Embed Size (px)
Citation preview

Aqueous Sulfide Oxidation and Feldspar Dissolution (Geochemical Reactioa Modeling Using CHILLER)
by Christopher Kenneth huu>n
A Thesis Subrnitted to the College of Graduate Studies and Research
Through the Department of Earth Sciences in Partial Fulfillmcnt
of the Requirements for the Dcgree of Master of Science
at the University of Windsor
Windsor, Ontario, Canada 1999

National Library 1*1 of Canada Bibliothèque nationale du Canada
Acquisitions and Acquisitions et Bibliographic Services services bibliographiques
395 Wellington Street 395. rue Wellirrgton Ottawa ON K1A O N 9 OnawaON K1AON4 canada canada
The author has granted a non- L'auteur a accordé une licence non exclusive licence ailowing the exclusive permettant à la National Library of Canada to Bibliothèque nationale du Canada de reproduce, loan, distribute or sell reproduire, prêter, distribuer ou copies of this thesis in microform, vendre des copies de cette thèse sous paper or electronic formats. la forme de microfiche/film, de
reproduction sur papier ou sur format électronique.
The author retains ownership of the L'auteur conserve la propriété du copyright in this thesis. Neither the droit d'auteur qui protège cette thèse. thesis nor substantial extracts fiom it Ni la thèse ni des extraits substantiels may be printed or othenvise de celle-ci ne doivent être imprimés reproduced without the author's ou autrement reproduits sans son permission. autorisation.

ABSTRACT
The oxidation of sulfides (primarily pyrite and pyrrhotite) exposed in mine waste
accumulations may produce acid mine drainage (AMD), which is characterized by a low
pH, a high sulfate content, and the presence of dissolved rnetals. In this study, CHILLER
(a FORTRAN cornputer modeling program that models geochernical reactions) was used
to study how various feldspars (albite, anorthite and microche) neutralizehuffer the acid
generated fiom pyrite oxidation. Pyrite:feldspar ratios of 1 :4, 1 : 1 and 4: 1 were modeled
to determine the effects of changing the pyrite:feldspar ratio. The results fiom the 1:l
pyrite:feldspar reaction models were explored in detail.
For each reaction model, a di fferent series of mineral pH-buffering assemblages
formed fiom the products of the feldspar dissolution reactions, buffering the acidity to
different values. The 1 : 1 pyrite:microcline reaction model produced: goethite, diaspore,
kaolinite, quartz, clinochlore, daphnite, stilbite and muscovite. The following minerals
formed fiorn the 1 : 1 pyrite:albite reaction model: goethite, diaspore, kaolinite, quartz,
clinochlore, daphnite, stilbite, celadonite and paragonite. The 1 : 1 pyrite:anorthite
react ion model y ielded the following minerals: goethite, diaspore, kaolinite, clinochlore,
daphnite, stilbite, laumontite, calcite and margarite. The 1 : 1 pyrite:microcline reaction
mode1 reached equilibrium fmt with a fmal equilibrated pH of approximately 8.3. The
I:l pyritemorthite reaction model was the last model to reach equilibrium with a final
equilibrated pH of approximately 1 3 -5.
A i t e ~ g the pyrite:feldspar ratio (1 :4, 1 : 1 and 4: 1) had no affect on the sequence
of alteration minerals fomed, so the resultant buffering reactions, buffered pH values and ... 111
fmal equilibrated pH were the same for each group of modeled reactions.
Increasing/decreasing the pyritc:fel&par ratio only affected the point at which the final
equilibrated pH was reached. In al1 three groups of rnodels the final equilibrated pH was
reached first by the 1 :4 @yrite:feldspar) reaction models while the 4: 1 @yrite:feldspar)
reaction models were the 1st to reach final quilibration.

He knows not his own strengtb that hath not met adversity. 4 e n Jonson

1 would Iike to sincerely thank my advisors, B. Petcr Hudec and Dr. Iain Samson,
for al1 of their support and guidance, but most of d l for their patience and understanding.
Without their help this shidy would not have been completed and for that 1 am greatly
indebted to them.
The author also wishes to thank Ingrid Churchill for al1 of her assistance and
guidance within the Geochemistry Lab. Always a source of information and never to
busy to offer a helping hanci, her generosity was never taken for granted.
1 would also Iike to acknowledge Mrs. Usha Jacob, Ms. Wendy Dupuis, Chris
Allen, Dr. M. Franklin and Dr. M. A. Holder-Franklin fiom the Biology department, as
they were al1 instrumental in my crash course in Microbiology.
James L. Palandri (a Ph.D. candidate studying geochemistry with Professor Mark
Reed's research group) and Mark H. Reed (CO-author of ptogram CHiLLER) are also
owed thanks. Correspondence with them regarding CHILLER and SOLVEQ helped me
through many fnistrating nights.
Special thanks are extended to my loving parents, for k ing there when 1 rnost
needed them and never questioning my abilities.
Finally, the following individuals are also owed recognition for their advice,
assistance and tirne: Dr. Ihsan Al-Aasm, Ian Kerr, Maria Cioppa, and Cyms Ghamari.

TABLE OF CONTENTS
... ABSTRACT ............................................................................................................. iii
ACKNOWLEDGEMENTS ....................................................................................... vi LIST OF TABLES .............................. ..... ................................................................... ix LIST OF FIGURES ................................................... ...................................................... x . . LIST OF APPENDICES .............................................................................................. XII ... LIST OF ABBREVJATIONS ...................................................................................... xi11
................................................................................................... 1 INTRODUCTION 1
II OBJECTIVES and SCOPE ...................................................................................... 8
III THEORETICAL CONSIDERATIONS ............................................................... 10 ................................................................................................... (A) Gcoc hemical Modeling 10
(i) Titration Models .................................................................................. 10 (ii) Fixed-Fugacity Models ................................................................. 1 1 (iii) Buffering ............................ ... ......................................................... 12
............................................................................................ (B) Gra~hÎc hscntation of Data 14 (C) Gaochemic.1 Reaction Modelinn uith SOLVEO and CHILLER ........................ ... . . 19
(i) SOLVEQ .............................................................................................. 19 (ii) SOLRUN, GEOCAL and SOLOUT ................................................... 19 (iii) CHILLER ........................................................................................... -20 (iv) CHILLRUN and CHILLOUT ............................................................ -21 (v) SOLTHERM and MINOX .................................................................. 22 (vi) Newton-Raphson Iteration and Convergence ...................................... 23
(D) Sulfide Oxidation .............................................................................................................. 25 (i) Pyrite Oxidation .................................................................................. -26 (ii) Pyrrhotite Oxidation ........................................................................... -31
(E) Thiobacilfus Ferrooxidcrns ............................ .. .............................................................. 33 (F) Gannue Dissolution ........................................................................................................... 34
(i) Feldspar (Aluminosilicate) Dissolution ............................................... 36 (ii) Carbonate Dissolution ....................................................................... 39
IV EXPERIMENTAL PROCEDURES ..................................................................... 40
V MODELMG and RESULTS .............................................. .. ........... 42 (A) CHILLRUN Setur, Essentials ...................................... -42
(i) Fluid Chemistry for the Water-Rock Titrations ................................... 42 (ii) Mineral Chemistry for the Water-Rock Tieations ............................... 43 (iii) SINC and SLIM .............................. ... .............................................. 44
............... ............................ (B) Sulfidc Oxidation and Fcldmar Dissolution Rcactions .. 45 (i) 100 % Pyrite ....................................................................................... 45 (ii) 1 0 % Pyrrhotite .................................................................................. 49
vii

(iii) Pyrite and FeIdspar Reactions .............................................................. 53 (a) 50%Fyritc+50%Microcline ........................................................ 55 (b) 50 % Pyrite + 50 % Albite ................................................................ 63 (c) 50 % Pyrite + 50 % Anorthite ........................................................... 71
........................................................................................................ VI DISCUSSION 81 (A) 1 00 YO M t e d 100 % PYllfiOtitc ................................................................................... 81 (B) 1 : 1 Pyrite + Albite . Pyrite + Anorthite . Pyrite + Microcline .......................................... 85 (C) 1 .4 . 1 : 1 and 4: 1 Pyrite + FeJdsmr Ratios .......................................................................... 93
................................................................................................... VI1 CONCLUSIONS 96
VI II RECOMMENDATIONS ....... .. ......................................................................... -98
........................................................................................................... =FERENCES 100
........................................................................................................... APPENDICES 107 ....................................................................... VITA AUCTORIS ........................ .... 166
viii

LIST OF TABLES
Table 1.
Table 2.
Table 3.
Table 4.
Table 5.
....................... Characteristics of Acid Rock Drainage (Ritchie, 1994a) 6
Median precipitation values of seven sites worldwide (hundreds of analyses) (Freeze and Cherry, 1979). pH = 5.5 @ 25 OC and 1
....................................................................................................... bar. 43
A sumrnary of the main features/results of the 1 :1 Pyrite:Microcline reaction model illustrating the minerals present, p d u d and consumed, pH and buffering reactions (with buffered pH values where applicable) for the points and intervals of Figure 6. ............................................................................ 62
A summary of the main features/results of the 1:l Pyrite:Albite reaction model illustrating the minerais present, produced and consumed, pH and buffering rractions (with buffered pH values where applicable) for the points and intervals of Figure 7. ................. 70
A summary of the main fe8turedresults of the 1:l Pyrite:Anorthite reaction model illustrating the minerals present, produced and consumed, pH and buffering reactions (with buffered pH values where applicable) for the points and intervals of Figure 8 ............................................................................................ 79

LIST OF FIGURES
Figure 1.
Figure 2.
Figure 3A.
Figure 3B.
Figure 4.
Figure 5.
Figure 6.
Figure 7.
Figure 8.
Figure 9.
Figure 10.
Figure 1 1.
Figure 12.
A simple cartoon illustration of a titration model. Reactants are incrementally added to the aqueous system with tirne (Bethke,
................................................................................................... 1996). 1 1
An illustration of a single pH-buffered and multiple-step pH- buffered model. ............................... .-..-.. ....................................... 13
An example of a stacked react ion path modeling diagram. ................ .17
An example of the same stacked reaction path modeling diagram ................................ presnited in Figure 3A (except not in log fonn). 18
Reaction of 100 % pyrite (Appendix A, Figure 1) with water ................................ (Table 2) at 25 OC and no aûnospheric contact. -46
Reaction of 100 % pyrrhotite (Appendix A, Figute 11) with ......................... water (Table 2) at 25 OC and no atmospheric contact. 50
Reaction of 50 % pyrite and 50 % microcline (Appendk A, Figure 4) with water (Table 2) at 25 O C and no atmospheric contact. ................................................................................................. 5 7
Reaction of 50 % pyrite and 50 % albite (Appendix A, Figure 2) with water (Table 2) at 25 OC and no atmosphetic contact. ................. 65
Reaction of 50 % pyrite and 50 % anorthite (Appendix A, Figure 3) with water (Table 2) at 25 O C and no amiospheric contact .............. 74
The activity c w e s for H' from the 100 % Pyrite and 100 % Pyrrhotite reactions modeled with CHILLER (Figures 4 and 5
........................................................................................ respectively). 83
The activity curves for ~ e ~ ' from the 100 % Pyrite and 100 % Pyrrhotite reactions modeled with CHILLER (Figures 4 and 5
........................................................................................ respectively). 83
The activity curves for ~ 0 ~ ~ ' from the 100 % Pyrite and 100 % W o t i t e reactions modeled with CHILLER (Figures 4 and 5 respectively). ...................................................... .. ........................ .84
The activity curves for H' h m the 50 % Pyrite and 50 % Feidspar (microcline, albite and anorthite) reactions modeled with CHILLER (Figures 6, 7 and 8 respectively). ............................... 88

Figure 13. The activity curves for a0 h m the 50 % Pyrite and 50 % Feldspar (microclinc, albite and anorthite) mactions modeled with CHILLER (Figures 6, 7 and 8 respectively) ................................ 88
Figure 14. The activity c w e s for ~ e 2 ' h m the 50 % Pyrite and 50 % Feldspar (rnicrocline, albite and anorhite) reactions modeleâ with CHILLER (Figures 6, 7 and 8 respectively) ................................ 89
Figure 15. The activity curves for s 0 d 2 - h m the 50 % Pyrite and 50 % Feldspar (microcline, albite and anorthite) reactions modeled with CHELER (Figures 6, 7 and 8 respectively) ................................ 89
Figure 16. The activity curves for AI" h m the 50 % Pyrite and 50 % Feldspar (microcline, albite and anorthite) reactions modeled with CHILLER (Figures 6, 7 and 8 respectively). ........................... ..--9 1
Figure 17. The activity curves for AIO(OH')~ h m the 50 % Pyrite and 50 % Feldspar (microcline, albite and anorthite) reactions modeled with CHILLER (Figures 6, 7 and 8 respectively). ............................... 9 1
Figure 18. The activity curves for H' h m the 1:4, 1 9 and 4:l Pyrite:Microcline reactions modeled with CHILLER. ....................... .95

LIST OF APPENDICES
APPENDIX A: CHILLRUN files used to nin CHILLER .......................................... 108
APPENDIX B: S M C and SLIM values for the CHILLRUN files in Appendix A ... 121
APPENDLX C: 1 :4 and 4: 1 (41ite:Feldspa.r (Ab. An and Mc)) Graphs ................... 134
APPENDIX D: Key Components of SOLRUN ......................................................... 148
APPENDM E: Key Components of CHILLRUN ...................... .. .... ............ .......... 152
............................................................................... APPENDIX F: List of Reactions 158
xii

LIST OF ABBREVIATIONS
Ab albite An anorthite Cal calcite Cdn celadonite Clcl clinochlore DPh daphnite BP diaspore Gt goethite Kln kaolinite Lmt laumontite MW magnetite Mc microcline M% rnargarite Ms muscovite pg paragonite Po pyrrhotite PY pyrite Qb qu- Stb stilbite
Figure 1. Abbreviations for rock-fonning minerals (Kretz, 1 983).
Ab An Cal Cdn Cld D P ~ Dsp Gt Kln Lrnt MW Mc Mrf! Ms pg Po PY Qtz
NaA1Si308 (Na - feldspar) CaA12Si201 (Ca - feldspar) CaC03 (carbonate) K(M~,F~~+)(F~~',AI)s 40 ~O(OH)Z (Fe - mica) (Mg)5AhSi30 lo(OH)g (Mg - chlorite) (Fe)sA12Si30 ~O(OH)~ (Fe - chlorite) AlqOH) (Al - hydroxide) FeO(0H) (Fe - hydroxide) A12S i20s(OH)4 (clay mineral) CaAi2Si4012 - 4H20 (Ca - zeoiite) Fe304 (Fe - oxide) KAlSi30s (K - feldspar) CaAl2(Al2Siz01o)(OH)2 (Ca - mica) KA13Si30io(OIi)2 O( - mica) NaAl2(A1Si3Oio)(OH)2 (Na - mica) Fei _,S (Fe - sulfide) Fe& (Fe - sulfide) Si& (silicate)
Stb NaCa2(A15Si13036) 1 4H20 @&Ca - zeolite) Figure 2. Mineral forrnulae.
xiii

The accumulation of mine wastcs such as tailings and waste-rock that wntain
sulfide minerals (i.e. pyrite and pyrrhotite) are ofkn potential locations for acid
generation. As a result, Acid Mine Drainage or AMD has become a serious
environmental issue and concem for the agencies that regulate the mining industry and
the companies that nui the mining operations (Ritchie, 1994a; Scharer et al., 1994; Eger
et al., 1994). The oxidation of the sulfide minerals exposed in waste-rock piles and
tailings irnpoundments may produce acid mine drainage, which is characterized by
(Gould et al., 1 994; Alpers et al., 1994; Blowes and Ptacek, 1994; Eriksson and Destouni,
1994; Dietz et al., 1994):
- a low pH,
- a hi& sulfate content, and
- the presence of dissolved metals (Le. Fe, Mg, Ni).
According to Jarnbor (1994) and Robertson (1994) tailings represent the
accumulation of mil1 processed gangue (sand-silt size), separated during the ore
processing procedure. Waste-rock on the other hand, represents the rock that m u t be
removed fiom an orebody in order to expose and excavate the ore, and ranges from grave1
to boulder s k debris (Bates and Jackson, 1984). Tailings and waste-rock are two forms
of mine waste (gangue) that are primarily composed of the non-econornic rocks or
minerals present in an orebody (Bates and Jackson, 1984). The ore in base-metal and
precious-metal mining operations can contain more than 90 % gangue, therefore, large
volumes of tailings are generated and disposeci of near the sites of these operations
1
(Robertson, 1994). Although the separation and concentration process removes the
economically desirable wmponcnt of an ore, the recovery of valuabb minerals is never
100 % efficient. As a result, tailings will contain small arnounts of the economic ore
minerals not removed through processing (Jarnbor, 1994). Waste-rock may also conîain
small amounts of the economic ore rninerals, but at much lower grades than the main
orebody itself.
The generation of mining waste, as mentioned above, also represents a spatial
problern for rnining companies regardless of whether or not AMD is produced as the
waste accumulates. Mine engineers, consultants and planners must consider the sUe of
the disposal sites required for the waste-rock and tailings accumulations as this affects the
overall extent of the minesite and costs of operation (Jarnbor, 1994). For example, a mine
that mills a? 6,000 tpd (tomes per day) (with an ore grade of about 6 %) requires a
disposal site capable of handling approximately 2,000,000 tonnes of tailings annually.
Let us consider the Valley Copper Mines in British Columbia, a porphyry copper deposit
that mills at 135,000 tpd with an ore grade of only about 0.5 % Cu (Jambor, 1994). The
buik of the processed ore in this example is accumulated as tailings at a rate of
approximately 45,000,000 tonnes per year. The Canadian base-metal mining industry has
produced over 12,000 ha of tailings and roughly 350,000,000 tonnes of waste-rock within
the 1 s t four or five decades that has been identified as acid-generating material
(Itzkovitch and Feasby, 1993). According to Aachib et al. (1994) the prelhninary
estimate for remediation costs for this mine waste with present technology amounts to
more than 5 billion dollars (Canadian). As these illustrations have shown, the disposal

sites requid for waste-rock and tailings accumulations are extrcxnely large, the potential
for acid generation witbin these site is infinite, and the cost of cleanup immense.
To wmpound the spatial arrangement and mine waste accumulation problems, the
conventional rncthod w d for îreating AMI3 involves chernical neutralization and
precipitation using lime. Liming (the addition of lime to the mine waste) produces a high
volume sludge thst is composed of unstable metal hydroxides and gypsum (Gould et al.,
1994; Rowley et al., 1994; Rao et al., 1994; Murdock et al., 1994). As some mine waste
accumulations have the potential to generate acid for longer periods of tirne then others,
excessive amounts of this high volume sludge will be produced at these sites through this
remediation method. As a result, lhing affects the spatial arrangement of these sites and
increases the size of the impoundment required for the accumulation of the mining waste.
Metals (i.e. Fe, Ni and Cu) may also be lost with this method of remediation, which, if
recovered, could provide revenue that would offset part of the treatment and disposal
costs while decreasing the sludge volume (Rao et al., 1994; Hubbard et al., 1994;
Schultze et al,, 1994). In addition, the lime sludge may be considered a hazardous waste
if toxic metals (i.e. Hg) are present in suscient quantities, fùrther increasing the cost of
disposa1 (Rowley et al., 1994; Hubbard et al., 1994; Schultze et al., 1994). According to
Murdock et al. (1994) there are advantages when lime is used as a treatment method in
the control of AMD. Lime is an inexpensive product that is widely available, easily
handled, and the reactions involved are controllable and predictable. According to Gould
et al. (1994) and Rowley et al. (1994) however, continuous liming is not a tolerable long-
term remediation method for the control of AMD and more stringent and strict guidelines

are needed for the new advances in the area of AMD neutralization. The onsite treatment
of acid mine drainage by chernical means is an expensive, long-tcnn cornmitment,
considering that drainage problems can persist for over a hundred years (Eger et al., 1994;
Gould et al., 1994).
Many ore deposits (that contain sulfides) also have acid-consuming minerals
associated with the mineralization or in n&y host and country rocks @ay, 1994).
According to Jambor (1994) tailings and waste-rock accumulations are not necessmily
acid generators, the potential for acid production wiil depend upon the mineral
composition of the mine waste. Acid-neutralization reactions according to Blowes et al.
(1994) are essential for controlling the byproducts of suifide oxidation in mine waste
accumulations and reducing the impact they have on the environment. The pH within
these environments is a balance between the acid-produchg sulfide oxidation reactions
and the acid-consuming mineral dissolution reactions. If there are more acid-producing
minerals in the mine waste accumulation, the resulting pH will be acidic. If the acid-
consuming minerals dominate the mine waste pile, the pH will be near neutral to basic.
The presence of acid-consuming minerals also affects the release of dissolved metais (i.e.
Fe, Ni, Pb) into the mine wastes pore water (Blowes et al., 1994). The higher the rate of
sulfide oxidation the greater the metal concentration found in the pore water. Therefore,
in al1 waste-rock and tailings accumulations there are some minerals that oxidize to
produce acid and release harmful elements, and other minerals that react with the acids to
neutralize them. Stable precipitates can form as a result of the acid-neutralization process
and harmful elements rnay be incorporated into their structure (Jambor, 1994). Mixing

mine wastes (containing sulfides) with acid-consuming minerals may be a conceivable
low cost alternative, under certain conditions, for the control or pcevention of AMD. If
properly constnicted, this in situ altemate waste management technique (rnixing) rnay
provide adequate protection against AMD without the continued maintenance or long
term obligations required with other remediation rnethods @ay , 1 994).
According to Jambor (1 994) the bulk of tailings produced from sulfide-bearing
ore deposits will generally consist of quartz, various silicates, carbonates, and iron
sulfides. Pyrite and pyrrhotite are the most abundant sulfide minerals present in mine
waste accumulations according to Alpers et al. (1994). Therefore, it can be generalized
that acid mine drainage (in mine waste accumulations) results fiom the oxidation of pyrite
(FeS2) andor pyrrhotite (Fe&), (where x may vary h m O to 0.1 25 (Nicholson, 1994))
(Jambor, 1994; Yanful et al., 1994)). Jambor (1994) notes that the presence of other (low
abundance) sulfides and sulfosalts such as, arsenopyrite (FeAsS), chalcopyrite (CuFeSz),
galena (PbS), sphalerite [(Zn,Fe)S], and tetrahedrite-ternantite [ (CU,F~)~~S~&-
(CU,F~)~~AS.&] can also present problems. The oxidation of these low abundant
minerals is usually responsible for the most deleterious elements produced in mine waste
effluents. Table 1 gives some of the typical characteristics obsewed and measured (under
natural surficial conditions) as a result of Acid Rock Drainage (ARD) (Ritchie, 1994a).
According to Lin (1996) AMD can be referred to in the general senx as acid rock
drainage. The acidity of a later-phase ARD effluent typically falls within a pH range of 2
to 4 and results in the mobilization of metal ions. The concentration of the metal ions
typically ranges fiom 1 to 3000 m a and have a significant impact on the envuonment as

well as reducing the quaiity of poîable groundwater supplies. The presence of dissolved
salts (Ca, Mg, Al, and sulfate) fùrthet rnagn@ these impacts on the environment. Ferrous
and ferric ions, f h c oxides, hydroxides and jarositcs produce the cornmon yellowish-
orange to reddish-brown discoloration and d u c e visibility in the receiving waters.
Table 1. Chanetcristics of Acid Rock Drrrinage (Ritcbu, 19948).
Acidity
Iron
Total dissolved
sa! ts
Typical associated chernical species
Sulfwic acid
I 1 supplies 1 1 - reduction in quality of water
Concentration Range
p H 2 t o 4
- discoloraton and turbidity in receiving waters as pH increases and ferric salts precipitate
- reduction in aquatic flora and fauna;
- bioaccurnulation; - reduction in quality of
potable groundwater supplies
- reduction in quality of potable groundwater
t
Fenous md ferric ion; Femc oxides, hydroxides;
Jarosites COPP~, magnesi=,
zinc, cadmium, mercwy, lead, arsenic,
radium
Calcium, magnesiun, aluminurn, sulfate
1 1 s u ~ d i e s for stock
Impact
-mobilizationofmetalions
100 to 3000 m a
1 t0 2 0 m&
100 to 30,000 mg"L
Sulfide oxidation is dependent upon a number of factors which defme the
environment within the waste-rock or tailings pile (Ritchie, 1994a). Some of these
factors include temperature, pH, oxygen concentration of the pore fluid rainfall
6requency (flushhg rate), chernid composition of the porc fluid, mineralogy of the mine
waste, and the microbial population. Certain microbes increase the rate of suifide
oxidation and the subsequent gencration of s u W c acid and metai ions within the mine
waste environment. The oxidation rate of sulfides can be catalyzed by the presence of
iron-consuming bacterium (i .e. ThiobaciIIus Fermoxida~ts) (Rich and Hutc hinson, 1 994;
Feasby et al., 1994). The optimal growth conditions for T. fewooxiri(am are around a pH
of 2 to 3, but they can survive within near-neutral pH envuonments (Nordstrom, 1982).

II OBJECTIVES and SCOPE
The objective of this study was to investigate the effect that feldspar dissolution
has on sulfide oxidation.
- the initial intent was to experimentally examine how different feldspars neutralize
the acid generated fiom aqueous sulfide oxidation:
- the results fkom the experimental reactions could not be used for the
purpose of this study
- these results were inconclusive and did not bear any logic when compared
to similar work
Thus, it was decided to simulate the reactions using computer models. The
FORTRAN computer modeling program CHILLER was selected to mode1 these
geochemical reactions.
- CHILLER computes the chernical equilibria of complex systems consisting of
solids, gases, and an aqueous phase (Reed, 1982)
- CHILLER models a variety of situations that include:
- fluid- fluid mixing, gas or rock titrations, boiling, condensation, and
evaporation (Reed and Spycher, 1998)
The geochemicai models were constnicted to examine how feldspar dissolution
(albite, anorthite, and microcline) and the resultant mineral assemblages buffer sulfide
oxidation.
- su1fide:feldspar ratios of 1:4, 1:l and 4:l were modeled with CHILLER to
determine what affect the ratios would have on the results
8

- thrre models wcre consûuctcd for cach feldspar:
- micmcline, albite and anorthite were each modeled with CHZLLER at
ratios of 1 :4, 1 : 1 and 4: 1 (sulfide to feldspar)
The results fiom CHILLER for each of the modeVsirnulations are presented in
stacked reaction path modelhg diagrams.
- these diagram allow for an organized and orderly presmtation of the stability
relations arnong alteration minerals and between minerals and the aqueous phase
(Re434 1997)
- the details fiom these diagrams illustrate how the specified modeling reaction
proceeded through a series of alteration mineral assemblages
- Figure 3A is an example of a stacked reaction path modeling diagram
produced with CHILLER @y reacting pyrite and water)
III THEORETICAL CONSIDERATIONS
(A) Geochernical Modelinq
A properly designed geochemical model can be used to represent sirnplified
versions of reactions that take place in nature or the laboratory. These models must not
be overly sirnplified to the point of being irnpractical nor so elaborate that they cannot be
applied to realistic problerns (Bethke, 1996). For a mode1 to be complete there must be a
balance between its practicality and the realism it is trying to portray. The important
features of a successfully created geochemical model should be portrayed without
attempting to show every chemical or mineralogical detail or change (Bethke, 1996).
(i) Titration Models
Titration models involve reactions between an initial fluid of known composition
and reactants which, if they are rninerals, are undersaturated with respect to the initial
fluid (Bethke, 1996). The reactants are incrementally added (titrated) into the system and
over the course of the reaction path they dissolve until equilibriurn is reacheâ and the
reaction stops (Figure 1). This process may cause minerais to precipitate as they become
saturated within the aqueous phase or force pre-existing rninerals within the system
(either original components or previously precipitated) to dissolve. The system continues
to evolve until the fluid is saturated with each titrated reactant or the reactants are
exhausted (Bethke, 1996). If the reactants are exhausted, the modeler can increase the
amount of the reactants that are incrementaily added to the aqueous phase and continue
10

Figure 1. A simple cartoon illustration of a titration model. Reactants are incrementally added to the aqueous system with tirne (Bethke, 1996).
to do so mtil equilibrium is reached. Once equilibrium is reached, any and al1 reactants
titrated into the system will continue to accumulate without any fùrther interactions.
(ii) Fked-Fugacity Models
Models that buffer the fûgacities of one or more gases, either through atmospheric
contact or some other source, are known as facd-fugacity path models (Bethke, 1996).
The earth's atmosphere acts as a buffer for the chemistry of many geochemical processes
that occur at or near its surface. The chemisûy of an aqueous phase will mach
equilibrium with a-buffer (Le. the atmosphere) if the reaction is slow enough to maintain
equilibrium. Gases from the atmosphere will either dissolve out of the atmosphere or
exsolve into it during this pmcess (Bethke, 1996).
11

A fixed-fbgacity path modci, accordhg to Bethke (1996), can p d u c e rtsults that
are different h m the results obtained in a simple titration model that is closed to the
atmosphere. As an example, consider the following reaction in which the reactant pyrite
is oxidized and goethite is produced:
FeS2 + s / 2 ~ 1 0 + '5/4020 * FcOOH + 4H+ + 2 ~ 0 4 ~ -
pyrite goethite
In a simple titration model that is closed to the atmosphere, the dissolved oxygen within
the aqueous phase wntrols the reaction rate. As pyrite is converted to goethite in reaction
1 the dissolved oxygen is consumed and pyrite oxidation ceases with t h e . Water that is
fully saturated with air at 1 atmosphere and 20 OC contains about 9 pprn 02' (Brown et al,
1 99 1 ). Therefore, only a small amount of pyrite is consumed in reaction 1 due to the lack
of an O2 buffer. In a fmed-fbgacity path model, however, the activity of 020 (reaction 1)
is buffered by the atmosphere and remains in equilibrium with the atmosphere. The
aûmspheric buffering of 02' allows reaction 1 to proceed until al1 of the pyrite is
consumed (Bethke, 1996).
(iii) Buffering
The term buffering refers to the ability to resist change. When some variable of a
chemical system fmes the value of a specifk component, this component is bufiered by
that variable. For example, if the pH of an aqueous solution is held constant by the
mineral composition of the system, the pH of that system is said to be buffered by the
mineral composition and this buffer is refemd to as a minera1 pH buffer. In the previous
12

case of O: k i n g buffered by the atmosphere, this buffer is referred to as an atmospheric
O2 buffer.
Figure 2 illustrates the difference between a single pH-buffered and multiple-step
pH-buffered model (for the purpose of this illustration the axes are not that important, but
the waterhck ratio (w/r) will be discussed in the following section). Curve B represents
a multiple-step pH-buffered modet, the flat stair stepping shape is indicative of a series of
good mineral pH buffers. Suficient amounts of H' are produced, offsetting the amount
of H' consumed (where the curve flattens out) and each step depicts a separate pH-
buffering reaction that begins and ends when a balancing ion is depleted or the buffering
minerai assemblage changes (Reed, 1997). Curve A represents a single pH-buffered
model, pH is not buffered until the reaction reaches final equilibration, and the resulting
curve changes very Little in shape compared to curve B.
Figure 2. An illustration of a single pH-buffered and multiple-step pH-buffered model. A - single pH-buffered model, B - multiple-step pH-buffered model.

(B) GraDhic Prescntation of Data
Stacked reaction path modeling diagrams allow the presentation of the stability
relations arnong alteration minerals and between minerals and the aqueous phase in an
organized and concise manner (Reeâ, 1997). Figuies 3A and 3B are examples of stscked
reaction path modeling diagrams produced with CHILLER (by reacting pyrite and water).
These figures are used hem to illustrate why the &ta was pmsented in log fonn; the
specifics about the data displayed in these diagrams is not important at this point. Each of
these figures presents the same results; the only difference between them is that the data
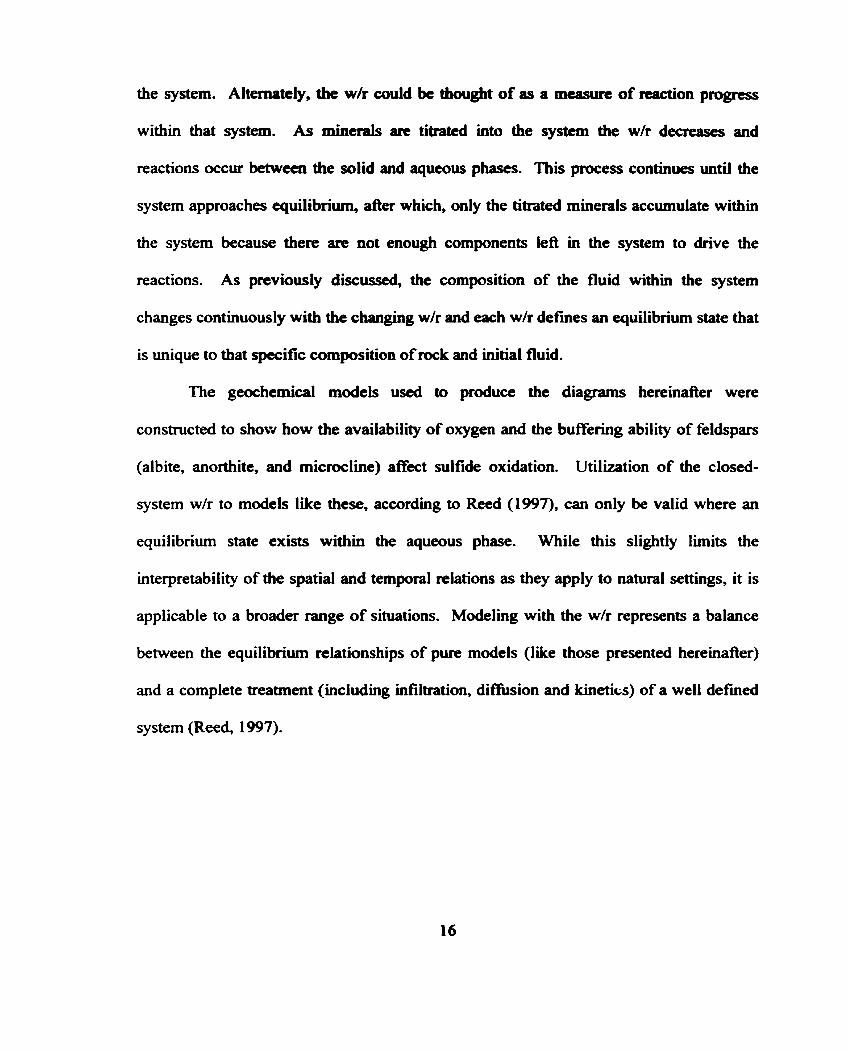
displayed in Figure 3A is in log form. As can be seen in Figure 3B, the specifics of the
reaction cannot be discerned fiom the data displayed. By presenting the same data in log
form (Figure 3A) however, details about such things as how the pH is buffered by the
formation of buffering minerals c m be seen. Consequently, al1 of the diagrams used to
describe the reactions rnodeled with CHILLER are displayed in log form.
The x-axis for these diagrams represents a measure of composition for the system
in tems of the watedrock ratio (wlr) (Figure 3A). The w/r is calculated by dividing the
mass of water in the initial aqueous phase by the mass of rock titrated into the system
(Reed, 1997). As more rock is titrated into the system, the resulting wlr ratio decreases
and proceeds h m a large to small value as the graph is read fiom left to right. The
composition of the fluid within these diagrams changes continuously with the changing
wlr (Reed, 1997). At any point along the x-axis, the w/r de fuies an equilibrium state that
is unique to that specific composition of rock and initial fluid.

The diagrams displaycd in this study apply to closecl-systcm rock titrations (no
material leaves the geochemical system after it has been added). The titrated minerais
react with the aqueous phase to produce new minerals that procipitate h m solution.
These newly formed minerals then either remain stable with the aqueous phase or, they
become unstable and are! incorporated into the aqueous phase with the possibility of other
stable mineral precipitates forming. This process continues until the geochernical system
reaches equilibrium. The m&ls and corresponding dia- demribed within this text
represent how the chemistry of a repository (containing 1 kg of rainwater) would evolve
as rock is incrementally titrated into the system, and allowed to equilibrate before the next
incremental addition of rock. This pmcess continues as more and more rock is
incrementally titrated into the repository (refer to Figure 1), until fmal equilibration is
reached. As a result, when the graphs are read fiom left to right, the w/r ratio decreases
as more rock is titrated into the system.
The wlr can be thought of as a measure of porosity within a system or as a
measure of reaction progress within that system. As porosity is a measure of the volume
of void space within a pile of unconsolidated sediments, it follows that, if these sedirnents
are hilly saturated, the pomsity is a measure of the w/r for the sediments. Therefore, as
any of the reaction models progress and more and more rock is titrated into the system,
the porosity of the system decreases due to compaction within the cepository. Eventually
a point is reached in which the titrated sedirnents are completely compacted and an
equilibrium state is reached in which the components of the system are static. Only the
titrated components within the system continue to change (increase) as they are added to
the system. Altematcly, the w/r cwld k thought of as a mutsure of &on progress
within that system. As minerals are titratcd into the systern the w/r decreases and
reactions occur between the solid and aqueous phases. This process continues until the
system approaches equilibrium, after which, only the titraîed minerals accumulate within
the system because there are not enough components left in the system to drive the
reactions. As previously discussed, the composition of the fluid within the system
changes continuously with the chmghg wlr and each w/r defmes an equilibrium state that
is unique to that specific composition of rock and initial fluid.
The geochemical models used to produce the diagrams hereinafter were
constmcted to show how the availability of oxygen and the buffering ability of feldspars
(albite, morthite, and microcline) affect sulfide oxidation. Utilization of the closed-
system wlr to models like these, according to Reed (1997), can only be valid where an
equilibrium state exists within the aqueous phase. While this slightly limits the
interpretability of the spatial and temporal relations as they apply to natural settings, it is
applicable to a broader range of situations. Modeling with the wlr represents a balance
between the equilibrium relationships of pure models (like those presented hereinafter)
and a complete treatment (including infiltration, diffision and kinetics) of a well defmed
system (Reed, 1997).

Figure 3A. An example of a stacked reaction path modeling diagram: (A) Minerals formed in log moles. (B) pH and log total aqueous molality of the principal component species (Le. L F ~ " represents the total of al1 aqueous Fe species). (C) Selected individual aqueous species in log molality (not log total aqueous molality). pH can be read directiy from the Log total aq molality and Log molality axes of B and C respectively.
Figure 3B. An example of the same stacked reaction path modeling diagram presented in Figure 3A (except not in log form): (A) Minerals formed in moles. (B) pH and total aqueous molality of the principal component species (i-e. Z F ~ ~ ' represents the total of all aqueous Fe species). (C) Selected individual aqueous species in molality (not total aqueous rnolality). pH can be read directly from the Total aq molality and Molality axes of B and C respectively.

(C) Geochemical Reaction Modelinn with SOLVEQ and CHILLER
(i) SOLVEQ
SOLVEQ is a FORTRAN computer-modeling program that can be used to
compute the chernical equilibria in aqueous systems (Reed, 1982). It is mainly used for
processing any type of water analyses in order to establish the consistency of such
parameten as the input data and the total number of moles of in solution (MTOT H')
(Spycher and Reeâ, 1998). The MTOT H' is required by CHILLER, and represents the
initial pH of the solution in total moles. SOLVEQ calculates the activities of al1 aqueous
species, the saturation indices of solids, and the fbgacities of gases afier the composition
and temperature of the aqueous solution has been input (Spycher and Reed, 1998). These
calculations are resolved using the Newton-Raphson numerical method which indirectly
solves a system of mass-balance and mass-action equations (Reed, 1982; Spycher and
Reed, 1998).
(ii) SOLRUN, GEOCAL and SOLOUT
The SOLRUN file is used to run SOLVEQ and it contains al1 the data specific to
each modeling run (Spycher and Reed, 1998). An existing SOLRUN file can be edited to
run SOLVEQ or the program GEOCAL can be used to create a new SOLRUN file.
GEOCAL is an interactive program that allows the programmer to speciQ the modeling
input data in various units @pm, m g , etc.) (Spycher and Reed, 1998). It asks simple
questions regarding the model's aqueous composition and run conditions (i.e. temperature
19

and pH). Once SOLRUN is wnfigured, SOLVEQ is nui and, if there are no problems,
convergence will be reached (refer to APPENDIX D for a description of the key
components of the SOLRUN data file). If SOLVEQ fails to converge however, various
error messages are built into the program that will help to determine the source of error
(Spycher and Reed, 2 998).
SOLOUT is the output file that contains the results of the calculations made by
SOLVEQ (Spycher and Reed, 1998). The file contains a wide range of information such
as: the number of iterations (loops) used to reach convergence, charge balance of the
solution, temperature, speciation data for al1 aqueous species, and the characteristics of
the component species.
(iii) CHILLER
CHILLER according to Reed (1982) is a FORTRAN cornputer modeling program
that can be used to compute the chemical equilibria of a system arnong solids, gases, and
an aqueous phase. This program can be used to model a variety of situations that include
fluid-fluid rnixing, gas or rock titrations, boiling, condensation, and evaporation (Reed
and Spycher, 1998). CHILLER also applies the Newton-Raphson numerical method to
indirectly solve a system of mass-balance and mass-action equations (Reed, 1982; Reed
and Spycher, 1998). According to Reed and Spycher (1998) afier the temperature,
pressure, and total composition of a chemical system has been input, CHILLER cornputes
the compositions of the solid, aqueous, and gas phases at equilibrium. To model
geochemical processes, CHILLER allows for incremental changes in either temperature,

pressure, enthalpy or composition (Red and Spycher, 1998). After each increment,
CHILLER recalculates the cquilibrium phase assemblage, mined compositions and the
aqueous composition of the system.
(iv) CHILLRUN and CHILLOUT
Before CHILLER is run, SOLVEQ should be used to calculate the homogeneous
equilibrium on the solution that is to be used in CHILLER to ease convergence (Red and
Spycher, 1998). Afler getting the SOLVEQ output, the CHlLLRUN file must be created
by either running the program GEOCAL, or by editing an existing CHILLRUN file (Reed
and Spycher, 1998). The CHILLRUN file contains al1 the data specific to each modeling
run. Once CHILLRUN is set up, CHnLER is run and if there are no problems,
convergence will be reached. AAer each successful equilibration, the values of SINC
(step increment) and SLIM (step limit) are increased by a factor of ten (SINC and SLIM
are titration panuneters, refer to APPENDIX E for a description of the key components of
the CHILLRUN data file), and CHILLER is run again. CHILLER usually reaches
convergence without any problems when SINC and SLIM are increased by a factor of
ten. When SINC and SLIM are increased by larger factors (Le. 100 or 1000) the iterative
method usually fails to reach convergence and the program stops. If CHILLER fails to
converge at any point, various error messages are built into the program that will help
determine the source of error (Reed and Spycher, 1 998).
CHILLOUT is the output file that contains al1 of the ru-specific CHILLRUN
data, and the results of each titration and subsequent equilibration produced with
CHILLER (Reed and Spycher, 1998). The results are organizcd into a stnrcturcd and
thorough data file based upon the step incrernent (SMC) and the step limit (SLIM) set by
the user. For each successful increment (titration) CHILLER outputs the equilibration
data to CHILLOUT. Therefore, if SINC = 1 and SLIM = 10, CHILLOUT will contain
data for nine increment steps as long as convergence is reached during each step.
CHILLOUT contains a broad range of information for each step such as: the nurnber of
iterations (loops) used to reach convergence, charge balance of the solution, temperature,
pressure, speciation data for al1 aqueous species, pH and the characteristics of the
component species (Reed and Spycher, 1998).
(v) SOLTHERM and W O X
SOLTHERM is the database used by CHiLLER and SOLVEQ and contains al1
thermodynarnic data for the aqueous, gas, and mineral species listed (Spycher and Reed,
1998; Reed and Spycher, 1990, 1998). This database supplies al1 of the thennodynamic
data, (activity coefficients data, component species data, derived species data, gas data,
mineral data and optional miscellaneous data), necessary to run CHILLER and SOLVEQ.
The MINOX reactant data file contains reactant stoichiometries and molecular weights
for the chemical components (oxides, minerals, gases, etc.) to be used as reactants in
titration reactions (Reed and Spycher, 1998). Reactants are generally specified as oxides
or minerals, but any other form of reactant may be entered into this file. MINOX is only
read if the MINSOL option for titrations is enabled (MINSOL set to a non-zero value (1-
4) in the CHILLRWN data file, see APPENDIX E) (Reed and Spycher, 1998).

(vi) Newton-Raphson Itcration and Convergence
Geochemical modeling programs like SOLVEQ and CMLLER provide insight
into complex naîural reactions. The simplified reactions run with these programs can be
interpreted more easily than those occuning in nature if there is a balance between
practicality and realism. With some basic geochemical knowledge, programs Iike
CHILLER and SOLVEQ can be run without necessarily understanding the complexities
nf how each program internally calculates the equilibrated output. Programs like *ese
solve a system of mass-balance and mass-action equations in order to mach equilibraîion.
There is no direct general method however, for fmding the solution of nonlinear
equations, so these equations need to be solved indir~ctly by iteration (Bethke, 1996).
According to Bethke (1996) Newton-Raphson iteration is the most effective approach for
solving nonlinear equations reliably, especially in systems where the mass is distributed
over minerals as well as dissolved species.
The Newton-Raphson iteration method works as foUows (Bethke, 1 W6): the set
of vafues that satisfies a group of equations is called the group's root. The iterative
method begins with a guess of the root's value, and then proceeds to improve the value
incrementally until it satisfies the equations to the desired accuracy. The fmt guess of the
root is typically set by the model, which cornmonly assigns the guess 90 % of the mole
numbers to the unknown variables. The desired accuracy is determined by the residual,
which is a measure of the inequality between two sides of a system of equations Be*
( 1996). Residuals are a measure of how far off the guess was fiom the mot's satisfjing
values. The Newton-Raphson iteration method attempts to make the residual

incrementally smaller by succepsivcly irnpmving the guess of the root's value. This
process continues until some value of the r w t is reached at some iteration point that
satisfies the system of equations to a desired accuracy, thk is known as convergence
(Bethke, 1996). Usually, convergence to a solution is rapid, however the model c m
"bomb" (stop) if convergence is not reached. A model that fails indicates that the
residual cannot be irnproved to satisw the root's value for the specified modeling
conditions. When this occurs, changes must be made to the modeling conditions in an
attempt to mach convergence. As Reed and Spycher (1998) note however, some models
may reach a numerical impossibility and never converge, or the chernical system that is
being investigated rnay be impossible and the model cannot justiw the chernistry.

@) Sulfide Oxiâation
Sulfide oxidation is a complicated process that involves a series of complex
intertwined reactions, which rnay have a serious impact on the environment. With tirne,
these reactions cm become an environmental concem as the resulting effluent pH
changes, ranging fiom Iess than 2 to as high as 8.5 (MiIls, 1985). This broad range in pH
values is related to the rate of sulfide oxiâation, and the buffering capacity of the rninerals
present in the geologic setting (Mills, 1985). According to Ritchie (1994a), during the
early stages (years to tens of years) of a sulfide-bearing tailings or waste-rock pile, the
chemical composition of the pore water in the waste accumulation changes with time and
depth. Several factors control these changes and they are dependent on such things as the
rate of sulfide oxidation the presence of acid-neutralizing gangue rninerals, and the rate
of pore water movement. Initially, the acid generated through sulfide oxidation is
neutralized close to the source and the pore water pH is near neutral (Ritchie, 1994a).
With tirne, the readily available acid-neutralizing rninerals are consumed and the acid
produced is transported away fiom the oxidation sites, decreasing the effluent pH. At this
stage in the sulfide-bearing tailings or waste-rock piles history (tens to hundreds of years),
the chemical composition of the effluent changes very slowly with tirne. It is this later
stage drainage which is typically described as "'acidic drainage" because the pH generally
ranges h m 2 to 4. Ritchie (1994a) also notes that the mine drainage fiom a sulfide-
bearing waste pile may not have a low pH at al1 but can still be considered an
environmentai threat. If a suficient amount of dolomite is present in this mine waste

pile, the acid produceci through sulfide oxidation could be buffered to a near-neutral pH,
however, the chinage would aiso have high levels of sulfate, calcium, and magnesiun;
common ch~micteristics of AMD (wiîhout the earrnark low pH).
Pyrite (Fe&) and pyrrhotite (Fql-x$S) are the most common sulfide minerals in
base and precious metal tailings impoundments (Blowes et al., 1994). According to
Ritchie (1 994a), pyrite oxidation (the prirnary pollutant generating process in AMD) is
wntrolled within the mine waste environment by several factors. These factors include
(for example) temperature, pH, oxygen concentration, chemical composition of the pore
water and microbial population. The relationships between the physical, chemical, and
microbial environments within a mine waste dump affect the rate of pyrite oxidation.
Consequently, the rate of pyrite oxidation affects the physical, chemical, and microbial
environments within the dump. The processes involved in sulfide oxidation at any one
mine waste site wil1 vary considerably fiom any other depending on site specific
conditions, and this is why modeling is dificult (Ritchie, 1994a).
(i) Pyrite Oxidation
The arnount of information with regards to the mineralogy of oxidized sulfide-
bearing mine waste is sparse. Several authors however, have proposed a series of
generalized reactions that may lead to the formation of AMD. In this section, the
proposed ideas of some of these authors will be examined. Although similarities exist
between these proposed AMD reactions, each of the authors concepts are prescnted in
their entirety.

The pyrite oxidation reactions mponsible for AMD according to Singer and
Stumm (1970) and Stumm and Morgan (1981) can be expresscd as follows:
Pyrite is broken down and the suifur is oxidued according to reaction 2 releasing
~ e * ' , SO? and p. The subsequent oxidation of ~ e * + (reaction 3) and hydrolysis of Fe "
(reaction 4) leads to the formation of femhydrite. The presence of ~ e j ' can lead to the
break down of pyrite and the direct oxidation of sulfur producing ~e*', SO~" and H'
according to reaction 5:
The direct oxidation of the sulfùr in 1 mole of pyrite by ~ e j ' results in the release of 16
moles of H' (reaction 5) versus the 2 moles of H' released during the oxidation of the
sulfur in pyrite by 02' (reaction 2). Reactions 2, 3, 4, and 5 regulate the amounts of H'
and ~ e ~ ' released into solution.
ThiobaciILus ferrooxidans (a species of bacterium) can act as a catalyst for
reaction 3, and are most active between pH 1.5 - 5.0 (Rose and Daub. 1994). T.
27

Jerrooxiidns in- the rate at which FC*' is oxicüzed in cornparison with inorganic
rates (Singer and Stumm, 1970). As reaction 3 is considered to be the rate-controlling
step, T. ferrooxikns can increase the rate at which the characteristics of AMD are
produced (Rose and Daub, 1994). Reactions 3 and 5 have been implicated as the problem
reactions in extreme cases of AMD. Under extreme acidic conditions reaction 4 is the
slowest of the four reactions thus lïmiting the rate at which additional acidity is produced
in this reaction and reaction 5 (Rose and Daub, 1994).
The overall reaction for pyrite oxidation is presented in reaction 6, which
represents the sum of reactions 2, 3, and 4 (Singer and Stumm, 1970; Sturnm and
Morgan, 198 1):
Fe% + '5/4020 + '/*H~O * Fe(OE& + 2 ~ 0 ~ ~ + 4Ei' pyrite ferrilrydrite
For each mole of pyrite oxidized in reaction 6 four moles of H+ are produced. According
to Rose and Daub (1994) ~ 0 4 ~ - (reaction 6) is initially released during pyrite oxidation
and this gives some indication to the amount of pyrite oxidized.
The following reactions according io Blowes et al. (1994) are responsible for the
generaîion of AMD. Pyrite is broken down and the sulfur is oxidized according to
reaction 2 producing ~ e ~ + , S O ~ ~ - , and two moles of H':
FeS2 + '120~' + H t O * lie2* + 2~0:- + zH' pyrite

The oxidation and subsequent hydrolysis of F C ~ * leads to the precipitation of Fe(OW3,
yielding two addition moles of (reaction 6) (Blowes et al., 1994):
Fe& + '5140? + ' 1 ~ ~ 2 0 * Fe(0m + 2 ~ 0 ~ ~ - + 4W pyrite ferrikydrite
According to Bigham et al. (1990) and Blowes and Ptacek, (1994) (referruig to reaction
6) goethite (FeOOH) or the precipitation of other ~e~+ -bear in~ phases may form in the
place of Fe(O&, releasing various amounts of H'. Continued oxidation of the sulfur in
pyrite by ~ e ) ' (produced h m the oxidation of ~ e ~ ' , reaction 3, released fkom reaction 2)
would lead to the release of more acid (reaction 5) (Blowes et al., 1994):
Fe$ + 1 4 ~ e ~ + 8H20 * 15Fe2+ + 2 ~ 0 : - + 1 6 c pyrite
Wiîh ~ e " as the primary oxidant, each mole of pyrite oxidized yields 16 moles of acidity.
As a fmal example of the reactions involved in pyrite oxidation consider the
following proposed by Ritchie (1 994b):
Fe$ + %O: + HIO * FeSOI + H2SOI pyrite

MS + Fe(so& + '/*a' + H 2 0 * MSOI + fFtso4 + H2S04 (wbere MS stands for iay mttal siiWide)
Reaction 7 (sum of reactions 8 and 9) shows that pyrite is oxidized in the presence of
oxygen producing acid and sulfate. Reaction 10 is a general reaction illustrating the
oxidation of any other metai sulfide. The rate of reaction 8 can be increased by a factor of
about 1 0' (Singer and Stumm, 1 968) if certain bacteria (i.e. 2'hiobocillu.s firrooxidmrF)
catalyze the oxidation of the ferrous iron in reaction 8 (Ritchie, 1994b). According to
Ritchie (19946) reaction 9 supports this process, at low acid pH values the oxidation of
pyrite by ~ e ~ + is increased (about 10 to 100 times faster (Olson. 1991)) due to the
presence of bacteria like T. ferrooxidam.
The overall complexity of the reactions and mechanisms involved in the oxidatioa
of sulfide minerals rnakes it difficult to describe al1 of the processes taking place at once
(Ritchie, 1 994b). The initial factors or conditions that begin the acidification process
leading to AMD within the waste-rock/tailings pile are not completely understood.
According to Nordstrom (1982) and Pmnk et al. (1992) reactions like those reported by
Singer and Stwnm (1970), Sturnm and Morgan (198 1), Blowes (1994), and Ritchie
(1994b) can be fûrther complicated; T. ferrooxidam can also grow within an anaerobic
environrnent. In order for the bacteria to survive under anaerobic conditions there must
be a source of ~ e " within the environrnent. Oxygen however, is requued as described by
reaction 8 for the continuhg source of ~ d ' the bacteria require. It is obvious that oxygen
cannot be present within an anaerobic environment. According to Nordstmm (1 982) and
Pronk et al. (1992) there is no conclusive evidmce on the micmorganisrns ability to act as

a catalyst within the anaerobic environment. Kleinmann (1979) did however, fmd trace
growth of Tjmooxidzm in these saturated (anaerobic) environrnents. Nonetheles, with
the amount of research and experimentation involving water covers and other gas
diffision barriers T. ferrooxidaris likely do not act as good catalysts under these
conditions.
(ii) qrrhotite Oxidation
Very little information exists with regards to pyrrhotite oxidation compared to the
number of studies done on pyrite oxidation. Nicholson (1994) however, notes that the
amount of attention paid to pymhotite oxidation is increasing as pyrrhotite has been
recognized as an important waste mineral in many metal mine waste impoundments.
Aqueous pyrrhotite oxidation can be the dominant p r e c w r to AMD in tailings
impoundments produced during the concentration and recovery of nickel (Blowes et al.,
1994). The complete oxidation of the sulfur in pynhotite may occur through reaction 11
(Blowes and Ptacek, 1994; Blowes et al., 1994; Nicholson, 1994):
The stoichiometry of pyrrhotite affects the amount of H' produced (Nicholson, 1994). If
x in reaction 11 is zero then pyrrhotite has a fomula of FeS and no H' will form during
oxidation. On the other hand, if x = 0.125 (the maximum value for x according to
Nicholson, 1994) then pymhotite will have a formula of FetSt and the maximum arnount

of acid wiii be produced. Partial completion of pyrrhotite oxidation will generote sO and
~ e ~ + W u g h the reaction (Blowes and Ptacek, 1994; Blowes et al., 1994):
Fyt.&$ + (2-2x)~e* * (3-3x)~e" + S' pyrrhotite
Sulfate ( ~ 0 4 ~ 3 may f o m if the elernental sO is oxidized in reaction 12 (Blowes and
Ptacek, 1994; Blowes et al., 1994). Elemental sO has also been shown to form at the
expense of H+ through reaction 13 (Ahonen and Tuovinen, 1994):
Burns and Fisher (1990) and Fisher and Burns (1990) have shown that the
aqueous oxidation of sulfur in pyrrhotite can lead to the formation of pyrite, consider the
following reaction:
This reaction also consumes acid and with t h e the pyrite will undergo oxidation in the
presence of o v g e n (as seen in reaction 6). According to Nicholson (1994) pyrrhotite
oxidation is 20 - 100 times faster than pyrite oxidation at 25 OC under atmospheric oxygen
concentrations. Due to the greater sulfur content of pyrite however, more acid per mole is
produced during pyrite oxidation than pyrrhotite oxidation.

(E) Tltiobacillus F e r r o o x k
Thiobacillusfirrooxidam are a widely studied ~ e ~ + - , pyrite- and suLfiir-oxidizing
genus of microorganisms that contribute to AMD (Nordstrom, 1982). This gram-negative
aerobic chernoautotrophic @duces its' own food t h u g b oxidation) acidophilic (thrives
within low pH envuonments) microbe obtains energy nom sorne form of sulfk (Le. m e t .
sulfides or r e d u d su& compounds) (Nordstmm, 1982; Gould et al., 1994). Theü
optimal growth conditions according to Nordswm (1982) are around a pH of 2 to 3, but
they can survive within near-neutral pH envuonments. Gould et al. (1994) suggest that
the pH range the thiobocilli thrive in is between 1 and 3.5 with the optimal near 2.
Besides living under such harsh conditions as a low pH environment, T ferrooxiidm can
also tolerate various delterious metal ions and anions such as arsenate (Tuovinen and
Kelly, 1 972).
T. ferrooxidonr play a significant role in the oxidation of sulfide minerds by
acting as catalysts, accelerating the rate of sulfide oxidation and the rate in which ~ e " is
generated from ~ e ~ ' (Nordstrom, 1982; Ritchie, 1994b; Nicholson, 1994; Gould et al.,
1994). According to Singer and Shunm, (1968, 1970) and Nordstrom (1976) the
bacterium increases the oxidation rate by a factor of about los. The presence of ~ e ' + at
low pH allows for the direct oxidation of sulfides by ~ e ) + , replacing 9 as the primary
oxidant (Nordstrom, 1982; Bigham, 1994).

(F) Gangue Dissolution
Gangue represents the valueless waste rock or minerals within an orebody that
must be separated fiom the economic rocks and minerals during concentration (Bates and
Jackson, 1984). The oxidation of sulfide minerals (within the gangue) and subsequent
release of acid, sulfate, and dissolved metals into the irnpoundment effluent can persist
for decades to centuries (Blowes and Ptacek, 1994). The dissolution of acid-neutralizing
gangue minerais (carbonates and alurninosilicates) within a waste-rocWtailings
environment act to buffer and neutralize the products of sulfide oxidation. The ultimate
amount of acidity and deleterious elements released during sulfide oxidation relates to the
amount of acid-generating minerals and acid-neutralizing minerals present in the gangue.
If there are more acid-generating minerals present within the waste-rock/tailings pile then
there is a greater chance of generating AMD. If there is a greater percentage of acid-
neutralizing minerals within the waste-rocwtailings pile then the chances of generating
AMI3 are decreased.
According to Blowes and Ptacek (1994) metal-bearing hyàroxide and
hydroxysulfate minerals can precipitate during the acid-neuîralizhg reactions. These
minerals act as sponges, effectively removing dissolved metals from the pore water within
the dump. If these acid neutralization and mineral precipitation reactions occur at the site
of suffide oxidation, then the rate of oxidation may be decreased by the formation of
inhibitory mineral coatings (Blowes and Ptacek, 1994). Inhibitory minerals such as
Fe(OW3 (ferrihydrite) can fom according to reaction 15:
These mineral coatings c m decrease the rate of sulfide oxidation by armoring the sulfide
minerals but they do not prevent AMD (Blowes and Ptacek, 1994).
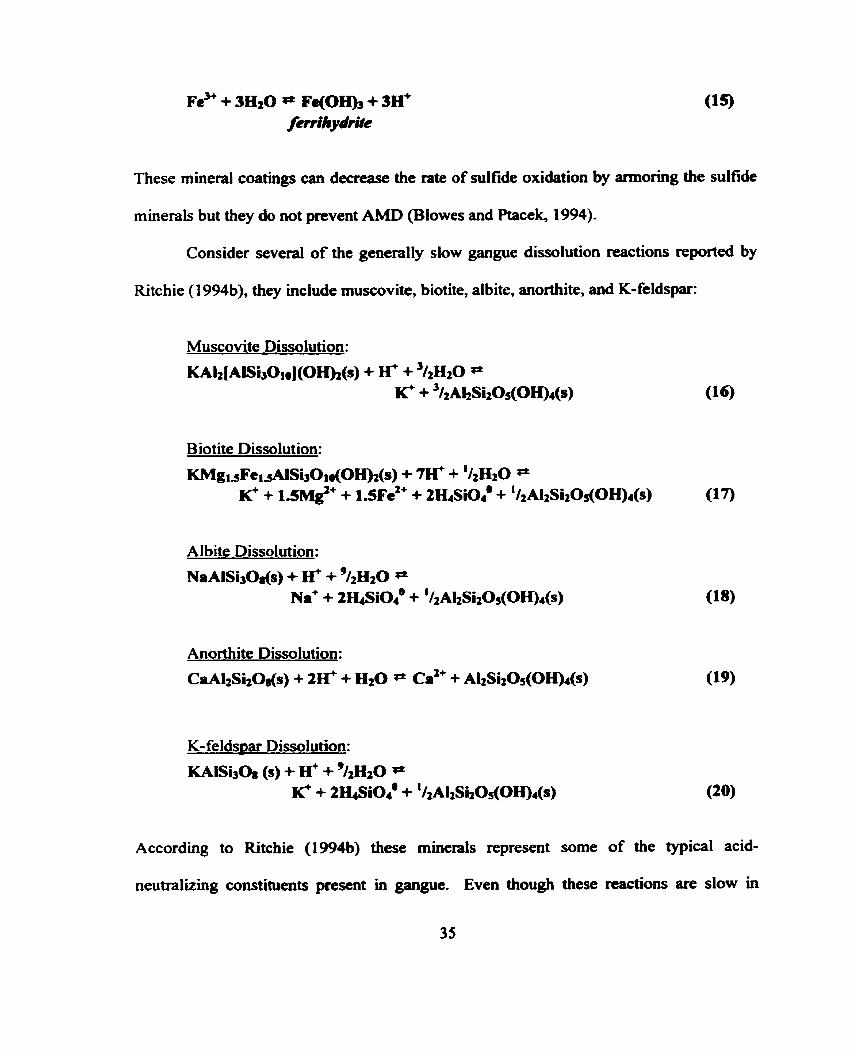
Consider several of the generally slow gangue dissolution reactions reported by
Ritchie (1 994b), they uiclude muscovite, biotite, albite. morthite, and K-feldspar:
Muscovite Dissolution:
KA12[NSi30 ( O s ) + tI' + %&O * K' + %AI&o~<oH)&)
Biotite Dissolution:
KMg~sFtl&Si301r(OH)2(s) + 'IH* + ' f 2 ~ 2 0 * K+ + 1 . 5 ~ c + 1 . 5 ~ e ~ ' + 2H&i0? + ' / ~ A I ~ S ~ O S ( O ~ ~ ( S ) (1 7)
Albite Dissolution:
NaAISi30&) + H+ + % H ~ O * Ni4 + 2&~i04' + '/~AI~s~~os(oH)~(s)
Anorthite Dissolution:
CaAI2Si2O&) + 2H+ + &O * ca2+ + A~S~~OS(OCL)~(S)
K-felds~ar Dissolution:
KAISi30i (s) + H' + %HIO if K' + 2H&io4@ + ' / ~ A ~ s ~ ~ o ~ o H ) ~ ( s )
According to Ritchie (1994b) these minerals represent
neutnilizing constituents pment in gangue. Even though
some of the typical acid-
these reactions are slow in

comparison to carbonate dissolution rcactions, their importance will be justifiai in time
during the chernical evolution of the pore water within the durnp (Ritchie, 1994b). With
t h e , when al1 of the readily available carbonate has been removed through dissolution,
the micas and feldspars will continue to neutralize the acid generated through sulfide
oxidation. The concentrations of major ions such as Ca, Mg, Na, K, Al and sulfate within
the drainage effluent are controlled by these reactions. In each case (reactions 16 to 20)
the gangue mineral and are consurned and the products of al1 the reactions include the
formation of kaolinite (AlrSiz05(OH)4) and silicic acid (H.&i049 while releasing K',
M ~ ~ ' , ~ e ~ ' , ~ a ' , and ca2' depending on the gangue minerals involved. Reactions 16 and
17 consume H' and decrease the fluids acidity while yielding K', and M ~ ~ ' and K'
respectively. As the acidity of the solutions in reactions 18, 19, and 20 is decreased
through dissolution, albite releases Na', anorthite releases ca2', and K-feldspar releases
(i) Feldspar (Alminosilicate) Dissolution
Only under very low pH conditions after al1 other acid-neutralizing sources have
k e n consumed (carbonates and simple hydroxides) does the dissolution of the feldspars
become important (Blowes and Ptacek, 1994). As mentioned in the previous section the
dissolution of the feldspars consumes H' and contributes Ca, Na, and K, as well as Si and
AI to the pore water and mine waste effluent. These reactions are generally slower than
the rate of pore water movement throughout the tailings or waste-rock pile and are usually
not rapid enough to attain equilibriurn with the system (Blowes and Piacek, 1994). The
significance of these more stable minerals becomes only more evident as the readily
soluble carbonate minerals are depleted duriag the acid neutralization reactions (Blowes
and Ptacek, 1994). The ability of such stable minerals to contml GMD afler al1 of the
more readily consumed minerals are gone may play an important role in environmental
remediation methods.
Within a tailings or waste-rock pile the factors governing feldspar dissolution and
the subsequent neutralization of the acid generated through sulfide oidation are complex.
Complete acid neutralization may only occur where the feldspar to sulfide mineral ratio is
hi& the proportion of feldspar mineral surface areas with which to react with are large,
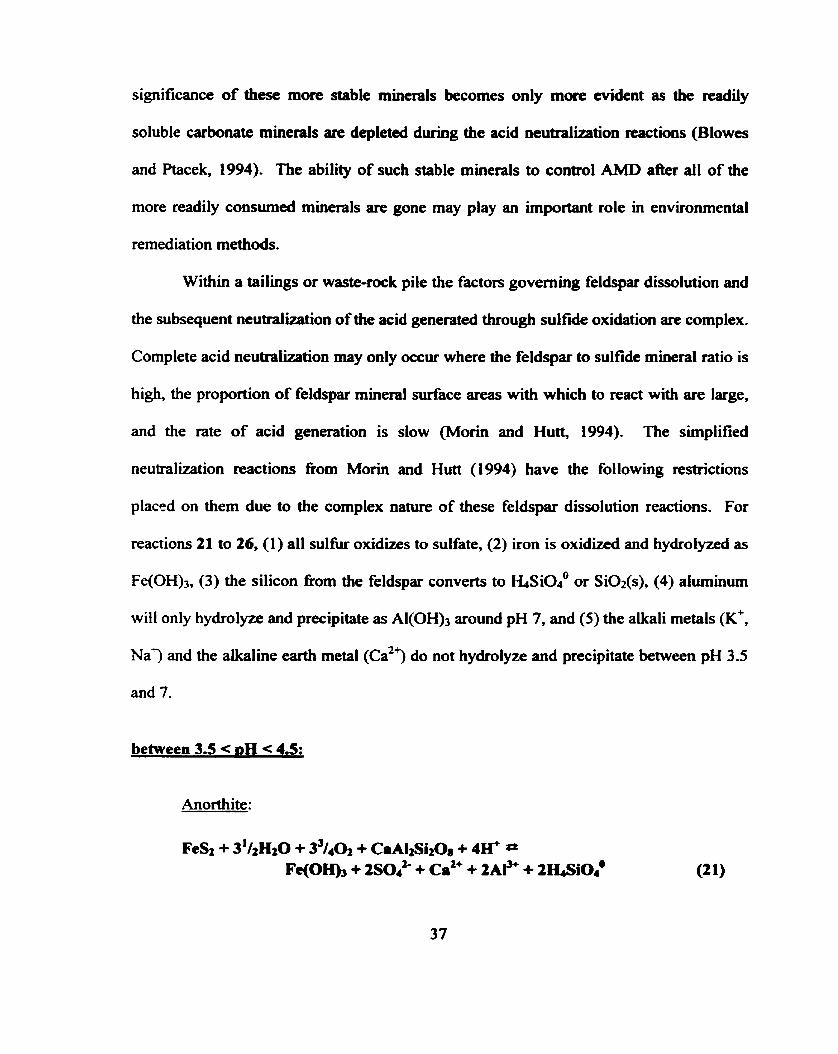
and the rate of acid generation is slow (Morin and Hutt, 1994). The simplified
neutralization reactions fiom Morin and Hutt (1994) have the following restrictions
placed on them due to the complex nature of these feldspar dissolution reactions. For
reactions 21 to 26, (1) al1 sulfùr oxidizes to sulfate, (2) iron is oxidited and hydrolyzed as
Fe(O&, (3) the silicon fiom the feldspar converts to H&i0lo or SiOz(s), (4) aluminum
will only hydrolyze and precipitate as AI(OH)p around pH 7, and (5) the alkali metals (K',
~ a 3 and the alkaline earth metal (ca23 do not hydrolyze and precipitate between pH 3.5
and 7.
between 3.5 < DH < 4.5:
Anorthite:

Albite:
around DH 7:
Anorthite:
Albite:
For the reactions within the 3.5 < pH < 4.5 range less silicic acid and alkaline
earth/alkali metals are produced per mole of pyrite consurned then at around pH 7. The
silicic acid and alkaline ear<h/akali rnetals produced at around pH 7 are 4 times greater
per mole of pyrite consurned then what is produced within the 3.5 < pH < 4.5 range.

(ii) Carbonate Dissolution
Reactions 27 and 28 (Ritchie, 1994b) represent the dissolution of carbonate
(generally present in gangue as calcite and dolomite) by sulfiiric acid:
Calcite Dissolution:
CaC03 + HzSO. * CaS04 + H20 + Ca calcite
Dolomite Dissolution:
The products of these dissolution reactions are C a , HzO and calcium and magnesium
sulfate. According to Ritchie (1 994b) carbonate dissolution is relatively fsst compared to
the rate of other mechanisms that control pyrite oxidation and it buffers the pH of the
waste-rock/tailings pore water at a near neutral pH. Chernical species containing many of
the trace metals that are pollutants in AMD are not soluble at pH values above 4.5
(Ritchie, t994b). As a result, the trace metal pollution is absent while the near-neutral
pH-buffering action of the carbonates persists. Thenfore, with carbonate dissolution the
pore water chemistry of the dump can be maintained at a near neutral pH while lacking
the presence of any heavy metals.
IV EXPERIMENTAL PROCEDURES
The initial intent of this shidy was to experimentally investigate how different
feldspars neutralize the acid generated through aqueous sulfide oxidation. Column
leaching experiments using triple distilled water, as the aqueous component, were set up
to study these reactions. The sulfide and feldspar concentrations within the columns were
varied and different feldspars were used (albite, anorthite and rnicrocline) to see what
affect they had on sulfide oxidation. The airn was to determine which feldspar and what
concentration of that feldspar would most effectively neutralize the acidic drainage.
These determinations were to be based upon the effluent that was collected daily fiom the
columns. The effluent pH was monitored and measured regularly during the experiments
and sarnples were collected for later analysis. These sarnples would be used to determine
the concentrations of various dissolved metals as well as the concentrations of SO~*- and
siozo. The sarnples however, were not analyzed because the pH values measured fiom
the leachate columns were always near neutral, whereas acidic conditions were expected.
Even after approxirnately three months there was no significant change in the measured
pH values. These experiments were repeated numerous t h e s with sulfides that were
donated and purchased, but the results were always the same.
To aid in the oxidation process, ïliobacillus ferrooxidans were purchased to act
as catalyst's for the sulfide oxidation reactions. Afier a bnef introduction into the world
of microbiology and numerous failed attempts, a culture of T ferrooxidam received from
the American Type Culture Collection (ATCC) was successfully transferred and
incubated in several test tubes of growih medium. AAer successful growth of a biofilrn
40

within some of the lcachatc columns, the expcriments were wntinued but the results w m
the same. The measured pH values of the various columns were still near neutral h m
day 1 and did not change with tirne.
As al1 attempts at modeling these reactions experimentally failed, it was decided
to modeVsimulate these reactions using a cornputer. The program CHILLER was
available and could be used to model these geochemical reactions. After over a year and
with help fiom James L. Palandri (a PhD. candidate studying geochemisûy with
Professor Mark Reed's research group) and Mark H. Reed (CO-author of program
CHILLER), the reactions were successhilly modcled to simulate conditions within a
submerged tailings pile (isolated h m the atmosphere). Unfortunately, al1 attempts to
model the same reactions open to the atmosphere failed. CHILLER could not model
these reactions because the calculated ionic strengths (within CHILLOUT) would
increase to excessive values and the corresponding activity coenicients would lose their
meaning in the sulfate-dominated fluid (M.H. Reeâ, personal communication, 1998).
Reed (personal communication, 1998) did suggest that the activity coefficient routine in
CHILLER could be modified to take into account the sulfatedominated fluid for a more
refined treatment but unfortunately, due to t h e constraints this was not performed.
MODELING and RESULTS
(A) CHILLRUN Setun Essentials
(i) F luid C hemistry for the Water-Rock Titrations
The chernistry of the pore water fluid within tailings or waste-rock piles is site
specific and dependent on numerous variables as was previously detailed. There is a
comrnon source however, for the water that infiltrates these mine waste accumulations -
rainwater. It should be noted that the rainwater chemistry and oxygen content varies fiom
region to region and this will a f h t the degree of sulfide oxidation within a mine waste
accumulation. Therefore, in order to model these reactions properly, the actual rainwater
chemistry for a specific region must be known. Although more accurate, this type of
approach is somewhat limited only to that region and generalizations fkom region to
region are difficult to make. In order to model sulfide oxidation reactions for a wider
array of situations, an average global rainwater chemisûy was used here. According to
Lee and Fetter (1994), greater than 99 % of the solutes in natural groundwater are made
up by less than twelve constituents. Seven ions make up the majority of these
constituents: ca2', Na', M~*+, K', HC03; sot-, and Cr; with some dissolved SiOt. Lee
and Fetter (1994) note that these constituents are routinely found in water sarnple
analyses, so they can serve as the constituents to describe the chemistry of natural waters.
The precipitation chernistry reported by Lee and Fetter (1994) was taken fkom Freeze and
Cherry (1979), and these values where selected to represent the general rainwater
chemistry for al1 the modeling performed with SOLVEQ and CHILLER (see Table 2).
42

Table 2. Median prccipitation v i l w r of aeven rilcl worldwide (hondnds of analyser) (Freeze and Cherry, 1919). pH = 5.5 @ 25 O C and 1 bar.
I Constituent I ~ r w ipitation I
The rainwater chemisûy for the modeling runs was input into GEOCAL Vi mgL
and because the density of the solution was 1 @cm3 (so 1 mg/L = 1 ppm) the oxygen
concentration was input as a ppm value. The oxygen concentration of the water was set
to 9 ppm for the reactions modeled because water which is fully saturated with au at 1
atmosphere and 20 OC contains about 9 ppm (Brown et al, 1991).
(ii) Mineral Chemistry for the Water-Rock Titrations
In order for CHILLER to pedonn water-rock titrations, MINSOL in the
CHILLRUN file must be set to a non-zero value (1,2, 3, or 4) depending on whether the
titration is in grarns or moles. MINSOL was set to 1 for al1 of the reaction modeling
completed in this study. MNSOL = 1 forces CHILLER to titrate the minerais in grarns,
with SMC and SLIM set in g ram (refer to APPENDIX E for a description of the key
components of the CHILLRUN data file). Once MINSOL is set to 1 in the CHILLRCTN
file the reactant minerals are input into NOMOX and theu respective weight percents are
43

entered into WTPC. For example, to titrate 80 % pyrite and 20 % albite hto the aqueous
phase of the CHILLRUN file, pyrite and albite are tisted under NOMOX and their weight
percents are input under WTPC as 80 % and 20 % rcspectively.
(iii) SINCandSLIM
SMC (step increment) is the incmmenting parameter that defmes how much
mineral or rock reactant will be titratcd into the que- phase of the CHILLRLM file
(Reed and Spycher, 1998). SLIM (step limit) is the variable that tells CHILLER to stop
once TOTMIX reaches SLIM. TOTMIX is the current amount of reactant added to the
original solution in grarns (Reed and Spycher, 1998). Therefore, if SINC = 1 and SLIM =
10, CHiLLER will titrate 1 gram of the reactant into the aqueous phase of the
CHILLRUN file and continue to do so as long as convergence is reached during each
titration. CHILLER will stop execution once TOTMIX = SLIM. n i e CHILLRUN file
must then be modified by increasing the SMC and SLIM values by a factor of 10 after
each successful run in order to continue modeling. This procedure is continued until
equilibnurn is reached or until CHILLER fails to reach convergence, at which point the
CWLLRUN file would have to be debugged. James Palandri (personal communication,
1998) suggested starting with SINC = 0 . 1 ~ 1 0 ' ~ and SLIM = 0.1 x10" as the initial
CHILLRUN file parameters.

@) Sulfide Oxidation and Feldsw Dissolution Reactions
(i) 100 % Pyrite
CHILLER was initially up to sirnulate how pure pyrite would oxidize within
an aqueous environment in which the water has a chernical composition equivalent to that
in Table 2. Pyrite was titrated into the aqueous phase by CHlLLER where it was
immediately broken down and the sulfiu was oxidized according to reaction 2, producing
~ e " , ~0;- and H' (Figure 4C).
The Hf liberated by reaction 2 acidifies the system and causes the pH to decrease from the
initial value of 5.5. Goethite simultaneously precipitates acwrding to reactions 3 and 29
(Figure 4A).
~ e * + 2H20 * FeO(0H) + 3lf goethite
The ~ e ~ ' produced in reaction 2 is oxidhd according to reaction 3 into femc iron (~e)').
The subsequent hydrolysis of ~ e " leads to the formation of goethite (reaction 29) (Figure
4A). Reactions 2 and 3 consume oxygen and deplete [w] within the system (Figure 4C

5 4 3 Log w / r
Figure 4. Reaction of 100 % pyrite (Appendix A, Figure 1) with water (Table 2) at 25 O C and no atmospheric contact. Mineral abbreviations can be found in the 'List of Abbreviations'. (A) Minerals formed in log moles. (B) pH and Iog total aqueous molality of the principal component species (Le. Z F ~ " represents the total of al1 aqueous Fe species). (C) Selected individual aqueous species in log molality (not log total aqueous molality). (D) Shows graph (C) in its' entirety. pH can be read directly fkom the Log total aq molality and Log molality axes of B and C respectively.

Figure 4. (Contuiued)
and D). The bisulfate species (HSO43 increases in abundance prior to point 1 due to the
protonation of ~ 0 4 ' - (reaction 30). The increasing [Hfl cirives reaction 30 to the right
producing HSOj'.
Point 1 / Interval 1-2
At point 1 [o2'] rapidly decreases (Figure 4C and D) in response to the rapidly
increasing [~e"] which drives reaction 3 to the right consuming 0:. The activity of ~ e "
increases as it is produced more rapidly in reaction 2 than it is consumed through reaction
3. The bisulfate species (HSOs] continues to increase in abundance, within interval 1-2,
according to reaction 30.

Point 2
At point 2 F ~ S O ~ fonns according to reaction 31; ~ e ~ ' and SQ*- within the
system have increaseâ sufficiently to drive reaction 31 quantitatively to the right.
H~S' also forms at point 2 (reaction 32) due to the presence of H' and HS-.
Pyrite oxidation ceases (or slows dramatically) as the available oxygen within the
system has decreased significantly (Figure 4C and D). The low [O:] inhibits the
oxidation of femus to femc iron in reaction 3. As a result, goethite does not form
becaw femc Uon is requued for its formation according to reaction 29. The initial pH
of the fluid has decreased fiom 5.5 to approximately 3.5 at point 2 as a result of reactions
2, 3 and 29 (Figure 4B and C). At this point goethite is replaced by pyrite as the stable
solid phase (reaction 33).
FeqOIi) + 2~0: + 4H+ " Fe& + '12~20 + 7512~2' goethite pyrite
Reaction 33 is the surn of reactions 2, 3 and 29. The relative stability of the two phases
(pyrite and goethite) is controlled by and [02'], the increased H? and decreased 02'
concentrations force reaction 33 to the right where pyrite stabilizes. The pH increases
slightly as a result of the H+ consurned by reaction 33, yielding a f m l equilibrated pH of
48

approximatcly 3.8. Once equilibrium has been reacheâ, pyrite sirnply accumulates as it is
titrated into the system by CHILLER
(ii) 100 % Pyrrtiotite
CHILLER was also set up to simulate the oxidation of pure pyrrhotite within an
aqueous environment. Pyrrhotite was titrated by CHILLER into the aqueous phase (see
Table 2) where it was immediately broken down and the s u l h was oxidized according to
reaction 1 1 (Blowes and Ptacek, 1994; Blowes et al., 1994; Nicholson, 1994).
F e ~ . ~ s + xH20 + (2-x/2m' P ( l - x ) ~ e ~ + + !Sa2- + 2& pyrrhotite
The products of reaction 11 ( ~ e * ' , SO~" and H-') accumulate within the aqueous phase
(Figure SC) and the system pH decreases fiom the initial value of 5.5. Goethite
simultaneously precipitates (Figure SA) as the ~ e ~ ' produced in reaction 11 is oxidized
into ~e) ' and hydrolyzed according to reactions 3 and 29. Bisulfate (HSO43 increases in
abundance pnor to point 1 due to the pmtonation of ~ 0 1 ~ ' (reaction 30) (Figure 5C). The
oxygen w i t h the system is depleted by reactions 11 and 3 as it is consumed during the
oxidation of pyrrhotite (Figure 5C and D).
Point 1 1 Interval 1-2
At point 1 [ 02O] rapidly decreases (Figure 5C and D) as it did in the pyrite
oxidation simulation. The rapidly increasing [~e'+] continues to drive reaction 3 to the
right, consuming 020 in the process while goethite is produceci (reaction 29). The activity
49

Figure 5. Reaction of 100 % pyrrhotite (Appendix A, Figure 1 1 ) with water (Table 2) at 25 OC and no abnospheric contact. Mineral abbreviations can be found in the 'List of Abbreviations'. (A) Minerals formed in log moles. (B) pH and log total aqueous molality of the principal component species (i-e. L F ~ " represents the total of al1 aqueous Fe species). (C) Selected individual aqueous species in log molality (not log total aqueous molality). (D) Shows graph (C) in its' entirety. pH can be read directly fiom the Log total aq molality and Log molality axes of B and C respectively.

of HSO; continues to increase up to point 2 due to the protonation of ~ 0 4 " (reaction 30).
Point 2 and Point 3
At point 2 the system pH has decreased to approxirnately 3.6 (Figure 5B and C) as
a result of the H' produced through reaction 1 1. F ~ S O ~ ' forms (reaction 3 1) as [ ~ e ~ ' ] and
[so~'-] continue to increase according to reaction II . Goethite is replaced by pyrite at
point 3 as the stable solid phase (reaction 33). The increased [H'] and decreased [oz0]
force reaction 33 to the right and pyrite stabilizes. The pH increases slightly to
approximately 4.1 at point 3 as a result of the H' consumed by reaction 33.
Intet-val 3-4
The excess [H+J drives reaction 14 (Nicholson, 1994) to the right and pyrite forms
as the sultùr in pyrrhotite is oxidized (Burns and Fisher, t 990; Fisher and Burns, 1990).

The pH of the system increases to approximately 6.4 as a mult of the H' consumed
through reaction 14. Goethite re-precipitates within interval 3-4 as the ~ e ~ + is oxidued
into ~ e ~ ' (reaction 3) and hydrolyzed according to reaction 34.
Reaction 34 acts as a decent pH buffer, holding the pH between 6.4 and 6.79 within
interval 3-4. The H' produced in reaction 34 offsets the H+ consumed through reaction
14. This buffer (reaction 34) however, fails when magnetite forms at point 4. The
activity of 02' is also buffered within this interval as the 02' prduced from reaction 34
offsets the 0; consumed in reaction 14.
Point 4
Magnetite forms at point 4 (Figure 5A) as the decreasing [a0] (Figure SC) drives
reaction 35 to the right.
The H+ produced in reaction 35 offsets the H' consumed in reaction 14. The formation of
magnetite (reaction 35) acts as a good pH buffer, holding the pH at approxirnately 9.42
within interval 4-5. This buffer however, fails when al1 of the goethite has been
52

consumed (rcaction 35) within intcmal 4-5. The concentration of the bisulfate species
(HS043 decmases at point 4 and, as a mult, H' and ~ 0 4 ~ - arc consumed according to
reaction 30 as the reaction is driven to the right. The decreasing @?e27 and [ ~ 0 4 * 7 within
interval 4-5 forces reaction 31 to the leA consuming F~SOI* in the process.
While magnetite fonns through reaction 35, and prior to the complete
consumption of goethite, pyrrhotite stabilizes. The low [027 forces reaction 11 to the left
and pyrrhotite forms as the stable solid phase. The system pH inoreases to a f d
equilibrated value of approximately 9.75 at point 5. Once equilibrium has been reached,
pyrrhotite simply accumulates as it is titrated into the system by CHILLER.
(iii) Pyrite and Feldspar Reactions
Due to tirne çonstraints and the fact that the 100 % pyrrhotite reaction mode1
(Figure 5) was buffered to higher pH values (by the formation of goethite and magnetite),
pyrrhotite was not modeled with the addition of feldspars. The pH for the 100 % pyrite
reaction mode1 however, was buffered at a much lower value (3.8), so the main focus of
this work was the investigation of how feldspars (and various proportions of these
feldspars) affect pyrite oxidation. Models with ratios of 1 :1, 1:4 and 4: 1 pyrite:feldspar
(albite, anorthite and microdine) were chosen to explore how these reactions would
evolve, and to determine what affect increasingldecreasing the pyrite:feldspar ratio would
have on the results. At a ratio of 1 :4, CHILLER titrates 1 part sulfide for every 4 parts of
feldspar into the aqueous phase. At a 1 : l ratio, equal parts of sulfide and feldspar are
titrated into the aqueous phase and at the 4:l ratio, 4 parts sulfide per 1 part of feldspar

are titrated into the aqueous phase. For bwity, this section deals with thc modcls for the
1: 1 ratios of pyrite:feldspar, showing how pyrite was buffcred by the pmsence of the
different feldspars. The results for the correspondhg 1 :4 and 4: 1 pyrite:feldspar (albite,
anorthite and microcline) reaction models can be found in Appendix C.
The following section describes the 1:l reactions between pyrite + microcline
(Figure 6), pyrite + albite (Figure 7), and pyrite + anorthite (Figure 8). Table 2 contains
the composition of the initial aqueous phase for al1 of the modekd reactions. In ah three
situations, CMLLER titrates pyrite into the system where it reacts with the aqueous
component to produce ~ e ~ ' , ~ 0 4 ~ - and H' (Figures 6C, 7C and 8C) (reaction 2). Goethite
precipitates as a result of reactions 3 and 29 as ~ e ~ + is oxidized into ~ e ~ + and ~ e ~ ' is
hydrolyzed (Figures 6A, 7A and 8A). Goethite remains stable over intervals 1-3 (Figures
6A, 7A and 8A), but is replaced by pyrite (reaction 33) at point 3 as the stable solid
phase. A minimum pH of approximately 3.7 is reached at point 3 for the 1 : 1 reactions
involving pyrite + microdine and pyrite + albite (Figures 6B and 7B), while a minimum
pH of approximately 3.8 is reached at point 3 for the 1 : 1 pyrite + anorthite reaction model
(Figure 8B). The relative stability of the two phases (pyrite and goethite) is controlled by
[H'] and [oz0]. The increased activity of H' and the decreased activity of 02 forces
reaction 33 to the right where pyrite stabilizes. Some H' is consumeci as a result, and the
pH increases slightly to approximately 4 within interval 3-4 (F4gures 68, 7B and 8B).
The fluid then reaches equilibrim with pyrite and pyrite simply accumulates in the
system as it is titrated by CHILLER.

(a) 50 % Pyrite + 50 % Microcline
The following minerals are initially undersaturated in the aqueous phase for the
reaction of 50 % pyrite and 50 % microcline with rainwater: pyrite, goethite, diaspore,
kaolinite, quare clinochlore, daphnite, stilbite, muscovite, and microdine. Table 3
summarizes the main featuredresults of this reaction and illustrates the minerals present,
produced and consumed, pH and buRering reactions (with buf5ered pH values where
applicable) for the points and intervais of Figure 6.
Microcline is simultaneously titrated into the aqueous phase with pyrite where it
dissolves congruently produciag K+, ~ l ~ * , si&', and AIO(OH)~ (Figure 6B and C), the
activities of which increase according to reaction M.
2KAISi308 + sH+ AIO(OH)@ + 2K* + 6~i0: + AP + 2H20 (36) microcline
The increasing IH+] (from pyrite oxidation) drives reaction 36 to the nght, consuming
microcline in the process. Although this reaction consumes H+, it does not consume H' at
a faster rate than it is produced h u g h the oxidation of pyrite and the subsequent
formation of goethite (see reactions 2,3 and 29) and has no apparent visible affect on pH
over intervals 1-3 (Figure 6B and C).
Interval 1-2
At point 1 diaspore saturates (Figure 6A) due to an increase in [AI"] and
[ A I ~ o H ) ~ (Figure 6C) that drives reaction 37 to the right.

The overall reaction for the formation of diaspore withia this system is shown in reaction
38 (which is the surn of reactions 36 and 37). Diaspore forms as reaction 38 proceeds to
the right (as a result of m), consurning microcline in the process.
2KAISi3@ + 2H+ * ZNO(0H) + 2K* + 6510; microcfine dkpore
Interval 2-3
Diaspore continues to f o m through reaction J(I until [sio2'] has increaxd
sufficiently for kaolinite to saturate (reaction 39). Kaolinite forms at point 2 (Figure 6A)
as the increasing [si@)] (Figure 6C) drives reaction 39 to the right, completely
consuming diaspore in the process.
Reaction 40 (which is the surn of reactions 38 and 39) now takes over as the main H'
consuming reaction (as diaspore has been consumed). Kaolinite is produced at the
expense of microcline and H' as reaction 40 proceeds to the right.
2KAlSi308 + H 2 0 + 2H* * AhSia05(OH)d + 2K+ + 4si0z0 microcline kaolinite

Figure 6. Reaction of 50 % pyrite and 50 % microcline (Appendix A, Figure 4) with water (Table 2) at 25 OC and no atmospheric contact. Mineral abbreviations can be found in the 'List of Abbreviations'. (A) Minerals formed in log moles. (B) pH and log total aqueous molality of the p ~ c i p a l component species (Le. X A ~ ~ ~ represents the total of al1 aqueous Al species). (C) Selected individual aqueous species in log molality (not log total aqueous molality). (D) Shows graph (C) in its' entirety. pH can be read directly from the Log total aq molality and Log molality axes of B and C respectively.

9 8 7 6 5 4 3 2 1 O -1 Log w/r
Interval 3-4
At point 3 the amount of kaolinite produced increases as the excess H' and the
HzO produced fiom goethite reacting out in reaction 36 drives reaction 40 to the right.
Quartz saturates soon after point 3 (within interval 3-4) (Figure 6A) due to the increased
[S~O~']. As the activity of H' is relatively high within interval 3-4 and the amount of
microcline titrated into the system is fairly low, H' is consumed slowly by reaction 40.
Consequently, the pH appears to be buffered within interval 3-4 (Figure 6B and C) by
reaction 40. The pH however, is not buffered within interval 3-4 and as more and more
microcline is titrated into the system, H' is consumed rapidly. The resultant pH increases
to approximately 6.2 at point 4 as H+ is consumed by reaction 40, where daphnite and
clinochlore precipitate.

The decrease in drives reaction 30 to the lefi coasuming HSO4- dong interval
3-4 (Figure 6C). The ~ 0 4 ~ - produced fkom reaction 30 along with the ~ e " in the systcm
produces F ~ S O ~ ' according to reaction 31. The activity of F ~ S O ~ ' i n c m along
interval 3-4 due to the increases in [ ~ e * 7 and [so~~-] (Figure 6C) which drives reaction
31 to the right The activity of HS- increases along interval 3-4 at the expense of [H~s*]
due to the decrease in (Figure 6C). R e f e r ~ g back to reaction 32, the drop in
dnves reaction 32 to the left producing HS-.
Interval 4-5
As [H+J continues to decrease (Figure 6B) daphnite and clinochlore saturate at
point 4 (Figure 6A) (reactions 41 and 42 respectively).
The drop in forces both of these reactions to the right consuming ~e'' and M ~ ~ ' in
the process. The H' produced in reactions 41 and 42 offsets the H' consumed in reaction
40 and buffers the pH between 6.25 and 6.5 witfiin interval 4-5. The b u f f e ~ g effect of
the chlorite pH buffers (Figure 6A) however, fails when L [ F ~ ~ C ] and z [ M ~ ~ ~ decrease
(Figure 68) as they are depleted by the precipitation of daphnite and clinochlore
(reactions 41 and 42 respectively). ~ e ~ ' is a balancing ion in reaction 41 and M ~ ~ + is a
59

balancing ion in reaction 42. The decline in L B * ~ and z[M~'] allows the pH to
increase to about 7.1 in intend 4 5 (Figure dB), where stilbite forms. The activity of
F ~ S O ~ ' decreases as a result of the drop in [ ~ e ~ q dong interval 4-5 (Figure 6C) (see
reaction 31). The &op in pe2C] forces reaction 31 to the lefi consuming [F~so?].
The stilbite-chlorite pH buffer also occurs within interval CS (Figure 6A). The
low and the presence of ~ a + , ca2', si0zo, and AIO(OH)~ (Figure 6 8 and C) forces
reaction 43 to the nght where stilbite saturates.
~ i + + 2ci2' + 19sia' + 9~10(0H)' + SFC'+ + SM^' + 30H20 * Ckl + Dpb + NiCa2(AI5Sii,Os) -14H20 + 25EI' (43)
stilbite
The stilbitechlonte pH buffer fails alrnost immediately as z[ca2'-j decreases in interval 4-
5 (Figure 68) due to the ptecipitation of stilbite (ca2+ is a balancing ion in reaction 43).
The slope of [a curve in interval 4-5 (Figure 6B) changes very slightly as stilbite foms.
The H' produced in reaction 43 does little to offset the H' consumed in reaction 40. As a
result, the pH increases to approximately 7.8 at point 5, where muscovite foms.
As a note, [~1 ' 7 rapidly decreases (within interval 4-5) (Figure 6C and D) and yet
L[AI~'] increases in Figure 6B over the same interval. The increase in L[AI~'] within
interval 4-5 (F4gure dB) is due to AlOf, which is not shown on Figure 6C, for the sake of
simplicity. The same peculiarity can also be observed in Figures 7 and 8 for the 1 : 1
reactions involving pyrite + albite and pyrite + anorthite.

Interval 5 4
Kaolinite continues to fom through reaction 4û as microdine is titrated into the
system until WC] has increased sufficientiy for muscovite to become stable (Figure 6A,
point 5). Muscovite precipitates at point 5 as the excess K' drives reaction 44 to the right
(consuming kaolinite).
Reaction 45 (which is the sum of reactions 40 and 44) now takes over as the main H'
consuming reaction. Muscovite is produced at the expense of microche and H+ as
reaction 45 proceeds to the ri&.
The kaolinite-muscovite-stilbite-chlorite pH buffer (reaction 46) briefly acts as a
good pH buffer, holding the pH at appmximately 7.8 within interval 5-6 (Figure 6B).
The H' produced in reaction 46 balances the I f + consurned in reaction 45. The kaolinite-
muscovite-stilbite-chlorite pH buffer however, fails when al1 of the kaolinite is converted
to muscovite in reaction 46. As a result, insufficient Hf is produced (by reaction 46)

Table 3. A summay of the main f-tandnsrlb of tbt 1:l Pyrite:Micmcliae reaction mode1 UIomiting tbe mioemb praeot, prodacd and consumed, pH and buffering reactiou (4th bu f fed pH valaa where applhbk) for the points and in tervals of Figure 6.
1 : 1 Py :Mc
Gt Point 1
L
Interval 2-3
Minerals Produced
DSP
Gt, Kln 1
Point 3
Clcl, Dph
Stable Minerais
Point 4
PY Kln
Clcl, Dph
Interval 5-6
Point 6
Minerals Consumed
Py,Kh@z
Beyond Point 6
Kln
Mc Dph, Stb, Ms Py, QtZ, clcl, Dph, Stb, Ms, Mc
Kln Dph, Stb b, QW cicl, Dph, Stb, Ms l'Y, h clcl,
B u f f e ~ g Reactions (and buffered pH,

to balance the H' consumed through mction 45.
The pH continues to hcrease as excess H' is consumed through mction 45
(Figure 6B) until microcline dissolution ceases (or slows dramatically). At point 6
(Figure 6A) the system reaches equilibrium with microcline and the microcline-
muscovite-stilbitechlorite pH bufier (reaction 47) yields a fmal equilibrated pH of
approximately 8.3.
3Mc + ~ a ' + 2ca2+ + 13si-@ + ~AIO(OH)@ + 5h2* + SM< + 3OHzO if
Ms + 2K+ + clcl + ~ p b + Stb + 23H' (47)
Microdine continues to accumulate beyond point 6 (Figure 6A) as it is titrated into the
systern by CHILLER.
(b) 50 % Pyrite + 50 % Albite
The aqueous phase for the reaction of 50 % pyrite and 50 % albite with rainwater
is initially undersaturated with respect to the following minerals: pyrite, goethite,
diaspore, kaolinite, quartz, clinochlore, daphnite, stilbite, celadonite, paragonite, and
albite. Table 4 sumarizes the main features/results for this reaction and illustrates the
minerals present, produced and consumed pH and b u f f e ~ g reactions (with buffered pH
values where applicable) for the points and intervals of Figure 7.
Albite is simultaneously titrated into the aqueous phase with pyrite where it
dissolves congruently producing Na', AI'+, ~ i 0 2 ' , and AIO(OH)~ (Figure 78 and C). the
activities of which increase accordhg to rcaction 48.
63

The H' produced from the oxidation of pyrite drives reaction 48 to the right conswning
albite. Although this reaction also wnsumes H', it does not consume H+ at a faster rate
than it is produced through the oxidation of pyrite (and the subsequent formation of
goethite, reactions 2,3 and 29) and has no apparent visible affect on pH over intervals 1-3
(Figure 78 and C).
Interval 1-2
Diaspore saturates at point 1 (Figure 7A) as [AI'+] and [ A I O ( O ~ ~ ] increase
(Figure 7C) and drive reaction 37 to the right. Reaction 49 (which is the s u m of reactions
37 and 48) represents the overall reaction for the formation of diaspore. Diaspore is
produced as reaction 49 moves to the right, (driven by m), consuming albite.
Interval 2-3
At point 2 [si&'] has increased sufficiently for kaolinite to sahirste according to
reaction 39. Kaolinite foms at point 2 (Figure 7A) because the increased [si97
(Figure7C) drives reaction 39 to the right, completely wnsurning diaspore. Reaction 50
(which is the sum of reactions 39 and 49) now represents the dominant H' consuming
reaction. Kaolinite foms at the expense of microcline as the excess H' in the system
drives reaction 50 to the right.
64
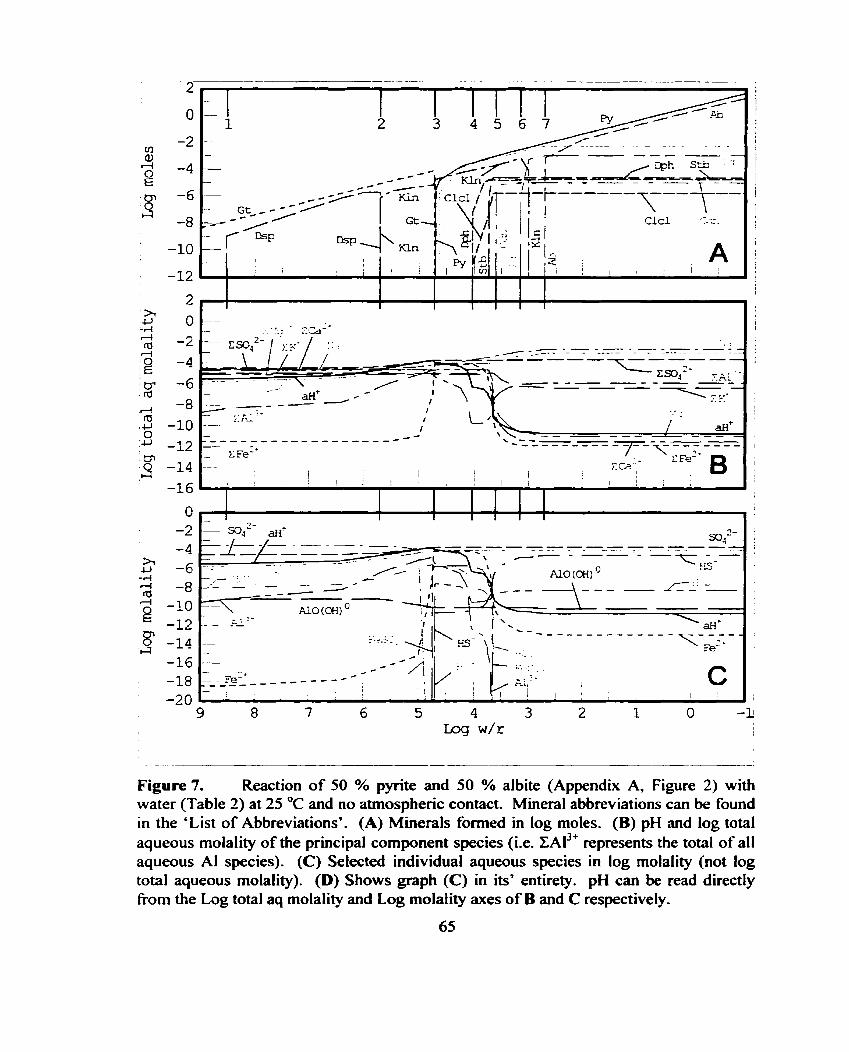
--
Figure 7. Reaction of 50 % pyrite and 50 % albite (Appendix A, Figure 2) with water (Table 2) at 25 OC and no atmospherk contact. Mineral abbreviations can be found in the 'List of Abbreviations'. (A) Minerals formed in log motes. (B) pH and log total aqueous molality of the principal component species (i.e. ZAI)' represents the total of al1 aqueous Al species). (C) Selected individual aqueous species in log molality (not log total aqueous molality). (D) Shows graph (C) in its' entirety. pH can be read directly from the Log total aq molality and Log molality axes of B and C respectively.
65

9 8 7 6 5 4 3 2 1 O Log w / r
- - ---A-L.------- .. -- -- - -- --.- --
Figure 7. (Continued)
2NaAISi301 + H 2 0 + 2H' * Alfii2Os(OW + 2 ~ a + + 4 ~ i 0 ? albite kaolinite
Interval 3-4
The amount of kaolinite produced increases at point 3 as the excess K' and the
H 2 0 produced fiom the goethite reacting out in reaction 33 drives reaction 50 to the right.
Quartz saturates within interval 3-4 (soon after point 3) (Figure 7A) due to the increased
[s~o:]. As the activity of H' is relatively high within interval 3-4 and the arnount of
albite titrated into the system is fairly low, H' is consumed slowly by reaction 50.
Consequently, the pH appears to be buffered within interval 3-4 (Figure 7B and C) as
kaolinite forms according to reaction 50. The pH however, is not buffered within interval
3-4 and as more albite is titrated into the system, H+ is consumed more rapidly. The pH

increases to approximotely 6.2 at point 4 as H* is consumeci by reaction SO, wbere
daphnite and clinochlore precipitate.
HS0,- is also consumed along interval 3-4 as the drop in IHI] drives reaction 30
to the left (Figure 7C). The SO~" produced through reaction 30 combines with the ~e'+
in the system to produce F~SO: (Figure 7C) according to reaction 31. The activity of
F ~ S O ~ ' incrrasa dong interval 3 4 as reaction 31 proceeds to the right. The activity of
HS- also increases dong interval 3-4 due to the decrease in [m. Referring back to
reaction 32, the drop in drives reaction 32 to the left and produces HS' while it
consumes H~S* (Figure 7C).
Interval 4-5
The decreasing (Figure 7B) causes daphnite and clinochlore to saturate
(Figure 7A) according to reactions 41 and 42 respectively. ~ e ~ + and M ~ ~ + are consumed
as the decreased [H+l forces both of these reactions to the right. The H+ consumed in
reaction 50 is offset by the H+ produced through reactions 41 and 42 and this causes the
change in the slope of the aH' curve. The buffering effect of the chlorite pH buffers fails
when z[F~*Y and zwg2'] (Figure 7B) rapidly decrease as they are depleted by the
formation of daphnite and clhochlore (Figure 7A). ~ e ~ ' is a balancing ion for daphnite
(reaction 41) and MC is a balancing ion for clinochlore (reaction 42). The drop in
z[l7e2'] and 12wg27 allows the pH to increase to about 7.1 in interval 4-5 (Figure 7B),
where stilbite fonns.
The stilbitechlorite pH buffer appears in interval 4-5 Figure 7A). The decreased
and the prescnce of ~ a * , ca2+, si&', and AIO(OFI)~ (Figure 7B and C) drive
67

reaction 43 to the right and stilbite f o m . The stilbite-chlorite pH buffkr f i l s alrnost
immediately due to the drop in ~[ca*'] in interval 4-5 (Figure 7B) due to the fortnation of
stilbite (ca2' is a balancing ion in reaction 43). The H' produced in reaction 43 does little
to offset the H' consumed in maction 50 so the slope of the aH' curve in interval 4-5
(Figure 7B) changes very little. The pH increases to approximately 9.4 at point 5, where
celadonite f o m .
The activity of F~SOI' decreases as a result of the drop in v e 2 7 along interval CS
(Figure 7C) (see reaction 31). The drop in r e 2 T forces this reaction to the lefi
consuming al1 of the F ~ S O ~ * (Figure 7C). The activity of HSO; also decreases along
interval 4-5 (Figure 7C) (see reaction 30). The decraaxd forces this reaction to the
left consuming al1 of the HS04- (Figure 7C).
Interval 5-6
The celadonite-stilbite-chlonte mineral pH buffer occurs in interval 56 (Figure
7A) (reaction 51). Celadonite precipitates at point 5 (Figure 7A) as the low and the
K' fiom the rainwater drive reaction 51 to the right.
~ a + + 2ca2+ + K' + I?eH + 2 3 ~ i a ' + IOAIO(OH)' + me2+ + 6 ~ 8 + 3 4 I h ~ ~ 0 *
Cdn + Ckl+ Dph + Stb + 2'ha0 + 33H' (51)
The celadonite-stilbitechlorite pH buffer fails almost immediately as zwg27, L [ K ~ ,
L[F~~'] and z[A~'T (Figure 7B) al1 decrease in interval 5-6. The decrease of any of these
balancing ions causes the celadonite-stilbite-chlorite pH buffer ta fail. The H+ pduced

in reaction 51 does nothing to offset the H' consumcd in reaction W. As a muk, the pH
increases to approximatcly 10.5 at point 6, whcrt paragonite f o m .
Interval 6-7
Kaolinite continues to form through reaction 50 as albite is titrated into the system
until par] has increased suficiently and paragonite becornes stable (Figure 7A, point 6).
Paragonite precipitates at point 6 as the excess ~ a ' drives reaction 52 to the right
(consuming kaolinite).
Reaction 53 now takes over as the main H' consuming reaction; paragonite is produced
as albite and li' are consumed.
The kaolinite-paragonite-celadonite-stilbite-chlorïte pH buffer (reaction 54)
briefly acts as a good pH buffer, holding pH at approximately 10.5 in interval 6-7 (Figure
7B)-
3Kla + 3Na' + Xa2+ + K' + ~ e * + 23siam + IOAIO(OH)' + 6~e'+ + 6lWC + 3l 'h~20 *
2Pg + Cdn + C M + Dph + Stb + 2'120zm + 35H? (54)

Table 4. A summay of the main f ~ h i d ~ i l t s of the 1:l Pyrite:Albitc reaction mode1 illustrating the minerab pracnt, producd and coismmed, pH and bumering reactions (with buf fed pH values where applieibk) for the points and intervals of Figure 7.
Point 1
Interval 1-2
Point 2
Lnterval2-3
1 Interval 3-4
Interval 4-5
Interval 6-7 r- Point 7 r- Point 7
Minerals Produced
DSP
Stable Minerals
Gt
4.57 Kln
PY
Stb
Qtz
Clci, Dph
Clcl-Dph (6.25-6.5)
Minerals Consurned
Gt
Gt, ml
Kln
DSP
1
PY, Kin
b, K h Qtz
Bufférhg Reactions (and buffered pH, where applicable)
Gt
Cdn
pH
5.49
3.72
Ab-Kln-Qtz (3.98-4.3 1)
Dph, Stb, Cdn w, Q@ clcl,
1 Dph, Stb, Cdn, Pg 1 Clcl-Dph (1 0.75) Ab Ab-Pg-Ch-Stb- 10.75
6.27
m, K h QtG Clcl, Dph, Stb b, K h QG Clcl, Dph, Stb, Cdn
Ab
1 Pg, Ab 1 1 1
Kh
Stb-Clcl-Dph
Cdn-Stb-C lcl-Dp h
Kln-Pg-Cdn-S tb- Dph, Stb, Cdn, Pg py, QQ CICI,
9.4
Clcl-Dph (1 0.53) Ab-Pg-Cdn-Stb- 10.75
The H' produced in reaction 54 ôaîances the H+ consumed in reaction 53. The kaolinite-
paragoniteceladonite-stiIbite-chlorite pH b a r fails when al1 of the kaolinite is
converted to paragonite (reaction a). As a result, there is not enough H' produced to
offset the H' consumed in reaction 53.
The pH continues to increase as excess H* is consumed in reaction 53 (Figure 7B)
until albite dissolution ceases (or slows drarnatically). At point 7 (Figure 7A) the fluid
reaches equilibrium with aibite and the albite-paragonite-celadonite-stilbite-chlorite pH
buffer (reaction 55). yields a f d equilibrated pH of approximately 10.7.
3Ab + 2ca2+ + K' + ~ e * + 17~i0: + 1 0 ~ 1 q o H ) ~ + 617e2+ + MC + 3 4 1 / 2 ~ 2 ~ r+
Pg + Cdn + Ckl + Dpb + Stb + NI+ + 2'/202Q + 31H+ (5s)
Albite continues to accumulate beyond point 7 (Figure 7A) as it is titrated into the system
by CHILLER.
(c) 50 % Pyrite + 50 % Anorthite
The following minerals are initially undersaturated in the aqueous phase for the
reaction of 50 % pyrite and 50 % anorthite with rainwater: pyrite, goethite, diaspore,
kaolinite, clinochlore, daphnite, stilbite, laumontite, margarite, calcite and anorthite.
Table 5 sumrnarizes the main features/results of this reaction and illustrates the minerals
present, produced and consumed, pH and buffering reactions (with buffered pH values
where applicable) for the points and intervals of Figure 8.

Anorthite is sirnultaneously titrated into the aqumus phase with pyrite where it
dissolves congruently producing caZ', AI^+, si@, and A~o(oH)~ (Figure 8B and C),
thei. activities increase accorâing to reaction 9 5 .
The activity of H' (which has increased due to the oxidation of pyrite) drives reaction 56
to the right and anorthite is consumed. Although reaction 56 consumes H+, it does not
consume H' at a faoter rate than it is produced thrwgh the oxidation of pyrite and the
subsequent formation of goethite (see reactions 2, 3 and 29). The arnount of H+
consumed by reaction 56 appears to have no apparent visible affect on pH over intervals
1-3 (Figure 8B and C).
Interval 1-2
At point 1 diaspore saturates (Figure SA) in response ta the increased AI^+] and
[AIO(OH)~J (Figure 8C), drïving reaction 37 to the right. The overall reaction for the
formation of diaspore is shown in reaction 57 (which is the sum of reactions 37 and 56).
Diaspore is produced as reaction 57 moves to the right (due to m), consuming
anorthite.

Interval 2-3
Kaolinite saturates at point 2 (Figure 8A) because of an incrcase in [sio2'] which
drives reaction 39 to the right. As a result, diaspore is completely consumed in interval 2-
3 (Figure BA). Now, the main H' consurning reaction involves the formation of kaolinite
as the excess drives reaction 58 (which is the sum of reactions 39 and 57) to the right.
Interval 3-4
At point 3, diaspore saturates (Figure 8A) due to an increase in [ ~ 1 0 0 f l ] (Figure
8C) which drives reaction 37 to the right. The ïncrease in [ A I O O ~ , observed only
within interval 3-4 of this model/simulation, can be attributed to the fact that there are 2
moles of ~ l ~ ' released per mole of anorthite consumed (while only 1 mole of AI^' is
produced per mole of albite or microcline wnsumed). The increase in [ A I O O ~ ] drives
reaction 37 to the right, produchg diaspore. In addition, the amount of kaolinite
increases at point 3 as the excess H+ and the HzO produced as a result of the goethite
reacting out (see reaction 33) drives reaction SS to the right.
As the activity of H' is relatively high within interval 3-4 and the arnount of
anorthite titrated into the system is fairly low, H' is consumed slowly by reaction 58.
Consequently, the pH appears to be buffered within interval 3-4 (Figure 8B and C) by
reaction 58. The pH however, is not buffered within interval 3-4 and as more anorthite is

Figure 8. Reaction of 50 % pyrite and 50 % anorthite (Appendix A, Figure 3) with water (Table 2) at 25 OC and no atmospheric contact. Mineral abbreviations can be found in the 'List o f Abbreviations'. (A) Minerals formed in log moles. (B) pH and log total aqueous molality of the principal component species (Le. LAI^' represents the total of al1 aqueous Al species). (C) Selected individual aqueous species in log molality (not log total aqueous molality). (D) Shows graph (C) in its' entirety. pH can be read directly from the Log total aq molality and Log molality axes of B and C respectively.

Log w/r
titrated into the system, H' is consumed rapidly. The H' consumed by reaction 58 causes
the pH to increase to approximately 6.3 at point 4, where daphnite and clinochlore
precipitate.
The decrease in [m drives reaction 30 to the left consuming HS04- along interval
3-4 (Figure 8C). The ~ 0 4 ~ - produced from this reaction along with [~e't] in the system
produces F ~ S O ~ ' according to reaction 31. The activity of F ~ S O ~ ' increases along
interval 3-4 as reaction 31 proceeds to the right (Figure 8C). The activity of HS- also
increases along interval 3-4 due to the decrease in [m. Refemng back to reaction 32,
the drop in [m drives reaction 32 to the leA producing HS- while it consumes [H~s']
(Figure 8C).

Interval 4-5
The decrease in (Figure 88) causes daphnite and clinochlore to sahuate
(Figure BA) accordhg to reactions 41 and 42 (respectively). The &op in drives both
of these reactions to the right consuming ~ e ~ * and M~*+ in the process. The H? produced
through reactions 41 and 42 offsets the H+ consumed in reaction 58. The buffering effect
of the chlorite pH buffers (Figure 8A) however, fails as ~ [ ~ e ~ f i and zwg2'-J decrease
rapidly in intemal 4-5 (Figure 8B) due to the precipitation of daphnite and cIhochlore.
~ e * ' is a balancing ion for daphnite (reaction 41) and M ~ ~ ' is a balancing ion for
clinochlore (reaction 42). The drop in ~ ~ e * 7 and xwg2fi allows the pH to increase to
about 8.9 in interval 4-5 (Figure 8B), where stilbite forms.
Kaolinite is consumed in interval 4-5 (Figure 8A) (see reaction 39) due to the &op
in [si0201 (Figure 8C). As [si@'] decreases reaction 39 is driven to the left and diaspore
forms.
The stilbite-chlorite-kaolinite-diaspore pH buffer also occurs in interval 4-5
(Figure 8A). The depleted [H+l (Figure 8 8 and C) drives reaction 59 to the right and
stilbite forms.
Kla + ~ a ' + 2ca2+ + 17siaa + 9 ~ 1 0 ( 0 ~ ) @ + We2+ + !Mg2+ + 29H20 0
Ckl + Dph + Stb + 2Dsp + 25H' (59)
The stilbite-chlorite-kaolinite-diaspore pH buffer acts as a good pH buffer,
holding the pH at approximately 8.9 (Figure 8B and C) because the H+ produced in

reaction 59 balances the H' consumed in reaction 57. This pH buffer (reaction 59)
however, fails at point 5 once al1 of the kaollliite has been consumed (Figure 8A).
The activity of F~SO? decreases as a result of the drop in [ ~ e ~ + ] along interval 4-5
(Figure 8C) (see reaction 31). The &op in p e 2 7 forces this reaction to the lefi
consuming al1 of the F~SO?. The activity of HSOC also decreases along interval 4-5 and
continues to do so into interval 56 (Figure 8C) (see reaction 30). The decreased [m forces this reaction to the left consuming al1 of the HSOI in interval 5-6 (Figure 8C).
Interval 5-6
The low (Figure 8B and C) within the systern drives reaction 60 to the right
producing laumontite at point 5 (Figure 8A).
An + Stb + ~AIO(OH)@ + 3 ~ i a ' + a e 2 + + SM^ + 16H20 + AP *
Cicl+ Dpb + 3Lmt + 2Dsp + Na' + 22H* (60)
The laumontite-stilbite-chlorite-diaspore pH buffer (reaction 60) also acts as a good pH
buffer, holding the pH at approximately 9 in interval 5-6 (Figure 8B and C). Reaction 61
now takes over as the dominant H+ consuming reaction as diaspore and laumontite fom.
2CaA12S$q + 2H+ + 4H20 2Dsp + Lmt + Ca 2' anorlAiie
The H' produced in reaction 60 balances the H+ consumed in reaction 61. This pH buffer
fails within interval 5-6 once al1 of the stilbite has been converted into laumontite through
reaction 60 (Figure SA). As a result, the pH incrases to approximately 10.3 at point 6
(Figure 8B and C), where calcite foms.
Interval 6-7
Calcite saturates at point 6 (Figure BA) due to an increase in x[ca2? a d a
decrease in IH+] (Figure SB). The increase in z[ca2+] and the decrease in drives
reaction 62 to the right producing calcite.
Calcite does not buffer the pH at all, and as a result, the pH decreases to approximately
1 1.9 at point 7, where margarite forms.
Interval 7-8
Diaspore continues to fom (reaction 61) as morthite is titrated into the system
until z[c~'+] has sufficiently increased and rnargarite stabilizes (Figure SA, point 7).
Margarite sahirates at point 7 as z[ca2+] increases (Figure 88) driving reaction 63 to the
right, consuming diaspore.
2An + 6Dsp + ci2+ + 5 ~ e * + + SM^' + 8 ~ i 0 2 ' + HCO; + 20H20 *
M q + Cal + Lmt + Dpb + Clcl + 21H* (63)

Table 5. A summmy of the main f#tudresiilb of tbe 1:l Pyrite:Anorthitc reaction mode1 illustratiag the mineriils prueat, produced rad consumcd, pH rad boffenng reactions (witb buf fed pH values wbere rpplicabk) for tbe pointa and intervals of Figure 8.
Point 1
1: 1 Py:An
Interval 1-2
Minerals Produced
Stable Minerals
DSP 1 Gt, Dsp
Minerals Conswned
Gt
1
interval 2-3
1 Point 4 1 Clcl, Dph Py, Kln, Dsp I I
L
Gt Point 2
Point 3
D ~ P Kln t Gt, KIn D ~ P
4., Dsp
Interval 4-5
Point 5
Interval 5-6
Point 6
Interval 6-7
Bu ffering Reactions (and buffered pH,
Kin
Stb
Lmt
Cal Dph, Lrnt b, Dsp, clcl,
Interval 7-8
Point 8
1 Beyond 1 poht 8
I
Gt
py, mp, clcl, Dph w, m p , Clcl, Dph PY, Dsp, Clcl, Dph, Lrnt PY, Dsp, Clcl,
An
Mrg-Lm t-Cal-Clcl- Dph-Dsp ( 1 1.92)
An-Mrg-Lmt-Cal- Clci-Dph (1 3.52) An-Mrg-Lmt-Cal- Clcl-Dph (1 3 S2)
Kln
Stb
Stb
Lrnt, Cal w, Clcl, Dph, Lmt, Cal, Mrg pK Clcl, Dph, Lmt, Cal, Mrg An, py, clcl, ilph, Lmt, Cal,
- Mrg
1 3.52
1 3 -52

The margarite-laumontitedcite-chlorite-diaspore pH buffer (rcaction 63) (Figure 8A)
briefly acts as a good pH buffer holding pH at approximately 1 1.9 in interval 7-8. The H'
produced in reaction 63 baiances the H' consumed in reaction 61, however, this buffer
fails when al1 of the diaspore in the system is converted to margarite (Figure 8A)
(reaction 63). Reaction 64 now takes over as the main H' consurning reaction, producing
margarite and laumontite.
3An + 2H+ + 4H20 * Mrg + Lmt + ci2+ (64)
The pH continues to Uicrease as the excess H' is consurned in reaction 64 (Figure
8B) until anorthite dissolution ceases (or slows dramatically). At point 8 (Figure 8A) the
fluid reaches equilibrium with anorthite and the anorthite-margarite-laumontite-cakite-
chlorite pH buffer (reaction 65) yietds a final equilibrated pH of approximately 13.5.
3An + ~AIO(OA)@ + 5hZc + 5IWg2+ + 20H20 + HCO; + 6 ~ i a ' *
Mrg + Lmt + Cal + Dpb + Clel + 19H' (65)
Anorihite accumulates beyond point 8 (Figure 8A) as it is titrated into the system by
CHILLER.

VI DISCUSSION
Numerical practicality according to Reed (1 997) dictates why waterhck reactions
are typically calculated by titrating rock into water. Because of this approach, the initial
waterkock ratios (w/r) are large as the amount of rock titrated into the system is so srnall
(initially) compared to the amount of water (in the initial aqueous phase). Consequently,
the results are usually expressed with the w/r changing fiom a large to a small value as
graphs are read fiom lefl to right (Figure 8). This corresponds to an increasing arnount of
rock k i n g titrated into the system as the graph is read h m left to right. To reiterate, the
models presented within this text represent how the chemistxy of a receptacle (containing
1 kg of rainwater) would evolve as rock is incternentally titrated into the system. After
each titration the rock and the fluid are allowed to equilibrate before the next incremental
addition of rock. This process continues as more and more rock is incrementally titrated
into the repository (refer Figure 1 ), until fmal equilibration is reached.
(A) 100 % Pyrite and 100 % Pyrrhotite
The 100 % pyrite and 100 % pyrrhotite reaction models p d u c e d very different
results. The mudel involving 100 % pyrite proceeded in a predictable manner, similar to
that described by Bethke (1996). Pynte is oxidized and goethite forms as long as there is
sufficient oxygen available within the system (Figure 4). Goethite is one of the principal
secondary products forrned during the oxidation of pyrite or pyrrhotite within a tailings
environment (Jambor, 1994; Blowes and Ptacek, 1994). The pH within the system

becornes acidic (decreases) as H' is produced d u ~ g the bmakdown of pyrite according
to reaction 2. Figure 9 (which is a graph comparing the activity of H' fiom both models)
illustrates this point. The pH decreases up to point 1 (Figure 9) at which point pyrite
oxidation ceases (or slows dramatically) and equilibrium is reached within the system.
The model for 100 % pyrrhotite, on the other hand, behaved in quite a different
fashion. Up to point 1 (Figure 9) the oxidation of pyrrhotite produced results that were
very similar to the results produced in the model for 100 % pyrite. Pyrrhotite is oxidized
and goethite fonns as ~ e " is oxidized and hydrolyzcd (Figure 5) (reactions 11. 3 and 29
respectively). Beyond point 2 (Figure 9) however, the pyrrhotite reaction model
proceeded in a very different manner. The subsequent formation of different pH-
buffering minerals altered the shape of the cuve giving it a distinctive step-like
appearance indicative of good pH buffers. Referring to Figure 5, goethite buffers the pH
between 6.4 and 6.79 (interval 3-4) and magnetite buffers the pH at approxirnately 9.42
(interval 4-5). Where the curve flattens out, the pH is buffered by the formation of a new
alteration mineral phase or assemblage. The initial pH for both of these systems was 5.5
and the final equilibrated pH values for the models (100 % pyrite and 100 % pyrrhotite)
were 3.8 and 9.75 respectively.
The resultant activities of ~ e ~ ' and ~ 0 4 ~ - are also different for the models
involving 100 % pyrite and 100 % pyrrhotite (Figures 10 and 1 1 respectively). ~ e * ' and
~04'- both increase up to point 1 as they accumulate in response to reaction 2 (the
breakdown of pyrite and the oxidation of sulfûr) and reaction 11 (the breakdown of

Figure 9. The activity curves for H' from the 100 % Pyrite and 100 % Pyrrhotite reactions modeled with CHILLER (Figures 4 and 5 respectively). pH can be read directly from the y-axis (Log molality). The selected individual aqueous specie is expressed in log rnolality (not log total aqueous molality).
Figure 10. The activity c w e s for ~ e ~ ' fiom the 100 % Pyrite and 100 % Pyrrhotite reactions modeled with CHILLER (Figures 4 and 5 respectively). The selected individual aqueous specie is expressed in log molality (not log total aqueous molality).

Figure I l . The activity curves for SO~" from the 100 % Pyrite and 100 % Pyrrhotite reactions modeled with CHILLER (Figures 4 and 5 respectively). The selected individual aqueous specie is expressed in log molality (not log total aqueous rnolality).
pyrrhotite and the oxidation of sulhir). With pyrite (reaction 2), ~ e " and ~ 0 4 ' - no longer
accumulate beyond point 1 (Figures 10 and 1 1 ) as equilibrium has been reached. Both
~ e " and ~ 0 4 ' - however, decrease beyond point 1 for the pyrrhotite reaction model and
equilibriurn is not reached until after point 2 (Figures 10 and 1 1). The decrease in the
activities of both ~e'' and ~ 0 4 ~ - are a result of the reactions involved in pyrrhotite
oxidation and the subsequent formation of pyrite, goethite and magnetite (Figure 5).
Magnetite has been suggested by Alpers et al. (1994) to form as a secondary mineral
within the mine waste environment.
The differences between the 1 00 % pyrite and 1 00 % pyrrhotite reaction models
are due to the distinct minera1 assemblages that buffer the pH to different values. For the
pyrite reaction model, the goethite-pyrite pH buffer (reaction 33) buffers the pH to a final
84

equilibrated value of approximately 3.8. The pyrrhotite reaction model however,
proceeds through a series of minera1 pH buffers that alter the shape of the curve.
Reaction 34 (the goethite-pyrite pH buffer) buffers the pH between 6.4 and 6.79, but,
eventually fails and gives way to reaction 35 (the goethite-pyrite-magnetite pH buffer).
Reaction 35 temporarily buffers the pH at 9.42, but, also fails and gives way to the final
minera1 pH buffer, reaction 11. The pyrite-magnetite-pyrrhotite pH buffer (reaction 1 l),
buffers the pH for the 100 % pyxrhotite reaction model to a fuial equilibrated value of
approximately 9.75.
(B) 1 : 1 Pyrite + Albite, %te + Anorthite, Pyrite + Microdine
The results produced fiom the modeled reactions between 1 : 1 pyrite:albite,
pyrite:anoxthite and pyrite:microcline were al1 sirnilar in appearance (Figures 6, 7 and 8).
As expected, pyrite was broken down and the sulfur was oxidized to produce H', ~ e ~ ' and
S O ~ ~ - , until [ 0 2 0 ] decreased significantly to the point at which the reaction ceased (or
slowed dramatically). The corresponding feldspar was broken down through dissolution
and as a result, H' was consumed. A series of mineral pH-buffering assemblages formed
fiom the products of the feldspar dissolution reactions, buffering the acidity within the
system to different values. The steps in the w] curve of Figures 6, 7 and 8 B and C
coincide with the formation of these mineral pH-buffering assemblages. Each step begins
with the formation of a new alteration mineral, which acts as a good pH buffer. The steps
end with the breakdown of the mineral pH buffer by dissolution or by depletion of the
balancing cations activity as the alteration mineral forms.
85

The graphs in Figures 12 through 17 compare the activities of H', 020, ~ l ) + , ~ e * + ,
~0:- and AIO(OH)~ (respectively) h m each model. The differences between the
activities of these species are due to the particular feldspar involved in the reaction. The
cation released by the felâspar in each model (albiteNa', anorthite-Ca2' and microcline-
K3 influences the mineral assemblages that form. A different minera1 assemblage foms
for each of the modeled reactions (1:l pyrite:albite, 1 :1 pyrite:anorthite and 1:l
pyrite:microcline) because of the particular cation (Na', ca2' or K3 involved. Therefore,
the activities of H', O;, ~ 1 ~ ' . ~e", SO?- and AD(oH)* are different in each model
because of the differences that exist between the resultant mineral assemblages.
The pH (Figure 12) for al1 three models decreases up to point 1 after which a
series of pH-buffering minerals forms, a l t e ~ g the [m cwes . The decrease in pH (for
each model) was due to the H' produced fiom the oxidation of pyrite. The reaction
between 1 : 1 pyrite:microcline is the fmt modeled reaction to reach equilibrium (Figure
1 2, point 2) and has a fmal equilibrated pH of approximately 8.3. The 1 : 1 pyrite:anorthite
reaction model takes the longest to mach equilibriurn (Figure 12, point 3) and has a fmal
equilibrated pH of approximately 13.5. Based on these results, if a near-neutral pH is
desired, microcline would be the prefemd feldspar to use as a mineral pH buffer under
these conditions. Anorthite however, would be a more appropriate mineral pH buffer, if
at some point in tirne, more Hf was generated in the system. Under these conditions,
anorthite would have a greater potential to neutralize any acid released into the system
(with time) because it has a much higher final equilibrated pH.

All three models consume oxygen at approximately the sarne rate (Figure 1 3). At
point 1 the rate of 020 mnsumption promptly incrcases as the amount of pyrite titrated
into the system has reached a critical value, rapidly consuming the 0 2 ' as pyrite is
oxidized. The products produced fiom the oxidation of pyrite increase as a result.
Besides the increase in [Fi+] (as previously discussed), the activities of ~ e ~ ' and ~ 0 4 ~ - also
increase up to point 1 (Figures 14 and 15 respectively) as pyrite is oxidized. The activity
of ~e*' decreases beyond point 1 due to the formation of F~SO: and iron-bearing
minemls, daphnite (for the models involving microdine and anorthite) and daphnite and
celadonite (for the albite reaction mode]). The activity of SO~" (Figure 15) is essentially
the sarne for al1 t h e models. The feldspar rnodeled for each system does not appear to
affect, differently, the amount of S O ~ ~ ' released into the system.
The activity of AI)' increases up to point I (Figure 16) as it is produced through
feldspar dissolution. Beyond this point, AL'^ decreases as various Al-bearing alteration
minerals precipitate (Le. kaolinite, the chlorites, the micas, and the zeolites).
Cornparisons of the behavior of [AL-''] (Figure 16) with [Hf] (Figure 12) yield an
interesting fmding. There appears to be a direct relationship between the activities of H'
and AI)' produced fiom the 1 : 1 reactions between pyrite:microcline, pyrite:albite and
pyrite:anorthite (Figures 1 2 and 16, respectively). The corresponding H' and AI-" graphs
for each of these reactions appear to be virtually identical. The relationship that exists
between these species can be explained by examining the equilibrium constant (K).
According to the law of mass action, the relative activities of the reactants and
products of a reaction at equilibrium can be cxpressed in ternis of the equilibrium

5 4 3 Log w/r
-
Figure 12. The activity curves for H' fiom the 50 % Pyrite and 50 % Feldspar (microcline, albite and anorthite) reactions modeled with CHILLER (Figures 6, 7 and 8 respectively). pH can be read directly from the y-axis (Log molality). The selected individual aqueous specie is expressed in log molality (not log total aqueous molality).
Figure 13. The activity curves for 02 fiom the 50 % Pyrite and 50 % Feldspar (microcline, albite and anorthite) reactions modeled with CHILLER (Figures 6, 7 and 8 respectively). The selected individual aqueous specie is expressed in log molality (not log total aqueous molality).

5 4 3 Log w/r
Figure 14. The activity curves for ~ e ~ ' fiom the 50 % Pynte and 50 % Feldspar (microcline, albite and anorthite) reactions modeled with CHILLER (Figures 6, 7 and 8 respectively). The selected individual aqueous specie is expressed in log molality (not log total aqueous molality).
Figure 15. The activity curves for ~ 0 4 ~ - h m the 50 % Pynte and 50 % Feldspar (microcline, albite and anorthite) reactions modeled with CHILLER (Figures 6, 7 and 8 respectively). The selected individual aqueous specie is expressed in log molality (not log total aqueous molality).

constant. Consider reaction 37, K relates to the H+ and AI)' species as follows:
As K is a constant, the concentrations of the reactants and products must increase or
decrease in order for K to remain constant. Therefore, because the activity c w e s for H'
and ~ 1 ~ ' (Figures 12 and 16, respectively) are so similar in appearance, it can be
concluded that as H' increases (pH decreases) the corresponding activity of AI^' must
also increase in order for K to remain constant. Conversely, as H' decreases (pH
increases) the corresponding activity of Al3' must also decrease in order for K to remain
constant.
The activity of A I ~ O H ) ' behaves sirnilady for the 1 : 1 pyrite:microclïne and
pyrite:albite reaction models (Figure 17). Up to point 1 (Figure 17), the activity of
AIO(OH)O remains stable due to the formation of diaspore but decreases beyond point 1
because diaspore is no longer stable. The activity of ~lO(0f-I)~ for the 1:l
pyrite:anorthite reaction mode1 remains stable due to the formation of diaspore but
decreases beyond point 2 because diaspore is no longer stable. The activity of AIO(OH)O
increases again at point 3, however, afier decreasing within interval 2-3, because diaspore
is again stable until point 4. As previously discussed, the activity of A I ~ O H ) ' increases
again due to the fact that there are 2 moles of ~ l - " released per mole of anorthite
consumed. The excess AI" causes an increase in [ A I ~ O H ) ~ ] within the aqueous phase
and diaspore re-precipitates at point 3.

5 4 3 Log w/r
Figure 16. The activity curves for ~ l " fiom the 50 % Pyrite and 50 % Feldspar (microcline, albite and anorthite) reactions modeled with CHILLER (Figures 6, 7 and 8 respectively). The selected individual aqueous specie is expressed in log molality (not log total aqueous molality).
Al0 (OH) O 1 4 -
Figure 17. The activity curves for AIO(OH)O from the 50 % Pyrite and 50 % Feldspar (microcline, albite and anorthite) reactions modeled with CHILLER (Figures 6, 7 and 8 respect ively). The selected individual aqueous specie is expressed in log molality (not log total aqueous motality).
The majority of the minerals formed through these rnodelcd reactions have been
reported h m waste rock accumulations. Goethite and kaolinite (although unceitainty
exists as to the latter's identification as a secondary mineral) are reported to form fkom the
oxidation of coal wastes (Jambor, 1994). Kaolhite, goethite and micas (vermiculite and
mked-layer mica-vermiculite) have been identified as secondary minerals in sulfide rich
tailings (Jambor, 1994). According to Blowes and Ptacek (1994) goethite, chlorite,
muscovite and feldspars have been identi fied as principal pH-bu ffering phases in tailings
piles. Zeolites often form as a result of the alteration of feldspars according to Mason and
Berry (1 968). Therefore, zeolites may form through the dissolution of feldspars within a
tailings pile, though none have been reporteci fiom these environments.
The minerals formed during the modeling reactions with CHILLER are al1
identified as minerah that exist within tailings environments or have the potential to exist
under those conditions. Initial test runs with CHILLER however, had resulted in the
formation of several minerals that were questionable, as far as their existence, within
these environments. As a result, these minerals had to be suppressed fkom forming
during modeling by listing them under the SUPNAM feature in the CHILLRUN data file
for each of the modeled reactions. SUPNAM is used to prevent the formation of any
questionable minerals, based on the user's knowledge (Reed and Spycher, 1998) (refer to
APPENDK E for a description of the key components of the CHILLRUN data file).
Some of the minerals suppressed fiom forming duruig these modeling reactions were:
andradite, staurolite, vesuvianite, zoisite, tilleyite, diopside, larnite and menvinite to name
a few.

Although not identified as secondary minerais, paragonite, margarite and
celadonite (al1 micas) could al1 foxm under appmpnate conditions. These minerais may
already fom within tailings piles, especially those known to contain micas (veimiculite
and mixed-layer mica-vemiculite), but they rnay not be present in suficient quantities
and therefore, not yet identified. On the other hancl, no one may have looked at the
possibility of their existence, or the simulations modeled with CHILLER are incorrect.
The sarne rational can be applied to the zeolites (laumontite and stilbite); they may exist
as a byproduct of feldspar dissolution, but remain to be discovered. As noted earlier, the
amount of information regarding the mineralogy (primary and secondary) of mine waste
tailings piles and waste rock accumulations is scant.
One has to bear in mind that the results £iom CHILLER do not actuaiiy dictate
which minerals would form but rather which minerals could form under the specified
conditions. This has to be kept in mind when reviewing the results fiom CHILLER, as
with al1 other geochemical models, the results are not absolute. Gemchemical reaction
modeling serves only as a twl that hopefully leads to M e r , more refmed investigations,
whether it be in the laûoratory or in nature. The reactions presented within this study
test@ to the complexity of the types of possible geochernical reactions that can take place
within mine waste accumulations during the formation of acidic mine drainage.
(C) 1 :4. 1 : 1 and 4: 1 Pvrite + Felds~ar Ratios
The pyrite and feldspar reactions were modeled at ratios of 1 : 1, 1 :4 and 4: 1 to
determine the e ffect of increasingldecreasing the pyrite: feldspar ratio. The mults
93

indicate that increasing or decreasing the pyrite:feldspar ratio had no afféct on the
sequence of alteration minerals fonmd; the resultant bufferùig reactions, buffered pH
values and fmal equilibrated pH were the sarnt for each p u p of modeled reactions. The
results of the pyrite:albite mode ling reactions (1 :4, 1 : 1 and 4: 1 ) were al1 the same, as were
the results tiom the pyriteanorthite and pyrite:microcline modeling reactions- This
conclusion is not surprishg because al1 that is king altered within the CHILLRUN file is
the amounts of pyrite and feldspar titrated into the systems.
Increas ing/decreasing the pyrite: feldspar ratio only affected the point at which the
reactions occurred. As time is not a factor expressed in the results from CHILLER, the
point at which these reactions occur will be related to the waterlrock ratio. To illustrate
this point, refer to the activity diagram for H' (Figure 18) fiom the 1 :4, 1 : 1 and 4: 1
pyrite:microcline reaction models. As can be seen in Figure 18, pyrite oxidation ceases
(or slows dramatically) at point 1 (log w/r = 5) for the 4:l pyrite:microcline reaction
model while in the 1:4 pyrite:microcline reaction model pyrite oxidation does not cease
(or slow dramatically) until point 3 (log wlr = 4.38). Therefore, the 4: 1 pyrite:microcline
reaction model is the first modeled reaction in which pyrite oxidation ceases (or slows
drarnatically) while the 1 :4 pyrite:microcline reaction model is the last modeled reaction
to reach this stage. Al1 three models (1 :4, 1 : 1 and 4: 1 pyrite:microcline) reach a
minimum pH at different w/r ratios (Figure 18 points 1, 2 and 3), and this is directly
related to the pyrite:feldspar titration ratio. At a ratio of 4: 1 pyrite:feidspar, more pyrite is
titrated into the system per titration than in the other modeled reactions (1:l and 4:l
pyrite:feldspar). As a result, the available oxygen within the system (9 ppm 0 2 ) is

consumed more rapidly by the 4:l pyrite:feldspar reaction models and they are the f m t
modeled reactions in w hich pyrite oxidation ceases (or slows ciramatical ly ). Conversely,
the 1 :4 pyrite:microcline reaction mode1 is the f m t modeled reaction to reach equilibrium
(Figure 18 point 4 versus points 5 and 6) because more feldspar (rnicrocline) is titrated
into the system per titration than in the other modeled reactions (1:I and 4:l
pyrite:microcline). As a result, H' is consumed more rapidly by the 1 :4 pytite:feldspar
reaction models and they are the f m t modeled reactions in which equilibrium is reached.
Figure 18. The activity curves for H' fiom the 1 :4, 1 : 1 and 4: 1 Pyrite:Microcline reactions modeled with CHILLER. pH can be read directly fiom the y-axis (Log molality). The selected individual aqueous specie is expressed in log molality (not log total aqueous motality).

Vn CONCLUSIONS
The principal conclusions fiom the results of this study are:
1. The 100 % pyrite reaction mode1 was buffered by the goethite-pyrite pH buffer to
a final equilibrated pH of approximately 3.8.
2, The 100 % pyrrfiotite reaction mode1 was buffered by three distinct mineral pH
bufTers, altering the shape of the [aH+J c w e . The pH was initially buffered between 6.4
and 6.79 by the goethite-pyrite pH buffer, then it was buffered at 9.42 by the goethite-
pyrite-magnetite pH buffer. The model was buffered to a fmal equilibrated pH of
approximately 9.75 by the pyrite-rnagnetite-pyrrhotite pH buffer.
3. The minera1 assemblages produced by each of the modeled reactions (1:I
pyrite:albite, 1 : 1 pyrite:anorthite and 1 : 1 pyrite:microcline) were different because of the
particular cation (Na', ca2' or K') involved. Consequently, the activities of species
produced f?om these reaftions (i.e. H+, O*', AI)') were different in each of the models
because of the differences that existed between the resultant mineral assemblages.
4. The 1:l pyrite:microcline reaction mode1 is the first modeled reaction to reach
equilibrium with a fmal equilibrated pH of approximately 8.3. The 1:l pyrite:anorthite
reaction model took the longest to reach equilibrium and buffered the pH to the highest
final equilibrated value of approximately 1 3 .S.

5 . The minerals formed during the modeling rcactions with CHILLER have becn
shown to exist within tailings environments or have the potential to exist under those
conditions.
The following minerals formed fiom the 1:l pyrite:microcline reaction model:
- goethite, diaspore, kaolinite, quartz, clinochlore, daphnite, stilbite and
muscovite.
The 1 : 1 pyrite:albite reaction model produced the following minerals:
- goethite, diaspore, kaolinite, quattz. clinochlore, daphnite, stilbite,
celadonite and paragonite.
The minerals that formed fkom the 1 : 1 pyrite:anorthite reaction model were:
- goethite, diaspore, kaolinite, clinochlore, daphnite, stilbite, laumontite,
calcite and margarite.
6. Increasing or decreasing the pyrite:feldspar ratio did not affect the sequence of
alteration minerals formed, so the resultant bufiering reactions, buffered pFI values and
final equilibrated pH were the same for each group of modeled reactions. Increasing or
decreasing the pyrite:feldspar ratio only affected the point at which the reactions occurred
(with respect to the watedrock ratio). To illustrate, in al1 three groups of models the 1 :4
(pyrite : feldspar) reaction rnodels reached fmal equilibration fmt (at a higher w/r) whi le,
the 4: 1 (pyrite:feldspar) reaction models were the last to mach fmal equilibration (at a
lower w/r).

VI11 RECOMMENDATIONS
Al1 of the reactions were success!ùlly modekd isolated fiom the atmosphere,
simulating how sulfide oxidation generates acid or AMD and feldspar dissolution
neutralizes/buffers the acid produced in a closed environment. To expand upon this
research, the same reactions should also be modeled without removing the atmospheric
buffers in CHILLER. The results of modeling these sarne reactions open to the
atmosphere would show how pyrite oxidation proceeds indefmitely with an inexhaustible
source of oxygen and unlirnited amounts of pyrite. This type of mode1 could then be used
to predict the minimum percentage of feldspar (depending on type) required to buffer and
neutralize the acid generated under certain conditions. In general, if there are more acid-
consuming minerals in the mine waste, the resulting pH will be near neutral to basic.
CHILLER would have to be modified however, because with previous modelhg
atternpts, the calculated ionic strengths (within CHILLOUT) would increase to excessive
values and the corresponding activity coefficients would lose their meaning in the sulfate-
dominated fluid (M.H. Reed, personal communication, 1998). Reed (personal
communication, 1998) suggests that the activity coefficient routine in CHILLER could be
altered to take into account the sulfate-dominated fluid for a more refined treatment.
Further attempts at modeling the reactions could be made in the laboratory. If
successfiil, CHILLER could then be used in conjunction with the laboratory experhents
to predict the outcome of certain reactions, which could then be tested in a series of
experiments. This approach would produce more diable predictions, since they were

Actuai site specific data reporteci h m mining companies consisting of mine
waste composition, pore fluid chemistry and effluent chemistry could be used by
CHILLER to preâict how theû present remediation techniques will fare with tirne or
model potential mixing remediation strategies. I f the results produced with CHILLER are
accurate, the modeler could use CHILLER to model and predict how the effluent
chemistry fiom newly accumulateci mine waste piles would change with t h e . This
advance would establish CHILLER as a predictive tool for acid mine drainage.

Aachib, M., Aubertin, M., and Chapuis, R.P., (1994), Column Tests Investigation of Milling Wastes Properties Used to Build Cover Systems, International Land Reclamation and Mine Drainage Conference and Third International Conference on the Abatement of Acidic Drainage Volume 2 of 4: Mine Drainage, US Department of the Interior, Bureau of Mines Special Publication SP 06B-94, p. 128.
Ahonen, L., and Tuovinen, O.H., (1994), Solid-phase Alteration and Iron Transformation in Column B ioleac hing of a Corn plex Sulfide Ore, Environmental Geochemistry of Suifide Oxidat ion, American C hemical Society Symposium Series 5 50, Editors: C.N. Alpers and D.W. Blowes, pp. 79-89.
Alpers, C.N., Blowes D.W., Nordstrom, D.K., and Jambor, J.L, (1994), Secondary Minerals and Acid Mine-water Chemistry, Mineralogical Association of Canada Short Course Handbook on the Environmental Geochemistry of Sulfide Mine- Wastes Vol. 22, Waterloo Ontario May, 1994, Editors: J.L. Jambor and D.W. Blowes, pp. 247-269.
Bates, R.L., and Jackson, J.A., (1 984), Dictionary of Geological T e m , Third edition. pp. 201, 514,558.
Bethke, C.M., (1996), Geochemical Reaction Modeling, Concepts and Applications, University of Illinois, Urbana-Charnpaign, New York - Oxford University Press, pp. 9-78, 146-149, 165- l98,303-305,33 1-342.
B igham, LM., ( 1 994) Mineralogy of Ochre Deposits Formed by Sulfide Oxidation, Mineralogical Association of Canada Short Course Handbook on the Environmental Geochemistry of Sulfide Mine-Wastes Vol. 22, Waterloo Ontario May, 1994, Editors: J.L. Jambor and D.W. Blowes, pp. 103-1 3 1.
Bigham, J.M., Schwertmann, U., Carlson, L., and Murad, E., (1990), A Poorly Crystallized Oxyhydroxysulfate of Iron Fonned by Bacterial Oxidation of Fe(i1) in Acid Mine Waters, Geochimica et Cosmochimica Acta, 54, pp. 2743-2758.
B lowes, D. W., (1 994), Remediation and Prevention of Lowquality Drainage fiom Tailings Impoundments, Mineralogical Association of Canada Short Course Handbook on the Environmental Geochemistry of Sulfide Mine-Wastes Vol. 22, Waterloo Ontario May, 1994, Editon: J.L. Jambor and D.W. Blowes, pp. 365- 3 79.
Blowes, D. W., and Ptacek CL, (1 994), Acid-neutralization Mechanisms in Inactive Mine Tailings, Mineralogical Association of Canada Short Course Handbook on the Environmental Geochemistry of S ulfide Mine- Wastes Vol. 22, Waterlm Ontario May, 1994, Editors: J.L. Jambor and D.W. Blowes, pp. 27 1-29 1.
Blowes, D.W., Ptacek C.J., Frind, E.O., Johnson, R.H., Robertson, W.D., and Molson, J. W., (1 994), Acid-Neutralization Reactions in Inactive Mine Tailings Impoundments and Their Effect on the Transport of dissolved Metals, International Land Reclamation and Mine Drainage Conference and Third International Conference on the Abatement of Acidic Drainage Volume 1 of 4: Mine Drainage, US Department of the Interior, Bureau of Mines Special Publication SP 06A-94, pp. 429-438.
Brown, T.L., LeMay, H.E., and Bursten, B.E., (1991), Chemistry The Central Science, Fifth Edition, Prentice Hall, E n g l e w d Cliffs, NJ 07632, p. 661.
Burns, R.G., and Fisher, D.S., (1990), Iron-sulfûr Mineralogy of Mars: Magmatic Evolution and Chernical Weathering Products, Journal of Geophysical Research 95, pp. 14415-14421.
Day, S.J., (1994), Evaluation of Acid Generating Rock and Acid Consuming Rock Mixing to Prevent Acid Rock Drainage, International Land Reclarnation and Mine Drainage Conference and Third International Conference on the Abatement of Acidic Drainage Volume 2 of 4: Mine Drainage, US Department of the Interior, Bureau of Mines Special Publication SP 068-94, p. 77.
Dietz, J.M., Watts, RG., and Stidinger, D.M., (1994), Evaluation of Acidic Mine Drainage Treatment in Constructed Wetland Systems, International Land Reclamation and Mine Drainage Conference and Third International Conference on the Abatement of Acidic Drainage Volume I of 4: Mine Drainage, US Department of the Interior, Bureau of Mines Special Publication SP 06A-94, p. 70.
Eger, P., Wagner, J.R., Kassa, Z., and Melchert, GD., (1 994), Metal Removal in Wetland Treatment Systems, International Land Reclamation and Mine Drainage Conference and Third International Conference on the Abatement of Acidic Drainage Volume 1 of 4: Mine Drainage, US Department of the Interior, Bureau of Mines Special Publication SP 06A-94, p. 80.
Eriksson, N., and Destouni, G., (1994), Modeling Field-Scale Transport of W e a t h e ~ g Products in Mining Waste Rock Durnps, International Land Reclamation and Mine Drainage Conference and Third International Conference on the Abatement of Acidic Drainage Volume 1 of 4: Mine Drainage, US Department of the Interior, Bureau of Mines Special Publication SP 06A-94, p. 50.
Feasby, DG., Chambers, D.B., Scharcr, J.M., Pcttit, C.M., Dakers, RG., and Goldsworthy, M.H., (1994), International Pmpcfave on the Role of Acid Generation in Selecthg Decommissioning Techniques for Uranium Mining Sites in Eastern Germany, International Land Reclamation and Mine Drainage Conference and T h ~ d International Conference on the Abatement of Acidic Drainage Volume 2 of 4: Mine Drainage, US Department of the Interior, Bureau of Mines Special Publication SP 068-94, p. 70.
Fisher, D.S., and Burns, R.G., (1990), W o t i t e Oxidation: Mechanisms of Acid Weathering, Geological Society of Arnerica Annual Meeting Program Abstracts 22, p. 207.
Freeze, R.A, and Cherry, LA., (1979), Groundwater, Englewood CliEs, New Jersey, Prentice-Hall, p. 604.
Gould, W.D., Bechard, G., and Lortie, L., (1994), The Nature and Role of Microorganisms in the Tiailings Environment, Mineralogical Association of Canada Short Course Handbook on the Environmental Geochemistry of Sulfide Mine-Wastes Vol. 22, Waterloo Ontario May, 1994, Editors: J.L. Jambor and D.W. Blowes, pp. 185-198.
Hubbard, K.L., Darling, G.D., Rao, S.R, and Finch, J.A., (1994), New Functional Polyrners as Sorbants for the Selective Recovery of Toxic Heavy Metals fiom Acid Mine Drainage, International Land Reclarnation and Mine Drainage Conference and Third International Conference on the Abaternent of Acidic Drainage Volume 2 of 4: Mine Drainage, US Department of the Interior, Bureau of Mines Special Publication SP 068-94, p. 273.
Itzkovitch, I.J., and Feasby, D.G., (1993), Le programme de neutralisation des eaux de drainage dans l'environnement minier, Colloque sur le progamme de neutralisation des eaux de drainage dans l'environnement minier, Val d'Or, NEDEM 93, pp. 1-1 6.
Jambor, J-L, (1994), Mineralogy of Sulfide-rich Tailings and Their Oxidation Products, M ineralogical Association of Canada Short Course Hand book on the Environmental Geochemistry of Sulfide Mine-Wastes Vol. 22, Waterloo Ontario May, 1994, Editors: J.L. Jambor and D.W. Blowes, pp. 59-101.
Kleinmann, R.L.P., (1 979), The Biogeochemistry of Acid Mine Drainage and a Method to Control Acid Formation, Ph.D. thesis, P ~ c e t o n University, Princeton, New Jersey.
K r e g R., (1983), Symbols for Rock-forming Minerais, Arnerican Mineralogist, Volume 68, pp. 277-279.

Lee, K., and Fetter, C.W., (1994), Hydrogeology Laboratory Manual, Lab 4, Water Chemistry and Water Quality, Macmillan Publishing Company, pp. 29-30.
Lin, C.K., (1996), Modeling Acid Mine Drainage, Ph.D. thesis, The University of Utah, Department of Chernical and Fuels Engineering.
Mason, B., and Berry, L.G., (1968), Elements of Mineralogy, W.H. Freernan and Company, San Francisco, pp. 430-436.
Mills, A.L., (1985), Acid Mine Waste Drainage: Microbial Impact on the Recovery of Soi1 and Water Ecosystems, Soi1 Reclamation Processes, Marcel Dekker Inc. New York, Editors: R.L. Tate and D.A. Klein, pp.35-80.
Morin, KA., and Hutt, N.M., (I994), Observed Preferential Depletion of Neutralization Potential Over Sulfide Minerals in Kinetic Tests: Site Specific Criteria for Safe NP/AP Ratios, International Land Reclamation and Mine Drainage Conference and Third International Conference on the Abatement of Acidic Drainage Volume 1 of 4: Mine Drainage, US Department of the Interior, Bureau of Mines Special Publication SP 06A-94, p. 148- 15 1.
Murdock, D.J., Fox, J.R., and Bensley, J.G., (1 994), Treatment of Acid Mine Drainage by the High Density Sludge Process, International Land Reclamation and Mine Drainage Conference and Third International Conference on the Abaternent of Acidic Drainage Volume 1 of 4: Mine Drainage, US Department of the Interior, Bureau of Mines Special Publication SP 06A-94, p. 241.
Nicholson, RV., (1 994), Imn-sulfide Oxidation Mechanisms: Laboratory Studies, Mineralogical Association of Canada Shon Course Handbaok on the Environmental Geochemistry of Sulfide Mine-Wastes Vol. 22, Waterloo Ontario May, 1994, Editors: J.L. Jambor and D.W. Blowes, pp, 163-182.
Nordstrom, D.K., (1976), Kinetic and Fquilibrium Aspects of ferrous Iron Oxidation in Acid Mine Waters, Abstract, Geological Society of America Annual Meeting, Denver Colorado.
Nordstrom, D.K., (1982), Aqueous Pyrite Oxidation and the Consequent formation of Secondacy Iron Minerals, Acid Sulfate Weathering; Proceedings of a Symposium, SSSA-Special-Publication 10, pp. 3 7-56.
Olson, G.J., (1991), Rate of Bioleaching by Z'hiobacifh jerroariidam; Results of an Interlaboratoy Cornparison, Applied Environmental Microbiology 57, pp 642- 644.
Pro& J.T., De Bruyn, J.C., BOS, P., and Kuenen, J.G., (1 W2), Anaerobic Gmwth of ThiobacilIw ferrooxidam, Applied Environmental M icrobiology, 58, pp 2227- 2230.
Rao, S.R., Kuyucak, N., Sheremata, T., Leroux, M., Finch, J.A., and Wheeland, KG., (1994), Prospect of Metal RecoverylRecycle from Acid Mine Drainage, International Land Reclarnation and Mine Drainage Conference and Third International Conference on the Abatement of Acidic Drainage Volume 1 of 4: Mine Drainage, US Department of the Interior, Bureau of Mines Special Publication SP 06A-94, p. 223.
Reed M.H., (1982), Calculation of Multicomponent Chernical Equilibria and Reaction Processes in Systems Involving Minerals, Gases and an Aqueous Phase, Geochimica et Cosmochimica Acta, 46, pp. 5 13-528.
Reed, M.H., (1997), Hydrothermal Alteration and its Relationship to Ore Fluid Composition, Geochemisûy of Hydrothermal Ore Deposits, Third Edition, Barnes, H.L. ('ditor.), John Wiley and sons, New York, pp. 303-365.
Reed, M.H., and Spycher, N.F., (1990), SOLTHERM: Data Base of Equilibria Constants for Aqueous-Mineral-Gas Equilibria, Department of Geological Sciences, University of Oregon, Eugene Oregon 97403, pp. 1-47.
Reed, M.H., and Spycher, N.F., (1 998), Users Guide for CHiLLER: A Program for Computing Water-Rock Reactions, Boiling, Mixing and Other Reaction Processes in Aqueous-Mineral-Gas-Systems and Minplot Guide, Third Edition, Department of Geological Sciences, University of Oregon, Eugene Oregon USA, pp. 1 -70.
Rich, D.H., and Hutchinson, KR., (1994), Coal Refuse Disposal Using Engineering Design and Lime Chemistry, International Land Reclamation and Mine Drainage Conference and Third International Conference on the Abatement of Acidic Drainage Volume 1 of 4: Mine Drainage, US Department of the Interior, Bureau of Mines Special Publication SP 06A-94, pp. 392-395.
Ritchie, A.1 .M., (1 994a), The Waste-rock Environment, Mineralogical Association of Canada Short Course Handbook on the Environmental Geochemisûy of Sulfide Mine-Wastes Vol. 22, Waterloo Ontario May, 1994, Editors: J.L. Jambor and D.W. Blowes, pp. 133-16 1.
Ritchie, A.I.M., (1994b), Sulfide Oxidation Mechanisrns: Controls and Rates of Oxygen Transport, Mineralogical Association of Canada Short Course Handbook on the Environmental Geochemistry of Sulfide Mine-Wastes Vol. 22, Waterloo Ontario May, 1994, Editors: J.L. Jarnbor and D.W. Blowes, pp. 201 -243.

Robertson, W.D., (1994), The Physical Hydrology of Mill-tailings Impundments, Mineralogical Association of Canada Short Course Handbook on the Environmental Geochemistry of Suüide Mine-Wastes Vol. 22, Waterloo Ontario May, 1994, Editors: J.L. Jarnbor and D. W. Blowes, pp. 1 - 17.
Rose, A. W., and Daub, G.A., (1 994), Simulated Weathering of Pyritic Shale with Added Lùnestone and Lime, International Land Reclamation and Mine Drainage Conference and Third International Conference on the Abatement of Acidic Drainage Volume 2 of 4: Mine Drainage, US Department of the Interior, Bureau of Mines Special Publication SP 068-94, p. 334-336.
Rowley, MY., Warkentin, D.D., Yan, V.T., and Puoshco, B.M., (1994), The Biosulfide Process: Integrated BiologicaVChemical Acid Mine Drainage Treaûnent - Results of Laboratory Piloting, International Land Reclamation and Mine Drainage Conference and Third international Conference on the Abatement of Acidic Drainage Volume 1 of 4: Mine Drainage, US Department of the Interior, Bureau of Mines Special Publication SP MA-94, p. 205.
Scharer, LM., Pettit, C.M., Chambers, D.B., and Kwong, E.C., (1994), Mathematical S imulation of a Waste Rock Heap, International Land Reclarnation and Mine Drainage Conference and Third International Conference on the Abatement of Acidic Drainage Volume 1 of 4: Mine Drainage, US Department of the Interior, Bureau of Mines Special Publication SP 06A-94, p. 30.
Schultze, LE., Zamzow, M.J., and Bremner, P.R., (1994), AMD Cleanup Using Natural Zeolites, International Land Reclamation and Mine Drainage Con ference and Third International Conference on the Abatement of Acidic Drainage Volume 2 of 4: Mine Drainage, US Department of the Interior, Bureau of Mines Special Publication SP 06B-94, p. 34 1.
Singer, P.C., and Stumm, W., (1968), Kinetics of the Oxidation of Ferrous Iron, Proceedings of the Second Symposium on Coal Mine Drainage Research, Bituminous Coal Research Inc., Monroebille Pennsylvania, pp. f 2-34.
Singer, P.C., and Stumm, W., (1970), Acidic Mine Drainage: The Rate Detennining Step, Science 167, pp. 1121-1 123.
Spycher, N.F., and Reed, M.H., (1 998), SOLVEQ: A Computer Program for Computing Aqueous-Mineral-Gas Equilibria, Revised Preliminary Edition, Department of Geological Sciences, University of Oregon, Eugene Oregon 97403, pp. 1-40.
S m , W., and Morgan, J.J., ( 1 98 1 ), Aquatic Chemistry, Wiley-Interscience, New York, p.780.

Tuovinen, O.H., and Kelly, D.P., (1972), Biology of Z%iobuciLIus femwxi&ns in Relation to the Microbiological Leaching of Sulfide Ores, Zeits. AlIg. Mhobiol. 12, pp. 3 1 1 - 3 6
Yanfül, E.K., Aube, B.C., Woyshner, M., and St-Arnaud, L.C., (1994), Field and laboratory Peiformance of Engineered Covers on the Waite Amulet Tailings, International Land Reclamation and Mine Drainage Conference and Third International Conference on the Abatement of Acidic Drainage Volume 2 o f 4: Mine Drainage, US Department of the Interior, Bureau of Mines Special Publication SP 068-94, p. 138.

APPENDICES
APPENDIX A
CHILLRUN files used to nui CHILLER

LIST OF FIGURES FOR APPENDIX A
Figure 1:
Figure 2:
Figure 3 :
Figure 4:
Figure 5:
Figure 6:
Figure 7:
Figure 8:
Figure 9:
Figure 10:
Figure 1 1 :
Chillm 1 .&t (Chillrun file for the reaction between 100 % pyrite and water with no atmospheric contact). ........................................... 1 10
Chillnui2.dat (Chillrun file for the reaction between 50 % pyrite + 50 % albite and water with no atmospheric contact). ................. .... 1 1 1
Chillrun3.dat (Chillnin file for the reaction between 50 % pyrite + 50 % anorrhite and water with no atmospheric contact) ................. 1 12
Chillm4.dat (Chillrun file for the reaction between 50 % pyrite + 50 % microdine and water with no atmospheric contact) .............. 1 13
Chillnui5.dat (Chillrun file for the reaction between 20 % pyrite + 80 % albite and water with no atmospheric contact). ..................... 1 14
Chillnrn6.dat (Chilhn file for the reaction between 20 % pyrite + 80 % anorthite and water with no atmospheric contact) ................. 1 15
Chillnur7.dat (Chillrun file for the reaction between 20 % pyrite + 80 % microcline and water with no atmospheric contact) .............. 1 16
Chillrun8.dat (Chillnin file for the reaction between 80 % pyrite + 20 % albite and water with no amiospheric contact). ..................... 1 17
Chillrun9.dat (Chilhn file for the reaction between 80 % pyrite + 20 % anorthite and water with no atmospheric contact) ................. 1 18
Chillrunl O.&t (Chillrun file for the reaction between 80 % pyrite + 20 % microcline and water with no atmospheric contact) .............. 1 19
Chillrunl 1-dat (Chillrun file for the reaction between 100 % pyrrhotite and water with no atmosphenc contact) ............................ 120
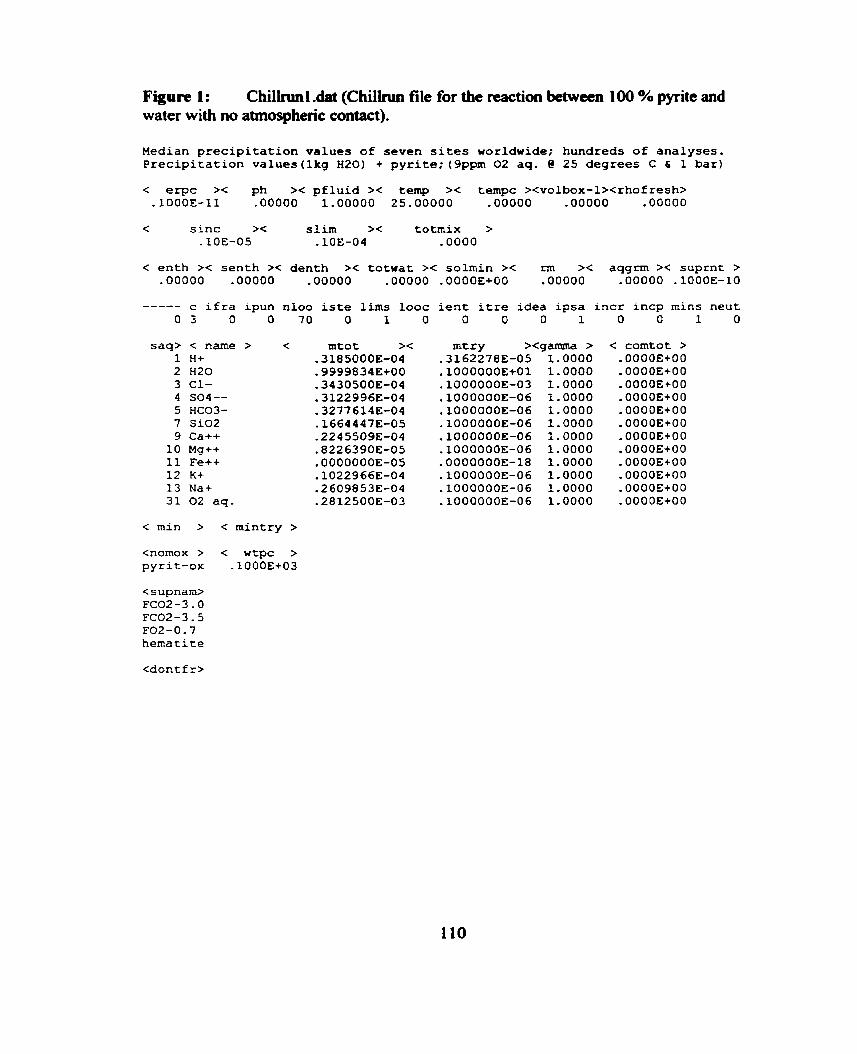
Figure 1: Chillrunl .dat (Chillnin file for the reaction between 100 % pyrite and water with no atmospheric contact).
Median p r e c i p i t a t i o n va lues of seven sites worldwide; hundreds o f ana lyses . P r e c i p i t a t i o n values(1kg H20) + pyrite;(9ppm 02 aq. @ 25 degrees C & 1 bar)
< erpc >< ph >< p f l u i d >< temp >< tempc ><volbox-l><rhofresh> . IOOOE-11 .O0000 L.00000 25.00000 .O0000 .O0000 .O0000
< s inc >< s l i m >< totmix > .10E-05 .10E-04 . O000
< enth >< senth >< denth >< totwat >< solmin >< rm >< aqgrm >< suprnt > .00000 .00000 .00000 .00000 .0000E+00 .00000 .00000 .1000E-10
----- c i f r a ipun nloo iste lims l o o c i e n t i t r e idea ipsa i n c r incp rnins neut
s a q > < n a m e > < 1 H+ 2 H20 3 C1- 4 S04-- 5 HC03- 7 S i02 9 Ca++
10 Mg++ Il Fe++ 1 2 K+ 13 N a + 31 0 2 aq.
< min > < mintry >
<nomox > < wtpc > pyrit-ox .1000E+03
mtor >< -3185000E-04 .9999834€+00 -3430500E-04 ,3122996E-04 ,3277614s-04 .16644473-05 -2245509E-04 .8226390E-05 .0000000E-05 .1022966E-04 -2609853E-04 -2812500E-03
mtry ><gamma > -3162278E-05 1.0000 .1000000E+01 1.0000 .1000000E-03 1.0000 .1000000E-06 1.0000 .1000000E-06 1.0000 -1000000E-06 1.0000 .1000000E-06 1.0000 .1000000E-06 1.0000 .0000000E-18 1.0000 .1000000E-06 1.0000 .1000000E-06 1.0000 .1000000E-06 1.0000
<supnam> FC02-3.0 FC02-3.5 FO2-O. 7 hematite

Figure 2: Chillnin2.dat (Chillm file for the reaction between 50 % pyrite + 50 % albite and water with no atmospheric contact).
Median p r e c i p i t a t i o n values of seven sites uorldwide; hundreds of a n a l y s e s . P r e c i p i t a t i o n values(1kg H20) + p y r i t e c a l b i t e , (1:1);(9ppm 02 @2SC & lbar)
< erpc >< ph >< p f l u i d >< temp >< tempc ><volbox-l><rhofresh> ,1000E-11 .ooooo 1.00000 25.00000 .O0000 .O0000 .O0000
< s i n c >< s l i m >< totmix > .10E-05 .10E-04 ,0000
< enth >< senth >< den th >< to twat >< soimin >< rm >< aqgrm >< s u p r n t > .00000 .00000 .00000 .00000 .0000E+00 .00000 ,00000 .1000E-IO
----- c i f r a ipun nloo i s te lims looc i e n t i t r e idea ipsa i n c r incp mins neu t
saq> < name > < 1 H+ 2 HZ0 3 C1- 4 S04-- 5 HC03- 7 Si02 8 Al+++ 9 Ca++ 10 Mg++ 11 Fe++ 12 K+ 13 Na+ 31 05 aq.
< m i n > < mintry >
<nomox > < wtpc > pyrit-ox .5000E+02 a l b i t e .5000E+02
m t o t >< mtry >c .3185000E-04 ,3162278E-05 .9999834E+00 .1000000E+01 -3430500E-04 .lOOOOOOE-03 -3122996E-04 .1000000E-06 -3277614E-04 .1000000E-06 -1664447E-05 .IOOOOOOE-06 .0000000E-05 . 1000OOOE-12 -2245509E-04 .1000000E-06 -8226390E-05 .1000000E-06 .0000000E-OS .0000000E-18 -1022966E-04 .1000000E-06 -2609853E-04 .IOOOOOOE-06 .2812500E-03 .lOOOOOOE-06
<supnam> FC02 -3. O FC02-3.5 F02-O. 7 hematite

Figure 3: ChilIrun3 .dat (Chililun file for the reaction between 50 YO pyrite + 50 % anorthite and water with no atmospheric contact). Median p r e c i p i t a t i o n values o f seven sites worldwide; hundreds of a n a l y s e s .
P r e c i p i t a t i o n v a l u e s ( l k g HSO) + p y r i t e s a n o r t h i t e , (1: 1) ; (9ppm 02 @2SC 6 lbar)
< erpc >< ph >< p f l u i d >< temp >< ternpc ><volbox-l><rhofresh> -1000E-11 .O0000 1.00000 25.00000 .O0000 .O0000 .O0000
c s i n c >c slim >< totmix > .10E-05 .10E-04 . O000
< e n t h >< senth >C d e n t h >< t o t w a t >< solmin >< rm >C aqgrm >< s u p r n t > .O0000 .00000 .00000 .00000 .0000E+00 .00000 .00000 -1000E-10
----- c i f r a ipun nloo iste lims l o o c ient i t r e i d e a i p s a i n c r i n c p mins n e u t O 3 O O 70 O 1 O O O O 1 O O 1 O
< min > < mint ry > <nomox > < wtpc > pyr i t -ox .5000E+02 a n o r t h i t .5000E+02
csupnam> FC02-3.0 fC02-3.5 f02-0.7 hernati te l awson i t a n d r a d i t grossula pumpelly p r e h n i t e c l i n o z o i epid-ord vesuvian z o i s i t e w o l l a s t o woll-psd t i l l e y i t epido-Fe ran k i n i t d i o p s ide hedenber s p u r r i t e p o r t l a n d l a r n i t e g e h l e n i t merwinit
mtot >< mtry ><gamma > .3185000E-04 -3162278E-05 1.0000 .9999834E+00 .1000000E+01 1.0000 .3430500E-04 .1000000E-03 1.0000 .3122996E-04 .1000000E-06 1.0000 ,3277614B-04 .1000000E-06 1 .O000 .1664447E-05 .1000000E-06 1.0000 .0000000E-05 .1000000E-12 1.0000 .2245509E-04 .1000000E-06 1.0000 -8226390E-05 ,1000000E-06 1.0000 .0000000E-05 .0000000E-18 1.0000 -1022966E-04 .1OOOOOOE-06 1.0000 .2609853E-04 .1000000E-06 1.0000 .2812500E-03 .lOOOOOOE-06 1.0000
< comtot > .0000E+00 .0000E+00 .0000E+00 .0000E+00 .0000E+00 .0000E+00 .0000€+00 *0000E+00 .0000E+00 .0000E+00 .0000E+00 .0000E+00 .0000E+00

Figum 4: Chi lh4 .dat (Chillm file for the rcaction between 50 % pyrite + 50 % microcline and water with no atmosphcric contact).
Median precipitation values of seven sites worldwide; hundreds of analyses. Precipitation values (lkg HZO) + pyriteCK-feldspar, (1: 1) ; (9ppm 02 @25C & lbar)
< erpc >< ph >< pfluid >< temp >< tempc ><volbox-l><rhofresh> -1000E-11 .O0000 1.00000 25.00000 .O0000 .O0000 .00000
< enth >< senth >< denth >< totwat >< solmin >c rm >< aqgrm >< suprnt > .00000 .00000 .00000 .00000 .0000E+00 .00000 .00000 -1000E-10
----- c ifra ipun nloo iste lims looc O 3 O O 70 O I O
saq> < name 1 H+ 2 H20 3 C1- 4 S04-- 5 HC03- 7 Si02 8 Al+++ 9 Ca++ 10 Mg++ 11 Fe++ 12 K+ 13 Na+ 31 02 aq.
> c mtot >< .318SOOOE-04 .9999834E+00 -3430500E-04 -3122996E-04 ,3277614E-04 -1664447L-O5 .0000000E-05 -2245509E-04 -8226390E-05 .0000000E-05 -1022966E-04 -2609853E-04 -2812500E-03
< min > < mintry >
<nomox > < wtpc > pyrit-ox .5000E+02 nicrocli . SOOOE+OZ
ient itre idea ipsa incr incp mins neut O O O 1 O O I O
mtry ><gamma > .3162278E-05 1.0000 .1000000E+01 1.0000 .1000000E-03 1,0000 .1000000E-06 1.0000 .1000000E-06 1.0000 ,1000000E-06 1.0000 .1000000E-12 1.0000 .1000000E-06 1.0000 .100G000E-06 1.0000 .0000000E-18 1.0000 .1000000E-06 1.0000 .1000000E-06 1.0000 .1000000E-06 1.0000
< comtot > .0000E+00 .0000E+00 .0000E+00 .0000E+00 .0000E+00 .0000E+00 - 0000E+00 .0000E+00 .0000E+00 .0000E+00 .0000E+00 .0000E+00 .0000E+00
<supnam> FC02-3.0 FC02-3.5 F02-0.7 hematite celad-Fe

Figure 5: Chilirun5.dat (Chillrun file for the reaction bctween 20 % pyrite + 80 % aibite and water with no atmospheric contact).
Median precipitation values of seven sites worldwide; hundreds of analyses. Precipitation values(1kg H20) + pyritecalbite,(l:4);(9ppm 02 @25C 6 lbar)
< erpc >< ph >< pfluid >< temp >< tempc ><volbox-l><rhofresh> -1000E-11 .O0000 1.00000 25.00000 .O0000 - O0000 .O0000
< s i n c >< slim >< totmix > . IOE-05 -10E-04 . O000
< enth >< senth >< denth >< totwat >< soimin >< rm >< aqgrm >< suprnt >
----- c i f ra ipun nloo iste lims looc O 3 O O 70 O 1 O
saq> < name > 1 H+ 2 HZ0 3 C1- 4 S04-- 5 HC03- 7 Si02 8 Al+++ 9 Ca++ 10 Mg++ 11 Fe++ 12 K+ 13 Na+ 31 02 aq.
c mtot >< .3185000E-04 .9999834&+00 -3430500E-04 -3122996E-04 -3277614E-04 ,1664447E-05 .0000000E-05 -2245509E-04 ,822639OE-O5 .0000000E-05 -1022966E-04 -2609853E-04 -2812500E-03
< min > < mintry >
<nomox > < wtpc > pyrit-ox .2000E+02 albite .8000E+02
.0000E+00 .00000 .00000 .1000E-10
ient itre idea ipsa incr incp mins neut
mtry ><gamma > .3162278E-05 1.0000 .1000000E+01 1.0000 .1000000E-03 1.0000 .1000000E-06 1.0000 .1000000&-06 1.0000 .1000000E-06 1.0000 .1000000E-12 1.0000 .1000000E-06 1.0000 ,1000000E-06 1.0000 .0000000E-18 1.0000 .1000000E-06 1.0000 .1000000E-06 1.0000 .1000000E-06 1.0000
O O 1 O
< corntot > .0000E+00 .0000E+00 .0000E+00 .0000E+00 .0000E+00 .0000E+00 .0000E+00 .0000E+00 .0000E+00 .0000E+00 .0000E+00 .0000E+00 .0000E+00
<supnam> FC02-3. O FC02-3.5 F02-0.7 hematite staur-Mg

Figure 6: Chilirun6.d.t (Chillrun file for the M a i o n between 20 % pyrite + 80 % anorthite and water with no atmospheric contact). Hedian precipitation values of seven sites worldwide; hundreds of analyses. Precipitation values(1kg H20) + pyriteCanorthite, (1:4);(9ppm 02 @25C 6 lbar) < erpc >< ph >< pfluid >< temp >< tempc ><volbox-l><rhofresh> -1000E-11 .ooooo ~.ooooo 25.00000 .ooooo .O0000 .00000
< sinc >< slim >< totmix > .10E-05 -10E-04 .O000
< enth >< senth >< denth >< totwat >c solmin >< rm >< aqgrm >< suprnt >
----- c ifra ipun nloo iste lims looc O 3 O O 70 O I O
soq> < narne > < 1 H+ 2 H20 3 Cl- 4 S04-- 5 HC03- 7 Si02 8 al+++ 9 Ca++ 10 Mg++ 11 Fe++ 12 K+ 13 Na+ 31 02 aq.
< min > < mintry > <nomox > < w t p c > pyrit-ox .2000E+02 anorthit .8000E+02
<supriano FCO2-3.0 FCO2-3.5 FOS-0.7 hernatite lawsonit andradit grossula pumpelly prehnite clinozoi epid-ord vesuvian toisite wollasto woll-psd tilleyit epido-Fe rankinit diopside hedenber spurrite portland larnite gehlenit merwinit staur-Mg
mtot >< -3185000E-04 -9999834E+OO .343OSOOE-O4 -3122996E-04 -3277614E-04 -1664447E-05 ~0000000E-O5 -22455093-04 ,8226390E-OS .0000000E-05 -1022966E-04 .2609853E-04 -2812500E-03
.0000E+00 .00000 .00000 .1000E-10
ient itre idea ipsa incr incp mins neut O O O 1 O O 1 O
mt ry ><gamma > < comtot > -3162278E-OS 1.0000 .0000E+00 .1000000E+01 1.0000 .0000E+00 .1000000E-03 1.0000 .0000E+00 .1000000E-06 1.0000 .0000E+00 ,1000000E-06 1.0000 .0000E+00 .1000000E-06 1.0000 .0000E+00 .IOOOOOOE-12 1.0000 .0000E+00 .1000000E-06 1.0000 .0000E+00 .1000000E-06 1.0000 .0000&+00 .0000000E-18 1.0000 .0000&+00 .1000000E-06 1.0000 .0000E+00 .1000000E-06 1.0000 .0000E+00 .1000000E-06 1.0000 .0000E+00

Figure 7: Chillrun7.dat (Chillrun file for the reaction between 20 % pyrite + 80 % microche and water with no atmospheric contact).
Hedian p r e c i p i t a t i o n v a l u e s o f s even sites worldwide; hundreds o f a n a l y s e s . P r e c i p i t a t i o n v a l u e s ( l k g H20) + pyr i t e6K- fe ldspa r , (1: 4 ) ; (9ppm 02 @25C 6 l b a r )
< erpc >< ph >< p f l u i d >< t e m p >< tempc ><volbox- l><rhofresh> -1000E-11 .O0000 1.00000 25.00000 .O0000 .O0000 .O0000
< s i n e >< s l i m >< t o t m i x > .10E-05 .10E-04 . 0000
C e n t h >< s e n t h >< d e n t h >< t o t w a t >< solrnin > c rm >< aqgrm >< s u p r n t > .00000 .00000 .00000 .00000 .0000E+00 .00000 .00000 .1000E-10
----- c i f r a ipun n l o o i s t e l i m s l o o c O 3 O O 70 O 1 O
saq> < name 1 CI+ 2 H2O 3 C1- 4 S04-- 5 HC03- 7 Si02 8 Al+++ 9 Ca++
10 Mg++ I I Fe++ 12 K+ 13 Na+ 31 02 aq.
> < mto t >< -3185000E-04 .9999834€+00 -3430500E-04 -3122996E-04 -3277614E-04 -1664447E-05 .0000000E-OS -2245509E-04 -8226390E-05 .0000000E-OS -1022966E-04 -2609853E-04 .2812500E-03
< min > < minrry >
<nomox > < wtpc > p y r i t - o x .2000E+02 m i c r o c l i .8000E+02
i e n t i t re i d e a i p s a i n c r i n c p mins n e u t O O O I O O I O
mtry >< -3162278E-05 .1000000E+01 .1000000E-03 .1000000E-06 .1000000E-06 .1000000E-06 .1000000E-12 .1000000E-06 .1000000E-06 .0000000E-18 .1000000E-06 .1000000E-06 .1000000E-06
< corntot > .0000E+00 .0000E+00 .0000E+00 .0000E+00 .0000E+00 .0000E+00 .0000E+00 - 0000E+00 .0000E+00 .0000E+00 .0000E+00 .0000E+00 .0000E+00
<supnam> FCO2-3. O FC02-3.5 F02-O. 7 hematite celad-Fe staur-Mg

Figure 8: Chillnin8.dat (Chillnin file for the d o n between 80 % pyrite + 20 % albite and water with no amiospheric contact).
Median p r e c i p i t a t i o n va lues o f seven sites worldwide; hundrecis of a n a l y s e s . P r e c i p i t a t i o n values (lkg H20) + p y r i t e l a l b i t e , (4 : 1) ; (9ppm 02 e25C 6 lbar)
< erpc >< ph >< pf lu id >< temp >< tempc ><volbox-l>Crhofresh> .1000E-11 -00000 1.00000 25.00000 .O0000 .00000 .00000
< s i n c >< s l i m >< totmix > .1OE-05 .10E-04 .O000
< enth >< senth >< denth >< t o t w a t >< solmin >< rm >< aqgrm >< suprnt > .00000 .00000 .00000 .00000 .0000E+00 .00000 .00000 .lOOOE-10
----- c ifra ipun nloo iste lims looc i e n t i tre idea ipsa incr incp mins neut O 3 O O 70 O 1 O O O O 1 O O 1 O
saq> < name > < 1 H+ 2 H20 3 Cl- 4 S04-- 5 HC03- 7 Si02 8 Al+++ 9 Ca++ 10 Mg++ Il Fe++ 12 K+ 13 Na+ 31 02 aq.
< m i n > < rnintry >
<nomox > < wtpc > pyrit-ox .8000E+02 a l b i t e - 2000E+02
mto t >< mtry ><gairima > -3185000E-04 .3162278E-05 1.0000 .9999834E+OO .1000000E+Ol 1.0000 .3430500E-04 .1000000E-03 1.0000 .3122996E-04 .1000000E-06 1.0000 -3277614E-04 .1000000E-06 1.0000 -1664447E-05 .1000000E-06 1.0000 .0000000E-05 .1000000E-12 1.0000 -2245509E-04 .1000OOOE-06 1.0000 .8226390E-05 .1000000E-06 1.0000 .0000000E-05 .0000000E-18 1.0000 .1022966E-04 .1000000E-06 1.0000 ,2609853E-04 .1000000E-06 1.0000 -2812500E-03 .1000000E-06 1.0000
< comtot > .0000E+00 .0000E+00 .0000E+00 .0000E+00 .0000E+00 .0000E+00 .0000E+00 .0000€+00 .0000E+00 .0000E+00 .0000E+00 .0000E+00 .0000E+00
<supnarn> FC02-3.0 FC02-3.5 F02-O. 7 hematite

Figure 9: Chilh9.dat (Chillm file for the reaction between 80 % pyrite + 20 % anorthite and water with no atmosphcric contact). Median p r e c i p i t a t i o n values of seven sites worldwide; hundreds o f ana lyses . P r e c i p i t a t i o n v a l u e s ( l k g H20) + p y r i t e i a n o r t h i t e , (4 : 1) ; (9ppm 02 @ 2 5 C & Iba r )
< erpc >< ph >< pf lu id >< temp >< tempc X v o l b o x - l > < r h o f r e s h > -1000E-11 .O0000 1.00000 25.00000 .O0000 .O0000 .O0000
< s i n c >< s l im >< totmix > .10E-OS .10E-04 . O000
< enth >< sen th >< denth >< t o twa t >< solmin >< rm >< aqgrm >< sup rn t > .00000 .00000 .00000 .00000 .0000E+00 .00000 .00000 - 1000E-10
----- c i f r a ipun nloo i s te i i m s looc ient i t r e idea i p s a i n c r i ncp mins neut
saq> < name > < 1 H+ 2 H20 3 C l - 4 S04-- 5 HC03- 7 Si02 8 Al+++ 9 Ca++
1 0 Mg++ 11 Fe++ 12 K+ 13 Na+ 31 02 aq.
C min > < mintry >
<nomox > < wtpc > pyri t -ox .8000E+02 a n o r t h i t .2000E+02
<supnam> FC02-3.0 FC02-3.5 F02-O. 7 hemotite lawsoni t andradi t grossu la pumpelly prehni re c l i nozo i epid-ord vesuvian z o i s i t e wol las to woll-psd t i l l e y i t epido-Fe r a n k i n i t d iopside hedenber s p u r r i te por t land l a r n i t e geh l en i t merwinit
<dont fr>
mtot >< .3185000E-04 .9999834E+OO ,3430500E-04 -3122996E-04 -3277614E-04 -1664447E-05 .0000000E-05 .2245509E-04 .8226390E-05 .0000000E-05 -1022966E-04 -2609853E-04 .2812500E-03
O O 1 O
< comtot > .0000E+00 .0000E+00 .0000E+OO .0000E+00 .0000E+00 .0000E+00 * 0000€+00 .0000E+00 .0000E+00 .0000E+00 * 0000E+00 .0000E+00 .0000E+00

Figure 10: ChillnmlO.dat (Chillm fik for the reaction bawcen 80 % pyrite + 20 % microcline and watcr with no atmosphcric contact).
Median precipitation values of seven sites worldwide; hundreds of analyses. Precipitation values(1kg H20) + pyritecl(-feldspar, (4:1);(9ppm 02 e25C & lbar)
< erpc >< ph >< pfluid >< temp >< tempc ><volbox-l><rhofresh> -1000E-11 .O0000 1.00000 25.00000 .O0000 .O0000 .O0000
< s inc >< slim >< totmix > -10E-05 .10E-04 .O000
----- c ifra ipun nloo iste lims looc O 3 O O 70 O 1 O
c name H+ HZ0 C1- S04-- HC03- Si02 Al+++ Ca++ Mg++ Fe++ K+ Na+ 02 aq.
> < mtot >< .3185000€-04 .9999834E+OO -3430500E-04 .3122996E-04 .3277614E-04 -1664447E-05 .0000000E-05 -2245509E-04 -8226390E-05 .00000GOE-05 -1022966E-04 -26098533-04 -2812500E-03
<nomox > < wtpc > pyrit-ox .8000E+02 microcli .2000E+02
.0000E+00 .O0000 -00000 -1000E-IO
ient itre idea ipsa incr incp rnins neut
mtry xgarmna > .3162278E-O5 1.0000 .1000000Et01 1.0000 .1000000E-03 1.0000 .1000000E-06 1.0000 .1000000E-06 1.0000 .1000000E-06 1.0000 .1000000E-12 1.0000 .1000000&-06 1.0000 .1000000E-06 1.0000 .0000000E-18 1.0000 .1000000E-06 1.0000 .1000000E-06 1.0000 .1000000E-06 1.0000
Cs upnam> FC02-3.0 FC02-3.5 F02-0.7 hematite celad-Fe

Figure 1 1 : Chillm 1 1 .dat (Chillrun file for the reaction between 1 00 % -0th and water with no atmospheric contact).
Median p r e c i p i t a t i o n va lues o f seven sites worldwide; hundreds of analyses. P r e c i p i t a t i o n values(1kg H20) + pyrrhotite;(9ppm 02aq- @25 degreesc 6 1 bar)
c erpc >< ph >< p f l u i d >< temp >< tempc ><volbox-l><rhofresh> . IOOOE-11 .O0000 1.00000 25.00000 -00000 .O0000 .O0000
< s i n c >< s l i m >< totmix > .10E-05 .10E-04 .O000
< enth >< senth >< denth >< totwat >< solmin >< nn >< aqgm >< suprnt > .00000 *00000 .00000 .00000 .0000E+00 .00000 ,00000 .1000E-10
----- c i f r a ipun nloo iste lims l o o c i e n t i t r e idea ipsa i n c r incp mins neut O 3 O O 70 O 1 O O O O 1 O O 1 O
< nme > H+ H20 C1- S04-- HC03- S i 0 2 Ca++ Mg++ Fe++ K+ Na+ 02 aq.
< mtot >< r n t ry ><gamma > .3185000E-04 -3162278E-05 1.0000 .9999834E+00 .1000000E+01 1.0000 .3430500E-04 .1000000E-03 1.0000 -3122996E-04 .1000000E-06 1.0000 -3277614E-04 .1000000E-06 1.0000 .1664447E-05 .1000000E-06 1.0000 -2245509E-O4 .1000000E-06 1.0000 -8226390E-05 .1000000E-06 1.0000 .0000000E-05 .0000000E-18 1.0000 -1022966E-04 .1000000E-06 1.0000 .2609853E-04 .1000000E-G6 1.0000 -2812500E-03 .1000000E-06 1.0000
c min > < mintry >
<nomox > < wtpc > pyrrhot i . lOOOE+O3 csupnam> FC02-3 .O FCOS-3.5 F02-O. 7 hematite c l c l - A l f a n t i g o r i

APPENDIX B SiNC and SLIM values for the CHILLRUN files in Appendix A
(Included are the hcrement (SïNC) and comsponding pH values sampled)
LIST OF FIGURES FOR APPENDIX B
Figure 1 :
Figure 2:
Figure 3:
Figure 4:
Figure 5:
Figure 6:
Figure 7:
Figure 8:
Figure 9:
Figure 10:
Figure 1 1 :
SINC and SLIM values for Chillnuil.dat (Reaction between 100 % pyrite and water with no atrnospheric contact). ............................. 123
SINC and SLIM values for Chilirun2-dat (Reaction between 50 % pyrite + 50 % albite and water with no atmospheric contact). ...... 124
SINC and SLIM values for Chillnin3.dat (Reaction between 50 % pyrite + 50 % anorthite and water with no atmospheric contact). . . . . . . . . .. .. . . . . . . ... . . . . . . . . . . . . . . . . . . . . . . . . . . . . . . . . . . . . . . . . . . . . . . . . . . . . . . . . . . . . . - . . . . 1 25
SMC and SLIM values for Chillrun4-dat (Reaction between 50 % pyrite + 50 % microcline and water with no atmospheric contact). .......... ........ ..... . . . .. .. . .. ..................-. . . . . . . . . . . 1 26
SINC and SLIM values for ChillninS-dat (Reaction between 20 % pyrite + 80 % albite and water with no atmospheric contact). ...... 127
SINC and SLIM values for Chillrun6.dat (Reaction between 20 % pyrite + 80 % anorthite and water with no atmospheric contact). ..............................................-...--.......-..............-......-........... 128
SINC and SLIM values for Chillrun7.dat (Reaction between 20 % pyrite + 80 % microcline and water with no atrnospheric contact). ...................... .. ........... ..... ..................................................... 129
SINC and SLIM values for Chillnin8.dat (Reaction between 80 % pyrite + 20 % albite and water with no atmospheric contact). ...... 1 30
SiNC and SLIM values for Chi lh9.dat (Reaction between 80 % pyrite + 20 % anorthite and water with no atmospheric contact). ......................................... ........................................ 1 3 1
SINC and SLIM values for ChillrunlO.dat (Reaction between 80 % pyrite + 20 % microcline and water with no atmospheric contact). ........................................................................................ 132
SiNC and SLIM values for Chillrunll.dat (Reaction between 100 % pyrrhotite and water with no atmospheric contact). ............... 133

Figure 1: SINC and SLIM values for Chillrunl .&t ( R d o n between LOO ./O pyrite and water with no atmospheric contact).
SINC O.IXIO-~ 0.1~10~ 0.1~10-~ 0.1~10" 0.1x10-' O. 1 1 .O 10 1 O0 Io00

Figure 2: S M C and SLIM values for Chillnin2.dat (Reaction between 50 % pyrite + 50 % albite and water with no atmospheric contact).
SLIM 0.1~10~ 0.1~10-~ 0.1x10-~ 0.1~10-' 0.22 1 .O IO 100 I o 0 0 IOOOO

Figu n 3: SMC and SLIM values for Chillrun3 .dat (Reaction ôetwecn 50 % pyrite + 50 % anorthite and water with no atmosphcric contact).
SLIM 0 . 1 ~ 1 0 ~ 0.1~10-~ 0.1x10-~ 0.1~10" o. 1 0.22 1 .O 10 100 Io00 lm

Figure 4: SMC and SLIM values for Chillrun4.dat (Reaction between 50 % pyrite + 50 % microcline and water with no amiosphcric contact).
SLIM 0 . 1 ~ 1 0 ~ 0.1~10-~ O. 1 x 10'~ 0.1x10-' 0.2 1 .O 10 100 Io00 1OOOO
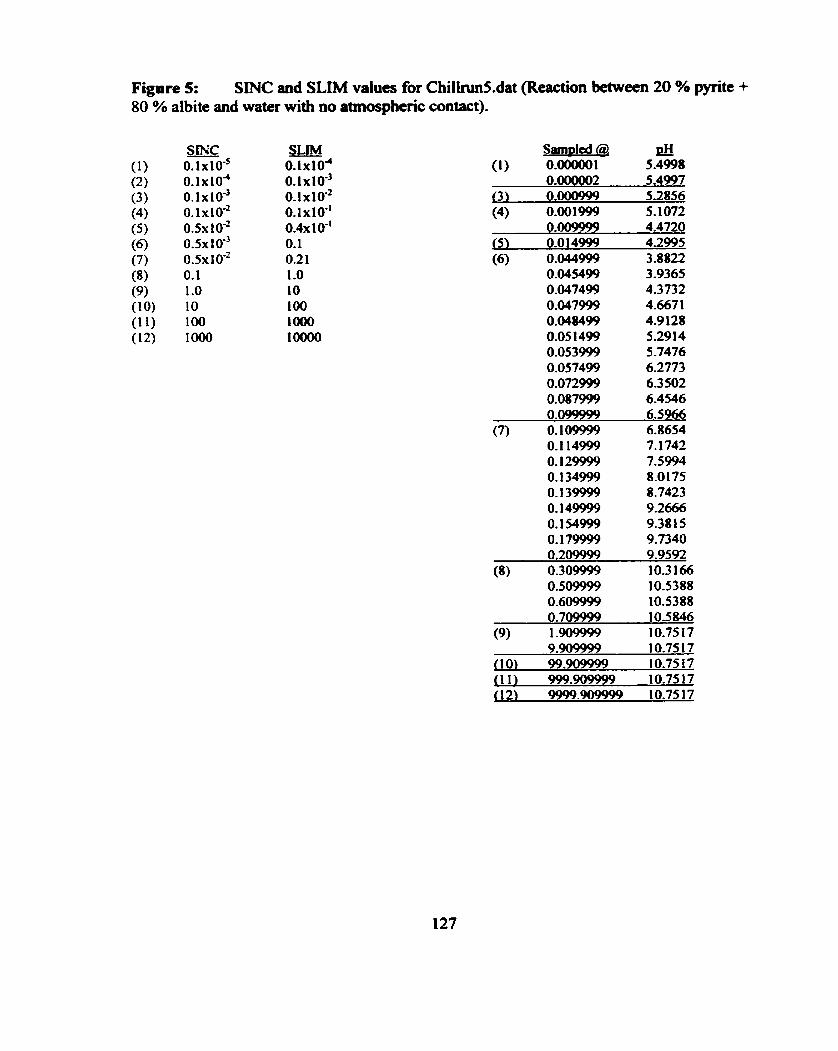
Figure 5: SINC and SLM values for ChilhS.dat (Reaction between 20 % pyrite + 80 % albite and water with no atmosphcric contact).
SLIM - 0 . 1 ~ 1 0 ~ 0.1~10'~ 0 .1~10 '~ 0.1~10" 0.4x 1 O" O. 1 021 1 .O 10 100 1000 IOOOO
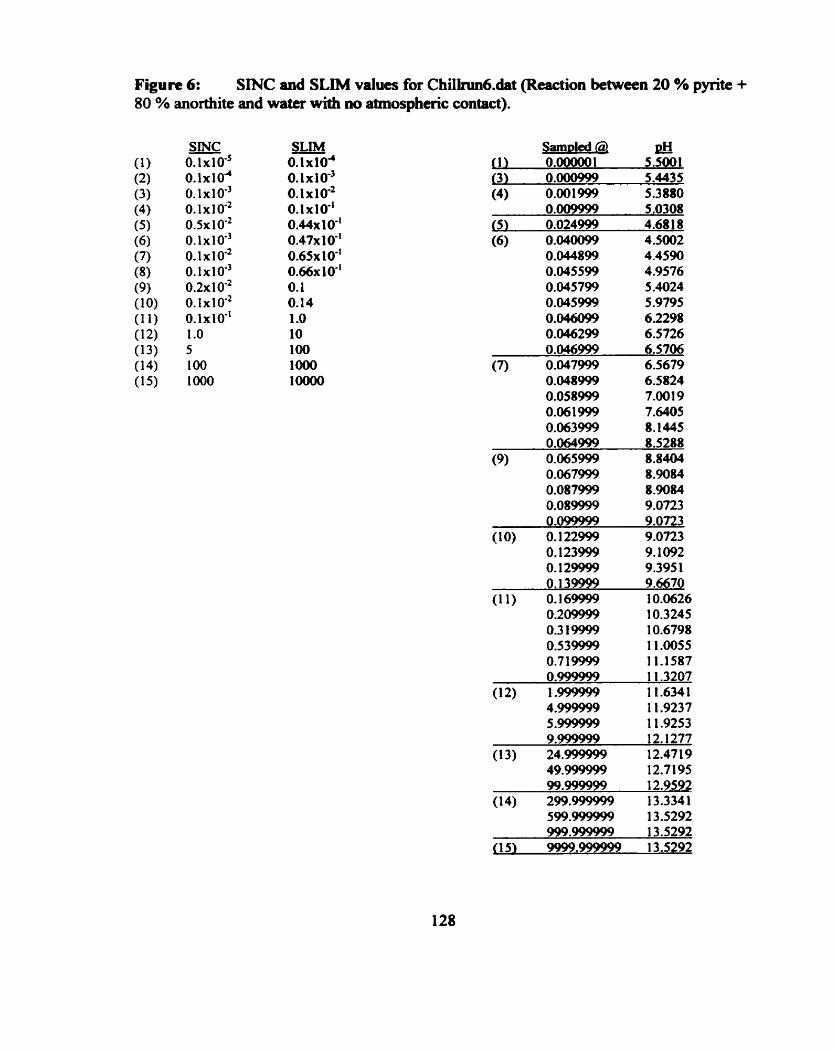
Figure 6: SNC and SLIM values for Chillnui6.dat (Reaction between 20 % pyrite + 80 96 anorthite and water widi no atmosphcric contact).
SLIM - 0.1~10' O.IXIO-~ 0.1x10-~ 0.1~10" 0.44~ 1 0" 0.47~ 1 0" 0 .65~ 10'' 0.66~ 1 0" 0.1 0.14 1 .O 10 100 Io00 1OOOO

Figure 7: SINC and SLIM values for Chillrun7.&t ( R d o n between 20 % pyrite + 80 % microdine and water with no atrnospheric contact).
SINC 0.1~10-~ 0 . 1 ~ 1 0 ~ 0 .1~10-~ 0.1x10-~ OSX 1 O" 0.1x10-~ 0.1 1 .O 10 1 00 Io00
SLIM - 0 . 1 ~ 1 0 ~ 0.1~10-~ 0.1x10-~ 0.1~10" 0.1 0.2 1 1 .O 10 100 1000 1 m

Figure 8: SINC and SLiM values for Chillnui8.dat (Reaction betwecn 80 % pyrite + 20 % albite and water with no atmospheric contact).

Figure 9: SiNC and SLIM values for Chilh9.dat (Reaction between 80 % pyrite + 20 % anorthite and water with no atmosphcric contact).
SLIM - 0 . 1 ~ 1 0 ~ o. 1x10~~ 0.1x10-~ 0.1x10-' 0.14~10-' o. 1 0.25 1 .O 1 O 100 Io00 1OOOO

Figure 10: SMC and SLIM vaiues for ChilirunlO.dat (Reaction between 80 YO pyrite + 20 % microdine and water with no atmospheric contact).
SLIM 0 . 1 ~ 1 0 ~ 0.1~10-~ 0.1x10-~ O. 1x10" 0.1 0.25 1 .O 10 100 lm Loo00

Figure 1 1 : SINC and SLIM values for Chilirun l 1 .dat (Reaction between 100 % pyrrhotite and water with no atmospheric contact).
SINC 0.lxl0'~ 0.1~10~ 0.1~10" 0.1~10'~ 0.1x10-~ 0.1~10-~ 0.1~10~ O. 1 1 .O 10 100 Io00 10

APPENDIX C 1 :4 and 4: 1 (Pynte:Feldspar (Ab, An and Mc)) Graphs

LIST OF FIGURES FOR APPENDIX C
Figure 1: Reaction of 20 % pyrite and 80 ./O albite .......................................... 136
Figure 2: Reaction of 20 YO pyrite and 80 % anorthite ...................................... 138
Figure 3 : Reaction of 20 % pyrite and 80 % microdine ................................... 140
Figure 4: Reaction of 80 96 pyrite and 20 % albite .......................................... 142
Figure 5: Reactioa of 80 % pyrite and 20 ./o anorthite ...................................... 144
Figure 6: Reaction of 80 96 pyrite and 20 % microcline ................................... 146

Figure 1. Reaction of 20 % pyrite and 80 % albite (Appendix A, Figure 5) with water (Table 2) at 25 OC and no atmospheric contact. Mineral abbreviations can be found in the 'List of Abbreviations'. (A) Minerals formed in log moles. (B) pH and log total aqueous molality of the principal component species (Le. ZAI)' represents the total of al1 aqueous Al species). (C) Selected individual aqueous species in log molality (not log total aqueous molality). (D) Shows graph (C) in its' entirety. pH can be read directly fiom the Log total aq molality and Log molality axes o f B and C respectively.
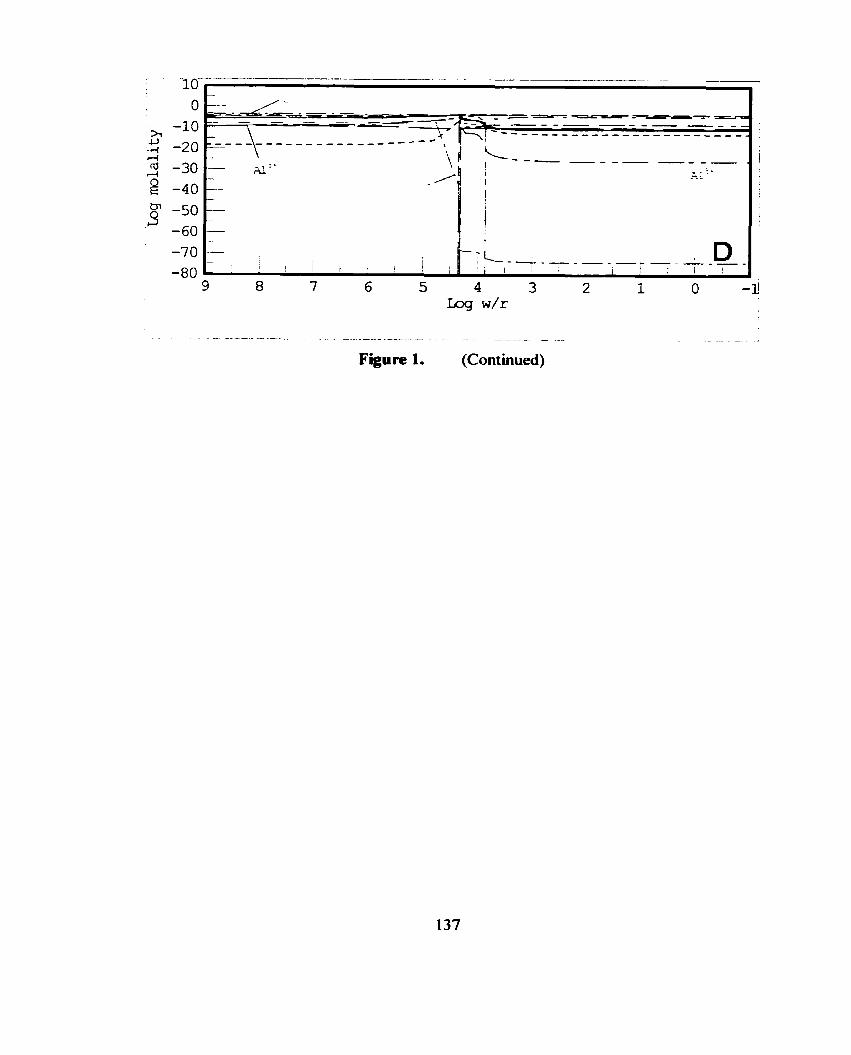
.-
-30 -- a:. -
-40 -
-- - .---u -.
Figure

Figure 2. Reaction of 20 % pyrite and 80 % anorthite (Appendix A, Figure 6) with water (Table 2) at 25 OC and no atmospheric contact. Mineral abbreviations can be found in the 'List of Abbreviations'. (A) Minerais formed in log moles. (B) pH and log total aqueous molality of the principal component species (i.e. ZAI~' represents the total o f al1 aqueous Al species). (C) Selected individual aqueous species in log molality (not log total aqueous molality). (D) Shows graph (C) in its' entirety. pH can be read directly fiom the Log total aq molality and Log molality axes of B and C respectively.

-. -- - - - -- - -
Finure 2. (Continued)

Figure 3. Reaction of 20 % pyrite and 80 % microcline (Appendix A, Figure 7) with water (Table 2) at 25 OC and no aûnospheric contact. Mineral abbreviations c m be found in the 'List of Abbreviations'. (A) Minerals formed in log moles. (B) FH and log total aqueous molality of the principal component species (i.e. ZAP' represents the total of al1 aqueous Al species). (C) Selected individual aqueous species in log molality (not log total aqueous molality). (D) Shows graph (C) in its' entirety. pH c m be read directly from the Log total aq molality and Log molality axes of B and C respectively.


Figure 4. Reaction of 80 % pyrite and 20 % albite (Appendix A, Figure 8) with water (Table 2) at 25 O C and no amosphenc contact. Mineral abbreviations can be found in the 'List of Abbreviations'. (A) Minerals formed in log moles. (B) pH and log total aqueous molality of the principal component species (i.e. LA?+ represents the total of al1 aqueous Al species). (C) Selected individual aqueous species in log molality (not log total aqueous molality). (D) Shows graph (C) in its' entirety. pH cm be read directly fiorn the Log total aq molality and Log molality axes of B and C respectively.
142

Figure 4. (Continued)

- - -- - -
Figure 5. Reaction of 80 % pyrite and 20 % anorthite (Appendix A, Figure 9) with water (Table 2) at 25 O C and no atrnospheric contact. Mineral abbreviations can be found in the 'List of Abbreviations'. (A) Minerals fonned in log moles. (B) pH and log total aqueous molality of the principal component species (i.e. ZAI" represents the total of al1 aqueous Al species). (C) Selected individual aqueous species in log molality (not log total aqueous molality). (D) Shows graph (C) in its' entirety. pH can be read directly fkom the Log total aq molality and Log molality axes of B and C respectively.
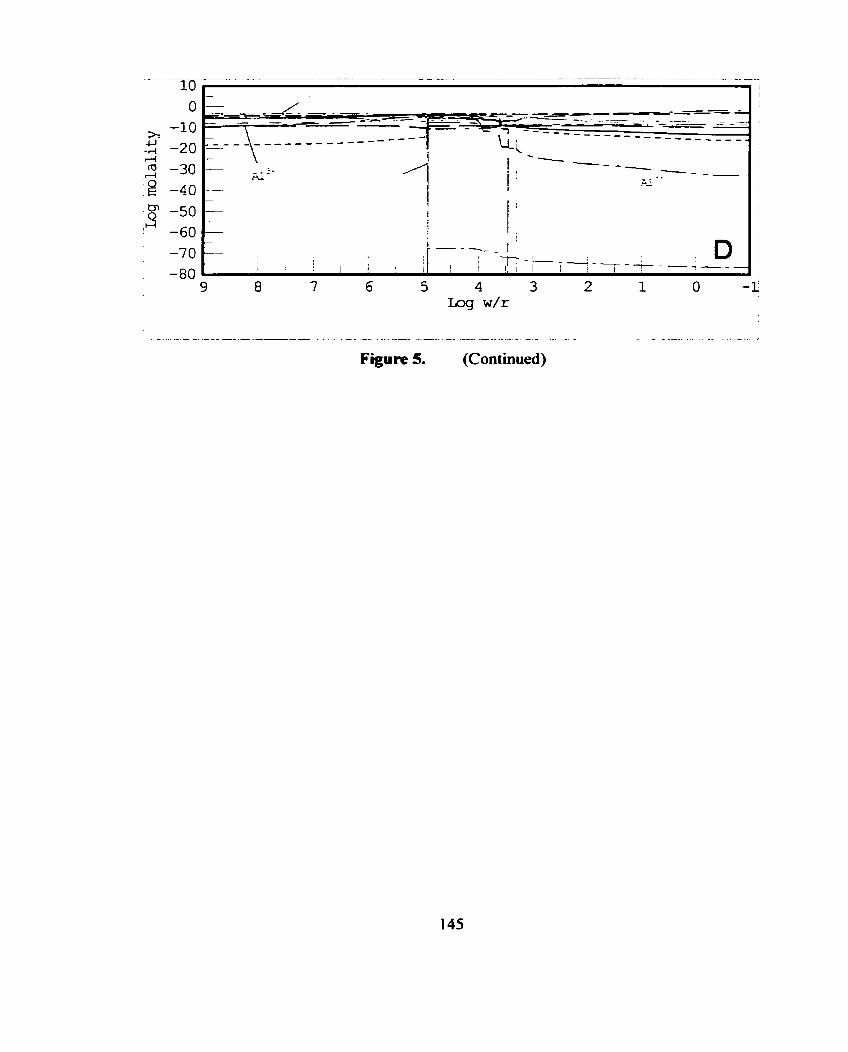

5 4 3 Log w/r
Figure 6. Reaction of 80 % pyrite and 20 % microdine (Appendix A, Figure 10) with water (Table 2) at 25 OC and no atmospheric contact. Mineral abbreviations c m be found in the 'List of Abbreviations'. (A) Minerals formed in log moles. (B) pH and log total aqueous molality of the principal component species (i.e. Z A ~ ~ ' represents the total of al1 aqueous Al species). (C) Selected individuai aqueous species in log molality (not log total aqueous molality). (D) Shows graph (C) in its' entirety. pH can be read directly from the Log total aq molality and Log molality axes of B and C respectively.

- - - - - - - - -- - - -- - - --y - - - -- - - - .- -. - - -- -- - - - .- - - - -. - - -- - - - - -
Figure 6. (Conthued)
APPENDIX D Key Components of SOLRUN

Key Components of SOLRUN
The key components of SOLRUN that best defme how SOLVEQ was used for
this study are highlighted (SOLD CAPS) in Figure 1 . This sample SOLRUN file is
followed by brief descriptions of the key components (Spycher and Reed, 1998). Al1
other components are either non-essential default values or they are not applicable to
these reactions.
Rainwater ( l k g ) with 9ppm 0 2 ; pH = 5.5 Data from Freeze and Cherry, 1979.
< eprc >< PH >< unac ><alkaln><TEMPC >< mi ><pr - min> .100E-11.550E+01,000E+OO.OOOE+00,25OE+O2,OOE+OO
ctem nmtt ipri ichb NIXX) C nsun igeo itre neut O O O O 1 40 3 O O O O
SAQ> < NAME 1 H+ 2 H2O 3 C1- 4 S04-- 5 HC03- 7 Si02 9 Ca++
f O Mg++ 12 K+ 13 Na+ 31 02 aq.
> < MTOT >< MTRY >< gamma > .0000000E+00 -3162278E-05 1,0000 .99998343+00 ,1000000E+01 1.0000 ,1128254E-04 .1000000E-03 1.0000 -3122996E-04 .1000000E-06 1.0000 -3277614E-04 .1000000E-06 1.0000 -1664447E-05 .1000000E-06 1,0000 .2245509E-04 .1000000E-06 1.0000 -8226390E-05 .1000000E-06 1.0000 .1022966E-04 .1000000E-06 1.0000 ,26098533-04 ,1000000E-06 1.0000 .2812500E-03 .1000000E-06 1.0000
Figure 1. SOLRUN file - this file computes the MTOT of H' @H=5.5) for rainwater (key components in BOLD CAPS), precipitation constituents fiom Freeze and Cheny, 1979.

PH - If PH is given, the total molar mount of is calculated. If PH = zero,
the pH is calculated h m the amount of H' provided.
TEMPC
TEMPC = the temperature (in OC ) of the system at which equilibrium is
calculated.
NLOOP or NLOO
(NLOOP = "nurnber of loops"). NLOOP is the maximum number of
Newton-Raphson iterations that SOLVEQ will use to converge the solution. If
convergence is not reached afier NLOOP iterations, the program ceases and non-
convergence is assumed. NLOOP is normally set to 40 and it is generally
accepted that if a case is not solved within 70 iterations, it will not converge.
C - (C = "charge" balance). The numerical value for C corresponds to the
selected ion fiom the component species in solution that is used for charge
balancing. The total molality of this ion is adjusted if a charge imbalance occurs
within the solution.
SAO
(SAQ = "sequence, aqueous"). The numeric values for SAQ are preset
and correspond to specific component species (from the xquence of component
species) within the SOLTHERM data file. SAQ tells SOLVEQ the positions of
the component species, required for the calculations, within SOLTHERM.
NAME
The names of the selected component species identified by SAQ are listed
under NAME. These names only serve as a visual aid for the reader as he/she
reads the SOLRUN data file.
MTOT
(MTOT = "moles, total"). MTOT represents the totai number of moles for
the component species within the SOLRUN file and defrnes the overall chernical
composition of the system. MTOT for water is designated as the amount of water
(in kilograms) within the system.
MTRY
(MTRY = "molality trial" value). MTRY contains the estimated trial
molalities for the component species. Default MTRY values are 1 x10-'~. As
SOLVEQ is used to calculate the actual (unknown) molalities, the closer the
preliminary MTRY values are to the actual molalities the better are the chances
for convergence. The MTRY value for water is in kilograms and is preset by
SOLVEQ to 1 kg.

APPENDIX E Key Components of CKILLRUN

Key Componcnts o f CKiLLRUN
The key components of CHILLRüN that best defuie how CHILLER was used for
this study are highlighted (BOLD CAPS) in Figure 1 . This sample CHILLRUN file is
followed by brief descriptions o f the key components (Reed and Spycher, 1998). Al1
other components are either non-essential default values or they are not applicable to
these water-rock titration reactions.
Yedian p r e c i p i t a t i o n values o f seven sites worldwide; hundreds of a n a l y s e s . e r e c i p i t a t i o n v a l u e s ( l k g H201 + p y r i t e ; (9ppm 02 aq. @ 25 degrees C 6 1 bar)
< erpc >< PB >< P m >< 'PDCP >< tempc ><volbox-l>Crhofresh> .1000E-11 .O0000 1.00000 25.00000 .O0000 .O0000 .O0000
c SINC >< SLIX >< m > .10E-OS . IOE-04 .O000
< enth >< s e n t h >< d e n t h >< t o t w a t >< so lmin >< rm >< a q g m >< suprnt > .00000 00000
---- C i f r a ipun WUX)
O 3 O O 70
S A Q > < t m B œ > < 1 H+ 2 H20 3 C1- 4 SO4-- 5 HC03- 7 Si02 9 Co++
10 Mg++ 11 Fe++ 12 K+ 13 Na+ 3 1 0 2 aq.
< M m > < - >
C N O 1 O I > < WTPC > pyr i t -ox . lOOOE+O3
~~ FC02-3.0 FC02-3.5 F02-O. 7 hemat i t e
Cdontf r>
i s t e lims looc O 1 O
>< -3185000E-04 .9999834E+00 .3430500E-04 -3122996E-04 -3277614E-04 -1664447E-05 -22455093-04 -8226390E-OS .0000000E-05 ,1022966E-04 -2609853E-04 -2812500E-03
i e n t i t r e i d e a ipsa i n c r i n c p XIHS n e u t O O O 1 O O 1 O
W m Y ><gamma > c comtot > .3162278E-05 1,0000 .0000E+00 .1000000E+01 1.0000 .0000E+00 .1000000E-03 1.0000 .0000E+00 .1000000E-06 1.0000 .0000E+00 .1000000E-06 1.0000 .0000E+00 .lOOOOOOE-06 1,0000 .0000E+00 .1000000E-06 1.0000 .0000E+00 .1000000E-06 1.0000 .0000E+00 .0000000E-18 1.0000 .0000E+00 .1000000E-06 1.0000 .0000E+00 .1000000E-06 1.0000 .0000E+00 -1OOOOOOE-06 1.0000 .0000E+00
Figure 1, CHILLRUN file - this file illustrates the rock titration (MINSOL = 1 ) capabilities of CHILLER. Pyrite is titrated into the aqueous phase at a rate of 0.1~1 O-' g (SiNC) until the value of SLIM ( 0 . 1 ~ 1 0 ~ g) is reached at which point program CHILLER stops (key components in BOLD CAPS).

PH - If PH is zero, the system pH is calculated h m the H+ ions in solution, and
is allowed to fluctuate with changes in fluid chemisûy. If PH is non-zero (1-14),
the pH remains fixed at that value during the m.
PFLUU)
Pressure of the system in bars.
TEMP
Temperature of the system in O C .
SINC - (SMC = "step increment"). SMC represents the incremental quantity of
reactant to be titrated into the aqueous phase. For modeling rock titration
reactions (MINSOL = l), SlNC is input as the arnount of reactant in grarns. For
each subsequent CHILLRUN file SMC is typically increased by a factor of ten.
SLIM - (SLIM = "step limit"). SLIM represents the total quantity of reactant that
can be titrated into the aqueous phase for that specific CHILLRUN file. Once
SiNC = SLIM program CHILLER stops and a new value for SLIM most be input
into the succeeding CHILLRUN file in order for CHILLER to m. For each
subsequent CHILLRUN file SLIM is also typically increased by a factor of ten.

TOTMIX
(TOTMIX = 'total mixture"). For rnodeling rock titration teactions
(MINSOL = L), TOTMIX represents the total amount of teactant added to the
solution, in grams.
C - (C = "charge" balance). The numerical value for C corresponds to the
selected ion h the component species in solution that is used for charge
balancing. The total rnolality of this ion may be adjusteci if a charge Unbalance
occurs within the solution.
NLOO or NLOOP
O O P = "number of loops"). NLOOP is the maximum nurnber of
Newton-Raphson iterations that CHILLER will use to converge the solution. If
convergence is not reached after NLOOP iterations, the program ceases and non-
convergence is assumed. NLOOP is normally set to 70 and it is generally
accepted that if a case is not solved within 70 iterations, it will not converge. For
some redox calculations however, an NLOOP value as large as 150 is required.
MINS or MINSOL
h4INSOL is used to activate the titration capabilities of CHILLER. With
MTNSOL set to 1, SWC and SLiM are entered into the CHILLRUN data file in
grams. Al1 reactants are therefore titrated into the aqueous phase in grams.

SA0
(SAQ = "sequence, aqueous"). The numeric values for SAQ are preset
and correspond to specific component species ( h m the sequence of component
species) within the SOLTHERM data file. SAQ tells CHILLER the positions of
the component species, required for the calculations, within SOLTHERM.
NAME
The names of the selected component species identified by SAQ are listed
under NAME. These names only serve as a visual aid for the reader as he/she
reads the CHILLRUN data file.
MTOT
(MTOT = "moles, total"). MTOT represents the total number of moles for
the component species within the CHILLRUN file and defmes the overall
chernical composition of the systern. MTOT for water is designated as the amount
of water (in kilograms) within the system.
MTRY
(MTRY = "molality trial" value). MTRY contains the estimated trial
molalities for the component species. Default MTRY values are 1x10-~'. As
CHILLER is used to calculate the actual (unknown) molalities, the closer the
prelirninary MTRY values are to the actual molalities the better are the chances
for convergence. The MTRY value for water is in kilograms and is preset by
CHILLER to 1 kg.
156

MIN or SATMIN
(SATMIN = bbsaturated mineral"). SATMM lists al1 of the minerais and
(or) gases that are saturatcd within the system.
MINTRY
(MINTRY = "mineral moles, trial"). MiNTRY contains the molar
arnounts of the minerals or gases listed within SATMIN. Default MMTRY
values are 1 x1 u9.
NOMOX
(NOMOX = "name, oxide"). NOMOX contains the narnes of the minerais
(reactants) used for the rock titration reactions.
W P C
(WTPC = "weight percent"). WTPC contains the weight percents of the
minerais Iisted under NOMOX.
SUPNAM
(SUPNAM = "suppression name"). SUPNAM Iists the narnes of the
minerals that are suppressed during the CMLLER calculations. This feature
(which is user specified) is used to suppress the formation of any questionable
minerals.

APPENDIX F List of Reactions

Fe& + '/ZH~O + * FcOOH + 4 s + 2 ~ 0 4 ~ - pyrite goethite
FeS2 + 'I~O: + H20 * Fe2+ + 2 ~ 0 4 ~ - + 2R+ pyrite
FcS2 + 14~e* + 8H20 * 15F'e2+ + 2 ~ 0 4 " + 16H' pyr ire
Fe& + 1s14020 + %Hz0 Fc(OW3 + 2 ~ 0 ~ ~ - + 4H+ pyrite ferrihydrite
FeS2 + ' / 2 0 : + H20 * F&04 + H2S04 pyrite
React ion
(1)
MS + Fe(S04)3 + 3/2a' + H20 * MSO4 + 2FeSO4 + H2S04 (10) (where MS stands for any metal suifide)
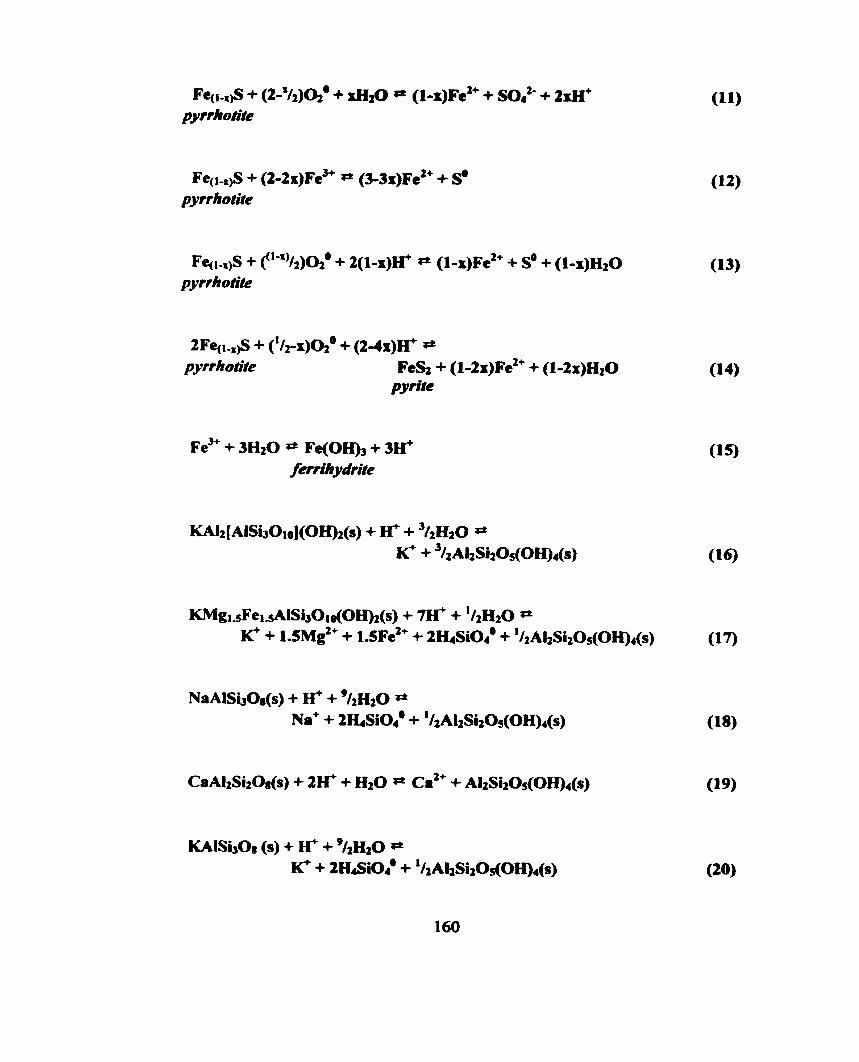
Fql,fi + (2-2x)Fe* 0 (3-3x)~e~* + sa pyrrhotite
Fq1-,$3 + f'-')/2)oio + 2(1-x)H+ * ( l - x ) ~ e ~ + + s0 + (1-x)H20 pyrrkotite
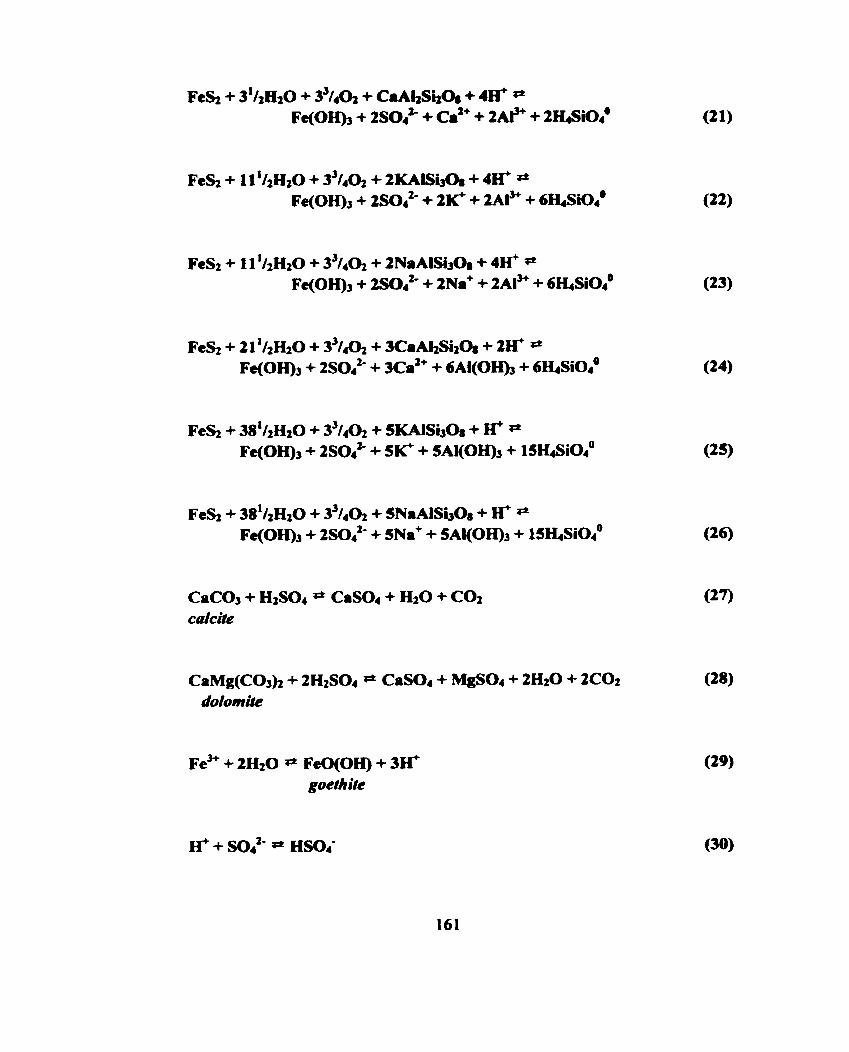
CaCO3 + &SOI * Cas04 + H z 0 + CO2 calcite

FeO(0H) + 2 ~ 0 4 ~ - + 4@ " Fe& + %H,O + 7 J 1 2 ~ a goethif e pyrite
2KAISi308 + * A I ~ o H ) ' + 2r + 6 s i a o + AP + 2H20 (36) microcline
2KAlSi308 + 2w * 2AIqOH) + 2@ + 6si0z0 microdine diasporc
2KAlSi301 + H20 + 2w * AhSi20s(OH)d + 2K' + 4~i02' microcline kadinite

~ a + + 2ca2+ + 1 9 s i a 0 + ~AIO(OH)@ + 5 h 2 + + + 30H20 * Clcl + Dpb + NaCai(Al&i130M) - 1 4 ï i I 0 + 25H? (43)
stilbite
3KAlSi30s + 2 s * K A 1 3 S i 3 0 ~ ~ O H ) 1 + 2K' + 6 s i a 9 microclhe muscovite
3KIn + 2K+ + Na' + 2ca2' + 19si02' + 9~10(0H)' + 5 ~ e ~ + + 5 ~ $ + + 27H10 *
2Ms + Clcl + Dph + Stb + 27@
3Mc + ~ a ' + 2ca2' + 13si0f + ~ A I ~ O H ) ' + SFC'+ + SM^+ + 30H20 r+
MS + 2K+ + CM+ Dph + Stb + 23H+

~ a + + 2ca2+ + + ~8 + 23sia0 + IOAIO(OH)' + 6it2+ + 6MC + 34'/2~20 *
Cdn + Clel + Dph + Stb + 2'/20z0 + 33H'
3NaAISi308 + 2H+ * NaA12(AlSi~Olo)(O~ + 2 ~ a + + 6sia0 albite paragonite
3Kla + 3 ~ a + + 2ca2+ + K' + ~ e * + 23sio2@ + ~OAIO(OH)O + 6 ~ e " + 6 ~ e + 3 1 1 1 2 ~ ~ 0 *
2Pg + Cdn + Cld + Dpb + Stb + 21/202Q + 3 5 c
3Ab + 2ca2+ + K' + ~e~ + 17sio2* + ~OAIO(OH)@ + 6 ~ e ~ + + 6 ~ $ + 3 4 ' 1 ~ ~ ~ 0 * Pg + Cda + Clcl+ Dpb + Stb + l U d + 2'/2020 + 31H'
CaAI2Si2O8 + 2H* * 2AlO(OH) + ci" + 2 ~ i 0 2 ~ anarthite diuspore
CaA12Si208 + Hz0 + 2H+ # Al2SilOflH)r + ca2+ anorthite kaolin&

Kln + ~ a + + 2ca2+ + 1 7 s e 0 + ~AIO(OH)' + SF~*+ + SM^ + 29H20 *
Ckl+ Dph + Stb + 2Dsp + 25H* (59)
An + Stb + ~ A I ~ O H ) ' + 3 s i a 0 + SFC*+ + SM< + 16H20 + AP *
Ckl+ Dph + 3Lmt + 2Dsp + ~ a ' + 22H' (60)
3An + 2 c + 4H20 * Mrg + Lmt + ci2+ (64)
3An + ~AIO(OH)@ + SF~" + SM^ + 20H2O + HCOY + 6sia0
Mrg + Lmt + Cal + Dph + Ckl+ 19H' (65)
VITA AUCTOIUS
NAME: Christopher Kenneth Lauzon
PLACE OF BIRTH: Windsor, Ontario, Canada
DATE OF BIRTH: October 1 8/1967
EDUCATION: Riverside Secondary Schwl 1981-1986
St. Clair College of Applied Arts and Technology, Windsor, Ontario, Canada 1986- 1988 Industrial Control Systerns Technician
University of Windsor, Windsor, Ontario, Canada 1 989- 1 994 B .Sc. Honors Geology
University of Windsor, Windsor, Ontario, Canada 1994- 1999 M.Sc. E h Sciences: Geology


![THOMSONITA – NaCa 2 [Al 5 Si 5 O 20 ].6H 2 O · 2020. 5. 3. · THOMSONITA – NaCa2[Al5Si5O 20].6H 2O A thomsonita é um tectosilicato do Grupo das Zeolitas. Tipicamente ocorre](https://img.dokumen.tips/doc/110x75/60aedadc480a4f6d1a51d4aa/thomsonita-a-naca-2-al-5-si-5-o-20-6h-2-o-2020-5-3-thomsonita-a-naca2al5si5o.jpg)


