Embed Size (px)
Citation preview

AQUEOUS SOLUTIONAND THE PHASE DIAGRAM
by
FREDERICK FIELD PURDONand
VICTOR WALLACE SLATERB.Sc., P.R.I.C., M.I.ChemtE."
LONDON: EDWARD ARNOLD & CO.

First Published in 1946
BOOKPRODUCTION
|WAR ECONOMY
|
STANDARD
This book ia producedin complete conformity with the
authorized economy standards
Printed in Great Britain byButler & Tanner Ltd., Frome and London

CONTENTSCHAP.
I. INTRODUCTIONPAGE
1
II. TWO-COMPONENT DIAGRAMS 7
A simple case without hydrates .......... 9
With hydrate formation ^ . . . . . . . m t .12With hydrates but without eutectics (incongruent melting points) . . . .14Retrograde solubility ....... 16A more complicated case . . . . . . . . , t .19
III. SOME PRACTICAL APPLICATIONS........... 20
Crystallization ........ 20Purification of crystals ............ 22Desiccation of crystals (solid processes) ......... 23
Liquid processes ............. 24Concentration by removal of ice .......... 24Solid fields 24
IV. How TO USE TRIPLE CO-ORDINATES .......... 26
Triple co-ordinate lattices ........... 26
To plot a solubility curve on triple co-ordinates ....... 27
V. How TO READ THREE-COMPONENT DIAGRAMS . . . . , . . .31The interpretation of a simple diagram . . . . . . . . .31The interpretation of a diagram with double salts ....... 36
The interpretation of a diagram with hydrate . . . . . . . .39A more complicated diagram........... 42Acids and bases instead of salts . . . . . . . . . .43
VI. PRACTICAL APPLICATION OF THREE-COMPONENT DIAGRAMS ... . . 45
Precipitation........... . . 45
Evaporation and dilution ........... 46
Addition of a salt............. 49
Addition of a salt to a system containing a hydrate ...... 60
Altering the temperature ........... 50A series of operations ............ 54
Isothermal invariant point in field of pure salt at lower temperature ... 66
A quantitative example of a cyclic process ........ 59
VII. DETERMINATION OF SOLUBILITY FOR PHASE DIAGRAMS ...... 63
Method of wet residues............ 63The synthetic complex method .......... 65
Apparatus .............. 65
Thermal analysis ............. 69
Notes on throe- and four-component systems . . . . . . . .71Solid solution ............ .72
iii

iv CONTENTSCHAP. PAGE
VHI. THE RECIPROCAL SALT PAIB 76
The base of the pyramid ........... 76
Plotting a point within the pyramid . . . . . . . . .78The phase diagram within the pyramid . . . . . . . . .81Orthogonal projection (the plan) 86
IX. SALT PAIR DIAGRAM APPLIED TO EVAPORATION 89
Pictorial projection for evaporation of water . . . . . . . .89Orthogonal projection for evaporation of water . . . . . . .91
X. JANEOKE'S PROJECTION 93
Janecke's projection for evaporation of water....... 95
Advantages of Janecke's projection ......... 96
Janecke's projection plus water . . . . . . . . . .96Janecke's projection plus water Simplified ........ 98
General survey of Janecke's diagram ......... 99
Janecke's diagram with incongruent point . . . . . . . .102Heating and cooling . . . . . . . . . ... . 106
XI. PRACTICAL EXAMPLES USING JANECKE'S PROJECTION ..... .110Preparation of potassium nitrate from sodium nitrate and potassium chloride . .110Double salts and hydrates . . . . . . . . . . .118Addition of a salt 128
Changing the temperature . . . . . . . . . . .129
XII. THE FIVE-COMPONENT SYSTEM : FOUR SALTS AND WATER . . . . . .131Four salts with a common ion .......... 131
Quinary systems with reciprocal salt pairs . . . . . . . .132The quinary system, Na, K, SO 4 , NO 3 , Cl, water at 75 C 134
Plotting the diagram within the prism . . . . . . . . .139Projection of the quinary with quantitative examples . . . . . .140General notes on the quinary system . . . . . . . . .153
XIII. GIBBS'S PHASE RULE ........ ..156Binary systems ............. 159
Ternary systems ............. 160
Quaternary systems ............ 161
The concentration variable . . . . ... . . .162
INDEX . 164

AQUEOUS SOLUTION AND THE PHASEDIAGRAM
CHAPTER I
INTRODUCTION
This book, as indicated in its title, deals with phase diagrams rather than with the
phase rule. It is also limited to aqueous solutions. For a more comprehensive treatment
of phase theory and of heterogeneous equilibria in general, the reader is referred to other
works such as The Phase Rule and its Applications, by Alexander Findlay and A. N. Campbell1
(8th edition, 1938), The Principles of the Phase Theory, by Douglas A. Clibbens (1920),
The Phase Rule and the Study of Heterogeneous Equilibria, by A. C. D. Rivett (1923), and
The Phase Rule and Phase Reactions Theoretical and Practical, by Sydney T. Bowden (1938).
For other specialized aspects of the phase rule there are Equilibria in Saturated Salt Solutions,
by W. C. Blasdale ( 1927), The Industrial Development of Searles Lake Brines with Equilibrium
Data, by J. E. Teeple (1929), States of Aggregation, by G. Tammann, translated by R. F.
Mehl (1925), and A Textbook of Metallography, by G. Tammann, translated from third
German edition by R. S. Dean and L. G. Swenson (1925). An introduction to the phase
theory is given by J. E. Wynfield Rhodes in Phase Rule Studies (1933).
Among these books there was the need for a more practical and elementary explanationof the use of phase diagrams. It is hoped that this book may serve first as an introduction
and then as a laboratory manual or desk companion for those workers who wish to applythis method for the solution of problems of heterogeneous equilibria. In aqueous solutions
such problems include the separation of pure chemicals from mixtures, the preparation of
double compounds and hydrates, the cyclic re-use of mother liquors, the right amountof evaporation or dilution required to give the best economic result consistent with purityof product and the effect of the addition of other salts, or the accumulation of impurities.
The progress of such operations can be followed quantitatively and optimum conditions
can be determined.
There are many practical uses of phase diagrams which may be applied without muchadvanced knowledge of the phase theory. If this were more generally realized we believe
that chemical industry would benefit by the much greater application of a simple methodof dealing with the types of problem indicated above. For this reason the explanation of
the phase rule has been relegated to the last chapter and the practical construction and
interpretation of diagrams has been presented so that they can be used simply from a know-
ledge of geometry and arithmetic. The chemist performs a series of ordered experimentsto prepare his diagram and he can then predict the results of endless experiments with
pencil and straight edge until he arrives at the one set of conditions which give the desired
result. At the same time it must be admitted that an understanding of phase theory in
general adds considerably to the interest in the subject and just sufficient theory has been
introduced to provide this interest.
With regard to actual diagrams reproduced, we have hi every case given the data
as well as the diagram, so that the reader may plot his own figure. This is the best way to
understand phase diagrams. Further, we believe that practical application creates an
1 B
2 AQUEOUS SOLUTION AND THE PHASE DIAGRAM
understanding more quickly than does mere theorizing and so, in explaining various points,
we have usually begun at once with actual examples avoiding, as far as possible, preliminary
explanations with hypothetical cases. Thus real chemicals have been used rather than
the imaginary ABC or XYZ, except for the reciprocal salt pair of Tables 22, 23, 24 and for
the five-component diagram of Fig. 40.
The Phase Rule was deduced from thermodynamic considerations by J. Willard Gibbs,
Professor of Mathematical Physics at Yale University, and published in 1876, Trans. Conn.
Acad., 1876, 3, 152. See also Collected Works of J. W. Gibbs, Vol. I, published in 1928
by Longmans. This rule gave a relationship between phases, degrees of freedom and
independent components. It may be expressed simply as
P + p =C + 2
where P = number of phases, F = number of degrees of freedom, and C number of
independent components.Gibbs's work was unnoticed except by a few and no attempt was made to use his
important generalization until it was disclosed, in a somewhat new form, by Bakhuis
Roozeboom in 1887 when, at the suggestion of van der Waals, he applied it in his researches
and showed the fundamental importance of the principle as a guide to the behaviour of
heterogeneous systems. (See B. Roozeboom 's book, Die Heterogenen Gleichgewichte vom
Standpunkte der Phasenlehre, whicA first appeared in 1904 and was continued, after
Roozeboom^ death in 1907, by Meyerhoffer and Schreinemakers.)
It was Roozeboom who made the theory of Gibbs generally accessible, but it was
the work of J. H. van't Hoff which inspired other workers, not only of his own time, but
right up to the present day. van't Hoff was unaware of the work of Gibbs when he was
studying chemical equilibria j1881 and when he enunciated his own laws which, in some
respects, coincided with Gibbs's phase rule.
By 1896 van't Hoff had carried out researches on the formation of double salts
and had started his classical investigation on the salt beds of Stassfurt, so that it was
van't Hoff and his co-workers who provided the first important example of the practical
application of Gibbs's work (see van't Hoff's Ozeanische Salzabtogerungen).
We are indebted to America for the phase rule, but it is largely due to the energies
and imagination of a small group of Dutchmen that this branch of physical chemistry has
been developed.In more recent years the tendency to make use of the phase rule in industry has
increased and a great mass of data has been collected in both America and Europe. Thoughless attention has been paid to the subject in this country, as indicated by the fewer publica-
tions in British journals, there have been numerous researches by Bassett, Findlay, Rivett
and others, but more notably those of Freeth and his co-workers. In 1915 the researches
of Freeth made it possible to obtain ammonium nitrate from Chile saltpetre when, to
quote the words of Professor Donnan, he"took the phase rule of Gibbs into the very
cannon's mouth."
The enunciation of the rule was only part of the story and the fuller use has, to a large
extent, been based on the development of improved graphical methods for the representation
of the equilibrium. The use of Cartesian co-ordinates for plotting the simple solubility
curve for one salt and water was only the beginning ; composition was usually the abscissa
and temperature the ordinate, although some books reverse this.
In 1827 Mobius had introduced his triangular or trilinear co-ordinates whereby points

INTRODUCTION 3
dependent upon three variables could be plotted provided the third variable was dependent
upon the: other two in the sense that the sum of the three was equal to unity, or to some
other standard. (An Elementary Treatise on Trilinear Co-ordinates, N. M. Ferrers, 1861;
Trilinear Co-ordinates and Other Methods of Modern Analytical Geometry of Two Dimensions,
W. A. Whitworth, 1866.) Willard Gibbs used these trilinear co-ordinates 1 for three-
component systems making the height of the equilateral triangle the standard, e.g. unityor one hundred (Trans. Conn. Acad., 1876, 3, 176). Roozeboom made the side of the
triangle his standard (Z. physik. Chem., 1894, 15, 145). Both amount to the same thingbut different measuring scales are required. In this book, as in other recent works, wehave rather combined the two, expressing position within the triangle more in terms of the
lattice and using an imaginary parallel rule. Such a method is more readily applied to
triangles of irregular shape. Printed graph paper for plotting on trilinear co-ordinates
can be purchased as triple co-ordinate paper and we have used this term.
With the introduction of more components the full representation of phase diagramsnecessitated more dimensions, even beyond three, and various devices have been introduced
to eliminate one or more of the variables. Pressure was first eliminated for aqueous solutions
by considering the systems, not at uniform pressure, but at such pressures that there was
no vapour phase. Thus the diagrams are not isobars but represent"condensed
"systems.
Atmospheric pressure usually fulfils this condition for practical purposes.
Temperature was then eliminated, in this case, usually by having a fixed temperature,that is the diagram represents an isotherm. With the exception of the diagrams in
Chapter II, representing binary systems, all the diagrams in this book are isotherms.
Polythermal diagrams can be prepared for systems representing water and two of even
more salts. Such polyiherms are figures in space and are generally shown as isometric
perspective projections of such three-dimensional figures. Such diagrams have a limited
use and in this book, for simplicity and easy application, we have used only isotherms andhave superimposed one or more isotherms in one plane when polythermal reactions are beingconsidered. The reader may imagine that the upper part of Fig. 36 is a polytherm, but it
also is simply the projection of two isotherms on to a plane ;a polytherm would show
curvature as the temperature was gradually changed whereas Fig. 35 merely shows the
results at two specific temperatures.Water was eliminated by the device of projecting from the point representing water.
This was introduced by Ernst Janecke," Uber eine ncue Darstellungsform der van't
Hoffschen Untersuchung iiber ozeanische Salzablagerungen/' Z. anorg. Chem., 1906, 51,
132 ; 1907, 52, 358, and 1907, 53, 319. His presentation was not good and did not receive
the merit it deserved ; in fact, fifteen years later, Henry Le Chatelier, in Compt. rend., 1921,
172 , 345,2put it forward as a new idea. Rivett in The Phase Rule, page 171, states that
"the
method offers no particular advantage over the pyramidal"and he would prefer the latter
to be adopted generally. We do not agree, as indicated in Chapter X. The pyramidalmethod is fully explained in Chapter IX, but this is merely to ensure a full and easy
understanding of the later chapters on Janecke's projection. The reader should not be
tempted to omit Chapter IX.
Janecke introduced several other methods of projection, as, for example, the projectionof a triangular prism on to one of the rectangular sides from one edge, the lines of projection
being parallel to the triangular ends and radiating from points along the edge.1 Gibbs's explanation is by no means clear arid credit should go to Roozeboom for popularizing
the method. 2 Janecke's reply, Chem. Ztg., 1922, 46, 361.

4 AQUEOUS SOLUTION AND THE PHASE DIAGRAM
The square-based regular pyramid was introduced by Lowenherz (Z. physik. Chem.,
1894, 13, 459) for plotting reciprocal salt pairs, that is the system in which double decom-
position may take place of the type :
AB + CD ^ AD i- CB.
It is of interest to note that van't Hoff introduced the sign ^ to represent mobile
equilibrium.
No attempt has been made in this book to cover all the many different methods of
plotting, projecting and using phase diagrams. The limited number of methods given has
been based on practical experience over a large number of years during which time manypublished methods have been tried, modified and, we trust, improved and extended. This
especially applies to the quaternary and quinary systems.
A phase reaction is a change in the number of phases or in their composition, a phase
being a homogeneous part of the heterogeneous mixture. Interest in phase reactions centres
in the fact thatt^e change from homogeneous to heterogeneous mixtures gives a means of
separating chemical substances, with or without chemical reaction. The change from
heterogeneous to homogeneous gives a means of purifying the mixture from extraneous
matter as in the filtration of dirt from a salt solution.
There are a number of terms used in any study of phase equilibria and these will now
be explained, although the preceding has already had to make use of many of them. Some
of these definitions are repeated in Chapter XIII in order to make that chapter complete
in itself.
A system is a mixture of substances limited to contain only those substances which
form its components and in which temperature and pressure may be altered as desired.
The system may be specific, that is a particular mixture of the substances, or it may be
general, that is it may refer to any mixture of the substances. In choosing the method of
diagrammatic representation, the general study of the system will require the boundaries
of the diagram, whether on a plane or in space, to be the limits of the system. Thus the
system sodium chloride and water will have the limits to represent all sodium chloride and
no water at one edge and all water and no sodium chloride at the other. It must not
include mixtures of sodium chloride and alcohol, since the introduction of alcohol brings
in another system. On the other hand, every system can be regarded as being limitless
in the sense that it is always a small part of a larger system. In this sense the system
sodium chloride and water would form part of the larger system sodium chloride, potassium
chloride and water, but in that case the larger system would also include two others :
potassium chloride and water ; sodium chloride and potassium chloride. This idea will be
especially noted in studying the quinary system, Chapter XII.
In this book, where the term system would be used to specify a particular mixture,
we have used the term complex.The substances comprising the system, when they are independent, are called com-
ponents. A component may be a chemical element or a compound, but the Phase Rule
is only concerned with the number of components and not with their composition. Thus
the number of components is the smallest number of chemical entities which can represent
the system under the conditions being studied. Thus for a condensed system calcium
carbonate is one component, but for a system at high temperature and with a possible
gaseous phase it is a system of two components, calcium oxide and carbon dioxide. For
the study of phase diagrams the number of components is of less interest than a knowledge

INTRODUCTION 5
of all the chemical compounds which can exist within the system. Thus in the system of
two components, sodium sulphate and water, we must know that there are at least three
possible chemical substances, sodium sulphate, sodium sulphate hexahydrate (Glauber's
salt) and water. The number of components is only required when one wishes to check
results obtained from the diagram with the Phase Rule.
One-component systems are described as unary, two- as binary, three- as ternary, four- as
quaternary, five- as quinary, and so on.
A phase is a homogeneous part of a mixture. The whole mixture may be homogeneous
as in the case of an unsaturated solution or it may be a mixture of different physical states
either of the same or of different chemical entities. Phases can be separated from one
another by physical or mechanical means, in theory at least, even though this may not be
always practicable. For example, a mixture of two kinds of crystals may be apparently
inseparable, but the microscope will show the separation. Since gases are infinitely miscible
the gaseous part of any system is always only one phase. Liquids form more than one
phase when they are not miscible ;for example, benzene and water. In aqueous salt
solutions it is rare to have more than one liquid phase and so in this book discussion has
been limited to cases where the liquid constitutes only one phase. Solids form as many
phases as there are chemical substances present in the solid state. The exception is where
solid solution or" mixed crystals
"are formed. This book does not include such cases
except for the brief reference at the end of Chapter VII. van't Hoff introduced the idea
of solid solution the expression" mixed crystals
"is unfortunate as it gives the wrong
impression.A phase diagram is a graphical representation in two or three dimensions of the lines
or surfaces of equilibrium between the phases in a system. Thus the lines and curves,
planes and curved surfaces on the phase diagram indicate that a mixture (complex) on one
side of the line or surface has a different set of phases from a mixture just on the other side.
They may both have the same number of phases or not, but if they have the same number
then their composition will be different.
Whereas the Phase Rule is only concerned with the number of phases and not their
composition nor their relative proportions, the phase diagram enables both to be determined.
Empirical data have to be obtained in order to be able to plot the diagram ;the inter-
pretation of the diagram enables one then to predict the course of a reaction with only
a limited number of determinations.
A degree of freedom or of variability is a possible choice of conditions for the system
which can be made without altering the number of phases. There are three kinds : pressure,
temperature and composition. Pressure has been excluded from the discussions in this
book and all aqueous solutions are assumed to be condensed. Temperature is a very
important selection to be made. By composition is meant the composition of any of the
phases and, for studies on aqueous mixtures, it is usually the composition of the solution
which is of interest and which is taken. It does not mean the composition of the mixture
(complex) this is important as by false reasoning the ability to change the composition of
the complex may be mistaken for a degree of freedom although the composition of the phases
remains unaltered. For example, if water is added to a mixture of salt solution and solid
salt (temperature kept constant), some salt will dissolve, but so long as insufficient water is
added there will still remain a mixture of salt solution (saturated at that temperature, and
therefore of fixed composition) and solid salt (though less in proportion). The addition of
the water does not constitute the selection of a degree of freedom : this statement must
15 AQUEOUS SOLUTION AND THE PHASE DIAGRAM
have added to it the words, wthin limits. Obviously if sufficient water is added to dissolve
all the solid salt, then the solution will become weaker and a selection of a degree of freedom
has been made, the composition of the liquid phase.A system with no degrees of freedom is described as invariant, with one degree as
univariant, with two degrees as bivariant, with three as tervariant, with four as tetravariant,
and so on. The main interest in these to the student of phase diagrams is to know that onthe diagrams the loss of a dimension means the loss of a degree of freedom. Dimensions
may be lost by regular progression from a space to a plane or a surface, thence to a line
or curve, and finally to a point. This will be understood better as the actual examplesare studied.
To avoid confusion it should be noted that the above terms invariant, univariant, etc.,
may be used with certain restrictions which give different meanings to them. Thus, as
already stated, pressure has been excluded from discussions in this book. This restriction
is indicated by the term"condensed
" and therefore an invariant condensed system would
be univariant if pressure were included. Similarly, if temperature is fixed the degree of
freedom may be qualified by the term "isothermal." In this sense an invariant isothermal
condensed system would be univariant condensed. This will also be understood better
when the examples are studied. It will then be seen that an isothermal invariant pointon an isothermal diagram is different from the system invariant point of a polythermal
diagram. The former would be univariant on the polythermal diagram.The following is an attempt to express in a few words the principles of phase diagrams
and their application. The phase isotherm shows the boundaries of fields of different
phases and gives exact information about any possible mixture of the components at the
specified temperature. The whole diagram is a system ;but a point representing a particular
mixture under consideration is also a system. This system (complex) can be moved about
within the whole system by such methods as adding or removing one of the components,
say water, or by removing one of the phases, e.g. by filtration or settling. Changing the
temperature, that is considering another isotherm, does not move the point representingthe system being studied, but it moves the boundaries of the fields and so the point has
been altered relative to the phase boundaries. The following chapters set out to amplifythis statement, commencing with the binary system of one salt and water and leading upto the quinary beyond which the student should be able to make his own way by a processof
"extrapolation."For the student who wishes to check his phase reactions by the phase rule we suggest
he use the modified form for condensed systems, as explained in Chapter XIII,
F = C - P -4 1

CHAPTER II
TWO-COMPONENT DIAGRAMS
As this book sets out only to deal with equilibrium in aqueous solutions, the two-
component system to be considered is that of water and a chemical substance, usuallya salt. The phase diagram in this case is the familiar solubility curve of elementarytextbooks, but it is much more than just the curve, and every point on the diagram has
a quantitative meaning. For this reason and because it is the foundation for more com-
plicated diagrams, the graphical representation of the two-component system will be
described in detail and from first principles.
A solubility curve is plotted within a rectangular figure the top of which is usuallyleft open. Temperature is measured from the base upwards and the composition of the
solution, in terms of per cent, salt and water, is measured between the two vertical sides
of the figure.
The distance between the two verticals is considered as being divided into one hundred
parts, percentages of the salt being measured from left to right and percentages of water
from right to left. The base line is taken to represent any convenient temperature.A moment's consideration will make clear that this procedure is not quite the same
as plotting a curve on graph paper using the more common rectangular co-ordinates of
each point. In that case one horizontal axis X and one vertical axis Y have an originmarked and taken as the zero point for both X and 7. With a diagram such as Fig. 1
there are two verticals, one representing 100% water and the other 100% of the salt,
and these two verticals are definite boundaries of the system.
Squared paper is convenient for this type of diagram, and the paper divided into
centimetre squares subdivided into millimetres is useful. The two verticals are drawn so
that the distance between them is ten squares or a multiple of ten squares and any con-
venient scale may be chosen for the temperature. Squared paper is not essential and very
good diagrams can be made on the drawing board, the points being plotted with T-squareand set-square or in the absence of these with a pair of compasses or a parallel rule.
For convenience the percentages of the salt are marked along the base, the left-hand
side being the water vertical and the right-hand side the salt vertical. Between these twovertical lines the composition of any mixture of water and the salt may be represented,but the composition is denoted by a vertical line and not by a point. Temperature is
measured from the base and it is usual to mark the temperature scale along the left-hand
vertical, but here again it must be noted that a temperature is a horizontal line and not
a point. The composition of a solution, or a mixture of water and the salt, at a definite
temperature becomes a point.The solubility curve is plotted from data which should state the percentage composition
of saturated solutions at various temperatures. Each point is plotted at the positionwhere the composition vertical is crossed by its corresponding temperature line. Whenall the points have been marked a curve is drawn evenly through them.
In almost all cases there will be one or more breaks in the curve or, in other words,
there will be more than one curve. The solubilities of a very large number of salts have
been determined over a range of temperature and published in standard reference books.
7
8 AQUEOUS SOLUTION AND THE PHASE DIAGRAM
In most cases the points at which the curves break are given as a definite temperature and
composition. In such cases the drawing of the curve presents no difficulties.
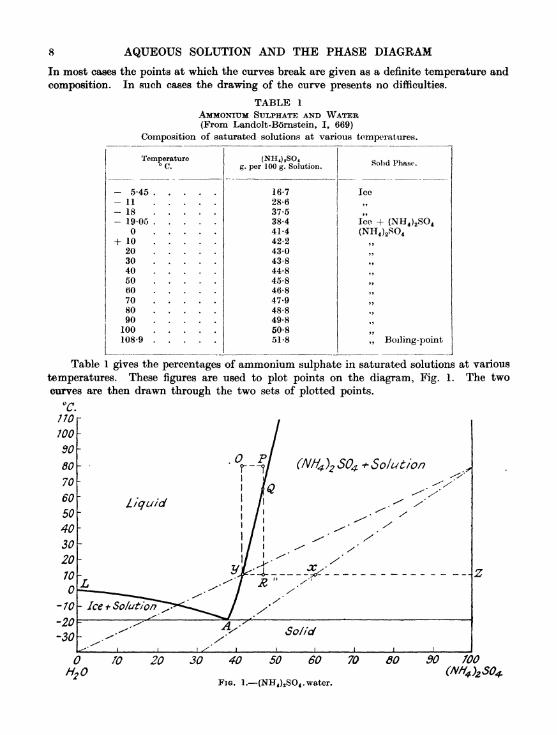
TABLE 1
AMMONIUM SULPHATE AND WATER(From Landolt-Bornstein, I, 669)
Composition of saturated solutions at various temperatures.
Table 1 gives the percentages of ammonium sulphate in saturated solutions at various
temperatures. These figures are used to plot points on the diagram, Fig. 1. The two
curves are then drawn through the two sets of plotted points.
nowo90
80
70
60
50
40
30
20
70
-70
-20
-30
Liquid
X Solid
H2/O 20 30 40 50 60 70
FIG. 1. (NH4 ) 2SO4 . water.
60 BO 700

TWO-COMPONENT DIAGRAMS 9
Such lines are referred to as curves even though in some cases they may appear to be
straight lines. This is to avoid any confusion between such curves and actual straight lines
which are used on phase diagrams.
Such solubility curves in which the concentration of a saturated solution is plotted
against temperature are very familiar but their full use is sometimes overlooked. For
instance, too much attention is paid to the curve itself without it being realized that every
point on the diagram has significance, whether it lies on the curve or not. Thus any pro-
portion of a simple salt to water at any given temperature may be marked on the graph
paper by a point. By noting the relation of the point to the curve, one may predict the
final condition of such a mixture, that is, what the solution will be, and how much and
what solid.
For the sake of regularity it must be repeated that, in addition to temperature and
concentration, there is another factor, pressure. Throughout this work pressure is ignored
because for this particular aspect of the Phase Rule the effect of pressure is negligible.
As a definite example of this the solubility of zinc sulphate at 25 C. and atmospheric
pressure is 36-69%, whereas its solubility at 25 C. at 250 atmospheres is 36-66%. The
figures for sodium chloride are 26-42% and 26-59% under the same conditions.
On the other hand, the vapour phase is considerably affected by pressure and so, by
ignoring pressure, we are assuming a system where there is no vapour phase. Such a systemis called a condensed system. With water solutions this means that the water can be taken
as all condensed, i.e. liquid or solid. Atmospheric pressure is generally taken to fulfil this
condition.
A Simple Case without Hydrates. Table 1, as already stated, gives the solubility
of ammonium sulphate and Fig. 1 is the solubility curve plotted therefrom. Fig. 1 is
usually called a solubility curve, but it is just as much a phase diagram as are some of
the more complicated diagrams given later in this book. The use of such a diagram is
to be able to determine what will happen to any mixture of ammonium sulphate and
water at any temperature.The right-hand curve is the more familiar one as the left-hand one is often ignored.
The former curve is the solubility of ammonium sulphate, the latter being the"solubility
"
of ice in weak ammonium sulphate solutions. The latter curve is also called the freezing-
point curve. This means that any solution of ammonium sulphate to the left of point A,
when cooled, will deposit ice and not ammonium sulphate. To complete the diagram
a horizontal straight line is drawn through the point A from the vertical line representing
100% water to the vertical line representing 100% ammonium sulphate.
Fig. 1 has been marked in a qualitative fashion to show what is to be expected in the
various parts of the diagram. The lines and curves divide it into a number of fields. The
upper field above the two curves is marked liquid and this means that any solution, which
is at such a temperature that it comes within this field, is completely liquid with no solid
and is an uiisaturated solution.
The lowest field is completely solid and any mixture of ammonium sulphate and water
may come within this field, but it will be noticed that such a mixture is only completely
solid when it is below the temperature of A, i.e. below 19 C. The point A is called
the eutectic point, the corresponding temperature being the eutectic temperature, and the
corresponding mixture of ice and ammonium sulphate the eutectic mixture. It is important
to realize that the eutectic mixture is a mixture and not a compound. The compoundsare at the peaks of curves as will be seen later.

10 AQUEOUS SOLUTION AND THE PHASE DIAGRAM
Within the field to the right marked "(NH 4 ) 2S0 4 -f solution," ammonium sulphate
crystals exist in equilibrium with a saturated solution. Within the left-hand field marked"
ice -f solution"
solid ice exists in equilibrium with a solution of ammonium sulphate.The latter solution is saturated with respect to ice but not saturated with respect to
ammonium sulphate. These two fields are the only ones where it is necessary to determine
the relation of solid to liquid : we propose to take an example from the right-hand one.
Suppose the mixture to be :
60 g. ammonium sulphate40 g. water
100 g.
at 10 C.
This is plotted as point x on the diagram. At this point there will exist solid ammonium
sulphate and saturated solution at 10 C. A line drawn through point x along the 10 C.
line cuts the curve at y where the ammonium sulphate content is 42-2%. This, then, Ls
the composition of the saturated solution.
The proportion of solid ammonium sulphate to solution may also be determined.
Produce the 10 C. line to meet the 100% ammonium sulphate vertical at z and measure
xy and xz. Then the proportion of solid to liquid will be in the proportion of xy to xz.
In the case taken
xy measures 18 (units of the abscissa scale)
xz measures 40
58
so that there will be
18 parts of solid ammonium sulphateto 40 parts of solution containing 42-2% ammonium sulphate
in 58 parts of mixture.
The above figures are converted into percentages by simple proportion as follows :
58 parts mixture contain 18 parts solid and 40 parts solution
100 iU>& 4000.1UU >' J> 58 " ?' " 58 55 "
i.e. 31 parts solid and 69 parts solution.
The percentages of solid ammonium sulphate and solution may also be read from the
diagram, thus avoiding the above calculation. A simple way of doing this is to draw a
straight line from the point representing 0% ammonium sulphate on the base line, through
y to cut the vertical line representing 100% ammonium sulphate at a point which we call
the projection point. From this projection point draw a straight line through x to cut the
base line. The point on the base line, so obtained, will be, in this example, 31% and we
interpret this as 31% ammonium sulphate solid and 69% solution of composition y.
The above remarks apply to the field bounded by the right-hand curve of the diagram.The field associated with the left-hand curve may be treated in a similar manner. Take
a point in the "ice -f solution"
field to represent a mixture at a specified temperature.
Through this point draw a horizontal line from the water vertical (the left-hand vertical)
to the curve. The point where this line meets the curve gives the composition of the

TWO-COMPONENT DIAGRAMS 11
solution, that is, the liquid phase. The proportions of ice and solution are found by measur-
ing the distance from the curve to the original point (towards ice) for the proportion of ice
and from the water vertical to the point (towards solution, i.e. the curve) for the proportionof solution.
So far we have only indicated how points on the diagram are read. The practical use
of two-component diagrams is considered in Chapter III, but it may not be out of placeto give one example at this stage.
A solution or mixture which is heated or cooled still maintains the same compositioneven though the proportions of solid and liquid may vary. Therefore change of temperaturecan only take place along vertical lines, these being lines of constant composition.
As an example, if a hot solution of ammonium sulphate is cooled, cooling can onlytake place along a vertical line from the point representing the composition of the solution.
Take a point P at 80 C. within the liquid field. The solution is not saturated but as the
solution cools it will follow the vertical line and so approach the saturation curve, meetingthe curve at Q which happens to be at (55 C. At this point the solution is saturated, andon further cooling ammonium sulphate will crystallize. If cooling is discontinued at 10 C.,
the mixture will be represented by the point R, which still has the same composition as P.
The mother liquor will have composition //and the proportions of solid ammonium sulphate
and mother liquor will be given by the distances yR and zR, as already studied in the
earlier example.It may be noted here that when a solution, such as that represented by the point P, is
allowed to cool, there is a change in the rate of cooling when the temperature reaches that
represented by the point Q. A further change in rate of cooling would occur at the eutectic
temperature 19 C. This is illustrated in Fig. la, which is further explained in the section
on thermal analysis, p. G9 et seq.
Time
Fig lo. Cooling curve for solution of 47-3% (NH 4 ) 2SO4 .

12 AQUEOUS SOLUTION AND THE PHASE DIAGRAMWith Hydrate Formation. Table 2 gives the solubility of manganese nitrate and
Fig. 2 is the diagram plotted therefrom., This example differs from the previous one in
FIG. 2. Mri(NO 3 ) 2 . water.
th#t hydrates are formed and the manganese nitrate curve is therefore not a single curvebut comprises two curves, one for the tri-hydrate Mn(N0 3 ) 2 .3H 2O and one for the hexa-
hydrate Mn(NO 3 ) 2 .6H 2O. The diagram has not been taken beyond the trihydrate as the
figures are not available for this.
TABLE 2
MANGANJUHB NITKATE AND WATER(From Landolt-Bornstein, I, 067)
Composition of saturated solutions at various temperatures
- 10 .
- 20 .
- 36 .
- 29 .
- 16 .
.
-f 11 .
25-8
23-5
27 .
30 .
35-5
Hexahydrate (6H2O) - 62-3% Mn(NO3 )a .
Trihydrate (3H 2O) - 76-8% Mn(NO3 ) 2 .

TWO-COMPONENT DIAGRAMS 13
Having drawn the curves from the figures in the table it is then necessary to mark the
positions for the two hydrates on the base and to draw two vertical lines to represent them.
The hexahydrate, Mn(N0 3 ) 2 .6H 2O, contains 62-3% manganese nitrate and 37-7% water.
The trihydrate, Mn(N0 3 ) 2 .3H 20, contains 76-8% manganese nitrate and 23-2% water.
These values are marked on the base line. Vertical lines are drawn from these points to
meet the curves and it will be noticed that the hexahydrate vertical meets its curve at the
peak. The trihydrate vertical also meets its curve at the peak, although this is not so
obvious as the curve is not drawn beyond this point.
The diagram is completed by drawing two horizontal lines, one through the eutectic
point A from the water vertical to the hexahydrate vertical and the other through the
eutectic point C between the verticals of the two hydrates.The lines and curves divide the diagram into a number of fields. For simplicity the
whole diagram may be regarded as composed of two simple diagrams like Fig. 1. Thusone such is between the water vertical and the hexahydrate vertical showing the equilibriumbetween water and the hexahydrate. Another diagram lies between the hexahydratevertical and the trihydrate vertical showing the equilibrium between the two hydrates.
By this simplification of the diagram any point on Fig. 2 may be examined by the methods
already described for Fig. 1.
The various fields have been named on the diagram, but there are two features which
require explanation. These arc the two hydrate verticals which are marked Mn(N0 3 ) 2 . 6H 2O.and Mn(N0 3 ) 2 .3H 20. These lines represent pure solid hydrates and may be regarded as
fields having length but no breadth.
The melting-point of the hexahydrate is 25-8 C. which is marked as point B. Abovethis temperature the compound is all liquid, whereas below it the compound is wholly solid,
the melting-point being sharply defined. Thus the hexahydrate vertical represents the
solid hexahydrate right up to the temperature of B. This feature is especially emphasizedbecause there are two fields marked "
Mn(N0 3 ) 2 .6H 2O -f solution," and the infinitely
narrow field of the solid hexahydrate separates these two fields.
To carry the above argument a stage further, if there is a trace of the trihydrate with the
hexahydrate then the mixture will not be wholly solid until it is cooled to the eutectic tempera-ture of 23-5 C., there being a mixture of solid hexahydrate and solution between 25-8 C.
and 23-5 C. On the other hand, if a small amount of water is added to the hexahydrate the
mixture will not be wholly solid until it is cooled to the other eutectic temperature of 36 C.,
there being a mixture of solid hexahydrate and solution between 25-8 C. and 36 C.
Similarly, the trihydrate vertical below D represents the solid trihydrate, the melting-
point of the compound being 35-5 C.
In Fig. 2 there are two eutectics, one at A, the other at C. This, therefore, is the"ideal
"phase diagram for two components where hydrates are formed and it is a com-
paratively rare example. More usually the curves are discontinued before reaching the
compound peak. If the curve passes the peak there must be a eutectic.
Before leaving Fig. 2 one quantitative example might be taken. Let the point x
represent a mixture of manganese nitrate and water at C. The horizontal fine yz is
drawn through x, the point y thus representing the composition of the solution. Thedistance zx represents the proportion of solution y and the distance yx represents the
proportion of solid which, in this case, is the hexahydrate.zx 7-5 units (of the abscissa scale)
yx = 5-0 units

14 AQUEOUS SOLUTION AND THE PHASE DIAGRAM
Therefore there are 7-5 parts of solution of composition y and 5-0 parts of solid hexa-
hydrate.
With Hydrates but without Eutectics (Incongruent Melting-points). In the
last example a eutectic mixture was formed between the hydrates, More commonly no
such eutectic mixtures occur, the only eutectic point being that between water and the
first hydrate. The system of sodium iodide and water may be taken as typical of this class.
Table 3 gives the solubility of sodium iodide and Fig. 3 is the phase diagram. Here,
again, there are two hydrates, a pentahydrate, NaI.5H 2O, and a dihydrate, NaI.2H 20,
and these have to be marked on the base and vertical lines drawn therefrom.
NaI2H2FIG. 3. Nal water.
The pentahydrate vertical does not meet its own curve AB, nor does the dihydrate
vertical meet its own curve BO. The former vertical is therefore not taken beyond the
temperature of point J5, while the latter is not taken beyond the temperature of point C.
This is because the pentahydrate cannot exist above the temperature of B, nor the
dihydrate above the temperature of C.
To complete the diagram the pentahydrate vertical, as mentioned above, is not drawn
beyond the temperature line passing through the transition point B. From B a horizontal
line is drawn, meeting the pentahydrate vertical and produced to meet the vertical repre-
senting the next compound, in this case the dihydrate vertical.
In the same way the dihydrate vertical is not taken beyond the temperature line
passing through C and from C a horizontal line is drawn to meet the vertical representing
the next compound, in this case the anhydrous salt.
Finally, a horizontal line is drawn through the point A, the eutectic between water
and the first hydrate, and the line produced to meet the water vertical on the left and
the pentahydrate vertical on the right.
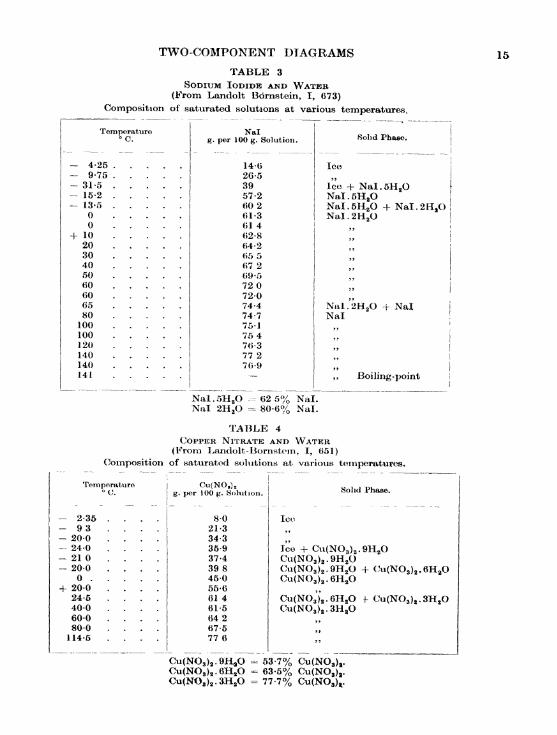
TWO-COMPONENT DIAGRAMSTABLE 3
SODIUM IODIDE AND WATER(From Landolt Bornstein, I, 673)
Composition of saturated solutions at various temperatures.
15
Nal.5H2--= 62 5% Nal.
Nal 2H 2O - 80-6% Nal.
TABLE 4
COPPER NITRATE AND WATER(From Landolt-Bornstem, I, 651)
Composition of saturated solutions at various temperatures.
Temperature(J.
- 235- 93
20-024-0
- 21- 20-0
.
4- 20-024-640-060-080-0
114-5
Cu(NO3 ) a .9H4O - 53-7% Cu(NO3 ) a .
Cu(NO 3 ) 2 .6H2O - 63-5% Cu(NO8 ) 8 .
Cu(N08 )2 .3H2- 77-7%

16 AQUEOUS SOLUTION AND THE PHASE DIAGRAM
Any mixture coming within the field marked " NaI.5H 2O -f solution"
is examined
by taking its relation to the curve AB and the pentahydrate vertical by the usual methodof drawing a horizontal line through the point under consideration, as described for Figs. 1
and 2. The field marked "NaI.2H 2O +- solution"
is treated in a similar manner.
Finally, any mixture coming within the field marked " Nal + solution"
is examined
in its relation to the curve CD and the 100% sodium iodide vertical.
The temperatures at B and C are called incongruent melting-points. This means that
the solids, NaT.5H 2O and NaI.2H 20, cannot exist in equilibrium with solutions of the
same composition. Thus if the solid Nal . 5H 2O is heated it will decompose into Nal . 2H 2
and a solution of lower Nal content at a temperature (B) below its melting-point on the
curve BC. By the time the temperature has reached a point to give NaI.5H 2O as solution,
then all the solid phase will have disappeared. An incongruent melting-point may be
defined as the temperature at which a compound decomposes. Further examples of
incongruency will be seen later in the ternary system. (See incoiigruently saturated
solution, p. 39.)
Conversely, a compound is said to have a congruent melting-point if the solid and liquid
of the same composition can exist together in a state of equilibrium. The point B on Fig. 2
was a congruent melting-point. In this case the melting-point is sharply defined and distinct.
Another example of the incongruent type of diagram is given in Table 4 and Fig. 4
copper nitrate.
H270 20 30 40 50 60 \ 70 80
Cu(N03)2 6H2
90 JOO
FIG. 4. Cu(NO3 ) 2 . water.
Retrograde Solubility. So far in all the examples given there has been an increase
in solubility with rise in temperature. This is the generally expected case, but some salts,
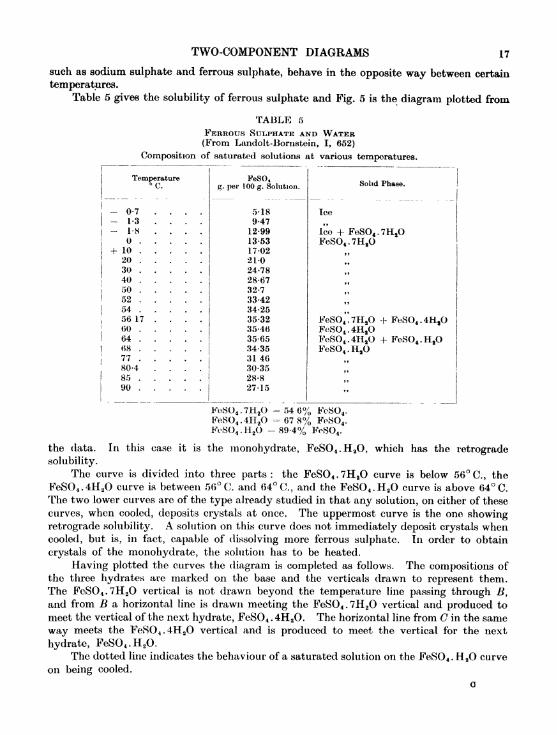
TWO-COMPONENT DIAGRAMS 17
such as sodium sulphate and ferrous sulphate, behave in the opposite way between certain
temperatures.Table 5 gives the solubility of ferrous sulphate and Fig. 5 is the diagram plotted from
TABLE 5
FERROUS SULPHATE AND WATER(From Landolt-Bomstein, I, 652)
Composition of saturated solutions at various temperatures.
FeSO4 .7H2O -546% FeSO4 .
FeSO4 .4H2O = 67 8% FeSO4 .
FeS04 .H2- 89-4% FeSG4 .
the data. In this case it is the monohydrate, FeS0 4 .H 2O, which has the retrograde
solubility.
The curve is divided into three parts : the FeSO 4 .7H zO curve is below 56 C., theFeSO 4 .4H 2O curve is between 56 C. and 64 C., and the FeSO 4 .H 2O curve is above 64 C.
The two lower curves arc of the type already studied in that any solution, on either of these
curves, when cooled, deposits crystals at once. The uppermost curve is the one showingretrograde solubility. A solution on this curve does not immediately deposit crystals whencooled, but is, in fact, capable of dissolving more ferrous sulphate. In order to obtain
crystals of the monohydrate, the solution has to be heated.
Having plotted the curves the diagram is completed as follows. The compositions of
the three hydrates are marked on the base and the verticals drawn to represent them.The FeS0 4 .7H 2O vertical is not drawn beyond the temperature line passing through B,and from B a horizontal line is drawn meeting the FeSO 4 .7H 2O vertical and produced to
meet the vertical of the next hydrate, FeS0 4 . 4H 2O. The horizontal line from C in the same
way meets the FeSO 4 .4H 2O vertical and is produced to meet the vertical for the next
hydrate, FeS0 4 .H 2O.
The dotted line indicates the behaviour of a saturated solution on the FeSO 4 .H 2O curve
on being cooled.
a

18 AQUEOUS SOLUTION AND THE PHASE DIAGRAM
7H2 FeSO^FIG. 5. FeSO 4 . water.
40 50\,60
^70
NaOH3 l2H2 NaOH2H2
7OONaOH
FIG. 6. NaOH. water.

TWO-COMPONENT DIAGRAMS 19
A more Complicated Case. Sodium hydroxide and water give an example where
hydrates are formed, some of which give eutectics while others merely show a break in the
curve. Table 6 gives the figures and Fig. 6 is the diagram.
Although this diagram looks and is fairly complicated, by taking the fields one at a time
it should be obvious that there is nothing in the diagram that the reader does not alreadyunderstand.
TABLE 6
SODIUM HYDBOXIDE AND WATER(From Pickering, J. Chem. Soc., 1893, 63, 890)
Composition of saturated solutions at various temperatures.
- 527- 1029- 17-20- 25-2- 28-0- 26-0- 252- 24-0- 21-7- 19-55- 18-0- 12-60- 845+ 1-62
5-40
7-00
13-2
15-55
13-95
10-75
5-00
7-80
10-30
12-30
18-00
40-25
57-85
632364-3
63-0
62-0
80-0
110-0
159-0
192-0

CHAPTER III
SOME PRACTICAL APPLICATIONS
Before going into detail in the use of two-component diagrams it may be well to ask
the question what is generally required to be done with a solution or mixture of one salt
and water ? Among the more common requirements are the preparation or purification
of the salt or one of its hydrates, the maintenance of a system as liquid or as a solid and the
concentration of a solution by the removal of water as ice. In order to attain any of these or
other results the number of operations that can be used is strictly limited. These are :
Change of temperature.Addition of water.
Removal of water (or addition of salt).
Change of pressure is not included, as all systems under consideration in this work are
Assumed to be at constant pressure (see note on condensed systems, p. 9).
In applying the above operations to a phase diagram there are two important rules :
Rule (1). Change of temperature moves the point under consideration along a vertical
line, the composition remaining unchanged. Thus raising the temperature moves the point
vertically upwards and lowering the temperature moves the point vertically downwards.
Rule (2). Change of water content moves the point under consideration along a
horizontal line, the temperature remaining unchanged. Addition of water moves the point
horizontally towards the water vertical. Removal of water or addition of the salt moves
the point horizontally towards the 100% salt vertical.
An example of rule (1) may be found on p. 11 with reference to Fig. 1. There the
temperature was changed from 80 C. to 10C., the point moving vertically downwards
from point P to R. At E the point represented a mixture of solid and liquid. The com-
position of the combined solid and liquid at R was the same as at P. The new liquid, of
course, had a different composition which was determined by the principles explained in
Chapter II.
In order to make rule (2) perfectly clear take the point x on Fig. 1. This represents
60% ammonium sulphate and 40% water at 10 C. If water is added to this mixture
keeping the temperature at 10 C., the point will move along the 10 C. line, in the direction
of y. The distance it moves depends upon the amount of water added. If sufficient water
is added the point will move beyond y and approach the water vertical along xy produced.
Conversely, if water is removed, e.g. by exposing the 60% ammonium sulphate solution
to a current of dry air, the temperature still being maintained at 10 C., the point will move
along the 10 C. line in the direction of z and could eventually reach the ammonium sulphate
vertical at z.
Crystallization. In the preparation of a salt by crystallization both rules will be
applied. An example will now be taken where it is required to obtain ammonium sulphate
crystals from a given weak solution, say 30% ammonium sulphate.
If this solution could be conveniently concentrated in the cold, say at 20 C., it could
only be taken as liquid to 43% ammonium sulphate as can be seen on Fig. 1, because the
20 C. line cuts the curve at 43%. By raising the temperature to 100 C. the solution may20

SOME PRACTICAL APPLICATIONS 21
be concentrated to 50-8% ammonium sulphate, that being the composition where the
100C. line cuts the curve.
The procedure, therefore, is to concentrate at a high temperature, say 100 C. or higher,
and then to cool the concentrate. This procedure may be outlined on the diagram as follows.
The original solution containing 30% ammonium sulphate lies on the 30% vertical.
One would assume that such a solution would be cold when received so that on heatingthe first movement on the diagram is up the 30% vertical, eventually reaching, say, the
100 C. point. The solution is then concentrated at its boiling-point this would be just
above 100C., but we will assume it to be 100C. for the purpose of the diagram. Asthe solution is concentrated the point on the diagram will move along the 100C. line
towards the ammonium sulphate vertical. (Removal of water rule 2.) If concentration
is to be stopped while the solution still remains liquid then the removal of water must be
discontinued when the point moving along the 100 C. line reaches the curve. This is at
50-8%. Actually the concentration would be stopped at about 50% and we will assume
that this is so.
The hot concentrated solution will then be cooled in order to crystallize out the
ammonium sulphate. Suppose it is possible to cool to 10 C., then the point on the diagramwill move down the 50% vertical from the 100 C. level to 10 C. (Change of temperaturerule 1.) The yield of crystals obtained at 10 C. may be determined by the method described
on p. 10.
To summarize : the crystallization of ammonium sulphate by concentration at 100 C.
and subsequent cooling of the concentrated solution may be considered on the diagram as
the movement of a point along the 100 C. horizontal from 30% to 50% ammonium sulphate,
followed by movement of the point down the 50% vertical to the 10 C. position. The
following diagram makes this clear :
The above example of concentration and cooling is a ^Concentration .
very simple case and hardly needed investigation on a phase
diagram. It is, however, necessary to understand such a case
in order to be able to apply the same principles to a less
simple example, as when there are hydrates and it is desired
to produce one specific hydrate.Take Fig. 2, for example. The important feature about
this diagram is that it tells one that, if the hexahydrate of
manganese nitrate is required, the solution must be con-
centrated to between A and (7, i.e. between the two verticals representing 40-5% and 64-6%
manganese nitrate. If, on the other hand, the trihydrate is required, then the solution
must be concentrated to a strength beyond (7, i.e. beyond the 64-6% vertical. In each
case the nearer the concentrated solution is taken to B and D respectively the greater will
be the yield of crystals. If the solution is actually on B or D then the liquid will be the salt
dissolved in its own water of crystallization and when cooled it will set solid, the hexahydrate
solidifying at 25-8 C. and the trihydrate solidifying at 35-5 C.
The diagram also indicates the limit to which cooling may be taken. For instance,
suppose the solution contains 70% manganese nitrate and that the trihydrate is required.
Obviously the solution must be cooled below 32 C., this being where the 70% vertical cuts
the curve. It must not, however, be cooled below 23-5 C., this being the eutectic tempera-
ture, indicated on the diagram by the horizontal line through the eutectic point (7, because
below this temperature the whole mixture will set solid as a mixture of the two hydrates.

22 AQUEOUS SOLUTION AND THE PHASE DIAGRAMIn other words, the cooling must be conducted in such a way that the final solution is ata temperature to bring it within the field marked "
Mn(NO 8 ) 2 .3H 2 -f solution."The above statement is especially important in preparing the hexahydrate. The
greatest yield of crystals is obtained by having the solution as near to B as possible, buta study of the diagram shows that whereas a point to the left of B may be cooled even to
36 C., a point to the right ofB may only be cooled to 23-5 C., so that the yield of crystalsfrom a solution to the left of B will be large while the yield from a solution to the rightof B will be very small. A solution to the right of B, if cooled below 23-5 C., will give asolid mixture of the two hydrates.
In cases where there are no eutectics a further advantage of the phase diagram arises.
Take, for example, sodium iodide, Fig. 3, and suppose it is desired to obtain the pentahydrate.Here is a case where, if the solution is concentrated until its composition corresponds to the
pentahydrate, NaI.5H 2O, i.e. 62-5% sodium iodide, the solution will not give the penta-hydrate on cooling. A consideration of the diagram shows that such a solution will depositthe dihydrate at 8 C. and will continue to deposit this compound until the temperaturehas reached - 13-50.
In order to obtain the pentahydrate the solution must not be stronger than 60%sodium iodide, this being the transition point B on the diagram.
Tt must be admitted that a solution stronger than 60% but weaker than 62-5% sodiumiodide if cooled below the temperature of B, i.e. 13-5 C., will theoretically give the penta-hydrate if equilibrium can be attained between the solid and the liquid, because the final
point comes within the fieldu NaT . 5H 2O -f solution." This is a problem where the history
of the case has to be taken into account. While such a solution was being cooled, betweenthe point on the curve and the 13-5 C. horizontal the dihydrate was being precipitated.Below 13-5C. the pentahydrate is precipitated and some of the dihydrate previouslyformed will be converted to the pentahydrate. The reaction between a solid and liquid is
often slow, depending upon the size of crystal, and it is therefore very probable that thefinal crystals will be contaminated with the lower hydrate.
The first suggestion of using a solution not stronger than 60% is therefore the wiserand safer procedure.
Similarly, the dihydrate is obtained by using solutions between 60% and 74% sodiumiodide, i.e. between B and C on the diagram.
Purification of Crystals. Thus far it has been assumed that weak liquors werethe source of supply from which crystals were to be obtained. It is perhaps more usual tohave impure crystals as the raw material, the problem being to purify them. It may bethat the raw material is the wrong hydrate or it may be that there are traces of impurityin them which have to be removed. These impurities may be insoluble in water so thata solution is first prepared and the insoluble matter is filtered or settled out. Or the
impurities may be soluble but so small in quantity that they remain in the mother liquorand in such small quantities that they do not materially affect the solubility of the mainproduct. In other words, in spite of the soluble impurity the system can still be consideredas one salt and water. The following is such an example.
As the procedure is the same in all cases where the solubility of the salt increases withincrease of temperature, for convenience, ammonium sulphate and Fig. 1 can be taken asthe example. The recrystallization may first be traced out on this diagram and a convenient
temperature and concentration chosen for the hot solution and also a suitable final
temperature to which the solution may be cooled.

SOME PRACTICAL APPLICATIONS 23
Let the vertical PR represent the composition of the hot solution and 80 C. the
temperature, that is at the point P. The solution is not saturated but will become saturatedwhen it has cooled to 65 C., the point Q on the curve, and before that temperature is reachedthe hot solution may be clarified by settling or by filtration.
The clear hot solution is then allowed to cool to the desired temperature, say 10C.,at which stage the crystals are separated from the mother liquor which is then heated andused to dissolve more of the crude salt. The process is a cyclic one, heating from y to O,
adding ammonium sulphate from O to P and cooling from P to R.
The diagram can also be used quantitatively. Starting with, say, one hundred parts of
mother liquor represented by the vertical Oy, 42% ammonium sulphate, it is necessary to
add solid ammonium sulphate till the composition of the mixture becomes 47-5% represented
by the vertical PR. The distance OP = yR, therefore, represents the proportion of solid
ammonium sulphate to be added and the distance Rz the proportion of mother liquor.These distances are 5-5 units for yR and 52-5 units for Rz (units are in terms of the abscissa
scale).
52-5 parts of mother liquor require 5-5 parts of ammonium sulphate
IAA 5-5 x 100 , r . . . A100 ,, ,, ,, ,, parts of ammonium sulphate52-5
v F
= 10-5 parts of ammonium sulphate.
From the proportions obtained by measurement of the lines yR and Rz the amount of
ammonium sulphate required can be calculated for any given quantity of mother liquor.
After the hot solution has cooled to the desired temperature, 10 C. in this case, the amountsof mother liquor and ammonium sulphate crystals are, of course, the same as before, i.e.
100 parts mother liquor and 10-5 parts crystals.
If the impurities are soluble, even though the percentage is very small, they will
accumulate in the mother liquor in time and a stage will eventually be reached when the
amount can no longer be ignored. The mother liquor must either be rejected or the
impurities removed. The latter may be effected either by a straightforward precipitationor by the application of the principles governing the solubility of two salts and water, whichis beyond the scope of this section.
Desiccation of Crystals. (Solid Processes.) It is sometimes desired to convert
hydrates to the anhydrous state without melting the crystals. This is possible providingtheir vapour pressure is such that they arc capable of giving up their water of crystallization
at a temperature low enough to be within the field of"
all solid." In such a case the water
is removed by the application of vacuum or by subjecting the hydrate to a current of air.
Obviously the quickest result will be obtained when the temperature is as high as
possible. The phase diagram gives the necessary information regarding the maximum
temperature to be allowed which will ensure the hydrate remaining completely solid
throughout the operation.Take copper nitrate, Fig. 4. The hexahydrate, Cu(N0 3)6H 20, containing 63-5%
copper nitrate will begin to melt at 24-5 C. If the water of crystallization is removed byhaving the crystals under vacuo or by passing a current of dry air over them the diagramshows that liquid will be present if the temperature exceeds 24-6C., until the compositionreaches the trihydrate Cu(N0 3)3H 20, i.e. 77-7% copper nitrate. The temperature must
therefore be kept just below 24-5 C. until 77-7% is reached, after which the temperature
may be raised to 114-5C., the point D on the diagram.

24 AQUEOUS SOLUTION AND THE PHASE DIAGRAM
Thus to desiccate any crystals the temperature must be controlled so that it follows
the top of the fields marked "solid," being increased by a series of distinct jumps.
Liquid Processes. Just as in some cases it is desired to avoid the presence of liquidso in others it is essential to avoid the presence of solids. For instance, in the concentration
of a liquid in a complicated plant it is important that the liquid shall remain fluid so that
it may flow through the plant without danger of a blockage.In concentration in vacuo there is more danger of crystals being deposited because the
boiling-point is reduced. A study of the phase diagram of the solution to be concentrated
tells one at once what is the minimum temperature to be specified at any given concentration,
and with this knowledge the concentration may be conducted under such a vacuum that
the temperature is maintained above that specified.
Concentration by Removal of Ice. An interesting, but not common, applicationof the phase diagram is in the concentration of a solution by the removal of water as ice.
This is only applicable where the strength of the original liquor is below that of the first
eutectic of the diagram ;that is, the concentration vertical must be to the left of point A of
Fig. 1, Fig. 2, or Fig. 3.
Such a solution on cooling will begin to precipitate ice when the temperature reaches
the curve. As the temperature is reduced more ice will be deposited and the concentration
of the solution will therefore move to the right. This process may be continued until the
concentration of the solution has reached the eutectic point at the eutectic temperature.In practice cooling will be discontinued just above the eutectic temperature so that the
ice may be removed by settling or filtration.
As a specific example a 10% ammonium sulphate solution could be concentrated to
27-5% by cooling to - 10 C.
Solid Fields. On the diagrams the solid fields have been given compositions. For
example, in Fig. 6 one field is stated to contain solid dihydrate and solid 3-5 hydrate. Formost practical purposes this is correct because, being solid, any
' k
pure"components or
any individual crystals of pure compound cannot be separated from the mixture and the
analysis of such a mixture will give the results stated.
It is necessary to point out that equilibrium between solid and solid is not readilyattained and will often not be attained unless the mixture has been through a liquid stageor through a stage with some liquid present.
For example, if ice is mixed with anhydrous sodium hydroxide and the temperaturemaintained below 30 C., the mixture will remain as ice and anhydrous sodium hydroxideeven though the composition comes between the dihydrate and the 3-5 hydrate. If, how-
ever, such a mixture is melted and further heated until it is completely liquid, on re-coolingthe mixture of solids will be, as stated on the diagram, the 2H 2 and 3-5 H 2O compounds.
It is interesting to take the last example in detail and see just what does happen on
re-cooling.
If the composition of the solution is to the left of the eutectic point Q, on cooling the
3-5 hydrate will be deposited first while the composition of the solution moves along the
curve towards O. When the eutectic temperature is reached the solution will be represented
by the point O and on further cooling the whole will set solid. In this case the solid mixture
may be regarded as composed of the 3-5 hydrate which was first deposited and the eutectic
of composition 0.
Thus the field between d and e and containing solid dihydrate and solid 3-5 hydrate
may be regarded as divided into two fields : that to the left of the G vertical is solid 3-5

SOME PRACTICAL APPLICATIONS 25
hydrate -f solid eutectic mixture, while that to the left of the G vertical is solid dihydrate
f solid eutectic mixture.
This is not a very important point as mixtures of solids are not easily separated by
purely mechanical means, but the reader should have a general idea of what does happenin the completely solid fields.
CHAPTER IV
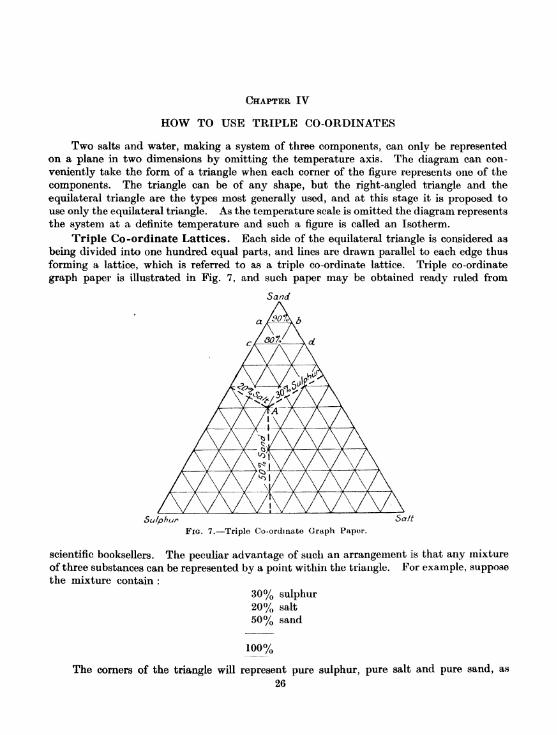
HOW TO USE TRIPLE CO-ORDINATES
Two salts and water, making a system of three components, can only be representedon a plane in two dimensions by omitting the temperature axis. The diagram can con-
veniently take the form of a triangle when each corner of the figure represents one of the
components. The triangle can be of any shape, but the right-angled triangle and the
equilateral triangle are the types most generally used, and at this stage it is proposed to
use only the equilateral triangle. As the temperature scale is omitted the diagram representsthe system at a definite temperature and such a figure is called an Isotherm.
Triple Co-ordinate Lattices. Each side of the equilateral triangle is considered as
being divided into one hundred equal parts, and lines are drawn parallel to each edge thus
forming a lattice, which is referred to as a triple co-ordinate lattice. Triple co-ordinate
graph paper is illustrated in Fig. 7, and such paper may be obtained ready ruled from
Sand
Su/phuFIG. 7. Triple Co-ordinate Graph Papor.
Sa/t
scientific booksellers. The peculiar advantage of such an arrangement is that any mixture
of three substances can be represented by a point within the triangle. For example, supposethe mixture contain :
30% sulphur
20% salt
50% sand
100%
The corners of the triangle will represent pure sulphur, pure salt and pure sand, as

HOW TO USE TRIPLE CO-ORDINATES 27
indicated on the diagram. Thus the point at the extreme top of the triangle represents
100% sand;the other corners represent 100% sulphur and 100% salt respectively. Moving
away from the corner marked " sand"
the percentage of sand becomes less and less, so
that 90% sand is represented on the line ab; 80% sand is on the line cd
;and so on, until
the bottom line or edge is reached indicating 0% sand.
The percentage contents of sulphur and salt are considered in a similar way, the sulphur
figures being read on the lines parallel to the right-hand side of the triangle and the salt
figures on the lines parallel to the left-hand side of the triangle. Thus a mixture of the
composition given above is represented by the point A in Fig. 7. This point is fixed bycounting 50 units of the scale from the base line towards sand for the sand percentage, 30 units
from the right-hand edge towards sulphur for the sulphur percentage, and 20 units from the
left-hand edge towards salt for the salt percentage.It will be clear from a study of the diagram that the sum of the values for sand, sulphur
and salt of any point within the triangle must be 100, so that it is possible to place anymixture within the triangle. It is also obvious that any two out of the three percentagesare sufficient to fix any particular point. A curve is obtained by plotting a series of pointsand joining them by a line.
To Plot a Solubility Curve on Triple Co-ordinates. A solubility curve on a triple
co-ordinate diagram represents the changes in solubility of one salt in water produced bythe presence of the other salt and vice versa. In Chapters II and III the changes in solubility
were caused by changes in temperature and on a two-component diagram at a definite
temperature, an isotherm, each curve would have been no more than a point. In a triple
co-ordinate diagram a solution saturated with one substance, and with none of the other
substance present, is a point, this being on one of the edges of the figure. On addinga second soluble substance some of it will dissolve and the solubility of the original substance
will be changed. Therefore the composition of the solution will be represented by a new
point, this time within the triangle.
As more and more of the second substance is added a series of new points will be
obtained, thus forming a curve. Hence it will be seen that whereas with one salt and water
an isotherm is a point, with two salts and water isotherms become curves. These isotherms
represent equilibrium between the solid salts and their solutions at one temperature. It
may appear at this stage that such diagrams are too restricted to be of much value. This
is definitely not so, and in any case methods of including temperature changes will be
considered later.
TABLK 7
SODIUM NITRATE . POTASSIUM NITRATE .WATER(From E. Cornec arid H. Krombacli, Caliche, 1928)
Composition of saturated solutions at 50 C.

28 AQUEOUS SOLUTION AND THE PHASE DIAGRAM
Table 7 gives the figures for sodium nitrate and potassium nitrate in water at the
temperature of 50 C. From these figures the diagram, Fig. 8, is plotted as follows :
No NO,
sovc
g/WOg
FIG. 8. NaNCK KNO,. water.
The point L, which is marked on both table and diagram, is the straightforward solu-
bility of pure sodium nitrate in water at 50 C. The figures immediately below this givethe composition of solutions saturated with sodium nitrate but which contain more andmore potassium nitrate. The solutions are not saturated with respect to potassium nitrate.
Thus, in this part of the table, the solid phase is given as sodium nitrate, meaning that if
any solid sodium nitrate is added it will not dissolve. On the other hand, if a small quantityof potassium nitrate is added it will dissolve. Thus if any solid phase is present in equili-
brium with such a solution, that solid must be sodium nitrate.
At the point A the solution has reached that stage when it is saturated with bothsodium and potassium nitrates so that the solid phase is shown as a mixture.
At M the figure given in the table is the straightforward solubility of potassium nitrate
in water at 50 C. The figures immediately above this give the compositions of solutions
saturated with potassium nitrate but which contain more and more sodium nitrate. Suchsolutions are saturated with potassium nitrate but not with sodium nitrate, and the solid
phase is therefore marked as potassium nitrate. Finally, the point A is reached from the
other direction.
Each of the points is plotted from the figures in the table and the points joined to formthe two curves meeting at A. To complete the diagram the point A is joined by a straight
line to the sodium nitrate corner and by another straight line to the potassium nitrate corner.
The figures in Table 7 are given as percentages by weight. The data is expressed as
composition by weight, and it is convenient to make the sum of the three components equalto one hundred, but this is not compulsory as it is equally possible to construct the diagramfrom data in parts per thousand, or in parts of unity, providing each side of the triangle is
taken as being equal to one thousand, or to one, as the case may be.

HOW TO USE TRIPLE CO-ORDINATES 29
In order to give opportunity for experience in plotting this type of diagram the figures
for two more diagrams are given, Table 8 being potassium iodate and potassium iodide,
TABLE 8
KIO3 .KI.H2O AT 25 0.
(From ,lohn E. Ricci, J.A.C.S., 1937, 59, 867)G. per 100 g. of Solution.
TABLE 9
Na2CO3 .K2CO3 .H2O AT 36 C.
(From Arthur E. Hill ami Frederick W. Miller, J.A.C.S., 1927, 49, 682)
Na,CO..
3-5
4-0
4-9
5-7
7-2
9-6
12-9
18-2
21-5
33-2
and Table 9 being sodium carbonate and potassium carbonate. Table 9 is a more compli-
cated case and the diagram should not be plotted until after studying Fig. 14.
Numerous other examples can be found in the literature, especially the Journal of the
American Chemical Society and Zeitschrift fur physikalische Chemie. Many of the examples
given in this book were taken from Caliche, a journal published for the Chilean Nitrate
Association. A very good book containing the solubility data for systems up to the
quaternary is Solubilities of Inorganic and Metal Organic Compounds, Vol. 1, by Atherton
Seidel, 3rd edition, 1940. Other books giving solubility data are Dictionary of Chemical
Solubilities Inorganic, 2nd edition, by A. M. Comey arid D. A. Halm, 1921 ;Landolt-
Bornstein Physikalisch-Chemische Tabellen, 5th edition, 1923-36;and International Critical
Tables of Numerical Data, Physics, Chemistry and Technology (McGraw-Hill), 1926-33.
The reader should be warned that sometimes the data are given in ways which may be

30 AQUEOUS SOLUTION AND THE PHASE DIAGRAM
wrongly interpreted. For example, if expressed as molality it must be remembered that
this means gram-mols. per 1,000 grams of solvent and must not be confused with molaritywhich means gram-mols. per litre of solution.
In the examples so far given in each case the two salts have a common ion. Theyare both salts of the same acid or of the same base. In most cases of three-component
systems consisting of two salts and water, the two salts must have a common ion. Such
an example as sodium nitrate, potassium chloride, and water is not a case of two salts
and water, because by double decomposition both sodium chloride and potassium nitrate
can be formed and the system thus becomes one of more than three components. Such
systems will be considered in a later chapter.

CHAPTER V
HOW TO READ THREE-COMPONENT DIAGRAMS
The Interpretation of a Simple Diagram. The purpose of this chapter is to showhow to read a three-component diagram as a preliminary to its practical application. Anymixture of the two salts and water at a given temperature is represented by a point onthe diagram for that particular temperature, The position of this point shows at a glancewhether the mixture will be liquid or solid or a mixture of both. In addition, its positionindicates the composition of liquid and solid and their proportion.
The mixture of the two salts and water is called a complex, and this must be clearly
distinguished from the term solution. A complex is the complete mixture, whereas thesolution is the liquid which that mixture may contain when the mixture has reached
equilibrium. In some cases the complex will be all liquid, that is, solution;
in others it
will be a solution (liquid) and a solid, the solid being either one of the components or amixture of the two.
The composition of the complex which determines the point must be the percentagecomposition of the whole mixture. Unless something (water or salt) is removed from or
added to the mixture the composition of the complex cannot alter. The mixture may beheated or cooled, thus altering the proportion of solid to liquid, but the composition of the
complex remains fixed, that is, it is represented by a fixed point on the diagram.
Proceeding now to an examination of a diagram, Fig. 8 represents a simple type. In
examining any complex on the diagram the conclusions arrived at assume that the mixturehas been given full opportunity to reach equilibrium between solid and liquid. To effect
this the mixture must have been agitated at the specified temperature for a sufficient lengthof time.
QUALITATIVE. The curves and lines divide Fig. 8 into four areas, referred to as
fields. A complex situated within the field marked"liquid
"is all solution. The three
other fields represent mixtures of solids and liquids as follows :
A complex within the triangular field marked "solution + NaN0 3
"is composed of
some solid sodium nitrate and a solution, the solution being somewhere on the curve LA.A complex in the similar, but opposite, field marked
"solution -f KN0 3
"is composed
of solid potassium nitrate and a solution, the solution in this case being on the curve
MA.A complex within the field marked
"solution A -f NaNO s + KN0 3
"is composed of
a mixture of solid sodium nitrate and solid potassium nitrate together with a solution of
the composition represented by the point A.
In general terms, when the solid phase is fixed the solution is variable within the limits
of the curve bounding the field. Conversely, when the composition of the solution is fixedat the invariant point the solid phase is a mixture of the two salts. In Fig. 8 the point A is
the invariant point.
QUANTITATIVE. A phase diagram, however, goes further than this and indicates the
exact composition of the liquid and solid in any complex. Fig. 8 gives the qualitative
description of the various fields; Fig. 9 is the same diagram marked for the quantitative
31

32 AQUEOUS SOLUTION AND THE PHASE DIAGRAM
50 C
gflOOg
FIG. 9. NaN03 .KN<V water.
examination of points within each of the fields. Point 1 is all liquid and represents an
unsaturated solution. In the example given the composition of this solution is :
sodium nitrate . . . .20%potassium nitrate . . .25%water . . . . .55%
The point L is a saturated solution of sodium nitrate with no potassium nitrate, while M is
a saturated solution of potassium nitrate with no sodium nitrate.
Point 2 is a solution similar to L in that it is saturated with sodium nitrate, but in this
case it also contains some potassium nitrate. The composition of this solution is :
sodium nitrate . . . .48-7%potassium nitrate . . . 20-0%water 36-3%
Point 3 is saturated with potassium nitrate, but containing some sodium nitrate, the
composition being :
sodium nitrate . . . .15%potassium nitrate . . .38%water 47%
The point A is a special case where the solution is saturated with both sodium nitrate
and potassium nitrate. The composition of this solution is given in Table 7.
Any complex on the curves LA or MA can be considered as being within the liquid
field but, being on the boundary of the field, it is saturated with one or other of the salts.
The only fully saturated solution is at point A.
So far the composition of the complex has also given us the composition of the solution
because the complex was all liquid. When the complex is within a field representing both
solid and liquid it is necessary to determine the composition of both solution and solid and

HOW TO READ THREE-COMPONENT DIAGRAMS 33
the proportions of each. Point 4 is within such a heterogeneous field, and its composition is :
sodium nitrate . . . .70%potassium nitrate . . .6%water 24%
but this is partly liquid and partly solid. The composition of the solid is known, this beingsodium nitrate.
It must be remembered that the composition of the complex does not alter, since
nothing is added or taken away, but the composition of the liquid is different from that of
the complex in the sense of having lost some sodium nitrate. The composition of the liquid
therefore, lies on a straight line joining the complex (point 4) to NaN0 3 ,and it is on that
part of the line away from NaNO 3 because the sodium nitrate has been removed from the
liquid. This is shown on the diagram by the dotted line joining point 4 to NaNO 3 ,this
line being produced beyond 4 to meet the curve LA at x. The point x gives the compositionof the solution which is seen to be :
sodium nitrate . . . .48-5%potassium nitrate . . . 10-0%water 41-5%
100-0%
Having established the composition of the liquid and of the solid in a complex at the
point 4, it remains to determine the amount of solid and liquid. As much which follows
is based on the method now to be described, part of Fig. 9 has been reproduced on a larger
scale in Fig. 10.
The distance between x and NaNO 3 is divided into two parts by the point 4. Thedistance between x and 4 represents solid and the distance between NaN0 3 and 4 represents
liquid. It will be noticed that the divisions of the line representing solid and liquid are
reversed in their proximity to the solid and liquid which they represent. Thus the lengthbetween x and 4 is near the liquid but represents solid. This is obvious when it is realized
that as a complex approaches nearer to the liquid the amount of solid becomes less and less
until it eventually disappears when the complex coincides with x.
The distances under consideration can be measured by inspection in terms of the scale
of the diagram. This is demonstrated in Fig. 10 and the distances are marked on the
diagram. These are :
x to 4 . . . .21-5 units of solid
NaN0 3 to 4 . . 30-0 units of liquid
total. . . . .51-5 units of complex.
The above figures are brought to percentages by proportion :
51-5 parts of complex contain 21-5 parts solid, 30 parts liquid
100 ,, 41-7 ,, ,, 58-3 parts liquid.
In the absence of a lattice on the diagram the distances may be measured on anyconvenient scale as it is the proportion only that is required.
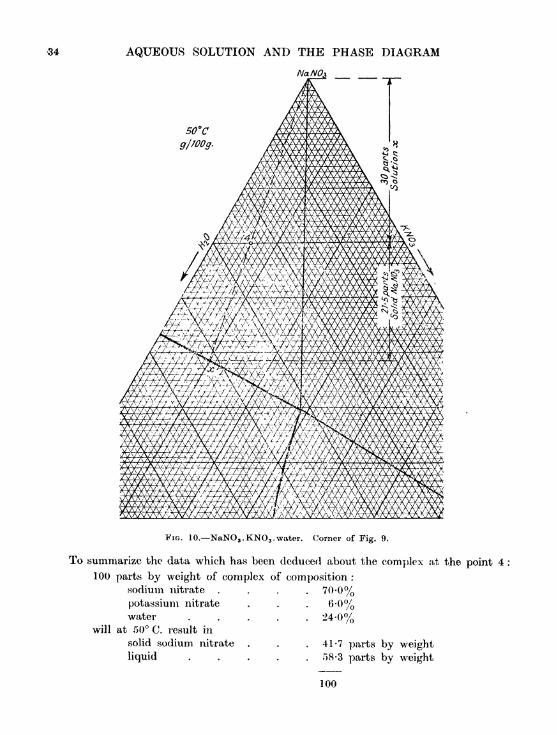
34 AQUEOUS SOLUTION AND THE PHASE DIAGRAM
NaNO*
50Cg/WOg.
FIG. 10. NaNO 8 .KNO3 .water. Corner of Fig. 9.
To summarize the data which has been deduced about the complex at the point 4 :
100 parts by weight of complex of composition :
sodium nitrate . . . .70-0%potassium nitrate . . . 6-0%water ..... 24-0%
will at 50 C. result in
solid sodium nitrate . . . 41-7 parts by weightliquid . . . . .58-3 parts by weight
100
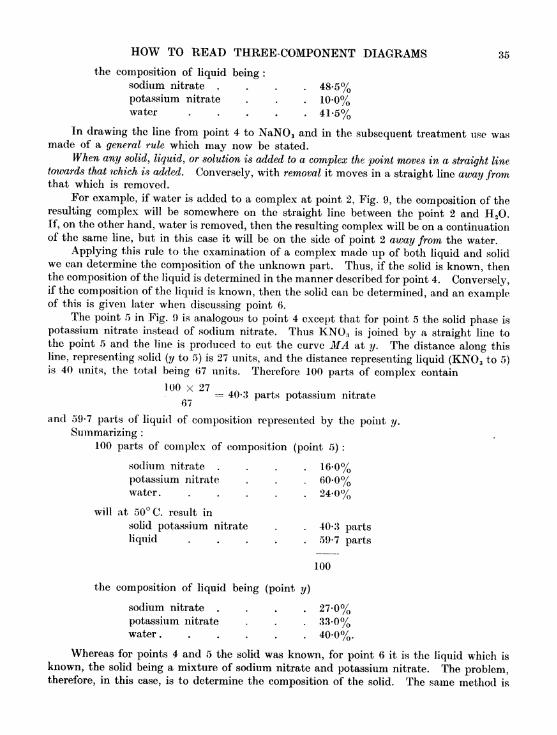
HOW TO READ THREE-COMPONENT DIAGRAMS 35
the composition of liquid being :
sodium nitrate .... 48-5%potassium nitrate . . . 10-0%water 41-5%
In drawing the line from point 4 to NaN0 3 and in the subsequent treatment use wasmade of a general rule which may now be stated.
When any solid, liquid, or solution is added to a complex the point moves in a straight line
towards that which is added. Conversely, with removal it moves in a straight line away fromthat which is removed.
For example, if water is added to a complex at point 2, Fig. 9, the composition of the
resulting complex will be somewhere on the straight line between the point 2 and H 2O.If, on the other hand, water is removed, then the resulting complex will be on a continuationof the same line, but in this case it will be on the side of point 2 away from the water.
Applying this rule to the examination of a complex made up of both liquid and solid
we can determine the composition of the unknown part. Thus, if the solid is known, thenthe composition of the liquid is determined in the manner described for point 4. Conversely,if the composition of the liquid is known, then the solid can be determined, and an exampleof this is given later when discussing point 6.
The point 5 in Fig. is analogous to point 4 except that for point 5 the solid phase is
potassium nitrate instead of sodium nitrate. Thus KNO 3 is joined by a straight line tothe point 5 and the line is produced to cut the curve MA at ?/. The distance along this
line, representing solid (y to 5) is 27 units, and the distance representing liquid (KN0 3 to 5)is 40 units, the total being 67 units. Therefore 100 parts of complex contain
100 x 27 = 40-3 parts potassium nitrate67
and 59-7 parts of liquid of composition represented by the point y.
Summarizing :
100 parts of complex of composition (point 5) :
sodium nitrate .... 16-0%potassium nitrate . . . 60-0%water. ..... 24-0%
will at 50 C. result in
solid potassium nitrate . . 40-3 parts
liquid . . . . .59-7 parts
100
the composition of liquid being (point y)
sodium nitrate . . . .27-0%potassium nitrate . . . 33-0%water 40-0%.
Whereas for points 4 and 5 the solid was known, for point 6 it is the liquid which is
known, the solid being a mixture of sodium nitrate and potassium nitrate. The problem,therefore, in this case, is to determine the composition of the solid. The same method is

36 AQUEOUS SOLUTION AND THE PHASE DIAGRAM
used as for points 4 and 5, but the line is drawn from the known solution, point A, throughthe complex, point 6, instead of from the known solid. This line is produced atvay fromA (because A is removed from the solid part) to meet the right-hand outside edge of the
triangle at z. The proportion of liquid and solid is determined by measuring the distances
between z and 6, this representing liquid, and between A and 6, this representing solid.
In Fig. these distances are :
A to 6 = 19-5 units of solid
z to 6 12-0 units of liquid
in 31-5 units of complex,
therefore 100 parts of complex contain 62-0 parts of solid and 38-0 parts of liquid.
The composition of the liquid is read on the diagram at A and the composition of the solid
is seen at a glance at z.
Summarizing :
100 parts of complex of composition (point 6)
sodium nitrate . . . .47-0%potassium nitrate . . . 41-0%water 12-0%
will at 50 C. result in
liquid . . . . .38-0 parts
solid . . . . . .62-0 parts
100
the composition of liquid being (point A)sodium nitrate . . . .39-8%potassium nitrate . . . 28-9%water 31-3%
and the composition of solid being (point z)
sodium nitrate . . . .51-5%potassium nitrate . . . 48-5%water . . . . .nil.
The Interpretation of a Diagram with Double Salts (Intermediate Compounds).The simple diagram so far studied concerns cases where no combination takes place between
the two salts, the only solids being the components, either in the pure state or as a mixture.
In some cases the two salts combine to form definite compounds or double salts. For
example, under certain conditions potassium sulphate and sodium sulphate combine to
form glaserite, 3K 2SO 4 .Na 2SO 4 ,a compound containing 78-6% potassium sulphate and
21-4% sodium sulphate. This is a definite compound and not just a mixture. In the
simple case there are only two fields where pure substance is in contact with solution. With
the formation of a double salt a third field containing a pure substance makes its appearance,
in this case the field of glaserite and solution. It will be easier to consider this by passing
directly to the diagram.

HOW TO READ THREE-COMPONENT DIAGRAMS
TABLE 10
SODIUM SULPHATE . POTASSIUM SULPHATE . WATEB(From E. Cornec and H. Krombach, Caliche, 1928)
Composition of saturated solutions at 50 C.
37
Solid Phase
K 2S04
K2SO4 + Glaserite
Na2SO4 + GlaseriteNa8SO4
Glaserite is 3K2SO4 . NaaSO4 and contains 78-6% K2SO4 , 21-4% Na2SO4 .
Table 10 gives the figures for plotting the diagram for potassium sulphate, sodiumsulphate and water at 50 C., and Fig. 11 is the diagram. Although a third salt, glaserite,has been introduced the system is still one of three components, two salts and water, because
50 C
g/WOg
G=G/asenteFIG. 11. K 2SO 4 .Na 2SO 4 . water.
any point in the diagram can be expressed in terms of the two simple sulphates and water,as seen in Table 10. The reader should compare Fig. 11 with Fig. 9. The difference is thatinstead of one point A we have two similar points A and B with a curve between them.The liquid field, bounded by the lines and curves between H 2O, L, A, B and M , and thetwo fields marked "
solution + K 2S0 4
" and "solution f Na 2S0 4
"are similar in all
respects to those already considered in the case of Fig. 9 and may be examined both
qualitatively and quantitatively in the manner already described.
The additional fields in Fig. 1 1 are defined by first marking the composition of glaserite
by a point on the line between potassium sulphate and sodium sulphate. The points A and
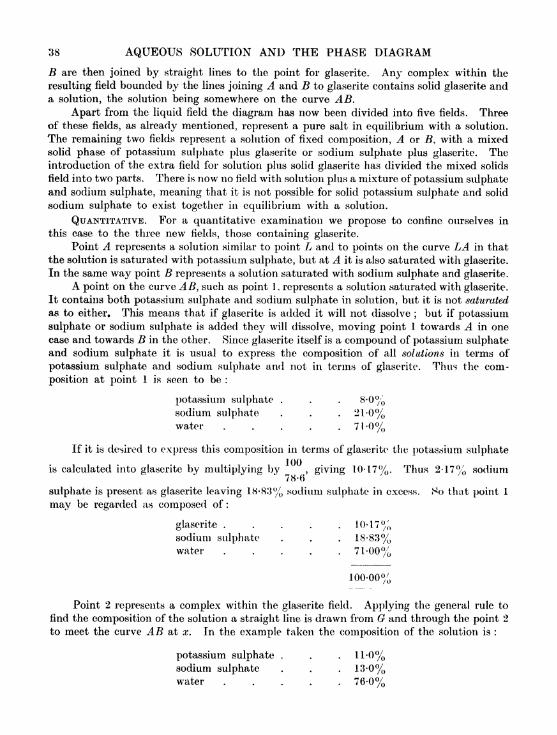
38 AQUEOUS SOLUTION AND THE PHASE DIAGRAM
B are then joined by straight lines to the point for glaserite. Any complex within the
resulting field bounded by the lines joining A and B to glaserite contains solid glaserite anda solution, the solution being somewhere on the curve AB.
Apart from the liquid field the diagram has now been divided into five fields. Three
of these fields, as already mentioned, represent a pure salt in equilibrium with a solution.
The remaining two fields represent a solution of fixed composition, A or B, with a mixedsolid phase of potassium sulphate plus glaserite or sodium sulphate plus glaserite. Theintroduction of the extra field for solution plus solid glaserite has divided the mixed solids
field into two parts. There is now no field with solution plus a mixture of potassium sulphateand sodium sulphate, meaning that it is not possible for solid potassium sulphate and solid
sodium sulphate to exist together in equilibrium with a solution.
QUANTITATIVE. For a quantitative examination we propose to confine ourselves in
this case to the three new fields, those containing glaserite.
Point A represents a solution similar to point L and to points on the curve LA in that
the solution is saturated with potassium sulphate, but at A it is also saturated with glaserite.
In the same way point B represents a solution saturated with sodium sulphate and glaserite.
A point on the curve AB, such as point 1 , represents a solution saturated with giaserite.
It contains both potassium sulphate and sodium sulphate in solution, but it is not saturated
as to either. This means that if glaserite is added it will not dissolve;but if potassium
sulphate or sodium sulphate is added they will dissolve, moving point 1 towards A in one
case and towards B in the other. Since glaserite itself is a compound of potassium sulphateand sodium sulphate it is usual to express the composition of all solutions in terms of
potassium sulphate and sodium sulphate and not in terms of glaserite. Thus the com-
position at point 1 is seen to be :
potassium sulphate . . . 8-0%sodium sulphate . . . 21-0%water 71-0%
If it is desired to express this composition in terms of glaserite the potassium sulphate100
is calculated into glaserite by multiplying by , giving 10-17%. Thus 2-17% sodium78*6
sulphate is present as glaserite leaving 18-83% sodium sulphate in excess. So that point 1
may be regarded as composed of :
glaserite . . . . .10-17%sodium sulphate . . . 18-83%water 71-00%
100-00%
Point 2 represents a complex within the glaserite field. Applying the general rule to
find the composition of the solution a straight line is drawn from G and through the point 2
to meet the curve AB at x. In the example taken the composition of the solution is :
potassium sulphate . . . 11-0%sodium sulphate . . . 13-0%water 76-0%

HOW TO READ THREE-COMPONENT DIAGRAMS 39
The relative amounts of solution and solid are determined by the method described on
page 33. .That is, the distance from to 2 represents solution, whereas the distance # to 2
represents solid. Measuring along the scale of the lattice these distances are :
G to 2 = 41 units representing solution
2 to x 35 units representing solid
total 76 units representing complex.
Therefore 100 parts by weight of complex (point 2)
contain 54-0 parts by weight of solution (point x)
and 46-0 parts by weight of solid (glaserite).
Point 3 represents a complex in a field of mixed solids and solution, the two solids being
potassium sulphate and glaserite. The composition of the solution is seen at a glance,
being represented by the point A. The composition of the solid is found by drawing a line
from the point of known liquid, A, through point 3 to meet the right-hand outside edge of
the triangle at y. The point y then indicates the composition of the mixed solids. This
is usually expressed in terms of potassium sulphate and sodium sulphate :
potassium sulphate . . .88%sodium sulphate . . .12%
but it must be noted that there is no free sodium sulphate, all the sodium sulphate being
present as glaserite.
The proportion of liquid and solid is determined by measuring the distances between
y and 3 (representing liquid) and between A and 3 (representing solid). These are 25-0 and
55-52 units of the lattice respectively.
Point 4 is treated in a way exactly similar to that for point 3, the solution being at Band the mixed solids being represented at z, a mixture of glaserite and sodium sulphate.
The system just studied includes an example of a solution which has the same com-
position as the double salt but which is not in equilibrium with it. W. Meyerhoffer, 1897,
refers to this as an incongruently saturated solution. Tii Fig. 1 1 a mixture of glaserite, with
just sufficient water to dissolve it, gives a saturated solution represented by the point
where the straight line from glaserite to H 2O cuts the curve LA. This solution is incon-
gruent because the only solid phase with which it could be in equilibrium is not glaserite
but potassium sulphate. With slightly less water the solution point would move towards
A but the solid phase would still be potassium sulphate. With still less water the solution
would remain at A while the solid phase moved from K 2SO 4 towards glaserite, only becoming
glaserite when there was no water. Conversely, the least drop of water decomposes glaserite
into a mixture of glaserite and potassium sulphate. This use of the word incongruent
should be compared with its similar use on p. 16 and later on p. 102.
The Interpretation of a Diagram with Hydrate. When one of the salts of a three-
component system forms a hydrate there are two possibilities : the anhydrous salt may
disappear completely from the system or both hydrated and anhydrous salt may be found
in different parts of the system. By taking sodium sulphate as an example both cases
may be illustrated. Sodium sulphate combines with water to form the decahydrate,
Na 2S0 4 . 10H 20, commonly known as Glauber's salt. In equilibrium with water and sodium
chloride the anhydrous sulphate is completely absent at 17-5 C. At 25 C., on the other
hand, both the decahydrate and the anhydrous sulphate are found. Tables 11 and 12

40 AQUEOUS SOLUTION AND THE PHASE DIAGRAMNaCL
ZSC9 I'OOg
HyO
FIG. 12. NaCl. Nft 2SO4 . water.
give the data for these two systems. Table 11, at 25 C., will be taken first and Fig. 12 ig
the diagram,TABLE 11
SODIOM CHLORIDE . SODIUM SULPHATE .WATER(From A. Chretien, Caliche, 1926)
Composition of saturated solutions at 25 C.
Na2S04 .10HaO -44-4% Na2SO4 , 55-9% H2O.
TABLE 12
SODIUM CHLORIDE. SODIUM SULPHATE . WATER(From A. Chretien, Caliche, 192G)
Composition of .saturated solutions at 17-5" C.

HOW TO READ THREE-COMPONENT DIAGRAMS 41
In this diagram there is a possibility of three different salts being obtained in the solid
state, sodium chloride, sodium sulphate decahydrate and anhydrous sodium sulphate.This compares with Fig. 11 and there are the same number of fields, six, in each case. The
only difference is that the extra compound, in this case the decahydrate, is represented bya point on the edge between water and sodium sulphate instead of being between the twosalts.
The four fields marked "liquid,"
"solution -f Nad,"
4tsolution f 8 " and "
solution A+ NaCl + S" are so similar to previous examples that no further explanation is required.
On the diagram NaSO 4 is marked S and Na 2S0 4 .10H 2 is marked $10 for convenience.
In the field marked "solution -f 810
"any complex will contain a saturated solution
of the decahydrate and some solid decahydrate. Such a complex is examined in the usual
NaCl
FIG. 13. NaCl.Na2SO 4 water.
way by drawing a line from the point of known solid, Na 2SO 4 . 10H 2O, through the complexto meet the curve EM. The ratio of the two parts of this line then gives the proportion
of solid decahydrate to solution.
In the remaining field, marked "solution B + S -f 10," any complex will contain
a solution of composition B and a mixture of the two solids, anhydrous and decahydrate.
The solution B is saturated with respect to both of these compounds, implying that it is
incapable of dissolving any more of either of them. The proportion and amount of the
two solids is determined by applying the general rule of drawing a straight line from the
point B, of known solution, through the complex to meet the edge of the triangle between
Na 2SO 4 .10H 2 and Na 2S0 4 . Where this line meets the edge of the triangle is the
composition of the mixed solids being expressed in terms of sodium sulphate and water,
remembering, however, that the water content is really present in combination with some
of the sodium sulphate as decahydrate. For this latter reason it may sometimes be necessary
to express the composition in terms of anhydrous and hydrate. This is done by calculating
the amount of sodium sulphate which will combine with the amount of water found.

42 AQUEOUS SOLUTION AND THE PHASE DIAGRAM
Fig. 13 is the diagram, plotted from Table 12, showing that, at 17-5 C., the anhydrousfield found in Fig. 12 has disappeared. The peculiarity about this diagram is that after
plotting the curves and drawing the lines in the manner hitherto described one is left with
a quadrilateral area between Nad, Na 2S0 4 ,Na 2SO 4 .10H 2 and A. To complete the
diagram this area must be divided into two triangular fields by the line joining NaCl to
Na 2S0 4 .10H 2O.
Any complex within the field marked "solution A + NaCl -f Na 2S0 4 . 10H aO
"contains
a solution of known composition, A, and a mixture of the two solids, sodium chloride and
Glauber's salt. Solution A is saturated with respect to these two salts. In ascertaining
the composition of the mixed solids the line drawn from A through the complex must be
produced only as far as the line joining NaCl to Na 2SO 4 . 10H 2O. The point obtained on
this line gives directly the proportion of sodium chloride and Glauber's salt.
The field marked "solid
"introduces a new aspect ; any complex within this field
contains no liquid, being a mixture of the three solids, sodium chloride, sodium sulphate
anhydrous and sodium sulphate decahydrate. This may cause the reader to object to the
earlier statements which said that the anhydrous salt had completely disappeared. That
statement was meant to imply that the field of the pure anhydrous salt had disappeared.The remaining fields of Fig. 13 are so much like those already examined that no further
details are given here.
NaN03
25 C
NaA/Oj+ Solution
H2O
D = Darapski tc No. A/Oj Na 2$04 H2FIG. 1 4. NaNO3 . Na2SO 4 . water.
A More Complicated Diagram. Table 13 contains figures for the system sodium
nitrate, sodium sulphate and water at 25 C., and Fig. 14 is the phase diagram plottedfrom this data.
It is not proposed to deal with this in detail as the composition of each field is marked
on the diagram. Thus there is a simple hydrate, Na 2S0 4 . 10H 20. There is a double salt,
but in this case the double salt is also a hydrate, NaNO 3 .Na 2S0 4 .H 2O (darapskite). There
is also a solid field containing sodium nitrate, sodium sulphate and darapskite.

HOW TO READ THREE-COMPONENT DIAGRAMS
TABLE 13
SODIUM NITRATE . SODIUM SULPHATJS.WATER(From A. Chretien, Caliche, 1926)
Composition of saturated solutions at 25 C.
Darapskite is NaNO3 .Na 2SO4 .H 2O and contains 34-6% NaNO3 , 58-0% Na2S() 4 , 7-4% H2O.
Acids and Bases instead of Salts. Thus far the mixtures considered have been of
two salts and water. The same methods are applicable when, instead of salts, the two"substances
"are acid and base, as, for example, calcium oxide (CaO) and phosphorus
P2 5
CaO
FIG. 15. P 2O 6 . CaO. water.
pentoxide (P a 5 ). Table 14 gives the figures for calcium oxide and phosphorus pentoxideand Fig. 15 is the diagram. The data given is not complete but is sufficient to illustrate
this type of diagram.

44 AQUEOUS SOLUTION AND THE PHASE DIAGRAM
TABLE 14
PHOSPHORIC ANHYDRIDE. CALCIUM OXIDE.WATER(Adapted from H. Bassott, Z. anorg. Chem., 1908, 59, 1-55)
Composition of saturated solutions at 25 C.
CaH4P2O 8 .H2O contains 56-4% P2O 5 , 22-2% CaO.CaHPO4 52-2% P aO 6 , 41-1% CaO.Ca3P 2 8 .H2 43-3% P
2O 6 , 51-2% CaO.
In a case such as this there is always at least one intermediate compound, not a double
salt as already encountered, but a compound of the two radicals. With calcium oxide
and phosphorus pentoxide there are three well-known intermediate compounds, tricalcium
phosphate (Ga s(PO 4 ) 2 . H 2O), calcium phosphate (CaHPO 4 ), and acid calcium phosphate
(Ca(H 2PO 4 ) 2 .H 2O). It is because of this type of diagram that it is preferred to use the
term intermediate compound rather than double salt. Thus in Fig. 13 glaserite was an
intermediate compound.The diagram is interpreted in the usual way, remembering that all compositions are
in terms of calcium oxide and phosphorus pentoxide.
It will be noticed that the field of tricalcium phosphate and solution is so narrow that
it can only be represented by a line on the diagram instead of the usual triangular area.
Likewise the field for calcium hydroxide is also represented by a line only and this line lies
on the bottom edge of the diagram.In the upper part of the diagram the curve is incomplete. If it could be completed
the curve would meet the left-hand edge of the triangle at a point representing the solubility
of phosphorus pentoxide in water at 25 C.
In practice interest is usually centred around the intermediate compounds and it is
not then necessary to know how the curves meet the edges of the triangle. In any case it
is often very difficult to obtain the data experimentally for the extremities.
CHAPTER VI
PRACTICAL APPLICATION OF THREE-COMPONENT DIAGRAMS
The most frequent application of three-component diagrams is for the productionof a salt in a pure state. From the previous chapter it will be realized that to achieve
such an object a complex must ultimately be obtained within the field of the salt required.
This salt may be one of the two main salts of the diagram or a hydrate of one of them or
a double compound of the two salts, which might itself be a hydrate. If the complex does
not naturally lie within the correct field, then one or more operations must be performedto cause it to move into that field. The means available for bringing about such a changeare :
(a) removing water (evaporation),
(6) adding water (dilution),
(c) adding one of the salts (but naturally never the one required),
(d) altering the temperature.In complicated cases several of these operations may be combined. The removal or addition
of water or the addition of one of the salts moves the position of the complex on the diagram.On the other hand, change of temperature does not alter the position of the complex but
changes the configuration of the diagram so that a given field may be altered to embracethe complex.
Before proceeding to study the effects of the above four operations it is necessary to
understand something of the nature of precipitation.
Precipitation. As an example of precipitation suppose calcium acid phosphate,CaH 4P 2O 8 .H 2O is to be prepared. It might appear at first that the method would be to
add the chemical equivalent of lime to a solution of phosphoric acid. A mere glance at the
three-component diagram is sufficient to show that such proportions will not precipitatethe desired compound.
The diagram required has already been given, Fig. 15. This shows that calcium acid
phosphate when precipitated will be in the form of its monohydrate, having the following
composition :
CaO . . . 22-2%P 2 5 . . 56-4%water . . . 21-4%
If lime and phosphoric acid are taken in the proportions to form calcium acid phosphatethen, no matter how much water is present, the mixture (complex) will be somewhere on
the straight line joining the point water to the point marked CaH 4P 2O 8 .H 2O. No part of
this line lies within the field of solid CaH 4P 2 8 . H 2O and solution. It is, therefore, impossibleto take such a complex and obtain precipitated calcium acid phosphate. The actual result
would be for neutral calcium phosphate, CaHPO 4 ,to be precipitated, while the solution
would be enriched in phosphoric acid.
The only way to precipitate calcium acid phosphate is to have less lime than the chemical
equivalent so that the complex may come within the field CaH 4P 2 8 .H 2O -f solution.
In a similar way double salts (intermediate compounds such as darapskite
45

46 AQUEOUS SOLUTION AND THE PHASE DIAGRAM
(NaN0 3 .Na 2SO 4 .H 20)) cannot generally be prepared by mixing the two salts in
stoicheiometrieal proportions. It is usually necessary to have one or the other in excess.
For example, Fig. 14 shows that to prepare darapskite there must be an excess of
sodium nitrate.
Evaporation and Dilution. To revert to the methods used for moving a complexinto the desired field evaporation and dilution will be considered first. On removing water,
e.g. by evaporation, the composition of the complex moves in a straight line on the diagramaway from the corner marked H 20. On the other hand, on adding water to a complex the
composition of the complex moves in a straight line on the diagram towards the corner
marked H 2O. It is, therefore, an easy matter to see whether adjustment of the watercontent will bring the complex within the required field or not.
As an example, take the case of sodium nitrate and potassium nitrate at 50 C., Fig. 9.
Suppose the original complex is a solution containing 10% sodium nitrate and 30% potassiumnitrate. This solution on evaporation of water will give potassium nitrate in the solid phasebecause a straight line from the corner H 2O to the complex, when produced, passes into the
potassium nitrate field.
In order to obtain as high a yield of solid potassium nitrate as possible the solution
may be evaporated until the complex reaches the point where the line of evaporation meetsthe line joining A to KNO 3 . This complex will be seen on inspection to be 21% sodium
nitrate, 63% potassium nitrate and 16% water, some of the potassium nitrate being presentas solid. If evaporation is carried beyond this point a mixture of sodium nitrate and
potassium nitrate will be obtained.
To take another example, of the opposite kind, suppose the original complex is a
mixture of solids and liquid containing 30% sodium nitrate and 60% potassium nitrate.
It is required to obtain pure potassium nitrate. An inspection of the diagram (assuminga temperature of 50 C.) shows that the original complex contains both sodium nitrate
and potassium nitrate in the solid phase. The eifect of dilution is seen by drawing a straightline from the complex to H 2O. This line passes through the potassium nitrate field so that
by adding sufficient water to bring the complex within this field pure potassium nitrate
can be obtained. Actually what happens is that the added water dissolves all the sodiumnitrate but only part of the potassium nitrate.
The maximum yield of potassium nitrate will be obtained if only just sufficient water
is added to bring the complex to the point where the line of dilution cuts the line joiningA to potassium nitrate. This is where the complex has the composition 26% sodium
nitrate, 53% potassium nitrate, and 22% water.
To summarize : the effect of evaporation and dilution may be seen on a diagram bydrawing a straight line from the corner representing water through the complex under
consideration. With evaporation the complex moves along this line away from water;
with dilution it moves along the line towards water.
In the examples given the complex was such that the evaporation dilution line passed
through the required field. If this had not been so then a simple operation of dilution or
evaporation would not be sufficient to give solid potassium nitrate. We shall revert to
this later.
An example of the phase reactions which take place during the removal of water
without change of temperature will now be considered in detail using Fig. 9. The complex,which is an unsaturated solution, is represented by the point a. During the removal of
water the point representing the complex moves from a towards the curve MA, and when

PRACTICAL APPLICATION OF THREE-COMPONENT DIAGRAMS 47
it reaches this curve the complex is a solution saturated as to KN0 3 and the solid phaseKN0 3 may be considered as just having appeared.
The system has gained a phase, so it has lost a degree of freedom. Thus, during the
further removal of water, the composition of the solution is fixed by nature as some pointon the curve MA. (See page 35, point 5.)
The further removal of water now causes the composition of the complex to move in
the same straight line from the curve towards b, during which time the point representingthe solution, saturated as to KN0 3 ,
but not saturated as to NaNO n , moves along the curvetowards A. During this period of change the solid phase is KN0 3 in equilibrium with asolution of varying composition along part of the curve MA. When the composition of
the complex arrives at b the composition of the solution is at A arid is saturated as to
both salts.
This system has now gained another phase and so lost another degree of freedom, andwith the further removal of water the composition of the solution cannot change.
If the removal of water is continued the composition of the solution will be unchanged.The composition of the complex will continue to move along the line H 3O d and, after
leaving b, will be at a point on the line between /; and d. A line drawn from A throughthis point between b and d will meet the NaNO 3 KNO 3 side of the triangle somewherebetween d and KN0 3 and will represent the composition of the mixed solid phase at that
stage of the evaporation. The composition of the mixed solids being deposited, while
water is being removed from solution A, is represented by c, on the side of the triangleand c represents the same composition as A dried up.
The composition of the mixed solids deposited during the whole of the evaporation of
the solution represented by a will be found at d. Thus A is the drying-up point of the
system at 50 C., and any solution point in the liquid field or on either of the curves will
move along one of the curves to A if sufficient water is removed. Further evaporation will
cause the solution to dry up at composition A. This means that down to the last trace
the liquid has composition A but the solid deposited has composition c.
The addition of water to the solid complex d, at 50 C., would have resulted in the
same phase reaction but in the reverse order. The removal of water causes the compositionof solutions to move along the curve towards the isothermal invariant point, and it is usual to
denote this by arrow heads on the curves. The reason for this will be evident at a later stage.The phase reactions caused by the isothermal removal of water from a complex which
can form a double salt is somewhat different from the simple case just considered. Fig. 11
which has already been studied is the isotherm at 50 C. representing K 2S0 4 , Na 2S0 4 andwater. If a line is drawn from 0, which represents the composition of glaserite, to water,it will be noticed that the invariant points A and B are both on the same side of this line
and are in the triangle H 2 Na2S0 4 .
The point B represents a solution saturated as to Na 2S0 4 and glaserite and the solution
may be represented in terms of these two salts and water. The solution is, therefore, said
to be congruently saturated. The point A, on the other hand, is saturated as to K 2SO 4
and glaserite and cannot be represented in positive terms of K 2S0 4 , glaserite and water ;
this solution is incongruently saturated. In other words, the line drawn from glaserite to
water does not cut the curve AB representing solutions saturated as to glaserite, so glaserite
is decomposed by water.
If sufficient water is added to glaserite the complex would be an unsaturated solution,
that is, a point on the line from H 2O to O but within the all-liquid field. If water is

48 AQUEOUS SOLUTION AND THE PHASE DIAGRAM
evaporated from this solution without change of temperature the point representing the
complex will move towards the curve LA and, on meeting the curve, the solution will be
saturated as to K 2S0 4 only.
If the evaporation is continued the point representing the complex will move still
nearer to and will cut the line from A to K 2S0 4 during which time the solution point will
have moved to A, while K 2S0 4 was being deposited as the solid phase.When the solution point is at A a new phase, glaserite, has just appeared, and on
the further evaporation of water the solution will remain at A, K 2S0 4 will dissolve and
glaserite will be deposited. This will continue until all the K 2S0 4 has been converted
to glaserite and the solution will dry up at composition A. The solid phase becomes all
glaserite only when solution A has dried up. The point A is the drying-up point of all
solutions within the system K 2S0 4 . glaserite. water.
The unsaturated solution which has just been considered was represented by a pointon the line from the water corner to G. If a small amount of Na 2SO 4 was added to this
solution it would be represented by a point still within the all-liquid field. The removal
of water from this solution will cause the point representing the complex to move along a
new line, a line from H 2O, through the new point and produced to meet the K 2S0 4 Na 2S0 4
side of the figure at a point near G but on the Na 2SO 4 side of it. When the point repre-
senting the complex meets the curve LA the solution is saturated as to K 2S0 4 and the
removal of more water causes the point representing the complex to cross the K 2S0 4 field
and meet the line K 2SO 4 A. During this time the point representing the solution has
moved along the curve LA to A, and K 2S0 4 has been deposited as solid phase.At the point A a new solid phase, glaserite, appears, so the system, i.e. the complex,
has lost a degree of freedom and the solution must remain at A as long as there are two
solid phases present. The continued removal of water causes the K 2SO 4 to dissolve and
glaserite to be deposited. The point representing the complex crosses the mixed field of
K 2S0 4 and glaserite, K 2S0 4 dissolves, glaserite is deposited and the composition of the
solution remains at A. This statement may be proved geometrically on the diagram bydrawing a line from H 2O through A and producing to a point within the figure to represent
the removal of water, then from the point selected by drawing a line towards K 2SO 4
to represent the dissolving of K 2S0 4 . This line will cut the line GA which represents the
removal of glaserite. Thus from the point A water was removed, K 2SO 4 added and glaserite
removed without changing the position of A.
To return to solution A, when sufficient water has been removed all the K 2SO 4 will
have been converted to glaserite and, as the phase K 2SO 4 has disappeared, a degree of
freedom has been gained. On the removal of more water the solution point will move from
A and along the curve towards B. The point representing the complex will cross the
glaserite field during which time glaserite only is the solid phase. When the point repre-
senting the complex meets the line EG the solution will be at B and a new phase Na 2S0 4
will have just appeared. Arrowheads, if shown on the curves, would load to the point B, the
congruently saturated drying-up point. The removal of still more water causes the point
representing the complex to cross the mixed field of glaserite and Na 2SO 4 ,but solution B is
unchanged in composition. The compositions of solution B and of the mixed solid phase
being deposited, during this period of the evaporation, are the same. Solution B finally
dries up at composition B and the total solids have the same composition as the original
solution with water removed. The points A and B are both drying-up points but B is the
final or system drying-up point.

PRACTICAL APPLICATION OF THREE-COMPONENT DIAGRAMS 49
An example of a hydrated double salt is given in Fig. 14, when the salt darapskiteappears. A solid phase of this type, when encountered in a ternary system, is called a
ternary compound because it can only be represented in terms of all three components.The point A represents a congruently saturated solution, B an incongruently saturatedsolution and the double salt darapskite is decomposed by water. The reader should findno difficulty in following the phase reactions when water is added to, or removed from,a complex represented on this figure.
Before leaving the question of dilution, attention must be called to a special kind ofdilution which often occurs in practice, that is, dilution with another solution, or even witha solid. For example, on Fig. 9, if the complex 30% sodium nitrate, 60% potassium nitrate
(point e) is diluted with a solution of potassium nitrate containing say 20%, the result ofsuch dilution will be on the line joining the original complex point e to the point representing20% potassium nitrate, 80% water.
Addition of a Salt. It will be obvious that dilution of a complex by adding a solid
salt will move the complex along the line joining the original complex to the point repre-
senting the solid. The phase reactions caused by such addition will now be considered in
detail, using Fig. 11. The complex represented by the point w is a system of one salt andwater, a binary system, and these remarks apply also to a similar point on the K 2SO 4 .H 2Oside of the triangle If some K 2SO 4 is added to complex w, the K 2SO 4 dissolves and the
point representing the solution will be 011 the curve MB and the system is 110 longer binarybut ternary. As more K 2S0 4 is added and time allowed for equilibrium, the point repre-
senting the solution will move along the curve towards B arid will be at B when sufficient
K 2SO 4 has been added and the point representing the complex is on the line from B to
Na 2SO 4 . At B the solution is saturated as to Na 2S0 4 and glaserite, the glaserite phasehaving just appeared. The system has gained a phase, so it has lost a degree of freedomand B is an isothermal invariant point.
If more and more K 2SO 4 is added the point representing the complex moves nearerto K 2SO on the line w~K 2SO 4 and crosses the field of mixed solid phases, Na 2S0 4 and
glaserite, but the point representing the solution remains at B. During this time Na2SO 4
and K 2SO 4 are going into solution and glaserite is being deposited.When the point representing the complex meets the line from B to glaserite the solution
point is still B, but the solid Na 2S0 4 may be considered as having just dissolved. Theaddition of more K 2SO 4 now causes the point representing the solution to leave B andmove along the curve BA. The system has lost a phase, Na 2SO 4 ,
and therefore gained a
degree of freedom, so, in addition to temperature, a concentration may be selected. Whilethe solution point moves on the curve towards A, on the addition of more K 28O 4 ,
the pointrepresenting the complex crosses the glaserite field and the solid phase formed is all glaserite.When this point meets the line from A to glaserite the composition of the solution is at Aand a new phase, K 2SO 4 , has just appeared. The system has regained a phase, thoughnot the same phase, and has therefore lost the degree of freedom it gained when the solution
point left B.
The point A is an isothermal invariant point and solution A is saturated as to glaseriteand K 2SO 4 . The addition of more K 2SO 4 will cause 110 further change in the compositionof this solution.
Two examples of double salts in a ternary system have been given and some of their
phase reactions have been studied. Before leaving this subject it should be mentionedthat another type of double salt exists where the double salt is not decomposed by water.
50 AQUEOUS SOLUTION AND THE PHASE DIAGRAM
These double salts may be anhydrous or hydrated, but their saturation curves lie in such
a position that the line drawn from water to the composition of the double salt cuts the
saturation curve and divides the ternary system into two other ternary systems. Eachof these systems then contains a ternary invariant point congruently saturated as to double
salt and one of the single salts. The dividing line becomes a binary system, the double
salt and water, and the whole system contains three congruent drying-up points. Anexample of a hydrated double salt of this type is ammonium ferrous sulphate and an
anhydrous example is in the system (NH 4 ) 2S04.Li 2SO 4 . water at 30 C. (Schreinemakers,Zi. physik. Chem., 1907, 59, 641.) The subject of double salts is an extensive one and it is
possible here only to indicate some of their phase reactions.
The Addition of a Salt to a System containing a Hydrate. In Fig. 12, a solution
represented by the point M is saturated as to Na 2SO 4 .10H 2O at 25 C. It is a system of
one salt and water, a binary system, and the same remarks apply to the solution represented
by the point L.
If some NaCl is added to solution M the NaCl will dissolve and the solution will be
represented by a point on the curve MB and the system is no longer binary but ternary.If more and more NaCl is added and time allowed for equilibrium the point representing
the solution will move along the curve MB and with the correct amount of salt added the
point will be at B. The solution is then saturated as to Glauber's salt and anhydroussodium sulphate and the complex is at a point within the mixed field, the triangle
Na 2SO 4 . 10H 2O Na 2SO 4 ,S. The system has now gained a phase and has therefore lost
a degree of freedom, and the composition of solution B is invariant for the temperatureof 25 C.
The addition of more NaCl, even though it dissolves, does not change the compositionof solution J5, because Glauber's salt becomes dehydrated and NaCl dissolves, so the solution
can be of the same composition so long as any Glauber's salt remains. When sufficient
NaCl has been added and all the Glauber's salt has been dehydrated, then the dissolvingof more salt causes the point, representing the solution, to leave B and move along the
curve towards A . That is, the system loses a phase when all the Glauber's salt is dehydratedand therefore a degree of freedom is gained. If excess of NaCl is now added and time
allowed for equilibrium, the point representing the solution will move to A when a new
phase, NaCl, appears and the solution is again invariant.
Altering the Temperature. It has already been stated that whereas addition or
removal of a substance moves the complex, change of temperature only changes the con-
figuration of the fields. It is convenient when dealing with changes of temperature to havethe diagrams of different temperatures on the same figure. Fig. 16 is an example of three
such diagrams superimposed ;the components are sodium nitrate, potassium nitrate and
water, and the three temperatures are 25 C., 75 C. and 100 C. The data are found in
Tables 15, 16 and 17 (see reference to polytherms in Chapter I).
Suppose the original complex is at 75 C. and the composition
25% sodium nitrate,
40% potassium nitrate.
This is marked x on the diagram and it is seen that at 75 C. it comes within the liquid field,
thus giving a clear solution.
At 25 C. the complex, still at point xt comes within the potassium nitrate field. This
means that on cooling from 75 C, to 25 C. potassium nitrate will crystallize out of the
solution.

PRACTICAL APPLICATION OF THREE-COMPONENT DIAGRAMS 51
25* 75 * 700C.
g./tOOg.
M' M"FIG. 10. NaNO 3 .KN() 3 water.
KNO.
TABLE 15
SODIUM NITRATE . POTASSIUM NITRATE . WATER(From E. Cornec and H. Krornbach, Caliche, 1928)
Composition of saturated solutions at 25 C.
TABLE 10
SODIUM NITRATE . POTASSIUM NITRATE. WATER(From E. Cornec and H. Krombach, Caliche, 1928)
Composition of saturated solutions at 75 C.
L'
A'

52 AQUEOUS SOLUTION AND THE PHASE DIAGRAM
TABLE 17
SODIUM NITRATE . POTASSIUM NITRATE . WATER(From E. Cornec and H. Krombach, Caliche, 1928)
Composition of saturated solutions at 100 C.
The important point to note in this type of problem is that the composition of the
complex does not alter. The part of the 75 0. diagram which especially concerns us is
the curve M'A'. As the temperature is lowered towards 25 C. the complex remains at
x, but the curve M'A' gradually moves across the chart until it reaches MA at 25 C. Atan intermediate temperature the curve reaches x and it is at this stage that potassiumnitrate begins to crystallize, giving potassium nitrate in the solid state and leaving a solution
the composition of which must be on the line from the potassium nitrate corner through x.
Thus at 25 C. the solution is where this line cuts the curve MA. At temperatures above25 C. the solution will be somewhere between the above point and .r.
Using the same diagram, Fig. 16, the point y represents a complex which, unlike r,
is hi the field of mixed solid at the low temperature. Suppose the problem is to obtain
pure potassium nitrate. The composition of the complex at y is
27.0% sodium nitrate,
51-5% potassium nitrate.
The complex will be in a different state at each of the three temperatures.At 100 C. it will be completely liquid.
At 75 C. it will give potassium nitrate in the solid state and a solution on the curveM'A' .
At 25 C. it will give a mixture of potassium nitrate and sodium nitrate in the solid
state and a solution of composition A.
In this case we are not only concerned with the curves MA, M'A', and M"A", but also
with the lines from the potassium nitrate corner to A, A', and A". As the solution y is
cooled from 100 C. the curve M"A" moves towards M'A', and when this passes y then
potassium nitrate begins to crystallize out of the solution. This is the desired result, but
on further cooling the line from the potassium nitrate corner to A' (i.e. the A' line) movestowards the A line. After the A' line has passed the point y both potassium nitrate andsodium nitrate are thrown out of solution. Thus the mixture must not be cooled below
the temperature at which the A' line reaches y. This temperature may be determined
approximately as follows.
The curve joining A, A' and A" shows the movement of the point A with change of
temperature. A straight line is drawn from potassium nitrate to y and produced to meetthe curve A A' A" at z. Call this the z line. Then the temperature at which the A' line
coincides with the z line gives the lowest temperature to which the complex y may be cooled

PRACTICAL APPLICATION OF THREE-COMPONENT DIAGRAMS 53
to obtain pure potassium nitrate in the solid state. This temperature will also give the
highest yield of pure potassium nitrate possible by cooling and the composition of the
solution will be z. By interpolation the temperature is judged to be approximately 50 C.
To determine this temperature accurately further phase diagrams are necessary, that
is curves at intermediate temperatures.To summarize, the main principles in the practical application of a phase diagram are :
(1) When any substance (water, salt, or solution) is added to a complex the compositionof the complex moves in a straight line towards the point representing that substance.
Conversely, when any substance is removed the composition of the complex moves in a
straight line away from the point representing that substance.
(2) When a complex is heated or cooled the position of the complex on the diagramremains unaltered, but the configuration of the diagram itself changes.
In either (1) or (2) the state of the complex may be predicted by the rules described
in Chapter V.
In practice it is usual to have a number of operations either simultaneous or sequential.
Thus a complex may be diluted and cooled at the same time;
it may be heated, evaporatedand then cooled.
It might be pointed out at this stage, that as the diagrams are isotherms, it is necessaryto know if any important change has taken place during the temperature range between
the isotherms under consideration. Fig. 14 will serve as an example : the short curve B(J
is the saturation curve of Na 2SO 4 at 25 C. At higher temperatures this curve is longer,
while the saturation curve of Na 2S0 4 .10H 2O becomes shorter and finally disappears at a
specific high temperature. At lower temperatures the curve BC disappears and a solution
is obtained which is saturated as to Na 2S0 4 .10H 2 and darapskite.
At an intermediate temperature, actually 24- 3 C., the curve BC becomes a point
representing a solution saturated as to three solid phases, Na 2S0 4 . 10H 20, Na 2S0 4 and
darapskite. Such a point is a system invariant point and it has no degree of freedom, the
composition of the solution is fixed by nature and the temperature of the isotherm is also
fixed. On the diagram which would be an isotherm at 24-3 C., two curves would radiate
from this invariant point at the break, but there would be three straight lines radiating
to darapskite, Na 2S0 4 and Na 2SO 4 . 10H 20.
In a similar way the curve AB will become a point at 74 C., and there will be a solution
saturated as to three solid phases, NaNO 3 , darapskite and Na 2SO 4 .
Finally, when studying isotherms evaporation is always considered as taking place
without change of temperature. In practice evaporation is carried out at the boiling-point
of the solution for the pressure conditions existing. Suppose the isotherm is at 25 C. and
the amount of water to be removed has been calculated. Then, in the majority of cases,
the solution may be heated to its boiling-point, the amount of water evaporated, the solution
cooled back to 25 C. and agitated for sufficient time to obtain equilibrium with the same
final result as if the evaporation had actually taken place at 25 C.
It might be well at this stage to consider more closely one of the system invariant
points mentioned above : for example, the point representing a solution saturated as to
NaNO 3 ,Na 2SO 4 and darapskite at 74 C. and when B arid C coincide at a point.
Suppose this solution to be contained in a vessel with a fair quantity of the three
solid phases added;
the temperature is 74 C. and equilibrium has been established.
If the temperature is raised the darapskite phase will disappear, and if the temperature is
lowered the points A and B will separate and form a curve.

54 AQUEOUS SOLUTION AND THE PHASE DIAGRAM
To raise the temperature, heat must be given to the system, that is, heat is applied to
the outer walls of the vessel but equilibrium must be maintained, because the phase rule
only applies to systems at equilibrium. This means that in the experiment being con-
sidered, the heat must be applied sufficiently slowly and agitation of the mixture must be
sufficiently vigorous, for the equilibrium not to be destroyed. Under these conditions the
temperature does not rise. Darapskite is decomposed, but the composition of the solution
remains unchanged until the darapskite phase has completely disappeared.The phase rule indicates that the composition of the solution cannot change nor
can the temperature alter while all three solid phases are present, unless the equilibrium is
destroyed.
The principle of Le Chatelier states that, if heat is applied to a system, the phasereactions are such that heat will be absorbed. The decomposition of darapskite or, in
other words, darapskite passing into solution and NaNO 3 and Na 2S0 4 being deposited,is an endothermic reaction, so by applying the principle of Le Chatelier it is possible to
predict the direction of phase reactions when the necessary thermal data are available.
When the solubility of a salt increases with rise of temperature the action of solution is
endothermic and the action of crystallization is exothermic. Darapskite belongs to this
class of salt because crystals of darapskite can be prepared by cooling a suitable solution.
When the solubility of a salt is retrograde the action of solution is exothermic and crystal-
lization is endothermic. Thus, when Glauber's salt or sodium nitrate dissolves in water,
heat is absorbed, but when sodium sulphate dissolves heat is given out.
To return to the invariant solution in the vessel, when the darapskite phase has dis-
appeared a degree of freedom has been gained. If heat is applied to the system the phasereactions will still be such as to cause the absorption of heat, but a temperature may now be
selected and so the temperature will rise without the equilibrium being destroyed. Whenheat is applied to the vessel the temperature will rise and the composition of the solution,
saturated as to sodium nitrate and sodium sulphate, will be fixed by the temperature.As the temperature rises heat will be absorbed because sodium nitrate will dissolve and
sodium sulphate will be deposited, and both these reactions are endothermic
The temperature could have been made to rise before all the darapskite had been
decomposed, that is, by applying a sufficient quantity of heat over a short period of time,
but in that case the equilibrium would be destroyed. In practice the equilibrium is usually
destroyed deliberately so that the reaction may be more rapid In the example beingconsidered sufficient heat would be supplied to overcome the resistance of the system and
the darapskite would be decomposed rapidly. The system could then be allowed to regain
equilibrium if necessary and at the temperature required.It will thus be realized that, during the isothermal removal of water, according to the
solid phases being deposited or dissolved, it will be necessary to supply heat or to removeheat in order that isothermal conditions may be maintained.
A Series of Operations. The following examples are typical of the application of
three-component diagrams to industrial processes where several operations are combined.
For convenience the same salts are used as for Fig. 16, but a new diagram is given, Fig. 17.
Three problems or examples will be considered, each being the separation of potassiumand sodium nitrates. In the first case the original mixture is rich in potassium nitrate
;
in the second case it is less rich;and in the last case it only contains a small amount of
the potassium salt.
(I) Suppose the first mixture contains 75% potassium nitrate and 25% sodium nitrate.

PRACTICAL APPLICATION OF THREE-COMPONENT DIAGRAMS
NaN03
25 & 100 C
g./fOOg
55
Fia. 17. NaNO3 .KNO8 . water.
This is marked r, on the diagram. When water is added the complex moves in a straight
line towards water and sufficient water must be added to bring the complex within the
potassium nitrate field for the temperature to which the mixture is going to be cooled.
In this example the temperature is assumed to be 25 C.
The water could be added to give a mixture at 25 C., and such a mixture, if given
sufficient time and agitation, would result in solid potassium nitrate, the sodium nitrate all
being in solution. Such a method does not allow for the removal of insoluble impurities
such as earthy matter. It is more usual to work at a higher temperature, say 100 C., and,
after nitration or settling, to obtain the crystals by cooling the clear liquid.
Water must, therefore, be added not only to bring the complex within the potassium
nitrate field for 25 "C., but also to bring it within the liquid field for 100 C. In the exampletaken (point x) water must be added until the complex reaches the curve M'A'. This will
give a solution at 100 C. which can be filtered or settled. The clear liquid on cooling to
25 C. will then deposit pure potassium nitrate.
If the original mixture of salts contains slightly less potassium nitrate, say 65%, then
the complex must be moved beyond the curve M'A' in order to enter the potassium nitrate
field for 25 C. The final solution would then be unsaturated at 100 C., and a smaller
yield of potassium nitrate will be obtained on cooling.
(II) With an original mixture containing 30% potassium nitrate and 70% sodium
nitrate a different kind of problem arises because the addition of water cannot give a complexwithin the potassium nitrate field for 25 C. (nor for any temperature above 25 C.). This
problem is approached from the opposite direction, that is, solid sodium nitrate is removed
in order to obtain a solution enriched in the potassium salt.
Water is added to the original mixture in sufficient quantity to move the complexinto the sodium nitrate field for 100 C. The complex need only be moved along the line
towards water as far as the boundary of the sodium nitrate field for 100 C. ;this is not

56 AQUEOUS SOLUTION AND THE PHASE DIAGRAM
point w but slightly above. At this boundary all the potassium salt will be in solution,
the solid phase being sodium nitrate. The composition of the solution is given at point A'on the diagram. Thus, after the separation of the solid sodium nitrate, a solution is obtained
which contains both sodium and potassium nitrate, but which has been enriched in the
potassium by the removal of some of the sodium, the temperature having been maintained
at 100C.Even now the enriched solution will not give potassium nitrate on cooling, the point A
'
being within the mixed field for 25 C. The addition of water to the solution will moveits position into the potassium nitrate field for 25 C. Water is therefore added, sufficient
to bring the solution just within that field, that is to the point y. It is not essential duringthis last addition of water to keep the temperature at 100C. The solution represented
by the point y is cooled to 25 C. and potassium nitrate is obtained as crystals. The mother
liquor has the composition represented by the point A.
The mother liquor can be used to dissolve a further quantity of raw material. Thus, if
solution of composition A is added to the 30% potassium nitrate mixture, a complex maybe obtained of a composition which lies on the boundary of the sodium nitrate field for
100 C. This complex is at w and lies on the straight line between A and 30% potassiumnitrate. If this complex is heated to 100 C. all the potassium nitrate will dissolve and solid
sodium nitrate can be removed. The solution will have the composition A' and the rest
of the process may be carried out exactly as described above, the final result being the
production of crystals of potassium nitrate and a mother liquor of composition A. Thusa cyclic process has been developed.
(Ill) If the raw material is very weak in potassium nitrate, say 5%, the first operationof the above cycle would give a mixture containing such a low percentage of liquid that it
would be impracticable to work at 100C., and the separation of the solid from the liquidat 100 C. would present innumerable difficulties. This introduces the third example.
The mixture containing 5% potassium nitrate and 95% sodium nitrate can be con-
veniently treated with cold water and, although the quantity will be small, it can be allowed
to drain through the mass and recirculated until a saturated solution is obtained. Sufficient
water must be circulated so that the composition of the mixture is represented by the
point z on the diagram, this being on the boundary of the sodium nitrate field for 25 C.
The saturated solution will have the composition A, the solid left behind being sodiumnitrate. To obtain potassium nitrate crystals the saturated solution A is concentrated bythe evaporation of water, thus moving the complex in a straight line through A away fromthe water corner. The evaporation is continued until the complex reaches the boundaryof the sodium nitrate field for 100 C. At this point the solution has the composition A',
and the solid which has been deposited is sodium nitrate. The solution A' is separatedfrom the sodium nitrate at 100 C., and is diluted with water and cooled as in the previous
example. This will give potassium nitrate crystals and mother liquor of composition A.The mother liquor A is already saturated with potassium nitrate at 25 C., and therefore
fresh water must be used for treating a further batch of raw material. The mother liquor Ais concentrated by evaporation together with the next batch of cold circulating liquor whichhas the same composition A. As in the previous example, the process is a complete cycleof operations which may be repeated indefinitely. In practice, of course, small impuritieswill accumulate and some mother liquor may have to be rejected or purified.
Isothermal Invariant Point in Field of Pure Salt at Lower Temperature. In
the above examples of a series of operations, the phase diagram taken was one where the

PRACTICAL APPLICATION OF THREE-COMPONENT DIAGRAMS 57
solubility of both salts at the invariant point increases with increasing temperature. Thus r
in Fig. 17 at A', the solution contains more potassium nitrate and more sodium nitrate
than at A. In other words, the triangle NaNO 3 .^4'.KNO 3 ,the mixed solid field at 100 C.,
lies entirely within the triangle NaN0 3.^.KNO 3 ,the mixed solid field at 25 C. The
point A', representing the hot solution saturated as to both salts, is within this mixed field
for the lower temperature. A curve drawn between A and A' is the path of the isothermal
invariant points as the temperature changes from 100 to 25 C., and if this curve is producedit will cut the side of the triangle between the two salts.
When a solution represented by A' is cooled both salts are deposited and the solution
remains saturated as to both salts. The solution must be diluted if one of the salts is to
be obtained pure in the solid phase on cooling. Many pairs of salts behave in this way.
NaN03
25 & 100*C.
g 1100g.
NaClMM'Fin. 18. -NaNO 3 .NaCl water.
Part of this diagram has been distorted for clarity.
It is quite common, however, for a pair of salts to behave differently, one of the salts
at the invariant point increasing in solubility at the expense of the other. When such
a solution, saturated as to both salts, is cooled, the more soluble salt crystallizes out and
the solution becomes unsaturated with the less soluble salt. The system sodium nitrate,
sodium chloride and water is a good example of this case. Tables 18 and 19 give the data,
and Fig. 18 is the diagram ;the temperatures chosen are 25 C. and 100 C.
It will be noticed that the curve A'A if produced would not cut the side of the triangle
NaN0 3 .NaCl and that the triangle NaN0 3 .4'.NaCl does not lie entirely within the triangle
NaNO s .4.NaCl.
An example will now be taken using the diagram to work out a method of separating
sodium nitrate from a raw material containing sodium chloride. Suppose the raw material
contains 40% sodium nitrate and 60% sodium chloride.
If the correct amount of water is added to the raw material and the temperature
maintained at 100 C., a complex may be obtained on the boundary of the sodium chloride

58 AQUEOUS SOLUTION AND THE PHASE DIAGRAM
TABLE 18
SODIUM NITRATE . SODIUM CHLORIDE . WATER(From E. Cornee and A. Chretien, Cahche, 1924)
Composition of saturated solutions at 25 C.
Kef Letter
M . ,
TABLE 19
SODIUM NITRATE . SODIUM CHLORIDE. WATER(From K. Cornee and A. Chretien, Caliche, 1924)
Composition of saturated solutions at 100 C.
Solid Phase.
NaNO3
NaCl
field for 100 C. Solid sodium chloride may be separated from the solution, which solution
wiljhave a composition A'. This solution is already within the sodium nitrate field for
25 C. and on cooling will deposit the nitrate. This differs from the previous example ofFig. 17 in that no dilution of solution A' is necessary. An inspection of the diagram,Fig. 18, shows that the mother liquor obtained at 25 C. will be a point on the curve LAwhere the line from sodium nitrate through A' meets the curve. This is not at z but slightlynearer to L.
In order to have a cyclic process the mother liquor must be used with fresh raw material.Sufficient raw material is taken to give a complex on the boundary of the sodium chloridefield for 100C., that is a similar position to that obtained when using water except thatthe complex is closer to A'. The complex at 100 C. will give solution A' and solid sodiumchloride. The sodium chloride is removed and the solution A' is cooled to 25 C. to producesodium nitrate crystals and the same mother liquor as before.

PRACTICAL APPLICATION OF THREE-COMPONENT DIAGRAMS 59
If the raw material contains more or less nitrate than 40% the same procedure will
result in the same solution, A', and a similar cyclic process.
For convenience of description when following an operation on the diagram a complexhas been taken to be on the boundary of a field. In actual practice the complex would
generally be moved to a point just within the desired field. This avoids the danger of
contamination. Also on the large scale the time to reach equilibrium is often too long to
be economical. Thus when making mixtures the quantities are adjusted accordingly.In the present example where the 40% raw material is treated with mother liquor the
operation of dissolving need not be continued long enough to give the solution A', but to
give a solution on the curve M 'A' at say x. When this solution is cooled a rather interesting
phenomenon occurs.
The solution is saturated with chloride but not with nitrate, and the first result of
cooling will be the crystallization of sodium chloride. The composition of the solution
will therefore move in a line through x away from sodium chloride. When the compositionof the solution reaches the curve A'A at y the solution is saturated with both salts. This
is at a temperature between 100C. and 25 C. since the curve A'A is not an isotherm,but the path of the invariant point at temperatures from 100 C. to 25 C. If solution y is
separated from the deposited sodium chloride and the solution cooled to 25 C. sodiumnitrate will be deposited and a mother liquor will be obtained on the curve LA represented
by the point z, which is on the line from sodium nitrate through y.
If, on the other hand, the deposited sodium chloride is not removed and the complex jc
cooled sodium nitrate will be deposited and sodium chloride will be redissolved. This
redissolving will proceed so that from the point y the composition of the solution follows
the curve A 'A. When all the sodium chloride has dissolved the solution will be where the
line from sodium nitrate through x meets the curve A'A, Further cooling to 25 C. will
give a final solution where the same line meets the curve LA. Thus in order to determine
the final result of cooling the intermediate deposition of sodium chloride could have been
ignored, but it is necessary to know the actual path of crystallization because, in this case,
it has shown the necessity of agitation during cooling.It may also be noted that the yield of nitrate is greater by leaving the chloride to
redissolve than if it were removed before cooling.
A Quantitative Example of a Cyclic Process. A cyclic process can be outlined
on a phase diagram in the manner already described, but it is also necessary to know the
quantities involved in each operation. On p. 56 a cycle was outlined, using Fig. 17, for
the production of potassium nitrate from a raw material containing sodium nitrate. Thecalculations below show how the cycle can be worked out quantitatively. It will be realized
that a larger diagram than Fig. 17 was used for this purpose
Briefly, the cycle moved on the diagram round the quadrilateral wA'ijA. The
complex w was first prepared and from this the solution A' was obtained. The latter
solution was diluted to y and on cooling gave solution A, which was used for the preparation
of a further quantity of complex w.
The data required are :
(a) The composition of the raw material (as given in the example on p. 55) :
70-0% sodium nitrate
30-0% potassium nitrate.

60 AQUEOUS SOLUTION AND THE PHASE DIAGRAM
(b) The composition of A' (obtained from table) :
36-7% sodium nitrate
48-1% potassium nitrate
25-2% water.
(c) The composition of A (obtained from table) :
40-3% sodium nitrate
19-1% potassium nitrate
40-6% water.
(d) The ratio of solution A to the raw material for complex w. (Obtained from diagramby the method described on p. 33.)
8-7 units solution A31-9 units raw material
40-6 units complex w.
(c) The ratio of solution A' to solid sodium nitrate (obtained from diagram) :
36-4 units solution A'
26-9 units solid sodium nitrate
63-3 units complex w.
(/) The proportion of water to be added to A' to give solution y (obtained from
diagram) :
69-8 units solution A'
15-0 units water
84-8 units solution y.
(g) The ratio of solution A to solid potassium nitrate for complex y (obtained from
diagram) :
60-3 units solution A20-6 units solid potassium nitrate
80-9 units solution y.
The cycle begins with mother liquor from a previous cycle, in this case solution A.
Suppose that 100 parts of raw material are to be treated. From the data (d) above :
31-9 parts1 raw material require 8-7 parts solution A
JOO 27-3
giving 127-3 parts complex iv.
At 100C. the complex w yields solid sodium nitrate. From the data (e) :
63'3 parts complex w give 26-9 parts solid sodium nitrate
127-3 54-1
leaving 73-2 parts solution A'.
1 Parts are by weight throughout this calculation.

PRACTICAL APPLICATION OF THREE-COMPONENT DIAGRAMS 61
The water required to produce solution y is obtained from the data (/) :
69-8 parts solution A' require 15-0 parts water
73-2 7,5-7
giving 88-9 parts solution y.
At 25 C. the complex y yields solid potassium nitrate. From the data (g) :
80-9 parts complex y give 20-6 parts solid potassium nitrate
88'9 i, ,, 22-6
leaving 66.3 parts mother liquor (solution A).
Summarizing :
The raw material . . . . . . .100-0 partsis mixed at 100C. with mother liquor A . . 27-3 ,,
From this is removed solid sodium nitrate . .54-1 ,,
leaving solution A' . . . . . 73-2 ,,
to which is added water . . . . 15-7 ,,
The diluted solution is cooled to 25 C. and gives solid
potassium nitrate . . . . . 22-6 ,,
and mother liquor A 6f>-3 ,,
The cycle begins with 27-3 parts mother liquor A and finishes with 66-3 parts, anincrease of 39 parts. This is due to the 15-7 parts of water which has been introduced
and which must be removed by evaporation. Thus 27-3 parts of the final mother liquorare returned to the dissolving vessel in order to treat a second charge of raw material,
leaving 39 parts to go to an evaporator.It is obvious that 15-7 parts of water can only be removed from the 39 parts of mother
liquor by taking the solution to dryness. If, on the other hand, the 39 parts are con-
centrated until the solution has the composition A', sodium nitrate being precipitated, less
than 15-7 parts of water will be evaporated. On diluting and cooling a further quantityof mother liquor A will be obtained which will also require concentrating. This might be
continued indefinitely leaving a smaller quantity of mother liquor each time.
In practice a stock of mother liquor would be carried and used to feed both dissolvingvessel and evaporator. For the purpose of costing it must be noted that for the productionof 22-6 parts of potassium nitrate 15-7 parts of water must be evaporated. In order to
produce 30 parts of potassium nitrate which will eventually be obtained from the original100 parts of raw material more water must be introduced and evaporated, as explained above.
In order that the concentrated liquor from the evaporator may be returned to the cycleat an appropriate stage the mother liquor would only be concentrated to the boundary of
the sodium nitrate field for 100 C. On the diagram the evaporation line is drawn as fromthe water corner through A and produced to meet the above boundary at which point
evaporation is discontinued. In this case the point happens to be very near to w and so
it is not marked on the diagram, but we will call it w' .
The proportion of water to be evaporated from 100 parts of mother liquor is determined
by taking the proportions of the line w' to A and H 2O to w'. These are 32 units and

62 AQUEOUS SOLUTION AND THE PHASE DIAGRAM
91-5 units respectively, indicating that 32 parts of water must be removed from 91-5 partsof mother liquor. That is 35 parts of water from 100 parts of mother liquor. This,at 100 C., will give solid sodium nitrate and solution A'
tthe latter being added to
the cycle at the A f
stage.

CHAPTER VII
DETERMINATION OF SOLUBILITY FOR PHASE DIAGRAMS
This chapter follows the study oi%
three-component systems and so the methods givenhere are applied to three-component diagrams. They may, however, be used for all systems
by suitable adjustment.The curves in three-component diagrams trace out the points of solutions saturated
with respect to one or more salts. Thus, if any mixture of water and the two salts is taken
which leaves some crystals undissolved, the analysis of the solution must give a point onone of the curves. By taking a range of mixtures a number of saturated solutions can be
obtained and a sufficient number of points determined to draw all the curves in the diagram.To complete the diagram it is necessary to know with what salt or salts each solution is
saturated, and so steps must be taken to determine the composition of the undissolved
crystals. By filtering and analysing the crystals an approximate idea may be formed, but
this is not sufficiently accurate as some mother liquor will be left in the filtered crystals.
As it is practically impossible to remove all the mother liquor a method is used which allows
for the presence of mother liquor and therefore no attempt is made to remove it. This
method was introduced by F. A. H. Schrcinemakers in 1893 and is known as the methodof "wet residues" (Z. physik. Chem., 1893 11, 81).
Method of Wet Residues. It will be remembered that if any complex is markedon the diagram it lies on the straight line joining its solution with its solid. If, therefore,
some mother liquor remains with the solid the composition of the wet residue must also
lie on the same straight line, but nearer to the solid. By analysing a solution and its wet
residue two points can be plotted on a diagram and a straight line is drawn through them.
The composition of the solution gives a point on the curve ; the composition of the solid
phase must lie somewhere on the straight line beyond the position of the wet residue.
If several solutions and their wet residues are analysed and their straight lines plotted,
some lines will be found to cross at points representing solid compounds, while others cross
at the point representing solution. In the latter case the solution thus indicated is an
invariant one at a break in the curve, showing that the complexes lie in a mixed field.
A convenient way of carrying out this method is to take a range of mixtures of the
two salts;
for example, take 90% of one salt and 10% of the other for one mixture. Then
take 80% of the one and 20% of the other, and so on to 10% and 90%. Water is added
to each mixture, but not in sufficient quantity to dissolve all the salt. The whole is agitated
for several hours at the desired temperature in order that equilibrium may be attained.
The mixture is allowed to settle while still maintained at the specified temperature,and some of the clear solution is analysed. This analysis gives the point on the curve.
The remainder of the solution is decanted and the wet residue of crystals and solution
is analysed as a whole. The best way to do this is to weigh the wet residue, dissolve it
in water, make up to volume and analyse the resulting solution. Such analysis is calculated
as a percentage of the wet residue and gives the second point on the diagram.For each original mixture two analyses are obtained, one representing solution, the
other representing wet residue. The solution points are joined to form the curves. The
points on the curves are joined by straight lines to their respective wet-residue points and
63

64 AQUEOUS SOLUTION AND THE PHASE DIAGRAMthe lines produced. An inspection of the diagram will now show whether sufficient pointshave been determined, and any deficiency is made up by preparing more mixtures withinthe range required. Not less than two lines and preferably more should meet at eachsolid phase and at each invariant point.
TABLE 20
AMMONIUM CHLORIDE . AMMONIUM NITRATE . WATER . 25 C.
(From Prutton, Brosheor and Marori, J.A.C.8., 1935, 57, 1(557)
1 Mean of three determinations.
25C.
g./JOOg.
H2FIG. 19. NH4C1.NH4NO 3 . water.
NH4 N02Wet-Residue Method of Plotting.
DETERMINATION OF SOLUBILITY FOR PHASE DIAGRAMS 65
The following example illustrates the method for a pair of simple salts. Table 20
gives figures obtained by Prutton, Brosheer and Maron for ammonium nitrate and ammoniumchloride at 25 C. (J.A.C.8., 1935, 57, 1657). Fig. 19 is the diagram. This shows the
importance of a number of determinations as the lines only approximately cross within
the ammonium chloride field, but there is no break in the ammonium chloride curve andthe general trend of the lines is to meet at the ammonium chloride corner. This is the
usual experience, and it is necessary to take a general view of the diagram as a whole.
It is not proposed to give any further examples, but if a double compound exists, or
a hydrate, the lines will indicate its presence by their obvious convergence on a point which
inspection will show to be a definite compound.Technical literature provides numerous examples of recent work, and the following
might be taken as studies of more complicated investigations for the determination of
equilibria for phase diagrams.
Magnesium sulphate, cadmium sulphate and water at 25 and 40. W. C. Vosburghet al, J.A.C.S., 1940, 1472.
Manganous nitrate -nitric acid water at 20 C. W. W. Ewing and C. F. Glich,
J.A.C.S., 1940, 2174.
An omnibus paper on: CaCl 2 Ca(NO 3 ) 2H 2O 25, CaCl 2 Ca(ClO 3 ) 2 H 2O 25,
SrCl 2 Sr(NO 3 ) a H 2O 25, KNO 3 Pb(NO 3 ),-H 2 0, by William F. Ehret, J.A.C.S.,
1932, 3126.
Sodium carbonate calcium carbonate water (at several temperatures). C. R. Buryand R. Redd, J.C.8., 1933, 1161. The data are given in this paper, but the isotherms
have not been plotted. A cross-section is given of the prism with temperature as the
ordinate. This could be obtained by mounting the isotherms to form a triangular prism.
Calcium sulphate, ammonium sulphate and water at several temperatures. A. E. Hill
and N. S. Yanick. J.A.C.S., 1935, 645. This is an example where one component has a verylow solubility.
The Synthetic Complex Method. A method which has been found to give results
quite accurate enough for ordinary works' use is a modification of the above. Instead of
analysing the wet residue a complex is prepared of known composition and the solution
only is analysed. This, again, gives two points on the diagram : the solution point on the
curve and the complex point which replaces the wet residue point. Hill and Ricci, J.A.C.8.,
1931, 53, 4305, say that the complex method is as accurate or more accurate than the residue
method if algebraic extrapolation of the tie lines is used.
A range of salt mixtures is prepared and water is added to each mixture as before,
but in this case the amount of water used must be known. It is convenient to run the
water from a burette into a stoppered bottle containing the salt mixture. The composition
of each complex is known and its composition can be calculated to percentages and marked
on the diagram.The bottles are agitated at the desired temperature for several hours until equilibrium
is reached. Care is required to avoid loss of water by evaporation, because it is assumed
that the composition of the complex remains as calculated from the quantities taken. For
the same reason the salts used must be as pure as possible.
A sample of the solution resulting from each complex is taken and analysed exactly
as in the method of wet residues. These solution points are plotted on a diagram to form
the curves, and by joining them to their respective complex points the solid phases are
indicated. The distance on the diagram from a solution point to a complex point is less

66 AQUEOUS SOLUTION AND THE PHASE DIAGRAM
than from a solution point to a wet residue. This increases the error when the line is
produced beyond the complex point, but for the majority of simple cases there is sufficient
accuracy. By algebraic extrapolation the complex point may be plotted without anywater content and thus the error can be reduced (see p. 67).
This method is quite suitable when working at low temperatures, say not above 40 C.
It is obvious that at 100 C. it is difficult to avoid some evaporation of the water content.
The reader must not be misled by the apparent simplicity of the preceding. Wheninvestigating a new system, in which very little is known about the existence or non-existence
of intermediate compounds or hydrates, great care and patience are necessary to ensure
that every solid phase is found. This is especially so where the compositions of different
solid phases are very much alike and are therefore close together in the diagram.It is sometimes necessary to obtain further confirmation of a particular solid phase
by microscopic examination of the crystals.
Apparatus. Many methods are in use for obtaining equilibrium between solid and
liquid and for removing sufficient solution for analysis. Whatever method and apparatusare chosen it is important that the salts and solution shall be in intimate contact at a constant
temperature for a period long enough to bring about equilibrium. This time varies from
a few minutes to several weeks, but for most cases the time taken is a few hours.
When equilibrium has been reached a sample of the clear liquor must be removed and
weighed under such conditions that there is no change in its composition. For instance,
there must be no loss of crystals through cooling, nor must there be any loss of water byevaporation. The clear liquor is usually obtained by allowing the complex to settle, for
several hours if necessary, the temperature being maintained constant.
A simple type of apparatus is a stoppered bottle fixed in a shaking device and submergedin a water-bath at a controlled temperature. The shaking device may be a wheel fixed
in a vertical position, so that the bottles tied to the spokes are turned over from end to endwithin the water-bath.
An elaborate thermostat, with automatic temperature control, can be used as the
water-bath, or a fairly large water container can be used with hand control when workingnear room temperature. A carbon filament lamp, with the glass immersed in the water,
makes a very simple electric heater.
When the agitation period is complete the bottles are removed from the wheel and the
contents are shaken down without removing the bottles from the water-bath. They are
placed in a rack below the surface of the water and left to settle until the supernatant
liquor is clear. The bottles are then raised so that their tops are just above water level.
The stoppers are dried with filter paper and removed.
Choosing a small dry pipette with a quick delivery, a sample from each bottle is taken
and delivered into a weighing bottle. If the pipette is warmed above the temperature of
the liquid there should be no fear of crystallization and the evaporation can be ignored.A pipette is suggested as a convenient instrument, but no attempt need be made to measure
the sample. The amount taken is weighed, made up to a definite volume and analysed.If the synthetic complex method is being used the remainder of the contents of the
bottles may be discarded. With the method of wet residues as much clear liquor as possibleis removed with a larger pipette, and the bottle containing the wet residues is re-stoppered,removed from the water-bath, dried and weighed at room temperature. The contents are
dissolved in water, made up to a definite volume and analysed.In the method of wet residues the object of removing as much liquor as possible before

DETERMINATION OF SOLUBILITY FOR PHASE DIAGRAMS 67
analysing is to obtain a wet residue point as far from the solution point as possible. Inthe synthetic complex method there is a limit to the distance obtainable between the twopoints, but in order to have them as far distant as possible the complex should contain theminimum amount of water, which will give a mixture that can be agitated and settled to
give a clear sample of solution.
There are two possible errors, the analytical error and the geometrical error in producinga line joining two points very close together. The analytical error is unavoidably multiplied,but the geometrical error can be avoided by a simple calculation. Suppose the synthetic
complex to be :
Salt A . . 20%Salt B . . . .30%Water .... 50%
and the solution on analysis gives :
A 4%B 16%Water . . . .80%
80 parts water contain 4A ~\- 16B50 2-5A -f WB.
This amount of solution is subtracted from the complex giving
20 - 2-5 = 17-5,41 - e . , ,
30 - 10.0 = 20.05/37 '5 t0tal
and no water.
Thus, if all the water could be removed from the complex as solution, the dry residuewould be
53-3% A46-7% B
This point, when marked on the edge of the diagram, gives the correct extrapolation of the
complex point. It does not necessarily represent any existing solid phase, but the line
joining this point to the solution point must pass through the true solid phase.Instead of obtaining equilibrium mixtures in stoppered bottles the work can be carried
out in open beakers using glass agitators driven by a small motor. This is obviously onlysuitable for room temperatures or lower where evaporation loss is very small.
More elaborate apparatus has been designed suitable for all temperatures and for
more accurate work. An apparatus for temperatures almost to the boiling-point of thesolution is illustrated in Fig. 20 A. This was used by Prof. Cornec and his collaboratorsat the University of Strasbourg and is described in Caliche, 1924.
The apparatus comprises a strong glass tube, a, provided with a rubber stopper whichhas three holes. A short length of glass tube is fitted into each hole with about one inch
protruding so that the vessel can be submerged in the water-bath.The central hole takes a glass rod agitator b which is rotated at 200 to 500 r.p.rn. by
means of a small motor and pulley. It is advantageous to have the pulley and its spindle
suitably supported and to connect the spindle to the glass rod of the agitator by means ofa short length of rubber tubing. This facilitates the disconnection of the apparatus.

'68 AQUEOUS SOLUTION AND THE PHASE DIAGRAM
D
CA)
FIG. 20.
The two outer holes are to take pipettes for sampling, and either or both of these
pipettes are used according to the nature of the solution. The pipette c of about 5 ml.
capacity is for taking the sample of clear solution when equilibrium has been established.
During the agitation period the pipette is supported out of the liquor by means of a rubberband e which also seals the opening. The sample is taken by removing the rubber band,
lowering the pipette and aspirating the solution to just above the level /. The pipette is
raised again, the rubber band replaced and the pipette allowed to drain.
If the wet residue is required, the remainder of the clear liquor is removed by insertingan ordinary pipette into the other pipette opening. The apparatus is taken from the
water-bath and the rubber stopper is removed in order to withdraw the pipette. The pipetteand the vessel are dried and weighed separately at room temperature for subsequent analysis.The wet residue adhering to the agitator can be ignored,
In carrying out the method as described above there is no means of knowing whenequilibrium has been reached . The smaller pipette d is introduced to overcome this difficultywhen necessary. One means of knowing that equilibrium has been reached is to establish
that the specific gravity of the solution is constant. The pipette d provides a means of
determining the relative density from time to time.
DETERMINATION OF SOLUBILITY FOR PHASE DIAGRAMS 69
The pipette is illustrated on Fig. 20 B. The two short lengths of capillary tube have
a bore of approximately 0-3 mm. A capillary tube of this bore will support a column of
water about 10 cm. and slightly more of salt solutions. Therefore, if the length from
g to h is made less than 10 cm., say 7 or 8 cm., then, when the pipette is filled above g and
allowed to drain, the level of the liquor will fall to g and remain there. This means that
the pipette will automatically retain the same volume of liquor whatever its composition.The pipette is inserted into the apparatus during the agitation, and is therefore at the
same temperature as the solution. In order to take a sample the agitation is stopped, the
liquor is allowed to settle and the pipette lowered into the solution and filled. The pipette
is raised clear of the liquor, allowed to drain and removed with its charge of solution. It
is wiped clean with filter paper, left to cool on its side and weighed. A further sample can
be taken, say one hour later, and if there is no change in weight, it may be assumed that
equilibrium has been attained.
The reason for cooling and weighing the charged pipette on its side is that as soon as
it begins to cool the solution contracts and empties the capillaries. In this condition the
pipette would discharge its contents if kept vertical.
If the pipette is calibrated for the temperature of the experiment the weighings will
give the actual specific gravity, a figure which may be very useful. The accuracy of this
type of pipette is of a high order. A pipette which held 1-7858 g. of water at 20 C. was
found to give a variation over a series of ten weighings of only 0-0002 g.
When the solution is rich in salts the contents of the small pipette d are sufficient for
analysis and pipette c is not required. When only one pipette is being used, whether
c or d, the other opening must be stoppered.
Thermal Analysis. A simple method for the determination of transition points for
phase diagrams takes advantage of the fact that changes of phase are associated with
absorption or liberation of heat. If a cooling curve is plotted for a complex the curve
follows the regular form for a body radiating heat, and there are no irregularities in the
curve as long as there are no phase or chemical reactions during the cooling. If a phase
reaction takes place, then heat will be generated and the rate of cooling will be affected.
This will be seen on the curve by a change in slope. The curve is usually plotted with
temperature as ordinate and time as abscissa, and the slope of the curve, when a phase
reaction is taking place, is to approach more nearly to the horizontal, i.e. the rate of cooling
is retarded.
The critical temperatures are those where a particular phase reaction commences or
ceases, and they are therefore indicated by the junctions of the different slopes on the
cooling curve. These temperatures mark the boundaries of different fields of polythermal
phase diagrams.The phase reaction on cooling, or, more accurately, 011 removing heat from the system,
is always exothermic. This is according to the Principle of Le Chatelier whereby the
reaction is such as to resist the attempted change. The liberation of heat in this case is an
attempt to maintain the temperature in spite of the removal of heat. Conversely, on heating
a system the phase reaction will always be endothermic. Thus, in every case, whether
heating or cooling, the curve will be altered to be more nearly horizontal at the point of
change from a system with no phase reaction to one with a phase reaction.
When a system is invariant (condensed) then it is not possible to choose temperature
as a degree of freedom. Thus, if heat is removed from a system and it reaches a temperature
at which the phase reaction makes the system invariant, then the temperature will remain

70 AQUEOUS SOLUTION AND THE PHASE DIAGRAM
constant until the phase reaction is complete. In this case the cooling curve becomes
horizontal. The typical case of this is where a pure substance of one component, or a pure
compound, is cooled and changes from liquid to solid. The temperature is the melting-
point of the substance. As soon as the smallest trace of solid appears in the liquid the extra
phase renders the system invariant and, until the liquid has all disappeared (by solidification),
the temperature cannot again alter. The heat liberated is the latent heat of the molten
substance, and the temperature will remain constant at the melting- (or solidification-) pointuntil there is no more liquid to give up heat on solidifying. When the substance is all solid
the system has lost a phase and become univariant (condensed) again. The temperature
may then alter, and so the cooling curve continues substantially as before, reaching the
solidification temperature .
1
When a cooling system has a phase reaction, e.g. from one phase to two phases, but
not such as to make it invariant, there is a change in the rate of cooling so that the cooling
curve becomes less steep but not horizontal. This change of slope may occur several times.
For example, in a ternary system, if the original system is liquid, then there are three
degrees of freedom,F 4- P = C + I
F 4_ 1=34-1.
The first change in rate of cooling will occur when one pure salt begins to deposit as solid.
There are then two degrees of freedom. The second change will be when a second salt
begins to deposit with the first. There is then one degree of freedom. The third changewill be when the eutectic point of the whole system is reached, three solid phases are being
deposited (e.g. ice and two salts), and there is no degree of freedom (system is invariant
condensed) so long as a liquid phase remains to make four phases in all The third changeis, therefore, to the horizontal on the cooling curve.
An example from binary system will indicate the use of the cooling curve. It a solution
of ammonium sulphate as represented by the point P on Fig. 1, that is 47-3% ammonium
sulphate and at 80 C., is cooled, there will be an arrest in the rate of cooling at 65 C.
represented by the point Q. This reduced rate of cooling will continue until the temperaturereaches 19 C.,
2 the eutectic temperature, A, when the temperature will remain constant,
the cooling curve being horizontal, until the whole mixture has become solid. The cooling
curve will then continue as in the first part. It will be clear to the reader that this is
a means of obtaining sufficient data to plot the phase diagram, Fig. 1.
A brief reference was made to the cooling curve of a solution of ammonium sulphateon p. 11 and the cooling curve was Fig. la. The curve AB is the normal cooling of the
solution when there is no phase reaction. At B ammonium sulphate begins to crystallize
out and this continues until C is reached, when the whole mixture begins to solidify. FromC to D both ice and ammonium sulphate are being formed in the solid phase, and at D there
is no liquid left. Thus, from D to E no phase reaction is taking place and the cooling is
unhindered again. B corresponds with point Q of Fig. 1 and C gives the eutectic temperature.
Special attention must be called to the case of retrograde solubility, as illustrated in
Fig. 5, for ferrous sulphate and water. In this case, if a mixture 30% FeS0 4 and 70% water
1 I.e. in accordance with Newton's Law of Cooling. Tho difference between the first part and the
last is only that due to the replacement of convoctivo cooling in the liquid by diffusive cooling in the
solid.
2 In this case the cooling would be effected by the use of a refrigerant in the outer vessel.

DETERMINATION OF SOLUBILITY FOR PHASE DIAGRAMS 71
is taken at 90 C., it will contain solid FeS0 4 .H 2O and solution. On cooling, the FeSO 4 .H 8Owill be dissolved and, as the solubility is retrograde, the act of solution will be exothermic.Thus heat will be liberated and the rate of cooling will be retarded until the temperaturereaches the saturation temperature for FeSO 4 .H 2O. Below this temperature there is onlyone phase (all liquid) and no phase reaction is taking place, so the cooling continues without
hindrance, i.e. the cooling curve becomes steeper. On reaching the temperature ofa saturated solution of FeS0 4 .7H 2O the exothermic deposition of FeS0 4 .7H 2O againretards the rate of cooling, and the cooling proceeds as described for ammonium sulphate.
A typical experimental method for plotting the cooling curve is to take the sample of
known composition in a glass boiling-tube, say 6 inches by 1 inch. A thermometer graduatedin tenth degrees is fixed in the tube and a stirrer is used. The sample is heated in the tubeuntil it is all liquid. The tube is then placed away from air currents, e.g. in an outer vessel,
so that it may radiate heat uniformly. The temperature is noted at one-minute intervals.
Supercooling may be avoided by seeding the solution ;in any case, if supercooling does
occur there will usually be a rise in temperature and the correct point can be determined
g/aphically.This method for determining transition points is known as thermal analysis. Since the
results give a temperature for a fixed composition it is obvious that they are more suited
for plotting on a polytherm than on an isotherm. For this reason the method is eminentlysuitable for the binary diagrams which have been given as polytherms. For the ternaryand higher systems, which in this book are given as isotherms, the method of thermal
analysis would give intermediate isothermal points. The specific temperature points
required could then be determined graphically by interpolation.A particular use of thermal analysis is where two isotherms are being studied on the
assumption that there has been no sudden change at intermediate temperatures. The
cooling curves of carefully chosen mixtures will show whether this assumption is correct.
If a transition is found then we know that an intermediate isotherm must be determined.
Notes on Three- and Four-Component Systems. Three-component systems of
two salts and water have been described at some length because more complicated systemsare largely made up of a number of them. Thus, if the three-component system is under-
stood, the more complicated systems present little difficulty. For example, a four-
component system of three salts and water can be divided into three systems each of twosalts and water represented on three equilateral triangles. If these three equilateral triangles
are arranged in space so that the water corner of each meets to form an apex, the three
triangles will stand on a base which is also an equilateral triangle. The solid figure formed
is a tetrahedron.
Just as an equilateral triangle was subdivided into a lattice to form the triple co-
ordinate graph paper, so a tetrahedron may be imagined as latticed in space. Any mixture
of three salts and water expressed as percentages may be represented by a point within
the tetrahedron, the lattice serving to fix the point and to define its composition.The three systems on three of the faces of the tetrahedron, the external systems, will
each have a three-component invariant point (i.e. when the systems are of the simplest
type without hydrates or double compounds). Within the tetrahedron there will be a four-
component invariant point representing a solution saturated with respect to all three salts,
and from this point three curves will radiate to meet the three three-component invariant
points of the external systems.A simple model will help at this stage, and six matchsticks can be joined together

72 AQUEOUS SOLUTION AND THE PHASE DIAGRAM
with sealing wax to form a small tetrahedron. Water will be represented at the apex andthe three salts at the three corners of the hase. Systems could be represented by makingcomplete models in wire, and this is sometimes done, but it is not generally necessary as
one or more projections of the tetrahedron may be drawn. If the small matchstick modelis allowed to cast its shadow from a not too near light on to a sheet of paper, the form that
the different projections take is readily seen. The drawing of such projections, includingthe projection of the curves and lines forming the internal system, is only a matter of simple
geometry. An article on the projection of the tetrahedron for phase rule study was publishedin Z. physik, Chem., 1909, 65, 562.
As the number of components increases the difficulty of graphical representation also
increases, because with each additional component an additional dimension is required.For example, a three-component isotherm can be completely represented in two dimensions
on triple co-ordinate graph paper. A four-component isotherm needs three dimensions,the tetrahedron. In the same way a five-component isotherm, such as four salts and water,
would require four dimensions. The difficulty is overcome by eliminating one of the
components, in this case water, as will be shown later in this book.
To revert to the four-component system the tetrahedron lattice is used where the three
salts have a common ion. There is another and very important type of four-component
system which may be considered as being built up from four three-component systems
represented on four equilateral triangles. These are arranged in space to form a pyramidon a square base, water being at the apex and the four triangular sides forming the external
systems. It is this type of four-component system which is the subject of the next four
chapters, because it has so much wider application than the systems where the three salts
have a common ion.
Solid Solution. Before leaving the three-component system it may be as well to
point out that the interpretation of the isotherms is not always as straightforward as the
reader has been led to believe. The statements are true in a general sense, but there are
some important exceptions. It is beyond the scope of this book to deal with the subjectof solid solutions, that is solid phases of variable composition, but it is necessary to mention
their existence.
The term solid solution was introduced by vaii't Hoff, and to-day solid solutions are
sometimes referred to as mixed crystals. Roozcboom, at the end of the last century, deduced
five possible types of solid solution in systems of two salts and water. Three of the typeswere when the two salts were completely miscible, and two types when the two salts were
only partly miscible but two series of solid solutions were formed, that is one salt dissolved
in the other and the other in the former. Since then a sixth type has been recognizedwhere only one series of solid solution is formed, the solid solution being of the nature of
a double salt but of varying composition with the varying composition of the liquid solution
with which it is in equilibrium. This sixth type was first mentioned by John E. Ricci,
(J.A.C.8., 1935, 575).
Two cases of solid solution in systems of two salts and water are shown in Fig. 21
plotted from the data in Tables 21A and 2 IB. Fig. 21A is a case when the miscibility of
the two salts is complete : the curves representing solutions in equilibrium with the puresalts have shrunk to zero and the invariant point has extended into a curve in equilibriumwith a solid solution of the two salts, the composition of which varies with the compositionof the liquid solution. Fig, 2lB is an example given by Ricci (loc, r,it.) : there are two
pure solid phases each with its curve representing solution in equilibrium with pure solid.

DETERMINATION OF SOLUBILITY FOR PHASE DIAGRAMS
TABLE 21A
AMMONIUM SULPHATE . POTASSIUM SULPHATE . WATER,
(From Weston, J. Chem. Soc., 1922, 121, 1223)
Composition of saturated solutions at 30 C.
TABLE 2lB
SODIUM SULPHATE . SODIUM BROMATE . WATER(From Kicci, J.A.C.S., 1935, 57, 805)
Composition, of saturated solutions and complexes at 45 C.
There is a third curve in equilibrium with the solid solution, but the solid solution is not
a double salt;
it has a composition which varies with the varying composition of the liquid
solution. There are two isothermal invariant points representing two solutions, one in
equilibrium with one pure solid and the other in equilibrium with the other pure solid.
Both solutions are in equilibrium with the solid solution.
The fact that solid solutions are fairly common has led to a school of thought which
suggests that all solid phases are solid solutions, even if to an extent too small to be detected

74 AQUEOUS SOLUTION AND THE PHASE DIAGRAM
30C
g./rOOg
Solid Solution
FIG. 21.
by analysis. This idea has no doubt been influenced by the fact that it is impossible to
prepare a pure substance. The idea of universal solid solution is supported by A. C. D.Rivett in his book, The Phase Rule and the Study of Heterogeneous Equilibria, 1923 (OxfordUniversity Press) ;
he suggests that in a system of one salt and water, the salt cannot be
pure at all temperatures because, for a change in composition of the solution phase, theremust be a change in composition of the solid phase. On the other hand, Ricci (loc. cit.)
has very correctly pointed out that phase concentrations are not really percentage by weight,although it is very convenient to consider them so. They are really in terms of mass perunit volume and therefore even a pure solid phase can change its composition with changeof temperature. All substances change in volume with change of temperature and, takingmass as constant, the mass per unit volume changes.
The phase rule, as theory, is not concerned with the purity but with the number of

DETERMINATION OF SOLUBILITY FOR PHASE DIAGRAMS 75
the phases in relation to the number of components and certain variables such as temperature,
pressure and concentration. Throughout this book solid solutions have been assumed not
to exist except in those cases where they have been found by experiment and the examplesused in the various diagrams have been chosen, as far as possible, from the cases where solid
solutions have not been found. (There is one exception, glaserite does dissolve somesodium sulphate, so the composition of glaserite varies slightly.)

CHAPTER VIII
THE RECIPROCAL SALT PAIR
The four-component system, where the three salts have a common ion, has beenmentioned towards the end of the preceding chapter as being represented on a tetrahedronlattice. It was there pointed out that a more important type of four-component systemis one which requires to be represented by a pyramid on a square base, water being repre-sented at the apex. This is the system of two salts and water where the two salts do nothave a common ion. It has been emphasized that, for the three-component systems tobe represented on triple co-ordinates, the two salts must have a common ion. This is
because, when the two salts do not have a common ion, there may be chemical reaction
between the two salts to produce two other salts.
For example, sodium sulphate and potassium chloride may react to produce sodiumchloride and potassium sulphate. This reaction is known as double decomposition, and thefour salts involved are called a reciprocal salt pair. Lowenherz in 1894 and van't Hoff in
1 895 were the first to work on this aspect of phase theory. For other early references see
Meyerhoffer and Saunders, Z. physik. Ohem., 1899, 28, 453, and 1899, 31, 370.
If the amounts of the first two are in chemical equivalent proportion, then the com-
position may be expressed in terms of either the first pair or the second pair. If, however,there is an excess of one of the first pair, then the composition may be expressed either in
terms of the first pair or in terms of the second pair with an excess of one of the first pair,
making three salts and water instead of two salts and water. Thus, although in the
reciprocal salt pair four salts are involved, any mixture of the four salts can be expressedin terms of three of them, and such a system therefore becomes a four-component systemof three salts and water. Such a system, however, cannot be represented on the tetrahedron,because this does not allow all the four salts to be represented. It is for this reason thatthe square-based pyramid is used, water being at the apex, and one of the four salts at eachof the corners. The salts of each pair must be diagonally opposite and not adjacent.
The Base of the Pyramid. Before proceeding to study the pyramid as a solid figureit may be well to make a study of its base, as a plane figure. The base of the pyramidrepresents mixtures of the salts without any water and in order to have a square base,instead of an irregular quadrilateral, the composition of a mixture must be expressed in
chemical equivalents because it has to satisfy a chemical equation.For example :
Na 2iSO, + 2KC1 ,- 2NaCl + K 2SO 4 .
Fig. 22 represents the base of a pyramid, each corner not only representing a pure salt
but implying a definite quantity of that salt, that is, one chemical equivalent. It may for
convenience represent 100 chemical equivalents. According to the above equation onemolecule of sodium sulphate is equivalent to two molecules of potassium chloride, andtherefore the corner of the diagram for potassium chloride implies a double molecule
(K 2C1 2 ). It is customary to refer to these quantities as mols, and for convenience thedouble molecule of potassium chloride is always referred to as a mol. In other words,
by a mol, in this case, is meant the quantity of a chemical which will satisfy the equationwhether this be one, two or more molecules. One example will make this quite clear.
76

THE RECIPROCAL SALT PAIR
NayMoIs per 700/r?o/$.
30\Naz Clz
30C12
50
\
FIG. 22.
NazClz
Clz
K2 Clz
77
Suppose a mixture contains :
Sodium sulphate .
Sodium chloride .
Potassium sulphate
24-9%
To convert to mols it is necessary to divide the percentages by their respective molecular
weights which are :
Na aSO t . . . .142Na 2Cl 2 . . . .117K 2SO 4 . . . .174
This givesNa 2SO 4 .... 0-357 mols
Na 2Cl 2 .... 0-213
K 2SO 4 .... 0-141 ,,
Thus, 100 mols of mixture contain :
Na aS0 4 .
Na 2Cl 2 .
K 2S0 4 .
in 0-711
50 mols
. 30
. 20
of mixture.
In order to plot this on Fig. 22 the corners are taken as each representing 100 mols of the
pure substance, any point within the diagram representing 100 mols of mixture. Since

78 AQUEOUS SOLUTION AND THE PHASE DIAGRAM
any mixture of the four possible salts can be expressed in terms of three salts, any pointin the square may be regarded as being in a right-angled triangle, or half a square. The
point representing the mixture given above is in the triangle K 2SO 4 . Na 2S0 4 . Na aCl 2 . Onlytwo figures are required to fix the position of the point, and it is most convenient to take the
figures for the salts at opposite ends of a diagonal, that is in this case Na 2Cl2 and K aS0 4 .
In other words, the salt at the right angle of the triangle is ignored. The point representingthe mixture is marked x on Fig. 22, this being 30 divisions towards Na 2Cl 2 and 20 divisions
towards K 2SO 4 ,the corner Na 2SO 4 being the origin.
It will be seen that the amount of the third component, Xa aSO 4 , is the distance from
x to the diagonal, all measurements being parallel to the sides of the square.
With reciprocal salt pairs it is not always known which three salts result from a mixture.
For instance, in the case under consideration, point x of Fig. 22, the composition could
have been expressed in terms of sodium sulphate, sodium chloride and potassium chloride
instead of potassium sulphate, sodium sulphate and sodium chloride. It will be noticed
that x is in both these triangles. For this reason it is a common practice to express the
composition of a mixture in terms of the radicals, Na 2 , C3j, K, and SO 4 . The above mixture
will be seen to contain :
Na 2 80 mols from Na,8O 4 (50) and Na,CL (30)
K 2 20 K 2SO t
C1 2 30 Na 2Cl 2
S0 4 70 Na 2SO t (50) and K^O, (20).
It will be noted that the basic radicals, Na 2 and K 2 ,total 100, and in the same way the acid
radicals, C1 2 and S0 4 ,total 100. Any pair of figures is sufficient to determine the point,
the pair being of opposite type of radical, that is, one basic and one acid. Tn the exampleNa or K might be taken with Cl or SO.
In the square the line between the corners marked Na,S0 4 and Na2Cl 2 repre-
sents 100 mols of Na 2 ;the line between Na 2Cl and K. 3C1 2 represents 100 mols of
C1 2 and the other lines similarly represent K 2 and SO 4 as marked on Fig. 22. Thus to plot
the point x, this is 30 divisions towards the C1 2 and 80 divisions towards the Na 2 ,all
measurements being parallel to the sides of the square. Tn this case the diagonal is
ignored.
Plotting a Point within the Pyramid. Passing from the ba,se to the whole pyramidwater is taken as being at the apex, the base representing mixtures which contain no water.
Water is therefore measured upwards, 10 mols of water per 100 mols of mixture being on
a plane parallel to the base and 10 divisions above it. Similarly, a mixture with 80 mols
of water per 100 mols of mixture is represented on a plane parallel to the base 80 divisions
above it.
As an example take a mixture containing :
Sodium sulphate . . . .15-85%Sodium chloride .... 26-15%Potassium chloride . . . 49-95%Water 8-05%.

THE RECIPROCAL SALT PAIR
On conversion to mols this becomes :
Na2SO 4 . . . .0-112 molsNa 2Cl 2
K 2C1 2
H 2
Thus 100 mols of mixture contain :
Na 2S0 4 .
Na 2Cl 2 .
K 2C1 2 .
H 2O
. 0-224
. 0-335
. 0-447
in 1-118 of mixture.
10-0 mols
20-0
30-0
40-0
Here four figures are given, but only three are essential in order to fix a point in space.It is proposed to take water and two salts, and as before the two salts are taken at oppositeends of a diagonal ; in this case sodium sulphate and potassium chloride.
Fig. 23 illustrates how the point is plotted. The water is taken first;
this fixes the
point as being on the plane representing 40 mol % water. This plane is drawn in detail
Water
^80 mol 7 plane
Mols per 100 mo/s
A\\\\ 'ix
/yjx^fe^40 mol % plane
on the figure and is seen to be similar to Fig. 22, except that each side represents (>0 molsinstead of 100 mols, the remaining 40 mols being the water. Therefore the point represent-
ing the mixture is plotted at y in the same way as was done for x on Fig. 22. From the
point A on the diagram y is 30 divisions towards KC1 and 10 divisions towards Na 2S0 4 ,
all measurements being parallel to the sides of the square.So far it has been assumed that the point was being plotted within an actual three-

80 AQUEOUS SOLUTION AND THE PHASE DIAGRAM
dimensional model of the pyramid. In practice, projections are used as far as possible.
Fig. 23 can now be considered as such a projection. It is not drawn in perspective, as in
that case the sides of the base would not be parallel, and measurement would be moredifficult. The base is drawn as a parallelogram and this gives two scales for measurement.
The line K 2Cl 2 .Na 2Cl2 and the line K 2S0 4 .Na 2S04 are of equal length and are considered
as being divided into 100 equal parts. This scale is used for all measurements in any partof the figure where those measurements are parallel to the lines named.
The second scale is obtained by dividing the lines K 2SO 4 .K 2C1 2 or Na 2S0 4 .Na 2Cl 2 into
100 equal parts, and this scale is used for all measurements parallel to these lines.
A third scale, the measurement of water from the base, is less definite on the projection.
Any or all of the four edges radiating from the apex can be divided into 100 parts, but these
edges are not of equal length on the projection. In measuring, the water measurementsare made from one of the edges and the scale of that edge must be used. For example,in plotting the point y the procedure would be as follows :
From Na 2Cl 2 measure 40 mols of water along the edge H 2O.Na 2Cl 2 in terms of the
scale of that edge. This gives the point A, which is four-tenths of that line.
From the point A measure 30 mols of potassium chloride on a line parallel to the line
Na 2Cl 2 .K 2Cl 2 and in the scale of that line. This gives the point B.
From the point A also measure 10 mols of sodium sulphate on a line parallel to the
line Na 2Cl 2 . Na 2SO 4 and in the scale of that line. This gives the point C.
From B and C complete the parallelogram to give y.
It should be noted that it is not necessary to draw the 40 mol % water plane, nor is
it even necessary to draw the complete parallelogram AByC. The point can be obtained
by drawing two lines only, as is shown in the next example.Let the mixture be :
Sodium sulphate . . . .20 mols %Sodium chloride . . . 25
,, ,,
Potassium chloride . . .30 ,, ,,
Water 25
As before, measure 25 mols of water along the edge. This gives the point D.
From D measure 30 mols potassium chloride parallel to the line Na 2CI 2 .K 2Cl2, givingthe point E.
From E measure 20 mols sodium sulphate parallel to the line Na 2Cl 2 .Na 2S0 4 , givingthe point z which represents the mixture.
Having plotted a point on a projection it will be realized that, if the construction lines
are removed, it is not possible to"read back
"the composition of the point, because all
points within the solid figure on a straight line in the direction of projection are represented
by only one point on the projection. In order to be able to say exactly where a point is
it is necessary to have two projections such as a plan and an elevation. The elevation
gives two of the dimensions and the plan gives the third, or vice versa.
In order to avoid the necessity and trouble of drawing two figures it is a common
practice to treat the base of the pyramid on the oblique elevation projection of Fig 23 as
if it were a plan. Points within the solid pyramid are then projected on to this base.
In other words, when y, for example, is plotted on the elevation, its projection is also
plotted on the base of the same diagram. The latter is usually carried out by calculating
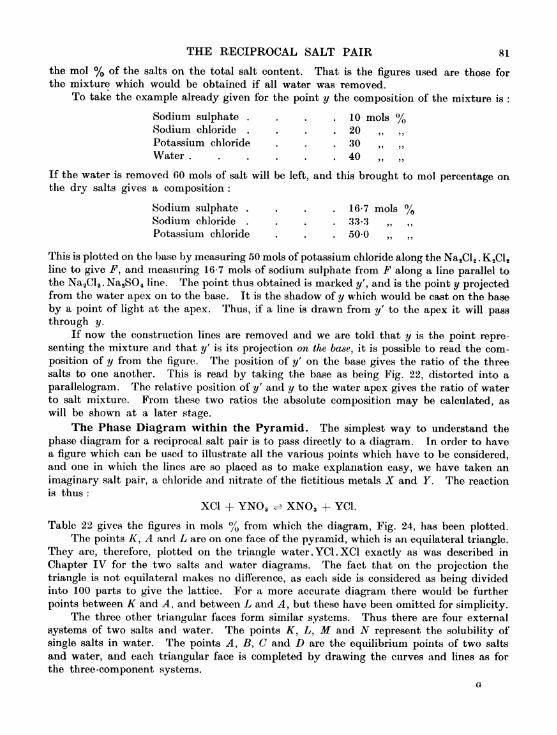
THE RECIPROCAL SALT PAIR 81
the mol % of the salts on the total salt content. That is the figures used are those for
the mixture which would be obtained if all water was removed.To take the example already given for the point y the composition of the mixture is :
Sodium sulphate . . . .10 mols %Sodium chloride . . . 20 ,, ,,
Potassium chloride . . .30 ,, ,,
Water 40
If the water is removed 60 mols of salt will be left, and this brought to mol percentage onthe dry salts gives a composition :
Sodium sulphate . . . .16-7 mols %Sodium chloride . . . .33-3 ,,
Potassium chloride . . . 50-0 ,, ,,
This is plotted on the base by measuring 50 mols of potassium chloride along the Na 8Cl 2 .K 2C1 2
line to give F, and measuring 16-7 mols of sodium sulphate from F along a line parallel to
the Na 2Cl 2 . Na aSO 4 line. The point thus obtained is marked y'',and is the point y projected
from the water apex on to the base. It is the shadow of y which would be cast on the base
by a point of light at the apex. Thus, if a line is drawn from y' to the apex it will pass
through y.
If now the construction lines are removed and we are told that y is the point repre-
senting the mixture and that y' is its projection on the base, it is possible to read the com-
position of y from the figure. The position of y' on the base gives the ratio of the three
salts to one another. This is read by taking the base as being Fig. 22, distorted into a
parallelogram. The relative position of y' and y to the water apex gives the ratio of waterto salt mixture. From these two ratios the absolute composition may be calculated, as
will be shown at a later stage.
The Phase Diagram within the Pyramid. The simplest way to understand the
phase diagram for a reciprocal salt pair is to pass directly to a diagram. In order to havea figure which can be used to illustrate all the various points which have to be considered,and one in which the lines are so placed as to make explanation easy, we have taken an
imaginary salt pair, a chloride and nitrate of the fictitious metals X and Y. The reaction
is thus :
XC1 + YNO 3 ^ XNO 3 + YC1.
Table 22 gives the figures in mols % from which the diagram, Fig. 24, has been plotted.The points K, A and L are on one face of the pyramid, which is an equilateral triangle.
They are, therefore, plotted on the triangle water . YC1 . XC1 exactly as was described in
Chapter IV for the two salts and water diagrams. The fact that on the projection the
triangle is not equilateral makes no difference, as each side is considered as being divided
into 100 parts to give the lattice. For a more accurate diagram there would be further
points between K and A, and between L and A, but these have been omitted for simplicity.The three other triangular faces form similar systems. Thus there are four external
systems of two salts and water. The points K, L, M and N represent the solubility of
single salts in water. The points A, B, C and D are the equilibrium points of two salts
and water, and each triangular face is completed by drawing the curves and lines as for
the three-component systems.

AQUEOUS SOLUTION AND THE PHASE DIAGRAM
TABLE 22
THE QUATERNARY SYSTEM. XCl. YNO 3 . WATER
RECIPROCAL SALT PAIR
Mols por 100 Molb of Soluti
XCl

THE RECIPROCAL SALT PAIR 83
The other two important points E and F are within the pyramid and are plotted as
described earlier in this chapter for Fig. 23. These two points represent solutions
which are saturated with three salts, as indicated in column 7 of the table. Curves are
then drawn from E to A and D and from F to B and C, that is from the points of three
salts to the points representing solutions saturated with only two of them. Finally the
curve EF is drawn. As with the curves on the faces, so with these curves, there should
have been intermediate plotting points.
To complete the internal system straight lines are drawn from E and F to the corners
representing the three salts with which each is saturated. It will now be seen that each
point that has been plotted is joined by a straight line or lines to the salt or salts with which
the solution is saturated. Thus the number of straight lines from a point towards the base
shows the number of salts with which the solution is in equilibrium. For example, from
K there is only one line : to YC1. From A there are two lines : to YC1 and XC1. FromE there are three lines : to YC1, XC1 and YN0 3 .
In Fig. 24 the curves which have just been described are represented by heavy lines to
distinguish them from the rest of the diagram . These curves form four irregular and curved
surfaces which cut the pyramid into two parts. The part of the pyramid above the surfaces
could be removed in one piece and represents'*
all liquid," with pure water at the apex.The part below the surfaces is complex, being mixture of solid and liquid. The surfaces
themselves represent solutions which, although being liquid, are saturated with respect to
one or more salts.
In a simple phase diagram of two salts and water there are two curves each representingsolutions saturated with one salt and containing varying amounts of the other. In systemsof three salts and water the curves have been extended into surfaces, which in the same wayrepresent solutions saturated with ONE salt but containing varying amounts of the other
two. For example, any point on the surface KAED represents a solution saturated with
YC1 and containing some XC1 and YN0 3 ,but not sufficient for saturation.
Where two surfaces meet they form a curve representing solutions saturated with TWOsalts but containing varying amounts of the third. For example, a point on the curve AErepresents a solution saturated with YC1 and XC1, and containing some YNO 3 . The curve
EF differs somewhat from the other curves ; it represents solutions saturated with two
salts, in this case XC1 and YN0 3 ,but containing varying amounts of a third salt XN0 3 .
The third salt might have been YC1 if the curve EF had been the other side of a vertical
plane on the diagonal XC1.YNO 3 . (Consult Fig. 28.)
Where three surfaces meet a point is formed representing a solution saturated with
THREE salts and containing no other salt. This point is called a quaternary invariant
point if the temperature is fixed. Thus the point F represents a solution saturated with the
three salts XC1, XNO, and YNO 3 .
In order to explain the part of the pyramid below the saturation surfaces, Figs. 25,
26 and 27 have been drawn, dissecting this part of the pyramid into eleven solid figures.
Each of these solid figures is a"
field"
within the meaning given to that term in earlier
chapters. For instance, in phase diagrams represented in two dimensions the fields are
planes. With three-dimensional diagrams the fields become figures in space.
The eleven fields can be grouped into three types. Each field represents solution and
solid, but the solid may be one pure salt, a mixture of two salts or a mixture of three salts.
Fig. 25 illustrates the four fields of one solid salt and solution. This figure should
be compared with Fig. 24 in order to recognize where the fields lie in the pyramids. Each

84 AQUEOUS SOLUTION AND THE PHASE DIAGRAM
K
N
XCl
K/V0j
FIG. 25.
field is a pyramid radiating from one of the corners of the square base. The extent of the
field is limited by the saturation surface. Any complex within one of these four fields
consists of a solution and one of the pure salts in the solid state. The composition of the
salt is denoted by the corner from which the field radiates, and the composition of the
solution is found by drawing a straight line in space from the known solid through
the complex to meet the saturation surface at the solution point. It should be noted that
the surfaces from the corner on the inside face of these cones are curved and not plane.
D
XCl
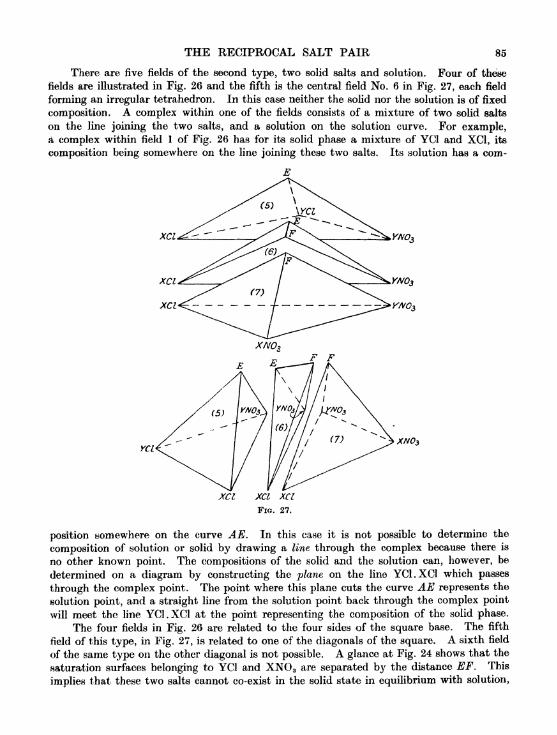
THE RECIPROCAL SALT PAIR 85
There are five fields of the second type, two solid salts and solution. Four of these
fields are illustrated in Fig. 26 and the fifth is the central field No. 6 in Fig. 27, each field
forming an irregular tetrahedron. In this case neither the solid nor the solution is of fixed
composition. A complex within one of the fields consists of a mixture of two solid salts
on the line joining the two salts, and a solution on the solution curve. For example,a complex within field 1 of Fig. 26 has for its solid phase a mixture of YC1 and XC1, its
composition being somewhere on the line joining these two salts. Its solution has a com-
XCL YNO*
XN03
position somewhere on the curve AE. In this case it is not possible to determine the
composition of solution or solid by drawing a line through the complex because there is
no other known point. The compositions of the solid and the solution can, however, be
determined on a diagram by constructing the plane on the line YC1.XC1 which passes
through the complex point. The point where this plane cuts the curve AE represents the
solution point, and a straight line from the solution point back through the complex point
will meet the line YC1 . XC1 at the point representing the composition of the solid phase.
The four fields in Fig. 26 are related to the four sides of the square base. The fifth
field of this type, in Fig. 27, is related to one of the diagonals of the square. A sixth field
of the same type on the other diagonal is not possible. A glance at Fig. 24 shows that the
saturation surfaces belonging to YC1 and XN0 3 are separated by the distance EF. This
implies that these two salts cannot co-exist in the solid state in equilibrium with solution,

86 AQUEOUS SOLUTION AND THE PHASE DIAGRAM
and they are therefore referred to as the unstable pair. The other pair, XCL and XNO 3 ,
is called the stable pair.
Of the third type of field there are only two, as illustrated in Fig. 27, fields 5 and 7.
Each field is a tetrahedron standing on half the base, which is divided by the diagonal
XC1. YN0 3 . A complex within one of the fields consists of a mixture of three solid salts
and a solution of fixed composition. Tn field 5 the solution is represented by the point E,
and in field 7 by the point F. The composition of the mixed solids is found by drawing
a straight line from the known solution point through the complex to meet the base, which
point is read in terms of the three salts at the corners of the base of the tetrahedron.
There is a possibility of a fourth type of field representing four solid salts in equilibrium
with solution. This could only occur if the line EF disappeared, as it sometimes does at
a particular temperature, so that E and F coincided at one point. In such a case the
fields 5, 6 and 7 would become one field.
Orthogonal Projections (the Plan). The dissection of the pyramid and the study
of its parts has been described as if a solid model were being used. It has already been
mentioned in connection with Fig. 23 that it is usually more convenient to use a projection
which may be considered as the shadow which a space model produces on a plane sheet
of paper. If the source of light is considered as being at infinity, the lines of projection
are parallel and the figure obtained is known as an orthogonal projection.
It is usual for orthogonal projections to be either elevations or plans, that is, projected
horizontally on to a vertical plane for the elevation, or projected vertically on to a horizontal
plane for the plan. Fig. 24 is of the nature of an elevation, but the lines of projection are
not horizontal and the base appears as a parallelogram instead of a line. Fig. 28 is an
YCl
Mo/s per 700 mo/s
XCl

THE RECIPROCAL SALT PAIR 87;
orthogonal projection of the same space model, but in this case it is a plan. It is the view
looking down into the crater which the saturation surfaces make in the pyramid. These
surfaces are denoted by the same letters as in Fig. 24 and they should be readily recognized.
Water is at the centre of the figure, the four salts being at the corners of the square.
The two diagonals divide the figure into four triangles which represent the triangular surfaces
of the pyramid. Taking one triangle as an example, the curves KA and AL are on the
surface of the pyramid, so that the triangle with the two curves mentioned forms a systemof two salts and water. The other three triangles are similar, and this disposes of the
outside edge of the crater and hence of the four external systems.
Points of the external system are plotted from the centre, taking the length of each
half-diagonal as 100 units, and using the figures given in the table without any modification.
For example, point K is 30-5 divisions from the centre on the diagonal towards YC1, the
table giving 30-5 mol % YC1. The point A is plotted by measuring 21-25 divisions from
the centre along the YC1 diagonal (21-25 mol % YC1) and 25-25 divisions parallel to the
XC1 diagonal (25-25 mol % XC1). The other points of the external system L, B, M, O,
N and D are plotted similarly. It will be seen that each of the four small triangular systems
is plotted as for triple co-ordinates, bearing in mind that one angle of the triple co-ordinates
is a right angle, this being the water corner.
In order to plot the internal system the centre is still taken as the origin and the
diagonals used as axes. Unless the complex lies on one of the diagonals there are always
three figures, apart from water, given for an internal point. Thus the point E is expressed
in terms of YC1, XC1 and YN0 3 . As there are only two plotting axes, two of these figures
must refer to the same axis. In the case of E, XC1 and YNOt{are at opposite ends of the
same diagonal, the figures being 22-2 mol % XC1 and 30-1 mol % YNO a . This means that
the point E is 22-2 divisions from the centre towards XC1 and 30-1 divisions towards YNO 3 ,
the final result being 30-1 - 22-2 = 7-9 divisions towards YNO 3 ,this being the greater.
It is also 3-2 divisions (3-2 mols % XNO 3 )towards XN0 3 .
Applying the same method to the point F, this is given in the table as
2(5-7 mols % XNO 3
10-6 ,, ,, XC121-2 YNO,,
and point is plotted as
21-2 10-(i = 10-6 divisions towards YNO 3
and 26-7 XNO,.
As regards reading back the composition of any point on the figure, this is only possible
when the point is known to be on the external system. For an internal point two figures
only can be read from the figure : the mol percentage of one salt and the difference in
mol percentage between the other two. Thus for the point F
XNO 3 can be read as 26-7 mols %YN0 3 -XC1 10-6
In other words, the same point can represent a number of complexes with different contents
of YN0 3 ,XC1 and water. At a later stage it will be shown how this difficulty can be
overcome.
On the external system there happens to be an imaginary lattice for reading the water :

88 AQUEOUS SOLUTION AND THE PHASE DIAGRAM
this is parallel to the sides of the square and makes each triangular side of the pyramida triple co-ordinate diagram. *
It should be stated here that some workers prefer to express their data in terms of
mols per fixed quantity of water, e.g. 100 g. or 1,000 mols, instead of mols %. Lftwenherz
used this method for plotting his pyramid and for its orthogonal projection. By this
method the water contents of solutions are known but, here again, the composition of pointsin the internal system cannot be read from the diagram.
To summarize, two different types of projection have been described to represent the
reciprocal salt pair : the pictorial projection of the whole pyramid (Fig. 24), and its orthogonal
projection in plan (Fig. 28). The phase diagram, that is the three-dimensional figure, obeysthe same rules as already given for triple co-ordinate diagrams. To give two examples
only, removal of water moves the complex in a straight line away from the point repre-
senting water;
the proportion of liquid to solid in a complex is found by measuring the
line drawn from the solid point to the complex point and from the complex point to the
solution point. If a suitable three-dimensional figure were available there would be little
difficulty in applying the rules to practical examples, but there are certain limitations in
working with projections. An example of the use of such projections in practice is the
subject of the next chapter.

CHAPTER IX
SALT PAIR DIAGRAM APPLIED TO EVAPORATION
It is now proposed to work out one operation, evaporation of water, to show howa projection such as Fig. 24 can be used, although, as will be seen in the next chapter, wedo not recommend this method.
Pictorial Projection for Evaporation of Water. Accurate plotting and measure-
ment of the internal systems on a pictorial projection is difficult and tedious. In Fig. 24,
for example, the edges are of various lengths which necessitates the use of different scales
which, to say the least, is unsatisfactory and liable to error. Again, an internal point
cannot be read back without some additional information and this limits the use of such
a diagram. Although Fig. 24 shows the saturation surfaces well away from the apex this
condition is not found generally, with the result that the saturation surfaces are small
unless large diagrams are drawn.
All these difficulties can be avoided by the use of simple diagrams developed from
projections of the pyramid. The reason, however, for spending time and space on the
pictorial projection is that the understanding of phase reactions within the pyramid forms
the necessary background for the study of the diagrams developed therefrom.
Fig. 29 is reproduced from Fig. 24 with only one saturation surface drawn. The
apex W represents water and points on any line drawn from W to the base of the pyramid
represent changes in composition of a complex by the removal (or addition) of water. This
line will be referred to as the water line.
Mols per 700moIs.
XCl

90 AQUEOUS SOLUTION AND THE PHASE DIAGRAM
The water line chosen, WQ, passes through four fields : the liquid field and three fields
of solid and liquid. Suppose the point H represents a solution in the liquid field and that
water is removed without change of temperature. The complex moves from H, away from
W, to O in the liquid field, O being the intersection of the line with the saturation surface.
The movement of the complex continues through the field of XCl and solution to the point Pwhere the water line intersects the undersurface of the field. The complex then passes to
T through the field of XCl, XNO 3 and solution, T being on the undersurface of that field.
Further evaporation takes the complex towards Q through the field of XCl, XNO 3 ,YNO 3
and solution, Q representing the composition of the dried-up solution.
When the complex is at P and the solid phase is XCl the solution is at S, this being
where the line XC1.P produced meets the curve BF. Thus, while the complex is passing
from O to P, the solution moves from to S along a curve on the saturation surface.
Similarly, as the complex moves from P to T, the solution moves from S to F;
in this
case the solid phase has a changing composition moving from XCl to V, as explained in
dealing with Fig. 26. Further evaporation moves the complex from T to Q, but the com-
position of the solution remains constant at F, the solid phase moving from V to Q.
Heference to Figs. 25, 26 and 27 will make the above clear.
To proceed to the quantitative examination of this evaporation problem it is assumed
that the composition of H is given and has been plotted by the method already described.
The composition of Q is readily calculated and also plotted.
H QXCl .... 18-02 55-0
YNOj .... 4-26 13-0
XNO, .... 10-47 32-0
Water .... 67-25
The water line is drawn and the other points 0, P and T may be found as follows.
The water line is projected on to the base by drawing a line from the centre of the
base, W 1} through Q to meet the edge of the base at R. By drawing the line WR a vertical
plane WRWi is obtained. This plane cuts the boundary surfaces between the fields along
the lines 1 to 2, 3 to 4 and R to 4. The points 1, 3 and R are known because the curve LBand the lines XC1.B, and WR all lie on a surface of the pyramid.
In order to fix the points 2 and 4 the curves AE and EF and the line ^.XCl are
projected orthogonally on to the base. This means they are plotted from the data in
Table 22 by the method described in Chapter VIII for Fig. 28, bearing in mind that the
base is distorted. The projected points are lettered A^ E l and Ft
. The line ^\.XCl is
now drawn, and this line is a projection of ^XCl. From the point where the line RW l
produced cuts the curve A-^E-^ draw a vertical l line to meet the curve AE at 2. From
the point where the line RW}cuts the line ^.XCl draw a vertical 1 line to meet the
line FXCl at 4.
The lines 1 to 2, 3 to 4 and R to 4 cut the water line at 0, P and T respectively. Know-
ing the position of P the position of S is also fixed and, similarly, from T the position of
V is fixed.
To examine the phase reactions of a complex between and P a line is drawn from
XCl through the complex to give a solution on the curve OS, the proportion of solution to
solid conforming to the general rules. Similarly, for a complex between T and Q a line
1 Vertical in this sense means parallel to WW.
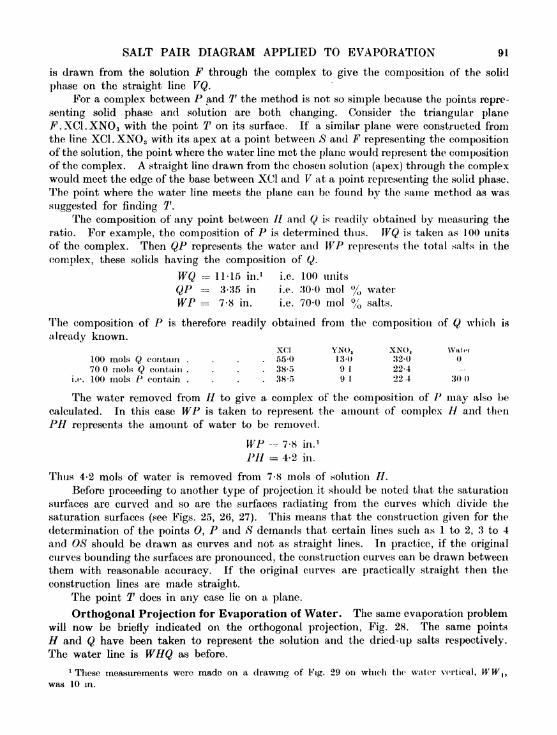
SALT PAIR DIAGRAM APPLIED TO EVAPORATION 91
is drawn from the solution F through the complex to give the composition of the solid
phase on the straight line VQ.For a complex between P and T the method is not so simple because the points repre-
senting solid phase and solution are both changing. Consider the triangular plane
T^.XCl.XNOg with the point T on its surface. If a similar plane were constructed fromthe line XC1.XNO 3 with its apex at a point between S and F representing the compositionof the solution, the point where the water line met the plane would represent the compositionof the complex. A straight line drawn from the chosen solution (apex) through the complexwould meet the edge of the base between XC1 and F at a point representing the solid phase.The point where the water line meets the plane can be found by the same method as was
suggested for finding T.
The composition of any point between // and Q is readily obtained by measuring the
ratio. For example, the composition of P is determined thus. WQ is taken as 100 units
of the complex. Then QP represents the water and WP represents the total salts in the
complex, these solids having the composition of Q.
WQ = 11-15 in.1
i.e. 100 units
QP = 3-35 in i.e. 30-0 mol % water
WP = 7-8 in. i.e. 70-0 mol % salts.
The composition of P is therefore readily obtained from the composition of Q which is
already known.XCl YNO, XNO, \VatM
100 mols Q contain .... 55-0 13-0 32-0
70 mols Q contain.... 38-5 9 1 22-4
i.e. 100 mols P contain .... 38-5 91 224 300
The water removed from H to give a complex of the composition of P may also be
calculated. In this case WP is taken to represent the amount of complex H and then
PH represents the amount of water to be removed.
WP - 7-8 in.1
PH = 4-2 in.
Thus 4-2 mols of water is removed from 7-8 mols of solution H.
Before proceeding to another type of projection it should be noted that the saturation
surfaces are curved and so are the surfaces radiating from the curves which divide the
saturation surfaces (see Figs. 25, 26, 27). This means that the construction given for the
determination of the points 0, P and $ demands that certain lines such as 1 to 2, 3 to 4
and OS should be drawn as curves and not as straight lines. In practice, if the original
curves bounding the surfaces are pronounced, the construction curves can be drawn between
them with reasonable accuracy. If the original curves are practically straight then the
construction lines are made straight.
The point T does in any case lie on a plane.
Orthogonal Projection for Evaporation of Water. The same evaporation problemwill now be briefly indicated on the orthogonal projection, Fig. 28. The same points
H and Q have been taken to represent the solution and the dried-up salts respectively.
The water line is WHQ as before.
1 These measurements were mado on a drawing of Fig. 29 on which the water vertical, W PT,,
was 10 in.

92 AQUEOUS SOLUTION AND THE PHASE DIAGRAM
It is obvious that the position cannot be found from this diagram alone, but in
some problems the composition of a saturated solution is known. Thus, if were the
starting point instead of H, P may be found as follows.
The line LO is drawn and produced to meet the curve BF at *S. This line may be an
interpolated curve if necessary. The line $.XC1 is drawn cutting the water line at P.
T can be found by plotting the drying- tip point of solution F at X, A line is drawnfrom X through Q to meet the outside edge at F. A line from V to F cuts the water line
at T. A comparison with Fig. 29 will show the reason for this.
The orthogonal plan has similar objections to the pictorial projection and its use for
technical problems is limited. It is not, therefore, proposed to spend any more time on
these projections but to proceed at once to the recommended method.

CHAPTER X
JlNECKE'S PROJECTION
There is another type of projection, introduced by Prof. Ernst Janecke l of Hanoverin 1906, which assumes that a shadow is cast from a point of light situated at the apexof the pyramid. This is still a plan, but the eye, instead of viewing the figure from a distance,is placed at the apex. The four external triangular surfaces are thus reduced to four
straight lines which form the boundaries of the projection. Fig. 30 is Janecke's projectionof the space model represented in Fig. 24, and the same lettering is used.
A glance back at Fig. 28 will show that in the new projection the external boundaryof the crater KALBMCND, has been distorted, and extended so that its outer boundary
XCl
MO,
XN03
FIG. 30.
coincides with the square base of the pyramid. The new figure has also been rotated
through 45 for convenience of plotting as will be seen later. Water is no longer representedat a point in the centre but has disappeared from the diagram. In Fig. 28 a change in the
amount of water in a complex moves the point representing the complex. In Fig. 30,
however, as the eye is imagined to be at the water apex, change in the amount of water,
although it moves the point in space, does not alter its apparent position on the projectionbecause the movement in space is in a straight line towards or away from the viewpoint.A point, therefore, on Fig. 30 represents the composition of a complex in terms of the salts
it contains, but gives no information as to the amount of water present.1 " Uber eine none Darstellungsform der van't Hoffschon Untersuchurig ubor ozoanische Salzabla-
gerangen," Z. anorg. Che.rn., 1906, 5t, 132; 1907, 52, 358, and 1907, 53, 319.
93

94 AQUEOUS SOLUTION AND THE PHASE DIAGRAM
The above means that in order to plot Janecke's projection, the data must be expressedas the amount of each salt in mols in a fixed quantity, usually one mol, of salts, not in
a fixed quantity of complex. In other words, water must be eliminated from the plotting
TABLE 23
THE QUATERNARY SYSTEM. XC1 . YNO3 .WATERRECIPROCAL SALT PAIR
The data in Table 22 has been calculated to mols per mol of salts and is given below. Water is
in mols per mol of salts and is the same for both sets of figures.
23A
KLMNABCDEF
HOPTQ
data. Table 23 has been thus calculated from the data in Table 22. A column for water
has been included because it will be required later : these figures express the water as mols
of water associated with one mol of salts at each point.
Any point on the diagram represents one mol of salts, mixed or pure according to its
position, but with the amount of water unspecified. Since the amount of salt is fixed at
one mol it is not possible to represent pure water on the figure because, however muchwater is added, there is always one mol of salts. Pure water can be considered as at infinity
vertically above the projection.
In Chapter VIII methods of plotting points within a square were fully described.
The figures in Table 23 may be used to plot the points for Fig. 30 in the same way, remember-
ing that where three figures are given as for point E the point is plotted as being within the
triangle of the three salts to which the figures apply.
The more usual method is to express the data in terms of radicals or ions, as given in
Table 23A. This also has been referred to when dealing with the base of the pyramid.In this case the diagonals of the square arc ignored and only two figures are required to
fix any point within the square providing that one figure is of a basic radical, and the other
of an acid radical. Table 23A actually gives four figures for every point, but in each case
two are redundant.

jlNECKE'S PROJECTION 95
An advantage of Janecke's projection is that having plotted any point its compositioncan be read back from the diagram. In fact, any point chosen within the figure can be
given a composition by measuring its position in the square. It is important to realize
just what such a composition implies, and Figs. 30 and 24 should be closely compared so
that the eye becomes trained to visualize a correct picture of the whole system, from
Janecke's projection. The relation of the four fields of Fig. 30 to the whole system mustbe clearly understood. Primarily they represent the four saturation surfaces of Fig. 24
,
but it is better to regard them as representing the four small inverted pyramids of Fig. 25.
This is because the usual use of these diagrams is to obtain one of the four salts pure andin the solid state, and for this result the complex must he within the corresponding field
which is one of these four small pyramids. Hence, when a point on Janecke's projectionis read in terms of the salts, it is assumed that the water content in the complex is the
amount demanded by the system to bring the complex within one of these inverted pyramids.
Janecke's Projection for Evaporation of Water, In order to illustrate the value
of this type of projection as compared with the orthogonal or the pictorial pyramid, it is
proposed to outline the same evaporation problem as was taken in Chapter IX.
On Fig. 30 the point Q is in the same relative position as it was on the base of Fig. 29
and, as the projection is from the water apex, the point Q represents all points on the water
line including H.
As water is evaporated from the solution H there is no movement of the complex on
the diagram. The problem, therefore, is to follow the movement of the solution and solid
phases during the evaporation, the water being assumed in each ease to be that which the
equilibrium demands.
During evaporation from H to (the letters //, 0, P, T, Q refer to Fig. 29, Q beingthe point on Fig. 30) there is no separation of solid and so, from the point of view of Janecke's
projection, there is no change in composition of the salts in solution.
As the complex changes from O to P (Fig. 29) XC1 is deposited as solid phase and the
solution moves from Q towards 8 on a straight line drawn from XC1 through Q. Thus,on this projection the composition of the salts in solution 8, or in any intermediate solution
between Q and S, is found accurately. The curve LOS (Fig. 29) must lie on a plane con-
structed from the edge W . XC1, because the only components removed from the solution
are water (by evaporation) and XC1 (by crystallization). This plane must cut any other
plane, in this case the base of the figure, in a straight line. Thus paths of crystallization
on Jdnecke's projection are straight lines when a single salt is being deposited.
The solution *Sy
, Fig. 30, is saturated with two salts XC1 and XN0 3 . On the removal
of more water, these two salts will be deposited and the composition of the solution will
move along the curve BF towards F, while at the same time the composition of the solid
phase will move along the edge of the square from XC1 towards V'. When the solution
reaches F the total solid phase is at K, FQV being a straight line.
On further evaporation the composition of the solution remains constant at F while
three salts are now deposited, XC1, XNO 3 and YNO 3 ,these being the salts with which the
solution is saturated. Furthermore, these salts are deposited in the same proportion as
they appear in the solution. Thus the composition of the total solid phase moves from
V towards F, reaching Q when the complex is completely dried up.
To sum up : the composition of the solution moves from Q to 8 while pure XC1 is
deposited, from S to F while a mixture of XC1 and XN0 3 is deposited, and remains at Fwhile the three salts are deposited. The amount of salts in solution relative to those

96 AQUEOUS SOLUTION AND THE PHASE DIAGRAM
deposited is found at any stage by the usual ratio methods. For example, when the solution
is at S, SQ represents solid XC1 and XCl.<) represents the salts in solution $. It must not
be forgotten that so far the water content has been ignored.
Advantages of JSnecke's Projection. The advantages of this type of diagram over
those of Figs. 24 and 28 are :
(i) ease of plotting a point,
(ii) there is only one scale for measurement,
(iii) any point found can be read in terms of the salts,
(iv) the saturation surfaces are not compressed into a small area,
(v) the paths of crystallization are straight lines so that solution points are determined
accurately.
It has to be admitted that water is ignored on Janecke's projection and this might be
considered a serious disadvantage. It is, however, considered better to introduce water
in another way than to lose the advantages of this type of projection. As a matter of fact,
most problems can be solved in outline on Janecke's diagram without any need to know
the amount of water until the final stage, and then by quite simple means the required
water contents are determined. In other words, Janecke's projection is sufficient where
relative solubilities are more important than the absolute solubility of each salt.
Janecke's Projection plus Water. Fig. 31 is a pictorial and isometric projection
of a Janecke's diagram in which the water content has been plotted vertically. The base
of the figure is a square, undistorted but rotated into a suitable position. Janecke's projec-
tion is plotted on this square from the data in Table 23. From the same table the water
data are used to plot a new series of points, which are plotted vertically above their corre-
sponding points on the base. When the necessary lines and curves have been drawn the
resulting figure is a square prism with the four saturation surfaces forming its upper
boundary.The new diagram is really the pyramid of Fig. 24, but with its four edges vertical.
It obeys the same rules as the pyramid, except that pure water cannot be represented, as
it now lies at infinity and therefore water lines are vertical. Also these water lines are all
drawn to the same scale which is an advantage over the pyramid. The composition of
a complex, in terms of mols per mol of salts, is read on the base, and the mols of water
per mol of salts are read upwards. When preparing the diagram any convenient scale
may be used for water.
In Fig. 29 the point H was chosen to represent an unsaturated solution from which
water was to be evaporated. In Fig. 31 the line HOPTQ represents the path of evaporation
of the complex and it is vertical. The measurement, using the water scale, of any part
of that line gives directly the mols of water concerned in a particular operation. Thus
the length HO represents the mols of water removed from a solution //, comprising one mol
of salts and HQ mols of water, in order to obtain a solution of composition O. It therefore
only remains to be able to plot the points O, P, T and Q accurately to be able to give
a quantitative description of the evaporation of solution H.
The point Q is plotted as described for Janecke's projection, Fig. 30. A vertical line
is drawn from Q, and H is marked since the mols of water per mol of salts in the solution His known. The position of O, where the solution is just saturated with XC1, is determined
by drawing a line from XC1 through Q to meet the curve BF at S. From S a vertical line
is drawn to meet the curve B1F l at Slf The line L lS l is drawn and, assuming the saturation
surface is a plane, where this line cuts HQ is the point 0.

JlNECKE'S PROJECTION 97
XCl
FIG. 31.
The point P is found by drawing the straight line $1 to cut HQ at P.The point T is found by drawing lines FQ, produced to V, and VFi to cut the water
line at T.
Thus Fig. 31 is a diagram which can be used in the same way as the pyramid, but withthe added advantage that the complete composition of any solution or complex can be read
directly from the diagram. For example :
P roadsS
XCl.
0-55
0-203
YNO..0-13
0-230
XNO,.0-32
0-567
Water.0-427 in 1-427 mols complex P0-753 in 1-753 solution Sl
These figures are readily calculated to mols %.XCl.
P - 38-60S - 11-57
YNO,.9-10
13-13
XNO,.22-40
32-40
Water.
29-90
42-90

98 AQUEOUS SOLUTION AND THE PHASE DIAGRAM
The amount of water to be evaporated from solution H to give complex P may be found
by measuring the distance HP, which is 1-623 units of the water scale. That is, 1-623 mols
of water must be removed from a quantity of solution H which contains 1 mol of salts. Thewater in H, i.e. HQ, measures 2-05 mols. So 1 mol salts in H becomes 1 + 2-05 = 3-05 mols
solution H.
3-05 mols 1-623 mols water = 1-427 mols complex P.
(1-427 mols complex P = I mol salts, 0-427 mols water.)
When the complex is P it is a mixture of solid XC1 and solution S lm The proportions of
solid to liquid are found by measuring the proportions of the line SQ and XC1.Q. Byreading these distances on the scale of the base it will be found that
7-97 mols Q = 3-47 mols XC1, 4-5 mols S (salts in solution Si)
1 mol Q = 0-435 mols XC1, 0-565 mols S1 mol Q = 0-427 (QP) mols water = 1-427 mols complex P1 mol 8 = 0-753 (881) mols water = 1-753 solution 8t
so 0-565 mols 8 = 1-753 x 0-565 = 0-992 #,.
That is, 1-427 mols complex P = 0-435 mols solid XC1 -f 0-992 mols solution.
Janecke's Projection plus Water (simplified). Provided the principles of Fig. 31
are clearly understood, it is not always necessary to have the complete isometric figure.
A simple plan and elevation of it makes it possible to draw the diagram on squared paper.The plan is simply Janecke's projection and the elevation is a horizontal view of the curve
or curves being used. Fig. 32 shows such a simplification. It is the same as Fig. 30 as
regards the plan, except that it has been rotated for convenience to make the YC1.XC1 line
the base.
For the elevation the line YX is the base because on the Y side are YN0 3 and YC1,while on the X side there are XN0 3 and XC1. The projection of any point is easily markedon the elevation by projecting upwards vertically from the plan and measuring the water
content (in mols) from the base line using any convenient scale. In the particular examplewhich has thus far been considered, i.e. evaporation of water from solution H, it is only
necessary to plot on the elevation that part of the diagram associated with the point H.
(H is plotted on the elevation and Q is its position on the plan.) Thus the curve FiS^Bihas been drawn by projecting the points FSB along the vertical lines of the paper and
plotting the mols of water for F, 8 and B respectively. The mols of water for pure XC1are also plotted at LI and a vertical line is drawn from Q 1 through H to represent the water
line. On the plan a line from XC1 through Q gives 8, which is projected on to the curve
FiBi at #,.
From Si a line drawn to LI cuts the water line at and a similar line to X cuts the
water line at P. Finally, a line from FI to X (now representing the point V of the plan)cuts the water line at T. The diagram is thus complete for an evaporation problem, the
points O, P, T and Q being interpreted as described for Fig. 31.
In using this simplified diagram the elevation may be drawn on any side of the square,but it is generally convenient to choose the side which gives the elevation of the requiredcurve without undue foreshortening. In addition to the ease of plotting and reading, the
method of representing water used in Fig. 32 has the advantage that two or more tempera-tures can be shown on one diagram.

JANECKE'S PROJECTION 99
MoIs water
\~2-0
-1-0
H
YCl XCl
General Survey of Janecke's Diagram. Fig. 33 is the same system
YCl -f XN0 3 ^ YN0 3 + XCl
and water as Fig. 32, but the new diagram is plotted from the data in Table 24, which is
intended to represent a different temperature, and as the solutions contain more water it
will be correct to say a lower temperature. Fig. 33 is therefore the same system but shows
a different isotherm. The new isotherm shows the reciprocal salt pair in its simplest form.
The two quaternary invariant points each fall within their own triangles ;thus solution E is
saturated with XCl, YNO 3 and YCl, and its composition can be expressed in terms of these
same three salts. The same applies to solution F, the components being in this case water
XCl, YN0 3 and XN0 3 . For this reason both E and F are said to be congruently saturated.

100 AQUEOUS SOLUTION AND THE PHASE DIAGRAMFIG. 33a.
Water
XCl
XCl
The four saturation surfaces can be divided into two pairs. The YC1 and XN0 3 are
the unstable pair, because the surfaces are separated by the length of the curve EF and
these salts cannot exist in equilibrium with each other and a solution. The XCl arid
YN0 3 surfaces form the stable pair because they can both exist together hi equilibrium in
contact with a solution, the solution being at any point on the curve EF. If the solution
is at H, then not only do the two salts XCl and YN0 3 form a stable pair, but they form
with water a ternary system in spite of the absence of a common ion.
If the point lies on the saturation surface it represents a solution just saturated as
to YN0 3 . If water is evaporated isothermally the point representing the composition of

JlNECKE'S PROJECTION 101
TABLE 24
THE QUATERNARY SYSTEM. XC1.YNO3 .WATEB
RECIPBOCAL SALT PAIR AT LOWER TEMPERATUREFor the same reciprocal salt pair as given in Tables 22 and 23 but the figures below are for a
lower temperature.
the solution moves in a straight line from YN0 3 through G to meet the curve EF at H.That is, the diagonal is the path of crystallization. When the solution is at H further
evaporation causes both YN0 3 and XC1 to be deposited in the same proportion as they are
present in the solution, so that the composition ofH now remains unchanged, and if sufficient
water is removed the solution finally dries up at composition H. (See Chapter VI on
ternary systems.)A point representing a saturated solution on any other part of the YN0 3 surface and
not falling on the diagonal YN0 3 .XC1 would, on the removal of water, deposit YN0 3
and the solution point would move towards the curve EF or either of the curves FC or ED,according to the position chosen. When the point reached the curve the solution wouldbe saturated with two salts, YNO 3 and one of the other three. The second salt would be
YCl if the path of crystallization met the curve ED, XC1 for the curve EF and XNO 3 for
the curve F(J,
When the solution point reached the curve, the removal of more water would cause
two salts to be deposited and the point would move along the curve away from a point
representing the composition of the solid phase being deposited. For example, the point Pmoves along the path of crystallization drawn from YN0 3 , and when the point meets the
curve at Q the solution is saturated with YNO 3 and XNO 3 . If more water is removedYN0 3 and XN0 3 are deposited, and the composition of the mixture is represented bya point near C (actually C if FC is a straight Line). The solution point must therefore
move away from C, that is, towards F. In the same way a solution point moving alongthe line drawn from YN0 3 through the point J represents a solution which when at O is
saturated with both YNO 3 and XC1. On the further isothermal evaporation of water both
YN0 3 and XC1 will be deposited, and the solution point will move away from the point
representing the composition of the mixture which is being deposited. This point mustbe //, because the composition of the mixture lies on EF, assuming EF to be a straight line
and the mixture contains only YN0 3 and XC1. The point O therefore moves towards F in
the same way as did the point Q.

102 AQUEOUS SOLUTION AND THE PHASE DIAGRAM
When the solution point meets the point F the solution is saturated with three salts,
and the removal of water causes the deposition of all three salts YN0 3 ,XC1 and XN0 3 ,
and the composition of the mixture being deposited is represented by F. The compositionof the solution can now no longer change when water is removed isothermally and the
solution dries up at composition F.
Had the points J and P been chosen on the other side of the diagonal YNO 3 .XC1 the
phase reactions would have been just the same except that E would have been the drying-up
point instead of F. Also, what is true for points and paths of crystallization in the YN0 3
field is equally true for the XC1 field. In the YC1 field a line drawn from YC1 througha point would meet either the curve ED or EA. The removal of water from the solution
represented by the point where the line met the curve would cause the point to move towardsE. Similar remarks apply to the XN0 3 field.
It will now be realized that the diagonal YN0 3 .XC1 divides the isotherm into three
systems. One system, which is the diagonal itself, is ternary with H as the drying-up point.The two remaining systems are both quaternary, being XCl YNO 3 YC1 and water withE as the drying-up point, and X01 YNO 3 XN0 3 and water with F as the drying-up
point. The arrow-heads on the paths of crystallization and on the curves, themselves pathsof crystallization, indicate the direction in which the compositions of solutions move whenwater is removed isothermally. If water is added, the points move in the opposite direction,
but the principles are exactly the same.
Fig. 33a shows the elevation of the ternary system on the diagonal.
Janecke's Diagram with Incongruent Point. The simplest possible case of the
reciprocal salt pair isotherm has been considered under Fig. 33, and it is now proposed to
revert to the slightly more complicated case of Fig. 32 which has been replotted as Fig. 34
YClK D W N
R
XCl XMO*
FIG. 34. Higher Temperature.

jlNECKE'S PROJECTION 103
There are four saturation surfaces similar to those on Fig. 33. One pair of these
surfaces, YNO 3 and XC1, form the stable pair and the other pair YC1 and XN0 3 form the
unstable pair, as was the case in Fig. 33. In contrast, however, with Fig. 33 neither diagonaldivides the Fig. 34 isotherm into two similar systems because the point E has moved over to
the other side of the XC1 .YNO 8 diagonal and is within the system XC1 .YNO 3 .XNO 3 . water,that is, it is within the same system as is the point F. Again, neither diagonal can beformed into a ternary system, the whole internal system being quaternary. The pointE is incongruent.
Phase reactions in the XNO 3 field in Fig. 34 are exactly the same as for Fig. 33;
in
the three remaining fields there are certain differences.
In either of the two fields forming the stable pair, that is XC1 and YNO 3 ,there are
three types of phase reactions. Taking the diagonal XC1.YNO 3 ,two of these types occur
when the point representing the complex falls on that side of the diagonal on which lies
the curve dividing the stable pair (EF). The first case is when the path of crystallization
meets one of the three curves EF, FB or FC. For example, the point Q where the pathof crystallization meets the curve EF, or 6?! where the path meets the curve FB. TakingG to represent a solution saturated with XC1, then on the removal of water the solution
point moves to H where the solution is saturated with XC1 and YN0 3 . On removing morewater the solution point moves towards F as both YNO 3 and XC1 arc being deposited.The composition of the mixture passing into the solid phase during this period is repre-
sented by 8 on the diagonal. When the solution was at H the solid phase was XC1, and
by the time the solution point has moved from H to F the solid phase has moved from
XC1 towards 8 to the point J. From the point F the further removal of water depositsall three salts, the mixture deposited having the composition F. Nor does the solution
composition change, but remains at F until dried up.The phase reactions of G l are similar, except that the mixture of two salts is XC1 and
XN0 3 of composition B. Points similar to G and G^ could have been chosen in the
YN0 3 field.
The second type of phase reaction in either of the fields forming the stable pair is whenthe position of the complex on the saturation surface, though still on the same side of the
diagonal X01.YN0 3 ,is such that the path of crystallization meets the curve ED or EA.
The point T may be taken as an example, where the line from YN0 3 through T meets the
curve ED at O. Removal of water beyond that stage causes two salts, YNO 3 and YC1,to be deposited while the solution point moves from O to E and when the solution is at
E the solid phase is at W. The solution at E is now saturated with three salts, XC1, YN0 8
and YC1. The removal of water causes XC1 and YN0 3 to be deposited and YC1 to be dis-
solved, the composition of the solution being unchanged. (This is explained later with
Fig. 34a.) The solid phase moves from W towards E, arriving at V on the diagonal whenall the YC1 is dissolved. On still further removal of water the composition of the solution
moves from E towards F, that is, away from 8, which represents the mixture being deposited.
The solid phase now moves from V towards U, arriving at U when F is the compositionof the solution. Then, as the solution dries up at composition F, the solid phase moves
from U to T.
The third type of phase reaction within the XC1 or YN0 3 field is when the complexfalls within the system XC1.YN0 3 .YC1. water, that is, on the other side of the diagonal,
and the point Q can be used as such an example. With water removal the solution point
moves from Q to Z and XC1 is the solid phase. The solution point then moves along the

104 AQUEOUS SOLUTION AND THE PHASE DIAGRAM
curve from Z to E and XC1 and YC1 are deposited, the composition of the deposit beingA, but the composition of the total solid phase moving from XC1 to /. Further isothermal
evaporation causes XC1 and YN0 3 to be deposited and YC1 to be dissolved, but the com-
position of solution E remains unaltered. The composition of the solid phase moves from/ towards Q, and arrives at Q when the solution has dried up at composition E. Thepoint E is therefore a drying-up point, but it is incongruent, and so not a final drying-uppoint. It is a drying-up point only if the complex lies within the system which has for its
components the three salts with which it is saturated.
The point E is said to be incongruently saturated because, although it is saturatedwith XC1, YN0 3 and YC1, its composition cannot be expressed in positive terms of thosethree salts. An incongruently saturated, quaternary invariant point such as E is nota drying-up point at all if the solid phase is removed as the evaporation proceeds. In that
case, when the solution reaches composition E, as the solids have been removed, there is
no solid YC1 to be dissolved and the composition of the solution does not even pause atE but moves straight on to F, that is, F is the only true drying-up point in the whole system.
The arrow-heads on the paths of crystallization show how the composition of thesolutions move from the complexes to the curves, and the arrow-heads 011 the curves,themselves paths of crystallization, show how the compositions move towards F.
Finally, the YC1 field may be regarded as divided by the diagonal XC1.YN0 3 ,and
complexes on either side of this diagonal behave similarly to the second and third typesalready described for the stable pair fields.
The isotherms represented on Figs. 33 and 34 are both common types and will serveas examples of all cases where no double salts or hydrated solid phases are formed. It is
quite common for the isotherm to take one form such as Fig. 33 at one temperature andanother form as Fig. 34 at another temperature. It is also possible through a temperaturerange for the changes in the form of the isotherm to be such that the stable pair at one
temperature becomes the unstable pair at another temperature. This could only comeabout by the curve EF becoming shorter and shorter until E and F were at one point andthen for E and F to diverge again, but in a direction which pulls the fields of the formerstable pair apart so that they now become the unstable pair. This shows that still anotherform of isotherm is possible, that is, when E and F are at one point which representsa solution saturated with all four salts at a certain definite temperature.
On page 103 it was stated that the composition of the incongruently saturated invariant
solution, represented by the point E on Fig. 34, is not changed by the removal of water if
the temperature is not allowed to alter. According to the phase rule the compositioncannot change so long as the three solid phases, XC1, YC1 and YN() 3 are in contact withthe solution, making four phases in all. (See Chapter XIII.) The system is quaternaryand is condensed, so the formula becomes
C -f- 1 = P + F4 + 1=4 + 1
The one degree of freedom has been used up by choosing the temperature of the isotherm,and so the composition of the solution, represented by the point E, is fixed by nature.
Although the composition of solution E does not change, the removal of water causestwo solid phases, XC1 and YN0 3 , to be deposited and the solid phase Yd to dissolve. Thephase rule gives no direct indication of this
;it merely states that three solid phases must
be present. The phase diagram shows what these three solid phases are and also shows

JANECKE'S PROJECTION 105-
that one of the solid phases, and which one, will dissolve as the others are deposited.
Fig. 34a demonstrates how it is possible for XC1 and YNO 3 to be deposited from solution E,for YC1 to dissolve when water is removed, and for the composition of the solution to be
unchanged. This figure is a reproduction of Fig. 34 with the appropriate lines.
On Fig. 34a the line from YN0 3 to a point a passes through E. The point a maybe chosen within limits and the distance from E to a gives the proportion of YN0 3 depositedfrom solution E. The line from XC1 and through the point b passes through a and thedistance from a to b gives the proportion of XC1 deposited from the composition represented
by point a. The line from YC1 through the point 6 passes through E and the distance 6 to
E gives the proportion of YC1 added to the composition, represented by the point 6, in
order to give composition E.
Fin. 34a.
Water could have been shown on an elevation, but it is not necessary ;if the composition
of the salt mixture in the solution is unchanged and the temperature is unchanged, then
the composition of the solution is unchanged so long as the three solid phases are presentand the system is at equilibrium. The following calculation is a quantitative proof that
solution E can remain unchanged in composition.If the distances are measured parallel to the base of the square which represents 1 mol
and is considered as divided into 100 parts
0-300 mol of YN0 3 is removed from 0-7 mol of salts in solution E.'. 0-428 ,, 1-0
This leaves 1-0 0-428 = 0-572 mol of mixture of composition a
0-400 mol of XC1 is removed from 0-700 mol of salts in mixture a
;. 0-327 ,, 0-572

106 AQUEOUS SOLUTION AND THE PHASE DIAGRAM
This leaves 0-572 - 0-327 = 0-246 mol of salts in mixture 6.
0-100 mol of YC1 is added to 0-600 mol of salts in mixture 6
.''041 0-246
To summarize :
x.1-000 mol of solution E ^ 0-458
0-428 mol YNO3 deposited =
0-572 mol salts in solution = 0-4580-327 mol XC1 deposited = 0-327
0-245 mol salts in solution - 0-1310-041 mol YC1 dissolved --=
0-286 mol salts in solution = 0-1311-000 mol salts in solution -- 0458
and the first solution is still E.
Heating and Cooling. The two isotherms represented in Figs. 33 and 34 havebeen plotted on one diagram as Fig. 35 for the purpose of studying the principles of heatingand cooling. An example in the XNO 3 field, say the point (Fig. 35), may be taken to
represent a solution saturated with XN0 3 and XC1 but containing some YNO 3 and at the
higher temperature. This solution is now cooled to the lower temperature when the
point G falls within the XNO 3 field on the plan. Draw a line from XNO 3 through G to
meet the curve F lB l on the plan when the point // represents the composition of the solution,
but only if the amount of water is such that H falls on the curve FiBi at the given lower
temperature. If the amount of water is too small the case is equivalent to water havingbeen evaporated and the solution point will have moved from H towards F. If the amountof water is too great the solution point will not have reached H but will be on the XN0 3
saturation surface somewhere on the line GH.Mark the point G on the elevation of the curve FB and draw a line from N0 3 (repre-
senting XNO 3 ) through G on the elevation. It will be seen that this line does not meetthe curve F^B^ on the elevation. Now draw a line on the elevation from // to C lt that is,
on the saturation surface, and where this line cuts the line from NO 3 through G is the point 7.
Project the point / on to the plan and mark it on the line GH at / on the plan. Then, if
G represents a solution at the higher temperature and if this solution is cooled to the lower
temperature, the solid phase will be pure XN0 3 and the solution will be represented by J.
The amount of water in solution / is read from the elevation, while the composition of
solution I and the proportion of solution to solid is read from the plan. The proportioncan, of course, be read from the elevation, but the plan is more convenient.
Thus:Solution G before cooling (1 mol of salts) has the composition
XCl.
0-235YNO..0-065
XNO,.0-700
Water.
0-80 mol
After cooling :
0-365 mol G = 0-235 mol solution / + 0-13 mol XN0 8
(XN0 3 to /) (XN0 3 to 0) (I to G)i.e. 1 mol G = 0-644 mol solution / -f 0-356 mol XNO 3

JlNECKE'S PROJECTION 107
The composition of solution / (1 mol salts) is
xci.0-365
Thus 0-644 mol = 0-235
YNO,. XNO,. Water.0-100 0-535 1-26 mol0-065 0-344 0-80 mol
Subtract 0-644 mol of solution / from 1 mol solution G and the mols XN0 8 deposited willbe found to agree with the figure given above,
xci. YNO,. XNO,.G = 0-235 0-065 0-700/ = 0-235 0-065 0-344
Water.
0-80 mol complex0-80 mol liquid phase
Mots water75r
0-356 mol solid phase
A/O3
YCl
XCI

108 AQUEOUS SOLUTION AND THE PHASE DIAGRAMA greater yield of solid XN0 3 would have been obtained if the point / had been very
near to H. On the elevation draw a line from H to NO 3 ,and where this line cuts the G water
line (the vertical through 0) at the point J gives the mols of water that the original complexshould contain in order to obtain the maximum yield of solid XNO 3 . O would not thenbe a clear solution at the higher temperature. The amount of water to be removed froma quantity of solution containing 1 mol of salts is found by measuring the distance GJ onthe elevation. Had that amount of water been removed from solution O before cooling,G would have become a mixture of a solution on the curve FB, somewhere between G and F y
and a solid made up of XN0 3 with some XC1. On cooling this mixture and allowing it toreach equilibrium, the solid would be XN0 3 and the solution would be representedby //.
As a different type of reaction take the point O on the curve FC to represent a solutionat the higher temperature, saturated with XNO 3 and YNO 3 . On cooling the solution to
the lower temperature the point is within the YN0 3 field on the plan. Draw a line
from YN0 3 through to meet the curve F C\ at P and draw a similar line from NO 3 (repre-
senting YNO 3 ) through O on the elevation to meet the curve F-fJi on the elevation. It
will be noticed that this line does not meet the curve at the point P which was projectedfrom the plan, but at Q, and if another elevation were drawn with Y and X as the baseit would be seen that the line from N0 3 through O did not meet the curve F-f}^ on theelevation at all but passed under it. It is, however, not necessary to draw another elevation.
In order to fix a point in space three axes are needed;the diagram provides two of them
and the third is provided by the well-known rule that the complex lies on a straight line
drawn from the solid phase to the solution. The point NO 3 on the elevation representsany mixture of XN0 3 and YN0 3 including, of course, the pure salts. If the line on theelevation drawn from NO 3 through is considered as drawn from some point on the side
of the square representing a mixture of XNO, and YN() 3 , there must be a point Q on thecurve F VC\ representing a solution in phase with that solid and a straight line drawn fromthe point representing that solution to the point representing the mixed solid in phasewith it must pass through O. If, therefore, a rod of adjustable length were hinged freelyin space at O, one end of the rod could be moved along the edge of the plan YNO 3 .XNO 3
until the other end met the curve F tt\ at the point Q. Actually all that is necessary is
to draw the line NO 3 .OQ on the elevation, project Q on to the plan and draw the line QORon the plan. Then, on cooling solution O from the higher temperature to the lower tempera-ture, Q represents the solution and R the solid phase.
Had the solution point been at P the solid phase would have been YN0 3 , but, as thereis too little water, the solution point has moved from P to Q. Adding water will movethe solution point from Q towards P and the solid phase from R towards YNO 3 . Theamount of water to be added to the quantity of solution containing 1 mol of salts is indicated
by the distance OS on the water line of the elevation (the vertical line) through 0. Thewater could conveniently be added before the cooling.
Heating a solution or mixture of solution and solid is similar to cooling except thatthe reactions take place in the reverse order.
Similar examples could be taken for solution on the curves DE or AE with similar
results. An example on the curve EF, but with a different salt pair, will be studied in thenext chapter. The points O and O representing the hot solution need not have been onthe curves. Had they been lying on the saturation surfaces, that is saturated with one salt
only, it would have made no difference to the principles involved. The above examples

JANECKE'S PROJECTION 109
have made it clear that when studying phase reaction by means of Janecke's projections
of the isotherms, the complex does not change its position during heating or cooling nor
during the addition or removal of water. It is only the points representing the solution
and the solid phase respectively that can move and the three points representing solution,
complex and solid phase always lie on one straight line.

CHAPTER XI
PRACTICAL EXAMPLES USING JlNECKE'S PROJECTION
Preparation of Potassium Nitrate from Sodium Nitrate and PotassiumChloride. The operations of heating and cooling, evaporating and diluting, adding andremoving salts are all taken together in the process of making potassium nitrate fromsodium nitrate and potassium chloride. The diagram required is shown in Fig. 36, which
MoIs water
KCl
NaClMA/a/V03

PRACTICAL EXAMPLES USING JlNECKE'S PROJECTION 111
has been plotted from the data given in Table 25 and shows two isotherms, one at 25 C.and one at 75 C. for the system :
NaNO, -f KC1 ^ KNO 3 + NaCl and water.
TABLE 25
THE QUATERNARY SYSTEM, NaNO3 . KC1 . WATER, FORMING THERECIPROCAL PAIR NaNO3 + KC1 ^ KNO3 + NaCl
Mol Icms per Mol of Salts
Data at 25 C. from W. Reinders, Z. anorg. Chem., 1915.Data at 75 C. from E. Coriioc and H. Krombach, Caliche, Sept. 1928.
The two isotherms are similar to those studied using X and Y for the positive ions, but it
will be noticed that the amounts of water per mol of salts are in all cases much greater.This makes no difference to the principle nor to the general form of the diagram as a con-
venient scale may always be chosen for water.
At 75 C. the curve EF divides the fields of the stable pair of salts, KN0 3 and NaCl,and solution F is congruently saturated while solution E is incongruently saturated.
At 25 C. the curve E^F^ also separates the same stable pair, and the points El andF 1 both represent solutions which are congruently saturated. Solution F is congruentlysaturated in the system NaCl.KNO 3 .NaNO 3 . water, but in addition to being representedin terms of the three salts mentioned it may be represented in terms of KC1 and NaN0 3 ,
because it falls on the diagonal between those two salts. The point F is therefore a ternaryinvariant point in the system KC1.NaNO 3 . water at 25 C.
The point E l represents a solution saturated with NaCl.KN0 3 and KC1, and may be
represented in terms of NaCl, KNO 3 and no KC1. E is a ternary invariant point in the
system NaCl.KNO 3 . water at 25 C. E l and F t are therefore both final drying-up points,but if the solution point is anywhere on the curve E lF l except at the point E v on the diagonal,,the solution point will move towards F t and dry up at F 1 on the removal of sufficient water.
It is now proposed to take as an example the production of potassium nitrate froma mixture of potassium chloride and sodium nitrate by double decomposition. The
potassium nitrate will be obtained by cooling a suitable solution from 75 C. to 25 C. and
removing the potassium nitrate crystals from the mother liquor. The raw material is
a mixture of potassium chloride and sodium nitrate and these would conveniently be added

112 AQUEOUS SOLUTION AND THE PHASE DIAGRAM
in equimolecular proportions represented by the centre of the square, point 0. The mixture
may also be considered as equimolecular proportions of sodium chloride and potassiumnitrate.
The composition of the hot solution may conveniently be a point on the curve EFsaturated with KN0 3 and NaCl. Inspection shows that the greatest yield of KNO 3 will
be obtained (for the temperatures chosen) if the composition of the hot solution is near E.
Let the point a be chosen to represent the composition of the hot solution;then b on the
line KNO 3 .a produced will be the composition of the cold solution. Solution b, after
separating the KNO 3 crystals, will be heated and the correct quantity of mixture O addedto give a complex at c, and the temperature will be maintained at 75 C. until equilibriumis attained. The solid phase will then be NaCl, which is removed, and the composition of
the solution will be at point a again. The process is cyclic : hot solution a is cooled, givingsolid KNO 3 and solution b
; solution b plus mixture O gives complex c, which when heated
yields solid NaCl and solution a.
To start the process solution a or b must first be prepared. Solution b could be obtained
by adding the correct amount of water to a mixture of KC1 and NaN0 3 , represented bythe point d and cooling to 25 C. This would give solution b and a small yield of KN0 3 .
Having traced out the cycle in what appears to be the best position on the plan pro-
jection, it is necessary to consider the amounts of water required in the various solutions.
Solution a is projected on the curve EF on the elevation, a line is drawn from a to Cl
(representing NaCl) and the point c is projected on this line. Solution b is projected onthe curve E lF l and a line is drawn from this point to NO 3 (representing KNO 3 ).
It will
be seen that the line NO Z b does not pass through the point a, but passes above it at a l ;
thus it is clear that in this case water must be added to solution a to move it into the all-liquid
field at 75 C., so that it will be in the KNO 3 field during most of the cooling period and
only reach the curve EF at the point b at the final temperature. The amount of water
to be added for 1 mol of salts in solution a is given by the vertical distance between a and a t .
After cooling, solution /; contains the added water, and this is removed by concentratingthe whole or a part of this liquor so that the solution is represented by the point 6 X . Theamount of water to be removed from 1 mol of salts in solution b is given by the vertical
distance between b and 6 X . The point b t may be found by drawing a line from NO 3 (repre-
senting KN0 3 ) through a and producing to meet the water line drawn vertically from b.
The removal of water from b is represented by a vertical line only, because when solution b
is heated it becomes unsaturated and, on the 75 C. isotherm, is in the field of all liquid.
A line drawn from b l to the point O on the elevation passes through the point c, andthe original complex is again formed by mixing solution b l and mixture O in the proportionsobtained by measuring the line bcO on the plan.
The cycle of operations and reactions is summarized as follows :
(1) Complex c at 75 C. yields solution a and solid NaCl.
(2) Solution a with water added yields solution a,, which is unsaturated at 75 C.
(3) Solution a l when cooled to 25 C. yields solution b and solid KNO 3 .
(4) Solution b when heated and water removed yields solution 6 X ,which is unsaturated
when hot.
(5) Solution b { plus mixture O yields the original complex c.
The elevation on Fig. 36 is given on a larger scale as Fig. 36a, and it is now proposedto study the procedure and reactions in more detail. Starting from complex c, this mixture
is agitated at 75 C. until it has reached equilibrium. In practice, the agitation might be

PRACTICAL EXAMPLES USING JlNECKE'S PROJECTION 113
continued until samples of the clear liquor showed no further change in specific gravityat 75 C. The solid salt and the solution are then separated at 75 C. and solution a is
diluted to give solution a 1? which is then allowed to cool to 25 C. to obtain solid potassiumnitrate and solution b.
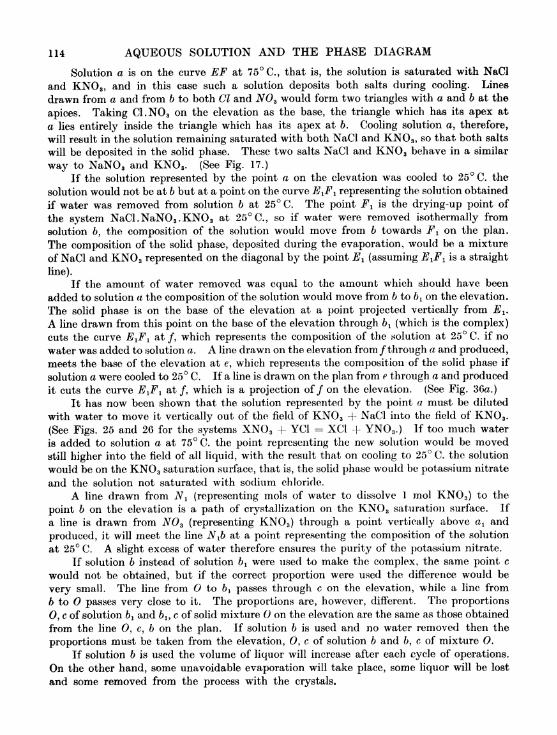
114 AQUEOUS SOLUTION AND THE PHASE DIAGRAM
Solution a is on the curve EF at 75 C., that is, the solution is saturated with Nadand KN0 8 ,
and in this case such a solution deposits both salts during cooling. Lines
drawn from a and from 6 to both Cl and N03 would form two triangles with a and 6 at the
apices. Taking C1.N0 3 on the elevation as the base, the triangle which has its apex at
a lies entirely inside the triangle which has its apex at 6. Cooling solution a, therefore,
will result in the solution remaining saturated with both NaCl and KN0 3 ,so that both salts
will be deposited in the solid phase. These two salts NaCl and KNO 3 behave in a similar
way to NaN0 3 and KNO 3 . (See Fig. 17.)
If the solution represented by the point a on the elevation was cooled to 25 C. the
solution would not be at b but at a point on the curve EJ?i representing the solution obtained
if water was removed from solution 6 at 25 C. The point F is the drying-up point of
the system NaCl.NaNO 3 .KNO 3 at 25 C., so if water were removed isothermally from
solution b, the composition of the solution would move from b towards F on the plan.
The composition of the solid phase, deposited during the evaporation, would be a mixture
of NaCl and KN0 3 represented on the diagonal by the point E (assuming J^i is a straight
line).
If the amount of water removed was equal to the amount which should have been
added to solution a the composition of the solution would move from b to b l on the elevation.
The solid phase is on the base of the elevation at a point projected vertically from E.A line drawn from this point on the base of the elevation through b-^ (which is the complex)cuts the curve E lF l at /, which represents the composition of the solution at 25 C. if no
water was added to solution a. A line drawn on the elevation from/through a and produced,
meets the base of the elevation at e, which represents the composition of the solid phase if
solution a were cooled to 25 C. If a line is drawn on the plan from e through a and producedit cuts the curve EJ?i at /, which is a projection of/ on the elevation. (See Fig. 36a.)
It has now been shown that the solution represented by the point a must be diluted
with water to move it vertically out of the field of KN0 3 + NaCl into the field of KN0 3 .
(See Figs. 25 and 26 for the systems XNO S + YC1 = XC1 + YN0 3 .) If too much water
is added to solution a at 75 C. the point representing the new solution would be movedstill higher into the field of all liquid, with the result that on cooling to 25 C. the solution
would be on the KN0 3 saturation surface, that is, the solid phase would be potassium nitrate
and the solution not saturated with sodium chloride.
A line drawn from N (representing mols of water to dissolve 1 mol KN0 3 )to the
point 6 on the elevation is a path of crystallization on the KNO 3 saturation surface. If
a line is drawn from N0 3 (representing KN0 3 ) through a point vertically above a l and
produced, it will meet the line Nfi at a point representing the composition of the solution
at 25 C. A slight excess of water therefore ensures the purity of the potassium nitrate.
If solution 6 instead of solution b 1 were used to make the complex, the same point c
would not be obtained, but if the correct proportion were used the difference would be
very small. The line from to 6 t passes through c on the elevation, while a line from
b to O passes very close to it. The proportions are, however, different. The proportions
0, c of solution b 1 and b lt cof solid mixture on the elevation are the same as those obtained
from the line 0, c, b on the plan. If solution b is used and no water removed then the
proportions must be taken from the elevation, 0, c of solution b and b, c of mixture O.
If solution b is used the volume of liquor will increase after each cycle of operations.
On the other hand, some unavoidable evaporation will take place, some liquor will be lost
and some removed from the process with the crystals.

PRACTICAL EXAMPLES USING JlNECKE'S PROJECTION 115
A cycle of reactions has now been studied qualitatively for the conversion of sodiumnitrate and potassium chloride into potassium nitrate and sodium chloride between twotemperatures. Table 26 shows how the reactions may be followed quantitatively and anexplanation of the method used is added. The compositions represented by the various
points are as follows :
KNO,. NaCl. NaNO, Water.c .0421 0-474 0-105 1-55 mols per mol of saltsa . . . . 600 0-250 0-150 2-21
i - 0-600 0-250 0-150 2-40b 0-304 0-435 0-261 4-20
bi . . . . 0304 0-435 0-261 3-84"
TABLE 26
0-750 mo] salts as complex c 0-526 mol salts as solution a + 0-224 mol NaCl.0-626 mol salts as solution a require 0-10 mol added water.
0-750 mol salts as complex c
224 mol NaCl removed .
0-10 mol water added
0-526 mol salts as solution a
KNO 8
0-316
Mols per Mol of Salts.
NaCl NaNO,.
0316
0-3550224
0-131
Water.
0079 1-16
0-10
0-079 1-26
526 mol salts as solution a - 0-302 mol salts as solution b -f 0-224 mol KNO3 .
0302 mol salts as solution b require 0-10 mol water to be removed.
526 mol salts as solution al
.
0-224 mol KNO3 removed0-10 mol water removed .
302 mol halts as solution
0316j
131
0-224I
0092 131
0-079
0079
1-26
010
1-16
0-302 mol salts as solution0-448 mol mixture O
0-750 mol salts as complex c
00920-224
0-316
0-131
0-224
0355
0-079
0079
1-16
1-16
302 rnol salts as solution 6 X -f 448 mol mixture O = 0-750 mol salts as complex c.
EXPLANATION OF TABLK 26
The procedure might be as follows :
The diagram is plotted on squared paper from the data given in Table 25. The point a is markedon the curve EF at 0-750 NO3 and the plan is completed by drawing tie lines from NaCl to a, fromKNO3 through a to find b and from 6 to O to find c. On the elevation tie lines are drawn fromCl to a, from KNO3 through a to find 6
t , from KNO3 to b to find a x and from O to 6t to find c.
The tie line, or path of crystallization, from Nad to a passes through c and gives the proportionof solid NaCl and solution a. This line and its parts are conveniently measured along the base of thesquare and it will be found that NaCl to a measures 0-750 mol of salts as complex c and is dividedinto NaCl to c - 0-526 rriol of salts as solution a and a to c = 0-224 mol of solid NaCl at 75 C. The

116 AQUEOUS SOLUTION AND THE PHASE DIAGRAM0-224 mol of NaCl is assumed to be removed leaving a solution containing 0-526 mol of salts as
solution a.
The vertical distance a to a1is measured on the elevation to find the amount of water to be
added to 1 mol of salts as solution a to move its composition into the KNO 3 field to a point whichwill allow it to remain in that field during the cooling to 25 C. The distance a to a
l measures0-19 mol water for 1 mol of salts as solution a, so 0-526 mol will require 0-10 mol water. The tie
line from KNO3 through a to b is conveniently measured along the NO3 side of the square. The line
measures 0-696 mol of salts as solution a and is made up of KNO3 to a = 0-400 mol of salts as solution6 and b to a 0-296 mol KNO 3 . For 0-526 mol of salts as solution a (see above) there will be0-302 mol of salts as solution b and 0-224 mol KNO 3 . The 0-224 mol of KNO3 is assumed to bo
removed, leaving 0-302 mol of salts as solution b at 25 C.
Tho vertical distance from b to bton the elevation is measured to find the amount of water to
be removed. The distance measures 0-33 mol of water to be removed from 1 mol of salts as solution 6.
There is 0-302 mol of salts as solution 6, so the amount of water to be removed is 0-1 mol whichis the same as the amount added to solution a. The tie line from b to O on the plan measured
vertically on the plan gives O to c 0079 mol of salts as solution b plus 0-117 mol of mixture O.
(NaNO3 + KC1) = 0-196 mol of salts in complex c. Therefore 0-302 mol of salts as solution 6 (see
above) will need 0-448 mol of mixture to be added to yield 0-750 mol of salts in complex c.
The cycle is now complete, it started with 0-750 mol complex c and it has finished with 0-750 rnol
of the same complex. 0-448 mol of mixture O (NaNO3 -f KC1) has been converted into 0-224 molof KNO 3 and 0-224 mol of NaCl.
In Table 26 the quantities of salts and of water in mols is given in table form for one completecycle.
The lengths of the paths of crystallization are best measured along one of the sides
of the square. Thus the line NaCl through c to a may be measured along the edge of the
square NaCl.NaN0 3 from NaCl. When the composition of a was read from the diagramthe NaCl was read as 0-250 mol ; therefore the length of the line NaCl to a must be 0-750 mol.
Thus the measurements of the lines are of the same degree of accuracy as the reading and
plotting of the points, and one may be used to check the other. The point c was read as
TABLE 27
100-0 g.
16-3 g.
83-7 g.
2-3 g.
86-0 g.
28-1 g.
67-9 g.
2-3 g.
65-6 g.
44-4 g.
100-0 g.
complex c =
NaCl removed
solution a
water added
solution aj_
KNO3 removed
solution b
water removed
solution &! -=
mixture added
complex c

PRACTICAL EXAMPLES USING JlNECKE'S PROJECTION 117
0-474 mol NaCl ; therefore from NaCl to c must be 0-526 mol as solution a. The whole
line reads :
0-750 mol as complex c = 0-526 mol as solution a -f 0-224 mol of NaCl.
Table 27 has been calculated from the data in Table 26, and shows the same cycle of
reactions but the quantities are in grammes and the compositions of the solutions in grammes
per 100 g. of solution. This calculation is, of course, necessary before the findings of a phase
KNO-.
NaNOf D
Fio. 37.

118 AQUEOUS SOLUTION AND THE PHASE DIAGRAM
diagram study can be applied to practice. The data in terms of mols per mol of salts are
converted first to grammes by multiplying each item by its molecular weight and then to
per cent., by multiplying each item in grammes by 100 divided by the sum of all the items
in grammes. One example should make this clear.
Complex c read from Fig. 36 has the following composition :
KNO a . NaCl NaNO, Water0-421 0-474 0-105 1-55 mols
This may be calculated to per cent, by weight as follows :
g.100KNO3 . . . 0-421 x 101 - 42 6 which, multiplied by - -- 39 7%
NaCl . . . 0-474 x 58 5 - 27 7 ,.= 25-9%
NaNO 3 . . . 0-105 x 85 - 8-9 = 8-3%Water . . . 1 55 x 18 - 27 9 = 20-1%
107-1 100
To find the weight of solid NaCl and of solution b in 100 g. of complex c. :
From Table 26 : 0-224 mols of solid NaCl were removed from a quantity of complex c
containing a total of 0-355 mols of NaCl. Therefore, 100 g. of complex c. contain 25-9 g.
of NaCl.
25-9 x 0-224 1/t r XT ^lb-3 g. of NaCl removed.
0-355
The weight of solution b is the difference, 100 16-3 83-7 g., as shown in Table 27. The
weights of KNO 3 and of water may be found in the same way.
Double Salts and Hydrates. A reciprocal salt pair in its simpler form has been
represented, and the reactions resulting from evaporation, dilution, heating and coolinghave been studied on Janecke's projection. It is now proposed to consider a more com-
plicated case, and the system chosen is :
2NaN0 3 + K 2S0 4 ^ Na 2S0 4 -f 2KN0 3 and water.
Figs. 37 and 38 show this system at 30 C. The two diagrams represent the same isotherm,
but two figures have been prepared to avoid confusion of lines when tracing out a numberof phase reactions. It should be observed that there are saturation surfaces representingtwo double salts, one anhydrous and one hydrated, and a hydrated simple salt in addition
to the four salts given in the above equation.
The double salts are :
Glaserite Na 2S0 4 .3K 2S0 4 or NaK 3(S0 4 ) 2 . G on Figs. 37 and 38.
Darapskite Na 2S0 4 .NaN0 3 .H 20. D on Figs. 37 and 38.
The hydrated simple salt is :
Glauber's salt Na 2S0 4 . 10H 20.
The diagram has been plotted from the data in Table 28. In calculating the data
from grammes per 100 g. of solution to mols per mol of salts, the grammes of NaN0 3 and
KN0 3 are divided by their respective molecular weights to obtain the number of mols.
The grammes of Na 2S0 4 and K 2S0 4 are divided by half their respective molecular weights

PRACTICAL EXAMPLES USING JlNECKE'S PROJECTION30C
KN03
119
C B D W ANa2 S04 anal K2 SO^ are halfmols
FIG. 38.
Na2S04
to obtain the number of half-mols. This is necessary because one equivalent of Na 8S0 4
requires two equivalents of KNO 3 to satisfy the equation. The table is therefore headedmols of NaN0 3 and KNO 3 but 0-5 mols of Na 2SO 4 and K 2SO 4 . The same object wouldhave been achieved if the molecular weights of K,S0 4 and Na 2 4 had been used and twicethe molecular weights of NaNO, and KNO 3 . In that case the mols of water would bedoubled, and though that makes no difference to the phase diagram, it is necessary to becareful to use the same molecular weight for calculating the mols back to grammes as wasused to calculate the grammes to mols. One example may be useful :
The point Q given as grammes per 100 g. solution has the following composition :
NaNO, NajS0 4 KNO,. Water.
28-0 8-04 161 47-9
The NaN0 3 , KN0 3 and water are divided by their molecular weights, and the Na 8S0 4 is
divided by half its molecular weight.- NaNO,. NajSO, -**-- KNO g .
*Water
0330 0-11310
0-15918
2-66 mols.The mols of salts, excluding the water, added together = 0-602
; therefore the mols ofsalts and of water per mol of salts
0-330
0602
NaNO,.0-547
5Na 2SO,0-188
or
159
0-602
KNO,.0-265
Water.
4-42
0-5 SO 4 .
0-188NO,.0-812
Water.
4-42

120 AQUEOUS SOLUTION AND THE PHASE DIAGRAM
TABLE 28
THE QUATERNARY SYSTEM, NaNO 3 .K2SO 4 .WATER, FORMING THERECIPROCAL PAIR 2NaNO 3 + K2SO4 ^ Na2SO 4 + 2KNO3
Mols per Mol of Halts at 30 C.
Data for the internal system are from E. Cornec, H. Krombach and A. Spack in Caliche, Aug. 1929.
The external systems are from various sources.
G gives composition of glaserite : NaaSO 4 . 3K2SO4 .
D darapskite : NaNO 3 .Na2SO4 .H2O
When plotting diagrams from data found in the literature, especially when the data are
from more than one source, a good deal of calculation is often necessary. The data maybe in grammes per 100 g. of solution, or per 100 g. of water, or these may be in mols
per 1,000 mols of water or the mols may be mol ions. A good 10-inch slide rule is sufficiently
accurate for all ordinary purposes, and with a little practice the re-calculation of the data
can be carried out quite quickly. It may here be stated that the figures given throughoutthis book have generally been obtained by the use of the slide rule.
Inspection of the diagram, Fig. 37 or 38, shows that the system may be divided into
four quaternary systems, one for each of the four drying-up points P, Q, R and 8. These
four systems are :
KNO 3 . Glaserite .K 2SO 4 . Water.
Darapskite . Glaserite . Na 2S0 4 . Water.
KNO 3 . Darapskite . Glaserite . Water.
KN0 3 . Darapskite .NaNO 3 . Water.
(Drying-up point P)
( Q)
( R)
( S)
The point 8 represents the only congruently saturated quaternary invariant solution
at the temperature, so 8 is the final drying-up point of all quaternary solutions. S is the
drying-up point of the system KN0 3 . darapskite.NaN0 3 . water. It is the drying-up point

PRACTICAL EXAMPLES USING JlNECKE'S PROJECTION 121
of the remaining systems only if the solid phase is removed, which in effect is moving the
complex into the system named. The remaining invariant points P, Q and R are incongruent
drying-up points. P is the drying-up point of the system KNO3 .glaserite.K 2804 . water,but it is situated outside the system although saturated with the three salt components ofthat system. In the same way Q is the incongruent drying-up point of the system
30C 25
NaMO
D&raps.
fandK2SO^ are halfmofs
Fio. 39.
darapskite.glaserite.Na2S04 . water, and R the incongruent drying-up point of the systemKJN~0 3 . darapskite. glaserite. water. The point is not a drying-up point.
The isotherm has seven saturation surfaces, but it must be remembered that the fields
are not surfaces but figures in space. Thus the saturation surface CSRQB represents
darapskite, but the field of darapskite is a distorted and inverted pyramid with the surface
CSRQB as its base and the point D as its apex (see Pig. 39), which is a perspective view
including water. In the same way the surface BQOA is the saturation surface

122 AQUEOUS SOLUTION AND THE PHASE DIAGRAMwhich is the base of an inverted pyramid with the Na aS0 4 corner as the apex. On the planprojection, therefore, a point which appears to be on the Na 2S0 4 saturation surface maybe within the Na 2S0 4 field or the darapskite field according to the amount of water present.This can be seen on the elevation of Fig. 37 where the point a lies on the Na 2S0 4 saturationsurface. On removing water to a^ the complex is within the Na 2S0 4 field, but at a a it has
passed into the darapskite field.
There are four stable pairs of salts in the internal system : KNO 3 and glaserite canexist together in equilibrium with solutions on the curve RP
; KN0 3 and darapskite withsolutions on the curve ES
; darapskite and glaserite with solutions on the curve EQ andglaserite and Na 2S0 4 on the curve QO.
The paths of crystallization radiate from the four corners of the square and along thecurves to the drying-up points, as was the case in the simple reciprocal salt pair diagrams.In the case of the double salts the paths radiate from the point representing the doublesalt and across its saturation surface. The arrows on the diagram make this clear.
The phase reactions involved when water is removed isothermally from the complexrepresented by the point a on Fig. 37 are as follows : a represents a solution just saturatedwith Na 2SO 4 ,
and is therefore on the Na 2S0 1 saturation surface. When water is removedthe solution point moves away from Na 8SO 4 and meets the curve BQ at b. The complexis now 15 the solid phase is Na 2SO t and the solution is b saturated with Na 2SO 4 anddarapskite.
Further removal of water from a^ to a 2 on the elevation causes the solution point tomove from /; towards Q, and the solid phase to move from Na 2SO 4 towards darapskite onthe edge of the square. Actually Na 2SO 4 goes into solution and darapskite is deposited,and when the solution point is at d the solid phase is all darapskite.
When more water is removed from a a to a A on the elevation, the solution point crossesthe darapskite saturation surface because d lies on a path of crystallization from D througha, so that the solution point must leave the curve BQ. When the solution point reachese the solution is saturated with darapskite and NaN0 8 ,
but the solid phase is still all
darapskite.On the removal of water from 3 to a4 on the elevation, the solution point moves along
the curve CS towards 8 and the solid phase moves from D towards NaN0 3 . When thesolution is represented by 8 the solid phase is a mixture of NaN0 3 and darapskite repre-sented by the point /. At composition S the solution dries up and the solid phase movesfrom / to a on the plan and from / to a 5 on the elevation.
Having followed one series of reactions on both plan and elevation it is proposed toindicate other series in different parts of the isotherm but using the plan only.
It might be repeated here that the reader should prepare larger diagrams on squaredpaper, using the data given in the tables. Squared paper ruled in inches and tenths is
useful. Figs. 37 and 38 should be plotted on at least a 10-inch square and with an elevationof the curves required for the reaction being studied. Some of the examples should beworked out in full, first qualitatively and then quantitatively. Carrying out the various
operations from the plotting of the diagram to the final calculations to grammes or poundsis the quickest way to become familiar with the use of phase diagrams.
The point u on Fig. 38 represents another complex on the Na 2SO 4 saturation surface.
On the removal of water the solution point moves away from Na 2S0 4 and meets the curve BQat v. On the further removal of water the solution point moves towards Q and the solid
phase moves from Na 2SO 4 towards darapskite and is at w when the solution point is at Q.

PRACTICAL EXAMPLES USING JlNECKE'S PROJECTION 123
On continuing the evaporation of water the solution point remains at Q, a mixture of
darapskite and glaserite is deposited while Na 2S0 4 is dissolved. The solution point cannotleave Q until all the Na 280 4 in the solid phase has passed into solution. During the
evaporation of water from solution Q the composition of the solid phase moves from w to
x, which represents a mixture of darapskite and glaserite (x being on the broken line joiningD to 0).
As still more water is removed the solution point leaves Q and moves towards R, whilethe solid phase moves from x to y and is still a mixture of darapskite and glaserite ; y is
where the line Ru meets DG. On the further evaporation of water the solution pointremains at R, darapskite and KN0 3 are deposited and glaserite is dissolved until the com-
position of the solid phase moves from y to z, which is a mixture of KN0 3 and darapskite.When all the glaserite has dissolved and the solid phase is at z the further removal of watercauses the solution point to move from R to S and the point representing the solid phasemoves from z to a. The removal of still more water causes solution S to dry up at com-
position 8, while the solid phase moves from a to u.
Two cases have been considered when water was removed from a complex on the Na 2S0 4
saturation surface. Both these cases were within the system
KNO, . darapskite .NaN0 3 . water,
that is, the points a and u are both within the triangle representing that system.The following is a summary of the phase reactions for the first case, complex a, Fig. 37.
to a
to a2
tO (1 3
to r/4
to e/-
a to b
b to d
d to e
e to #at S
Solid Phase(total).
Na 2SO4
Na,SO4 to DD
D to// to a
The path of crystallization crossed the darapskite surface and was a-b-d-e-8.
For the second case, complex u, Fig. 38, the phase reactions are summarized thus :
Complex Solid Phase
Na2SO 4
Na2SO4 to ww to xx to y
y to z
z to a
a to u
The points Ui to u 7 are on the elevation which is not given in Fig. 38. The path of crystal-
lization followed the curves bounding the darapskite surface and was u-v-Q-R-S.
A straight hue drawn from Q to 1) divides that part of the Na 2S0 4 surface, within the
system KN0 3 . darapskite.NaN0 3 . water into two parts. If the complex is on the sodium
side of the line the path of crystallization will be similar to a-b-d-e-S, and if on the potassium
side of the line the path will be similar to u-v-Q-R-S.

124 AQUEOUS SOLUTION AND THE PHASE DIAGRAM
The remainder of the Na 2S0 4 saturation surface falls partly within the systemKN0 3 . darapskite . glaserite . water and partly within the system
darapskite . glaserite .Na 2S0 4 . water.
If the point g is the complex, the path of crystallization will be similar to that when u wasthe complex, except that the solution will dry up at R. For the point h the path of
crystallization will again be similar except that Q will be the drying-up point. In both
cases if the solid phase is removed as formed the solution point will move to 8.
The positions of u, g and h might have been chosen so that the path of crystallization
met the curve OQ instead of the curve BQ. In such cases the solution point would take
a similar path except that it would move to Q along the curve OQ instead of the curve BQ,and the solid phase would move from Na 2SO 4 towards glaserite instead of towards darapskite.
At the temperature of the isotherm there is a small field of Glauber's salt in the Na 2S0 4
corner of the diagram. If in Fig. 37 the complex is represented by the point g on the
Glauber's salt saturation surface, then the following is a summary of the phase reactions
when water is removed.
Here, again, g l to g 5 have not been marked on the elevation. The point g as solid phase
represents a mixture of darapskite, glaserite and Na2S0 4 . The solution remains at i until
all the Glauber's salt is converted to Na 2S0 4 . The solution dries up at Q before all the
Na 2SO 4 can dissolve.
On the glaserite saturation surface the paths of crystallization radiate from represent-
ing glaserite. In Fig. 38 the complex 6, for example, may be on the saturation surface,
that is, the solution is saturated with glaserite. On removing water the solution point will
move in a direction away from G and meet the curve PR at d. The point d now representsthe solution and G the solid phase. As more water is evaporated the composition of the
solution moves from d to R and the composition of the solid phase moves from G to e.
Solution d is saturated with glaserite and has become just saturated with KN0 3 , glaserite
alone being in the solid phase. As the solution point moves from d both glaserite andKN0 3 are deposited, and when the solution point reaches R the solution which is saturated
with glaserite and KN0 3 is now also just saturated with darapskite. When still morewater is removed the solution remains at R, KN0 3 and darapskite are deposited, but
glaserite is dissolved so that the composition of the solid phase moves from e to /, beingat / when all the glaserite has dissolved. On the further removal of water the solution
point leaves R and moves towards S, while the composition of the solid phase moves from
/ towards D on the broken line KNO 3 .Z> to a point near/. At composition S the solution
dries up and the three salts KNO 3 , darapskite and NaN0 3 are deposited and the compositionof the solid phase moves from near / to the complex point b.
The above description of the phase reactions when water is removed isothermally from
the saturated solution represented by 6 has been given at some length as an example, but

PRACTICAL EXAMPLES USING JlNECKE'S PROJECTION 125
it is proposed to deal with other complexes on the glaserite surface in summary form only.For example, the above case of the removal of water from complex b, Fig. 38, may besummarized as follows :
System KN0 3 .D .NaN0 3 . water. Glaserite saturation surface.
Path of crystallization from O through complex meets curve PR.
Solution.
Moves from complex to curve PR.
Moves to R.
Remains at R.
Moves to S.
Solid Phase.
Glaserito.
Glaserite -f KNO3 deposit. Point moves from G towardsKNO 3 on line KNO 3 .O.
KNO3 4- Darapskite deposit, Glaserite dissolves. Pointmoves to lino KNCX.Z).
KNO3 4- Darapskito deposit. Point moves on line KNO3 .Dtowards D.
Dries up at S. KNO3 4- Darapskite -f NaNO3 deposit. Point moves to
complex point.
The above summary covers all cases when the complex is on the glaserite surface andwithin the system KN0 3 .D.NaN0 3 . water, and in a position that a path of crystallizationfrom O through the complex meets the curve PR.
The summaries given below indicate the phase reactions when the path of crystallizationmeets the curve RQ and QO.
System KN0 3 .D.NaNO 3 . water. Glaserite saturation surface.
Path of crystallization from through complex meets curve RQ.
Solution.
Moves from complex to curve RQ.
Moves to R.
Remains at R.
Moves to S.
Dries up at S.
Solid Phase.
Glasorite.
Glaserite and Darapskite deposit. Point moves from Otowards D on line OD.
KNO3 + Darapskite deposit, Glaserite dissolves. Pointmoves from line OD to line KNO3 .Z).
KNO3 4- Darapskite deposit. Point moves on line KNO3 .Dtowards KNO,.
KNO3 4- Darapskite + NaNO 3 deposit. Point moves to
complex point.

126 AQUEOUS SOLUTION AND THE PHASE DIAGRAM
Same system but path of crystallization from G meets curve QO.
Solution.
Moves from complex to curve QO. \
Glasento.
Moves to Q.i
Glasorite 4- Na2SO 4 deposit. Pomt moves from G towardsi Na2
S04
Remains at Q. I Glasento -f Darapskito deposit, Na 2SO4 dissolves. Pointi moves from side of square to line GD.
Moves to R.|
Glaserite and Darapskito deposit. Point moves on line
I
GD towards D.
_ ^ _ _ _ i __Remains at 7?.
j
KNO3 4 Darapskito deposit, Glasente dissolves. Pomtmoves from line GD to lino KNO 3 .Z>.
I
" " ~" "
Moves to S. ' KNO3 -4- Darapskite deposit. Point moves on line KNO 3 .)i towards KNO 3 .
j
- - -_.._.Dries up at S.
\
KNO 3 + Darapskito -f NaNO, deposit. Point moves to
j
complex point.
The glaserite saturation surface extends over three systems : these are
(1) KN0 3 .Z>.NaN0 3 . water, (2) KN0 3 .#.,D. water, and (3) Z>.6? .Na 2S0 4 .water.
Paths of crystallization drawn through complexes falling within the first of these three
systems will meet one of the curves, PR, RQ or QO. These three cases have already beendescribed and summarized.
Paths of crystallization drawn through complexes falling within the second of the
systems named will also meet one of the same three curves. The phase reactions start
on the same lines as those described for the system KN0 3 ./>.NaN0 3 . water, but the solutionwill dry up at R before all the glaserite has dissolved.
Within the third system, paths of crystallization from G will meet the curve QO or OJ,and in both cases the solution will dry up at Q before all the Na 2SO 4 has dissolved. Ifthe path of crystallization meets the curve QO the reactions are similar to those indicatedin the third summary given above, except that the solution dries up at Q beforeall the Na aR0 4 has dissolved. The reactions involved if the path of crystallization meetsthe curve OJ are described below.
Let n, Fig. 38, be the complex on the glaserite saturation surface and within the systemD.#.Na aS0 4 . water. When water is removed the solution point moves towards p andglaserite is deposited. From p the solution point moves towards 0, glaserite and Glauber'ssalt being deposited and the composition of the solid phase moves from G towards q beingat q when the solution is at O. As the removal of water continues the solution remains at 0,glaserite and Na 2S0 4 are deposited while Glauber's salt dissolves (or the Glauber's is con-verted into anhydrous sodium sulphate by the removal of water). The composition of thesolid phase remains at q because the projection ignores water, but actually the point repre-

PRACTICAL EXAMPLES USING JlNECKE'S PROJECTION 127
senting the solid phase moves vertically downwards in space until q represents a mixture
of glaserite and Na 2S0 4 . Then, when all the Glauber's salt has disappeared, the removal of
more water causes the solution point to move from to Q ; glaserite and Na 2S0 4 are
deposited, and the composition of the solid phase moves from q to r and as the solution
dries up at Q the solid phase moves from r to n.
On the K 2S04 saturation surface three examples, q and k of Fig. 37, and i of Fig. 38,
are summarized below. In the first case the complex chosen, the point q, Fig. 37, is
within the system KN0 3 .6r.K 2S0 4 .water, so the drying-up point must be P. Thus to
summarize :
Solution.
Moves from q to r.
Moves from r to P.
Dries up at P.
K 2S04 .
i
Glaserite deposits and K 2SO4 dissolves.
Point moves from K 2SO 4 to /.
KNO3 and Glaserite are deposited, K 2SO4
dissolves. Point moves from t to q.
The complex /, Fig. 37, is on the K 2S0 4 saturation surface, but within the systemKNO 3 . .D . water. The drying-up point must therefore be R, which is saturated with
KN0 3 , glaserite and darapskite. The phase reactions are summarized below :
I Solution.
i Moves from fc to /.
j
I
Moves from I to m.
Solid Phase.
i
K 2S04.
Glaserite deposits, KoSO 4 dissolves. Point moves fromK
2SO4 to G.
Moves from m to n across (7 surface.|
Glaserite deposits. Point remains at G.
Moves from n to JR.
...... -
I
I
KNO 3and Glaserite deposit. Point moves from G to p
on the line KNO^.tr.
Dries up at 7?. KNO3and Darapskite deposit. Glaserite dissolves. Point
moves from p to k.
The point k is on the sodium side of a line drawn from glaserite to P, the path of crystalliza-
tion crossed the glaserite surface and was k m n R. Other complexes on the K 2SO 4 surface
and on the sodium side of the line named would follow a similar path.
The point i, Fig. 38, is on the K 2S0 4 surface and within the system KNO 3 .GM>. water,
but it is on the potassium side of the line Glaserite-P.

128 AQUEOUS SOLUTION AND THE PHASE DIAGRAM
The following is a summary of the phase reactions :
Solution. Solid Phase
Moves from i to j.
Moves from j to P.
Remains at P.
Moves from P to .#.
K.SCV
Claserite deposits, KaSO4 dissolves. Pointmoves from K 2SO4 to k.
KNO 3 and Glaserite deposit, K2SO 4 dissolves.
Point moves from k to I.
KNO3 and Cilaserite deposit. Point moves online KNO 3 .CJ from I to m.
Dries up at R.I
i
KNO3and Darapskite deposit, Glaserite dis-
|
solves. Point moves from m to i.
On the KN0 3 surface, if the complex is in the system KN0 3 .(7.K 2SO 4 .water, say at
iv, Fig. 37, the solution will dry up at P. If the complex is at u, Fig. 37, in the systemKNO 3 .D.6r.water the solution will dry up at R, and if at v, Fig. 37, in the systemKN0 3 .Z>.NaNO 3 .water the solution will dry up at 8.
The NaN0 3 and the darapskite surfaces are entirely within the system
KN0 3 .Z>.NaNO 3 . water
and so all solutions will dry up at 8.
A general rule has been illustrated above, namely, that when the path of crystallization
is on the boundary of a field it can only enter that field when the solid phase is the phaseof that field. For example, d, m and i of Fig. 37, where the solid phases are double salts
(D or 0) or a hydrate.The phase reactions which take place when water is removed without change of tempera-
ture have now been studied in detail. The addition of water to the various solid mixtures
results in the same reactions, but in the reverse order.
Addition of a Salt. The reactions resulting from the addition of solid salts to com-
plexes, including solutions both saturated and unsaturated, should present no difficulties
as long as the following principles are remembered.
The addition of the salt moves the point representing the complex in a straight line
towards the point representing the added solid.
The addition or removal of water moves the point vertically, and the amount can be
such that it moves into the required field representing a pure solid phase.A line then drawn from the known solid phase through the complex gives the point
representing the solution on the curve.
The solution point is not on the curve except with the correct amount of water, there-
fore the solution point must be considered on the elevation as well as on the plan.
Take any point within the square diagram to represent a solution or mixture. Byadding one or more of the four salts the complex may be moved into any of the fields as
represented on the square. By adding or removing water the point may be moved vertically
into, or to the boundary of, the three-dimensional field representing the pure salt required.

PRACTICAL EXAMPLES USING JANECKE'S PROJECTION 129
The addition of a salt or of a solution of a salt or salts, providing the salt or salts are
represented in the system, may be considered as doing no more than moving the complex(i.e. the particular system being studied). When the complex has been moved to its new
position the problem then resolves itself into no more than the adjustment of the water,and it is for this reason that the examples of removal of water have been considered in suchdetail.
Changing the Temperature. The changing of temperature, the removal andaddition of water and of salt were considered at some length when a complete cycle of
operations was studied earlier in this chapter. It is not, therefore, proposed to consider
isotherms for other temperatures for the system NaN0 3 + K 2SO 4 and water. On the other
hand, there are some interesting phase reactions which take place with change of temperature,and these might be considered briefly.
The curve AO on Fig. 38 (at 30 C.) separates the Na 2S0 4 and Glauber's salt saturation
surfaces. At a lower temperature, say 20 C., the Na 2SO 4 surface will have disappearedand sodium sulphate will be represented only as Glauber's salt. The reactions which take
place as the temperature is lowered will now be described.
It is possible, by applying the principle of Le Chatelier, to predict the direction the
phase reaction will take when temperature is altered. (See page 54.) By this principle,if heat is removed from the system, the phase reactions will be such that heat will be givenout. That is, sodium sulphate will dissolve and Glauber's salt will be deposited ; or, in other
words, sodium sulphate will combine with water to form Glauber's salt ; both these reactions
are exothermic.
The removal of heat causes the temperature to fall and the curve AO moves towards
the curve BQ, and the points A and B unite near B at 24-3 C. Below this temperaturethe curve AO, now BO, continues to move in the same general direction and below 24-3 C.,
but above 21-8 C. forms a small triangle in the corner of the Na 2SO 4 surface near Q. Asthe temperature falls still further this triangle gets smaller and smaller until at 21 -8 C. it
vanishes to a point. This new point near Q represents a solution saturated as to four solid
phases, Glauber's salt, darapskite, glaserite and Na 2SO 4 . These four solid phases can exist
in equilibrium with a solution only at this temperature, 21 -8 C.
The point near Q is a system invariant point and has no degree of freedom in the
condensed system.If the system is maintained at equilibrium the temperature will remain at 21-8 C. and
the composition of the solution will remain unchanged until all the Na 2SO 4 has disappeared,even if more heat is removed. When the Na 2S0 4 has disappeared a degree of freedom is
gained, the temperature will fall and the new solution, represented by a point near Q, will
be saturated as to Glauber's salt, darapskite and glaserite.
If more heat is now removed from the system the temperature will fall and the com-
position of the solution will depend on the temperature. As the temperature falls the
two points Q and R will move closer together until at 17-6 C. they will unite at a point
representing a solution saturated as to Glauber's salt, darapskite, glaserite and KNO 3 .
This is a new system invariant point.Above 17-6 C. there was a curve QR dividing the glaserite and the darapskite saturation
surfaces. That is, glaserite and darapskite formed a stable pair, and Glauber's salt and
KN0 3 formed an unstable pair.
Below 17-6 C. the point formed by the union of Q and R again divides, and two new
points appear, one on either side of the position occupied by the curve QR just before it
130 AQUEOUS SOLUTION AND THE PHASE DIAGRAM
disappeared. This means that below 17-6 C. Glauber's salt and KN0 3 become the stable
pair, and glaserite and darapskite become the unstable pair.
To make this quite clear, at 17-6C. four curves meet at a point which is in contact
with four saturation surfaces. Both above and below 17-6C. the point divides so that
each new point is the junction of three curves This example should be compared with
the example given above when a system invariant point was formed near Q by the dis-
appearance of the triangular field of Na 2S0 4 . It will then be seen that there are two typesof system invariant points in this condensed quaternary system. In all there are five such
points between the temperatures of 10C. and 60 C.
These are :
At 10 C., when darapskite disappears and at 21 -8 C. when Na 2S0 4 disappears.At 60 C. when darapskite + KN0 3 form the stable pair below 60 C., and
NaN0 3 -f Na aS0 4 form the stable pair above 60 C. At 44 C. when darapskite -f glaserite
form the stable pair below 44 C., and Na 2S0 4 -f KN0 3 form the stable pair above 44 C.
At 17-6 C. when Glauber's salt -f KN0 3 form the stable pair below 17-6C., and darap-skite -f- glaserite form the stable pair above 17-6C.
The data for plotting the isotherms necessary for the study of this system over the
range of temperatures given above may be found in Caliche, July 1928 and August 1929.
(Cornec, Krombach and Spack, Strasbourg University.)

CHAPTER XII
THE FIVE-COMPONENT SYSTEM: FOUR SALTS AND WATER
The representation of phase equilibrium data on a diagram becomes more complicatedas more components are introduced. Thus, for the binary system it was possible to include
temperature on a plane diagram. For the ternary system temperature had to be eliminatedas a variable and isotherms were used
;the three components were represented in two
dimensions by the artifice of triple co-ordinates. Temperature was of course included bysuperimposing a number of isotherms on the same diagram.
For the quaternary system three dimensions were necessary to represent all four com-
ponents on isotherms. Thus, where the three salts had a common ion the system was
represented within a tetrahedron, which was only briefly described at the end of Chapter VII ;
where the salts had no common ion and thus formed a reciprocal salt pair, the system was
represented within a square-based pyramid, such as Fig. 24. This was converted to a plane
diagram, not by fixing the water composition as in the case of temperature for the ternaryisotherm, but by ignoring water or leaving it off the diagram by projecting from the water
point as in Janecke's projection, e.g. Fig. 30.
The quinary system of four salts and water would similarly require four dimensions to
represent the five components, that is, providing the triple co-ordinate device is still used.
Thus one component has to be eliminated to enable the system to be represented even within
a three-dimensional figure. Water is the component usually eliminated as was done for
the quaternary. Here, again, the four salts may have a common ion, in which case the
figure becomes a tetrahedron with one salt at each corner, or the four salts may not havea common ion throughout, in which case the figure has to include some square faces to
represent reciprocal salt pairs. The salts in the latter case are also represented at the
corners of the solid figure but, although there are only four components (apart from water),there are more than four salts. This was explained in the introduction to the reciprocalsalt pair.
Four Salts with a Common Ion. The isotherm with water eliminated for the
system of four salts with a common ion may, as already stated, be represented within
a tetrahedron. This space model is built up from four quaternary systems which form the
external faces of the space diagram. Each quaternary system is in a triangle (i.e. in two
dimensions) obtained by making a Janecke's projection on the base of the original quaternarytetrahedron with water at the apex or point of projection. Four salts and water can be
arranged to make four quaternary systems, each of three salts and water : thus A, B, C andD can be taken as ABC, BCD, CDA and DAB. It is therefore clear that the four
quaternary systems represented on triple co-ordinates can be combined to form the four-
sided figure, the tetrahedron to represent the quinary system of four salts and water.
Each quaternary system will have a quaternary invariant point (i.e. when the systemsare of the simplest type without hydrates or double salts). This is where the three equili-brium curves from the edges meet in the middle of the triangle. Two solid phases are in
equilibrium along the curves, but three l are in equilibrium at the quaternaryl invariant
point, which is on the face of each side of the tetrahedron.
1Quaternary invariant point because there are four components altogether, three salts and water.
131
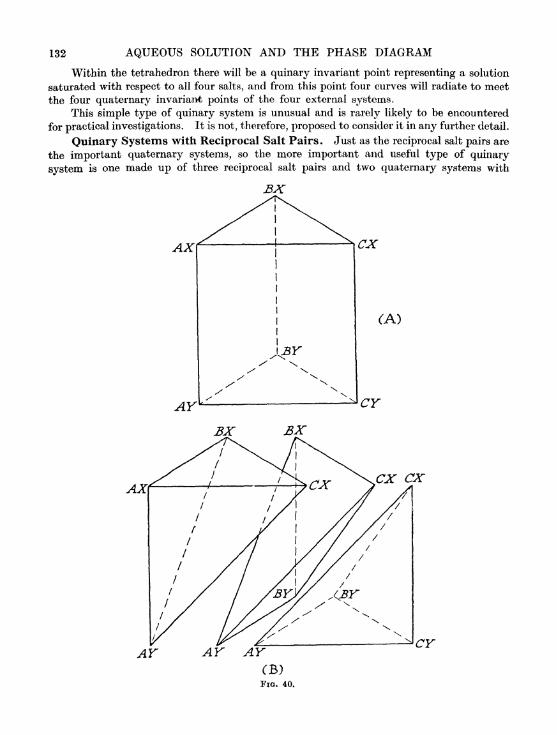
132 AQUEOUS SOLUTION AND THE PHASE DIAGRAM
Within the tetrahedron there will be a quinary invariant point representing a solution
saturated with respect to all four salts, and from this point four curves will radiate to meet
the four quaternary invariant points of the four external systems.This simple type of quinary system is unusual and is rarely likely to be encountered
for practical investigations. It is not, therefore, proposed to consider it in any further detail.
Quinary Systems with Reciprocal Salt Pairs . Just as the reciprocal salt pairs are
the important quaternary systems, so the more important and useful type of quinary
system is one made up of three reciprocal salt pairs and two quaternary systems with
BX
AX
AY
CX
(A)
CY
BX
AX
AY
CX
CY
FIG. 40.

THE FIVE-COMPONENT SYSTEM: FOUR SALTS AND WATER 133
a common ion. The three squares and the two equilateral triangles used to represent the
five"external
"systems thus form the five surfaces of a regular triangular prism, the six
corners representing six salts, although the system only comprises five components includingwater. This means that, although six salts are named and exist, any composition could
be expressed in terms of four salts only.
Fig. 40A shows such a figure, and it will be noticed that each salt is linked to three
other salts by the edges of the solid figure and that one of the three has a common anionwhile the other two have a common cation, or vice versa.
A further indication of why the system is quinary may now be given. The reciprocalsalt pair had four salts and water and yet was quaternary because it could be divided bythe diagonal into two systems each of three salts and water. Similarly, Fig. 40A can be
divided, not into two triangles by one line but into three tetrahedra by two planes, see
Fig. 40B. Any quinary point, that is inside the three-dimensional figure, can be repre-sented in terms of the four salts at the four corners of one or other of the three
tetrahedra.
The system in its simpler form would have three quinary invariant points, and in its
simplest form the invariant points would be one in each of the three tetrahedra shown in
Fig. 40B. From these points, representing solutions saturated as to four salts, four quinarycurves would radiate to quaternary invariant points on the four faces of each tetrahedron.
The two curves which join the three quinary invariant points are made up of the four
curves which radiate from these invariant points to the inner faces of the tetrahedra, formed
by the two cutting planes ;the four short curves form two continuous curves joining the
three points. That is, there are ten curves within the figure and these curves, togetherwith the quaternary curves of the external systems, form the edges of surfaces which divide
the whole figure into six fields, one for each of the six salts at the six corners of the
prism.On Fig. 40s, the internal plane surfaces already mentioned above are : BX.CX.AY
forming one surface of the left-hand tetrahedron and one surface of the central tetrahedron ;
CX.BY.AY forming one surface of the right-hand and one of the central tetrahedron.
These surfaces can be quaternary systems within the quinary system, just as in the
quaternary system, see Fig. 33, the diagonal of the square formed a true ternary
system.In the simple quinary system now being considered, the surfaces BX.CX.AY and
CX.BY .AY are true quaternary systems, three salts and water, and each tetrahedron is
a quinary system, four salts and water, bounded by four quaternary systems, three salts
and water. In practice such a simple quinary system is not likely to be found, as it involves
the assumption of no double salts and that the three invariant points are all congruentlysaturated.
Only a few systems of four salts and water have been investigated to any degree of
completeness. The classic example is the work of van't Hoff and his collaborators on the
evaporation of sea water and on the salts of dried-up seas. Some of this work was on the
system containing Na, K, Mg, Cl, S0 4 , water, and many double salts were encountered.
More recently the system Na, K, S0 4 ,No 3 , Cl, water has been investigated very fully and
at temperatures from 0C. to 90 C. by E. Cornec, H. Krombach and A. Spack at the
University of Strasbourg. This system makes a good example for a first study because
it is fairly simple at the higher temperatures when only one double salt, glaserite, is found.
The data are given in Table 29.

134 AQUEOUS SOLUTION AND THE PHASE DIAGRAM
TABLE 29
THE QUINARY SYSTEM : SODIUM, POTASSIUM, SULPHATE, NITRATE, CHLORIDE, WATER at 75 C.
Mols per Mol of Salts.
(Adapted from E. Cornec and H. Krombach, Caliche, Sept. 1928)
G = Glaserito : 3K 2S04 .Na2SO4 .
The Quinary System, Na.K.SO4 .NO 3 .Cl. Water at 75 C. 1 The projection of
the prism, Fig. 41, is a pictorial representation, and the internal system is only approximateto the data given in Table 29. The alterations were made for clarity. The figure is assumed
to be made of wire and has one of the squares as base for convenience of viewpoint. Thesuffixes to the letters indicate the number of solid phases in equilibrium with the solution.
There are four quinary invariant points (isothermal condensed) in the internal system,
AI> BI> 4 and D 4 . The curves radiating from these points to the external system link upwith the curves of the external systems and form the boundaries of surfaces which divide
the figure into seven three-dimensional fields, one for each possible solid phase, KN0 3 ,
NaN0 3 , KC1, NaCl, K 2S0 4 ,Na 1SO and glaserite.
The diagram, Fig. 42, is the same as Fig. 41, except that it is drawn to a smaller scale
and the seven fields have been separated for greater clarity. Each field can now be studied
separately and one or two examples should suffice.
SO 4 is of course 5 mol if the others aro 1 mol.

THE FIVE-COMPONENT SYSTEM: FOUR SALTS AND WATER 135
Cz
75 C.
A/a A/0*
Na2S04 and K2Sare ha/f mo/s.
FIG. 41.
75C.
Na2 S04 andare half mots.
KCl NaClFIG. 42.

136 AQUEOUS SOLUTION AND THE PHASE DIAGRAM
The small wedge-shaped field at the NaNO 3 corner is the sodium nitrate field. This
field has three internal faces, one which joins the sodium chloride field, the face at the
narrow end which joins the potassium nitrate field, and the top face which joins the sodium
sulphate field. Points on these three faces represent solutions saturated as to NaN0 3 plus
NaCl, NaN0 3 plus KNO 3 and NaN0 3 plus Na 2S0 4 , respectively. Internal surfaces, junction
of two fields, represent solutions saturated as to two salts. The remaining three faces are
planes and belong to the external systems and points on these faces or inside the three-
dimensional field represent solutions saturated with sodium nitrate.
The three internal edges, i.e. the curves radiating from the point A 4 ,are each curves
of three salts, the longest curve, from A to the right represents solutions saturated as to
NaNO 3 plus Na 2SO 4 plus NaCl, the shorter curve, from A^ represents solutions saturated
as to NaN0 3 plus Na 2S0 4 plus KNO 3 and the shortest curve, from A to the base of the
figure, represents solutions saturated as to NaNO 3 plus NaCl plus KN0 3 . Internal curves,
junctions of three fields, represent solutions saturated as to three salts.
The point J. 4 is at the junction of four fields and represents an invariant (isothermal
condensed) quinary solution saturated as to NaN0 3 plus NaCl plus Na 2S0 4 plus KN0 3 .
As will be seen later the point A 4 is congruently saturated and the NaNO 3 field representsthe simplest possible field in a quinary system. The potassium nitrate field at the left-hand
top corner of the base in Fig. 41 is less simple and has three top faces, because, in addition
to the K 2S0 4 surface on the left, it has a glaserite surface and also the Na 2S0 4 field overlapsthe KNO 3 field at the narrow end on the right forming a small Na 2S0 4 surface.
The internal surfaces of the KN0 3 field represent solutions saturated as to two salts
as follows :
Top surface on the left .
Top surface central position
Top surface on the right
Surface joining KC1 field
Surface joining NaCl field
Surface joining NaNO 3 field
KN0 3 + K 2S0 4
KNO 3 -f Glaserite
KN0 3 + Na 2S0 4
KNO 3 -f KC1KNO 3 -h NaClKNO 3 -f NaNO 3
The internal curves of the KNO 3 field represent solutions saturated as to three salts
as follows :
The three curves radiating from the point A^ have already been mentioned for the
NaNO 3 field.
The curve from A^ to J5 4
The curve from 4 to back of figureThe curve from jB4 to C4
The curve from C4 to Z>4
The curve from D 4 to left of figure
KN0 3 + NaCl + Na 2S0 4
KN0 3 -f Na 2S0 4 + Glaserite
KN0 3 + NaCl + Glaserite
KNO 3 -f KC1 + Glaserite
KN0 3 + KC1 + K 2S0 4
The points -B4C 4 and Z>4 represent solutions saturated as to four salts as follows ;
The point B, . . . . KN0 3 + NaCl -f Na 2S0 4 -f Glaserite
The point <74 . . . . KN0 3 -f NaCl -f KC1 + Glaserite
The point Z> 4 . . . . KN0 3 + KC1 + K 2S0 4 + Glaserite

THE FIVE-COMPONENT SYSTEM: FOUR SALTS AND WATER 137
Having followed the meaning of surfaces, curves and points on two of the fields the
remaining five fields should present no difficulties.
Fig. 43 is the same view of the prism as was given in Fig. 41, but the prism has been
divided into four tetrahedra by means of three planes. This figure should be comparedwith Fig. 40 A and^B when the prism was divided into three tetrahedra. The reason for
four tetrahedra in Fig. 43 is that another salt, glaserite, is present and glaserite is now one
75C.
KCl KCl NaCl NaCl NaCl
Na2S04 and K2504 are half mo/s.
FIG. 43.
of the possible components. The system is still one of five components, four salts andwater and the seven salts KN0 3 ,
NaN0 3 , KCl, NaCl, K 2S0 4 ,Na 2S0 4 and glaserite may be
represented by equations in terms of the four salts at the four corners of any one of the
tetrahedra, negative terms and zero terms being allowed.
The four quinary invariant points have been marked within the tetrahedra on Fig. 43 ;
compare this with Fig. 41, for which purpose the same letters have been used. The positions
of these four points will now be considered. The point A^ is within the tetrahedron which
represents the system NaN0 3 .NaCl.Na 2S0 4 .KN03 and water, and the point A^ is also
saturated with the four salts just named. That is, the solution can exist in equilibriumwith solid NaN0 3 , NaCl, Na 2S0 4 and KN0 3 ,
and it can be represented in positive terms of
those four salts. The solution represented by point ^4 4 is, therefore, congruently saturated
and is the drying-up point of the system within which it is situated. As will be seen later,
it is also the final drying-up point of the whole system represented within the prism.The points J54 and C*4 are also within the tetrahedron representing the system
NaN0 3 .NaCl.Na2S0 4 .KN0 3 and water. The point 4 is saturated as to KN0 3 plus NaCl
plus Na 2S0 4 plus glaserite, and cannot be represented in positive terms of the componentsof the system. It represents a solution incongruently saturated. In a similar way, the
point (7 4 is incongruently saturated.
The point D^ represents a solution saturated as to KN0 3 , KCl, K 2S0 4 and glaserite,
but is within the system with KN0 3 . NaCl. KCl. glaserite as components. Solution D 4 is,
therefore, incongruently saturated.
The points A^, B^ C4 and D 4 are all drying-up points. If water is removed isothermally

138 AQUEOUS SOLUTION AND THE PHASE DIAGRAM
from solution Z)4 then KN0 3 ,KC1 and glaserite (6?) are deposited and K2S0 4 is dissolved ;
the composition of the solution is unchanged and will remain unchanged at Z>4 as long as
any K 2S04 remains in the solid phase. If the solid phase is removed from contact with
the solution, the composition will change and the point representing its composition will
move from D4 towards (74 and, if the evaporation is continued, it will^arrive at <74 . The
0-5Na2504
75 C.
NaCl
HCl
KN03FIG. 44.
point Z>4 is the drying-up point of the system KC1.K 2S04.KNO 3 . glaserite and water onlyas long as the solution is in contact with the required solid phase.
In the same way, when water is removed isothermally from solution C4 ,then NaCl,
KNO 3 and glaserite are deposited, KC1 is dissolved and the composition of the solution is
unchanged. If the solid phase is removed or all the KC1 has dissolved, the point representing
the solution will move from 4 to J5 4 during the evaporation and NaCl, KN0 3 and glaserite
will be deposited.If water is removed isothermally from solution #4 ,
then NaCl, KN0 3 and Na 2S0 4 will
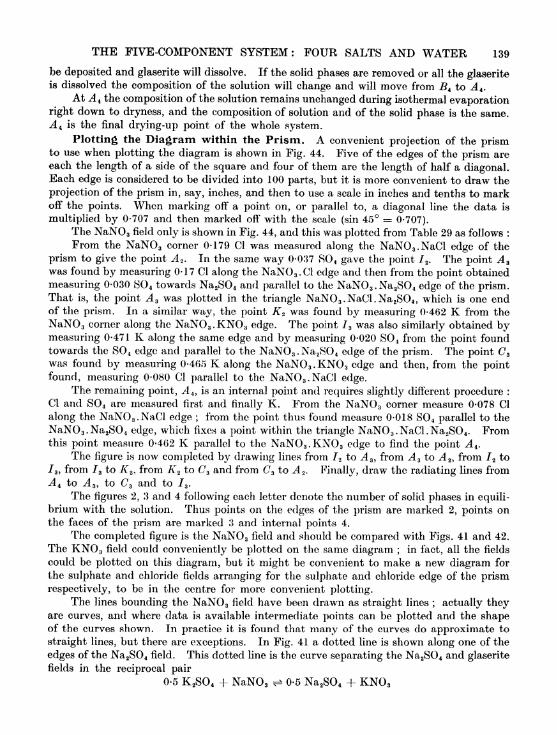
THE FIVE-COMPONENT SYSTEM: FOUR SALTS AND WATER 139
be deposited and glaserite will dissolve. If the solid phases are removed or all the glaseriteis dissolved the composition of the solution will change and will move from B4 to A^.
At A 4 the composition of the solution remains unchanged during isothermal evaporationright down to dryness, and the composition of solution and of the solid phase is the same.A * is the final drying-up point of the whole system.
Plotting the Diagram within the Prism. A convenient projection of the prismto use when plotting the diagram is shown in Fig. 44. Five of the edges of the prism are
each the length of a side of the square and four of them are the length of half a diagonal.Each edge is considered to be divided into 100 parts, but it is more convenient to draw the
projection of the prism in, say, inches, and then to use a scale in inches and tenths to markoff the points. When marking off a point on, or parallel to, a diagonal line the data is
multiplied by 0-707 and then marked off with the scale (sin 45 = 0-707).The NaN0 3 field only is shown in Fig. 44, and this was plotted from Table 29 as follows :
From the NaN0 3 comer 0-179 Cl was measured along the NaNO 3 .NaCl edge of the
prism to give the point A 2 . In the same way 0-037 SO 4 gave the point / 2 . The point A z
was found by measuring 0-17 Cl along the NaNO 3 .Cl edge and then from the point obtained
measuring 0-030 SO 4 towards Na 2SO 4 and parallel to the NaNO 3 .Na 2SO 4 edge of the prism.That is, the point A 3 was plotted in the triangle NaNO 3 .NaCl.Na 2SO4 ,
which is one endof the prism. In a similar way, the point K 2 was found by measuring 0-462 K from the
NaNO 3 corner along the NaNO 3 .KN0 3 edge. The point / 3 was also similarly obtained bymeasuring 0-471 K along the same edge and by measuring 0-020 SO 4 from the point foundtowards the SO 4 edge and parallel to the NaNO 3 .Na 2SO 4 edge of the prism. The point C 3
was found by measuring 0-465 K along the NaN0 3 .KNO 3 edge and then, from the pointfound, measuring 0-080 Cl parallel to the NaNO 3 .NaCl edge.
The remaining point, A t ,is an internal point and requires slightly different procedure :
Cl and SO 4 are measured first and finally K. From the NaNO 3 corner measure 0-078 Cl
along the NaNO 3 .NaCl edge ;from the point thus found measure 0-018 S0 4 parallel to the
NaN0 3 .Na 2S0 4 edge, which fixes a point within the triangle NaN0 3 .NaCl.Na 2S0 4 . Fromthis point measure 0-462 K parallel to the NaN0 3.KNO 3 edge to find the point ^4 4 .
The figure is now completed by drawing lines from 7 2 to ^4 3 ,from A 3 to A z ,
from /2 to
/ 3 ,from 73 to K 2 , from K2 to C3 and from (7 3 to ^4 2 . Finally, draw the radiating lines from
AI to ^4 3 ,to (73 and to 7 3 .
The figures 2, 3 and 4 following each letter denote the number of solid phases in equili-
brium with the solution. Thus points on the edges of the prism are marked 2, points onthe faces of the prism are marked 3 and internal points 4.
The completed figure is the NaNO 3 field and should be compared with Figs. 41 and 42.
The KNO 3 field could conveniently be plotted on the same diagram ;in fact, all the fields
could be plotted on this diagram, but it might be convenient to make a new diagram for
the sulphate and chloride fields arranging for the sulphate and chloride edge of the prism
respectively, to be in the centre for more convenient plotting.The lines bounding the NaN0 3 field have been drawn as straight lines
; actually theyare curves, and where data is available intermediate points can be plotted and the shapeof the curves shown. In practice it is found that many of the curves do approximate to
straight lines, but there are exceptions. In Fig. 41 a dotted line is shown along one of the
edges of the Na aS0 4 field. This dotted line is the curve separating the Na 2S0 4 and glaseritefields in the reciprocal pair
0-5 K 2S0 4 -f NaN0 3 ^ 0-5 Na 2S0 4 + KN0 3

140 AQUEOUS SOLUTION AND THE PHASE DIAGRAM
with water at 75 C. This dotted line indicates that the surface separating the Na 2S0 4
and glaserite fields in the prism does not actually approximate to a plane surface, but the
fact is unimportant for a general study.
Projection of the Quinary with Quantitative Examples. Phase reactions within
KCl r
75C.
(A)
Upper surface
ofinterface.
Glaserite
(B)
Lower surfaceof interface
(C)
Interface
projectedfrom Na2S
FIG. 45.
a quinary system could be followed on a space model made of wire, but the technique wouldbe difficult and tedious. A projection similar to Fig. 41 or Fig. 44 could be used, but
internal points could not be read on the diagram. An orthogonal projection on one of the
square sides of the figure also has limitations.

THE FIVE-COMPONENT SYSTEM: FOUR SALTS AND WATER 141
In the case of the quaternary system, represented within a pyramid, the difficulty wasovercome by using Janecke's projection, that is, a projection on the base from the water
36*)
NaCl
FIG. 46.
apex. The quinary system may be represented in a similar way. Water has already beeneliminated and is not represented within the prism. One of the salts may now be eliminated
by projecting from the corner, representing that salt, on to the square opposite. In this

142 AQUEOUS SOLUTION AND THE PHASE DIAGRAM
case a square diagram is obtained as a Janecke's type of projection of a square-based pyramidwith the salt, to be eliminated, at the apex of projection. The pyramid is not a regular
pyramid.As an example, in the system represented by Fig. 41, Na 2S0 4 may be eliminated by
projecting from the Na 2S0 4 corner on to the KCl.KN0 3 .NaN0 3 .NaCl square. It will
readily be seen that only points within the pyramid Na 2SO 4 .KCl.KN03.NaN0 3 .NaCl will
project on the square. Any other points within the prism would project on to the base
beyond the line KC1.KNO 3 ;K 2S0 4 itself would project on the base at a point where the
lines NaCl.KCl and NaNO 3.KN0 3 meet at infinity.
Thus the choice of salt to be eliminated depends upon the part of the system to be
studied. The salt must be chosen so that the required points and curves come within the
pyramid of which that salt is the apex. If this is not convenient, it may be necessary to
use two projections or to project some points outside the square.
For the example to be studied the projection has been taken from the Na 2SO 4 corner
of Fig. 41, and Fig. 45 is the projection. Fig. 45c shows the complete projection of the
interface between the sulphates (K 2SO 4 ,Na 2SO 4 and glaserite) and KC1, KNO 3 , NaNO 3
and NaCl. The diagram should be regarded as an open square with KC1.KNO 3 as the
open end.
The square diagram should be compared with Fig. 41 and, for greater clarity, with
Fig. 42. The figure is a plan of the upper surface of the interface, that is, of lower surfaces
of the K 2S0 4 , glaserite and Na 2SO 4 fields. This is made clear by Fig. 45A. It is also a planof the lower surface of the interface, that is, of the upper surfaces of the four fields represented
by the four corners. This is shown in Fig. 45B.
On the composite diagram, Fig. 45c, a convention is suggested for marking the areas
to show what field is above, indicated as +, and what field is below, indicated as .
Comparison of Figs. 45A, B and c makes this clear.
A point on this diagram might represent a solution containing no sulphate, some
sulphate or saturated as to sulphate, or with different amounts of sulphate in the solid phase.
The diagram of Fig. 45c has been repeated in Fig. 46, but an elevation has been intro-
duced assuming that the two sides of the prism have been opened out so that the sulphate
may be represented vertically above the base. The plan may then be considered as an
orthogonal projection of the opened-out elevation. (This may be understood by comparisonwith Fig. 39.) The elevation gives the amount of sulphate (representing Na 2SO 4 ),
in addition
to 1 mol of the other salts.
Water may also be represented vertically on the elevation and a solution, saturated
as to two salts, would be represented by a point on the plan and by two points on the elevation^
vertically above the point on the plan. One point on the elevation would lie on the sulphatesaturation surface and the other on the water saturation surface. If the solution were
saturated as to three salts the two points on the elevation would lie vertically above but
on their respective curves.
For plotting the diagram of Fig. 46 the required data in Table 29 have been calculated
to eliminate Na 2SO 4 ,that is, so that the other salts add up to 1 mol. The re-calculated
data is given in Table 30 and the same reference letters have been used.
For the calculation, the mol fraction of SO 4 is separated from the other negative ions.
As Na 2S0 4 is to be eliminated, the same mol fraction is subtracted from the total Na mol
fraction. The total is then calculated back to unity by simple proportion. Two examplesshould make this clear.

THE FIVE-COMPONENT SYSTEM: FOUR SALTS AND WATER 143
TABLE 30
THE QUINARY SYSTEM, Na.K.NO3 .Cl.Na2SO4.WATER AT 76, C.
Mols per Mol of Salts (less Na2SO4 ).
The data from Table 29 have been calculated to represent a projection from the NaaS04 cornerof the prism.
G-Glaserito: 3K2SO4 .Na2SO4 .
Solution J54 has the following composition :
Deduct 0-024 Na.
Divide by (1-0- 024) = 0-976 .
Solution E3 has the following composition :
Deduct 0-150 Na
Divide by (1-0-
0-150) = 0-850 .
The result of subtracting the mol fraction of Na equivalent to S0 4 (half-mol) will
always be positive if the complex under consideration comes within the relevant pyramid.If it comes outside the pyramid then the result will be a negative value for Na, which meansthat the point will be plotted outside the square, that is, above the KC1.KN0 3 side. This
is sometimes necessary where the investigation overlaps the area of projection.The water figures need not be altered but may remain the same as in Table 29, but, in
this case, it must be remembered that the water figure applies to one mol of total salts
and not to one mol of salts without sulphate.The data are plotted in terms of Na, K, N0 3 and Cl on the square base plan, and the
S0 4 (representing Na 2S0 4 )and the water are plotted vertically on the elevation using any
1 Now in terms of 5 Na2SO 4 .

5 Na aSO 4 .
0-025
144 AQUEOUS SOLUTION AND THE PHASE DIAGRAM
convenient scales. The composition of any point may be read on the diagram and may becalculated back to rnols per mol of total salts. For example, take solution J5 4 .
Na. K. NO, ClB4 is read from the diagram as . . 0-492 0508 0-884 0-116Add 0-025 Na for Na2SO4 . . . 0-025
0-517 1>508 0^884 (Ml 6 (H)25Divide by 1-025 .... 0^504 0496 0-863 T113 0-024 *
Phase reactions may be followed quantitatively on this type of diagram and at anystage the compositions of solution and solid phases, as read on the diagram, may be calculated
to the compositions in terms of 1 mol of salts, and the correct proportion of each may befound by inspection, as will be seen later.
It is only necessary to plot the part of the diagram being studied and this especially
applies to the elevation. In Fig. 46 the whole internal system at 75 C. has been plottedon the plan. The sulphate and water elevations of the curve E 3B^ only, have been plottedon the elevation
;the water curve is marked E 3(w).B^(w) and the sulphate curve is marked
Et(8).Bt(8).
The point a on the plan has been taken to represent a complex, and the phase reactions
on the removal of water from this complex will now be studied quantitatively. The com-
position of the complex as represented on the diagram is as follows :
Na 0-680 molK 0-320 .,
N0 3 0-402
Cl 0-598
0-5 Na 2S0 4 . . . 0-184
Water .... 7-000
The composition in the more usual terms of 1 mol of total salts in complex a is :
Na 0-730 molK 0-270
NO 3 0-340
Cl 0-505
0-5 S0 4 .... 0-155
Water .... 7-000 ,,
The point s represents the complex on the elevation from the point of view of Na 2S0 4 ,
while the point w on the elevation represents water for the same complex. It is seen that
the complex, represented by s, would lie above the NaCl field and within the Na 2S0 4 field
if the correct amount of water were present.2 The position of w shows that the complex
is unsaturated solution, and the quantitative example to be worked out is the removal of
water from solution w.
ISOTHERMAL REMOVAL OF WATER. If sufficient water is removed from the solution wt
a mixture of NaCl and Na 2S0 4 will be deposited when the amount of water is such that
1 Now as 0-5 SO4
.
2 The point s is within the Na2SO 4 field of the space diagram (the prism), but water had beeneliminated to prepare that diagram. When water is re-introduced a four-dimensional diagram wouldresult and the complex might then bo in the Na2SO 4 field or in the field of all solution.

THE FIVE-COMPONENT SYSTEM: FOUR SALTS AND WATER 145
there are two solid phases. This is seen because the point a lies in the field marked(Na 2SO 4 + , NaCl -). (See Fig. 45.) The NaCl corner of the square represents NaCl or
Nad -f- Na 2SO 4 ,and therefore a line drawn from this corner, through a, to meet the
curve E^Bi at b is the path of crystallization of NaCl and Na 2SO 4 on the surface dividingthese two fields. This line is projected on to the elevation by plotting B z (see Table 30 and
compare Fig. 41) for sulphate and for water on the elevation, and drawing two lines
B 2 (s) to x and B z(w) to ?/, where x and y are the points corresponding to 6 on the respectivecurves, and vertically above it.
The solution, as represented by the point s, is within the Na 2SO 4 field (compare Fig. 46with Fig. 45c). If sufficient water is removed it will become saturated and Na 2S0 4 will
be deposited. This will be when water is somewhere between w and w', because w' representsa solution on the water saturation surface and saturated as to the two salts, Na 2S0 4 andNaCl. The vertical distance ww' indicates the amount of water to be removed from 1 molof salts before both Na 2SO 4 and NaCl will be deposited. The corresponding point on the
sulphate saturation surface for the solution saturated as to Na 2SO 4 and NaCl is #'. Thedistance SQ' indicates the mols of Na 2S0 4 deposited from 1 mol of the other salts in solution s.
It should be noted that the composition of the salts in solution, as represented by the
point s, does riot alter until the water content has reached the position between w and w' at
which Na 2SO 4 begins to be deposited.
Having reached the composition represented by the points w' and s' (and being still
at a 011 the plan), if more water is removed, the point, representing solution, will movefrom a on the plan towards b. On the elevation it will move from s' towards x and fromw' towards y. A mixture of NaCl and Na 2SO 4 will be deposited.
When water has been removed to the point w" the composition of the solution will be
represented by b on the plan, and by x for sulphate, and y for water on the elevation. The
complex will, of course, still be at a. The composition of the solid phase will be at NaClon the plan (representing NaCl f Na 2SO 4 )
and at e on the elevation, and there will beb to a parts of solid and NaCl to a parts of solution. The solution b is saturated as to
NaCl, Na 28O 4 and glaserite, the glaserite phase having just appeared.If the removal of water is still further continued the solution point will move from
b along the curve towards B. On the elevation it moves from y towards B4(w) and fromx towards 7? 4 (s) NaCl and glaserite will be deposited while Na 2S0 4 will be dissolved.
(Compare incongrueiitly saturated solutions in the quaternary system and Fig. 34a.) Anypoint on the curve E^B^ is incongrueiitly saturated and the point, representing the solution
in question, can only remain on the curve as long as there is Na aSO 4 in the solid phase.If the solid phase were removed when the solution was at b, then the further removal of
water would cause the solution point to leave the curve and cross the NaCl . glaserite surface
towards the curve (74J3 4 .
In the case being considered the Na 2S0 4 is left in the solid phase and so the solution
point follows the curve E SB4 , reaching B^ when the water is such that it is represented bythe point w"' on the elevation. The composition of the solution B^ will also be represented
by Bt(s) and BA(w) on the elevation. The solid phase, a mixture of NaCl, Na 2SO 4 and
glaserite, may be read at d on the plan, in terms of Cl, Na and K, and at d on the elevation
in terms of Na 2SO 4 ; thence it is calculated to 1 mol of NaCl, Na 2SO 4 and K 2SO 4 ,and may
be further calculated to NaCl, Na 2S0 4 and glaserite. There will be BA to a parts of solid
and d to a parts of solution.
By the removal of water from complex a, the solution was enriched in potassium and

146 AQUEOUS SOLUTION AND THE PHASE DIAGRAM

THE FIVE-COMPONENT SYSTEM: FOUR SALTS AND WATER 147

148 AQUEOUS SOLUTION AND THE PHASE DIAGRAM
greatly enriched in nitrate, but some of the potassium was lost in the solid phase. If the
object had been to recover the potassium, then NaNO 3 could have been added to the original
solution to move it to the point c on the plan. Then the removal of water would have
caused the composition of the solution to move directly to J54 with a solid phase of NaCland Na 2S0 4 only.
Tables 31 and 32 show quantitatively how the isothermal removal of water from 1 molof complex a gives solution b and then solution J3 4 ,
with the proportion and actual quantitiesand composition of solution and solid phases. The following explanation should make the
method clear.
The compositions as read on the diagram (plan and elevation) are the correct composi-
tions, but they are not in a familiar form. Part of the sodium is read as Na ion on the
plan and part of it is read as Na 2SO 4 011 the elevation. The total, including Na 2SO 4 ,is
more than 1 mol of salts, but may be calculated to represent 1 mol.
The proportions of solution to solid, as read on the plan, are distorted because the
amount of Na 2SO 4 varies on different parts of the diagram, i.e. on the projection of the
interface. A line drawn from the point representing the solution to the point, representing
the solid phase, and passing through the complex represents the amount of complex. On
Fig. 47 this line is 6 to NaCl and measures 0-540 mol using the base of the square for measure-
ment. This can, therefore, be taken as 0-540 mol of complex a, which is the same as the
NO 3 content of 1 mol of solution b. In the same way the amount of solution /; is the same
as the NO 3 content of 1 mol of complex a, i.e. NaCl to a. The expression 1 mol of complex a
here ignores the water content and means a complex with salt content, less Na 2SO 4 ,of
1 mol. The corrected proportions may be found by inspection of the data read from the
diagram after it has been adjusted to represent 1 mol of total salts, including Na 2SO 4 .
For example, 0-540 mol of complex a (line 6 to NaCl, and N0 3 content of 1 mol of
solution 6 as read on the diagram) becomes 0-499 mol of complex a (N0 3 content of solution 6
as mols per mol of total salts). The same final result would be obtained if the line 6 to
NaCl were measured parallel to the vertical sides of the square : in this case, K would be
taken instead of NO 3 .
COOLING. Having followed some reactions on a quinary isotherm it is now proposedto consider a case of cooling a solution.
Table 33 gives the data for plotting the same quinary but at 25 C. The same letters,
but small case, have been used when the solutions have the same solid phases. A diagramlike Fig. 41 should be plotted by the reader for comparison, when it will be noted that the
figure obtained is similar to Fig. 41, but that the Na 2SO 4 field (see Fig. 45A) has become
two fields : Na 2S0 4 on the NaCl side and darapskite on the NaNO 3 side. In addition to
this, there is a field for Na 2SO 4 .10H 2O above the Na 2SO 4 and darapskite fields (not shown
in Fig. 47). The projection from the Na 2S0 4 corner of the prism is shown in Fig. 47 and
was plotted from the data in Table 34. The point ^4 4 at 75 C. has become e 4 at 25 C.,
saturated as to NaN0 3 ,KN0 3 ,
NaCl and darapskite. The curve AJ 3 of Fig. 46 has become
e 4m 3 , representing solution saturated as to NaNO 3 ,KN0 3 and darapskite and containing
some chloride. The sulphate and water elevations of the curve e4w 3 have been included
in Fig. 47, and the point A from Table 30 (75 C.) has been plotted on plan and elevation
because it is proposed to study the effect of cooling this solution from 75 C. to 25 C.
Solution A 4 might have been obtained by adding the required amount of NaNO 3 to
the complex a already studied on Fig. 46 and removing the correct amount of water.
It is proposed to consider two examples of cooling the solution. In the first example

THE FIVE-COMPONENT SYSTEM: FOUR SALTS AND WATER 149
KCl
cut 25 C
7T13(W)
m3 (S)
Nad
the solution will be diluted with a small amount of water and a mixture of NaN0 3 andKN0 3 obtained as solid phase. In the second example the solution will be diluted with
a larger amount of water and pure KNO 3 obtained as solid phase when cooled to 25 C.
First Example. On the plan the point A t appears in the KNO 3 or the glaserite fields
at 25 C. (Compare Fig. 45A and B.) On the elevation A^(s) is below the KNO s-glaseriteinterface which means that, within the prism, the point A* is inside the three-dimensional
field of KNO 3 .

150 AQUEOUS SOLUTION AND THE PHASE DIAGRAM
TABLE 33
THE QUINARY SYSTEM : SODIUM, POTASSIUM, SULPHATE, NITRATE, CHLORIDE, WATER, AT 25 C.
Mols per Mol of Total Salts.
(Adapted from data by Blasdale, 1918, Reinders, 1915, and Cornec, Krombach and Spack, 1929-30).
D = Darapskito : NaNO a .Na2SO4 .H2O.G = Glaserito : 3K 2SO4 .Na 2SO4 .
When water is represented, solution A^ at 25 C. can be in the KNO 3 field, theNaN0 3 -f KN0 3 field, or the field of NaN0 3 -f- KN0 3 + darapskite, according to theamount of water present.
When the quaternary system was studied it will be remembered that a point onJanecke's projection of the pyramid was within the field of one salt, two salts or three salts,
according to the amount of water present (see Figs. 29, 30, and 31). It will be seen shortlythat the point A^ is in the field of three salts when the amount of water is as given in Table 29.

THE FIVE-COMPONENT SYSTEM: FOUR SALTS AND WATER 151
TABLE 34
THE QUINARY SYSTEM : Na.K.NO 3 .Cl.Na2SO4 .WATER AT 25 C.
Mols per Mol of Salts (less NaSO 4 ).
The data from Table 33 have been calculated to represent a projection from the Na2SO4 corner
of the prism.
Solid Phase.
Na2S0 4 -I- NaCl
NaNO 3 1- DKNO 3 '-H K 2S0 4
4- KC1Na,SO 4
4- NaCl + GNaCl 4- KC1 -f GKC1 -f K 2S() 4 4- GKNO 3 + K 2S0 4 -f GNaNO3
4- KNO 34- D
KN0 3 + D 4- GNaNO 3 f NaCl + DNa2SO4 + NaCl + DKN03 + NaCl 4- KC1 4- GKNO 3
4- KC1 f K aSO 4 + GNaN0 3
4- KN0 3 + NaCl + DNaCl 4- KNO S 4- D + GNaCl 4- Na2S0 4
4- D 4- G
D -- Darapskite : NaNO 3 .Na2SO4 .H 2().
G = Claserite : 3K 2SO4 .Na 2SO 4 .
On Fig. 47 a line is drawn from the NO 3 corner (representing NaNO 3 and KN0 3 as
solid phase) of the elevation through A^(s) to meet the sulphate curve at x. The point x is
then projected 011 to the water curve and on to the curve e 4w 8 on the plan ; these three
points are marked x on the diagram and represent the solution required if the solid phase
is to be free from darapskite with a maximum yield of NaNO., and KN0 3 .
Another line is drawn from the NO 3 comer of the elevation to meet the water curve
at x, and it will be noticed that this line does not pass through A*(w) but passes above it
at a point representing more water. This amount of water, represented by the vertical
distance above A*(w), must be added to 1 mol of salts as solution A^ before the solution
is cooled.
A line is drawn from x on the plan, through A 4 to meet the nitrate side of the square
at y which represents the composition of the solid phase.
The above reactions are followed quantitatively on Table 35.
It has been shown above that solution A 4 needs dilution if the solid phase is to be
NaN0 3 and KN0 3 ,that is, the undiluted solution A^ at 25 C. was within the field of three
salts, NaN0 8 ,KN0 3 and darapskite.
If solution A 4 had been cooled to 25 C. without dilution the solid phase would have
been these same three salts. The solution at 25 C. would still have been represented on
the curve e 4m 3 at a point near x. The solid phase would have been represented near y on
the plan and by two points on the N0 3 vertical of the elevation representing Na 2S04 (to be
calculated to darapskite) and water of crystallization.

152 AQUEOUS SOLUTION AND THE PHASE DIAGRAM

THE FIVE-COMPONENT SYSTEM: TOUR SALTS AND WATER 153
Second Example. If the right amount of water is added to solution At before cooling,the solid phase will be KN0 3 , because the complex will have been moved into the field ofone salt, KN0 3 .
Draw a line on the plan from KNO 3 through A^ to meet the curve e 4m 3 at 2. Project z
on to the curve e 4w3(w) on the elevation and draw a line from this point (not shown in the
figure) to the N0 3 corner. This line will cut the vertical line which passes through A^(w)at a point above A t(w), giving the amount of water to be added to 1 mol of total salts assolution A*.
When this diluted solution is cooled to 25 C., KNO 3 will be the solid phase. Thecomposition of the solution at 25 C. will be represented by z on the plan and by the projectionof z on the curve e 4w a(w) on the elevation.
The sulphate in the solution will not be represented on the curve e 4w 3(s). A line
drawn from the N0 3 corner of the elevation through A t (s) is below the sulphate elevationof the curve. The sulphate in the solution at 25 C. is therefore represented by a pointvertically below the projection of z and on the interface between the KNO 3 and NaN0 3
fields. Thus the cooled solution is saturated as to KNO 3 (KN0 3 is the solid phase), justsaturated as to NaNO 3 (it lies on the saturation surface) and is not saturated as to Na 2SO 4 .
The point representing the Na 2S0 4 in the solution may be found on the elevation wherethe line from the NO 3 corner and through A^(s) would cut a vertical line through z.
In the above examples of cooling solution A* it will have been noticed that the pathsof crystallization from KN0 3 and from a mixture of NaNO 3 and KNO S were drawn on the
plan across the curve /4u 3 to meet the curve ejn 3 . These paths of crystallization cannotmeet the curve /4w 3 , they pass below it and only appear to meet it on the plan.
It has been shown that when solution A 4 is cooled to 25 C. without any added water,the solid phase is NaNO 3 ,
KNO 3 and darapskite. The solution, therefore, must be repre-sented on the curve e 4m 3 . When solution A^ is diluted before cooling, the compositionof the solution at 25 C. must therefore be still further removed from the curve /4?i 3 .
General Notes on the Quinary System. Assuming that there is no vapour phaseand that pressure is fixed at one atmosphere, then, according to the phase rule when thereare five phases of four solids and a solution, the quinary system will have one degree offreedom.
F = C P + 1 (see next chapter).
Number of components (7 = 5, number of phase P = 5. Therefore ^ = 5 54-1 = 1.
Temperature may, therefore, be selected when there are four solid phases as well asa solution.
If there are five solids as well as a solution, then there is no degree of freedom left andthe temperature is that fixed by nature. There are several such cases in the system whichhas just been considered, but only one need be mentioned. The point A 4 on Fig. 44 repre-sents a solution saturated as to NaN0 3 , NaCl, Na aSO 4 and KNO 3 ,
and is an isothermalinvariant point at 75 C.
If the temperature is lowered, assuming the system remains at equilibrium, the point ^4 4
moves nearer to Na, Cl and S0 4 ,but the general shape of the NaNO 3 field remains the same.
At 74 C. a field of the double salt, darapskite, begins to form at the / 2 corner as a small
triangle on the Na aS0 4 surface IJ 3A tA 3 . As the temperature is still further lowered the
darapskite field grows until one of its surfaces covers the Na 2SO 4 surface of the NaNO s
field completely, the last part to be covered being the A* corner. At a little below 55 C.
the Na 2S0 4 surface has disappeared from the NaNO 3 field and is replaced by darapskite,

154 AQUEOUS SOLUTION AND THE PHASE DIAGRAMand the point A 4 has become, say, L 4 ,
which represents a solution saturated as to NaN0 3 ,
NaCl, darapskite and KN0 3 . At a definite temperature, 55 C., there is a point, say J/ 6 ,
which is saturated as to NaNO 3 , NaCl, Na 2SO 4 , darapskite and KNO 3 .
If the system was at this required temperature and equilibrium was established, all
five phases would be present and the point M 5 on a diagram would be in contact with all
five three-dimensional fields.
If heat is given to the system and equilibrium maintained, the phase reactions will
be such as to absorb heat. (Principle of Le Chatelier.) Darapskite will be decomposedinto NaNO 3 ,
Na 2S0 4 and water, but the temperature and the composition of the solutionwill remain unchanged ; NaN0 3 , NaCl and Na 2SO 4 will dissolve as the darapskite is decom-posed. When all the darapskite is decomposed this field is no longer in contact with the
point M 5 ,a phn.se is lost and a degree of freedom gained. The temperature can now rise
and a temperature may be selected. The solution will then be similar to A^ saturated as
to NaNO 3 , NaCl, Na 2$O 4 and KNO 3 .
If, on the other hand, heat had been removed from the system, the phase reactionswould have been such as to give out heat. Darapskite would have been deposited andNa aSO, would have dissolved. The temperature and the composition of the solution wouldstill have remained unchanged. In this case when the Na 2S0 4 is all dissolved a degree offreedom is gained, and the temperature can fall and a temperature may be selected. Whenthe system is at equilibrium the solution, similar to L 4 , is. saturated as to NaNO 3 , NaCl,darapskite and KNO 3 .
To summarize :
Three solutions are being considered :
At is saturated as to NaN0 3 , NaCl, Na 2SO 4 and KNO 3 .
L 4 is saturated as to NaNO 3 , NaCl, darapskite and KNO 3 .
If 5 is saturated as to NaN0 3 , NaCl, darapskite, Na 2S0 4 and KN0 3 .
Solution MS can exist, in contact with five solid phases only at a temperature fixed bynature. This temperature is 55 C.
Above this temperature the phase darapskite disappears and the solution becomessimilar to A^ its composition depending on the temperature selected.
Below this temperature the phase Na 2SO 4 disappears and the solution becomes similarto L 4 ,
its composition depending on the temperature.The solution M 5 , saturated as to, and in contact with, its five solid phases, represents
a system invariant point ;it has no degree of freedom in the condensed system. The
composition of the solution is fixed by nature and the temperature also, which may notbe altered if equilibrium is to be maintained. The temperature could easily be altered byapplying sufficient heat quickly, but the system would 110 longer be in equilibrium ;
whenequilibrium was re-established a phase would have disappeared.
There are six points representing solutions saturated as to five solid phases in the
system Na, K, S0 4 ,NO 3 ,
Cl and water between the temperatures of 55 C. and 1-3C.Two of these points are caused by the disappearance of a phase from the whole system.At 11-6 C., Na 2S0 4 disappears and is replaced by Glauber's salt. The Glauber salt field
touches the NaCl field on the NaCl Na 2SO 4 edge of the diagram at 17-9 C., and as the
temperature falls it spreads over the NaCl field, displacing the Na 2SO 4 surface. A little
above the temperature of 11-6C. the Na 2S0 4 field is a small tetrahedron with its baseon the three-dimensional NaCl field and its apex at the Na aS0 4 corner of the diagram.

THE FIVE-COMPONENT SYSTEM: POUR SALTS AND WATER 155
As the temperature falls the tetrahedron shrinks and at 11-6 C. it vanishes, leaving a pointon the NaCl field representing a solution saturated as to NaCl, glaserite, darapskite, Na 2S0 4
and Glauber's salt. In a similar manner darapskite disappears at 3-4 C. A point repre-
senting a solution saturated as to five solid phases can be formed in another way, that is,
like the case already described at 55 C. In this example the point occurs at the separationof two solid phases which have been in contact and the bringing into contact of two other
solid phases which had been apart. In this example, above 55 C., NaN0 3 and Na 2SO 4
were in contact and below 55 C., KNO 3 and darapskite were in contact. There are in all
four examples of this class between the temperatures mentioned, namely at 55 C., 38 C.,
8-7 C. and 1-3 C.
The necessary data for plotting isotherms over the temperature range, mentioned in
the preceding paragraph, can be found in Caliche, July and August, 1930 (Cornec, Krombachand Spack).
This concludes the practical examination of phase diagrams which this book set out to
present. It does not claim to be in any way exhaustive, but it is suggested that sufficient
examples have been given to enable the reader to tackle any phase problem of aqueoussolutions which he is likely to meet. The methods of solving the more complicated cases
may be legion, but they all follow the principles which have been illustrated. The next
chapter is brief and is an attempt to give the reader a clear picture of just sufficient phase
theory to help him to have a theoretical background to his more practical diagrams.

CHAPTER XIII
GIBBS'S PHASE RULE
This brief explanation of the Phase Rule has been purposely relegated to the last
chapter, because it is felt that many students have failed to make full use of phase diagramsbecause the theoretical study of the phase rule does not emphasize the extreme simplicity
of its practical application. The standard elementary textbooks rarely carry the phase
theory beyond unary systems. Binary systems are touched upon in some cases, but ternary
systems are practically ignored.The Phase Theory deals with systems in equilibrium. A system, in this sense, is
a mixture of chemical components, that is, a complex. When the mixture attains equili-
brium it resolves itself into a number of phases, a phase being a homogeneous part of the
heterogeneous system. As regards gases, these are always completely miscible and a mixture
of gases is homogeneous. Thus there can only be one gaseous phase. Some liquids are
immiscible, as for benzene and water, and there can therefore be more than one liquid phase.
Except, however, for certain rare exceptions, aqueous solutions only give one liquid phase.With solids, however, there may be as many solid phases as there are solid chemical com-
pounds in the system. This is assuming that solids are immiscible, which is generallythe case.
The chemical entities in a mixture are called its components when they are inde-
pendent. Chemical entities, which are dependent upon another chemical entity, are not
components. For example, chlorine and sodium, of sodium chloride, are dependent uponeach other. If the amount of sodium is doubled by adding sodium chloride, then the
amount of chlorine is also doubled and there is only one component, sodium chloride. If,
however, the system contains sodium hydroxide, hydrochloric acid, sodium chloride and
water the number of components is three, since sodium chloride in this case is not a com-
ponent but is dependent on the sodium hydroxide and hydrochloric acid. The two latter
are components in this example because they are independent of each other. Similarly,
a mixture of Glauber's salt, anhydrous sodium sulphate and water has only two components,Glauber's salt being dependent on the other two substances. In other words, the numberof components in a system is the smallest number of chemical substances required to define
the composition. The Phase Rule is concerned with this number and not with the nature
of the components.The chemical composition of a mixture may be expressed in terms of its components
which do not alter in number. Its physical composition is defined in terms of its phases.
The number of components does not vary but its phases may be altered, for example, bythe physical treatment of the mixture. The total number of phases may be increased or
decreased, and a phase may be made to appear or disappear.
The physical conditions to which a mixture may be subjected are temperature, pressure,
electrostatic and electromagnetic fields, gravitational fields, radiant energy, etc. It is usual
to ignore all these except temperature and pressure, and for condensed systems, where the
effect of pressure is negligible, only one external physical condition, temperature, need be
specified.
The Phase Theory is concerned with completely defining the state of a system in
equilibrium. Such a definition requires a knowledge of the factors which influence the
156

GIBBS'S PHASE RULE 157
state of equilibrium. These factors or variables are of two kinds : external variables andconcentration variables, the former having been reduced to one, temperature, and the latter
being the concentration of a component in a phase, expressed as mass in unit volume or
as volume of unit mass. (Specific gravity or specific volume.)The Phase Rule states that there is a relationship between the number of components,
the number of phases and the number of independent variables. The independent variables
are called the degrees of freedom : these are the number of variables which must be
specified in order that the system may be completely defined without ambiguity. In order
to be able to state the condition of a mixture in equilibrium it is not necessary to know all
the variables. Having specified the temperature and some of the concentrations, the other
concentrations can only be those required by the equilibrium, that is, they are fixed byNature. The Rule, deduced by Gibbs, states that the number of independent variables
(degrees of freedom) F is a function of the number of components C and the number of
phases P.
Fundamentally, this number is C P, being the number of independent concentration
variables.
When temperature is introduced as a variable the number of independent variables
is increased by one and the expression becomes
C -P + 1.
If pressure and temperature are introduced the expression becomes
C - P -f 2
and it was in this form that Gibbs introduced the Rule.
If any of the other external variables were necessary the expression would be
C - P -f k
where k is the number of external variables which influence the system.
The Rule is deduced from thermodynamic considerations. For a system to be in
equilibrium each phase must be in equilibrium with each other phase. Consider one of the
components distributed between two phases : the system will be in equilibrium when the
thermodynamic potential, GL ,of the component in phase I is equal to the thermodynamic
potential, On ,of the same component in phase II. is the recognized symbol for thermo-
dynamic potential.
Suppose that an infinitely small quantity dm of the component passes from phase I to
phase II. The decrease in O of the component in phase I is
_dGidm'
The increase in of the same component in phase II is
+ 30n_dm
'
But the thermodynamic potential must remain unchanged because the two phasesare in equilibrium. That is 9(7 = O. As
BO = - d(h + ^_n = O,dm dm
,, dQI dGuthen - i1.
dm dm

158 AQUEOUS SOLUTION AND THE PHASE DIAGRAM
Similarly, the equilibrium of the same component between phase II and phase III may be
expressed by the equation
dCrn _ d(rin
dm dm
A third equation, that is, between phase I and phase III is redundant because of the
simple law of logic that things which are equal to the same thing are equal to one another.
Thus only two equilibrium equations are necessary for three phases.
Continuing the above procedure for P phases will give P ~ I equilibrium equationsfor the component chosen.
If there are C components there will be C(P 1) equations. Each of these equations
is dependent upon the concentration of a component in a phase and, as they are equations,
they are dependent upon each other. The expression C(P I), therefore, gives a figurefor the number of dependent concentration variables.
The total number of concentration variables is found as follows. For each phase, its
composition could be expressed in C terms for C components. If the composition is
expressed in parts per 100 parts, then only (C 1) terms are required. For example, if
there are three components a, 6, and c, and it is known that the phase contains 10% of
a and 70% of 6, then it is known that the amount of c will be (100 80) = 20%. In other
words, although there are C terms for expressing the concentration of C components in
each phase, only (C 1) of these terms are concentration variables. As there are P phasesthere will be P(C 1) concentration variables.
To this number must be added the external variables (temperature, pressure, etc.).
If temperature is the only one which influences the equilibrium only one external variable
is added, making P(C 1) -f 1 total variables.
The number of independent variables is obtained by subtracting the number of
dependent concentration variables from the above total. This gives the degrees of
freedom F :
F == P(O -1) -f 1 - C(P - 1)
= c ~ P + 1
The more usual form in chemical literature takes pressure as well as temperature into
account and so appears as
F == C - P| 2.
As regards the modified form, F C P -J- 1, this expression only applies to
CONDENSED systems where temperature is the only external influence affecting equilibrium.
Throughout this book it has been assumed that all the systems are condensed. This meansthat there is no vapour phase, but it does not necessarily eliminate pressure as a possibleexternal variable. The reason for omitting pressure in the above deduction of the Ruleis that changes of pressure have a negligible effect upon the solubility of a salt in water.
Changes of pressure do, however, affect the vapour phase considerably so that it must beassumed that there is no vapour phase in order to be able to omit pressure changes. In
other words, the pressure must be great enough to condense all the vapour, but the systemis not necessarily isobaric. Atmospheric pressure is usually sufficient to give this condition.
It may at first appear that there must always be a vapour phase, because all aqueoussolutions, and even ice, exert a vapour pressure. That this is not so will be clearly seen
if the system is imagined as being enclosed in an elastic bottle. Let the system consist of
water and one salt. The pressure is atmospheric, the temperature is 20 C. and all air has
GIBBS'S PHASE RULE 159
been excluded. The bottle is completely filled by the complex with no room for vapour.If the temperature is raised, although the vapour pressure of the solution increases, no
vapour phase can appear until the boiling-point of the solution is reached. Thus, systemscan be considered as condensed if the temperature is below the boiling-point of the liquidphase at the given pressure.
To summarize, the phase theory shows that when the number of independent com-
ponents in the system is fixed, the type of equilibrium is determined only by the numberof co-existing phases. By the type of equilibrium is meant the variability of the system,which is expressed as the number of degrees of freedom . A system with no degree of freedomis called invariant. When restricting the scope to condensed systems such a system shouldbe called
"invariant condensed," but as this book is only concerned with condensed systems
this term is often omitted. A system with one degree of freedom is called univariant, withtwo degrees bivariant, with three degrees tervariant, with four degrees tetravariant, and so on.
The number of independent components gives the order of the system, unary, binary,
ternary, quaternary, quinary, and so on.
From the rule for condensed systems, F ~ C P -f 1, it is obvious that addinga component adds a degree of freedom. The disappearance of a phase has the same effect.
The converse is also true.
It is now proposed to apply the rule to a few examples.
Binary Systems (e.g. one salt and water).Here (7-2.There cannot be less than one phase, and in such a case where P = 1
^ = 2-1-1-1=2.
Thus the maximum number of degrees of freedom is two, and the system is bivariant
for a condensed system.The minimum number of degrees of freedom is none, and when F 0, P = 3.
Thus the maximum number of phases possible is three.
Taking the case of one phase this will be unsaturated * solution. The two degrees-of freedom are temperature and the concentration of the salt in the solution (or, alterna-
tively, the concentration of the water in the solution). This means that these two mustbe selected to define the system. Reference to the early diagrams (e.g. Fig. 1) will illustrate
that in order to fix a point within the liquid field it is necessary to know the temperatureand the concentration.
When there are two phases, F = 1 and the system is univariant. This implies that
if the temperature is selected, the concentration of the solution is fixed by nature to satisfythe equilibrium. Conversely, if the concentration is selected the temperature must be the
one temperature which satisfies the equilibrium. Fig. 1 was drawn on the assumption that
at a fixed temperature the solubility of the salt would always be the same. This can nowbe considered as proved by the phase rule, so that if the temperature is known, the con-
1 A saturated solution cannot bo taken for the above ctiso as a saturated solution must have a
solid phase in theory. Points on saturation curves .and surfaces must be considered as representingsaturated solutions m contact with the solid phases. A saturated solution of one salt in water has,
therefore, two phases though it is often conveniently described as all liquid. Having two phases and
being of two components there is one degree of freedom. If temperature is selected the compositionof the solution is fixed by nature, or if the composition of the solution is selected then only at one
temperature can such a solution exist in equilibrium with the solid phase.

160 AQUEOUS SOLUTION AND THE PHASE DIAGRAM
centration of the salt in solution is found on the saturation curve. Conversely, if the
concentration of the salt in solution is selected the corresponding temperature is found onthe curve.
It will be noted that, although the phase rule justifies the drawing of the curve, it
does not indicate its shape or position, nor does it indicate the relative amounts of the
phases. The former must be determined by direct experiment, the latter being then
obtained from the diagram. Nor does the phase rule predict what the solid phase will be,
it merely gives the number of phases. The composition must be determined by experiment,and the diagram can then be used to predict other points within the field. The above
example assumes the solid phase to be salt. It might, of course, be ice, but the same
arguments hold.
When there are three phases, F = and the system is invariant. This means that
neither temperature nor concentration of the solution may be selected and the system is
already defined by nature. In Fig. 1 the point A represents the only solution which can
exist in equilibrium with both ice and salt, and the complex must be on the horizontal line
through A.
It must be noted that defining a system is not the same thing as stating the compositionand temperature of a complex. The phase rule takes no account of the relative amountsof the different phases. When a system has been defined the temperature is fixed andthe composition of each phase is fixed (by choice or by nature), but not their relative amounts.
In the bivariant case (the liquid field of Fig. 1) both temperature and composition have
to be selected to mark the solution, which in this case is the complex. In the invariant
case (e.g. ammonium sulphate and solution field of Fig. 1) it may appear that both tempera-ture and composition may be selected, but this is only necessary to fix the complex. The
composition of the phases is fixed by nature once the temperature has been selected.
The above argument will make clear why the solid field below the eutectic is also
univariant. If temperature is selected, although the relative amounts of ice and salt maybe chosen, the compositions of the ice and of the salt are fixed by nature, being pure ice
in the ice phase, and pure salt in the salt phase.
When referring to selection of temperature and concentration it is obvious that such
selections are always"within limits." Freedom has a limited range.
'Ternary Systems (e.g. two salts and water).
With the addition of one more component the maximum number of degrees of freedom
is increased by one, so that for a ternary system there can be three degrees of freedom.
For one phase the rule shows that there will be three degrees of freedom (tervariant).
This must be the liquid phase, that is unsaturated solution. The three possible selections
are temperature and two out of the three components for the concentration. Usually the
concentration variables chosen are those for the two salts, rather than for one of the salts
and water. Theoretically the three selections could be three concentrations, but in that
case they would have to be expressed as mass per unit volume, which is what the phase rule
really demands (see later, p. 163).
For two phases there will be two degrees of freedom (bivariant). Temperature maybe one selection and the concentration of one of the components in one of the phases the
other, or, alternatively, two concentrations may be taken. In the case where the two phasesare one of the salts and a solution, it is usual to take the concentration of one of the salts
in the solution phase as the concentration selection. Fig. 9 may be taken as an example.This diagram represents the whole system at 50 C., and is described as an isotherm.

GIBBS'S PHASE RULE 161
The point 5 is in the field of"potassium nitrate -f solution," that is, two phases and
bivariant. As already stated, it should be described as"bivariant condensed." As
temperature has been selected, one degree of freedom has been used up, so that the systemrepresented by the field surrounding point 5 could be described as
"univariant isothermal
condensed." This leaves one degree of freedom for this field on the isotherm. Supposethe concentration of potassium nitrate in the solution phase is selected. Then nature fixesthe concentration of sodium nitrate. For example, if potassium nitrate is 33%, thensodium nitrate must be 27% in the solution, giving point y on Fig. 9. Conversely ,' if theconcentration of sodium nitrate were selected, then nature fixes the concentration of
potassium nitrate. It will be obvious that the water concentration could have been theselection.
It should again be noted that the phase rule does not predict the concentration of theother components, it only establishes that, having selected one concentration, the otherconcentrations are fixed by nature. The actual figures have to be determined by experiment,and this was done before Fig. 9 could be plotted. Furthermore, having determined the
composition of the solution at y, the phase rule does not concern itself with the compositionof the complex which may contain any quantity of the solid phase in equilibrium with anyquantity of the solution. This is the same as saying that the complex may be anywherealong the straight line drawn from y to the point representing the solid phase. Thus the
phase rule has justified the use of straight lines as tie-lines in phase diagrams.For three phases, F = 1 and the system is univariant condensed. If temperature
is selected the system is invariant isothermal condensed, there being only one compositionof solution which is in equilibrium with two solid phases. (Point A of Fig. 9.) If tempera-ture is not selected the concentration of one of the components might be chosen in thesolution phase. In such a case temperature could only be that which nature demands to
satisfy the equilibrium. Here, again, the phase rule does not concern itself with the com-
position of the complex, which may be anywhere within the field of solution and mixed solids.
For four phases, which is the maximum number, F = and the system is invariantcondensed. There is only one solution which can be simultaneously in equilibrium withthe two solid salts and with ice, and this condition can only exist at one temperature.These factors are all fixed by nature and man has no choice, unless he can find anotherexternal variable which has an influence. When ice is present pressure does have anappreciable effect, and in the deduction of the formula, if such a formula were to be usedfor ice, pressure should have been included making F C P -f 2. The four-phasesystem then becomes univariant but, although pressure has now been introduced, the
system will still be condensed unless the pressure is so reduced that a vapour phase appears.
Quaternary Systems (e.g. three salts and water).For a system of four components when there is one phase, the formula shows that
there are four degrees of freedom. That phase must be liquid (i.e. unsaturated solution),and there is free choice, within limits, of temperature and of the concentration of three ofthe components in the solution.
For two phases there are three degrees of freedom : temperature and the concentrationof two of the components in the solution, or, if the concentrations of three of the componentsin the solution are selected, then there is no choice of temperature. A phase diagram for
four components can be represented within a tetrahedron with the components situated atthe four corners. Saturated solutions are represented on three surfaces within the figure
forming one irregular surface, and as temperature is changed this surface moves towardsM

162 AQUEOUS SOLUTION AND THE PHASE DIAGRAM
or away from the water corner. To plot a point within the tetrahedron three dimensions
are necessary ;these can be the concentrations of three of the components. When such
a point has been plotted the saturation surface may be imagined as being moved by changeof temperature. There can be only one position of the surface, and therefore only one
temperature, when the point is on the surface. Thus, if three concentrations are selected,
there is no choice of temperature, and the system is tervariant condensed. If temperatureis selected there is only a choice of two concentrations and the system is still tervariant
condensed, although it may be described as bivariant isothermal condensed.
When there are three phases the system becomes bivariant, the two degrees of freedom
being temperature and one concentration, or, alternatively, two concentrations. Thesolution would be on one of the lines where two saturation surfaces meet, and an extension
of the argument given for two phases will show that one concentration choice has been
lost, since the solution lies on a line instead of a surface.
In the same way for four phases a further concentration choice is lost, and the solution
in this case is represented by the point where the three surfaces meet. This system is
univariant condensed, there being a choice of either temperature or one concentration.
A condensed quaternary system to be invariant must have five phases. These are,
in their simplest form, solution, three solid salts and ice. This can only happen at one
temperature and with one composition for the solution. If double salts or hydrates are
formed the maximum number of phases still remains five.
In the above examples of quaternary systems only the solution has been considered.
Just as in the ternary systems the complex was somewhere within the field in question, so the
quaternary complexes lie within three-dimensional fields which are parts of the tetrahedron.
Reference to Figs. 25, 26 and 27, which show the dissection of a pyramid, can be made to
illustrate this. Although the pyramid has a square base, the system is quaternary and the
arguments given hold for this figure also. Fig. 25 shows four tervariant systems ;with
the tetrahedron there are only three such systems. Fig. 26 shows four bivariant systemssimilar to the three which would be found in the tetrahedron. Fig. 27 shows two univariant
systems at 5 and 7;
in the tetrahedron there would only be one.
The Concentration Variable. In all the above examples it was assumed for con-
venience that the concentration of a component to be selected applied to the solution phase.
In practice this is nearly always the case. But the phase rule allows the concentration
of any component in any phase to be selected. The concentration of a component in
a solid phase of its own composition could be selected if it be remembered that concentrations
are volume concentrations expressed as mass of component per unit volume of phase. Thus
the concentration of salt as a component in the same salt as solid phase, even though its
composition may be 100%, may vary in concentration. This is equivalent to giving its
specific gravity or specific volume which at a stated pressure is controlled by the temperature.That is, it would be substantially a temperature selection.
The concentration of a component in unit volume of another solid phase may also be
selected, but if the solid is pure the selection is meaningless, being nil. If, on the other
hand, there is a concentration, that is, the solid phase does contain some of the componentin question, then it is obviously a case of solid solution and the selection would be feasible.
This, however, is beyond the scope of this elementary work. The concentration of a com-
ponent in a solid phase must not be confused with the composition of a mixture of two
solid phases in a mixed field.
It may appear to the reader that, in view of the above, the general usage of weight per

GIBBS'S PHASE RULE 163
weight composition (e.g. %), instead of volume concentrations, is unsound. When the
diagrams are plotted on a percentage composition basis the error cancels out. The practicalvalue of phase diagrams justifies the use of composition by weight.
The question of the phase rule allowing the choice of the concentration of any componentin any phase has led to a school of thought which takes the view that no solid phases in
equilibrium with solutions can be pure. In other words, solid solution is assumed to be
universal, and throughout this book where a solid phase has been assumed to be 100% pure,this would not be strictly accurate. Any change in the composition of the solution, this
school states, would result in a corresponding change in the composition of the solid phase,however small that change might be, so that each particular solution composition would
correspond with only one solid phase composition. A. C. D. Rivett, The Phase Rule andthe Study of Heterogeneous Equilibria, 1923, supports this school. The authors do not
agree with Rivett, but one example is now given of its implication to phase diagrams.
Taking Fig. 9, the complex at 5 gives solution of composition y and solid potassiumnitrate, but the latter would not be absolutely pure ;
it would contain a small quantity of
sodium nitrate and of water and these quantities would be fixed. If the solution compositionis altered the amounts of sodium nitrate and water in the potassium nitrate would also alter
in the same direction. Thus the line from y, through the point 5, would stop at a point
representing solid just within the potassium nitrate corner. The locus of a number of such
points, representing solids, would be a curve very close to the potassium nitrate corner
but not coincident with it. The line joining one solution point to its corresponding solid
point is called a tie-line, and it is therefore clear that to select the concentration of a com-
ponent in the solid phase is the same as selecting the concentration of the same componentin the solution phase.
Although this book does not deal with solid solution, two cases have been given, Fig. 21,
where the composition of the solid phase varies considerably with change of compositionof solution, and in such a case the tie-lines have to be drawn on the phase diagram.
The idea of universal solid solution, as expounded by Rivett, appears to have been
introduced to explain the apparent discrepancy between the theory which gave choice of
any component in any phase, whereas in practice this did not appear to be true. It is nodoubt true that solid phases are not pure, but the reason is more likely due to the lattice
structure of matter and is no concern of the phase rule. The rule does not state that the
solid phases are pure or impure.1 A large number of the cases which apparently presented
difficulty disappear when it is realized that concentrations are in terms of mass per unit
volume as far as the theory is concerned, even though the diagrams use composition byweight.
1 See p. 72 et seq. for further explanation.
INDEXThis book has dealt with four systems, two-, three-, four-, and five-component, the four-
component being principally the reciprocal salt pair. The main references in the index are under theterms given above, but other references, which are subdivided, use the terms binary, ternary, quaternaryand quinary to indicate the kind of system with which the reference is concerned.
Acid and bast) (ternary), 43Addition of a salt, quaternary,
128
, ternary, 49, 50, 53of water, binary, 20
.
f quaternary, 89, 112-18, quinary, 151^3
. .f ternary, 46, 53
Ammonium chloride, ammonium,nitrate, water, 25 C. :
diagram and table, 64Ammonium ferrous sulphate, 50Ammonium nitrate, ammonium
chloride, water, 25 C. :
diagram and table, 64Ammonium sulphate, 50, 65
and water, diagram andtable, 8
, potassium sulphate, water,30 O. :
diagram, 74 ; table, 73
Apparatus for solubility deter-
mination, 66
Base and acid (ternary), 43
BASSETT, H., 44
Binary, 5, 159See Two-component
Bivariant, 6, 159
BLASDALE, W. C., 1, 150
BOWDEN, SYDNEY, T., 1
Brosheer, 64
C, number of components, 157Cadmium sulphate, 65Calcium acid phosphate, prep-
aratiori, 45
carbonate, 65- chlorate, 65
chloride, 65
nitrate, 65Calcium oxide, phosphorus pent-
oxide, water, 25 C. :
diagram, 43; table, 44
Calcium phosphate, 44
sulphate, 65
Caliche, 29
CAMPBELL, A. N., 1
Cartesian co-orduiates, 2Chemical composition, 156Chilean Nitrate Association, 29
Chloride, sulphate, nitrate,
sodium, potassium, water :
25 C., diagram, 149 ; table,150, 151
75 C., diagram, 135, 137,
138, 140, 141; table,
134, 143
CHRETIEN, A., 40, 43, 58
CLIBBKNS, DOUGLAS A., 1
COMEY, A. M., 29
Complex, 4, 31, 156
Components, 4, 156
Composition, chemical, 156, physical, 156
Concentration variables, 162
, dependent, 158
, independent, 157
Concentrations, volume, 162Condensed systems, 3, 6, 9, 156,
158
Congruent melting point, 16
Congruently saturated, quater-nary, 99, 111, 120
, ternary, 47, 49
Cooling curve, 11, 69, 70-
-, Newton's Law of, 70
, quaternary, 106
, quinary, 148
, ternary, 53
Copper nitrate and water :
diagram, 16 ; table, 15
CORNEC, E., 27, 37, 51, 52, 58,
67, 111,120, 130, 133, 134,150Crystallization, 21-3
, paths of, 59, 95, 96, 101, 122,153
Crystals, desiccation of, 23
, purification of, 22
Curves, 9, 83
Cyclic process, quaternary, 115-18
, ternary, 59-62
Darapskito, 42, 43, 49, 118, 148
Degree of freedom, 5, 6, 157
Dependent chemical entity, 156Desiccation of crystals, 23
Dilution, lino of, 46See Addition of water
Double decomposition, 30, 76See also Reciprocal salt pair
164
Double salts not decomposed bywater, 50
, quaternary system, 118, ternary system, 36
Drawing a diagram, 7
Drying-up point, 47, 102, 111,120, 137
Endothermic solution and crystal-lization, 54
Equilibrium, 53, 156
equations, 158for solubility determination,66
Eutectic mixture, 9
point, 9, 70
temperature, 9
Evaporation, quaternary, onJanecke's projection, 95
, , on orthogonal projection,91
, ,on pictorial projection, 89
, ternary, 46-9, , line of, 4(5
Exothermic solution and crystal-lization, 71
F, degrees of freedom, 157
FKRRERK, N. M., 3Ferrous sulphate and water :
diagram, 18 ; table, 17
Fields, 9
, solid phase, 24
, three-dimensional, 83
FINDLAY, ALEXANDER, 1
Five-component diagram :
, Janecke-type projection,142
, plotting in a prism, 139, prism (with reciprocal salt
pairs), 132
, removal of water, 144tetrahedron (salts -with
common ion), 131Five-component isotherm, 72Five-component system (quin-
ary), 131-55
.,common ion for four salts,
131
, invariant point, 132
, with reciprocal salt pairs,132-55

Four-component diagram :
, Janecke's projection, 93-130
1 plus Water, 96
, simplified form, 98
, pyramid, 76, 81-92
, , base of, 76-8
, , evaporation of water,89
,
y t orthogonal projection(plan), 86-8, 91
, , pictorial projection,89-91
, , plotting, 78-81
Four-component system (quater-
nary), 161
, common ion for throe
salts, 71, 72
, in variant point, 71, 99, 104
, reciprocal salt pair, 76 ff.
Four salts and water, see Five-
compoiieiitFreeclom, degree of, 5, 6, 157
FREETH, 2
Or, thcrmodynamic potential, 157Gaseous phase, 156
GIBBS, J. WILLARD, 2, 3
Gibbs's phase rule, 156-63
Glaserite, 36, 49, 75, 118, 134Glauber's salt, 39, 50, 118, 148
HAHN, D. A., 29
Heating, quaternary, 106
, ternary, 53
Heterogeneous equilibria, 1
HILL, ARTHUR E., 29, 65
Homogeneous, 5
Hydrate in binary, 12in quaternary, 118in ternary, 39, 50
Ice, concentration by removal of,
24
Jncongruent drying-up point, 121
melting-point, 14, 16
point, Janecke's diagram, 102
Incongruently saturated qxiater-
nary, 104, 111
quinary, 145
ternary, 39, 47, 49
Independent chemical entity, 156
Independent variables, see De-
grees of freedomIntermediate compounds, 36International Critical Tables, 29
Invariant, 6, 159
condensed, 159, 161
isothermal condensed, 161
point, quaternary, 71, 99, 104,
120, 129
, quinary, 132, 153
, ternary, 49, 56-9, 111
INDEX
Ion, 78, 94
, common, 30, 100, 131
Isotherm, 3
Isothermal, 6
invariant point, 6
, quinary, 153
, ternary, 49, 56-9, 111
JANECKE, ERNST, 3, 93Janecke's projection for quater-
nary, 93 ff.
, advantages of, 96
, applied to quinary prism,142
plus water, 96
-, simplified form, 98
KROMBACK, H., 27, 37, 51, 52,
111, 120, 130, 133, 134, 150
LANDOLT-BORNSTEIN, 20Lead nitrate, 65LE CHATELIER, HENRY, 3
Le Chatelier, principle of, 54, 69,
129, 154Lithium sulphate, 50
LOWENHERZ, 4, 76, 88
Magnesium sulphate, 65
Manganese nitrate and water,diagram and table, 12
Manganous nitrate, 65
MARON, 64
Melting point, congruent, 16
, incongruent, 14, 16
Metallography, 1
MEYERHOFFER, W., 2, 39, 76
MILLER, FREDERICK W., 29Mixed crystals, 5, 72Mobile equilibrium, 4
MOBIUS, 2
Molality, 30
Molarity, 30Mols per mol, calculation to per
cent., 118of salts, 118
Newton's Law of Cooling, 70
Nitrate, chloride, sulphate,sodium, potassium, water :
25 C., diagram, 149; table,
150, 15175 C., diagram, 135, 137,
138, 140, 141 ; table, 134,143
Nitric acid, 65Number of components, 4
One salt and water, see Two-component
Order of a system, 159
Orthogonal projection of pyra-mid, 86-8, 91
165
P, number of phases, 157Paths of crystallization, 59, 95,
96, 101, 122, 153Per cent., calculation to molsper
mol, 119
Phase, 5, 156
diagram, 5, 156
, relation to phase rule, 5, relation to phase theory, 1
reaction, 4
rule, 156-63for condensed system, 6
, limitation of, 4, 5, 104,160, 161
and solid solution, 74-5theory, 156
Phosphate, calcium, 44
Phosphorus pentoxide, calciumoxide, water, 25 C. :
diagram, 43 ; table, 44Physical composition, 156
conditions, 156
PICKERING, 19
Pipette for sampling, 68
Plotting a phase diagram :
, binary, 7-9, 12-14, 17
, quaternary :
, , Janecke's pro-jection, 94, 96
, , orthogonal pro-jection, 87
1 f pyramid, 76, 78-81
, quinary, prism, 139
, , Janocke typo pro-jection, 142-4
, ternary, 26-9
Points, 83
Polytherm, 3, 71
Potassium, sodium, sulphate,nitrate, chloride, water :
25 C., diagram, 149 ; table,
150, 15175 C., diagram, 135, 137,
138, 140, 141; table, 134,
143Potassium carbonate, sodium
carbonate, water, 36 C.,
table, 29Potassium chloride, sodium
nitrate, salt pair 25 C. and75 C. :
diagram, 110, 113; table,111
Potassium iodate, potassiumiodide, water, 25 C., table,29
iodide, 29Potassium nitrate, 65
, cyclic process, 59-62
preparation, 110-18
, separation from sodiumnitrate, 54-6

166
Potassium nitrate, sodiumchloride, salt pair, 25 C.
and 75 C. :
diagram, 110, 113 ; table,111
Potassium nitrate, sodiumnitrate, water :
25 C., diagram, 51, 55 ;
table, 61
50 C., diagram, 28, 32 ;
table, 27
75 C., diagram, 51 ; table,
51
100 C., diagram, 51, 55;table, 52
Potassium nitrate, sodium
sulphate, salt pair, 30 C. :
diagram, 117, 119, 121 ;
table, 120Potassium sulphate, ammonium
sulphate, water, 30 C. :
diagram, 74 ; table, 73
Potassium sulphate, sodiumnitrate, salt pair, 30 C. :
diagram, 117, 119, 121 ;
table, 120
Potassium sulphate, sodium
sulphate, water, 50 C. :
diagram and table, 37
Potential, thermodyiiamic, 157
Precipitation, 45
Pressure, a degree of freedom,158
, effect on solubility, 9
, excluded, 5
ignored for condensed sys-
tems, 156
Prism, for quinary, 132
, plotting within, 139
, projection of, 140
Projection, Janocke's, 93
, orthogonal, 86, 91
, pictorial, 89
, quinary prism, 140
PRUTTON, 64Purification of crystals, 22
Pyramid, base of, 76-8
, Jaiiecke's projection, 93
, orthogonal projection, 86, 91
, pictorial projection, 89
, plotting within, 78-81
, quaternary, 76
Quaternary, 5, 159
, invariant point, 99
, iiicongrueiitly satur-
ated, 104See Four-component
Quinary, 5, 153, 159See Five-component
Radicals, 78, 94
INDEX
Reciprocal salt pair, 4, 76 ff.
See Four-componentSee also Quaternary
REINDERS,W., Ill, 150
Retrograde solubility, 16
cooling curve, 701RHODES, J. K WYNFIELD, 1
RICCI, John E., 29, 73 ; solid
solution, 72, 74 ; synthetic
complex method, 65
RIVETT, A. C. D., 1;and pyra-
midal method, 3 ; solid
solution, 74, 163
ROOZEBOOM, B., 2, 3, 72
Salt pair, 76 ff.
Sampling pipette, 66
Saturation :
curve, 159
surface, 159
, quaternary, 111
., , Janocke's projection,95, 96, 100, 121
.
, , pyramid, 84, 89, 90
, quinary, 142
SATJNDERS, 76SCHTREINEMAKERS, F. A. H., 2,
50, 63
SEIDTCL, ATHERTON, 29
Sodium bromate, sodium sul-
phate, water, 45 C. :
diagram, 74 ; table, 73
Sodium carbonate, 65
Sodium carbonate, potassiumcarbonate, water, 36 0.,
table, 29Sodium chloride, potassium
nitrate, salt pair, 25 C.
and 75 U C. :
diagrams, 110, 113 ; table,
111
Sodium chloride, sodium nitrate,
water :
25 C., diagram, 57 ; table,
58
100 C., diagram, 57 ; table,
58
Sodium chloride, sodium sul-
phate, water :
17-5 C., diagram, 41; table,
4025 C., diagram and table,
40
Sodium hydroxide and water :
diagram, 18; table, 19
Sodium iodide and water :
diagram, 14; table, 15
Sodium nitrate, potassiumchloride, salt pair, 25 C.
and 75 C. :
diagram, 110, 113 ; table,
111
Sodium nitrate, potassiumnitrate, water :
25 C., diagram, 51, 55 ;
table, 51
50 C., diagram, 28, 32;table, 27
75 C., diagram, 51 ; table,51
100 C., diagram, 51, 55 ;
table, 52Sodium nitrate, potassium sul-
phate, salt pair, 30 C. :
diagram, 117, 119, 121;table, 120
Sodium nitrate, separation fromsodium chloride, 57 ff.
Sodium nitrate, sodium chloride,
water :
25 C., diagram, 57 ; table,
58
100 C., diagram, 57 ; table,
58Sodium nitrate, sodium sulphate,
water, 25 C. :
diagram, 42 ; table, 43
Sodium, potassium, sulphate,nitrate, chloride, water :
25 C., diagram, 149 ; table,
150, 151
75 C., diagram, 135, 137,
138, 140, 141 ; table, 134,143
Sodium sulphate, potassiumnitrate, salt pair, 30 C. :
diagram, 117, 119, 121 ;
table, 120
Sodium sulphate, potassiumsulphate, water, ,50 C. :
diagram and table, 37
Sodium sulphate, sodiumbromate, water, 45 C.,
table, 73
Sodium sulphate, sodiumchloride, water :
17-5 C., diagram, 41 ; table
4025 C., diagram and table,40
Sodium sulphate, sodiumnitrate, water, 25 0. :
diagram, 42 ; table, 43
Solid fields, 24
solution, 5, 72, 74, 163
Solubility curve, 7
on triple co-ordinates, 27
Solubility, determination, 63 ff.
, method of wet residues, 63
, synthetic complex method,65
, retrograde, cooling curve, 70-1
Solution, 31
SPAOK, A., 120, 130, 133, 150

Specific gravity, 157, 162
volume, 157, 162
Squared paper, 7, 122
Stable pair, 86, 100
Straight lines, use of, 9, 161
Strontium chloride, 65
nitrate, 65
Sulphate, nitrate, chloride,
sodium, potassium, water :
25 C., diagram, 149 ; table,
150, 151
75 C., diagram, 135, 137, 138,
140, 141 ; tablo, 134, 143
Surfaces, 83
Synthetic complex method for
solubility, 65
System, 4, 156
,kinds of, 5
,invariant point, 6
, , quaternary, 129
f } quinary, 154
, , ternary, 53
TAMMANN, G., 1
TEEPLE, J. E., 1
Temperature, change of :
, binary, 20
, quaternary, 106, 110-18.
129
, quinary, 14853, ternary, 45, 50
INDEX
Temperature, degree of freedom,157
, external variable, 157
Ternary, 5, 159
See Three-componentTervariant, 6, 159
, condensed, 162
Tetrahedron, quaternary, 71
, quinary, 131
Tetravariant, 6, 159
Thermal analysis, 11, 69, 71
Thermo-dynamic potential, 157
Thermostat, 66
Three salts and water :
See Four-componentThree-component diagram, 2662
, interpretation, 31-44
, plotting, 26-30Three-component system (tern-
ary), 26, 71, 160
Tie-linos, 65, 163
Transition points, determination,71
Triangular co-ordinates, 2-3
Trilinear co-ordinates, 2-3
Triple, co-ordinate paper, 3, 26
co-ordinates, 26 if.
Two salts and water :
See Three-componentTwo-component diagrams, 7 ff.
system (binary), 7, 159-60
167
Unary, 5, 159Univariant, 6, 159
, condensed, 161, 162
, isothermal condensed, 161
Unstable pair, 86, 100
VAN DER WAALS, 2
VAN'T HOFF, 2, 4, 5, 72, 76, 133
Vapour pressure, 158
Variability, 5, 159
Variables, concentration, 157,
158, 162
, dependent, 158
, external, 157
, independent, see Degrees of
freedomVolume concentrations, 74, 162
Water, evaporation of, see evap-oration
line, 89
, removal of, quaternary, 89,
91, 95, 110 ff., 122-8
, , quinary, 144
, , ternary, 46-48
, rule for addition (ternary), 53
, for change of (binary), 20
WESTON, 73
Wot residues, method of, 63
WHITWOBTH, W. A., 3