Embed Size (px)
Citation preview

Rev 07/17/2015 Part # 22070014
AquaVision Colloidal
Borescope
Installation and Operation Manual


1
Table of Contents
DOCUMENTATION CONVENTIONS .................................................................. 2
SECTION 1: SYSTEM DESCRIPTION ................................................................ 4
FUNCTION AND THEORY ...................................................................................... 4 SYSTEM COMPONENTS ....................................................................................... 5 BORESCOPE PROBE & CABLE .............................................................................. 5 OPTIONAL REEL ................................................................................................. 6 CAMERA CONTROL UNIT ..................................................................................... 7
SECTION 2: SYSTEM SOFTWARE, AQUALITE ................................................ 8
SOFTWARE INSTALLATION ................................................................................... 9 GENERAL LAYOUT OF SCREEN ........................................................................... 10 GENERAL OVERVIEW OF MENU BARS AND SUB-MENUS ........................................ 12
SECTION 3: SYSTEM CHECK, INSTALLATION & DEPLOYMENT ................ 18
SYSTEM HOOK-UP, OPERATIONAL CHECK, & DATA COLLECTION TESTS ................ 18 INSTALLATION & PREPARATION FOR FIELD MEASUREMENTS ................................. 22 SYSTEM DEPLOYMENT & DATA INTERPRETATION ................................................. 23
SECTION 4: SYSTEM MAINTENANCE & CALIBRATION ............................... 24
REGULAR MAINTENANCE ................................................................................... 24 CALIBRATION DETAILS & FIELD TEST .................................................................. 24
SECTION 5: SYSTEM TROUBLESHOOTING & FAQS .................................... 26
FREQUENTLY ASKED QUESTIONS ....................................................................... 29
SECTION 6: SYSTEM SPECIFICATIONS ......................................................... 30
SECTION 7: PARTS AND ACCESSORIES ...................................................... 32
PROBE CENTERING DEVICE ............................................................................... 33
APPENDIX A: FILTERING AQUALITE DATA FOR FURTHER ANALYSIS ..... 34
THE WARRANTY .............................................................................................. 37
2
NOTE
DOCUMENTATION CONVENTIONS
This document uses the following conventions to present information:
An exclamation point icon indicates a WARNING of a
situation or condition that could lead to personal injury or death. You should not proceed until you read and thoroughly understand the WARNING message.
WARNING
CAUTION
A raised hand icon indicates CAUTION information that relates
to a situation or condition that could lead to equipment malfunction or damage. You should not proceed until you read and thoroughly understand the CAUTION message.
A note icon indicates NOTE information. Notes provide
additional or supplementary information about an activity or concept.

3
In order to ensure your Colloidal Borescope System has a long service life and operates properly, adhere to the following cautions and read this manual before use.
Disconnect from power source when not in use.
Power input source must not exceed maximum ratings.
Equipment must be wired to a negative ground system.
Equipment may not operate properly with excess wiring not supplied by manufacturer.
Avoid spraying fluid directly at equipment.
Never submerge equipment.
Avoid pulling on wires to unplug equipment wiring.
Avoid using equipment with obvious physical damage.
To prevent equipment damage, avoid dropping it.
WARNING
The following applies only to users in European countries:
This product is designated for separate collection at an appropriate collection point. Do not dispose of as household waste.
For more information, contact the seller or the local authorities in charge of waste management.
Do not operate this equipment if it has visible signs of significant physical damage other than normal wear and tear.
Notice for consumers in Europe:
This symbol indicates that this product is to be collected separately.
The Colloidal Borescope cannot be made dangerous or unsafe because of failure due to EMC interference.
4
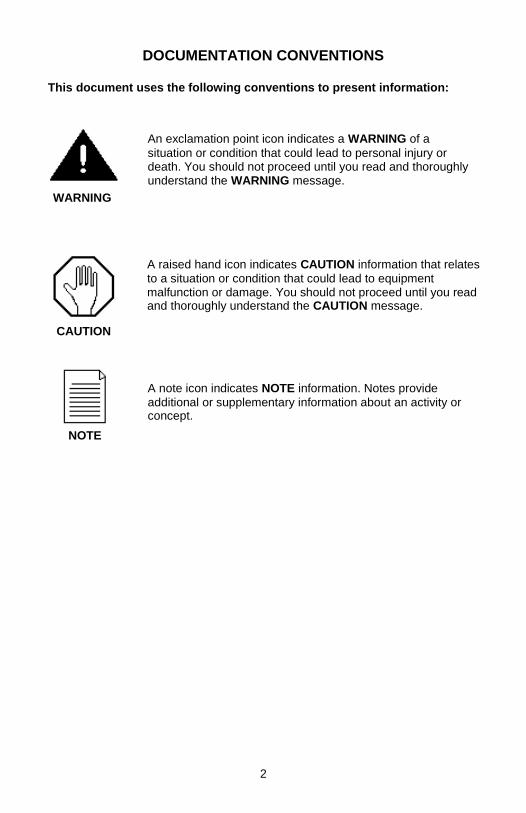
Section 1: System Description Function and Theory
There are naturally occurring particles, colloids, in groundwater that are neutrally buoyant. These colloidal particles being carried by the natural groundwater can be observed and measured to obtain groundwater velocity and direction. The Colloidal Borescope System integrates a high-resolution magnetic resistance compass, a high magnification particle imaging camera, and accurate tracking software, AquaLITE, to identify and measure groundwater velocity and particle flow trajectory. The Borescope provides a magnified image of moving colloidal particles suspended in the borehole; these particles are tracked against magnetic heading information and efficiently provide velocity and trajectory of the colloidal particles. The Borescope’s compass is calibrated to true North and provides relative data regardless of the probe’s down well heading. Therefore, no data adjustments are required from site analysis. Accidental spills and leaks associated with various facility operations have resulted in significant sub-surface contamination. The Colloidal Borescope offers an accurate methodology for assessing contaminant transport potential. Data acquired with the instrument may be used to quantify heterogeneities and dispersion – parameters necessary to estimate the extent and magnitude of underlying contaminants, define exposure routes, and assess risks.
Figure 1.1 –Colloidal Borescope Probe Features
5
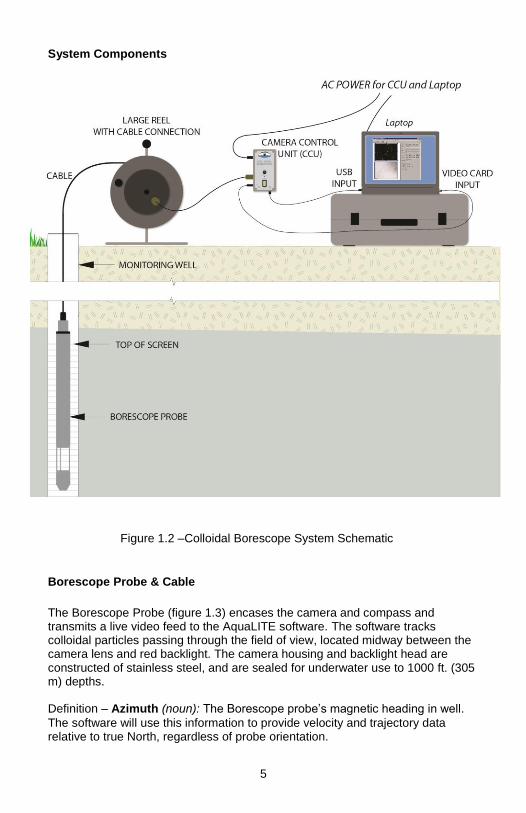
System Components
Borescope Probe & Cable
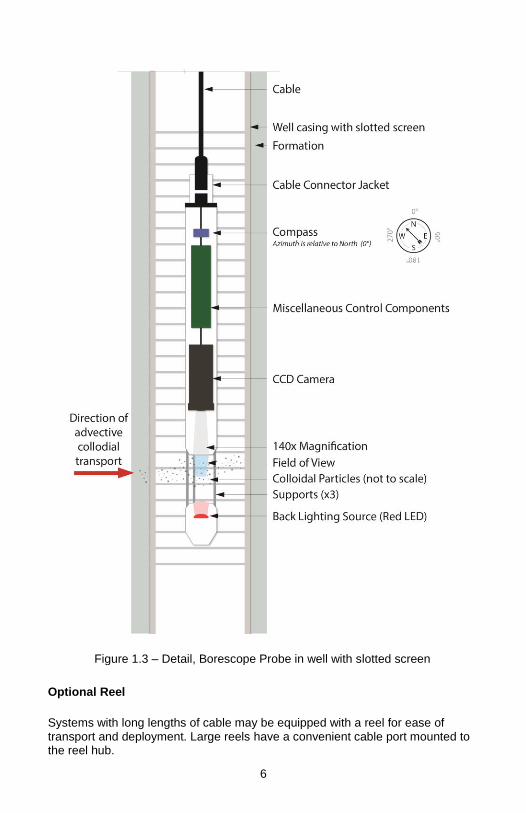
The Borescope Probe (figure 1.3) encases the camera and compass and transmits a live video feed to the AquaLITE software. The software tracks colloidal particles passing through the field of view, located midway between the camera lens and red backlight. The camera housing and backlight head are constructed of stainless steel, and are sealed for underwater use to 1000 ft. (305 m) depths. Definition – Azimuth (noun): The Borescope probe’s magnetic heading in well.
The software will use this information to provide velocity and trajectory data relative to true North, regardless of probe orientation.
Figure 1.2 –Colloidal Borescope System Schematic
6
Optional Reel
Systems with long lengths of cable may be equipped with a reel for ease of transport and deployment. Large reels have a convenient cable port mounted to the reel hub.
Figure 1.3 – Detail, Borescope Probe in well with slotted screen
7
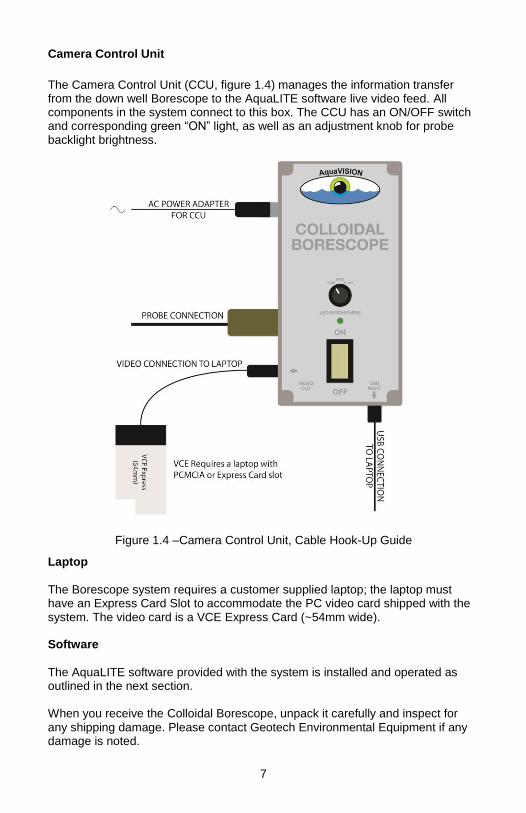
Camera Control Unit
The Camera Control Unit (CCU, figure 1.4) manages the information transfer from the down well Borescope to the AquaLITE software live video feed. All components in the system connect to this box. The CCU has an ON/OFF switch and corresponding green “ON” light, as well as an adjustment knob for probe backlight brightness.
Laptop
The Borescope system requires a customer supplied laptop; the laptop must have an Express Card Slot to accommodate the PC video card shipped with the system. The video card is a VCE Express Card (~54mm wide). Software
The AquaLITE software provided with the system is installed and operated as outlined in the next section.
When you receive the Colloidal Borescope, unpack it carefully and inspect for any shipping damage. Please contact Geotech Environmental Equipment if any damage is noted.
Figure 1.4 –Camera Control Unit, Cable Hook-Up Guide
8
Section 2: System Software, AquaLITE The AquaLITE software included in the Colloidal Borescope system is a key component in obtaining a reliable flow measurement. Typically, there are two types of measurements that can be encountered in a well; if consistent horizontal flow in a steady direction for two or more hours occurs then the Borescope is in a preferential flow zone where groundwater flow is occurring. If the colloids remain in focus across at least one-half of the field of view, then horizontal flow conditions dominant the measurement zone. If variable flow conditions persist, then the instrument should be moved to a different depth. Experience has shown that if swirling flow conditions persist after 15 to 20 minutes, especially if the Borescope has been in the well at other test intervals, then a non-preferential flow zone has been encountered and the instrument should be moved to a new test interval. When the Colloidal Borescope is inserted into the well, the ambient groundwater flow is disturbed. The Borescope acts as a slug that can cause water from the well bore to flow into the surrounding aquifer and affect flow measurements. These effects commonly last 10 to 30 minutes before ambient flow conditions re-establish in the well bore. Use the graph view in the tracking software to view the consistency of the directional measurements and changes in the magnitude of the velocity. If directional measurements are consistent but the velocity decreases with time, then additional measurements are needed to ensure a reliable flow file. It has commonly been observed that consistent flow directions can occur but as the velocity slowly decreases, the flow directions can change and become swirling. This is typical of initial flow measurements in “non-preferential” flow zones. It is important that both direction and velocity stabilize before a measurement can be considered reliable. There are, however, exceptions such as fluctuating pumping rates or boundary conditions. Each situation must be evaluated on a site-specific basis. Many conditions may be encountered in a monitoring well. It is always important to remember that the instrument is providing a direct measurement of flow conditions in the well at the selected depth interval. Fluctuating boundary conditions such as a river undergoing stage-level changes, cycling pumping wells, or other factors that can induce pressure changes in the aquifer will affect the Colloidal Borescope measurements. These external influences must be considered in order to obtain reliable flow measurements. The basic principle of AquaLITE
The AquaLITE Software was developed for standard Windows users. Data from the Colloidal Borescope is transferred to the surface by high strength electrical cable where AquaLITE takes these magnified images and digitizes
9
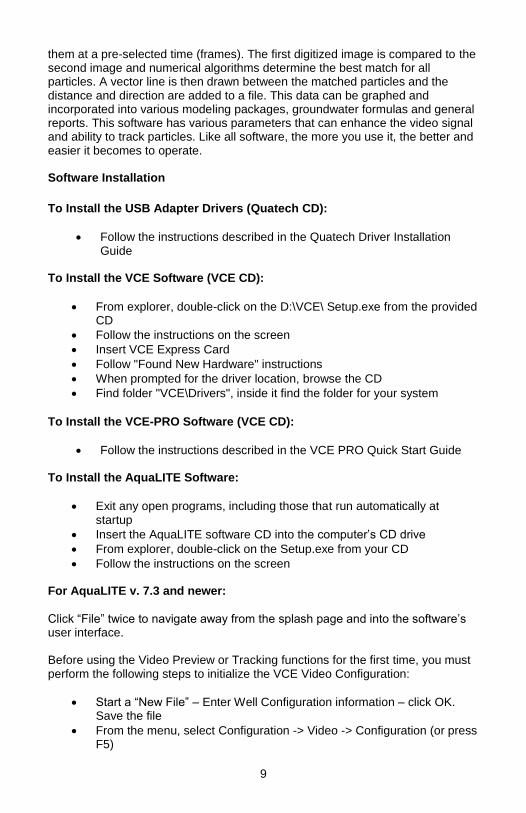
them at a pre-selected time (frames). The first digitized image is compared to the second image and numerical algorithms determine the best match for all particles. A vector line is then drawn between the matched particles and the distance and direction are added to a file. This data can be graphed and incorporated into various modeling packages, groundwater formulas and general reports. This software has various parameters that can enhance the video signal and ability to track particles. Like all software, the more you use it, the better and easier it becomes to operate. Software Installation
To Install the USB Adapter Drivers (Quatech CD):
Follow the instructions described in the Quatech Driver Installation Guide
To Install the VCE Software (VCE CD):
From explorer, double-click on the D:\VCE\ Setup.exe from the provided CD
Follow the instructions on the screen
Insert VCE Express Card
Follow "Found New Hardware" instructions
When prompted for the driver location, browse the CD
Find folder "VCE\Drivers", inside it find the folder for your system
To Install the VCE-PRO Software (VCE CD):
Follow the instructions described in the VCE PRO Quick Start Guide To Install the AquaLITE Software:
Exit any open programs, including those that run automatically at startup
Insert the AquaLITE software CD into the computer’s CD drive
From explorer, double-click on the Setup.exe from your CD
Follow the instructions on the screen For AquaLITE v. 7.3 and newer:
Click “File” twice to navigate away from the splash page and into the software’s user interface. Before using the Video Preview or Tracking functions for the first time, you must perform the following steps to initialize the VCE Video Configuration:
Start a “New File” – Enter Well Configuration information – click OK. Save the file
From the menu, select Configuration -> Video -> Configuration (or press F5)
10
Ignore the error message that says “VCE Capture Card Registry Data Not Available”. Click OK
Click the “Auto Crop” button
Click the “Close” button
From the menu, select Configuration -> Video -> Save Configuration (or press F6)
Close the File
When software is first initiated, agreement to the software terms and limitations is required. Software will not work without consent. The next screen will ask which Video Grabber card is being used. Determine if you are using the MRT Video Port Professional or the IMPERX Video Capture Essentials. Enter the data. This information can be changed at any time under the file menu. Software must be re-started after changing the video card. General Layout of Screen
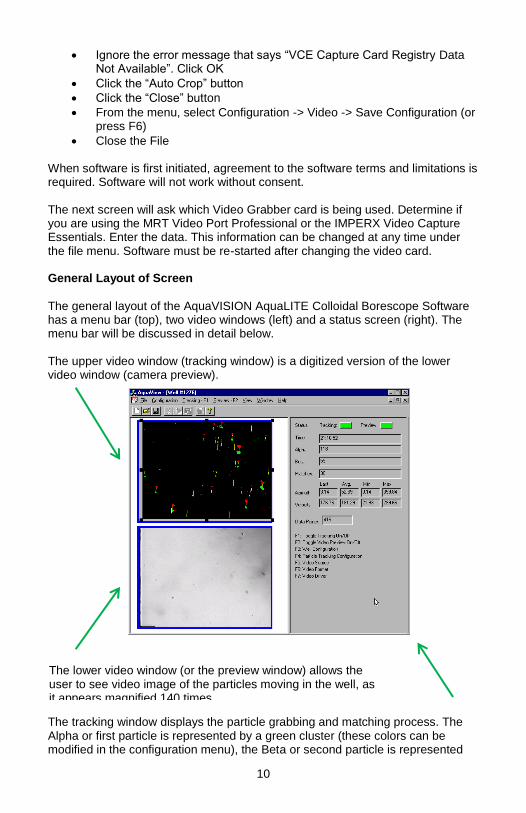
The general layout of the AquaVISION AquaLITE Colloidal Borescope Software has a menu bar (top), two video windows (left) and a status screen (right). The menu bar will be discussed in detail below. The upper video window (tracking window) is a digitized version of the lower video window (camera preview).
The tracking window displays the particle grabbing and matching process. The Alpha or first particle is represented by a green cluster (these colors can be modified in the configuration menu), the Beta or second particle is represented
The lower video window (or the preview window) allows the user to see video image of the particles moving in the well, as it appears magnified 140 times.
11
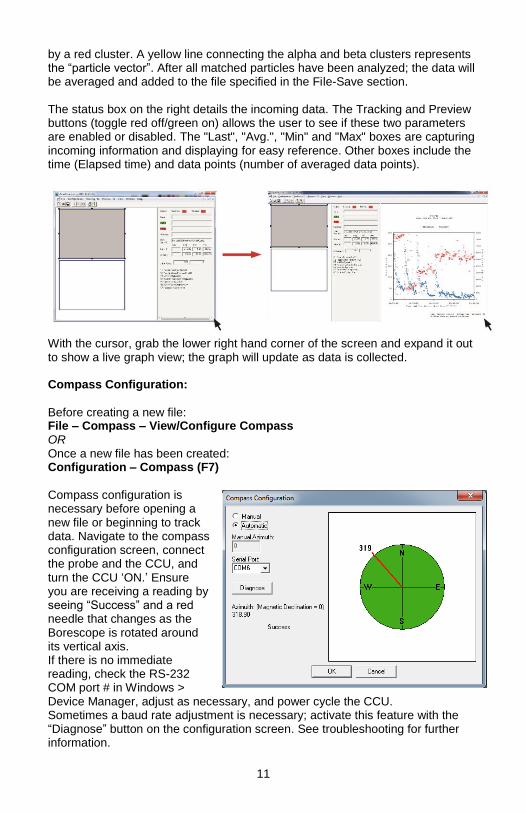
by a red cluster. A yellow line connecting the alpha and beta clusters represents the “particle vector”. After all matched particles have been analyzed; the data will be averaged and added to the file specified in the File-Save section. The status box on the right details the incoming data. The Tracking and Preview buttons (toggle red off/green on) allows the user to see if these two parameters are enabled or disabled. The "Last", "Avg.", "Min" and "Max" boxes are capturing incoming information and displaying for easy reference. Other boxes include the time (Elapsed time) and data points (number of averaged data points).
With the cursor, grab the lower right hand corner of the screen and expand it out to show a live graph view; the graph will update as data is collected. Compass Configuration:
Before creating a new file: File – Compass – View/Configure Compass OR Once a new file has been created: Configuration – Compass (F7)
Compass configuration is necessary before opening a new file or beginning to track data. Navigate to the compass configuration screen, connect the probe and the CCU, and turn the CCU ‘ON.’ Ensure you are receiving a reading by seeing “Success” and a red needle that changes as the Borescope is rotated around its vertical axis. If there is no immediate reading, check the RS-232 COM port # in Windows > Device Manager, adjust as necessary, and power cycle the CCU. Sometimes a baud rate adjustment is necessary; activate this feature with the “Diagnose” button on the configuration screen. See troubleshooting for further information.

12
General Overview of Menu Bars and Sub-Menus
File – New (Ctrl+N)
The user will be prompted to input the following: Well Name:
Alphanumeric field, specific identifier for the well of interest.
Depth: Alphanumeric
field, depth that the Colloidal Borescope instrument is viewing and tracking. Enter in “feet” or “meters”.
Date: Automatic Field Date, can be modified.
Magnetic Declination: Magnetic Declination can be found in Section 3
(for the United States only). File – Open (Ctrl+O)
Open a previous file. File – Close
Close current file, does not exit the program. Viewing/Printing Well Analysis Summary
After a logging event, AquaLITE will analyze the data and create an in-depth, cohesive Well Analysis Summary. There are a few options to view this report, they are outlined below.
File – Print (Ctrl+P)
With this option, AquaLITE will offer a few options. “Print Summary” will print only the Well Analysis Summary, only the graph, or both. These files can be printed to PDF, depending on the device setup on the configured laptop. File - Copy Graph to Clipboard
Allows user to export graph to the Windows Clipboard, it can be pasted as JPEG or BITMAP. File - Copy Graph to File
Allows user to save the graph image to disk (JPEG, BITMAP, or WMF).
13
File - Copy Summary to File/ Clipboard
This option will place the Summary to the clipboard, allowing the user to post the well summary as an image into an external file in. The image file can be easily copied and pasted into a word document.
Explanation of the Well Analysis Summary Sheet:
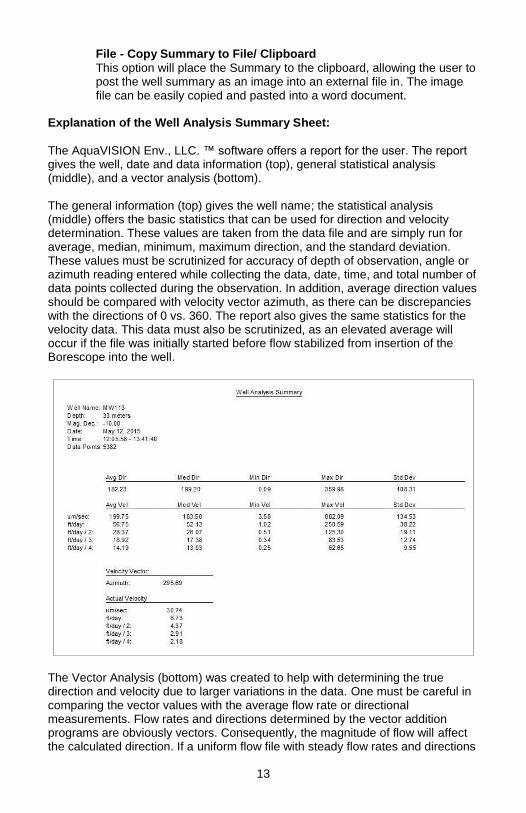
The AquaVISION Env., LLC. ™ software offers a report for the user. The report gives the well, date and data information (top), general statistical analysis (middle), and a vector analysis (bottom). The general information (top) gives the well name; the statistical analysis (middle) offers the basic statistics that can be used for direction and velocity determination. These values are taken from the data file and are simply run for average, median, minimum, maximum direction, and the standard deviation. These values must be scrutinized for accuracy of depth of observation, angle or azimuth reading entered while collecting the data, date, time, and total number of data points collected during the observation. In addition, average direction values should be compared with velocity vector azimuth, as there can be discrepancies with the directions of 0 vs. 360. The report also gives the same statistics for the velocity data. This data must also be scrutinized, as an elevated average will occur if the file was initially started before flow stabilized from insertion of the Borescope into the well.
The Vector Analysis (bottom) was created to help with determining the true direction and velocity due to larger variations in the data. One must be careful in comparing the vector values with the average flow rate or directional measurements. Flow rates and directions determined by the vector addition programs are obviously vectors. Consequently, the magnitude of flow will affect the calculated direction. If a uniform flow file with steady flow rates and directions
14
were analyzed using both software packages, then the direction and rates would be similar. However, if there is a large variation in the flow direction and a corresponding variation in flow rates, then there will be differences. For example, if a particle is moving due north at 200 um/s and a second particle is moving due south at 100um/s, then the average velocity and direction would show a flow rate of 150 um/s in a due east direction, respectively. The vector addition will show a flow rate of 100 um/s in a due north direction. There are cases; that is, if two nonadjacent quadrants contain the highest number of data points, then an erroneous reading can results. This case, however, is rare and based on our experience only occurs during swirling flow--which is unreliable to begin with. The software will note that these files are "unreliable for direction determination" for the Velocity Vector reading. The Well Analysis Summary Sheet has been offered to the user only as an added benefit for determining the "True" direction and velocity. Only a certified Colloidal Borescope Operator should make the appropriate determination of direction and velocity.
Configuration Field: Well, Tracking, Video, and Graph.
Configuration – Well (F3): allows modification of well parameters entered when
creating a new file, i.e., name, depth, azimuth and date.
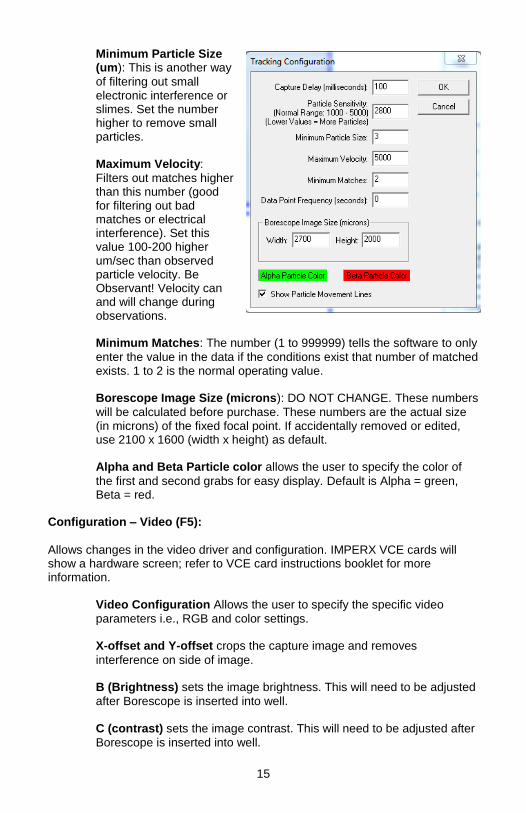
Configuration – Tracking (F4):
It is recommended to change only one or two tracking configuration fields at a time. Allow the unit to stabilize after making edits to ensure controlled, sensible tracking configuration edits.
Capture Delay (milliseconds): Sends a signal to the frame grabber to
snap the second comparative image every 1 to 99999 milliseconds. Setting the window to 1 allows the software to grab as fast as possible. Particle Sensitivity: This parameter acts like a filter. Increase this value
if large amounts of colloids exist or electrical interference is present. Lower the value if only a few colloids exist and the electrical source is clean. This parameter will need to be changed throughout a session as colloids decrease (Normal Range is between 1000-5000). This is ONLY the Normal Range can be smaller or larger depending on the conditions of the aquifer.
Azimuth:
The Borescope probe’s magnetic heading in well. The software will use this information to provide velocity and trajectory data relative to true North, regardless of probe orientation.
Automatic azimuth detection via AquaLITE is recommended, as manual azimuth entry should only be used if down well probe orientation is known.
15
Minimum Particle Size (um): This is another way
of filtering out small electronic interference or slimes. Set the number higher to remove small particles. Maximum Velocity:
Filters out matches higher than this number (good for filtering out bad matches or electrical interference). Set this value 100-200 higher um/sec than observed particle velocity. Be Observant! Velocity can and will change during observations. Minimum Matches: The number (1 to 999999) tells the software to only
enter the value in the data if the conditions exist that number of matched exists. 1 to 2 is the normal operating value. Borescope Image Size (microns): DO NOT CHANGE. These numbers
will be calculated before purchase. These numbers are the actual size (in microns) of the fixed focal point. If accidentally removed or edited, use 2100 x 1600 (width x height) as default. Alpha and Beta Particle color allows the user to specify the color of
the first and second grabs for easy display. Default is Alpha = green, Beta = red.
Configuration – Video (F5):
Allows changes in the video driver and configuration. IMPERX VCE cards will show a hardware screen; refer to VCE card instructions booklet for more information.
Video Configuration Allows the user to specify the specific video
parameters i.e., RGB and color settings. X-offset and Y-offset crops the capture image and removes
interference on side of image. B (Brightness) sets the image brightness. This will need to be adjusted
after Borescope is inserted into well. C (contrast) sets the image contrast. This will need to be adjusted after
Borescope is inserted into well.
16
S (Saturation) sets the saturation (leave at 0).
H (hue) sets the Hue (leave at 0).
All Other fields will be set back to original if modified!
Video Driver sets the MRT Video Port video capture device driver (If
error code states video card no longer exists, then reboot computer). Configuration – Graph:
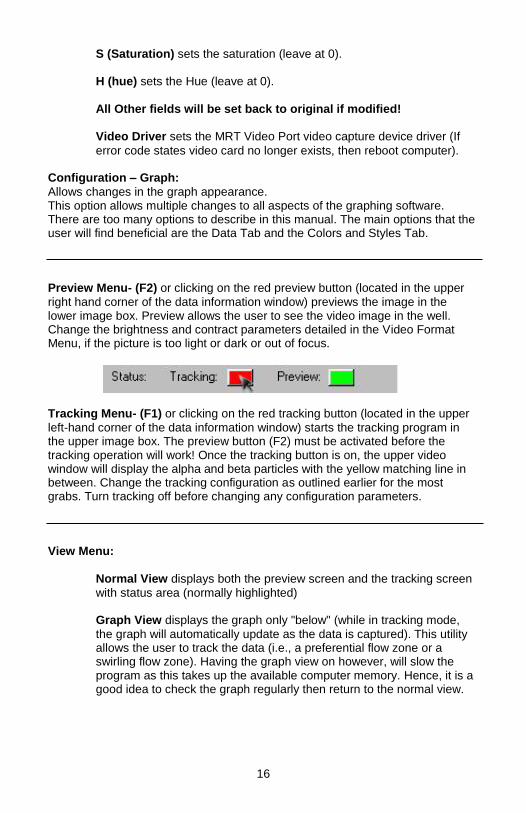
Allows changes in the graph appearance. This option allows multiple changes to all aspects of the graphing software. There are too many options to describe in this manual. The main options that the user will find beneficial are the Data Tab and the Colors and Styles Tab. Preview Menu- (F2) or clicking on the red preview button (located in the upper
right hand corner of the data information window) previews the image in the lower image box. Preview allows the user to see the video image in the well. Change the brightness and contract parameters detailed in the Video Format Menu, if the picture is too light or dark or out of focus.
Tracking Menu- (F1) or clicking on the red tracking button (located in the upper
left-hand corner of the data information window) starts the tracking program in the upper image box. The preview button (F2) must be activated before the tracking operation will work! Once the tracking button is on, the upper video window will display the alpha and beta particles with the yellow matching line in between. Change the tracking configuration as outlined earlier for the most grabs. Turn tracking off before changing any configuration parameters. View Menu:
Normal View displays both the preview screen and the tracking screen
with status area (normally highlighted) Graph View displays the graph only "below" (while in tracking mode,
the graph will automatically update as the data is captured). This utility allows the user to track the data (i.e., a preferential flow zone or a swirling flow zone). Having the graph view on however, will slow the program as this takes up the available computer memory. Hence, it is a good idea to check the graph regularly then return to the normal view.
17
Window Menu:
New option allows for a new tracking window. Primarily used if an
existing file has been used. Cascade Aligns the windows from upper right to lower left. Used if
multiple files are open. Tile Aligns the windows from upper center to lower center. Used if
multiple files are open. Align Icons Typical Windows aligning protocol.
Split View displays the graph and the Tracking screen. Not
recommended while tracking is on, as the computer’s resources are limited. To return to normal view, simply click “View-Normal.” If tracking has stopped then double click on the tracking button to start the tracking.
Other Commands: Save the File
Save the file in the directory of choice
Open a File
Opens a previously created file Print the File
Option allows user to print report, graph or both (see Print and Preview commands below) Preview the File
Allows user to see report, graph or both prior to printing Print Setup
Allows user to select printer and printer options Report Font
Allows user to select from many font types for report output Export Log Data
Allows user to export data (.log) for use in other spreadsheets Import Log Data
Allows user to import data from previous versions of AquaVIEW/LITE

18
Section 3: System Check, Installation & Deployment It is recommended that the operator read the journal article by Kearl (1997, Journal of Hydrology, 200, 323-344) for an understanding of the theory of groundwater flow in a borehole, observed flow conditions, and laboratory testing of the instrument. System Hook-Up, Operational Check, & Data Collection Tests
After unpacking the Colloidal Borescope system and installing the AquaLITE software, an operational check should be conducted prior to field deployment. The following procedure is recommended: 1. Connect the CCU’s power adapter to a 120VAC supply. Ensure that the
CCU on/off switch is turned OFF.
2. Connect the cable between the Borescope Probe and the CCU.
- Before plugging the connector into the probe, make sure the sealing surfaces are clean and lightly lubricated with silicon grease or other seal lubricant.
3. Locate the USB-to-USB cable provided with the system; connect the “USB Port” from the CCU into a USB port on the laptop.
4. Locate the VCE Express video card (54mm) provided with the system; connect the “Video Out” from the CCU to the Express Card Slot on the laptop.
5. Install and open AquaLITE and navigate to File – Compass – View/Configure Compass.
6. Turn the CCU on/off switch to ON. In a few seconds, the green compass
circle should show a red needle indicating the probe heading (internal compass). Rotate the probe around the vertical axis and verify that the red needle moves in a relative fashion. See Troubleshooting Section if unable to read-in compass heading.
7. Set up a new project in AquaLITE, File > New. Enter a test well configuration, as well as magnetic declination. For the United States, use the graph in this section.
8. The AquaLITE video screen should be white, and the colloidal back light should be on. Enable “Preview” status and observe the video screen shift color. Place a small object (pencil tip, piece of paper, finger, etc.) approximately midway between the backlight head and the camera. A magnified, silhouetted image should be observed on the monitor. Move the object up and down within the field of view to characterize the focal point.
9. Hold the Borescope with the backlight head down and rotate the unit around its vertical axis. Observe the compass display on the monitor to make sure it

19
changes smoothly and corresponds to the angular position of the Borescope. Confirm cardinal orientation, North = 0°.
Figure 3.1 – Magnetic Declination: USA

20
Now that the Borescope is set up and delivering live video, we recommend conducting a quick in-office test to gain experience with viewing, collecting, and analyzing data. The test uses a water bucket and municipally plumbed water source (tap or faucet) to observe predictable velocities and directions. Follow the instructions below: 1. Recommended Settings for in-office bucket test: 2.
3. Fill a bucket with at least 8” of water so that the bottom portion of the
Borescope can be submerged.
4. Ensure that “Preview” is enabled (green), and toggle the “Tracking” button on AquaLITE. If a hazy “Preview” screen is evident, toggle the “Preview” button a couple of time.
5. Swirl the water in the bucket clockwise, and place the Borescope in the
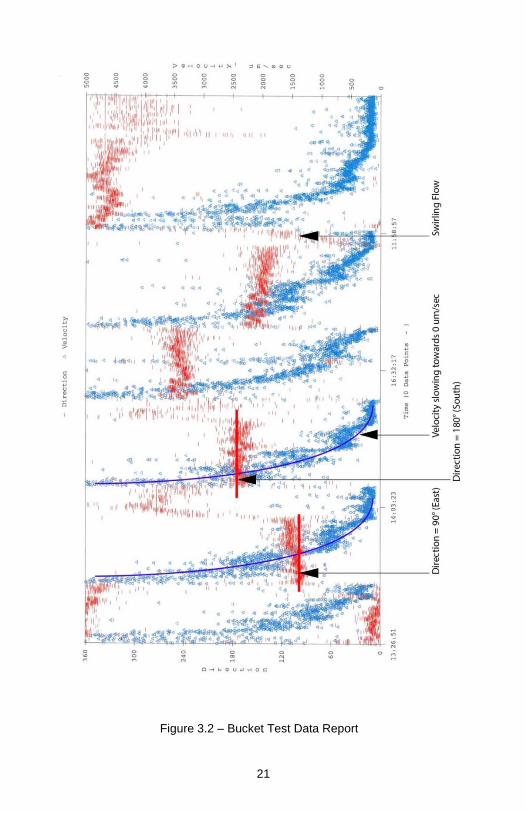
water against the north side of the bucket for at least 20 minutes. Using the Graph View, observe the colloidal particles moving towards the east (90°), and observe the velocity decreasing as the water slows down and the particles begin to swirl in multiple directions. When viewing the graph, you should see a decrease in velocity as the water slows down, and the direction lines should start to represent swirling flow (figure 3.2).
6. Repeat above, but place the Borescope against the south side of the bucket;
the particles should now be moving west (270°). When placed on the west side of the bucket, the particle movement is north, and when placed on the east side of the bucket, the particle movement is south.
7. Conduct the experiment again; pay note to the orientation of the compass
versus output data. Try different orientations to gain a thorough understanding. No manual adjustments/calculations are required when interpreting data.
8. View the live test graph to help understand how the instrument will be reading and transmitting data; this in-office test should provide practice and precedent for field measurements.
Disconnect, dry, and store all system components in preparation for field installation.
Capture Delay (milliseconds): 100
Particle Sensitivity: 2800
Minimum Particle Size: 3
Maximum Velocity: 5000
Minimum Matches: 2
Data Point Frequency (seconds): 0
Borescope Image Size (microns): 2700 x 2000
21
Figure 3.2 – Bucket Test Data Report
22
Installation & Preparation for Field Measurements
For the Colloidal Borescope to provide reliable measurements of groundwater flow rates and directions, it is important that the instrument be placed in a developed, high quality well. The well screen should consist of mechanically slotted screen with a minimum of three columns of slots or wire-wound screen. Prior to measurements, the well should be adequately developed using a jetting tool or mechanical surging. A low permeable skin surrounding the well screen will result in groundwater flowing around the well and swirling flow within the well. Finally, any devices in the well such as dedicated pumps should be removed from the well at least 24-hrs prior to testing. This will allow the ambient hydraulic conditions in the well and the surrounding porous media to re-establish and any turbidity effects from removing the pump to subside. Prior to placing the Colloidal Borescope in a test well, the video image should be checked by placing an object such as a pen between the lens and the back light. The Borescope should be slowly lowered into the well to minimize disturbing the formation, which may result in excessive turbidity in the well. If this occurs, there will not be a clear picture on the video screen and several hours or perhaps a full day may be required for the well water clarity to return. The Colloidal Borescope provides depth specific measurements of groundwater flow direction and velocity. Several important factors must be considered in order to obtain a reliable measurement. It is widely accepted that flow occurs in preferential flow zones within subsurface aquifers. These preferential flow zones dominate groundwater flow even in "homogeneous" aquifer. For a reliable measurement, the Colloidal Borescope must be placed in these preferential flow zones. A combination of relevant geologic information and the proper utilization of the Colloidal Borescope system are necessary to locate and measure these preferential flow zones. Prior to flow measurements, the geologic log for a particular well should be consulted and possible high permeable zones selected. Based on this information, the Borescope should be placed in the center of these zones. Subsequent measurements should offset by selected intervals from the initial zone until a preferential zone is located.
When deploying equipment in the field with portable power, be sure to read and understand your portable generator’s User Manual for proper installation, operating, and earth ground instructions. Failure to do so may result in unaccounted static disturbance during data collection. WARNING
23
System Deployment & Data Interpretation
With the CCU’s power switch turned off, connect all CCU cables to the laptop and to the probe. Initialize the AquaLITE software, turn on the CCU, check the compass configuration, and then begin probe deployment. When the Borescope is lowered in position and the well has settled, use the knob on the camera control unit to adjust the backlight (low, medium, high intensity) for optimum contrast and observation of the maximum number of colloidal particles. In relatively clear water, the best results are obtained with the backlight at a low setting. Use the AquaLITE software to gather data, as outlined in the previous section.
Always use a grounding wire attached to the power supply if inserted into a stainless steel or metal cased well.
24
Section 4: System Maintenance & Calibration Regular Maintenance
Maintenance for the camera and light head is limited to cleaning and maintenance of the O-ring seals, and cleaning the housing and window. Lens
To avoid scratching the windows, they should only be cleaned with mild soap and water. During cleaning, flush the windows with clean water then use a small amount of mild soap on your finger to gently clean the windows. Allow to air-dry or gently dry with a soft cloth or lens tissue. O-Rings
The O-rings in the housing and light head should be inspected on a yearly basis, and should be replaced if any damage is noted, or if they appear to be flattened or deformed in any way. During replacement, the O-rings, O-ring grooves, and mating surfaces should always be clean, and should be lubricated with silicon grease or other O-ring lubricant before assembly. Backlight LED
The light head uses a long life LED that should not require regular maintenance. If replacement is necessary, the lamp assembly should be replaced as a complete unit. This is accomplished by first removing the retaining ring on the light housing, and withdrawing the end closure by inserting a ¼-20 bolt for use as a puller. The lamp assembly can then be taken out by removing an internal retaining ring and unsoldering the leads to the lamp. After replacing of the lamp circuit, check the O-ring seal and mating surfaces for cleanliness, and for any nicks or scratches. Replace the O-ring if damaged. Lubricate the O-ring and mating surfaces with a light coating of O-ring lubricant, install the O-ring, and replace the end closure and retaining ring. If repair or replacement of other components is necessary, please contact Geotech Environmental Equipment, Inc. Calibration Details & Field Test
The Colloidal Borescope is calibrated before shipping. Therefore, it only requires simple, occasional tests to ensure that the instrument’s settings have not accidentally changed. Laboratory Calibration
An extensive laboratory-testing program was undertaken to determine the accuracy of the Colloidal Borescope for determining groundwater flow direction and rate. Details of these laboratory tests are presented in Kearl (Observations of particle movement in a monitoring well using the Colloidal Borescope. 1997 Journal of Hydrology, 200, 323-344).
25
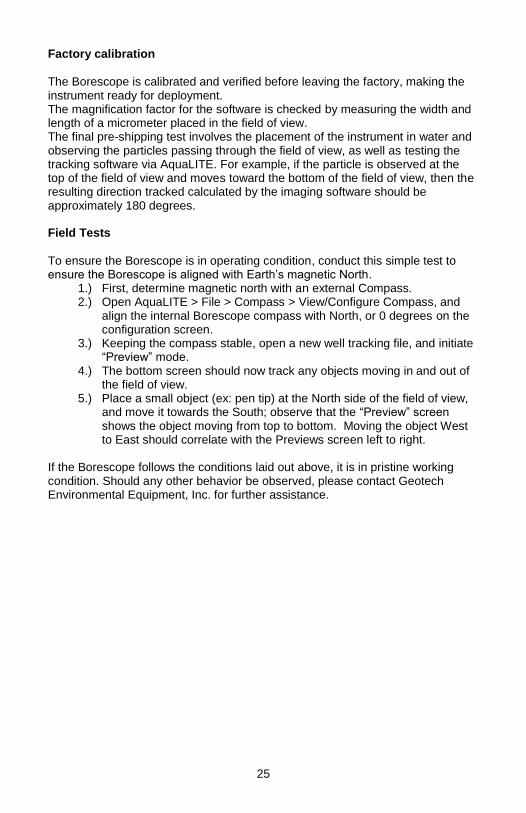
Factory calibration
The Borescope is calibrated and verified before leaving the factory, making the instrument ready for deployment. The magnification factor for the software is checked by measuring the width and length of a micrometer placed in the field of view. The final pre-shipping test involves the placement of the instrument in water and observing the particles passing through the field of view, as well as testing the tracking software via AquaLITE. For example, if the particle is observed at the top of the field of view and moves toward the bottom of the field of view, then the resulting direction tracked calculated by the imaging software should be approximately 180 degrees. Field Tests
To ensure the Borescope is in operating condition, conduct this simple test to ensure the Borescope is aligned with Earth’s magnetic North.
1.) First, determine magnetic north with an external Compass. 2.) Open AquaLITE > File > Compass > View/Configure Compass, and
align the internal Borescope compass with North, or 0 degrees on the configuration screen.
3.) Keeping the compass stable, open a new well tracking file, and initiate “Preview” mode.
4.) The bottom screen should now track any objects moving in and out of the field of view.
5.) Place a small object (ex: pen tip) at the North side of the field of view, and move it towards the South; observe that the “Preview” screen shows the object moving from top to bottom. Moving the object West to East should correlate with the Previews screen left to right.
If the Borescope follows the conditions laid out above, it is in pristine working condition. Should any other behavior be observed, please contact Geotech Environmental Equipment, Inc. for further assistance.
26
Section 5: System Troubleshooting & FAQs
If you are experiencing other problems than mentioned in this section, please contact Geotech at [email protected] so that others may
benefit from your experience! Problem: No picture with the instrument in the well
Solution: There are several possible causes of no picture from the instrument
while in the well.
Make sure all connections are complete as shown in Figure 1.1 and Figure 1.2. Check contrast and brightness levels in the Video Source Menu (increase or decrease brightness depending on preview color, if preview screen is blue then check to see if the BNC cable from the camera control unit to the computer Express slot is plugged in). There is a light adjustment switch on the Camera Control Unit; however, this is only for small light increases.
Is system powered up? Check to see if the Colloidal Borescope red backlight is ON. Camera control unit and laptop must be ON!
Is Borescope sending the compass readout to the Compass Configuration screen in AquaLITE? If the compass is providing a
reading, then the turbidity of the well may be too high. Remove Borescope from well and look at lenses. Place object under lens to see if image comes back. If not, check to see that the seals have not been breached and water has entered the camera compartment. If image looks fine on surface then well is most likely too turbid to characterize. Another well should be selected until the water clarity returns.
If there is no compass reading, recheck all power supplies and cables. Make sure to use grounding wire if a Power Inverter is being used to supply power to equipment in the field. If the grounding wire is not used, damage can occur to the camera.
Problem: Abrupt change in groundwater flow direction Solution:
If consistent directional flow is interrupted by an abrupt change in flow direction, the first item to check is the velocity graph. If there has been a steady decline in the magnitude of the velocity when the directional change occurred, then chances are the measurement zone is a non-preferential flow zone and the Borescope should be moved to a different test interval.
If velocity is consistent, check for outside interference such as pumping wells, tidal influences, or fluctuating river stages. Even in steady preferential flow zones, short-term directional changes can occur. Continue to observe for 10 -15 minutes. If direction charges to a third direction, then the Borescope is in a non-preferential flow zone.
27
Problem: Numerous particles are being grabbed but no data is being recorded Solution:
If this condition occurs, then the maximum velocity setting in the Tracking Configuration is lower than the velocity of the particles. Reset the maximum velocity to a value approximately twice the measured velocity.
Problem: Numerous particles are being grabbed but computer is slow writing to file Solution:
First option is to increase the particle sensitivity until only a few particles are being grabbed.
The second option is to click on the tracking window and manually drag (decrease) the size of the window so that the grabbing area is smaller. This tells the software to grab only that portion of screen. This works well if there is something obstructing a portion of the video image i.e., large debris, mud, or synthetic material on the lens or backlighting source (drag the preview box away from that portion of the frame grabber).
Problem: Loss of particles in the viewing area Solution:
For aquifers that contain few colloidal particles such as coarse grain sands, particle density may decrease to one or two particles every minute. Be sure to set the delay between frames to the minimum values possible. The particles between the two frames, however, should not overlap to ensure an accurate measurement. Several hours may be required at a test interval in order to obtain enough particle matches to ensure a reliable flow zone.
Another potential problem is if the particles become blurry and then disappear altogether. This effect could result from a dirty well. Numerous particles can settle on the backlight source and decrease the amount of light available for viewing. Gently shaking the Borescope can remove these particles and allow a good image without disturbing the fines in the surrounding formation. Be sure to carefully lower the Borescope into these types of wells.
Problem: No flow zones detected in a well Solution:
First, keep trying different zones within the well screen. Remember, preferential flow zones can be in small laminar zones (a matter of inches), so keep on looking!
If 5 to 10 measurement where taken in a 5-ft well screen and no steady consistent flow zones where found, then the instrument should be moved to a new well. It is possible that the well is located in a stagnant flow zone within the aquifer; however, it is more likely that the well was poorly developed and there is a low permeable skin surrounding the well thus deflecting groundwater around the well. Another possibility is

28
that the well was screened is a low permeable zone of the aquifer with surrounding preferential flow zones that do not intersect the well screen.
It may seem obvious, but recheck the well log to ensure that the Borescope is located in the well screen and not the well casing.
Problem: Poor flow zones with particles that appear on the screen then rapidly disappear. Solution:
If this problem occurs then there are large vertical gradients in the well. Particles that stay in focus only briefly are moving across the focal plane of the lens. Well screens that intersect two or more permeable flow zones with different potentials can result in vertical flow in the well. Attaching packers to the instrument may reduce this vertical flow component.
Problem: Poor flow zones in large diameter wells Solution:
If this condition occurs, then it is recommended that the packers be attached to the instrument. The packers centralize the Borescope, keeping it off the sides of the well screen and minimize vertical flow that may be affecting the measurements.
Problem: Software Crashes Solution:
Restart by double clicking on AquaView LITE icon. If problem still exists then reboot computer.
Problem: Software will not track particles Solution:
Check the delay setting in the Tracking configuration menu. The faster
the particles are moving the smaller the "Capture Delay Frame" value should be and vice versa.
Check the Particle Sensitivity in the same menu screen. If numerous particles exist on the preview screen then the sensitivity should be increased to approx. 2500-4500). If only a few particles are visible then the sensitivity should lowered to be between 500-2000.
If the visible amount of particles is overwhelming, click on the tracking preview window (upper) and drag the box corners in so that the image window is smaller. This tells the software to grab only that portion of screen. This works well is there is something obstruction a portion of the video image i.e., large debris, mud, or synthetic material (drag the preview box away from that portion of the frame grabber). Turn particle tracking off and on again.
Turn tracking off while viewing graph and/or modifying parameters. Turn back on after changes are made.
Problem: Backlight source does not work Solution:
Check all cables to ensure connections are right. Check 1 amp fuse within Camera Control Unit (above plug outlet). If camera is sending image (use auxiliary light and look at monitor) and if no light is present,

29
it is possible that the internal camera unit has been jarred and is not contacting the two light source connections. –
THE FOLLOWING SHOULD BE PERFOMED BY AN AUTHORIZED/TRAINED COLLOIDAL BORESCOPE OPERATOR. Remove three screws from lower light unit on Borescope (note position of light unit compared to Borescope, mark with pen if needed). Pull the light unit apart. Check with a multi-meter for power from Borescope, voltage should read approximately 12 millivolts. Tap instrument so that camera unit slides towards the open end. Replace light unit (matching pen lines). Light should come on at this point. Remove light unit, replace rubber seals and add silicon (vacuum grease). Replace light unit (matching pen lines).
If light does not work at this point, check depth of contact with ruler and check depth of light source to ensure contact is being made. Make sure that the spring contract is not stuck. If camera unit will not move or there is no power to light source, equipment must be sent back to Geotech for repair.
Problem: Compass software cannot find port. Solution:
From the Windows start menu click Settings – Control Panel – System – Hardware – Device Manager – Ports and simply see which
port is being used by AquaLITE. Then go back into AquaLITE and in the compass calibration – automatic – port – scroll down to highlight the
appropriate port and retry. Power cycle the CCU to reset the connection.
Frequently asked Questions What is the minimum particle size and ratio needed for the Colloidal Borescope to function properly?
The limit is somewhere between 200 and 500 NTU. Naturally, occurring particles are between 5um and 20um. Particle sensitivity is just less than 1um.
What is the minimum velocity that can be detected?
As many days, weeks, months as user is willing to spend taking measurements determines the minimum velocity. Minimum velocity is essentially zero. If a particle sits in the field of view, it will not be tracked until it moves. For example, if it takes a year to move 1um then the flow speed would be 1um per year.
Is additional data manipulation required to account for the azimuth?
No. After entering in magnetic declination, the AquaLITE software will always orient to true North, regardless of the azimuth. The azimuth reading is present to help the user orient their view when watching the live video feed and tracking.
30
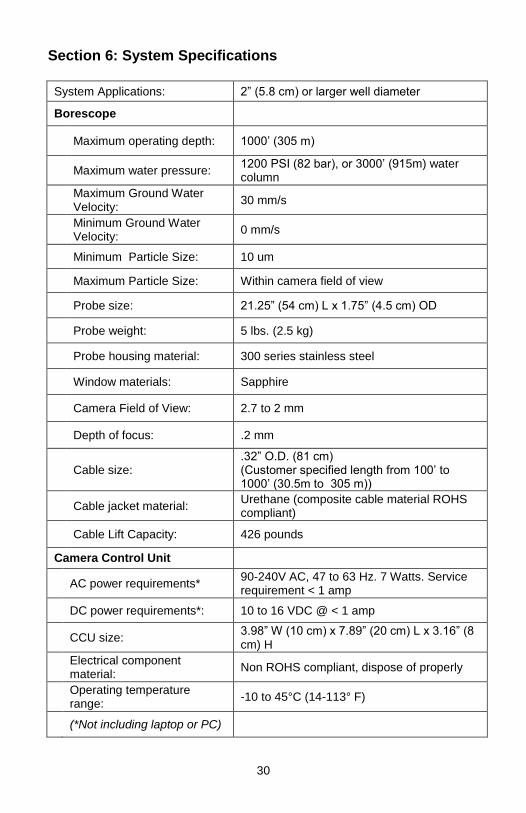
Section 6: System Specifications
System Applications: 2” (5.8 cm) or larger well diameter
Borescope
Maximum operating depth: 1000’ (305 m)
Maximum water pressure:
1200 PSI (82 bar), or 3000’ (915m) water column
Maximum Ground Water Velocity:
30 mm/s
Minimum Ground Water Velocity:
0 mm/s
Minimum Particle Size: 10 um
Maximum Particle Size: Within camera field of view
Probe size: 21.25” (54 cm) L x 1.75” (4.5 cm) OD
Probe weight: 5 lbs. (2.5 kg)
Probe housing material: 300 series stainless steel
Window materials: Sapphire
Camera Field of View: 2.7 to 2 mm
Depth of focus: .2 mm
Cable size:
.32” O.D. (81 cm) (Customer specified length from 100’ to 1000’ (30.5m to 305 m))
Cable jacket material:
Urethane (composite cable material ROHS compliant)
Cable Lift Capacity: 426 pounds
Camera Control Unit
AC power requirements*
90-240V AC, 47 to 63 Hz. 7 Watts. Service requirement < 1 amp
DC power requirements*: 10 to 16 VDC @ < 1 amp
CCU size:
3.98” W (10 cm) x 7.89” (20 cm) L x 3.16” (8 cm) H
Electrical component material:
Non ROHS compliant, dispose of properly
Operating temperature range:
-10 to 45°C (14-113° F)
(*Not including laptop or PC)
31
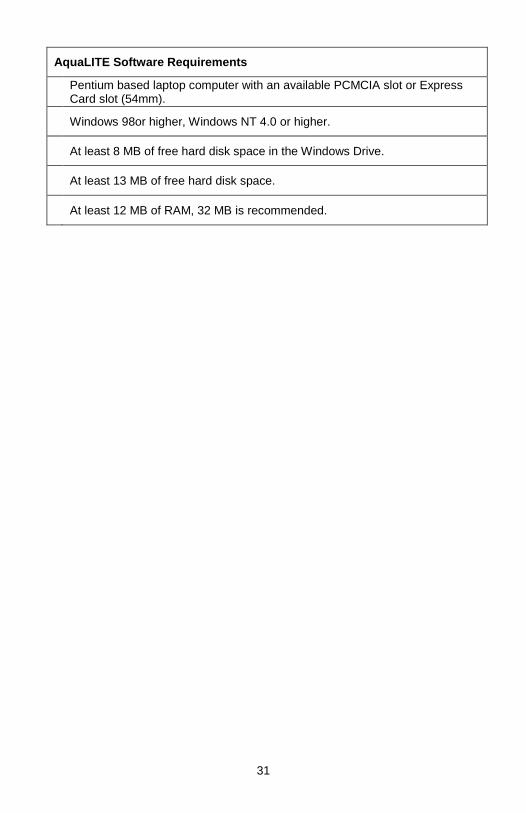
AquaLITE Software Requirements
Pentium based laptop computer with an available PCMCIA slot or Express Card slot (54mm).
Windows 98or higher, Windows NT 4.0 or higher.
At least 8 MB of free hard disk space in the Windows Drive.
At least 13 MB of free hard disk space.
At least 12 MB of RAM, 32 MB is recommended.
32
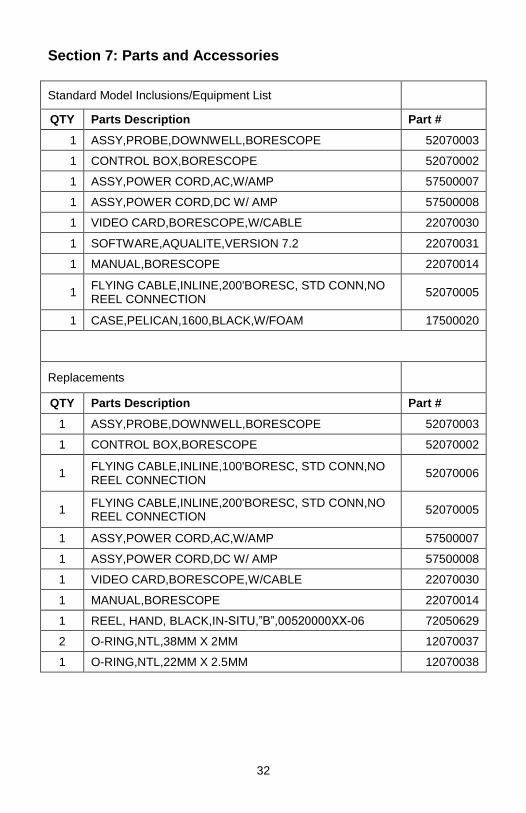
Section 7: Parts and Accessories
Standard Model Inclusions/Equipment List
QTY Parts Description Part #
1 ASSY,PROBE,DOWNWELL,BORESCOPE 52070003
1 CONTROL BOX,BORESCOPE 52070002
1 ASSY,POWER CORD,AC,W/AMP 57500007
1 ASSY,POWER CORD,DC W/ AMP 57500008
1 VIDEO CARD,BORESCOPE,W/CABLE 22070030
1 SOFTWARE,AQUALITE,VERSION 7.2 22070031
1 MANUAL,BORESCOPE 22070014
1 FLYING CABLE,INLINE,200'BORESC, STD CONN,NO REEL CONNECTION
52070005
1 CASE,PELICAN,1600,BLACK,W/FOAM 17500020
Replacements
QTY Parts Description Part #
1 ASSY,PROBE,DOWNWELL,BORESCOPE 52070003
1 CONTROL BOX,BORESCOPE 52070002
1 FLYING CABLE,INLINE,100'BORESC, STD CONN,NO REEL CONNECTION
52070006
1 FLYING CABLE,INLINE,200'BORESC, STD CONN,NO REEL CONNECTION
52070005
1 ASSY,POWER CORD,AC,W/AMP 57500007
1 ASSY,POWER CORD,DC W/ AMP 57500008
1 VIDEO CARD,BORESCOPE,W/CABLE 22070030
1 MANUAL,BORESCOPE 22070014
1 REEL, HAND, BLACK,IN-SITU,”B”,00520000XX-06 72050629
2 O-RING,NTL,38MM X 2MM 12070037
1 O-RING,NTL,22MM X 2.5MM 12070038

33
Optional Accessories
QTY Parts Description Part #
1 REEL, PORTABLE, SMALL 11400010
1 REEL, PORTABLE, LARGE 11400011
1 ASSY, CENTERING DEVICE, BORESCOPE 52070018
CLAMP, FLOW RESTRICTOR, BORESCOPE 22070018
RING, CENTER, RUB, 3.75”ODx1.75”ID, BORESCOPE 12070053
SCREW, 3/8-24, SET, FLOW RESTRICTOR, BORESCOPE 12070054
Probe Centering Device
If deploying the Borescope probe into a 4” well, Geotech recommends the Borescope be equipped with centering disks. The disks will help stabilize the Borescope within the larger diameter well, and can help guide colloidal flow into the camera’s field of view. A full centering device kit consists of - 4 flow restrictor clamps - 2 centering rings - 8 setscrews The centering rings are held in between the restrictor clamps. The restrictor clamps are secured to the probe with setscrews. Before deploying the Probe with Centering Devices, ensure the clamp assemblies are tight by gently tugging with your hand.
34
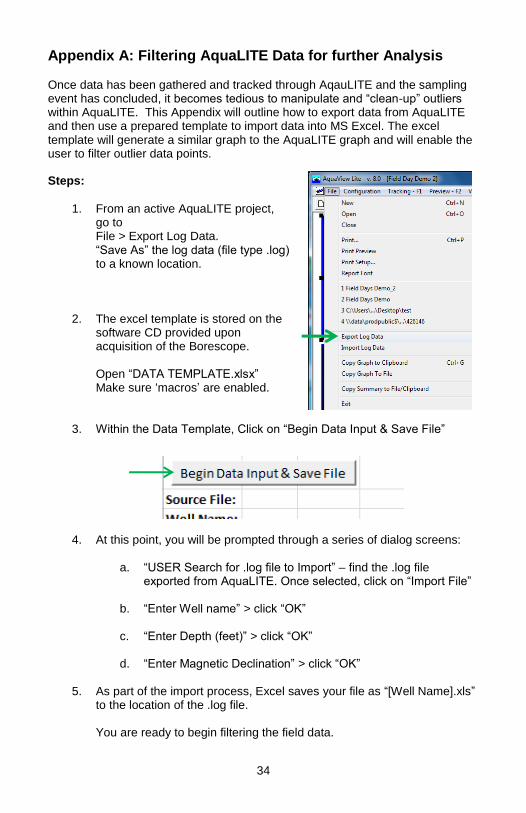
Appendix A: Filtering AquaLITE Data for further Analysis
Once data has been gathered and tracked through AqauLITE and the sampling event has concluded, it becomes tedious to manipulate and “clean-up” outliers within AquaLITE. This Appendix will outline how to export data from AquaLITE and then use a prepared template to import data into MS Excel. The excel template will generate a similar graph to the AquaLITE graph and will enable the user to filter outlier data points. Steps:
1. From an active AquaLITE project,
go to File > Export Log Data. “Save As” the log data (file type .log) to a known location.
2. The excel template is stored on the software CD provided upon acquisition of the Borescope. Open “DATA TEMPLATE.xlsx” Make sure ‘macros’ are enabled.
3. Within the Data Template, Click on “Begin Data Input & Save File”
4. At this point, you will be prompted through a series of dialog screens:
a. “USER Search for .log file to Import” – find the .log file
exported from AquaLITE. Once selected, click on “Import File”
b. “Enter Well name” > click “OK”
c. “Enter Depth (feet)” > click “OK”
d. “Enter Magnetic Declination” > click “OK”
5. As part of the import process, Excel saves your file as “[Well Name].xls” to the location of the .log file. You are ready to begin filtering the field data.

35
6. In the Data Template, notice that there are two sheet tabs in the bottom left of the window, “Data” and “Graph.”
a. The graph on tab 2 should be very similar to the one generated by AquaLITE. As points/matches are filtered, it will adjust and clarify the data.
7. Column E, “# Points,” captures how many particle matches AquaLITE noticed and tracked per particle. It is helpful to filter these and show only particles that were matched, for example, 10 instances versus only 2 or 5. There is a small down arrow on this column header where you can manage the filter. Select and deselect # Points from the filter dialog box. Click “OK.” Example: for a data set of 1000 or more points, you can confidently discard data points that had less than 10 matches.
8. Adjust filter as necessary, referring to the updated graph on sheet 2 of the excel spreadsheet. Depending on the integrity of your data set, the graph should be cleaner with fewer outliers.
For further questions, please consult with your Geotech Technical Sales
Representative.
36
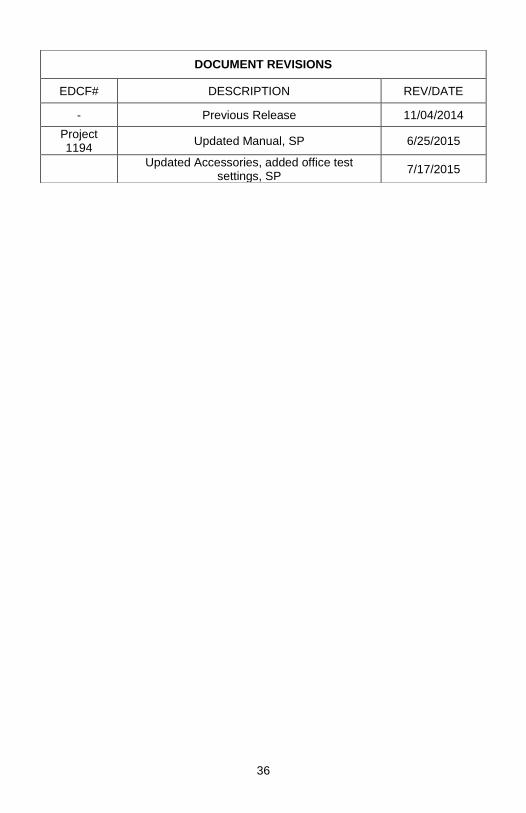
DOCUMENT REVISIONS
EDCF# DESCRIPTION REV/DATE
- Previous Release 11/04/2014
Project 1194
Updated Manual, SP 6/25/2015
Updated Accessories, added office test
settings, SP 7/17/2015

37
The Warranty For a period of one (1) year from date of first sale, product is warranted to be free from defects in materials and workmanship. Geotech agrees to repair or replace, at Geotech’ s option, the portion proving defective, or at our option to refund the purchase price thereof. Geotech will have no warranty obligation if the product is subjected to abnormal operating conditions, accident, abuse, misuse, unauthorized modification, alteration, repair, or replacement of wear parts. User assumes all other risk, if any, including the risk of injury, loss, or damage, direct or consequential, arising out of the use, misuse, or inability to use this product. User agrees to use, maintain and install product in accordance with recommendations and instructions. User is responsible for transportation charges connected to the repair or replacement of product under this warranty.
Equipment Return Policy
A Return Material Authorization number (RMA #) is required prior to return of any equipment to our facilities, please call our 800 number for appropriate location. An RMA # will be issued upon receipt of your request to return equipment, which should include reasons for the return. Your return shipment to us must have this RMA # clearly marked on the outside of the package. Proof of date of purchase is required for processing of all warranty requests. This policy applies to both equipment sales and repair orders.
FOR A RETURN MATERIAL AUTHORIZATION, PLEASE CALL OUR SERVICE DEPARTMENT AT 1-800-833-7958.
Model Number: ________________ Serial Number: ________________ Date of Purchase: ________________
Equipment Decontamination
Prior to return, all equipment must be thoroughly cleaned and decontaminated. Please make note on RMA form, the use of equipment, contaminants equipment was exposed to, and decontamination solutions/methods used. Geotech reserves the right to refuse any equipment not properly decontaminated. Geotech may also choose to decontaminate the equipment for a fee, which will be applied to the repair order invoice.

Geotech Environmental Equipment, Inc. 2650 East 40th Avenue Denver, Colorado 80205
(303) 320-4764 ● (800) 833-7958 ● FAX (303) 322-7242 email: [email protected] website: www.geotechenv.com
In the EU
Geotech Equipos Ambientales Calle Francesc I Ferrer, Guardia Local 19, Mollet del Valles, Barcelona 08100, España
Tlf: (34)93 5445937 email: [email protected]
website: http://spanish.geotechenv.com
Printed in the United States of America