Embed Size (px)
Citation preview
A GIS-Based Assessment of Liquefaction Potential ofthe City of Aqaba, Jordan
NASSER M. MANSOOR
Department of Earth and Environmental Science, 195 University Avenue,Rutgers University, Newark, NJ 07102
TINA M. NIEMI
Department of Geosciences, University of Missouri-Kansas City, 5100 Rockhill Road,Kansas City, MO 64110
ANIL MISRA
Department of Civil and Environmental Engineering, University of Missouri-Kansas City,5100 Rockhill Road, Kansas City, MO 64110
Key Terms: Liquefication, GIS, Aqaba, Jordan, Earth-quake, Dead Sea Transform
ABSTRACT
The city of Aqaba, Jordan, located along thenorthern shore of the Gulf of Aqaba, is built over theseismically active Dead Sea Transform plate bound-ary fault system. The subsurface stratigraphicsequence underlying the city is composed of alluvialfan deposits containing varying amounts of clay, silt,sand, and gravel interbedded within the coastal areaswith aeolian and beach sand. Groundwater levelsalong the coastal areas are very shallow. Thegroundwater levels increase to the north and north-east to depths greater than 17 m about 5 km from theshore. The liquefaction potential of the city of Aqabasoils was analyzed using the Simplified Procedure ofYoud and Idriss and the modified Chinese criteria ofWang. Maps of the liquefaction susceptibility of areasin the city of Aqaba were displayed using theGeographic Information System (GIS). Applicationof the modified Chinese criteria indicates that thecohesive subsurface layers are predominantly non-liquefiable. The types of sediments most susceptible toliquefaction are saturated silt and sand deposits. Twoclassification schemes were developed in this lique-faction analysis. Our results indicate that the coastalareas of Aqaba have a high potential to liquefy,whereas the eastern parts of the city lie predomi-nantly within a nonliquefaction zone. The criticalfacilities were overlaid with the liquefaction hazardmap of the city and show that only the hotel and thecommercial districts lie within a zone of highsusceptibility to liquefaction. The areas that have
historically experienced liquefaction were found toexist within the high susceptibility zone as well,supporting the findings of this study.
INTRODUCTION
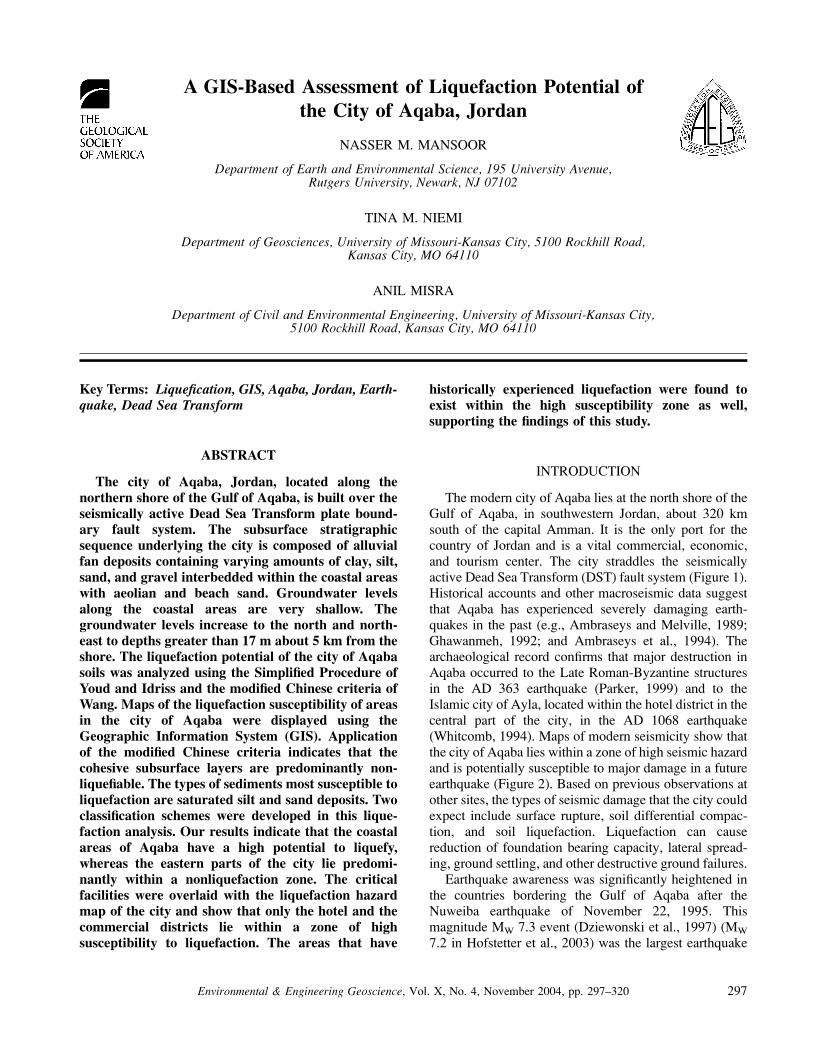
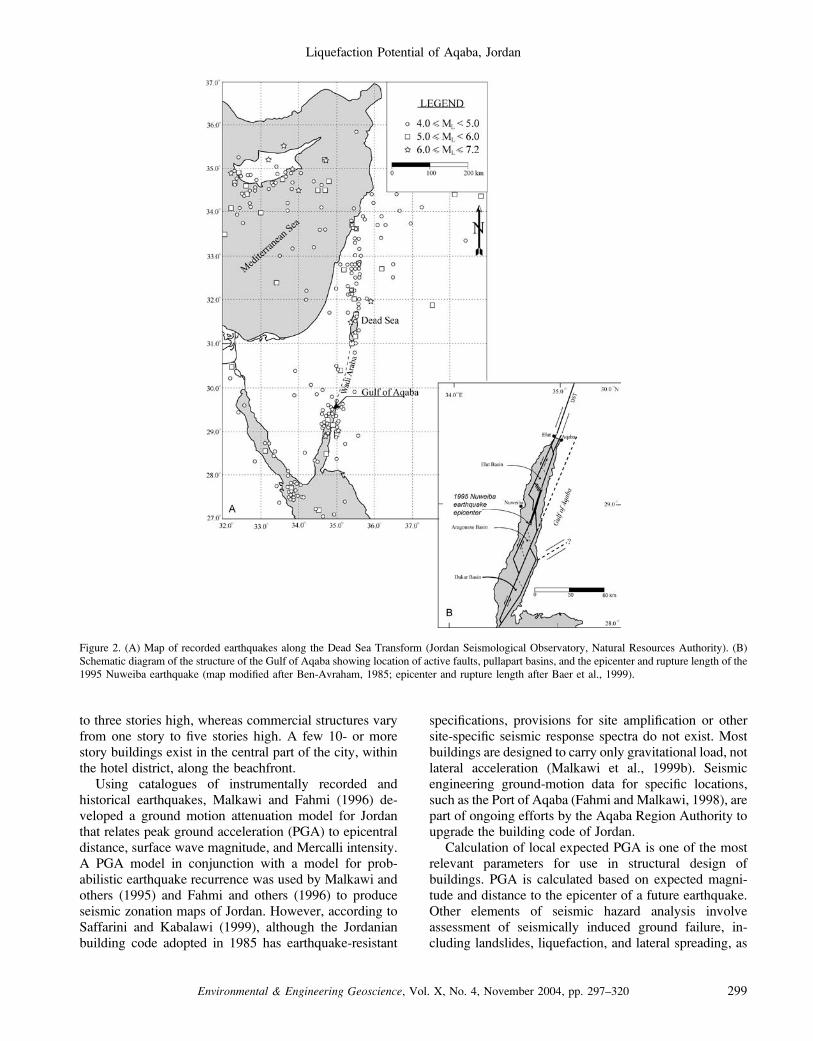
The modern city of Aqaba lies at the north shore of theGulf of Aqaba, in southwestern Jordan, about 320 kmsouth of the capital Amman. It is the only port for thecountry of Jordan and is a vital commercial, economic,and tourism center. The city straddles the seismicallyactive Dead Sea Transform (DST) fault system (Figure 1).Historical accounts and other macroseismic data suggestthat Aqaba has experienced severely damaging earth-quakes in the past (e.g., Ambraseys and Melville, 1989;Ghawanmeh, 1992; and Ambraseys et al., 1994). Thearchaeological record confirms that major destruction inAqaba occurred to the Late Roman-Byzantine structuresin the AD 363 earthquake (Parker, 1999) and to theIslamic city of Ayla, located within the hotel district in thecentral part of the city, in the AD 1068 earthquake(Whitcomb, 1994). Maps of modern seismicity show thatthe city of Aqaba lies within a zone of high seismic hazardand is potentially susceptible to major damage in a futureearthquake (Figure 2). Based on previous observations atother sites, the types of seismic damage that the city couldexpect include surface rupture, soil differential compac-tion, and soil liquefaction. Liquefaction can causereduction of foundation bearing capacity, lateral spread-ing, ground settling, and other destructive ground failures.
Earthquake awareness was significantly heightened inthe countries bordering the Gulf of Aqaba after theNuweiba earthquake of November 22, 1995. Thismagnitude MW 7.3 event (Dziewonski et al., 1997) (MW
7.2 in Hofstetter et al., 2003) was the largest earthquake
Environmental & Engineering Geoscience, Vol. X, No. 4, November 2004, pp. 297–320 297
on the DST during the 20th century. The earthquake wasfelt over an area greater than 1,000 km2 (Malkawi et al.,1999c). More than 150 aftershocks with M . 4 wererecorded during the 2 years following the Nuweibaearthquake (Rabinowitz and Steinberg, 1998; Malkawiet al., 1999c). The Nuweiba earthquake ruptured alonga NNE-trending, left-lateral strike-slip fault (Figure 2).The distribution of aftershocks lies predominantly alongthe eastern side of the Gulf of Aqaba and suggests that themain fault rupture occurred on a 45- to 70-km length ofthe strike-slip fault along the Aragonese and Elatbathymetric deeps (Figure 2) (Hofstetter et al., 2003;Klinger et al., 1999). The rupture propagated from southto north in at least two subevents (Klinger et al., 1999;Pinar and Turkelli, 1997; and Hofstetter et al., 2003).
Seismological and synthetic aperture radar interferometrydata indicate about 1.4 to 3.2 m of sinistral slip in theearthquake (Baer et al., 1999).
During the 12 years preceding the Nuweiba earth-quake, there were three discrete periods (1983, 1990, and1993) of increased seismic activity within the Gulf ofAqaba (El-Isa et al., 1984; Alamri, 1991; and Amrat,1996). These earthquake swarms migrated from north tosouth and define the approximate rupture boundaries ofthe Nuweiba 1995 rupture trace (Klinger et al., 1999).The maximum magnitude event during all the swarmswas the MW 6.1 earthquake of August 3, 1993. A focalplane mechanism and the alignment of microseismicityepicenters indicate that the 1993 rupture occurred ona N328W-trending, normal fault (Dziewonski et al., 1994;Pinar and Turkelli, 1997). This is particularly interestingbecause similar cross-fault structures are mapped inAqaba (Niemi and Smith, 1999; Mansoor, 2002; andSlater and Niemi, 2003) and because the Nuweibaearthquake nucleated near the August 3, 1993 earthquake.
Damage from the 1995 Nuweiba earthquake wasconcentrated in the cities on the Sinai Peninsula (Egypt),the Saudi Arabian coastline, and the cities of Aqaba(Jordan) and Elat (Israel) located 70 km to the north ofthe epicenter. The hotel districts located near the beachesin Elat and Aqaba sustained the most damage from the1995 Nuweiba earthquake as a result of local amplifica-tion of the peak ground acceleration (Wust, 1997;Saffarini and Kabalawi, 1999; and Al-Tarazi, 2000).High ground water conditions, resulting in saturated sandlayers, make this region also susceptible to liquefaction.Although liquefaction sand blows were observed in Elat(Wust, 1997), subsidence was the only observableevidence of potential liquefaction in Aqaba (Malkawiet al., 1999c). Other damage in Aqaba included lateralspreading and differential settlement.
Wust (1997) concluded that damage to structures builton alluvial fan sediments appeared to be more extensive inAqaba, as compared to buildings on the same substrate inElat. Several reasons were suggested for this, includingdifferent construction standards, amplification withinalluvial fan sediments, and potential reactivation of faultsburied in the alluvium (Wust, 1997). Two strong motionaccelerographs were stationed in Aqaba at the time of the1995 Nuweiba earthquake (Saffarini and Kabalawi, 1999;Malkawi et al., 1999c). These instruments were stationedon the ground floors of the Aqaba Hotel, located at thebeach, and the Civil Defense Building, located on alluvialfan deposits 3 km north of the beach. Maximum ac-celeration recorded at the beach location was signifi-cantly higher (0.16 g) than at the inland site (0.06 g)(Saffarini and Kabalawi, 1999; Malkawi et al., 1999c).The low-rise residential and commercial structures withinAqaba are constructed predominantly of reinforcedconcrete. The houses and apartment complexes are two
Figure 1. Regional map of the tectonic setting of the study area
(modified after Garfunkel and Ben-Avraham, 1996). J, Jordan Valley
fault; E, Ed Damur fault; R, Rachaya fault; Y, Yammouneh fault; G,
Ghab fault; CN-S, Central Negev Sinai shear belt.
Mansoor, Niemi, and Misra
Environmental & Engineering Geoscience, Vol. X, No. 4, November 2004, pp. 297–320298
to three stories high, whereas commercial structures varyfrom one story to five stories high. A few 10- or morestory buildings exist in the central part of the city, withinthe hotel district, along the beachfront.
Using catalogues of instrumentally recorded andhistorical earthquakes, Malkawi and Fahmi (1996) de-veloped a ground motion attenuation model for Jordanthat relates peak ground acceleration (PGA) to epicentraldistance, surface wave magnitude, and Mercalli intensity.A PGA model in conjunction with a model for prob-abilistic earthquake recurrence was used by Malkawi andothers (1995) and Fahmi and others (1996) to produceseismic zonation maps of Jordan. However, according toSaffarini and Kabalawi (1999), although the Jordanianbuilding code adopted in 1985 has earthquake-resistant
specifications, provisions for site amplification or othersite-specific seismic response spectra do not exist. Mostbuildings are designed to carry only gravitational load, notlateral acceleration (Malkawi et al., 1999b). Seismicengineering ground-motion data for specific locations,such as the Port of Aqaba (Fahmi and Malkawi, 1998), arepart of ongoing efforts by the Aqaba Region Authority toupgrade the building code of Jordan.
Calculation of local expected PGA is one of the mostrelevant parameters for use in structural design ofbuildings. PGA is calculated based on expected magni-tude and distance to the epicenter of a future earthquake.Other elements of seismic hazard analysis involveassessment of seismically induced ground failure, in-cluding landslides, liquefaction, and lateral spreading, as
Figure 2. (A) Map of recorded earthquakes along the Dead Sea Transform (Jordan Seismological Observatory, Natural Resources Authority). (B)
Schematic diagram of the structure of the Gulf of Aqaba showing location of active faults, pullapart basins, and the epicenter and rupture length of the
1995 Nuweiba earthquake (map modified after Ben-Avraham, 1985; epicenter and rupture length after Baer et al., 1999).
Liquefaction Potential of Aqaba, Jordan
Environmental & Engineering Geoscience, Vol. X, No. 4, November 2004, pp. 297–320 299

well as site effects of ground shaking such as amplifica-tion. In this paper we evaluate the liquefaction hazard inthe city of Aqaba based on subsurface geotechnical dataobtained from various sources. The results are presentedin a point-based Geographic Information System (GIS)format that can be updated easily and interpolated acrossareas that lack geotechnical information but have similarsubsurface conditions. This study will provide the cityplanners and the engineering designers with numericalvalues of the liquefaction hazard that can be used to helprefine the building code provisions and improve the safetyof structures and critical facilities.
TECTONIC AND GEOLOGICAL SETTING
Aqaba lies within a major active seismic region, alongthe plate boundary of the Dead Sea Transform faultsystem (DST). The transform extends for about 1,100 kmand separates the Arabian Plate on the east from the Sinaisubplate on the west (Figure 1). The transtensional motionand the en echelon fault geometry have created severalpull-apart basins. According to models of gravity datacollected across the DST presented by Ten Brink andothers (1999), the fault valley between the Dead Sea andthe Gulf of Aqaba is composed of several smalldepositional basins. These en echelon basins are orientedat a clockwise angle to the axis of the transform and areshallow toward the north. The average minimum lateQuaternary slip rate for the DST is about 4–7 mm/year(Zhang, 1998; Klinger et al., 2000; and Niemi et al.,2001).
The city of Aqaba is built on alluvial sediments derivedfrom the Wadi Yutim, located east of the city between therugged mountains of Ash Shahabi and Al Akhdar, andalluvial fans emanating from the eastern plateau (Figure3). Niemi and Smith (1999) divided the Wadi Yutimsurficial deposits into four mappable Quaternary fan units,based on air photo interpretations. The subsurfacestratigraphy of the various alluvial fan units was in-vestigated in several trench excavations and soil pits of upto 4 m deep (Mansoor, 2002; Niemi and Mansoor, inpreparation). Existing boring logs, up to 20 m in depth,and several hand auger cores of depths up to 4 m were alsoanalyzed to provide essential information about thelithology and the groundwater conditions.
LIQUEFACTION PRINCIPLE AND OCCURRENCE
Liquefaction is defined as the process by which thesaturated sediments temporarily lose their shear strengthand behave as a viscous fluid rather than as a solid (Seedand Idriss, 1982; Kramer, 1996). Consequently, structuresmay tilt or sink, and buried pipelines may float to thesurface. Ground fissures and lateral spreading can also bea result of the liquefaction phenomenon. The liquefactionsusceptibility of soil deposits may be affected by factorssuch as grain size, relative density, depth and thicknessof the strata, age of sediments, presence of overlyingnonliquefiable layers, and the previous seismic history(Seed, 1979; Seed and Idriss, 1982; and Obermeier andPond, 1999). Generally, three conditions must existfor liquefaction to occur: (1) soil type susceptible toliquefaction; (2) presence of a shallow water tableresulting in a saturated condition, and (3) strong groundshaking (Kramer, 1996).
The sediments most susceptible to liquefaction aresaturated silts and sands. If the silt and sand sediments areoverlain by a nonliquefiable stratum, the liquefaction
Figure 3. Quaternary geologic map of the region along the Dead Sea
Transform north of the Gulf of Aqaba showing the geometry of faults
in the region of Aqaba, Jordan and Elat, Israel (modified after
Garfunkel, 1970).
Mansoor, Niemi, and Misra
Environmental & Engineering Geoscience, Vol. X, No. 4, November 2004, pp. 297–320300

susceptibility may be very high because high porepressure will not dissipate to the surface. Several recentstudies also indicate that gravel may be liquefiable, andinstances have been reported in Japan, China, NewZealand, and the United States (e.g., Seed et al., 1985;Stokoe et al., 1988; and Obermeier and Pond, 1999). Mostcommonly, liquefaction originates at depths of 2 to 5 mbelow the ground surface, but it can also originate atdepths of up to 20 m or more (Seed and Idriss, 1982).
Liquefaction can be explained as the process oftrapping excess pore pressure as a result of cyclic loadinggenerated by ground shaking. The overburden pressure ofa non-cohesive soil produces contact forces between eachgrain and its neighboring particles, creating soil strength.When water saturates the soil, pore pressure counters theoverburden pressure. If a rapid loading such as that ofseismic ground shaking is applied, the particles tend tomove into a denser configuration as a result of shearingand temporary loss of grain-to-grain contact. The loss ofgrain-to-grain contact temporarily transfers some or all ofthe overburden stress to the pore water. As a result, thepore pressure reduces the contact forces between theparticles, and consequently, the shear strength of the soilwill decrease, and the soil may behave as a fluid.
Literature on liquefaction-induced features and theassociated damage within the city of Aqaba and theadjacent areas is very limited. Most of the reportedliquefaction damage is related to the Nuweiba earthquakeof November 1995 (Wust, 1997; Malkawi et al., 1999c).Other studies concerned with archeological structureswithin the city reveal evidence of paleoseismic eventsassociated with liquefaction (Ghawanmeh, 1992; Whit-comb, 1994; and Al-Homoud and Tal, 1998).
Damage assessment reports from the 1995 Nuweibaearthquake (as previously discussed) indicate that severalareas experienced liquefaction damage as well asliquefaction-induced features. Wust (1997) surveyed thepost-seismic damage from this earthquake within andaround Aqaba, Elat, and the eastern Sinai Peninsula. Hereported that the failure features and lateral spreadingwithin Elat’s hotel district were caused by liquefaction asa result of local amplification of ground acceleration in theunconsolidated alluvial fan and sabkha material on whichthe city is built. Sand boils were reported both in naturalenvironments and in conjunction with man-made struc-tures such as landfills, ramps, ditches, and levees. Thissuggests that liquefaction (accompanied by water-tablefluctuations) was an active process during this earthquake.On the other hand, the damage within the city of Aqaba,according to Wust (1997), was most severe along theshoreline areas around the Alcazar Hotel, Miramar Hotel,and Aqaba Gulf Hotel because of different constructionstandards and reactivation of the fault lines in the alluvialfans under Aqaba. Earthquake damage in Aqaba wasreported by Malkawi and others (1999c) and included
differential settlement, lateral spreading, and separation offoundations, mostly along the shoreline area. They did notobserve any direct evidence of liquefaction such as sandboils or dikes.
In an archeological study, Whitcomb (1994) excavatedthe ancient walled city of Ayla that is located adjacent tothe beach and extends a few tens of meters north of theshoreline (Figure 3). Ayla was founded in the eighthcentury AD. Whitcomb (1994) shows, from detailedmapping of the ancient architecture, that this ancient cityexperienced subsidence caused by several earthquakes.Historical records describe the subsidence of the ancientAyla City as ‘‘swallowed by the earth’’ after the AD 1068earthquake (Ghawanmeh, 1992). This description of thedamage can possibly be explained by the liquefactionphenomenon. Geotechnical research at ancient Ayla byAl-Homoud and Tal (1998) indicates that tilting andsinking of portions of the exterior walls may have beenthe result of liquefaction.
BOREHOLE DATA
An evaluation of the liquefaction hazard in Aqaba wasconducted based on Seed and Idriss’s stress approach(1971, 1982), updated by Seed and others (1985) andYoud and Idriss (1997). This method utilizes StandardPenetration Test (SPT) blow count data. This commontechnique uses the corrected blow count for an energyratio of 60 percent and an effective overburden pressureof 1 ton/ft2 (95.76 kPa) as a function of the soil type,(N1)60. The total and the effective overburden pressure atthe point of interest, as well as the earthquake magnitude,must be established to perform an empirical correlationbetween the cyclic stress ratio (CSR) and the correctedblow count of the SPT to estimate the cyclic resistanceratio (CRR). The borehole data included in this studyconsist of the logs of 109 boreholes compiled fromdifferent studies and geotechnical investigations carriedout in the city of Aqaba. The data were compiled mainlyfrom Malkawi and Fahmi (1996), Malkawi and others(1997), Al-Homoud and Tal (1998), the JordanianNatural Resources Authority (NRA) in collaborationwith the Royal Scientific Society (RSS), and privategeotechnical companies.
The borehole logs contain detailed stratigraphic de-scriptions and different geotechnical test data, especiallySPT data. The boreholes were drilled to depths rangingfrom 2.3 m to 20 m. The NRA drilled only three boreholesto the depth of bedrock (Malkawi and Fahmi, 1996). Inaddition, three boreholes were drilled using a hand augerto aid in determination of the shoreline areas, subsurfacestratigraphy and to confirm the depth to groundwater. Thedata include coordinates of the borehole, surface eleva-tion, the variation of the soil profile with depth,groundwater depth, and laboratory test results performed
Liquefaction Potential of Aqaba, Jordan
Environmental & Engineering Geoscience, Vol. X, No. 4, November 2004, pp. 297–320 301

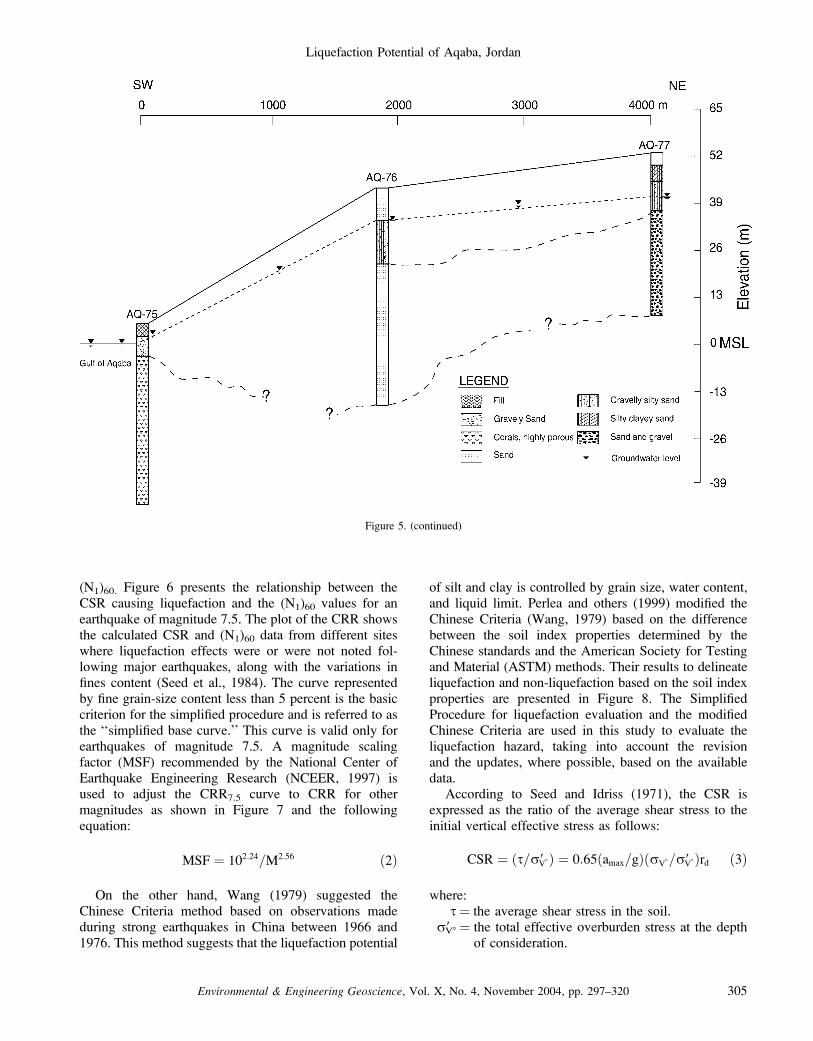
on samples from specific depths. These laboratory testsincluded Atterberg limits and natural moisture content.The field N-value of the standard penetration test data isrecorded as a separate parameter included in the boreholelogs. Figure 4 presents a generalized cross sectionconstructed from boreholes located along the shoreline.The cross section shows a detailed stratigraphic sequence,water levels, and the N-value of the SPT. The correlationbetween soil consistency and Peck’s N-value of 1974were also used in this study (Table 1). A semiquantitativedescription of the relative density or compactness, rangingfrom very loose to very dense, is correlated to the N-value.
The analyses involved evaluating the subsurfacestratigraphy and the groundwater conditions, analyzingthe geotechnical borehole data, and using various valuesfor earthquake magnitudes and PGA derived fromrecorded accelerometers and response spectra developedby previous studies (Fahmi and Malkawi, 1998; Malkawiet al., 1999b,c). The average soil unit weights (dry andsaturated) of Kulhawy and Mayne (1990) were used inthe liquefaction evaluation (Table 2) to calculate thevertical overburden stress.
A multi-layer spatial analysis was conducted to providethe first point-based liquefaction hazard map of the region.
The geological, hydrological, and geotechnical data wereentered into a computer-based GIS. The database includeda base map of the city of Aqaba, digitized at a scale of1:10,000, including roads, utilities, and various criticalfeatures. Three layers were spatially registered to the basemap: (1) geologic map with fault locations, (2) ground-water levels from borehole data, and (3) geotechnical dataand subsurface lithology based on borehole data. Theanalysis component included total and effective over-burden stress calculations, ground motion parameters, andliquefaction evaluations. These steps are discussed inmore detail in the following sections.
GROUNDWATER CONDITIONS
Groundwater depth plays a key role in liquefactionevaluation because it results in increased saturation andreduces the effective vertical stress. Shearing disrupts thedepositional grain packing and results in a more closelypacked grain structure, forming a denser material.
Mapping groundwater conditions within the city ofAqaba is based on a compilation of groundwater leveldata from geotechnical borehole logs that have beendrilled, for engineering purposes, throughout the city.
Figure 4. Cross section trending NNW–SSE showing the elevation of the different stratigraphic layers along the gulf shoreline, groundwater
elevations, and the N-value of the SPT where tested. See Figure 15 for cross section location.
Mansoor, Niemi, and Misra
Environmental & Engineering Geoscience, Vol. X, No. 4, November 2004, pp. 297–320302
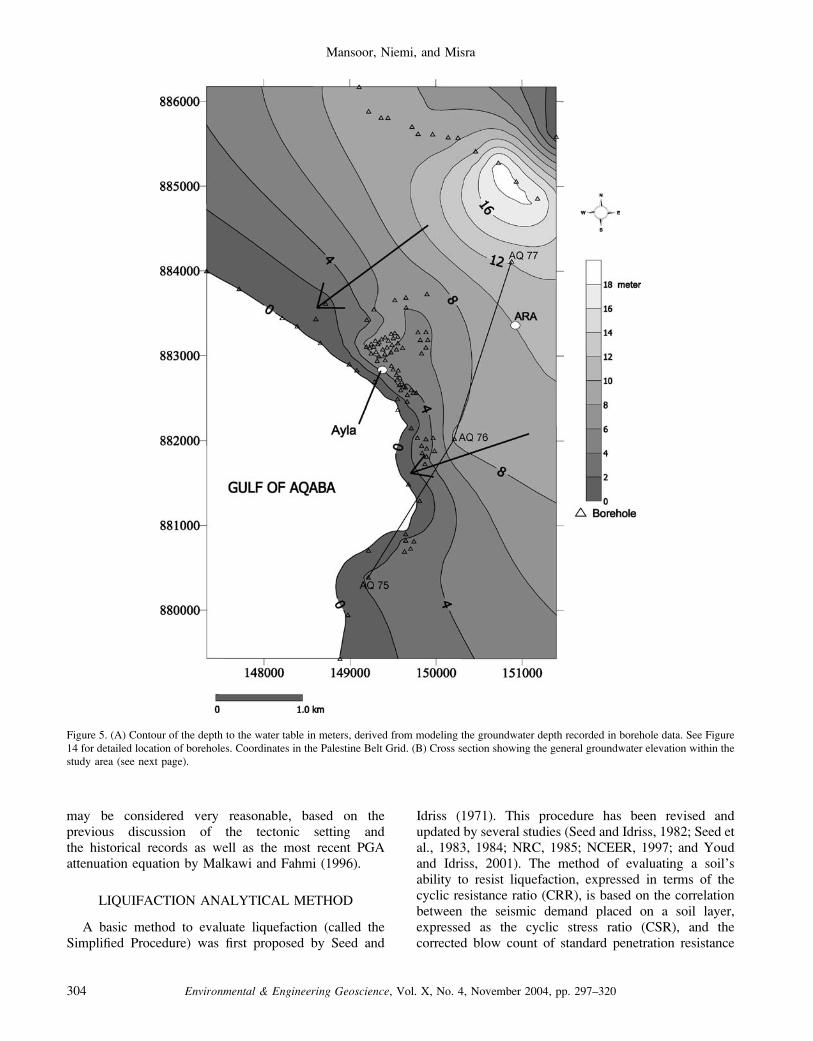
The data were used to generate a groundwater contourmap of the study area that was used in the liquefactionevaluation within Aqaba (Figure 5A). A compiled crosssection in the northeast–southwest direction shows thegeneral elevation of the groundwater levels within thestudy area (Figure 5B).
The groundwater level surface shows that the area ischaracterized by shallow water levels at the south andsouthwest along the gulf shoreline from about 1.4 mbelow ground surface to about 17 m to the north andnortheast (Figure 5A). Most of the boreholes locatedabout 3 km to the north and northeast portions of the gulfshoreline are characterized by dry conditions up to 20 mdeep. The study area portrays both unconfined andconfined conditions, caused by the presence of local claylenses, within the subsurface stratigraphic sequence(Figure 4). Groundwater movement is mainly from thenortheast to the southwest in the northern parts of the cityand from east to west in the southern parts of the city, asindicated in the groundwater contour map and the crosssection (Figure 5A and B). Municipal use of thegroundwater may affect future groundwater levels of thestudy area and, consequently, may reduce the liquefac-tion hazard.
SEISMICITY, GROUND MOTIONPARAMETERS, AND PGA
In order to perform a liquefaction hazard evaluation ata specific site, the magnitudes of both a MaximumCredible Earthquake (MCE) and a Maximum ProbableEarthquake (MPE) must be estimated. According toguidelines issued by the California Division of Mines andGeology (1975), the MCE is the maximum earthquakethat appears capable of occurring under the presentlyknown tectonic framework at any time. The MPE is themaximum earthquake that is likely to occur during a 100-year interval. The MCE should be regarded as a magni-tude not less than the maximum that has occurred withina historic time.
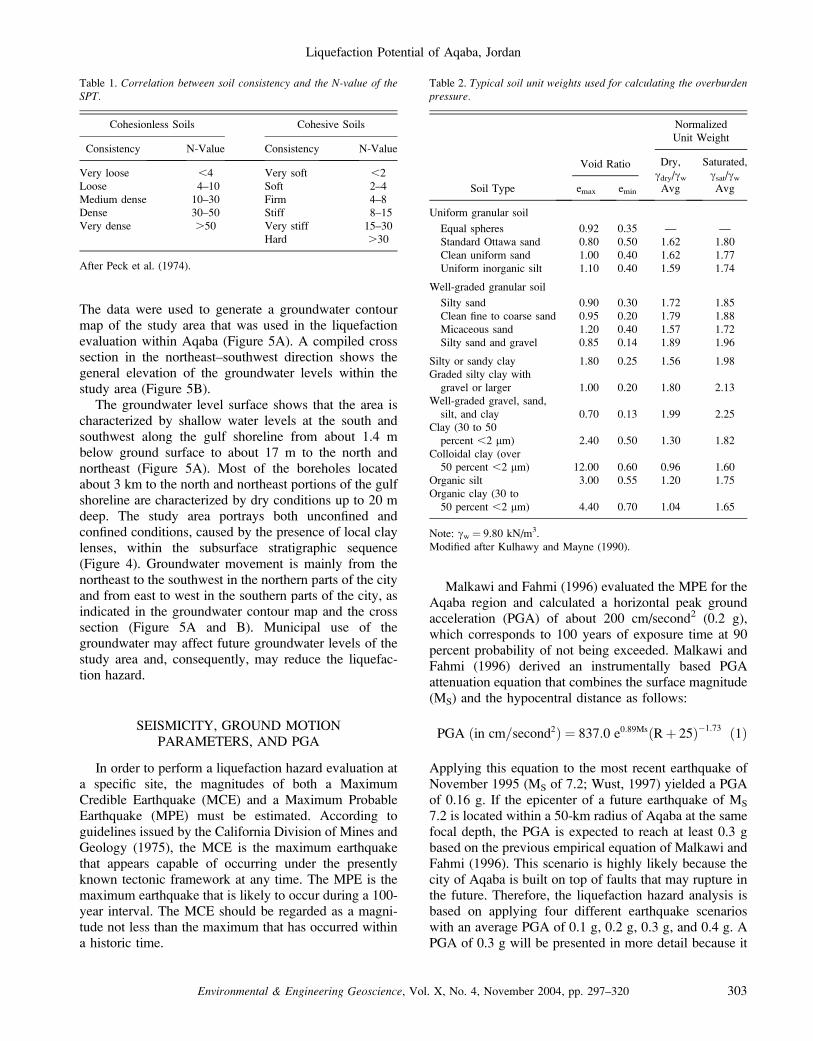
Malkawi and Fahmi (1996) evaluated the MPE for theAqaba region and calculated a horizontal peak groundacceleration (PGA) of about 200 cm/second2 (0.2 g),which corresponds to 100 years of exposure time at 90percent probability of not being exceeded. Malkawi andFahmi (1996) derived an instrumentally based PGAattenuation equation that combines the surface magnitude(MS) and the hypocentral distance as follows:
PGA ðin cm=second2Þ ¼ 837:0 e0:89MsðRþ 25Þ�1:73 ð1Þ
Applying this equation to the most recent earthquake ofNovember 1995 (MS of 7.2; Wust, 1997) yielded a PGAof 0.16 g. If the epicenter of a future earthquake of MS
7.2 is located within a 50-km radius of Aqaba at the samefocal depth, the PGA is expected to reach at least 0.3 gbased on the previous empirical equation of Malkawi andFahmi (1996). This scenario is highly likely because thecity of Aqaba is built on top of faults that may rupture inthe future. Therefore, the liquefaction hazard analysis isbased on applying four different earthquake scenarioswith an average PGA of 0.1 g, 0.2 g, 0.3 g, and 0.4 g. APGA of 0.3 g will be presented in more detail because it
Table 1. Correlation between soil consistency and the N-value of theSPT.
Cohesionless Soils Cohesive Soils
Consistency N-Value Consistency N-Value
Very loose ,4 Very soft ,2
Loose 4–10 Soft 2–4
Medium dense 10–30 Firm 4–8
Dense 30–50 Stiff 8–15
Very dense .50 Very stiff 15–30
Hard .30
After Peck et al. (1974).
Table 2. Typical soil unit weights used for calculating the overburdenpressure.
Soil Type
Void Ratio
Normalized
Unit Weight
emax emin
Dry,
cdry/cwAvg
Saturated,
csat/cwAvg
Uniform granular soil
Equal spheres 0.92 0.35 — —
Standard Ottawa sand 0.80 0.50 1.62 1.80
Clean uniform sand 1.00 0.40 1.62 1.77
Uniform inorganic silt 1.10 0.40 1.59 1.74
Well-graded granular soil
Silty sand 0.90 0.30 1.72 1.85
Clean fine to coarse sand 0.95 0.20 1.79 1.88
Micaceous sand 1.20 0.40 1.57 1.72
Silty sand and gravel 0.85 0.14 1.89 1.96
Silty or sandy clay 1.80 0.25 1.56 1.98
Graded silty clay with
gravel or larger 1.00 0.20 1.80 2.13
Well-graded gravel, sand,
silt, and clay 0.70 0.13 1.99 2.25
Clay (30 to 50
percent ,2 lm) 2.40 0.50 1.30 1.82
Colloidal clay (over
50 percent ,2 lm) 12.00 0.60 0.96 1.60
Organic silt 3.00 0.55 1.20 1.75
Organic clay (30 to
50 percent ,2 lm) 4.40 0.70 1.04 1.65
Note: cw ¼ 9.80 kN/m3.
Modified after Kulhawy and Mayne (1990).
Liquefaction Potential of Aqaba, Jordan
Environmental & Engineering Geoscience, Vol. X, No. 4, November 2004, pp. 297–320 303
may be considered very reasonable, based on theprevious discussion of the tectonic setting andthe historical records as well as the most recent PGAattenuation equation by Malkawi and Fahmi (1996).
LIQUIFACTION ANALYTICAL METHOD
A basic method to evaluate liquefaction (called theSimplified Procedure) was first proposed by Seed and
Idriss (1971). This procedure has been revised andupdated by several studies (Seed and Idriss, 1982; Seed etal., 1983, 1984; NRC, 1985; NCEER, 1997; and Youdand Idriss, 2001). The method of evaluating a soil’sability to resist liquefaction, expressed in terms of thecyclic resistance ratio (CRR), is based on the correlationbetween the seismic demand placed on a soil layer,expressed as the cyclic stress ratio (CSR), and thecorrected blow count of standard penetration resistance
Figure 5. (A) Contour of the depth to the water table in meters, derived from modeling the groundwater depth recorded in borehole data. See Figure
14 for detailed location of boreholes. Coordinates in the Palestine Belt Grid. (B) Cross section showing the general groundwater elevation within the
study area (see next page).
Mansoor, Niemi, and Misra
Environmental & Engineering Geoscience, Vol. X, No. 4, November 2004, pp. 297–320304
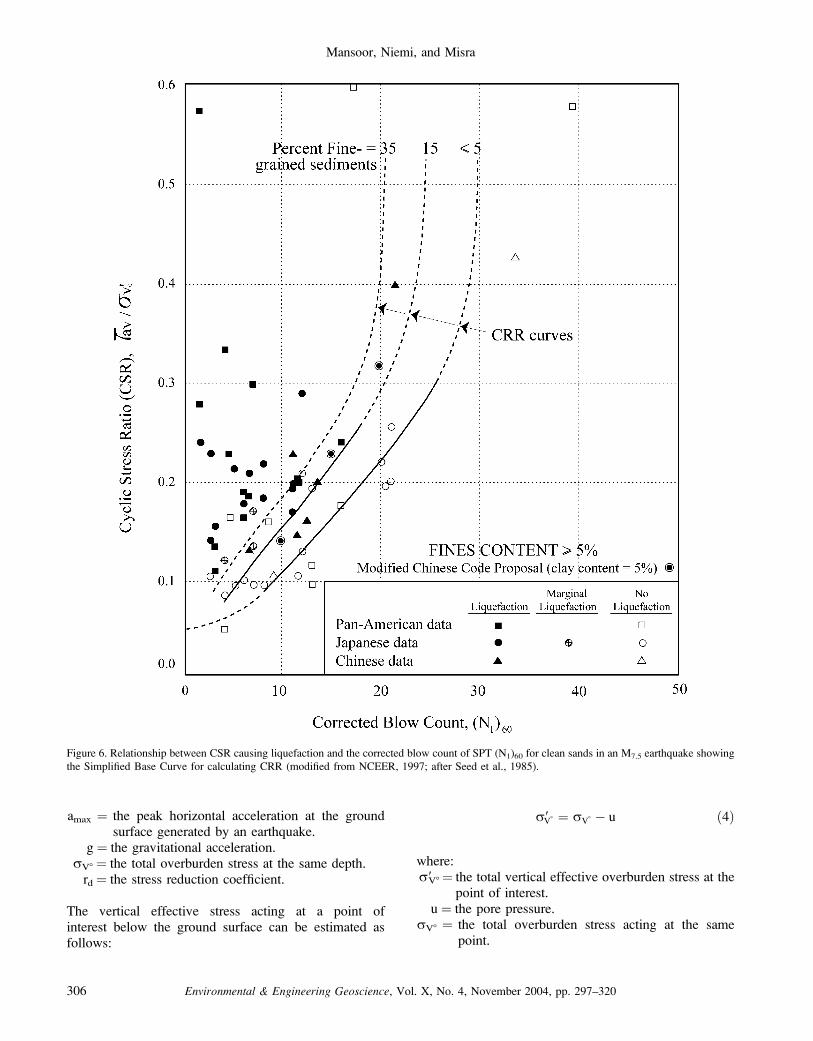
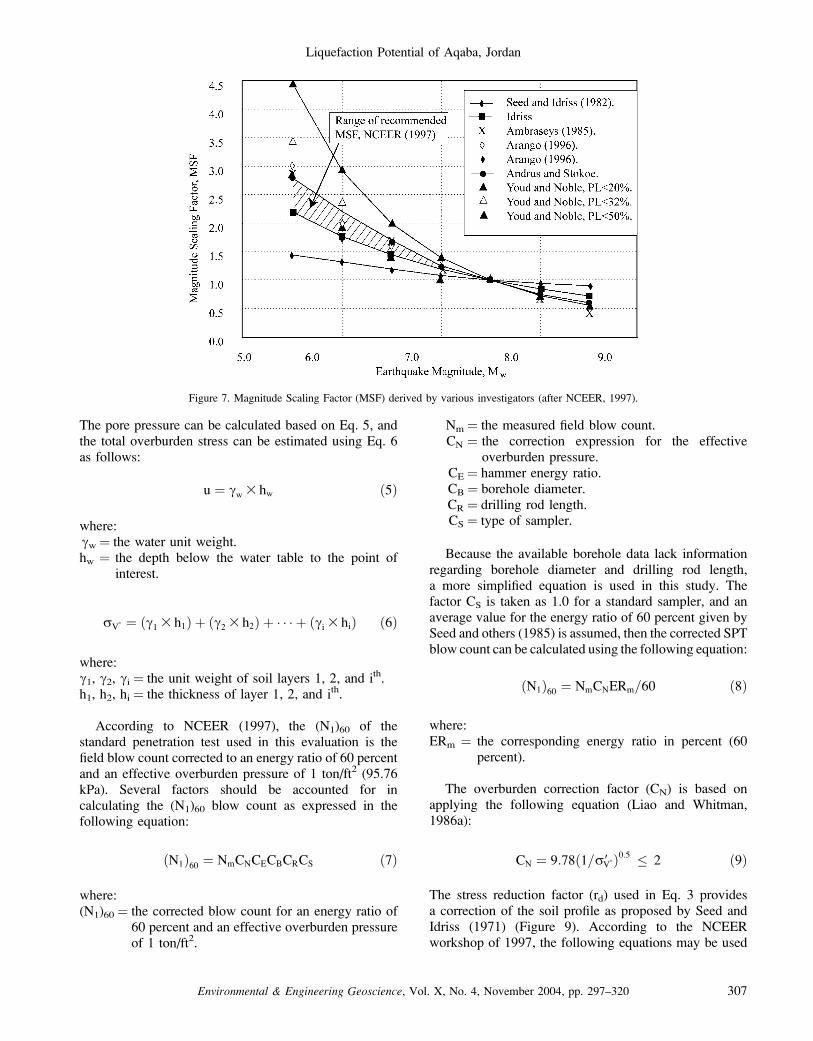
(N1)60. Figure 6 presents the relationship between theCSR causing liquefaction and the (N1)60 values for anearthquake of magnitude 7.5. The plot of the CRR showsthe calculated CSR and (N1)60 data from different siteswhere liquefaction effects were or were not noted fol-lowing major earthquakes, along with the variations infines content (Seed et al., 1984). The curve representedby fine grain-size content less than 5 percent is the basiccriterion for the simplified procedure and is referred to asthe ‘‘simplified base curve.’’ This curve is valid only forearthquakes of magnitude 7.5. A magnitude scalingfactor (MSF) recommended by the National Center ofEarthquake Engineering Research (NCEER, 1997) isused to adjust the CRR7.5 curve to CRR for othermagnitudes as shown in Figure 7 and the followingequation:
MSF ¼ 102:24=M2:56 ð2Þ
On the other hand, Wang (1979) suggested theChinese Criteria method based on observations madeduring strong earthquakes in China between 1966 and1976. This method suggests that the liquefaction potential
of silt and clay is controlled by grain size, water content,and liquid limit. Perlea and others (1999) modified theChinese Criteria (Wang, 1979) based on the differencebetween the soil index properties determined by theChinese standards and the American Society for Testingand Material (ASTM) methods. Their results to delineateliquefaction and non-liquefaction based on the soil indexproperties are presented in Figure 8. The SimplifiedProcedure for liquefaction evaluation and the modifiedChinese Criteria are used in this study to evaluate theliquefaction hazard, taking into account the revisionand the updates, where possible, based on the availabledata.
According to Seed and Idriss (1971), the CSR isexpressed as the ratio of the average shear stress to theinitial vertical effective stress as follows:
CSR ¼ ðs=r9V8Þ ¼ 0:65ðamax=gÞðrV8=r9V8Þrd ð3Þ
where:s¼ the average shear stress in the soil.
r9V8 ¼ the total effective overburden stress at the depthof consideration.
Figure 5. (continued)
Liquefaction Potential of Aqaba, Jordan
Environmental & Engineering Geoscience, Vol. X, No. 4, November 2004, pp. 297–320 305
amax ¼ the peak horizontal acceleration at the groundsurface generated by an earthquake.
g ¼ the gravitational acceleration.rV8 ¼ the total overburden stress at the same depth.rd ¼ the stress reduction coefficient.
The vertical effective stress acting at a point ofinterest below the ground surface can be estimated asfollows:
r9V8 ¼ rV8 � u ð4Þ
where:r9V8¼ the total vertical effective overburden stress at the
point of interest.u ¼ the pore pressure.
rV8 ¼ the total overburden stress acting at the samepoint.
Figure 6. Relationship between CSR causing liquefaction and the corrected blow count of SPT (N1)60 for clean sands in an M7.5 earthquake showing
the Simplified Base Curve for calculating CRR (modified from NCEER, 1997; after Seed et al., 1985).
Mansoor, Niemi, and Misra
Environmental & Engineering Geoscience, Vol. X, No. 4, November 2004, pp. 297–320306
The pore pressure can be calculated based on Eq. 5, andthe total overburden stress can be estimated using Eq. 6as follows:
u ¼ cw 3 hw ð5Þ
where:cw ¼ the water unit weight.hw ¼ the depth below the water table to the point of
interest.
rV8 ¼ ðc1 3 h1Þ þ ðc2 3 h2Þ þ � � � þ ðci 3 hiÞ ð6Þ
where:c1, c2, ci ¼ the unit weight of soil layers 1, 2, and ith.h1, h2, hi ¼ the thickness of layer 1, 2, and ith.
According to NCEER (1997), the (N1)60 of thestandard penetration test used in this evaluation is thefield blow count corrected to an energy ratio of 60 percentand an effective overburden pressure of 1 ton/ft2 (95.76kPa). Several factors should be accounted for incalculating the (N1)60 blow count as expressed in thefollowing equation:
ðN1Þ60 ¼ NmCNCECBCRCS ð7Þ
where:(N1)60 ¼ the corrected blow count for an energy ratio of
60 percent and an effective overburden pressureof 1 ton/ft2.
Nm ¼ the measured field blow count.CN ¼ the correction expression for the effective
overburden pressure.CE ¼ hammer energy ratio.CB ¼ borehole diameter.CR ¼ drilling rod length.CS ¼ type of sampler.
Because the available borehole data lack informationregarding borehole diameter and drilling rod length,a more simplified equation is used in this study. Thefactor CS is taken as 1.0 for a standard sampler, and anaverage value for the energy ratio of 60 percent given bySeed and others (1985) is assumed, then the corrected SPTblow count can be calculated using the following equation:
ðN1Þ60 ¼ NmCNERm=60 ð8Þ
where:ERm ¼ the corresponding energy ratio in percent (60
percent).
The overburden correction factor (CN) is based onapplying the following equation (Liao and Whitman,1986a):
CN ¼ 9:78ð1=r9V8Þ0:5 � 2 ð9Þ
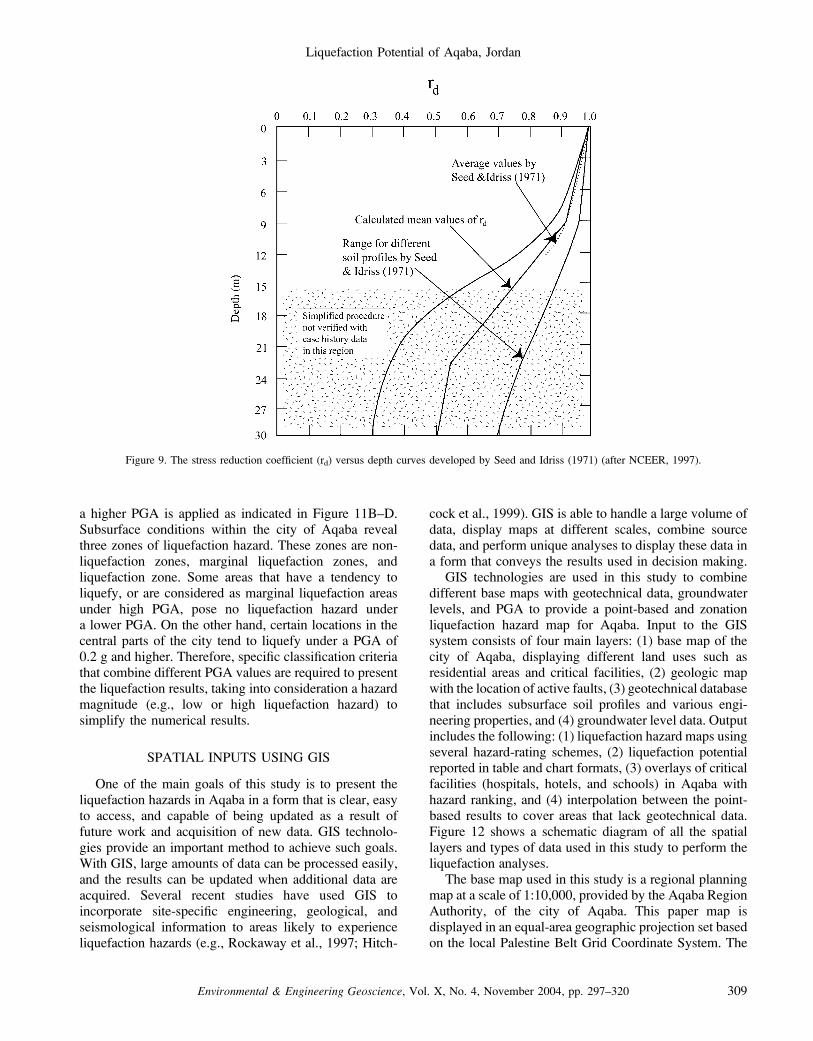
The stress reduction factor (rd) used in Eq. 3 providesa correction of the soil profile as proposed by Seed andIdriss (1971) (Figure 9). According to the NCEERworkshop of 1997, the following equations may be used
Figure 7. Magnitude Scaling Factor (MSF) derived by various investigators (after NCEER, 1997).
Liquefaction Potential of Aqaba, Jordan
Environmental & Engineering Geoscience, Vol. X, No. 4, November 2004, pp. 297–320 307

to estimate the average values of rd, considering the depthbelow the ground surface (Z) as proposed by Liao andWhitman (1986b):
rd ¼ 1:0� 0:00765 Z for Z � 9:15 m ð10Þrd ¼ 1:174� 0:0267 Z for 9:15, Z � 23 m ð11Þ
To plot the results accurately and to calculate the factorof safety against liquefaction initiation, an empiricalequation that represents the ‘‘simplified base curve’’ wasrequired. In this study, the following formula, derived byRobertson and Fear (1995) and recommended by theNCEER, is used to plot the results of the liquefactionanalyses. The equation allows us to compare the CSR andthe CRR7.5 to present the results at a detailed scale wherethe liquefaction hazard can be subdivided along severalboundaries. This equation, according to Robertson andFear (1995), is valid only for (N1)60 less than 30 as follows:
1003CRR7:5
¼ 95=½34� ðN1Þ60� þ ½ðN1Þ60=1:3� � 0:5 ð12Þ
Finally, the factor of safety (FS) against liquefactioninitiation is expressed in the following equation. It takesinto consideration the magnitude scaling factor (MSF)correction as proposed by Seed and Idriss (1982):
FS ¼ ðCRR7:5=CSRÞ MSF ð13Þ
The previous method of analysis using the SimplifiedProcedure and the index soil properties of the modified
Chinese Criteria (Perlea et al., 1999) is simplified by theflow chart presented in Figure 10.
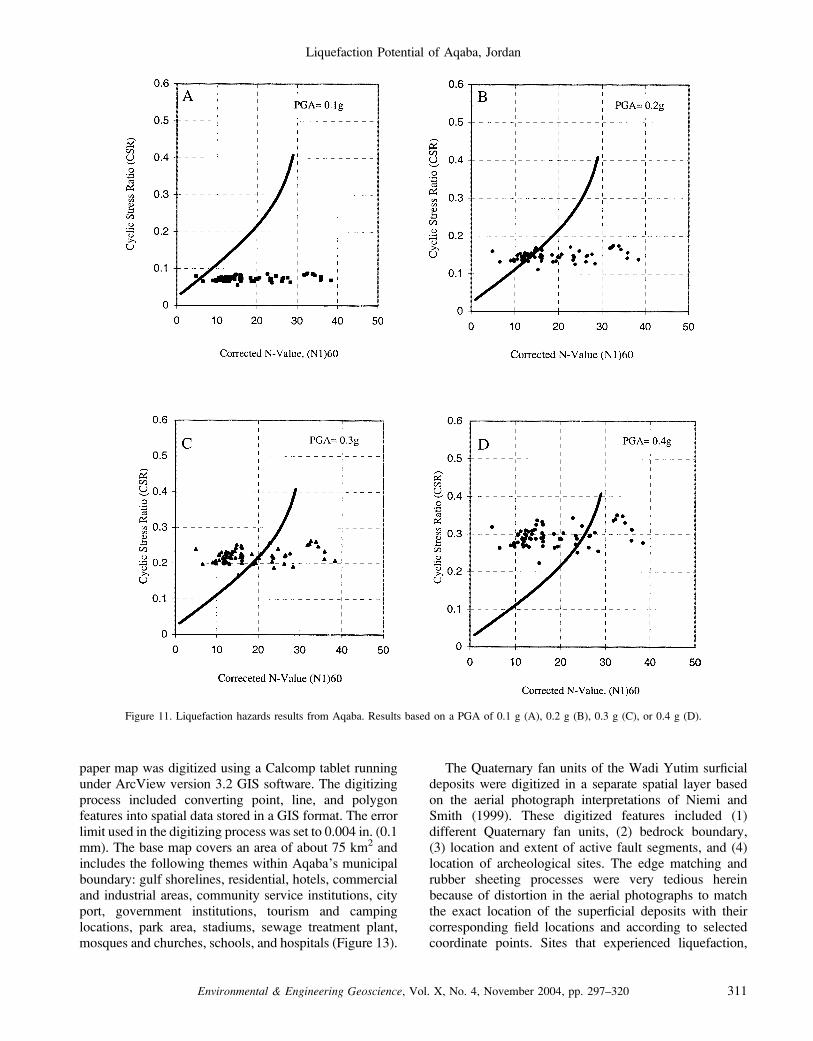
Figure 10 shows how liquefaction hazards data weregenerated. Each soil profile is divided into severalsublayers based on stratigraphic variation and saturationcondition in order to calculate the overburden stressesused in the analysis. For the analyses at each location, thedepth was determined based on the groundwater depthbecause liquefaction cannot be generated under dryconditions. The liquefaction analyses were also basedon applying four different cyclic loading scenarios atPGA equal to 0.1 g, 0.2 g, 0.3 g, and 0.4 g. Laboratorytests carried out on the different cohesive layersencountered at the borehole locations are characterizedby high liquid limit values and low moisture content.These values fall in the non-liquefiable zone based on themodified Chinese Criteria presented in Figure 8. On theother hand, the same layers play a major role in trappingthe excess pore pressure after liquefaction within thecohesionless layers. The results of the liquefaction hazardevaluation, as determined by applying the modifiedSimplified Procedure to the cohesionless layers encoun-tered in all boreholes, are presented in Figure 11 fordifferent values of PGA as point-based values for eachborehole location.
These results lack the spatial distribution of theliquefaction hazard within Aqaba City. To overcome thisproblem, a GIS approach is used to overlay the resultonto a base map as discussed later.
A PGA of 0.1 g reveals only one location that may besusceptible to liquefaction, as shown in Figure 11A, butsignificantly more locations pose a liquefaction hazard if
Figure 8. Chinese Criteria adapted to ASTM definition of index soil properties (after Perlea et al., 1999).
Mansoor, Niemi, and Misra
Environmental & Engineering Geoscience, Vol. X, No. 4, November 2004, pp. 297–320308
a higher PGA is applied as indicated in Figure 11B–D.Subsurface conditions within the city of Aqaba revealthree zones of liquefaction hazard. These zones are non-liquefaction zones, marginal liquefaction zones, andliquefaction zone. Some areas that have a tendency toliquefy, or are considered as marginal liquefaction areasunder high PGA, pose no liquefaction hazard undera lower PGA. On the other hand, certain locations in thecentral parts of the city tend to liquefy under a PGA of0.2 g and higher. Therefore, specific classification criteriathat combine different PGA values are required to presentthe liquefaction results, taking into consideration a hazardmagnitude (e.g., low or high liquefaction hazard) tosimplify the numerical results.
SPATIAL INPUTS USING GIS
One of the main goals of this study is to present theliquefaction hazards in Aqaba in a form that is clear, easyto access, and capable of being updated as a result offuture work and acquisition of new data. GIS technolo-gies provide an important method to achieve such goals.With GIS, large amounts of data can be processed easily,and the results can be updated when additional data areacquired. Several recent studies have used GIS toincorporate site-specific engineering, geological, andseismological information to areas likely to experienceliquefaction hazards (e.g., Rockaway et al., 1997; Hitch-
cock et al., 1999). GIS is able to handle a large volume ofdata, display maps at different scales, combine sourcedata, and perform unique analyses to display these data ina form that conveys the results used in decision making.
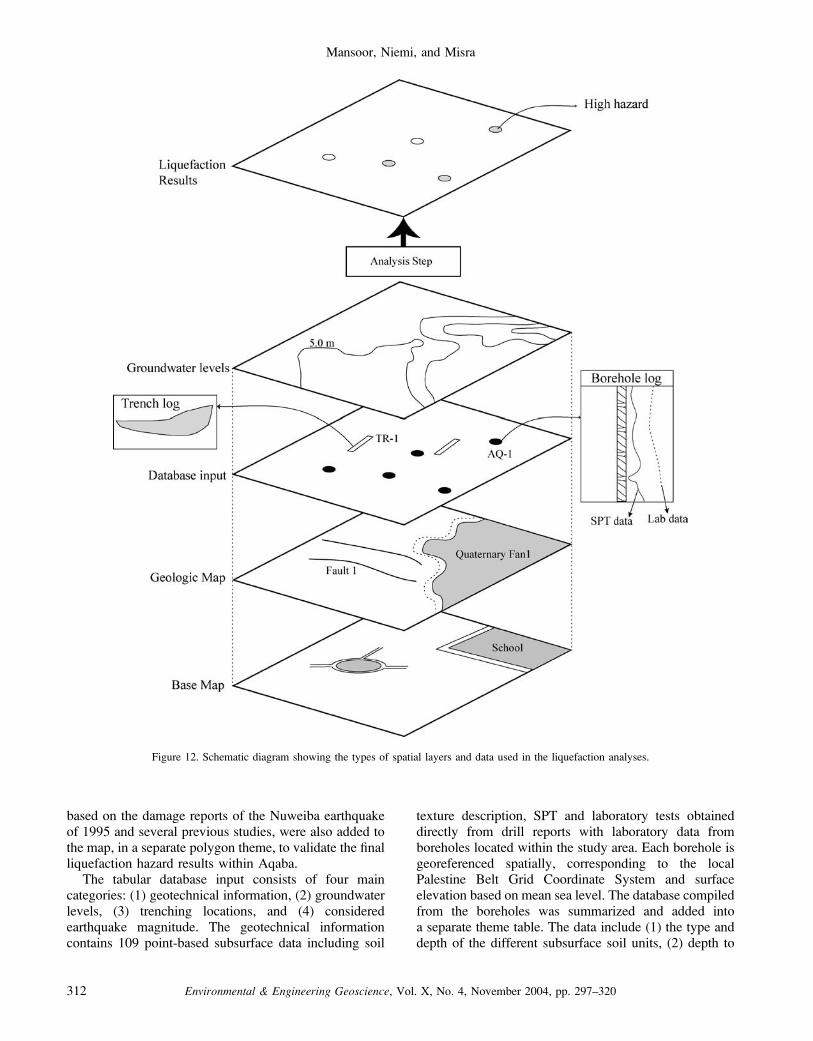
GIS technologies are used in this study to combinedifferent base maps with geotechnical data, groundwaterlevels, and PGA to provide a point-based and zonationliquefaction hazard map for Aqaba. Input to the GISsystem consists of four main layers: (1) base map of thecity of Aqaba, displaying different land uses such asresidential areas and critical facilities, (2) geologic mapwith the location of active faults, (3) geotechnical databasethat includes subsurface soil profiles and various engi-neering properties, and (4) groundwater level data. Outputincludes the following: (1) liquefaction hazard maps usingseveral hazard-rating schemes, (2) liquefaction potentialreported in table and chart formats, (3) overlays of criticalfacilities (hospitals, hotels, and schools) in Aqaba withhazard ranking, and (4) interpolation between the point-based results to cover areas that lack geotechnical data.Figure 12 shows a schematic diagram of all the spatiallayers and types of data used in this study to perform theliquefaction analyses.
The base map used in this study is a regional planningmap at a scale of 1:10,000, provided by the Aqaba RegionAuthority, of the city of Aqaba. This paper map isdisplayed in an equal-area geographic projection set basedon the local Palestine Belt Grid Coordinate System. The
Figure 9. The stress reduction coefficient (rd) versus depth curves developed by Seed and Idriss (1971) (after NCEER, 1997).
Liquefaction Potential of Aqaba, Jordan
Environmental & Engineering Geoscience, Vol. X, No. 4, November 2004, pp. 297–320 309
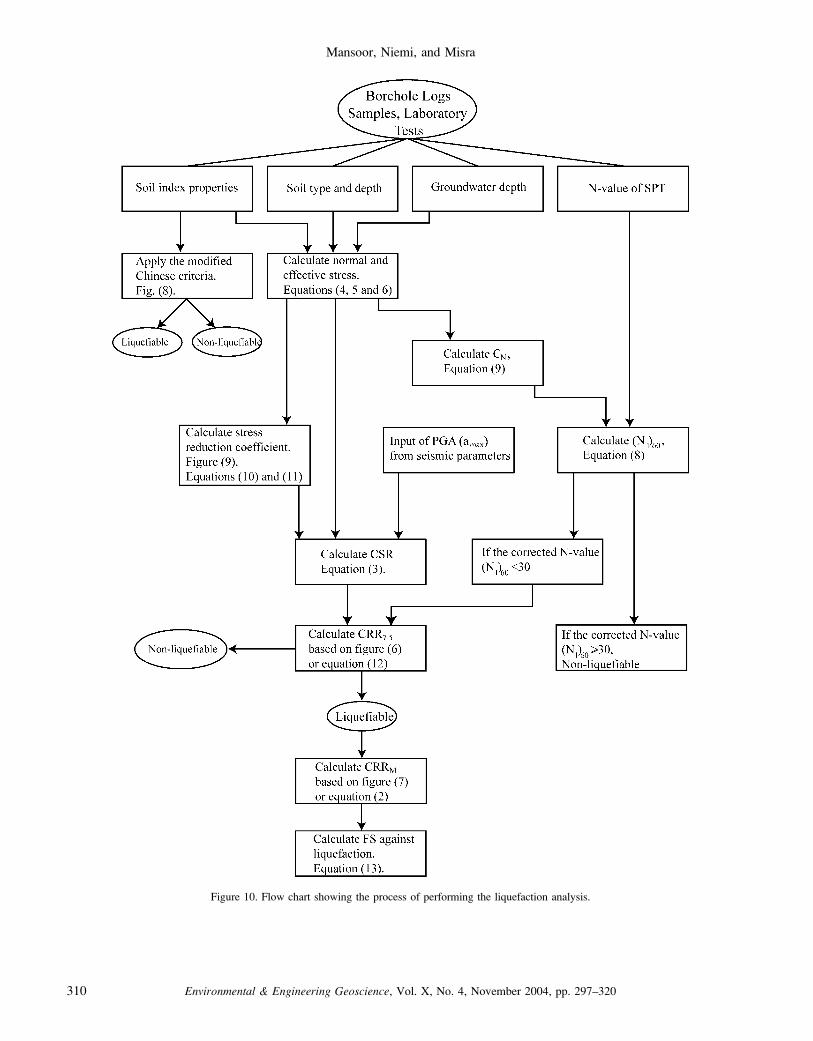
Figure 10. Flow chart showing the process of performing the liquefaction analysis.
Mansoor, Niemi, and Misra
Environmental & Engineering Geoscience, Vol. X, No. 4, November 2004, pp. 297–320310
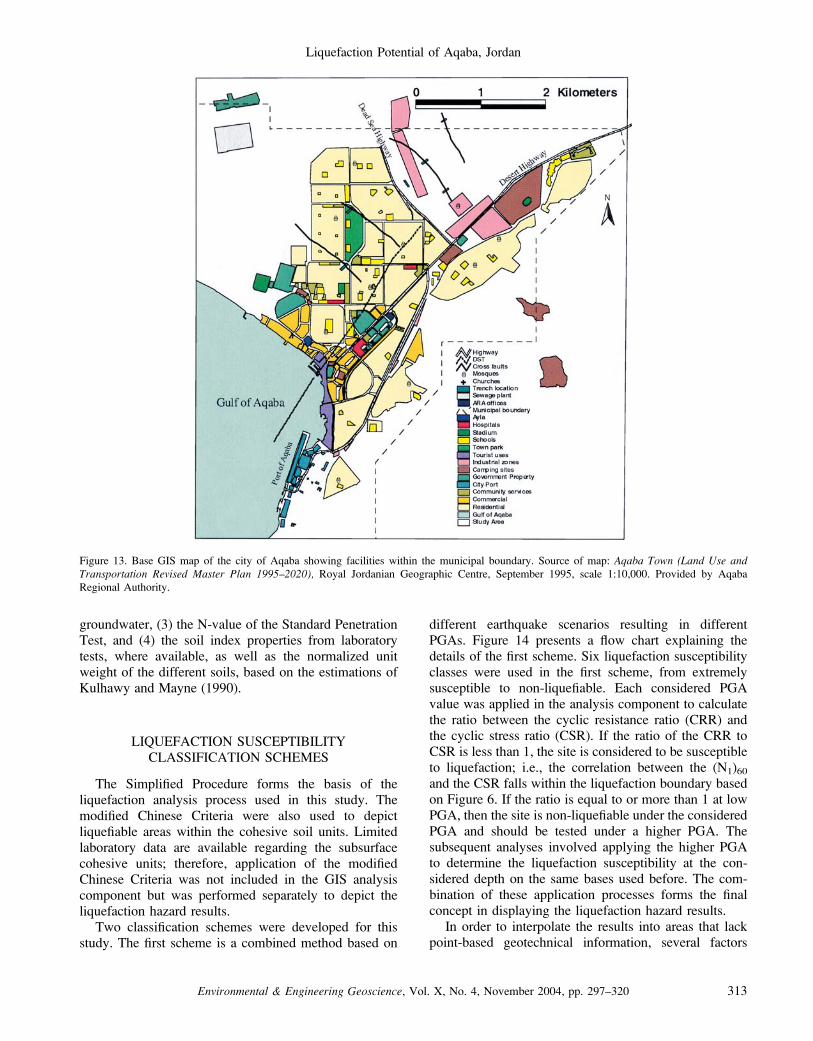
paper map was digitized using a Calcomp tablet runningunder ArcView version 3.2 GIS software. The digitizingprocess included converting point, line, and polygonfeatures into spatial data stored in a GIS format. The errorlimit used in the digitizing process was set to 0.004 in. (0.1mm). The base map covers an area of about 75 km2 andincludes the following themes within Aqaba’s municipalboundary: gulf shorelines, residential, hotels, commercialand industrial areas, community service institutions, cityport, government institutions, tourism and campinglocations, park area, stadiums, sewage treatment plant,mosques and churches, schools, and hospitals (Figure 13).
The Quaternary fan units of the Wadi Yutim surficialdeposits were digitized in a separate spatial layer basedon the aerial photograph interpretations of Niemi andSmith (1999). These digitized features included (1)different Quaternary fan units, (2) bedrock boundary,(3) location and extent of active fault segments, and (4)location of archeological sites. The edge matching andrubber sheeting processes were very tedious hereinbecause of distortion in the aerial photographs to matchthe exact location of the superficial deposits with theircorresponding field locations and according to selectedcoordinate points. Sites that experienced liquefaction,
Figure 11. Liquefaction hazards results from Aqaba. Results based on a PGA of 0.1 g (A), 0.2 g (B), 0.3 g (C), or 0.4 g (D).
Liquefaction Potential of Aqaba, Jordan
Environmental & Engineering Geoscience, Vol. X, No. 4, November 2004, pp. 297–320 311
based on the damage reports of the Nuweiba earthquakeof 1995 and several previous studies, were also added tothe map, in a separate polygon theme, to validate the finalliquefaction hazard results within Aqaba.
The tabular database input consists of four maincategories: (1) geotechnical information, (2) groundwaterlevels, (3) trenching locations, and (4) consideredearthquake magnitude. The geotechnical informationcontains 109 point-based subsurface data including soil
texture description, SPT and laboratory tests obtaineddirectly from drill reports with laboratory data fromboreholes located within the study area. Each borehole isgeoreferenced spatially, corresponding to the localPalestine Belt Grid Coordinate System and surfaceelevation based on mean sea level. The database compiledfrom the boreholes was summarized and added intoa separate theme table. The data include (1) the type anddepth of the different subsurface soil units, (2) depth to
Figure 12. Schematic diagram showing the types of spatial layers and data used in the liquefaction analyses.
Mansoor, Niemi, and Misra
Environmental & Engineering Geoscience, Vol. X, No. 4, November 2004, pp. 297–320312
groundwater, (3) the N-value of the Standard PenetrationTest, and (4) the soil index properties from laboratorytests, where available, as well as the normalized unitweight of the different soils, based on the estimations ofKulhawy and Mayne (1990).
LIQUEFACTION SUSCEPTIBILITYCLASSIFICATION SCHEMES
The Simplified Procedure forms the basis of theliquefaction analysis process used in this study. Themodified Chinese Criteria were also used to depictliquefiable areas within the cohesive soil units. Limitedlaboratory data are available regarding the subsurfacecohesive units; therefore, application of the modifiedChinese Criteria was not included in the GIS analysiscomponent but was performed separately to depict theliquefaction hazard results.
Two classification schemes were developed for thisstudy. The first scheme is a combined method based on
different earthquake scenarios resulting in differentPGAs. Figure 14 presents a flow chart explaining thedetails of the first scheme. Six liquefaction susceptibilityclasses were used in the first scheme, from extremelysusceptible to non-liquefiable. Each considered PGAvalue was applied in the analysis component to calculatethe ratio between the cyclic resistance ratio (CRR) andthe cyclic stress ratio (CSR). If the ratio of the CRR toCSR is less than 1, the site is considered to be susceptibleto liquefaction; i.e., the correlation between the (N1)60and the CSR falls within the liquefaction boundary basedon Figure 6. If the ratio is equal to or more than 1 at lowPGA, then the site is non-liquefiable under the consideredPGA and should be tested under a higher PGA. Thesubsequent analyses involved applying the higher PGAto determine the liquefaction susceptibility at the con-sidered depth on the same bases used before. The com-bination of these application processes forms the finalconcept in displaying the liquefaction hazard results.
In order to interpolate the results into areas that lackpoint-based geotechnical information, several factors
Figure 13. Base GIS map of the city of Aqaba showing facilities within the municipal boundary. Source of map: Aqaba Town (Land Use andTransportation Revised Master Plan 1995–2020), Royal Jordanian Geographic Centre, September 1995, scale 1:10,000. Provided by Aqaba
Regional Authority.
Liquefaction Potential of Aqaba, Jordan
Environmental & Engineering Geoscience, Vol. X, No. 4, November 2004, pp. 297–320 313

should be considered in a classification scheme becausethe geotechnical properties can vary significantly fromone location to another, and, therefore, interpolation andextrapolation may represent false conditions. To over-come this problem, the boundaries between the Quater-nary fan units, the gulf shoreline, and the groundwater
contours were used to set barriers to divide areas that mayrepresent similar subsurface conditions. This interpola-tion process requires a different classification scheme,using a unique PGA value in order to depict theliquefaction susceptibility results under similar condi-tions. Table 3 presents the second classification scheme
Figure 14. Flow chart showing the combined classification scheme used to display the point-based liquefaction hazards.
Mansoor, Niemi, and Misra
Environmental & Engineering Geoscience, Vol. X, No. 4, November 2004, pp. 297–320314

developed for this purpose, in which the ratio between theCRR and the CSR was divided into five different classesbased on considering a PGA of 0.3 g. This classificationscheme was used in displaying the liquefaction hazardand thereafter performing interpolation between these
values to present a hazard zonation map within areas thatrepresent similar subsurface conditions.
The areas that are susceptible to liquefaction wereidentified and displayed using the spatial analyses and theclassification techniques of the GIS. The liquefactionsusceptibility overlays within Aqaba are presented inseveral forms that can be used according to the user’sinterest. The results are presented in four displays asfollows: (1) liquefaction susceptibility overlays based onthe combined classification scheme presented in Figure 15at each borehole location, (2) liquefaction susceptibilitydisplay based on the developed scheme presented in Table3 by applying a PGA of 0.3 g, (3) point-based liquefactionresults with location of the critical facilities, and (4)a liquefaction susceptibility zonation map that interpolates
Table 3. Liquefaction susceptibility classification scheme based onapplying 0.3 g PGA.
FS ¼ CRR/CSR Liquefaction Susceptibility
.1.101 Non-liquefiable
1.000–1.100 Marginal liquefaction
0.801–0.999 Low susceptibility
0.650–0.800 Moderate susceptibility
,0.65 High susceptibility
Figure 15. Point-based liquefaction susceptibility map of the city of Aqaba based on the combined classification scale. Locations of all boreholes are
shown.
Liquefaction Potential of Aqaba, Jordan
Environmental & Engineering Geoscience, Vol. X, No. 4, November 2004, pp. 297–320 315

the point-based hazard results into other areas that mayhave similar subsurface conditions. Each of these mapscan be presented at a smaller scale to display liquefactionsusceptibility within a limited area for design consider-ations. The data can also be represented in tables, charts,and reports. This is accomplished by selecting a specificarea with known coordinates or within a specific facilityor geologic theme. These reports and charts providenumerical values of the liquefaction hazards and thesubsurface conditions at each location used in the variousdesign calculations and the settlement considerations.
The point-based liquefaction susceptibility resultsbased on applying the developed classification schemeare presented in Figure 15. The analyses show that most ofthe considered boreholes along the gulf shoreline are
characterized mainly by moderate to high susceptibility.The same result of mostly moderate to high susceptibilityis also found based on applying a PGA of 0.3 g as shownin Figure 16. In order to get a clear idea about specificstructures and facilities that are likely to be affected byliquefaction within Aqaba, only critical facilities in-cluding hospitals, schools, and the high-rise buildingsrepresented by hotels and commercial structures wereextracted from the base map and overlaid on the point-based liquefaction susceptibility hazard map, as shown inFigure 17. The map shows that hospitals and schools arelocated within areas not susceptible to liquefaction butthat the hotel and the commercial district lie within a highliquefaction hazard zone and should be reconsidered froma design point of view.
Figure 16. Point-based liquefaction susceptibility map of the city of Aqaba based on a PGA of 0.3 g.
Mansoor, Niemi, and Misra
Environmental & Engineering Geoscience, Vol. X, No. 4, November 2004, pp. 297–320316
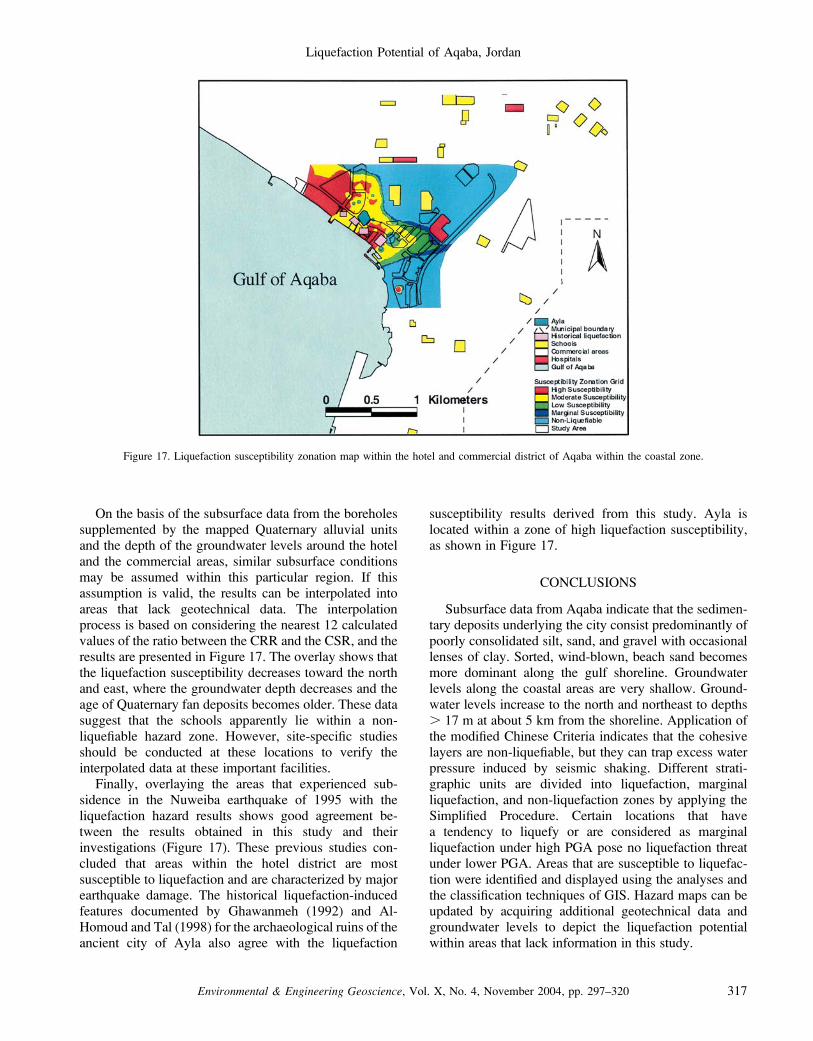
On the basis of the subsurface data from the boreholessupplemented by the mapped Quaternary alluvial unitsand the depth of the groundwater levels around the hoteland the commercial areas, similar subsurface conditionsmay be assumed within this particular region. If thisassumption is valid, the results can be interpolated intoareas that lack geotechnical data. The interpolationprocess is based on considering the nearest 12 calculatedvalues of the ratio between the CRR and the CSR, and theresults are presented in Figure 17. The overlay shows thatthe liquefaction susceptibility decreases toward the northand east, where the groundwater depth decreases and theage of Quaternary fan deposits becomes older. These datasuggest that the schools apparently lie within a non-liquefiable hazard zone. However, site-specific studiesshould be conducted at these locations to verify theinterpolated data at these important facilities.
Finally, overlaying the areas that experienced sub-sidence in the Nuweiba earthquake of 1995 with theliquefaction hazard results shows good agreement be-tween the results obtained in this study and theirinvestigations (Figure 17). These previous studies con-cluded that areas within the hotel district are mostsusceptible to liquefaction and are characterized by majorearthquake damage. The historical liquefaction-inducedfeatures documented by Ghawanmeh (1992) and Al-Homoud and Tal (1998) for the archaeological ruins of theancient city of Ayla also agree with the liquefaction
susceptibility results derived from this study. Ayla islocated within a zone of high liquefaction susceptibility,as shown in Figure 17.
CONCLUSIONS
Subsurface data from Aqaba indicate that the sedimen-tary deposits underlying the city consist predominantly ofpoorly consolidated silt, sand, and gravel with occasionallenses of clay. Sorted, wind-blown, beach sand becomesmore dominant along the gulf shoreline. Groundwaterlevels along the coastal areas are very shallow. Ground-water levels increase to the north and northeast to depths. 17 m at about 5 km from the shoreline. Application ofthe modified Chinese Criteria indicates that the cohesivelayers are non-liquefiable, but they can trap excess waterpressure induced by seismic shaking. Different strati-graphic units are divided into liquefaction, marginalliquefaction, and non-liquefaction zones by applying theSimplified Procedure. Certain locations that havea tendency to liquefy or are considered as marginalliquefaction under high PGA pose no liquefaction threatunder lower PGA. Areas that are susceptible to liquefac-tion were identified and displayed using the analyses andthe classification techniques of GIS. Hazard maps can beupdated by acquiring additional geotechnical data andgroundwater levels to depict the liquefaction potentialwithin areas that lack information in this study.
Figure 17. Liquefaction susceptibility zonation map within the hotel and commercial district of Aqaba within the coastal zone.
Liquefaction Potential of Aqaba, Jordan
Environmental & Engineering Geoscience, Vol. X, No. 4, November 2004, pp. 297–320 317
Most of the soils considered, as represented inboreholes along the gulf shoreline, are characterizedmainly by moderate to high susceptibility, in agreementwith the conclusions of Malkawi and others (1999a). Thesoils represented in boreholes located to the north andnortheast, within the older Quaternary alluvial fandeposits, are predominantly non-liquefiable. The criticalfacilities extracted from the base map of Aqaba wereoverlaid with the liquefaction potential. These maps showthat the hospital and the schools apparently are locatedwithin areas not susceptible to liquefaction. However,these sites should be verified with site-specific inves-tigations. The hotels and the commercial district lie withina high-liquefaction-hazard zone. Overlaying the liquefac-tion susceptibly maps derived from this study with theareas that had documented damage in the 1995 Nuweibaearthquake, and the historically-documented liquefaction-induced features in the archaeological ruins show a goodagreement between the results of this study and thedamage assessment reports.
Further geotechnical exploration is required along thegulf shorelines north of the hotel district and within theport location to get a comprehensive understanding aboutthe liquefaction hazards within these locations. Theadditional data could be incorporated simply in the GIStechniques used for this study. We strongly recommendthat the Jordanian National Building Codes requirereconsidering or updates of their provisions relevant tothe seismic conditions for the city of Aqaba as well asenforcement of those new regulations and improvementof engineering construction practices. We recommendcareful evaluation of the existing structures to find outwhether or not they are capable of withstanding theseismic hazard and performing a comprehensive seismicretrofit process where required, if possible. The sub-surface stratigraphy should be considered carefully toperform interpolation between the point-based results toextend the liquefaction hazard maps to areas that lackgeotechnical information and must be used as a pre-liminary or a supplementary parameter for designpurposes.
ACKNOWLEDGMENTS
The authors are indebted to the staff of the AqabaSpecial Economic Zone (Aqaba Region Authority),especially Engineer Mohammad Balqar, for help andsupport during three seasons of field investigations. Wealso thank the Natural Resources Authority and EngineerMahmoud Azzam for providing most of the geotechnicaldata. A very grateful thanks to Dr. Abdallah HuseinMalkawi of the Jordan University of Science andTechnology for his assistance and support. GIS analyseswere carried out in the research laboratory of Dr. Wei Ji of
the University of Missouri-Kansas City. Funding for thisproject was made possible through an American Associ-ation of PetroleumGeologists Grant-in-Aid of Research toN. M. Mansoor. We are extremely grateful to Dr. S.Thomas Parker, director of the North Carolina StateUniversity’s Roman Aqaba Project archaeological exca-vation, for providing room and board and other logisticsupport during field research for this project.
REFERENCES
ALAMIRI, A. M., 1991, Seismicity and aeromagnetic features of the
Gulf of Aqaba (Elat) region: Journal Geophysical Research, Vol.96, pp. 20179–20185.
AL-HOMOUD, A. S. AND TAL, A. B., 1998, Geotechnical study for
evaluating stability and restoration work at the 1,000 year old
archaeological site of Ayla, Gulf of Aqaba, Kingdom of Jordan:
Environmental Engineering Geoscience, Vol. 4, pp. 103–114.AL-TARAZI, E., 2000, The major Gulf of Aqaba earthquake, 22
November 1995–Maximum intensity distribution: Natural Haz-ards, Vol. 22, pp. 17–27.
AMBRASEYS, N. N.; MELVILLE, C. P.; AND ADAMS, R. D., 1994, TheSeismicity of Egypt, Arabia and the Red Sea, a Historical Review:Cambridge University Press, Cambridge, UK, 181 pp.
AMBRASEYS, N. N. AND MELVILLE, C. P., 1989, Evidence for intraplate
earthquake in northwest Arabia: Bulletin Seismological SocietyAmerica, Vol. 79, pp. 1279–1281.
AMRAT, A., 1996, Empirical Relations Characterizing EarthquakeGround Motion Attenuation in Jordan, Jordan Seismological
Observatory, Seismology Division, Amman, Jordan, 28 p.
BAER, G.; SANDWELL, D.; WILLIAMS, S.; AND BOCK, Y., 1999,
Coseismic deformation associated with the November 1995,
MW¼ 7.1 Nuweiba earthquake, Gulf of Elat (Aqaba), detected by
synthetic aperture radar interferometry: Journal GeophysicalResearch, Vol. 104, No. B11, pp. 25221–25232.
BEN-AVRAHAM, Z., 1985, Structural framework of the Gulf of Elat
(Aqaba): Journal Geophysical Research, Vol. 90, pp. 703–726.CALIFORNIA DIVISION OF MINES AND GEOLOGY, 1975, Recommended
guidelines for determining the maximum credible and the
maximum probable earthquakes: Special Report 2/75, CDMG
note 43.
DZIEWONSKI, A. M.; EKSTROM, G.; AND SALGANIK, M. P., 1994,
Centroid-moment tensor solutions for July–September 1993:
Physics Earth Planetary International, Vol. 83, pp. 165–174.DZIEWONSKI, A. M.; EKSTROM, G.; AND SALGANIK, M. P., 1997,
Centroid-moment tensor solutions for October–December 1995:
Physics Earth Planetary International, Vol. 101, pp. 1–12.EL-ISA, Z. H.; MERGHELANI, H. M.; AND BAZZARI, M. A., 1984, The
Gulf of Aqaba earthquake swarm of 1983 January–April: JournalGeophysical Research, Vol. 78, pp. 711–722.
FAHMI, K. J. AND MALKAWI, A. H., 1998, Dynamic site response
evaluation of the port city of Aqaba (Jordan) employing the
equivalent linear method: Canadian Geotechnical Journal, Vol.35, pp. 961–975.
FAHMI, K. J.; MALKAWI, A. H.; AND AL-ZOUBI, O. Y., 1996, Seismic
engineering ground motion maps for Jordan employing local
attenuation relations: Environmental Engineering Geoscience,Vol. 2, No. 1, pp. 23–33.
GARFUNKEL, Z., 1970, The Tectonics of the Western Margins of theSouthern Arava: Ph.D. Thesis, Hebrew University, Jerusalem,
204 pp. (in Hebrew, English abstract).
Mansoor, Niemi, and Misra
Environmental & Engineering Geoscience, Vol. X, No. 4, November 2004, pp. 297–320318

GARFUNKEL, Z. AND BEN-AVRAHAM, Z., 1996, The structure of the Dead
Sea basin: Tectonophysics, Vol. 266, pp. 155–176.GHAWANMEH, Y. H., 1992, Earthquake Effects on Bilad Ash-Sham
Settlements, Studies in History and Archaeology of Jordan,IV, S. Tell (Editor), Annals of the Department of Antiquities,
Amman, Jordan, pp. 53–59.
HITCHCOCK, C. S.; RALPH, C. L.; AND HAYDON, W. D., 1999, Mapping
liquefaction hazard in Simi Valley, Ventura County, California:
Environmental Engineering Geoscience, Vol. 5, No. 4, pp.
441–458.
HOFSTETTER, A.; THIO, H. K.; AND SHAMIR, G., 2003, Source
mechanism of the 22/11/1995 Gulf of Aqaba earthquake and its
aftershock sequence: Journal Seismology, Vol. 7, pp. 99–114.KLINGER, Y.; AVOUAC, J. P.; ABOU KARAKI, N.; DORBATH, L.; BOURLES,
D.; AND REYSS, J. L. 2000, Slip rate on the Dead Sea transform
faulting northern Araba valley (Jordan): Geophysical JournalInternational, Vol. 142, pp. 755–768.
KLINGER, Y.; RIVERA, L.; HAESSLER, H.; AND MAURIN, J., 1999, Active
faulting in the Gulf of Aqaba: new knowledge from the MW 7.3
earthquake of 22 November, 1995: Bulletin Seismological SocietyAmerica, Vol. 89, pp. 1025–1036.
KRAMER, S. L., 1996, Geotechnical Earthquake Engineering: PrenticeHall, Upper Saddle River, NJ, 653 p.
KULHAWY, F. H. AND MAYNE, P. W., 1990, Manual on Estimating SoilProperties for Foundations Design: Report EL-6800, Electric
Power Research Institute, Palo Alto, CA.
LIAO, S. S. AND WHITMAN, R. V., 1986a. Overburden correction factors
for SPT in sand: Journal Geotechnical Engineering, Vol. 112,No. 3, pp. 373–377.
LIAO, S. S. AND WHITMAN, R. V., 1986b. Catalogue of a Liquefactionand Non-Liquefaction Occurrences During Earthquakes: Re-
search report, Department of Civil Engineering, Massachusetts
Institute of Technology, Cambridge, MA.
MALKAWI, A. H., 1997, Assessment of Liquefaction Potential andEvaluation of Settlement in Sands Due to Earthquake Shaking atAqaba Bridge Proposed Hotel: Technical report, Arab Center for
Engineering Studies, Jordan, 95 pp.
MALKAWI, A. H. AND ALAWNEH, A. S., 1999a, Dynamic Site ResponseEvaluation for the Chimney Located Near the Fertilizer Plant(Aqaba City): Research report, Civil Engineering Department,
Jordan University of Science and Technology, Irbid, Jordan, 25
pp.
MALKAWI, A. H.; ABDULLA, F.; BARAKAT, S.; AND AL-SHERIADEH, M.,
1999b, Application of extreme value statistics to annual maxi-
mum magnitudes in Jordan employing a mixture distribution:
Earthquake Spectra, Vol. 15, No. 4, pp. 711–724.MALKAWI, A. H.; NUMAYR, K. S.; AND BARAKAT, A. B., 1999c. The
Aqaba earthquake of November 22, 1995: Earthquake Spectra,Vol. 15, No. 3, pp. 397–415.
MALKAWI, A. H.; NUMAYR, K. S.; AND BARAKAT, A. B., 1997, TheAqaba Earthquake of November 22, 1995, Preliminary Re-connaissance Report: Jordan University of Science and Tech-
nology Special Publication, 45 pp.
MALKAWI, A. H. AND FAHMI, K. J., 1996, Locally derived earthquake
ground motion attenuation relations for Jordan and conterminous
areas: Quarterly Journal Engineering Geology, Vol. 29, pp.
309–319.
MALKAWI, A. H.; AL-HOMOUD, A.; AND LIANG, R. Y., 1995, Seismic
hazard mapping of Jordan: Quarterly Journal EngineeringGeology, Vol. 28, pp. 75–81.
MANSOOR, N. M., 2002, A GIS-Based Assessment of Active Faults andLiquefaction Potential of the City of Aqaba, Jordan: M.S. Thesis,
University of Missouri-Kansas City, Department of Geosciences,
258 p.
NATIONAL CENTER OF EARTHQUAKE ENGINEERING RESEARCH (NCEER),
1997, Proceedings of the NCEER Workshop on Evaluation ofLiquefaction Resistance of Soils: Technical report, Multidisci-
plinary Center for Earthquake Engineering Research, 40 p.
NATIONAL RESEARCH COUNCIL (NRC), 1985, Liquefaction of SoilsDuring Earthquakes: National Academy Press,Washington, D. C.
NIEMI, T. M. AND SMITH, A. M., 1999, Initial results of the southern
Wadi Araba, Jordan geoarchaeological study: Implications for
shifts in late Quaternary aridity: Geoarchaeology, Vol. 14, No. 8pp. 791–820.
NIEMI, T. M.; ZHANG, H.; ATALLAH, M.; AND HARRISON, B., 2001, Late
Pleistocene and Holocene slip rate of the northern Wadi Araba
fault, Dead Sea Transform, Jordan: Journal Seismology, Vol. 4,pp. 449–474.
OBERMEIER, S. F. AND POND, E. C., 1999, Issues in using liquefaction
features for paleoseismic analysis: Seismological ResearchLetters, Vol. 70, No. 1, pp. 34–58.
PARKER, S. T., 1999, Brief notice on a possible early 4th century
earthquake at Aqaba, Jordan: Journal Roman Archaeology, Vol.12, pp. 372–376.
PECK, R. B.; HANSEN, W. E.; AND THORNBURN, T. H., 1974, FoundationEngineering: John Wiley and Sons, Inc., New York, 514 pp.
PERLEA, V. G.; KOESTER, J. P.; AND PRAKASH, S., 1999, How liquefiable
are cohesive soils? Proceedings 2nd International Conference onEarthquake Geotechnical Engineering, Lisbon, Portugal, Vol. 2,pp. 611–618.
PINAR, A. AND TURKELLI, N., 1997, Source inversion of the 1993 and
1995 Gulf of Aqaba earthquakes: Tectonophysics, Vol. 283, pp.279–288.
RABBINOWITZ, N. AND STEINBERG, D. M., 1998, Aftershock decay of
three recent strong earthquakes in the Levant: Bulletin SeismologySociety America, Vol. 88, pp. 1580–1587.
ROBERTSON P. K. AND FEAR, C. E., 1995, Liquefaction of sands and its
evaluation. Proceedings, 1st International Conference on Earth-quake Geotechnical Engineering, Keynote lecture, Tokyo, Japan.
ROCKAWAY, T. D.; FROST, J. D.; EGGERT, D. L.; AND LUNA, R., 1997,
Spatial earthquake hazard assessment of Evansville, Indiana:
Seismological Research Letters, Vol. 68, No. 4, pp. 675–688.ROYAL JORDANIAN GEOGRAPHIC CENTER, 1995, Landuse map of the
City of Aqaba, 1:10,000.
SAFFARINI, J. S. AND KABALAWI, H., 1999, Design response spectra for
Aqaba City-Jordan: Earthquake Engineering Structural Dynam-ics, Vol. 28, pp. 725–739.
SEED, H. B., 1979, Soil liquefaction and cyclic mobility evaluation for
level ground during earthquakes: Journal Geotechnical Engi-neering, Vol. 105, No. GT2, pp. 201–255.
SEED, H. B. AND IDRISS, I. M., 1971, Simplified procedure for
evaluating soil liquefaction potential: Journal Soil MechanicsFoundations Division, Vol. 97, No. SM9, pp. 1249–1273.
SEED, H. B. AND IDRISS, I. M., 1982, Ground Motion and SoilLiquefaction During Earthquakes: Earthquake Engineering Re-
search Institute, Berkeley, CA.
SEED, H. B.; IDRISS, I. M.; AND ARANGO, I., 1983, Evaluation of
liquefaction potential using field performance data: JournalGeotechnical Engineering, Vol. 109, No. 3, pp. 458–482.
SEED, H. B.; TOKIMATSU, K.; AND HARDER, L. F., 1984, The Influence ofSPT Procedure in Soil Liquefaction Resistance Evaluation:Report,UCB/EERC-84-15, University of California, Berkeley, CA.
SEED, H. B.; TOKIMATSU, K.; HARDER, L. F.; AND CHUNG, R. M., 1985,
The influence of SPT procedure in soil liquefaction resistance
evaluation: Journal Geotechnical Engineering, Vol. 111, No. 12,pp. 1425–1445.
SLATER, L. AND NIEMI, T. M., 2003, Detection of active faults along the
Dead Sea Transform using ground penetrating radar and
implications for seismic hazards within the city of Aqaba, Jordan:
Tectonophysics, Vol. 368, pp. 33–50.
Liquefaction Potential of Aqaba, Jordan
Environmental & Engineering Geoscience, Vol. X, No. 4, November 2004, pp. 297–320 319
STOKOE, K. H. II; ROESSET, J. M.; BIERSCHWALE, J. G.; AND AOOUAD,
M., 1988, Liquefaction potential of sands from shear wave
velocity: Proceedings, 9th World Conference on EarthquakeEngineering, Tokyo, Japan, Vol. 3, pp. 213–218.
TEN BRINK, U. S.; RYBAKOV, M.; AL-ZOUBI, A.; HASSOUNEH, M.;
FRIESLANDER, U.; BATAYNEH, A.; GOLDSCHMIDT, V.; DAUD, M.;
ROTSTEIN, Y.; AND HALL, J., 1999, Anatomy of the Dead Sea
transform: Does it reflect continuous change in plate motion?
Geology, Vol. 27, No. 10, pp. 887–890.WHITCOMB, D., 1994, Ayla: Art and Industry in the Islamic Port of
Aqaba: Special Publications, Oriental Institute, University of
Chicago, Chicago, IL, 32 p.
WANG, W., 1979, Some Findings in Soil Liquefaction: Water
Conservation and Hydroelectric Power Scientific Research
Institute Report, Beijing, China, pp. 1–17.
WUST, H., 1997, The November 22, 1995, Nuweiba Earthquake, Gulfof Elat (Aqaba): Post Seismic Analysis of Failure Features and
Seismic Hazard Implications: Geological Survey of Israel, Report
GSI 3-97, Jerusalem, Israel.
YOUD, T. L., 1973, Liquefaction. Flow and Associated Ground
Failure: U.S. Geological Survey Circular 688, 12 p.
YOUD, T. L. AND IDRISS, I. M., 1997, Proceedings of the NCEER
Workshop on Evaluation of Liquefaction Resistance of Soils:
Technical report, NCEER-97-0022.
YOUD, T. L. AND IDRISS, I. M., 2001, Liquefaction resistance of soils:
summary report from the 1996 NCEER and 1998 NCEER/NSF
workshops on evaluation of liquefaction resistance of soils:
Journal Geotechnical Geo-environmental Engineering, ASCE,
Vol. 127, No. 10, pp. 297–313.
ZHANG, H., 1998, Late Pleistocene and Holocene Slip Rate of
the Northern Wadi Araba Fault, Dead Sea Transform,
Jordan: Master’s thesis, University of Missouri-Kansas City,
128 p.
Mansoor, Niemi, and Misra
Environmental & Engineering Geoscience, Vol. X, No. 4, November 2004, pp. 297–320320