Embed Size (px)
Citation preview

David Spring April 2008 Addendum Page 1 of 34
April 2008 Addendum to Analysis of Child Support Issues
Determining an Equitable Residential Credit Comparing the Betson Multiplier Method to the Traditional Cross Credit Method
Submitted to the 2007-2008 Washington State Child Support Work Group
Prepared by David Spring M Ed Educational Psychology and Human Development
University of Washington And
2007 Washington State Child Support Work Group Shared Parenting Representative
April 20 2008
David Spring April 2008 Addendum Page 2 of 34
Table of Contents PAGE
Section One EXECUTIVE SUMMARYhelliphelliphelliphelliphelliphelliphelliphelliphelliphelliphelliphelliphelliphelliphelliphelliphellip 3 Section Two Hidden Assumptions and Drawbacks of the Betson Multiplier Methodhelliphelliphelliphelliphelliphelliphelliphelliphelliphelliphelliphelliphelliphelliphelliphelliphelliphelliphelliphelliphellip hellip 4 Section Three Comparing the Betson Multiplier Method to the Traditional Cross Credit methodhelliphelliphelliphelliphelliphelliphelliphelliphelliphelliphelliphelliphellip14 Section Four Equitable Division of the Child Tax Credithelliphelliphelliphelliphellip helliphelliphelliphellip 22 Section Five Additional studies on the benefits of shared parenting and residential credits in improving child developmenthelliphelliphelliphelliphelliphelliphelliphelliphelliphelliphellip 23 Section Six Determining the amount the median lower time parent Has been overcharged helliphelliphelliphelliphelliphelliphelliphelliphelliphelliphelliphelliphelliphelliphelliphelliphelliphelliphelliphelliphelliphelliphelliphelliphelliphellip 26 Section Seven Shortcomings of the USDA Per Capita Methodhelliphellip helliphelliphelliphelliphelliphellip 28 Section Eight Conclusion What is in the best interest of the child helliphelliphelliphelliphelliphelliphellip 32 REFERENCEShelliphelliphelliphelliphelliphelliphelliphelliphelliphelliphelliphelliphelliphelliphelliphelliphelliphelliphelliphelliphelliphelliphelliphelliphelliphelliphelliphelliphelliphellip 34
David Spring April 2008 Addendum Page 3 of 34 Section One Executive Summary One of the most important decisions faced by the Washington State Child Support Work Group is the method for determining the amount of the residential credit There were only two options which received support during the sub-committee discussions of this issue The first option is the traditional cross credit approach which has been used here in Washington State for over 30 years without objection The second method is a relatively new ldquograduated multiplierrdquo method advocated by Dr Betson The purpose of this April Addendum is to compare these two methods so that Work Group members will have a clear understanding of how they are different Section Two summarizes the hidden assumptions and drawbacks of the Betson multiplier method The most troubling of these is the hidden assumption that parents will be able to increase their combined income by 50 after divorce This is rarely the case Thus the Betson multiplier method is really an attack on shared parenting and is thus not in the best interest of the childrsquos emotional development By contrast the traditional cross credit method does not assume any increase in parental income after divorce Section Three presents charts comparing the two methods in 8 different situations four where total income and thus the total obligation is divided 50-50 and four in which the total income is divided 40-60 These charts confirm that the Betson multiplier method never results in an equitable division of child rearing costs on a per day basis It is thus contrary to Washington State law (RCW 26190001) which requires an equitable division of the total obligation on a per day basis By contrast the traditional cross credit method always results in an equitable division of the total obligation on a per day basis Section Four provides a method for adding an equitable division of the child tax credit This credit is about $180 per month or about $6 per day This is about 25 of the median Combined Monthly Obligation This section provides a chart for equitable division of this credit when a child spends more than 20 of the time at the lower time parentrsquos home Section Five summarizes additional research on the benefits of residential credits and shared parenting to a childrsquos emotional development and the harmful effects of relocation on a childrsquos emotional development This research not only supports the need for a residential credit but also the need for retention of the residential credit even if the higher time parent attempts to relocate the child away from the lower time parent Section Six calculates the amount that lower time parents are overcharged under the current system and under the Betson system This Addendum confirms that the failure to provide a residential credit results in the lower time parent being ldquodouble-chargedrdquo for any time they spend caring for the child This is contrary to both the ldquoequitablerdquo requirement in the Child Support Act and the ldquofoster the childrsquos relationship with both parentsrdquo requirement of the Parenting Act Sterling (2003) concluded that residential credits are awarded in Washington State in only 4 of the cases This Addendum recommends retention of the traditional cross credit method for calculating the amount of the credit and lowering the threshold to 20 for determining the availability of the credit This change would result in a residential credit in about 50 of all cases and would bring child support awards more closely aligned to the primary intentions of the Washington State Child Support Act and the Washington State Parenting Act
David Spring April 2008 Addendum Page 4 of 34 Section Two Hidden Assumptions and Drawbacks of the Betson multiplier method
This section is offered as a critique of Dr Betsonrsquos Indiana Residential Credit Report1 and also of his latest Residential Credit Washington State Report 2
I The Economic Table Does Not Assume the Child Resides with only one parent
Dr Betson begins his latest report with ldquoa declaration of goals and objectivesrdquo His first assumption is that ldquoThe Economic Table (Basic Child Support Obligation) assumes the child resides with one parentrdquo This of course is in keeping with Dr Betsonrsquos ldquoONE SUGAR BOWLrdquo assumption However Dr Betsonrsquos claim that ldquothe Economic Table assumes that the child resides with only one parentrdquo is not correct Instead the scientific research upon which the Economic Table is supposed to be based and from which the Economic Table has been derived is the spending patterns of intact families The Income Shares assumption is that spending on the child after separation should be maintained at the same level as spending before separation Thus the Economic Table takes the research on spending on children in intact families and then arbitrarily imposes that same level of total child spending on non-intact families While there is fierce debate about whether maintaining intact family spending after divorce is even possible given that total family spending on other items (such as housing) are greatly increased after separation the Income Shares assumption is that spending on the child should be maintained after separation at the same total level as before separation The Economic Table therefore represents the amount typically spent on children in intact families after excluding child care and health care It does not represent or assume that this is the cost of the child residing with only one parent
There is also much disagreement on what the amount spent on children actually is in intact families Thus the Wisconsin Economic Tables assume a flat rate of 17 of combined net income Spring (2008) concluded that intact families spend a maximum of 15 of total family spending on one child Others such as the Betson-Rothbarth table assumes up to 25 for one child The current Washington State Table averages about 18 for total family spending on one child based originally on a Book by Eden (1977) on spending patterns in intact families which in turn was based upon a USDA per capita estimate of spending on children in intact families Thus the current Table represents the total combined obligation of both parents regardless of the number of households with the assumption that they will spend the same amount on the child after separation as they spent on the child before separation
Washington State in particular never assumed that the Economic Table was merely to cover expenses in the custodial parentrsquos house To the contrary the Shellan Table and all later tables were all based on the assumption that the residential credit was to be taken directly from the total amount listed in the Economic Table using a traditional cross credit method There is no mention at all of the use of multipliers in Washington State historical documents
1 Betson D (2004) Shared Parenting Visitation and Child Support Work Product of Indiana
Judicial Council Review of Support Guidelines 2 Betson D (2008) Residential Credit PDF Emailed to the Washington State Child Support
Work Group on March 11 2008
David Spring April 2008 Addendum Page 5 of 34
For example on page 8 of the 1987 Washington State Child Support Commission Report (which was the basis for the 1988 Child Support Act See pages 36 and 37 of the February Addendum) the Commission states as a basic principle A schedule should recognize the involvement of both parents in the childrsquos upbringing It should take into account the financial support provided directly by parents in shared physical custody or extended visitation arrangements
This ldquoextended visitation arrangements was first assumed to be 20 later fixed at 25 and later changed to the discretion of the court with a presumption at 35 The recent credible scientific studies on this subject support going back to 20
On page 11 the authors described the model chosen by the Commission At least 18 states have adopted or are considering adoption of child support schedules that are based on the Income Sharing Model or on a hybridization of the Income Shares Model with the Cost Sharing Model The model suggests first that parental income be totaled Next the percentage of that total income that would have been spent on the children had the family remained intact is calculated and allotted to child support Finally each parent pays the percentage of child support that would correspond to their relative share (percentage) of the combined total income The actual flow of child support payments will then depend on the amount of time the child spends with each parent
These two sentences make it very clear that the Economic Table is assumed to
be the total mount spent on the child had the family remained intact and that the residential credit is to be taken directly from this amount without any multiplier
On page 12 the authors add The proposed schedule uses a hybrid Income
and Cost Sharing Model similar to the one described in the previous section It was chosen over the alternatives because of its neutrality regarding residential placement and because it is more equitable in regards to the parentsrsquo support obligation while still providing economic protection for the children
It is clear that the 1987 report and thus the Washington State Child Support Act was based upon the Economic Table as an estimate of the total child cost in an intact family with the exception of child care and major medical care which were separate add-ons It is also clear that this total obligation was intended to be divided between parents based not only on percent of income but also on percent of time spent with both parents (with an explicit residential credit) and without any multiplier
The Washington State Parenting Act also makes it very clear that the childrsquos
relationship with both parents will be fostered after divorce (RCW 2609002) Thus the assumption in our State is that the child will have two households and reside with two parents and that the cost in the Economic Table is the total cost to be divided equitably
The only issue that has ever been debated in our State is what the minimum threshold should be for granting a residential credit In the past it was wrongly believed that the lower time parent incurred little or no expenses during their time with the child This was shown to be a false assumption in three recent studies on this topic which were described in more detail in the March Addendum
David Spring April 2008 Addendum Page 6 of 34
These studies confirmed that once the 20 time threshold is passed lower time parentrsquos per day costs approach the per day costs of the higher time parent because at about the 20 of time mark it becomes likely that the lower time parent will be providing the child with their own bedroom Having bedrooms in each house is a significant expense for the lower time parent and a significant emotional benefit for the child The threshold in the past was as low as 20 then it was fixed for a few years at 25 then after a fierce debate in 1991 it was made at the discretion of the court with a presumption of credit at 35 but with credit possible any time the lower time parent could provide evidence that they incurred significant expenses Put another way if the lower time parent actually provided a bedroom they were supposed to get a credit Sadly courts ignored the plain meaning of the statute and instead imposed a 35 minimum
Dr Betson correctly points out that high thresholds create huge problems with ldquocliff effectsrdquo wherein the residential credit goes from nothing to a huge amount He notes that Indiana has chosen 15 for a threshold Dr Betson recommends no threshold at all In the March 2008 Addendum I recommended a 20 threshold which I felt best reflected the scientific literature on child costs in lower time parents households and also represented focusing on a minimum time that would be in the best interest of the childrsquos emotional development Certainly one of the main decisions this work group will face is the minimum threshold question I am not opposed to a threshold lower than 20 but I agree with Dr Betson that thresholds have serious problems with cliff effects This becomes a particular problem with thresholds above 25
It is important to understand however that while the threshold has had a complex history and ldquono real right answerrdquo as to the best threshold the method used to calculate the residential credit in our State has a very simple history and a very clear right answer The traditional cross credit method 3 is the only method our State has ever used for the simple reason that it is the only method that equitably divides the total obligation between the parents on a per day basis It is therefore the only method that complies with the Washington State Child Support Act (RCW 2619001)
II The current calculation of the lower time parentrsquos obligation does not
account for their direct child related expenses In the fourth paragraph on page 1 of Dr Betsonrsquos most recent report he correctly
noted that ldquoThe current calculation of the non-custodial parentrsquos obligation doesnrsquot account for NCPrsquos out of pocket expenditures made when the child resides with themrdquo The assumption in our State was that the lower time parent had no significant expenses until a certain threshold was reached This threshold was originally estimated to be 20 and later fixed at 25 and later moved up to 35 But there was no research in 1991 It was all guess work
3 In both of his reports Dr Betson tries to hijack the term ldquocross creditrdquo method by calling the ldquoWilliams 150 Multiplierrdquo method the cross credit method Given that Williams clearly added a ldquomultiplierrdquo step to the traditional cross credit method one wonders what Dr Betson lsquos motives are for this deception There is no doubt that novice readers will be confused and misled by the fact that Betsonrsquos use of this term is radically different from my use and from the use in the historical Washington record (see the February Addendum for a detailed account of the history of the residential credit in our State) I will therefore refer to the cross credit method without a multiplier as the ldquotraditional cross credit methodrdquo and if a multiplier is added I will call it the Williams Multiplier method Finally I will refer to Dr Betsonrsquos method as the ldquoBetson graduated multiplierrdquo method Given that multipliers greatly reduce the residential credit I think that readers have a right to know when a multiplier is being used
David Spring April 2008 Addendum Page 7 of 34 Only since about 2003 has there been adequate research to verify that 20 is in fact a point at which expenses become not just significant but nearly equal to the per day expenses at the higher time parentrsquos house In other words lower time parentrsquos expenses are in fact much greater than was assumed to be the case in 1991 when the current residential credit language was adopted Thus we now know that there was a reasonable basis for lower time parents who cared for the child more than 20 of the time to complain that they were (and still are) being ldquodouble chargedrdquo III The Basic child support obligation does NOT envision the child only having one bedroom Instead Washington law assumes the child will have two bedrooms after separation
In the same (fourth) paragraph on page 1 of his most recent report Betson makes the claim that the BCSO ldquoenvisions only one bedroom for the child not twordquo This claim is simply not true While Dr Betson assumes the child only has one sugar bowl nowhere in the Child Support Act does it specify that the child will only have one bedroom or one sugar bowl Nowhere in the historical documents does it specify that the child will only have one bedroom or one sugar bowl Instead the historical record going all the way back to 1982 confirms that when the child has two bedrooms that a traditional cross credit method is to be used to equitably divide the total obligation between the two parents on a per day basis This in turn is based on two often repeated principles First that spending on the child after separation should remain at the same level as before separation Second that spending on the child before separation is to be estimated based upon studies of spending on children in intact families
Dr Betson takes the first principle and adds six words that are not in the Child Support Act Because he is a firm believer in the ONE SUGAR BOWL assumption Dr Betson wants ldquospending on the child IN THE HIGHER TIME PARENTrdquoS HOUSEHOLD after separation to remain at the same level as before separation Adding these six words ndash IN THE HIGHER TIME PARENTrsquoS HOUSEHOLD - would not only be a radical shift in Washington State Child Support policy but would be contrary to the EQUITABLE provision of the Washington State Child Support Act and create a huge incentive for divorce and result in huge conflict over who should be the higher time parent as it gives preferential financial treatment to the higher time parents household and places nearly all of the financial burden for the child and all of the negative financial consequences of divorce on the lower time parent It is also contrary to the childrsquos best interest as it leads directly to the loss of the lower time parent over time which is harmful to the childrsquos emotional development This is precisely why the Washington State Parenting Act assumes that the child will retain their relationships with both parents and therefore have two bedrooms after separation
As noted earlier the BCSO as specified in the Economic Table is based upon spending in intact families with the assumption that this same level of spending on the child will be maintained after separation There is no specification at all in the BCSO LIMITING THE EXPENDITURE OF THIS TOTAL AMOUNT TO ONLY THE HIGHER TIME PARENTS HOUSEHOLD Obviously if the lower time parent spends no time caring for the child or cares for the child so little as to not incur significant expenses then the total obligation does all go to the higher time parent But this is because the lower time parent has no direct expenses It is NOT because of some unwritten assumption that intact family spending must be maintained in the higher time parentrsquos household
David Spring April 2008 Addendum Page 8 of 34 IV Total spending on the child does not increase in shared parenting arrangements because total income does not increase
In the same (fourth) paragraph on page 1 of his most recent report Betson also makes the claim that ldquoThe total spending on the child increases when expenses incurred by the CP are duplicated by the NCP to accommodate the presence of the child in their respective householdsrsquo
This claim is not true for the very simple reason that total spending on children is related to the total net income of the parents This basic principle has been confirmed in every study that has ever been done on child costs For example in the January Analysis I concluded based upon the convergence of several sources that total spending on children excluding child care and health care does not exceed 15 of total combined net income Our current Table is about 20 higher than this at 18 to 19 of combined net income Thus even our current Economic Table recognizes this principle and is based upon this principle The only way that the total spending on the child can increase is for the total income of the parents to increase
Since the total income of the parentrsquos does not increase after separation what actually happens in shared parenting arrangements is that the financial living standards of both parents and the financial living standard of the child falls after separation in order for both parents to meet their new living expenses It is interesting to note that children especially younger children have no awareness at all of their living standard They are typically happy as a lark as long as they can retain their relationships with both of their primary attachment figures
In the fifth paragraph on page 1 Betson makes the claim that ldquoThe purpose of the residential credit is to provide an accounting of the total expenditures being made on behalf of the child by each parent and to maintain the sharing of the total cost of the child in proportion to their ability to pay (net incomes)rdquo
This statement is correct as long as one understands that the ldquototal expenditures being made on behalf of the childrdquo in Washington State law is not required to be greater than the BCSO specified in the economic table and directly related to the total combined net income This total expenditure might only occur in one household Or it might be divided between two households
V Dr Betsonrsquos calculations of ldquotransferred expensesrdquo and ldquoduplicated
expensesrdquo are based on his false assumption that the financial standard of living must be maintained in the higher time parentrsquos household
Next in his latest report Dr Betson provides sections called ldquoElaboration of
Transferred Expensesrdquo and ldquoElaboration of Duplicated Expensesrdquo In these sections he makes numerous assumptions that are not supported by the child cost research However I will not go over these here because the entire discussion is not merely inaccurate but irrelevant for the simple reason that it is based upon his false assumption that the financial standard of living must be maintained in the higher time parentrsquos household As a practical matter it is impossible to maintain the pre-divorce standard of living in the higher time parentrsquos household without a dramatic increase in the combined incomes of the two parents No where in the Washington State Child Support Act does it require that the standard of living be maintained in the higher time parentrsquos household Dr Betson is simply assuming that having a full sugar bowl in the higher time parentrsquos house is more important to the child than retaining both parents
David Spring April 2008 Addendum Page 9 of 34
Using this highly flawed premise Dr Betson concludes that ldquotransferred expensesrdquo are 40 of the total what Betson calls ldquocontrolled expensesrdquo are 10 of the total and ldquoduplicated expensesrdquo are 50 of the total The controlled expenses are controlled by the Custodial parent Betson at the end of the second paragraph on page 5 gives examples of controlled expenses as being ldquoordinary medical expenses and clothingrdquo Apparently Dr Betson believes the child will never get sick at the lower time parentrsquos house and that the child will always drag their entire wardrobe of clothing back and forth between the two households These assumptions like all of Dr Betsonrsquos other assumptions are completely unrealistic Instead the child will get sick at both households and the child will have a closet full of clothes at both households
Before moving on it is important to focus on Dr Betsonrsquos claim that duplicated
expenses are assumed to be 50 of the total obligation There is no basis in the scientific research on child rearing costs that this assumption is true any more than there is a basis for assuming a ldquocontrolled costrdquo of 10 Nevertheless this assumption is the basis for Dr Betsonrsquos addition of a 150 multiplier to the BCSO There are numerous flaws with Betsonrsquos method of adding a ldquo150 Multiplierrdquo to the total obligation even if the multiplier is only ldquophased itrdquo
1 Adding a 150 multiplier is contrary to the scientific literature on the cost of child rearing The scientific literature has a wide range of views as to the cost of the child However using the example given by Betson in his Indiana report on residential credits if the total combined obligation is $900 per month this is assumed to be the total amount that was spent on the child prior to the divorce Using the current economic table and assuming the $900 includes child care and medical care it is likely that this amount is about 20 of total family spending andor total family net income This makes total family net income of the Betson example about $4500 per month Divorce is often related to one parent losing their job However assuming that both parents retain their current employment the NULL hypothesis would be that their incomes would remain the same after divorce as it was before divorce All scientific research also confirms that their child related expenses would remain the same (at $900 a month) What would change is that the family would have to pay for two homes instead of one Assuming equal shared parenting as in the Betson example each parent would get $450 of the $900 total obligation Thus the total amount spent on the child would remain the same even though the amount spent in each household would be cut in half But even $450 per month is more than enough for each parent to meet the basic needs of the child especially if each parent only cared for the child half the time
2 Adding a 150 multiplier assumes a ldquoghost incomerdquo increase of 50 According to the scientific research on spending on children the only way to increase the amount spent on the child 50 is to increase the combined income of both parents by 50 Thus adding a multiplier of 150 would raise the total combined obligation in the Betson example from $900 to $1350 per month This in turn requires a 50 increase in the combined income of the parents Only those few parents who could increase their income 50 would be able to have shared parenting arrangements (This is called the ldquoGhost Incomerdquo problem of the 150 multiplier because the 150 multiplier assumes a 50 increase in income) Thus Betson is assuming an increase in income that does not exist
David Spring April 2008 Addendum Page 10 of 34
3 Adding a multiplier is contrary to Washington State law As discussed earlier Washington State law requires that the child support payment reflect the CURRENT income and standard of living of both parents Thus if the child has two homes and the parental income has not increased all that is requires is that the shared parenting arrangement meet the basic needs of the child This requirement is almost always met even if both parents suffer a drop in living as a result of divorce and the additional cost burden of a second house
4 A 150 multiplier is based on the assumption that the pre-divorce family standard of living can andor should be maintained in both households after divorce It assumes that costs can be duplicated without lowering the standard of living This is a false assumption Nothing in Washington State law requires that the pre-divorce standard of living be maintained in either household Nor does the scientific literature support this as a possibility Instead it is highly unlikely that the amount spent on the child can rise by 50 after divorce
5 Adding a multiplier increases the financial incentive for divorce One of the purposes of a residential credit is to equitably divide the cost of child rearing between the parents Adding a multiplier artificially raises the cost of child rearing thus continuing the financial incentive for a higher time parent to seek a divorce
6 If one were going to use a multiplier one should use 50 rather than 150 Rogers argues that what matters after divorce is not the total combined income but rather the average of the two incomes As Rogers (2005) has correctly observed ldquoThe average income is the maximum standard of living that can be sustained in both householdsrdquo Put another way while before divorce each parent had access to the full 100 of combined income after divorce each parent only has access to about 50 of the combined income Thus if there is to be parity between parents to minimize conflict between parents then both parents should experience a 50 drop in their standard of living after divorce (and the child will also experience a 50 drop in their standard of living at both households) Thus the multiplier should be 05 not 15
If a multiplier is to be used to represent the true economic situation after divorce the
multiplier should be 50 not 150 However a more honest solution is to simply reduce the economic table to the 15 flat rate we have proposed for ldquoactual child costsrdquo and then not use any multiplier at all Even if the current table is retained (ie adopting the status quo option) it would still be more equitable to use the straight line cross credit calculation In other words the cross credit calculation yields the most equitable result regardless of the economic table it is used with Thus the use of a multiplier cannot be justified by any economic argument VI The real purpose of multipliers is to artificially inflate the cost of child rearing The February Addendum provided numerous studies confirming that the purpose of ldquoper capitardquo child cost assumptions was simply to artificially inflate the cost of child rearing by as much as 50 Addition of a multiplier which assumes a dramatic rise in child costs without a parallel rise in parent income has exactly the same purpose It should therefore comes as no surprise that those who have used ldquoper capitardquo assumptions in creating child cost estimates are the same people who advocate for the use of multipliers The following example provides an estimate of the amount of increase that results from addition of a multiplier This is followed by an estimate of the combined effect of a multiplier with a per capita child cost ratio to show the cumulative effect
David Spring April 2008 Addendum Page 11 of 34 In the next section we provide several typical situations with a median combined obligation of $600 per month based upon a combined median net income of about $3600 per month This equates to a marginal child cost ratio at this income level of about 17 using the current Economic Table If one raises the obligation 50 by adding a 50 multiplier due to a shared parenting arrangement then the new assumed total obligation is $900 per month However since the combined income did not change the new child cost ratio is $900 divided by $3600 or 25 The increase in the ratio is 817 equals just under 50 This is similar to the increase in the child cost ratio that results from using a per capita estimation method rather than a marginal estimation method But what happens if one uses BOTH an initial per capita child cost ratio estimate of 25 AND a 50 multiplier In other words what would happen if we adopted both Dr Betsonrsquos recommended (per capita) Economic Table and Dr Betsonrsquos recommended (50 multiplier) Residential Credit method First the initial child cost ratio even without the residential credit would jump dramatically from $600 per month per month to as much as $900 per month (using the Betson Engel Table) Second this $900 combined obligation would be multiplied again by 50 bringing the combined monthly total obligation up to $1350 per month Keep in mind that the combined income of the couple is still only $3600 Tack on another 5 or $180 per month for child care and health care and we arrive at $1530 per month for the total obligation of a couple only making $3600 per month Thus the combination of a per capita estimate and a 50 multiplier results in an estimated child cost of 425 of combined net income for one child This is more than double the amount found in any credible scientific study This amount means that the funds left for both parents to live off of is only 100 - 425 = 575 Thus each parent only gets 28 of the total net income while the child gets 42 Nearly every credible study has found that children cost about half of what an adult costs But Dr Betsonrsquos assumptions lead to the amazing conclusion that one child costs twice what one adult costs Thus Dr Betson is requiring divorced parents to pay child costs that are three to four times what they paid prior to the divorce As this is simply impossible his faulty assumptions make shared parenting impossible and result in the dad either failing to pay child support or living out of the back of his truck Did I mention that Dr Betson works as a consultant for PSI which in turn makes $120 million per year making money collecting child support from dads would have gone into default Clearly Dr Betsonrsquos assumptions are good business for PSI but bad business for the millions of children who lose all contact with their fathers VII Why it is essential that the residential credit be presumptive On pages 5 to 6 Dr Betson discusses ldquoImplementation Issuesrdquo and ldquoadditional issuesrdquo This discussion confirms that there is general agreement on nearly every issue other than the method used to determine the amount of the residential credit However while Dr Betson agrees that the residential credit should be presumptive and no longer treated as a deviation at least one member of the sub-group wanted to keep the residential credit merely ldquopermissiverdquo and at the courtrsquos discretion I would therefore like to explain why a residential credit presumption is essential
David Spring April 2008 Addendum Page 12 of 34 The current residential credit provision has a clause that it is ldquopresumptiverdquo above 35 and discretionary below 35 Despite this fact many judges refuse to give a residential credit even when both parents are wealthy enough to meet the childrsquos basic needs and have a 50-50 residential schedule In other words many judges refuse to comply with the current residential credit law In at least one of these cases the dad was forced to pay 98 of the total obligation even though he cared for the child directly 50 of the time These extremely gender-biased court rulings are nearly always reversed on appeal 4 However many parents especially in shared parenting arrangements simply cannot afford to pay for an Appeals attorney (which can cost more than $3000000 for an appeal) One judge refused to give the dad a residential credit even after the judgersquos original decision was reversed by the Court of Appeals Thus given the extreme gender bias of at least some judges the only way to assure that the residential credit will actually be given is to make it presumptive and not discretionary Even with a presumption it is likely that some gender-biased judges will still refuse to comply with the law But hopefully over time it will become more apparent that residential credits actually benefit children in terms of retaining both parents and thus more judges will become more enlightened and less resistant This struggle for shared parenting has gone on for more than 20 years It is not likely to be resolved merely with the passage of a stronger residential credit law but only with a change in the hearts and minds of our entire society VIII Dr Betsonrsquos Excel Sheet calls the traditional cross credit method ldquoAlternative 1rdquo and the Betson Graduated Multiplier ldquoIndiana Creditrdquo The ldquotraditional cross creditrdquo option (Alternative 1 on the Betson Excel sheet) is the method we are currently using here in the State of Washington and have been using for over 20 years This option is so common that many Washington State Child Support computer programs can calculate it simply with the push of a button Dr Betson misleads readers by calling the Williams Multiplier method a ldquocross creditrdquo procedure He further confuses readers by presenting four options only two of which are actually supported by anyone on the Residential Credit sub-committee Naturally Dr Betson and his supporters are in favor of the Betson graduated multiplier method (called the Indiana Credit on his Excel sheet) The rest of us support the traditional cross credit approach which Dr Betson calls Alternative 1 in his Excel sheet What the Work Group really needs if it is to choose between the Betson graduated multiplier method and the traditional cross credit method is direct comparisons between the two methods It is important to see how the methods are actually calculated rather than merely punching some buttons Therefore in the next section we will directly compare the calculations and results of these two methods side by side so that readers can see how they differ and why they differ However for now the following chart is a simple side by side comparison showing the differences between these two methods 4 For example see DRURY v TABARES (1999) 97 Wn App 860 Also Marriage of Baldwin Division One No 50034-1-I (2002) Also see Marriage of Rusch (2004) 124 Wn App 226 All three of these cases involved 50-50 parents who were denied a residential credit
David Spring April 2008 Addendum Page 13 of 34 RESIDENTIAL CREDIT AS A PERCENT OF THE TOTAL OBLIGATION WHEN INCOMES OF PARENTS ARE EQUAL of residential time
Traditional Cross Credit Method
Betson Multiplier Method
20 20 10 30 30 24 40 40 40 50 50 45 60 60 60 70 70 76 80 80 90 100 100 100
The results in this Table can be arrived at using the Betson Excel sheet by setting the incomes of both parents to be equal and then taking the Percentage columns of Alternative I (the Traditional Cross Credit Method) and the Indiana Credit (the Betson Multiplier Method) and dividing the percentages in half (to get the percent of the total obligation rather than the percent of the obligation of one parent) The percentages above 50 are obtained by subtracting the percentages below 50 from 100 Note that the traditional cross credit method always results in a match between the time spent caring for the child and the percentage of credit received However it does not always result in an exact match with the Betson multiplier method The above chart confirms that the parent punished the most by the Betson Graduated Multiplier method is the lower time parent who only cares for the child 20 of the time They only receive a credit for 10 of the time In other words they only receive a credit for about half of what they spent directly on the child during their time with the child This is troubling for three reasons First other than dads who never get to see their kids this is the most common of all groups of lower time parents Thus it will impact a very large number of fathers Second assuming the dad pays for a bedroom for the child it is highly likely that his per day child costs are far greater than the majority momrsquos per day child costs This is because both parents are paying for a bedroom But the childrsquos bedroom at the momrsquos house is occupied 80 of the time and she is reimbursed for 80 of her bedroom costs while the child bedroom at the dadrsquos house is only occupied 20 of the time Thus because the dad must absorb much higher un-reimbursed child costs than the mom his per day costs during his 6 days per month with the child are likely to be much higher than the momrsquos per day costs during her 24 days with the child Third and probably more important in terms of its impact on the childrsquos emotional development because the lower time parent is not adequately reimbursed for their direct costs the lower time parent might not have the funds needed to pay for the child to have their own bedroom at the lower time parentrsquos house As noted above this bedroom is important to the childrsquos sense of security It is therefore not wise to short-change this group of lower time parents as it is financially hurting the parents most in need of financial help and emotionally hurting the child in most need of help The next section explores the differences between the Betson multiplier method and the traditional cross credit method in greater detail
David Spring April 2008 Addendum Page 14 of 34 Section Three Comparing the Betson Multiplier Method to the Traditional Cross Credit method All cases assume a median family with one child and a ldquomedianrdquo total Economic Table obligation of $622 per month which equates to a total median combined net monthly income of about $3600 under the current Economic table rate of about 17 5
Note that if the Betson Rothbarth Per Capita Table is adopted the rate would rise to about 21 and the median total obligation at 3600 combined monthly net would rise about $150 per month to about $750 while if the Spring Marginal Table were adopted the rate would fall to 15 and the median total obligation would fall about $80 per month to about $540 In either case since the method of determining the residential credit is based on the total obligation it is independent of the method of determining the Economic Table) $600 per month is used for convenience as it is equal to $20 per day Calculations exclude child care and health care See notes below for more details If Parents have equal incomes and lower time parent has 20 of residential time Higher time parent = 24 days per month Lower time parent = 6 days per month Residential Credit formula used
Betson Multiplier method 6
Traditional Cross Credit
Difference per month
Total Combined Obligation from Table
$600 per month $20 per day
$600 per month $20 per day
Multiplier Added (20) $120 per month $4 per day
$0 $120
Assumed rise in combined net monthly income
$720 per month (about $6 per hour)
$0 $720
New combined obligation $720 per month $24 per day
$600 per month $20 per day
$120
Each parents income share of total obligation
$360 per month $300 per month $60
Direct Child Costs of Higher Time parent
80 x $720 = $576 80 x $600= $480 $94
Direct Child Costs of Lower Time parent
20 x $720= $144 20 x $600= $120 $24
Transfer payment $360 - $144 = $216 $300 - $120 = $180 $36 Actual Residential Credit $300 - $216 = $84 $300 - $180 = $120 $36 Per day actual credit $846 days =$14day $1206 = $20day $6 per day 5 Sterling (2003) reported that receiving parent median net monthly income in 2003 was about $1500 and paying parent median net monthly income was about $1800 for a total combined income of $3300 per month Thus the current combined net monthly income is about $3600 per month and the current total obligation is about $622 using a ldquosingle column averagerdquo rate of 17 under the current table The actual rate under the ldquotwo columnrdquo current table is about 15 for younger children and 19 for older children See Spring February Addendum page 58 Under the Betson Rothbarth Table the rate would rise to about 21 for a total obligation of $756 Under the Spring marginal table the rate would fall slightly to 15 for a total obligation of $540 None of these rates include child care or medical which will raise the actual total obligation about 5 of combined net or about $180 per month 6 Betson actually uses a graduated multiplier which is more complex that is indicated in this discussion A graduated multiplier is used to reduce the cliff effect of a fixed multiplier Either multiplier is based on the assumption that child costs increase in shared parenting arrangements There is no evidence to support this conclusion and substantial evidence that child costs as a percent of income do not increase The complexity of the Betson multiplier is also due to his assumption that there are duplicated costs variable costs and traveling costs Again there is no credible scientific evidence to support this assumption I have therefore used a simplified graduated multiplier as a rough approximation of the Betson graduated multiplier Analysis on page 10 confirms the results are similar
David Spring April 2008 Addendum Page 15 of 34 COMPARISON 2 Parents have equal incomes lower time parent 30 of time Higher time parent = 21 days per month Lower time parent = 9 days per month Residential Credit formula used
Betson Multiplier method
Traditional Cross Credit method
Difference per month
Total Combined Obligation from Table
$600 per month $20 per day
$600 per month $20 per day
Multiplier Added (30) $180 per month $6 per day
$0 $180
Assumed rise in income (Multiplier x 5)
$900 per month (about $7 per hour)
$0 $780
New combined obligation $780 per month $26 per day
$600 per month $20 per day
$180
Each parents income share of total obligation
$390 per month $300 per month $90
Direct Child Costs of Higher Time parent
70 x $780 = 546 70 x 600 = 420 126
Direct Child Costs of Lower Time parent
30 x $780 = 234 30 x $600 = 180 $54
Transfer payment after Direct Costs
$390 ndash 234 = $156 $300 ndash 180 = 120 $36
Actual Residential Credit $300 - $156 = $144 $300 ndash 120 = $180 $36 Per day actual credit $1449 days = $16day $1809 days =
$20day $4 per day
COMPARISON 3 Parents equal incomes lower time parent 40 of time Higher time parent = 18 days per month Lower time parent = 12 days per month Residential Credit formula used
Betson Multiplier method
Traditional Cross Credit method
Difference
Total Combined Obligation from Table
$600 per month $20 per day
$600 per month $20 per day
Multiplier Added (40) $240 per month $8 per day
$0 $240
Assumed rise in income (Multiplier x 5)
$1120 per month (about $8 per hour)
$0 $1120
New combined obligation $840 per month $28 per day
$600 per month $20 per day
$240
Each parents income share of total obligation
$420 per month $300 per month $120
Direct Child Costs of Higher Time parent
60 x $840 = 504 60 x $600 = $360 $144
Direct Child Costs of Lower Time parent
40 x $840 = 336 40 x $600 = $240 $96
Transfer payment after Direct Costs
$420-$336= $84 $300 ndash $240 = $60 24
Actual Residential Credit $300 ndash $84 = $216 $300 ndash $60 = $240 $24 Per day actual credit $21612 days =
$18day $24012days = $20day
$2day
David Spring April 2008 Addendum Page 16 of 34 COMPARISON 4 Parents equal incomes lower time parent = 50 of time Higher time parent = 15 days per month Lower time parent = 15 days per month Residential Credit formula used
Betson Multiplier method
Traditional Cross Credit method
Difference per month
Total Combined Obligation from Table
$600 per month $20 per day
$600 per month $20 per day
Multiplier Added (50) $300 per month $4 per day
$0 $300
Assumed rise in income (Multiplier x 5)
$1500 per month (about $9 per hour)
$0 $1500
New combined obligation $900 per month $30 per day
$600 per month $20 per day
$300
Each parents income share of total obligation
$450 per month $300 per month $150
Direct Child Costs of Higher Time parent
50 x $900 = $450 50 x $600 = $300 $150
Direct Child Costs of Lower Time parent
50 x $900 = $450 50 x $600 = $300 $150
Transfer payment after Direct Costs
$450-$450 = 0 $300-$300 = 0 0
Actual Residential Credit $300 - $0 = $300 $300 ndash 0 = $300 0 Per day actual credit $30015 days =
$20day $30015 days = $20day
0
COMPARISON 5 Parents 4060 unequal incomes 8020 unequal times Higher time parent = 24 daysmonth Lower time parent = 6 daysmonth Residential Credit formula used
Betson Multiplier method
Traditional Cross Credit method
Difference per month
Total Combined Obligation from Table
$600 per month $20 per day
$600 per month $20 per day
Multiplier Added (20) $120 per month $4 per day
$0 $120
Assumed rise in combined net monthly income
$720 per month (about $6 per hour)
$0 $720
New combined obligation $720 per month $24 per day
$600 per month $20 per day
$120
Higher time parents share of total obligation
40 x $720 = $288 per month
40 x $600 = $240 per month
$48
Lower Time parents share of total obligation
60 x $720 = $432 per month
60 x $600 = $360 per month
72
Direct Child Costs of Higher Time parent
80 x $720 = $576 80 x $600= $480 $94
Direct Child Costs of Lower Time parent
20 x $720= $144 20 x $600= $120 $24
Transfer payment after Direct Costs
$432 - $144 = $288 $360 - $120 = $240 $48
Actual Residential Credit $360 - $288 = $72 $360 - $240 = $120 $108 Per day actual credit $726 days =$12day $1206 = $20day $8 per day
David Spring April 2008 Addendum Page 17 of 34 Comments on the most common situation In the most common situation the parents have 4060 unequal incomes and 8020 unequal times with the child with one child at median incomes and the total combined obligation according to the current Economic Table is about $600 per month Although it is rarely the case we will also assume that the federal child tax credit (about $180 per month or $6 per day) is also divided between the parents based upon the ratio of their time with the child Without any residential credit funds available to the higher time parent is $600 per month Since the higher time parent cares for the child 24 days per month the higher time parent receives about $60024 days= $25 for each day the child is with that parent The lower time parent currently receives $0 per day for each of the 6 days the child is with that parent Clearly failure to provide a residential credit results in an inequitable division of child rearing costs and thus is contrary to RCW 2619001 The Betson Multiplier method results in an actual residential credit of $72 per month to the lower time parent in comparison to no credit at all Since that parent cares for the child 6 days per month this works out to a residential credit of $12 per day to the lower time parent The amount of funds available to the higher time parent compared to no credit is $600 per month minus $72 equals $528 per month divided by 24 days per month equals $22 per day Clearly the Betson multiplier method does not divide the cost of child rearing equitably between the parents and is contrary to RCW 2619001 The traditional cross credit method which has been used in the State of Washington for over 20 years results in an actual residential credit of $600 per month times 20 = $120 per month to the lower time parent Since that parent cares for the child 6 days a month this works out to a residential credit of $20 per day to the lower time parent The amount of funds available to the higher time parent compared to no credit is $600 minus $120 equals $480 per month Divided by 24 days per month equals $20 per day Since the per day funds available to each parent is the same for each day the child is cared for by that parent the cost of child rearing is equitably divided between the parents and the traditional cross credit method is compliant with RCW 2619001 COMPARISON 5 Parents 4060 unequal incomes 8020 unequal times Higher time parent = 24 daysmonth Lower time parent = 6 daysmonth Residential Credit formula used
No residential credit
Betson Multiplier method
Traditional Cross Credit method
Residential Credit per month
$0 $72 $120
Residential credit per day $0day $726 days = $12day
$1206 days = $20day
Funds available to higher time parent per month
$600 $600 - $72 = $528
$600 - $120 = $480
Funds available to higher time parent per day
$60024 days = $25day
$58824 days = $22day
$480 24 days = $20day
Difference in funds available to parents
$25 - $0 = $25 per day
$22 - $12 = $10 per day
$20 - $20 = $0 per day
David Spring April 2008 Addendum Page 18 of 34 COMPARISON 6 Parents 4060 unequal incomes 7030 unequal times Higher time parent = 21 daysmonth Lower time parent = 9 daysmonth Residential Credit formula used
Betson Multiplier method
Traditional Cross Credit method
Difference per month
Total Combined Obligation from Table
$600 per month $20 per day
$600 per month $20 per day
Multiplier Added (30) $180 per month $6 per day
$0 $180
Assumed rise in combined net monthly income
$900 per month (about $7 per hour)
$0 $900
New combined obligation $780 per month $26 per day
$600 per month $20 per day
$180
Higher time parents share of total obligation
40 x $780 = $312 per month
40 x $600 = $240 per month
$48
Lower Time parents share of total obligation
60 x $780 = $468 per month
60 x $600 = $360 per month
72
Direct Child Costs of Higher Time parent
70 x $780 = $546 70 x $600= $420 $94
Direct Child Costs of Lower Time parent
30 x $780= $234 30 x $600= $180 $24
Transfer payment $ 468- $234 = $234 $360 - $180 = $180 $48 Actual Residential Credit $360 - $234 = $126 $360 - $180 = $180 $108 Per day actual credit $1269 days =$14day $1809 = $20day $6 per day COMPARISON 7 Parents 4060 unequal incomes 6040 unequal time Higher time parent = 18 days per month Lower time parent = 12 days per month Residential Credit formula used
Betson Multiplier method
Traditional Cross Credit method
Difference
Total Combined Obligation from Table
$600 per month $20 per day
$600 per month $20 per day
Multiplier Added (40) $240 per month $8 per day
$0 $240
Assumed rise in income (Multiplier x 5)
$1120 per month (about $8 per hour)
$0 $1120
New combined obligation $840 per month $28 per day
$600 per month $20 per day
$240
Higher time parents share of total obligation
40 x $840 = $336 per month
40 x $600 = $240 per month
$48
Lower Time parents share of total obligation
60 x $840 = $504 per month
60 x $600 = $360 per month
72
Direct Child Costs of Higher Time parent
60 x $840 = $504 60 x $600 = $360 $144
Direct Child Costs of Lower Time parent
40 x $840 = $336 40 x $600 = $240 $104
Transfer payment $504-$336= $168 $360 ndash $240 = $120 $48 Actual Residential Credit $360 ndash $168 = $192 $360 ndash $120 = $240 $48 Per day actual credit $19212 = $16day $24012 = $20day $4day
David Spring April 2008 Addendum Page 19 of 34 COMPARISON 8 Parents 4060 unequal incomes 5050 equal time Higher time parent = 15 days per month Lower time parent = 15 days per month Residential Credit formula used
Betson Multiplier method
Traditional Cross Credit method
Difference per month
Total Combined Obligation from Table
$600 per month $20 per day
$600 per month $20 per day
Multiplier Added (50) $300 per month $4 per day
$0 $300
Assumed rise in income (Multiplier x 5)
$1500 per month (about $9 per hour)
$0 $1500
New combined obligation $900 per month $30 per day
$600 per month $20 per day
$300
Higher time parents share of total obligation
40 x $900 = $360 per month
40 x $600 = $240 per month
$48
Lower Time parents share of total obligation
60 x $900 = $540 per month
60 x $600 = $360 per month
72
Direct Child Costs of Higher Time parent
50 x $900 = $450 50 x $600 = $300 $150
Direct Child Costs of Lower Time parent
50 x $900 = $450 50 x $600 = $300 $150
Transfer payment after Direct Costs
$540-$450 = $90 $360-$300 = $60 0
Actual Residential Credit $360 - $90 = $270 $360 ndash $60 = $300 $30 Per day actual credit $27015 days =
$18day $30015 days = $20day
$2day
Comparing percentage of time to percentage of funds available Assuming the parents have equal incomes with a total median obligation of $600 per month the following chart depicts the ratios of the percentage of funds available to each parent based upon their time with the child The following chart assumes that federal child tax credits will be fairly divided between the parents based on the percentage of time the child spends with each parent This tax credit is about $6 per day Residential Credit formula used
Betson Multiplier method
Traditional Cross Credit method
Credit for lower time parent 8020 $726 days = $12day $1206 days = $20day Funds to higher time parent 8020 $600 - $72 =
$52824 days = $22day $48024 days = $20day
Credit for lower time parent 7030 $1269 days = $14day $1809 days= $20day Funds to higher time parent 7030 $600 ndash 126 =
$47421 days = $24 day $42021 days =$20 day
Credit for lower time parent 6040 $19212 days = $16day $24012 days = $20day Funds to higher time parent 6040 600-192 =
50818 days = $28 day 36018 days = $20day
Credit for lower time parent 5050 $27015 days = $18day $30015 days = $20day Funds to higher time parent 5050 $600- $270 =
$33015 days = $22day $30015 days = $20day
Thus the Betson Multiplier method never yields an equitable result while the traditional cross credit method always yields an equitable result
David Spring April 2008 Addendum Page 20 of 34 Comparing the actual Betson graduated multiplier with the simplified graduated multiplier used in this discussion The following two tables compare the actual Betson graduated multiplier results as provided in Betson (2004) page 18 and in column 5 on the Betson Excel sheet (2008) with the simplified graduated multiplier used in the above discussion These Tables confirm that the simplified multiplier method yields results very close to the more complex Betson graduated multiplier Also provided are comparison columns for the traditional cross credit method the Betson residential credit and what would provide an equitable credit in dividing up the total child cost based upon the same per day cost for each day the child is with each parent TABLE ONE LOWER TIME PARENT INCOME SHARE 50 Results listed as NCP transfer payment as a percent of total obligation Time With lower time parent
Betson complex Multiplier 7
Simplified Graduated Multiplier
Cross Credit Transfer
Betson Residential Credit
Cross Credit Credit
20 40 36 30 10 20 30 25 26 20 25 30 40 10 14 10 40 40 50 5 0 0 45 50
TABLE TWO LOWER TIME PARENT INCOME SHARE 60 Time with lower time parent
Betson complex Multiplier
Simplified Multiplier Method
Cross Credit Transfer
Betson Residential Credit
Cross Credit Credit
20 50 48 40 10 20 30 38 39 30 22 30 40 25 28 20 35 40 50 20 15 10 40 50
The above Tables confirm that neither the complex Betson multiplier nor itrsquos simplified approximation ever yield an equitable result Instead they both always provide more income to the higher time parent on a per day basis This places the majority time parentrsquos household in a preferred financial position and means the lower time parent continues to pay much more in child costs on a per day basis than the higher time parent This is not only inequitable but it leads to conflict animosity lack of cooperation between parents and an increased likelihood of litigation between the parents But the Betson multiplier method is even stranger than one might think when one applies it to the median non-intact family We will discuss this problem in more detail in Section Six however for now we will merely consider the Betson calculation with and without a Betson residential credit for the median family with a 4060 income split and an 8020 residential time split
7 Betson D (2004) Shared Parenting Visitation and Child Support Work Product of Indiana Judicial Council Review of Support Guidelines See page 18 In the example used by Betson the BCSO (Basic Child Support Obligation) is $200 per week If the Income share of the NCP is 60 then the transfer payment at zero time is $120 and the transfer payment at 20 residential time is $100 for a residential credit of $20 per week or 10 of the BCSO Thus if the BCSO is $756 per month the residential credit would be about $76 per month
David Spring April 2008 Addendum Page 21 of 34 The following Table is discussed in greater detail in Section Six Comparison for 4060 Net Income split and 8020 Residential Time Split Comparing Three Options
Current Table with Traditional Residential Credit
Spring Table with Traditional Residential Credit
Betson Table with Betson Multiplier Resid Credit
Total Combined monthly obligation
$612 $540 $756
Residential Credit 20 x $612 = $122 20 x $540 = $108 10 x $756 = $76 Assumed Obligation Higher Time parent
40 x $612 = $245
40 x $540 = $216
40 x $756 = $302
Assumed Obligation Lower Time parent
60 x $612 = $367
60 x $540 = $324
60 x $756 = $454
Assumed Cost to Higher Time Parent
80 x $612 = $490
80 x $540 = $432
90 x $756 = $680
Assumed Cost to Lower Time Parent
20 x $612 = $122
20 x $540 = $108
10 x $756 = $76
Transfer payment $367 - $122 = $245 $324 - $108 = $234 $454 - $76 = $378 Residential Credit = 20 of combined obligation using the traditional cross credit method and 10 of combined total obligation using the Betson Multiplier method See the second chart on Page 10 of this report Focusing only on the far right column the Betson method results in a transfer payment of $378 after applying a 10 residential credit There are two problems with the Betson method First the total obligation as determined by the Betson Rothbarth Per Capita method is over 20 higher than the current Economic Table and about 50 higher than any credible child cost study But to add insult to injury the residential credit to the lower time parent is only 10 of the total obligation even though the lower time parent cares for the child 20 of the time and thus should get a 20 credit This results in a transfer payment over 150 greater than by using the current table with the traditional cross credit method It is also over 160 greater than the transfer payment using the Spring Economic Table with a traditional cross credit method Thus the only method that results in an equitable division of child rearing costs on a per day basis is the traditional cross credit approach without any multiplier This is likely the reason why it has been used here in Washington State without objection for over 25 years The threshold has been changed over time ranging from a low of 20 to a high of 35 but a multiplier has never been added to the formula in our State Thus adding any kind of multiplier would be a major change to the credit determination method used in our State
David Spring April 2008 Addendum Page 22 of 34 Section Four Equitable Residential Time Credit Division of the Child Tax Credit In order to equitably divide the cost of child rearing between parents it is also important to give each parent a ldquoresidential creditrdquo for their fair ratio of the federal child tax credit This is problematic in that the federal government does not permit breaking the child credit into fractions Thus the only way to equitably divide this credit is to divide it up over several years based upon the ratio of time each parent spends caring for the child For example if the higher time parent cares for the child 80 of the time they should receive the first 4 years of the child tax credit and the lower time parent should receive the fifth year Lower Time Parent of time with child
Lower Time Parent Higher Time Parent
Over 20 to 25 To receive child tax credit one year out of 5
To receive child tax credit 4 years out of 5
Over 25 to 33 To receive child tax credit one year out of 4
To receive child tax credit 3 years out of 4
Over 33 to 50 To receive child tax credit one year out of 3
To receive child tax credit 2 years out of 3
50 To receive child tax credit one year out of 2
To receive child tax credit one year out of 2
Thus in the median family circumstance where there is one child and the lower time parent cares for the child 20 to 25 of the time equitable division of the residential credit would result in the lower time parent receiving 20 of the residential credit over time As the total median tax credit is at least $180 per month the lower time parent should receive a credit of at least $36 per month over time Since most lower time parents never receive any portion of the child tax credit they are typically overcharged $36 per month
David Spring April 2008 Addendum Page 23 of 34 Section Five Additional Studies on the Benefits of Shared Parenting and thus the benefits of residential credits to child development Numerous recent studies have documented that shared parenting is more beneficial to children of divorce that sole custody arrangements (Warshak 2000 Kelly amp Lamb 2003 Flouri amp Buchanan 2004) Children in shared parenting arrangements have fewer behavior and emotional problems higher self-esteem better family relations and better school performance than children in sole custody arrangements (Bauserman 2002) Several studies also report the harmful effects of parental relocation (Humke amp Schaeffer 1995 Jordan Lara amp McPartland 1996 Tucker Marx amp Long 1998) Relocation has an adverse impact on the child greater than divorce itself Research confirms that children can handle divorce so long as they do not also suffer relocation away from the other parent The cumulative effect of divorce relocation and loss of the other parent leads to extremely poor child outcomes If the child is not in a (protective) intact family structure even one relocation doubles the risk of behavioral and emotional problems including poor school performance school drop out drug and alcohol abuse conduct disorders depression and suicide (Tucker et al 1998) When children of divorce move even one time the odds of having academic and behavioral problems in school nearly doubled (from 17 to 30) (page 122) It is therefore becoming increasingly obvious that relocating children away from their lower time parent is not generally in the best interest of most children of divorce Emma Adam one of Americarsquos leading child development researchers also conducted a study of this issue She found that the combination of the loss of a parent together with divorce and relocation led to very poor child outcomes (Adam 2004) Adams noted that ldquochildren exposed to higher levels of family instability (eg more frequent separations from parental figures and more frequent residential moves) show worse adjustment across a variety of developmental domainshellip Among the (adolescent) girls in our study 42 had experienced at least one (long term) separation from their father figure (page 210)rdquo Thus children of divorce who have already suffered one major harm in being subjected to their parentsrsquo divorce should be protected from future relationship stress with a presumption against relocation In the largest study ever conducted of the effects of relocation on children of divorce (Braver Ellman amp Fabricius 2003) the authors concluded that relocation of the child away from the lower time parent after divorce had serious long term negative impacts on children subjected to this harm Sadly the authors found that 48 of children in families with shared parenting arrangements were subjected to relocations This rose to 75 for children in families with sole maternal legal custody As a direct consequence of these relocations over half of all children of divorce eventually lose all contact with their lower time parent (typically their father) Relocation is a critical factor in children losing their relationships with their fathers About 60 of custodial parents will relocate the child within two years of divorce The average move is about 400 miles (Schacter 2004) As the child is typically age 5 to 6 at divorce and age 7 to 8 at the time of the relocation the relocation will adversely affect the childrsquos relationship not only with the other parent but also with school peers pets community activities and the childrsquos extended family More than a quarter of all American children do not have meaningful contact with their biological father
David Spring April 2008 Addendum Page 24 of 34 Girls without a father in their life are two and a half times as likely to get pregnant and 53 percent more likely to commit suicide Boys without a father in their life are 63 percent more likely to run away and 37 percent more likely to abuse drugs Both girls and boys are twice as likely to drop out of high school twice as likely to end up in jail and nearly four times as likely to need help for emotional or behavioral problems US Department of Health and Human Services Press Release March 26 1999 The best predictor of crime in a community is the percentage of absent father households Seventy percent of US citizens believe that the most significant family or social problem facing the US is the physical absence of the father from the home resulting in a lack of involvement of fathers in the rearing and development of children Domininci amp Bayh 1999 Introduction to the Responsible Fatherhood Bill (S 1364) The quality of the relationships between BOTH parents and the child following divorce are independently and positively related to the childrsquos emotional well being (Sandler Cookston amp Braver 2008) The authors note that ldquothere is a growing consensus that childrenrsquos relationships with both the custodial mother and non-custodial father impact their adjustment following divorcerdquo (page 292) In a survey of grown children of divorce over 80 stated that the wished they had been permitted to spend more time with their fathers (Finley amp Schwartz 2007) The authors noted that ldquothe fatherrsquos frequent physical presence in all aspects of his childrsquos life appears to be requiredrdquo (to meet the emotional needs of the child) ldquoEquitable joint physical custody (ie shared parenting) appears to be the post-divorce arrangement most preferred by children of divorcehellip (and will result in) decreases in feelings of emotional longing in children from divorced familiesrdquo (page 583) Relocation can severely alter the quality of the other parentrsquos involvement Geographic proximity (especially both parents remaining in the same school district) greatly facilitates a fatherrsquos ability to engage in a meaningful way with his children When the father is allowed to have an ongoing and meaningful relationship with the child the child does reasonably well However if the father is shut out of the childrsquos life for any reason the childrsquos emotional and academic development is placed at risk While mothers often claim the reason they relocated was to improve their financial situation there is rarely any change in their financial circumstances (McLanahan amp Sandefur 1994) In fact it is likely that relocation will worsen the motherrsquos financial situation as relocation often has an adverse impact on child support payments Relocation impacts child support in that if the father feels he has been treated unfairly and shut out of the childrsquos life then less child support is paid (Braver et al 1993) Numerous studies have shown that fathers are as capable as mothers of being competent and nurturing caregivers (Silverstein amp Auerbach 1999) Washington State law presumes that it is in the best interest of the child to preserve and foster the childrsquos relationships with both parents after divorce (RCW 2609002) Child Support policies which equitably divide the cost of child rearing between both parents will also help to preserve and foster the childrsquos relationship with both parents Thus more equitable policies would also be in the best interest of the child Given how harmful relocation after divorce is to children it would be harmful to children to have a residential credit policy unless there was also a retention of residential credit policy to reduce the financial incentive to relocate a child in order to avoid a residential credit
David Spring April 2008 Addendum Page 25 of 34 The following policy is discussed in more detail on pages 33 and 34 of the March Addendum It is intended in part to retain the original residential credit in cases wherein the higher time parent attempts to relocate the child away from the lower time parent This policy is needed to prevent the residential credit from becoming a financial incentive for relocation Either parent may seek an adjustment to increase or decrease the residential credit based upon providing evidence of a substantial change in circumstances to the court The court shall make a written finding as to which parent was primarily responsible for the change in circumstances If the court finds that the obligor parent failed to take full advantage of their residential time with the child the court shall reduce the residential credit to the credit the parent would have received based upon the time actually spent caring for the child If the court finds that actions of the higher time parent such as voluntarily relocating the child so far away from the lower time parent as to make the prior residential schedule impractical then the prior residential credit shall be retained In cases where both parents or neither parent was primarily responsible for the change in residential schedule the court will make an equitable determination on a case by case basis This policy also addresses the concern of higher time parents that the lower time parent will get a residential credit without actually following through by spending time with the child But the real winner is the child who will benefit from a higher likelihood of keeping both parents
David Spring April 2008 Addendum Page 26 of 34 Section Six Determining the amount the median lower time parent Has been overcharged As noted above the median non-intact family has one child with a combined median net monthly income of about $3600 and a current total combined obligation of about $612 using a ldquosingle column averagerdquo rate of 17 under the current table The actual rate under the ldquotwo columnrdquo current table is about 15 for younger children and 19 for older children See Spring February Addendum page 58 Under the Betson Rothbarth Table the rate would rise to about 21 for a total obligation of $756 Under the Spring marginal table the rate would fall slightly to 15 for a total obligation of $540 In addition the median every other weekend plus half the school holidays plus two weeks in the summer schedule results in the child being with the lower time parent about 6 to 9 days per month Thus the lower time parent typically cares for the child 20 to 25 percent of the time The following table confirms the degree to which the Betson method of calculating the total obligation combined with the Betson method for calculating the residential credit results in overcharging the lower time parent Comparison for 4060 Net Income split and 8020 Residential Time Split Comparing Three Options
Current Table with Traditional Residential Credit
Spring Table with Traditional Residential Credit
Betson Table with Betson Multiplier Resid Credit
Total Combined monthly obligation
$612 $540 $756
Residential Credit 20 x $612 = $122 20 x $540 = $108 10 x $756 = $76 Assumed Obligation Higher Time parent
40 x $612 = $245
40 x $540 = $216
40 x $756 = $302
Assumed Obligation Lower Time parent
60 x $612 = $367
60 x $540 = $324
60 x $756 = $454
Assumed Cost to Higher Time Parent
80 x $612 = $490
80 x $540 = $432
90 x $756 = $680
Assumed Cost to Lower Time Parent
20 x $612 = $122
20 x $540 = $108
10 x $756 = $76
Transfer payment $367 - $122 = $245 $324 - $108 = $234 $454 - $76 = $378 Residential Credit = 20 of combined obligation using the traditional cross credit method and 10 of combined total obligation using the Betson Multiplier method See the second chart on Page 10 of this report Subtracting the $36 per month credit which is the lower time parentrsquos equitable share of the child tax credit results in an equitable transfer payment of $234 - $36 = $198 per month Thus for the past 20 years the median lower time parent has been overcharged about $367 - $198 = $169 per month Put another way lower time parents have been paying about double what they should have been paying It is no wonder so many of them are living out of their cars failing to make their support payments dropping out of their childrsquos life andor committing suicide
David Spring April 2008 Addendum Page 27 of 34 Interestingly the major problem has not been the inflated rate used in the current Economic Table but the failure to grant a residential credit The Economic Table has accounted for $245 - $234 = $11 of the overcharge while the failure to provide a residential credit has accounted for $169 - $11 = $158 of the overcharge Thus the most important factor in approaching an equitable division of the total child rearing obligation is not lowering the Economic Table but rather lowering the threshold to 20 of parenting time and thereby granting more lower-time parents an equitable residential credit The Betson Rothbarth Per CapitaTable without any residential credit would result in a lower time parentrsquos monthly transfer payment of $756 x 60 = $454 This is obviously much more than double the equitable transfer payment of $198 In fact since the federal tax credit is at least $180 the higher time parent would receive $454 plus $180 per month which equals $624 per month This exceeds the estimated combined per divorce child cost of $540 by $84 per month Thus not only does the higher time parent pay none of the estimated pre-divorce child cost but she makes $84 per month over and above the child cost Thus adopting the Betson Rothbarth Table will greatly increase the financial incentive for divorce Since the Betson multiplier method results in a lower percentage for the residential credit even with a residential credit the Betson method results in a transfer payment of $378 per month This is 50 greater than the current Economic Table with a residential credit and about 90 greater than an equitable transfer payment of $198 Thus the current Economic Table overcharges the median lower time parent by about $169 per month This works out to about $2000 per year Since the lower time parent is overcharged for about 18 years the total overcharge is at least $36000 not including interest Given that millions of lower time parents have been overcharged during the past 30 years this sounds like an adequate basis for a multi-billion dollar class action lawsuit Of course those who have suffered the most harm are the millions of children who lost their relationships with their lower time parents as a result of this extremely unjust system We cannot undo the harm inflicted in the past on lower time parents and their children However we can greatly reduce the injustice inflicted in the future by simply lowering the threshold for the residential credit to 20 of residential time and retaining our Statersquos traditional cross credit method for calculating the residential credit The Betson Rothbarth Table would overcharge the median lower time parent by $378 - $198 = $180 per month Adopting the Betson Residential credit method even with the Betson residential credit would actually increase the overcharging of lower time parents This is because the Betson 10 residential credit is only half of the traditional 20 credit while the Betson Rothbarth Economic Table is much greater than the current Economic Table Thus the Betson multiplier method would result in a residential credit with no actual benefit to the median lower time parent and would result in overcharging lower time parents by at least 90
David Spring April 2008 Addendum Page 28 of 34 Section Seven Shortcomings of the USDA Per Capita Method On April 19 2008 Bob Shirley emailed work group members the latest report from the USDA containing their ldquoestimaterdquo of the cost of child rearing 8 Some have criticized the USDA for using extremely old CEX data and merely updating it every year with the latest Consumer Price Index adjustment For example on page (i) the author Mark Lino states ldquoData used to estimate expenditures on children are from the 1990-1992 Consumer Expenditure Survey ndash Interview portion (CE) rdquo On page (iii) Lino added ldquoAlthough based on the 1990-1992 CE the expense estimates were updated to 2007 dollars using the Consumer Price Index (CPI)rdquo But the truth is that it does not matter which years of CEX data one uses since there has been no real change in the CEX data for at least 30 years Clearly the USDA is aware of this fact or they would have used more recent CEX data Instead whatever method one is using will essentially determine the result one gets regardless of the year of the report Thus the USDA reports the same ratio of child cost to total income today that they reported 28 years ago (about 26) Dr Betson also reports essentially the same Per capita Rothbarth result today that he reported 28 years ago (about 25) He also reports the same per capita Engel result today that he reported 28 years ago (about 28) Finally the Florida State marginal Engel result in 2004 is essentially the same as the Williams marginal Engel result in 1988 (about 20) These remarkably consistent results over time are due to the fact that child rearing costs as a percent of total family spending have been extremely stable over the years Thus child costs increase in the same ratio as total family income and rise at the same rate of total family income Because the Economic Table already has this built in adjustment for inflation there is no need to change the table over time In other words while inflation may raise the absolute amount of child costs over time inflation does not change the ratio of child costs to total costs over time The real problem with the USDA result is not that it is outdated but that it is based upon the false ldquoper capita assumptionrdquo that children cost the same as adults In every USDA report the author (Mark Lino) notes that about 50 of their estimate is based upon data he believes to be credible The remaining 50 of the USDA estimate including housing costs is based upon the ldquoper capita assumptionrdquo that children cost the same as adults On page (1) of the USDA report Mark Lino states ldquoUnlike food and health care no research base exists for allocating estimated household expenditures on housing transportation and other miscellaneous good and services among family members USDA uses the per capita method in allocating these expenses the per capita method allocates expenses among household members in equal proportions ldquo Of course the claim that ldquono research base existsrdquo for housing costs or transportation costs is absurd There is a mountain of research in both of these areas This research is well summarized on the Rogers Cost Share website as well as in each of my prior addendums 8 Lino M (2008) Expenditures on Children by Families 2007 US Department of Agriculture Center for Nutrition Policy and Promotion Miscellaneous Publication No 1528-2007
David Spring April 2008 Addendum Page 29 of 34 Instead Lino is simply ignoring the mountain of research that is out there for the sole purpose of artificially inflating the cost of child rearing Put another way the USDA method is to get exact (marginal) results for well researched child cost areas and then apply a ldquoper capita methodrdquo to estimate child costs in areas they claimed were not well researched The USDA method divides all child costs into a total of seven areas The four well researched areas that were 50 of the USDA estimate included Food clothing health care and ldquochild care and educationrdquo The three unresearched areas that were the other 50 of the USDA estimate included Housing transportation and miscellaneous goods and services Thus in an intact two parent one child family (which is the basis of the Income Shares assumption and supposedly the basis of the Washington State Economic Table) the child cost for 50 of the families expenses is assumed to be 100 of combined family expenses for those areas divided by 3 = 33 The USDA result has been reported in several PSI reports as being about 26 of total combined net income From these two numbers we can estimate what the USDA cost of one child was for the remaining 50 of family expenses In other words what number would be needed to balance out 33 so that the average of the two numbers would be 26 The answer is 26 minus (33 minus 26) or 26 minus 7 equals 19 Put another way the 50 of the USDA estimate that is based on credible scientific studies concluded that child cost in those areas was less than 20 of total family spending in those areas In order to artificially increase the estimate of child costs to politically acceptable levels the USDA then arbitrarily used a per capita estimate of 33 for the remaining unstudied areas of family spending in order to reach the ridiculous conclusion that one child costs 26 of total family spending in an intact family For the USDA estimate to be true child costs averaged 19 for the well researched areas and suddenly jump up to 33 for the unresearched areas This is your tax dollars at work for the sole purpose of misleading the public Taking just one area housing costs as an example it defies logic and common sense that in an intact two family household the child can possibly account for 33 of total family spending on housing Anyone who has had a child knows that before the child was born the intact family had X expense on housing and that this cost did not change after the child was born At some point the child is given their own bedroom and for the median low income family that typically will later go through divorce this may mean moving from a one bedroom apartment to a two bedroom apartment Thus the cost of the child can easily be determined just by going to any newspaper and comparing the cost increase of a two bedroom apartment to a one bedroom apartment Thus is what the Self Sufficiency Survey did and what the Spring (2008) analysis did The result is about $200 per month or about 20 of combined family spending on housing Clearly 20 for housing cost is much less than the 33 housing cost assumed by the USDA
David Spring April 2008 Addendum Page 30 of 34 Over-estimation of housing costs The following example shows that dividing housing costs on marginal rather than a per capita basis results in an actual reduction of as much as 50 If a childless couple lives in a one bedroom apartment costing $500 per month and moved to a two bedroom apartment costing $600 per month after having a child USDA would estimate the child cost to be $6003= $200 = 33 of total costs By contrast the true additional cost or marginal cost of the child would be $600-500 = $100 = 20 of total costs But the error in estimation is not 33-20 = 13 Instead it is $200-$100$100 = 100 difference in estimation Thus if the per capita estimate of child cost is 26 the marginal estimate might only be 13 For the USDA report to be true then two bedroom apartments would have to cost 50 more than one bedroom apartments I challenge those who believe in either the Betson or Lino per capita estimation methods to show me a single ad in any newspaper in America in which the cost of a 2 bedroom apartment is 50 greater than a one bedroom apartment or even 33 greater than a one bedroom apartment The reason we can be certain that per capita estimates are extremely inflated is that any application of the per capita estimation method to any data area for which costs can actually be verified leads to obviously absurd results For example the per capita assumption applied to the birth of the first child leads to the absurd conclusion that if the day before the child is born the total cost of the two parents is $3000 per month then the day after the child is born the total cost of the two parents plus the child is $4500 This means that all parents would have to increase their income by 50 just to have one child First of all we know that parental income typically does not increase at all with the birth of the child It may even fall as one or both parents take time off from work to care for the child In addition we know that while families with one child do have slightly higher total incomes than families without a child the rise in income is only about 10 not the 50 predicted by the ldquoper capitardquo assumption Over-estimation of Transportation costs are also divided by USDA on a per capita basis Thus a family of two without a child whose annual car expense is $6000 the day before a baby is added to an expectant family is allocated at $3000 for each parent The next day with baby arrived the cost of the car attributed to the baby suddenly on the scene is $2000 Certainly the mileage directly associated with transporting children would be more accurate than USDA estimate which is an obvious exaggeration Over-estimation of Miscellaneous costs are also divided by USDA on a per capita basis However miscellaneous costs in the CEX data base specifically include such things as manicures make-up hair styling health club memberships country club memberships etc Surely many of the expensive costs associated with maintaining adults should not be equally distributed amongst all family members including children since they are not costs associated with raising children Certainly none of these things are basic essential costs of child rearing Thus per capita estimation of the misc category also greatly over-estimates child rearing costs
David Spring April 2008 Addendum Page 31 of 34 Equally troubling is the USDA refusal to even acknowledge the dozens of marginal cost studies that have been done during the past 40 years If one were to only read the USDA report (andor the PSI reports) one might falsely conclude that the only studies ever done on the cost of child rearing are the Per Capita estimates of the USDA and Dr Betson This clearly was the mistaken conclusion of the 2005 Washington State Child Support Work Group In adopting this self-serving tunnel vision approach to child cost research the USDA justifies its artificially inflated estimates by observing that its Per Capita 26 estimate is conveniently between Betsonrsquos 25 Per Capita Rothbarth estimate and Betsonrsquos 28 Per capita Engel estimate In fact the true reason these three estimates are so similar is because all three are based upon the per capita assumption There have been over a dozen marginal studies done during the past 40 years Some have used the Engel method some have used the Rothbarth method and some have used direct estimation methods I have cited these dozens of studies numerous times in my past submissions so I will not cite them again here But these marginal studies have resulted in child cost estimates ranging from 10 to 20 of total family spending Even at the highest of these estimates with the child cost in an intact two parent family at 20 each parent costs 40 so that the combined family spending equals 40 + 40 + 20 = 100 Thus one child at most costs HALF of what one adult costs More typically the majority of studies found the one child costs about a Third of what one adult cost But NO credible study has ever found the child to cost the same as an adult It is therefore pretty mind boggling that the USDA continues to use the per capita assumption for 50 of its expenses when its own research has concluded that child costs are only 19 of total family spending for the 50 of its data which is not arbitrarily based on the per capita assumption Because the 2005 Work group failed to understand the history of our Economic Table and failed to understand the per capita basis to the Betson methods they voted to dramatically increase the Economic Table even though there was no evidence to support a change in the ratio of child costs over time Hopefully this current work group will be much better informed than the 2005 Work group The fate of literally millions of children and their important emotional relationships with both of their parents hangs in the balance (For a more detailed analysis of the shortcomings of all per capita estimation methods see the February 2008 Addendum)
David Spring April 2008 Addendum Page 32 of 34 Section Eight Conclusion What is in the best interest of the child The Betson multiplier method is based upon the assumption that child costs increase 50 in shared parenting arrangements This in turn requires a 50 increase in combined parental income However scientific research and well as common sense confirms that parental income does not increase after divorce Nor do total child costs increase in shared parenting arrangements Instead parental incomes remain about the same after divorce as before divorce As there are more non-child costs after divorce than before divorce the ratio of funds spent on the child in either household are actually likely to fall rather than rise What Dr Betson multiplier method is really advocating for is retaining the childrsquos (and motherrsquos) financial standard of living post divorce to the same level that it was pre-divorce He is claiming that the size of the childrsquos sugar bowl in the higher time parentrsquos house should not change after divorce because the ldquochild and mom eat out of the same sugar bowlrdquo So if the child is to have two sugar bowls instead of one the size of the sugar bowl should be increased 50 so that the momrsquos sugar bowl stays the same size and thus the mom and child will not be financially impacted by the divorce As it is rarely possible for the combined income to increase 50 Dr Betson is really saying it is better for the child to have one large sugar bowl at the momrsquos house than to have two smaller sugar bowls in two houses Dr Betson assumes that all that it important to the child is the stability of the childrsquos financial well being He ignores the fact that stability of the childrsquos emotional well being is far more important to the childrsquos development than stability of the childrsquos financial well being The child ldquotrue standard of livingrdquo has BOTH financial and emotional components In retaining one large sugar bowl at the momrsquos house the child retains a high financial standard of living but the childrsquos emotional standard of living is cut in half by the loss of one of the childrsquos important attachment figures If instead one assumes that retaining the childrsquos emotional standard of living post divorce is more important than retaining the childrsquos financial standard of living then it is more preferable that the child have two smaller financial sugar bowls so that the child can retain both emotional sugar bowls In other words it is better to cut the childrsquos financial standard of living in half by living in two less expensive households than to cut the childrsquos emotional standard of living in half by eliminating one of the childrsquos attachment figures (more commonly referred to as parents) Driving a loving and devoted parent out of a childrsquos life is more harmful to a childrsquos development than cutting off one of the childrsquos arms This is why the Washington State Parenting Act states that it is in the best interest of the child to FOSTER the childrsquos relationships with both parents after divorce Dr Betsonrsquos multiplier method also includes several other faulty assumptions Among these are that a child has ldquoduplicated costsrdquo which he assumes to be 50 of the total (this is the D in his equations) Variable costs which depend on the amount of time with each parent which he assumes to be 40 of total costs (this is the V in his equations) and costs that travel with the child which he assumes to be 10 of total costs This is the childrsquos clothing which he assumes will travel with the child and are paid for fully by the higher time parent There is no scientific support for any of these assumptions
David Spring April 2008 Addendum Page 33 of 34 Instead scientific research and common sense confirm that the child typically has clothing and toys at both households that are paid for by the parent at that household In addition once the threshold exceeds 20 of total time it is likely that the child will have a bedroom at each household This bedroom at each household is essential to the childrsquos emotional well being as one of the main emotional problems faced by children of divorce is insecure attachment related to a fear of abandonment by one or both parents The bedroom at both households is a physical symbol to the child that they will not be abandoned by that parent while the child is at the other parentrsquos house An important part of the child (the bedroom) is retained at both households This bedroom is such a huge part of the total cost of child rearing that it is likely that the lower time parentrsquos per day expenses will greatly exceed the higher time parentrsquos per day expenses This is particularly true in cases where the division is very great (ie 80-20 time splits) Rather than the child having duplicated expenses of 50 and variable expenses of 40 and non-traveling (controlled) expenses of 10 it is likely that nearly all expenses in shared parenting arrangements except for food are duplicated expenses Thus it is likely that in shared parenting arrangements the size of the childrsquos financial sugar bowl will be cut in half in that the child will have two smaller sugar bowls rather than one big sugar bowl But the research on shared parenting confirms that these two smaller financial sugar bowls result in better child outcomes because the child also retains both emotional sugar bowls Thus stability of the attachment figures in the childrsquos life is more important to the childrsquos development that maintaining the size of the childrsquos financial sugar bowl in the higher time parentrsquos household The Betson multiplier method is not in the best interest of the child not only because it is based on numerous faulty assumptions but because it is harmful to shared parenting and therefore harmful to children of divorce In the most common cases (80-20 time splits) it results in a residential credit that is only half of the lower time parentrsquos actual per day expenses This makes it extremely difficult for the lower time parent to pay for the childrsquos bedroom and stay in the childrsquos life By contrast the traditional cross credit method treats both parents equally on a per day basis This Addendum confirms that the failure to provide a residential credit results in the lower time parent being ldquodouble-chargedrdquo for any time they spend caring for the child This is contrary to both the ldquoequitablerdquo requirement in the Child Support Act and the ldquofoster the childrsquos relationship with both parentsrdquo requirement of the Parenting Act Sterling (2003) concluded that residential credits are awarded in Washington State in only 4 of the cases This Addendum recommends retention of the traditional cross credit method for calculating the amount of the credit and lowering the threshold to 20 for determining the availability of the credit Also recommended is addition of provisions for fairly dealing with the residential credit over time These changes would result in a residential credit in about 50 of all cases and would bring child support awards more closely aligned to the primary intentions of the Washington State Child Support Act and the Washington State Parenting Act
David Spring April 2008 Addendum Page 34 of 34 References Adam E K (2004) Beyond Quality Parental and Residential Stability and Childrenrsquos
Adjustment Current Directions in Psychological Science 13 (5) 210 ndash 213 Bauserman R (2002) Child adjustment in joint-custody versus sole-custody
arrangements A meta-analytic review Journal of Family Psychology 16 91ndash102
Betson D (2004) Shared Parenting Visitation and Child Support Work Product of Indiana Judicial Council Review of Support Guidelines
Betson D (2008) Residential Credit PDF Emailed to the Washington State Child Support Work Group on March 11 2008
Braver S Wolchik SA Sandler IN Sheets VL Fogas B amp Bay RC (1993) A longitudinal study of noncustodial parents Parents without children Journal of Family Psychology 7 9-23
Braver S L Ellman I M amp Fabricius W V (2003) Relocation of children after divorce and childrens best interests New evidence and legal considerations Journal of Family Psychology 17 206ndash219
Finley GE amp Schwartz SJ (2007) Father Involvement and Long Term Adult Outcomes The Differential Contributions of Divorce and Gender Family Court Review 45 (4) 573-587
Flouri E amp Buchanan A (2004) Early fathers and mothers involvement and childs later educational outcomes British Journal of Educational Psychology 74 (2) 141-153
Humke C amp Schaeffer C (1995) Relocation A review of the effects of residential mobility on children and adolescents Psychology A Journal of Human Behavior 32 16ndash24
Jordan W J Lara J amp McPartland J M (1996) Exploring the causes of early drop-out among race-ethnic and gender groups Youth amp Society 28 62ndash94
Kelly J B amp Lamb M E (2003) Developmental issues in relocation cases involving young children When whether and how Journal of Family Psychology 17 193ndash205
Lino M (2008) Expenditures on Children by Families 2007 US Department of Agriculture Center for Nutrition Policy and Promotion Miscellaneous Publication No 1528-2007
McLanahan S amp Sandefur G (1994) Growing up with a single parentrdquo What hurts what helps Cambridge MA Harvard University Press
Sandler I Miles J Cookston J amp Braver S (2008) Effects of Father and Mother Parenting on Childrenrsquos Mental Health in High and Low Conflict Divorces Family Court Review 46 (2) 282-296
Schacter JP (2004) Geographic mobility 2002 to 2003 (US Census Bureau No P20-549 Washington DC US Department of Commerce
Silverstein L B amp Auerbach C F (1999) Deconstructing the essential father American Psychologist 54 397ndash407
Sterling K (2003) Washington State report Tucker J Marx J amp Long L (1998) ldquoMoving onrdquo Residential mobility and childrens
school lives Sociology of Education 71 111ndash129 Warshak R A (2000) Social science and childrens best interests in relocation cases
Burgess revisited Family Law Quarterly 34 83ndash113
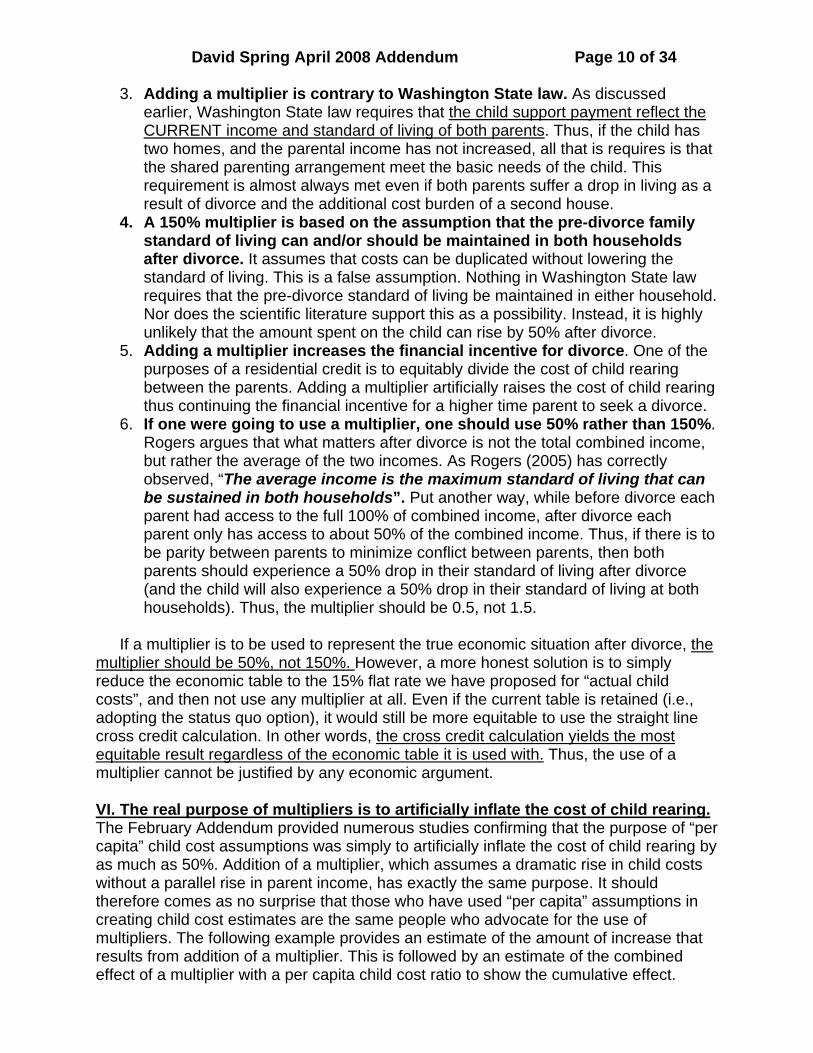
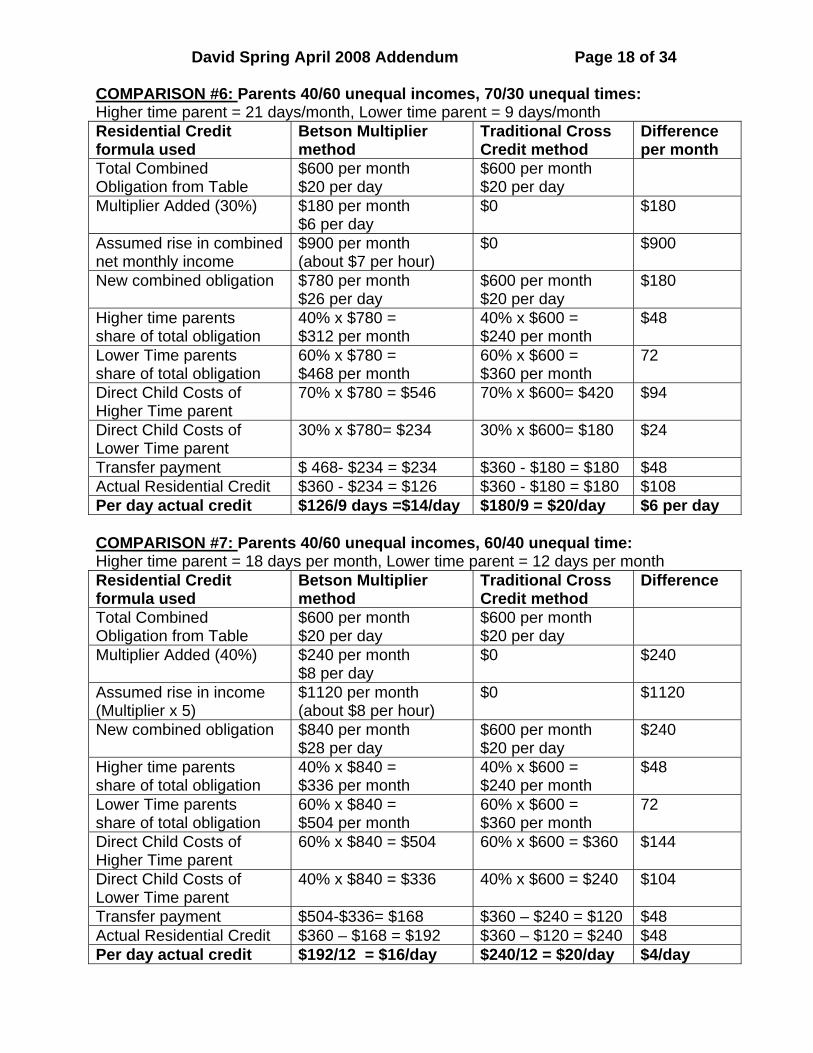
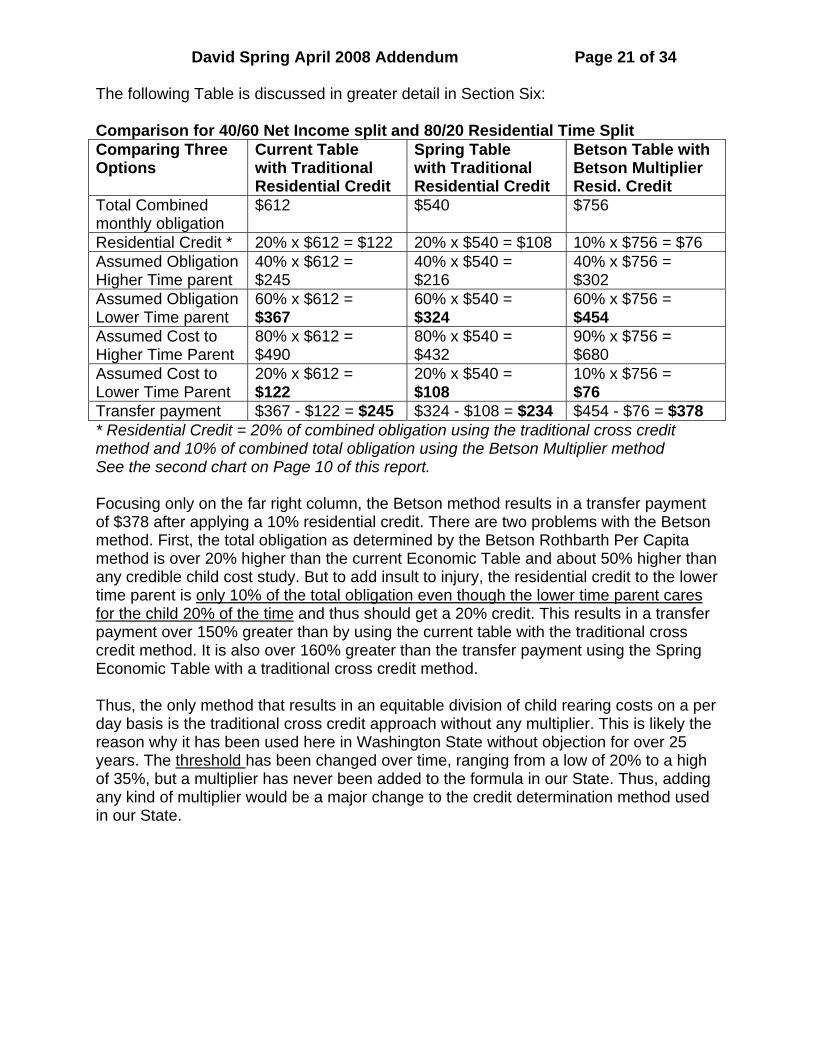