Embed Size (px)
Citation preview

April 2019Page 1

April 2019Page 2
This presentation may contain statements that are forward looking. These statements are based on current expectations and assumptions that are subject to risks and uncertainties, which may cause actual results to differ materially. A summary of risks and uncertainties is described in more detail in our periodic reports filed with the Securities and Exchange Commission (SEC).
We undertake no duty to update or revise this presentation, whether as a result of new information, future events or otherwise. For the most recent financial, risk and other information about PACCAR, please see our SEC filings and most recent earnings release available on the Investor Relations page of www.paccar.com.
Disclosure Regarding Forward-Looking Statements

April 2019Page 3
Truck and
Other78%
Financial Svcs6%
Parts16%
PACCAR A Global Technology Company in Commercial Vehicles
Truck and Other$18.3B Revenues
Premium Quality Light, Medium and Heavy Commercial Vehicles, Diesel Engines and Powertrain Components
Aftermarket Parts $3.8B Revenues
Distribute Aftermarket Parts through Global Network of over 2,200 Dealerships
Financial Services $1.4B Revenues
Finance and leasing portfolio of 198,000 trucks and trailers, with assets of $14.4B
80 Years of Consecutive Profitability; Dividend Paid Every Year Since 19412018 Revenues $23.5B 2018 Net Income $2.2B 2018 Dividend Yield 4.6%

April 2019Page 4
Quality Highest Integrity
Operational Excellence
Conservative Financial
ManagementLong-Term Perspective
Our CulturePACCAR is a company with a great culture and a bright future. Our focus is on doing things in an ethical and disciplined manner. We make decisions utilizing conservative financial principles and common sense for the long-term benefit of our customers, employees and shareholders.

April 2019Page 5
PACCAR’s business segments include Commercial Vehicles, Powertrain, Aftermarket Parts, Financial Services and Information Technology. PACCAR’s premium brands Kenworth, Peterbilt and DAF are the premier light, medium and heavy duty commercial trucks in their markets. Other brands include PACCAR Powertrain, PACCAR Parts, PACCAR Financial, and PACCAR Leasing.

April 2019Page 6
Products
• PACCAR’s product investments deliver industry-leadingperformance and value to our customers
• Our products reflect our core brand values of quality, innovation and technology
6-16t Vocational >16t

April 2019Page 7
The integrated PACCAR Powertrain is the most advanced powertrain in the market. The PACCAR MX-13 and MX-11 engines are optimally matched to the advanced PACCAR 12-Speed automated transmission and the efficient 40K tandem drive axle to achieve exceptional performance and fuel economy.
The PACCAR MX-13 engine offers 510 hp and 1,850 lb.-ft. of torque and the PACCAR MX-11 engine features 430 hp and 1,650 lb.-ft. of torque. PACCAR designs MX engines to an industry-leading B10 life of one million miles. This means 90% of PACCAR MX-13 and MX-11 engines are expected to reach one million miles without the need for a major overhaul.
In addition to the PACCAR tandem drive axle, Kenworth and Peterbilt offer the PACCAR steer axle. DAF trucks include a range of lightweight and durable PACCAR front and rear axles.

April 2019Page 8
0
50
100
150
200
2009 2010 2011 2012 2013 2014 2015 2016 2017 2018
Units (000s)
BrasilAustraliaMexicoCanadaUSEurope
PACCAR Truck ProductionOver 1.3 Million Trucks Produced 2009 - 2018
189.1
61.078.8
138.0 140.4 137.1 142.9154.7
140.9158.9
PACCAR produced a record 189,100 trucks in 2018

April 2019Page 9
0
5
10
15
20
25
0
5
10
15
20
25
99 00 01 02 03 04 05 06 07 08 09 10 11 12 13 14 15 16 17 18
$ Billions$ Billions Revenues
0.00.40.81.21.62.02.4
0.00.40.81.21.62.02.4
99 00 01 02 03 04 05 06 07 08 09 10 11 12 13 14 15 16 17 18
$ Billions$ Billions Net Income
PACCARExcellent Financial Performance Throughout the Business Cycle
CAGR = 6%
CAGR = 9%
• Reputation for superior operational excellence
• Increase in revenues and net income reflect growth in market share in North America and Europe, record aftermarket parts sales and growth in financial services
• Maintain profitability throughout the cycle due to strong cost control discipline and experienced management team

April 2019Page 10
-9%
-6%
-3%
0%
3%
6%
9%
12%
-9%
-6%
-3%
0%
3%
6%
9%
12%
09 10 11 12 13 14 15 16 17 18PACCAR Volvo DaimlerVolkswagen Iveco Navistar
• PACCAR’s operating margin has been at the top of the industry since 2012, reflecting the premium value of our products and our leadership in operating efficiency.
• This is a testament to the outstanding performance of PACCAR’s 28,000 employees.
Best-in-Class Operating EfficiencyCommercial Vehicle Segment Operating Margin

April 2019Page 11
0
4
8
12
16
20
24
0
4
8
12
16
20
24
09 10 11 12 13 14 15 16 17 18PACCAR Volvo Daimler Volkswagen CNH Navistar
Best-in-Class Operating EfficiencyInventory Turns
PACCAR’s inventory turns are the highest in the industry, a result of the PACCAR Production System, Lean Manufacturing and Six Sigma

April 2019Page 12
0%
4%
8%
12%
16%
0%
4%
8%
12%
16%
09 10 11 12 13 14 15 16 17 18PACCAR Volvo Daimler Volkswagen CNH Navistar
Best-in-Class Operating EfficiencySG&A % of Sales
PACCAR’s SG&A as a percentage of sales is much lower than its peer group, reflecting strong financial discipline

April 2019Page 13
0
2,400
4,800
7,200
9,600
12,000
0
40
80
120
160
200
90 92 94 96 98 00 02 04 06 08 10 12 14 16 18
$/TruckUnits (000s)
Trucks Net Income per Truck
Net Income per Truck• Net income per truck is
PACCAR’s net income divided by total truck unit sales.
• Truck sales not only generate profit from the sale, but also parts and finance profit. This illustrates the strength of PACCAR’s business model, providing the highest quality trucks, aftermarket support and financing.
• PACCAR achieved record net income per truck in 2018.

April 2019Page 14
($ Millions)3/31/19
Cash & Securities $ 3,815Manufacturing Assets 7,433Financial Services Assets 14,909Total Assets $ 26,157
Manufacturing Debt $ 0Manufacturing Liabilities 5,593Financial Services Liabilities 11,459Shareholders' Equity 9,105Total Liabilities & Equity $ 26,157
• Superb balance sheet
• $3.8 billion in cash and securities to support growth opportunities and investments in all phases of the cycle
• No manufacturing debt – a capital structure that has proven beneficial throughout the business cycle
• A+/A1 credit rating provides excellent access to the credit markets for PACCAR Financial Services
PACCAR IncA+/A1 Credit Ratings
April 2019Page 15
0%5%
10%15%20%25%30%
2018
0%5%
10%15%20%25%30%
Average 2014 - 2018
Best-in-Class Return on Invested Capital
ROIC = NOPAT/(Equity + Manufacturing Debt + Postemployment Benefit Liabilities)
PACCAR’s high profitability, strong working capital management and prudent investments resulted in best in class return on invested capital of 25.6% in 2018, and an average of 21.8% over the last five years.

April 2019Page 16
• High ROI Capital Investments− ROIC 25.6% 2018
• Pay Regular Quarterly and Annual Dividend− Dividend paid every year since 1941− Total dividends paid approximately 50% of net income for many
years− Regular quarterly dividend 20-year annualized growth of 11%− Total 2018 dividends declared increased 41% (yoy)
• Opportunistic Share Buybacks− $800 Million authorized; $507 Million remaining as of 3/31/19
• Strategic M&A− Disciplined valuation and screening process− Clear path to value creation
• Pension fully funded
Capital Allocation Strategy

April 2019Page 17
0
300
600
900
1,200
1,500
0
300
600
900
1,200
1,500
99 00 01 02 03 04 05 06 07 08 09 10 11 12 13 14 15 16 17 18
$ Millions$ Millions
Dividends Stock Repurchased
Dividends Declared and Stock Repurchases
CAGR = 11%

April 2019Page 18
0%
1%
2%
3%
4%
5%
0%
1%
2%
3%
4%
5%
2009 2010 2011 2012 2013 2014 2015 2016 2017 2018
Average Dividend Yield = 3.0%
Excellent Dividend Yield
• PACCAR’s dividend yield, reflects the total quarterly + special dividends declared in the year, divided by the average stock price for the year
• PACCAR’s dividend yield has increased over the last 10 years, and averaged 3.0%

April 2019Page 19
71%
13% 10% 6%Truck Rail Pipeline Water
% Total U.S. Freight Tonnage Hauled by Transportation Mode (Source: ATA)
Trucking Moves the Economy71% of U.S. Freight is Moved by Truck
Trucking is the lifeblood of the economy. In the U.S., the economy depends on trucks to deliver ten billion tons of virtually every commodity consumed - Over 70% of all the freight transported annually. 34 million commercial trucks, including 3.7 million heavy-duty trucks, move that freight. The percentage of tonnage by mode is stable over time.

188255
400
298.112
3701060.943
410
130
197.3 180
123.4 95
2013 2018Units in Thousands
>6t Truck Market 2013 – 2.7 Million2018 – 3.3 Million
1,325
North America
South AmericaAfrica &
Middle East
Europe
India
296
355295
Rest of Asia
Russia/CISChina
222722
Australia
300
300125
1,060
190195
225
PACCAR Truck Assembly
>6t Global Truck Market
April 2019Page 21
0 50 100 150 200 250 300Hualing
IsuzuIveco
DayunKamAZ
JianghuaiNavistar
HongyanHino
Ashok LeylandBeijing Foton
Tata MotorsPACCARShaanxi
VolkswagenSinotruk
VolvoDongfeng
FAWDaimler
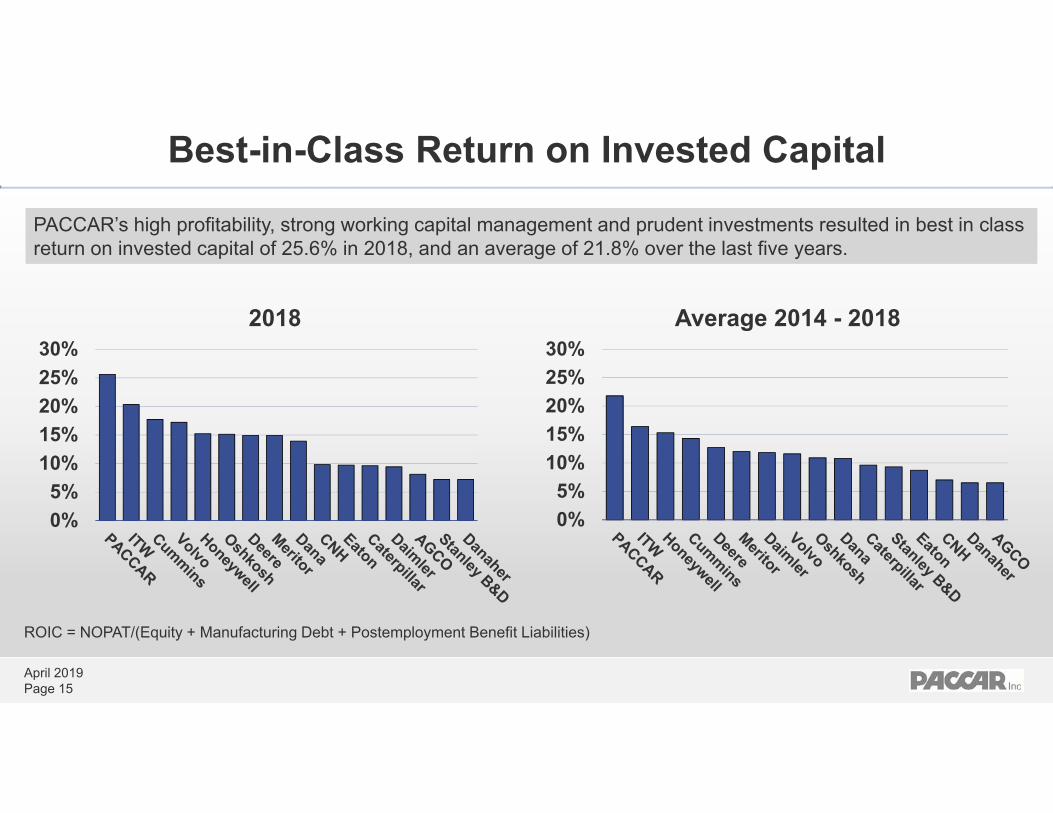
Total Production 2018 = 2.4 Million
#8
• PACCAR competes globally with truck manufacturers from North America, Europe and Asia
• PACCAR was the 8th largest heavy-duty manufacturer in the world last year, 4th among the multinational competitors. (China had 4 of the top seven producers on record production in 2018)
>16t Truck Manufacturing2018 Production (Units 000s)

April 2019Page 22
0
50
100
150
200
250
300
350
0
50
100
150
200
250
300
350
00 01 02 03 04 05 06 07 08 09 10 11 12 13 14 15 16 17 18 19
Units (000s)Units (000s)
US & Canada Europe South America
>16t Truck Market Size OutlookUnits Estimate 2019U.S. and Canada 295,000 – 315,000Europe 290,000 – 320,000 S. America 105,000 – 115,000

April 2019Page 23

April 2019Page 24
PACCAR Strategy
Premium Products and Services
Profitable Market Share Growth
Geographic Expansion
QualityQuality TechnologyTechnology InnovationInnovation
Bra
nd V
alue
sPr
ofita
ble
Gro
wth

April 2019Page 25
• Operating cash flow has averaged $2.5 billion for the last five years and has grown 8% annually over the last 20 years
• Strong operating cash flow enables PACCAR to invest in growth throughout the business cycle
• PACCAR has invested $6.1 billion in capital projects, innovative products and new technologies in the last decade
• Key investments:− International Truck of the Year 2018 DAF XF/CF trucks − PACCAR MX-13 and MX-11 engine factory in North
America− Kenworth and Peterbilt 2.1 meter wide cab program in
North America, South America, Australia− DAF Brasil factory− PACCAR Parts Distribution Centers
PACCARInvesting Throughout the Business Cycle
02004006008001,000
0200400600800
1,000
99 00 01 02 03 04 05 06 07 08 09 10 11 12 13 14 15 16 17 18 19
$ Millions$ MillionsCapital Investments and R&D Expenses
Capital R&D
0.00.51.01.52.02.53.0
0.00.51.01.52.02.53.0
99 00 01 02 03 04 05 06 07 08 09 10 11 12 13 14 15 16 17 18
$ Billions$ BillionsOperating Cash Flow

April 2019Page 26
0
100
200
300
400
500
600
700
0
100
200
300
400
500
600
700
09 10 11 12 13 14 15 16 17 18
# of Engines (000s)
# of Engines (000s)
Cumulative PACCAR MX Engines Produced
DAF MX 13 KW/PB MX 13 MX 11
• The PACCAR MX-13 is the flagship of PACCAR’s engine line-up with 454,000 engines in operation in Europe and 188,000 engines in operation in North America and a growing presence in South America and Australia.
• Produced the 200,000th MX engine for North America in March 2019
• PACCAR expanded its engine program in 2013 with the introduction of the PACCAR MX-11 in Europe. The MX-11 was launched in North America in January 2016.
Cumulative PACCAR MX Engines Produced
PACCAR MX-1110.8 Liter
PACCAR MX-1312.9 Liter

April 2019Page 27
Emerging Truck Technology Trends
• Driver Environment
• Human Machine Interface
• Augmented Reality
Driver Assistance SystemsConnectivity Human Centered Design
• Road User Safety
• Driver Shortage
• Autonomous Trucks
• Vehicle Uptime
• Artificial Intelligence
• Advanced Fleet Management
PACCAR is deploying many emerging technologies to meet customer expectations and reduce operating costs

PACCAR Emerging Technology Programs
Alternative Powertrain Vehicles Connected Trucks
Platooning Autonomous Truck Development

April 2019Page 29
Alternative Powertrain Vehicles
XF/CF HybridElectric Range 20 Miles
CF ElectricElectric Range 75 Miles
Peterbilt Electric RefuseElectric Range 80 Miles
Kenworth Hydrogen PortElectric Range 150 Miles
Peterbilt Electric PortElectric Range 150 Miles
Kenworth Hybrid ElectricElectric Range 250 Miles
PACCAR has introduced several alternative powertrain trucks currently in field-testing with customers
LF ElectricElectric Range 135 Miles

April 2019Page 30
• PACCAR Innovation Center in Silicon Valley enhances PACCAR’s access to emerging technologies and talent from around the world.
• The Innovation Center collaborates with other PACCAR engineering teams to develop next generation technologies such as an SAE Level 4 autonomous truck
• The Innovation Center truck lab is equipped with the tools needed to integrate emerging technologies.
PACCAR Innovation Center, Sunnyvale, CA

PACCAR Facility Investments
DAF Factory, Ponta Grossa, Brasil Dynacraft, McKinney, Texas
PACCAR Engine Factories DAF Cab Paint Facility, Westerlo, Belgium
April 2019Page 32
PACCAR Parts Strategy
0
1,000
2,000
3,000
4,000
0
1,000
2,000
3,000
4,000
04 05 06 07 08 09 10 11 12 13 14 15 16 17 18
$ Millions$ MillionsPACCAR Parts Sales
CAGR = 8%
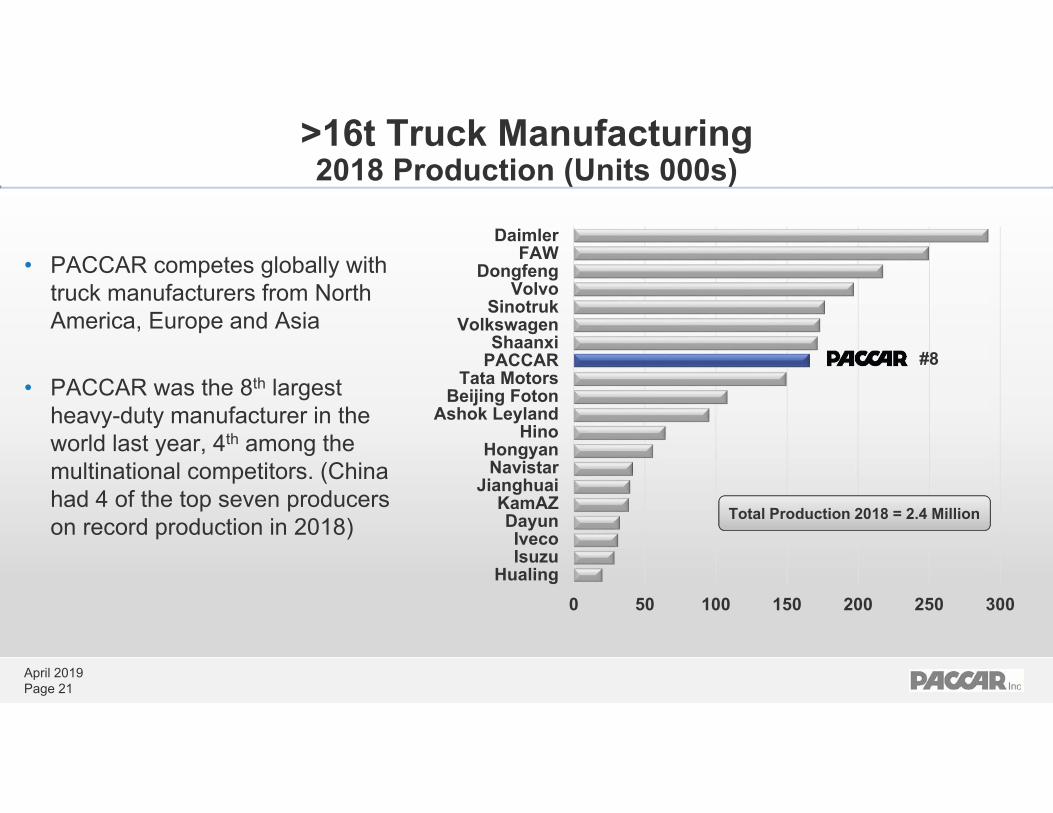
PACCAR Parts achieved $3.8 billion in sales in 2018, a 15% increase over a year ago and a CAGR of 8% over the last 15 years
Growth Drivers:• Growing population of Kenworth, Peterbilt and
DAF trucks due to geographic expansion and market share growth
• Growing population of PACCAR engines due to North America introduction in 2010
• Best-in-class Distribution Network− 18 parts distribution centers and 2,200+ dealer
locations• Proprietary, PACCAR Genuine and TRP
branded parts enhance margins• Growing network of TRP stores Toronto Parts Distribution Center opened October 2018

April 2019Page 33
PACCAR Parts Distribution Centers and Dealers18 PDCs in 11 Countries; 2,200+ Dealer Locations
PACCAR Distribution Centers
KW, PB, DAF Dealers

April 2019Page 34
PACCAR Global Dealer Network• Independent dealer network of 2,200+ dealer
locations• Premium customer experience• Strong dealer profitability and expanded
opportunities from PACCAR engines and TRP stores
• Competitive flooring and retail financing provided by PACCAR Financial and PACCAR Leasing

April 2019Page 35
400
500
600
700
800
400
500
600
700
800
99 00 01 02 03 04 05 06 07 08 09 10 11 12 13 14 15 16 17 18
Growth in Kenworth and Peterbilt Dealer LocationsU.S. and Canada
Locations Locations
PACCAR MX-13 Introduced in 2010
Dealer Investments of $1.3 Billion since 2010
70% Growth in Dealer Locations
Drives Long-Term PACCAR Parts Growth

April 2019Page 36
PACCAR Financial Services Strategy
• PACCAR Financial Services supports truck sales by providing financing and leasing services to PACCAR customers
• In 2018, PACCAR Financial financed 24% of all Kenworth, Peterbilt and DAF trucks
• Geographical diversification, disciplined credit underwriting, and rigorous portfolio management have enabled PACCAR Financial to earn excellent profits throughout the business cycle.
• Key strategies and investments:− Predictive data analytics for credit quality− Expanded used truck centers− Mobile finance and credit system− E-Contract and e-signature− Customer on-line portal
Total Assets 12/31/18 = $14.4 Billion
012345678
0
2
4
6
8
91 94 97 00 03 06 09 12 15 18
%% Low 30+ Days Past Due
U.S. & Canada$7.0 Billion
48% Europe$3.6 Billion
25%
Australia & Mexico$1.4 Billion
10%
PacLease$2.4 Billion
17%

April 2019Page 37
0%
5%
10%
15%
20%
25%
30%
0%
5%
10%
15%
20%
25%
30%
North America Australia Europe S. America
1998 2008 2018
• Since 1998, PACCAR’s above 16 tonne market share has increased in all home markets
• DAF achieved record 16.6% share in Europe in 2018, which improved to 17.1% in 1Q19
• Kenworth is the market leader in Australia • PACCAR’s investment in truck
manufacturing in Brasil supports PACCAR’s medium-term goal of 10% market share for Kenworth and DAF products in South America.
Long-Term Growth in PACCAR Heavy Duty Market Share

April 2019Page 38
DAF Entered Market in 2013
36 Dealer Locations
Heavy Duty Trucks Sales of 2,300 in 2018
Market Share 6.7% in 2018
Local Assembly of PACCAR MX Engines Since 2016
Fenabrave Brand of the Year in 2016, 2017 & 2018
Introducing PACCAR Financial in 2019
On HighwayOff Highway
DAF Brasil

April 2019Page 39
Kenworth Began Producing Trucks in 1960
133 Dealer Locations
284,000 Units Built
Heavy Duty Trucks Sales of 8,900 in 2018
Heavy Duty Market Share of 34.7% in 2018
Kenworth Launched 2.1m Trucks in 2013
Introduced PACCAR MX‐13 Engine in 2013
PACCAR Mexico

April 2019Page 40
DAF Russia established in 2011
Heavy Duty Market – 62,000 Trucks in 2018
50 DAF, Kenworth and TRP Dealer Locations
Heavy Duty Trucks Sales of 2,700 in 2018
Market Share 4.2%; 10.1% of European Brands in 2018
DAF Russia

April 2019Page 41
• Started Production in 2006
• 17 Dealer Locations
• Introduced Medium Duty LF in 2013
• Delivered >6,000 units through 2018
• Trucks Sales of 1,000 in 2018
• Heavy Duty Market Share of 16.3% in 2018
DAF Taiwan

April 2019Page 42
Environmental Leadership
CDP Climate Change A List –Top 2% of 6,900 Reporting Companies
Reduce Environmental Impact Through Product Design
Natural Gas Truck Market Share Leader in US and Canada
Alternative Powertrain Vehicles (Natural Gas, Hydrogen Fuel Cell, Electric, Hybrid)
93% of Factories are ISO 14001 Certified
75% of Factories are Zero Waste to Landfill

April 2019Page 43
First Quarter 2019 Earnings

April 2019Page 44
PACCAR Revenues and Profit
80 consecutive years of net profit
Dividends every year since 1941
First Quarter($ in Millions) 2018 2019Revenues $5,654 $6,488
Net Income $512 $629Return on Revenues 9.1% 9.7%Diluted EPS $1.45 $1.81Number of Trucks Delivered 44,500 51,500

April 2019Page 45
$5.65
$6.49
2018 2019
Sales and Revenues(Billions of Dollars)
• Record Sales and Revenues of $6.49 Billion • Record Deliveries of 51,500 Trucks• Record Net Income of $629.0 Million• After-tax Return on Revenues of 9.7%• Record PACCAR Parts Revenues of $1.00 Billion • Record PACCAR Parts Pretax Income of $208
Million, a 20.7% Pretax Return on Revenues• Financial Services Pre-Tax Income of $84 Million• R&D Expenses of $78.3 Million• Capital Investments of $134.3 Million
2019 Financial ResultsFirst Quarter 2019 vs. First Quarter 2018
$512
$629
2018 2019
Net Income(Millions of Dollars)

April 2019Page 46
25%
26%
27%
28%
25%
26%
27%
28%
13 14 15 16 17 18 1Q19
Parts
Excellent Truck and Parts Gross Margins
• Truck margins have increased due to new products and operating efficiencies
• Parts margins have benefited from investments and growing populations of PACCAR trucks and engines
Gross Margins
10%
11%
12%
13%
10%
11%
12%
13%
13 14 15 16 17 18 1Q19
Truck
12%13%14%15%16%
12%13%14%15%16%
13 14 15 16 17 18 1Q19
Total Manufacturing

April 2019Page 47
$4.35
$5.11
2018 2019
Sales(Billions of Dollars)
• Sales Increased 17% (yoy)
• Pretax Profit Increased 31%
• Record Quarterly Deliveries of 51,500
Trucks, a 16% Increase
• Price Realization of 3%
TruckFirst Quarter 2019 vs. First Quarter 2018
$395
$517
2018 2019
Segment Pretax Profit
(Millions of Dollars)

April 2019Page 48
$940$1,005
2018 2019
Sales(Millions of Dollars)
• Sales Increased 7%
• Pretax Profit Increased 8%
• Results Driven by Investments in Parts
Distribution Centers (PDCs); Increased Dealer
Locations, Including TRP Stores; Expanded
PACCAR-Branded and TRP All-Makes
Product Lines; Fleet Services and e-
Commerce Programs; and increased
PACCAR trucks and MX engines in operation
• New PDC opened in Toronto in October 2018
Aftermarket PartsFirst Quarter 2019 vs. First Quarter 2018
$192$208
2018 2019
Segment Pretax Profit
(Millions of Dollars)

April 2019Page 49
$332$350
2018 2019
Revenues(Millions of Dollars) • Revenues Increased 5%
• Pretax Profit Growth of 24%
• Increased Earning Assets
• Strong Demand for Used Trucks
− Opening Used Truck Centers in Prague,
Czech Republic, and Denton, Texas, in
2019
• Record Portfolio of 202,000 Trucks and Trailers
• Total Assets of $14.9 Billion
Financial Services First Quarter 2019 vs. First Quarter 2018
$68
$84
2018 2019
Segment Pretax Profit
(Millions of Dollars)

April 2019Page 50
PACCAR Competitive AdvantagesExperienced Management Team
Highest Quality Products
Rigorous Cost Control
Innovative Technology
Global Aftermarket Parts Sales
Strongest Dealer Network
Profitable Financial Services
Excellent Supplier Partnerships

April 2019Page 51