Embed Size (px)
Citation preview

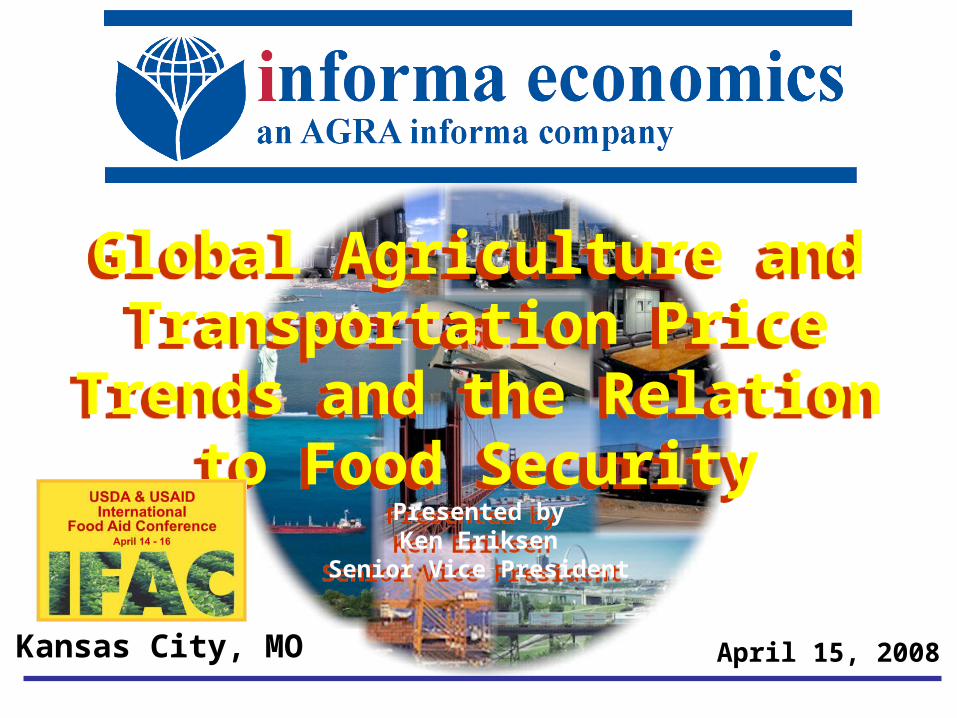
April 15, 2008Kansas City, MO
Global Agriculture and Transportation Price
Trends and the Relation to Food Security
Presented byKen Eriksen
Senior Vice President
Global Agriculture and Transportation Price
Trends and the Relation to Food Security
Presented byKen Eriksen
Senior Vice President

Transportation and Food Security Slide 2
Global Environment
The Global Age is Readily Apparent The world is shrinking Shipping options expanding
• Transportation transformation underway
The U.S. is not as pivotal
Developing Countries Slowly Coming of Age – The Awakening of Asia Continues Expanding infrastructure Port developments Still a ways to go however
Economy Driving Infrastructure Issues

Transportation and Food Security Slide 3
Weakened Currency
US$ vs. Selected Foreign Currencies
60
70
80
90
100
110
120
130
140
150
160
Au
g-9
6
Jan
-97
Jun
-97
No
v-97
Ap
r-98
Sep
-98
Feb
-99
Jul-
99
Dec
-99
Ma
y-00
Oct
-00
Ma
r-01
Au
g-0
1
Jan
-02
Jun
-02
No
v-02
Ap
r-03
Sep
-03
Feb
-04
Jul-
04
Dec
-04
Ma
y-05
Oct
-05
Ma
r-06
Au
g-0
6
Jan
-07
Jun
-07
No
v-07
Pe
rce
nta
ge
(J
an
1, 1
99
6 =
10
0)
China Yuan Canada $ Japan Yen ECU Euro Australia $
Transportation and Food Security Slide 4
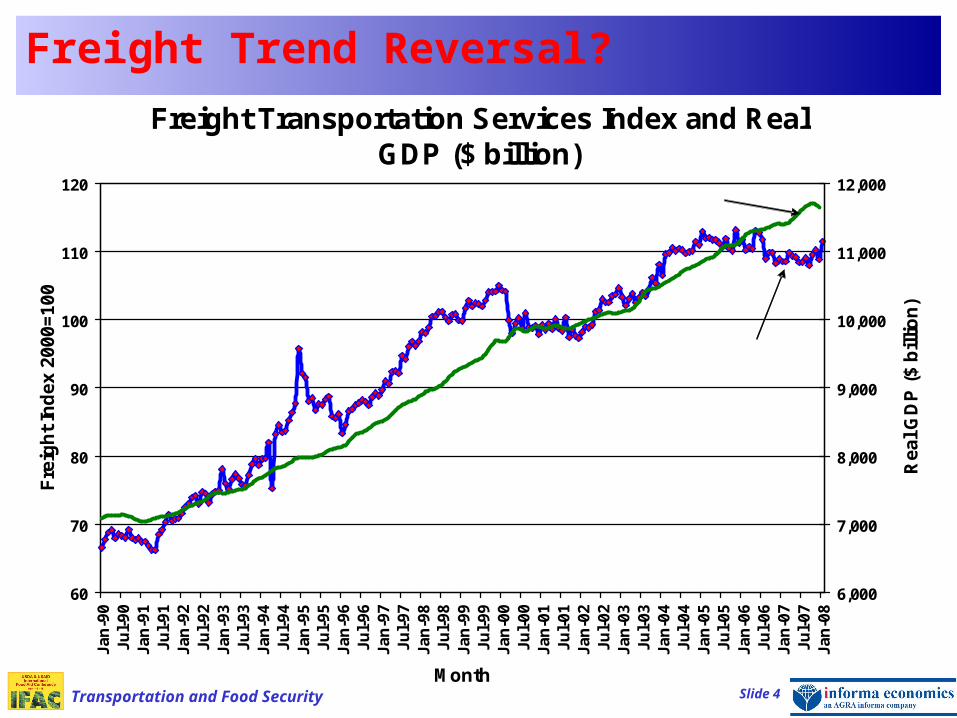
Freight Trend Reversal?
Freight Transportation Services Index and Real GDP ($ billion)
60
70
80
90
100
110
120
Ja
n-9
0J
ul-
90
Ja
n-9
1J
ul-
91
Ja
n-9
2J
ul-
92
Ja
n-9
3J
ul-
93
Ja
n-9
4J
ul-
94
Ja
n-9
5J
ul-
95
Ja
n-9
6J
ul-
96
Ja
n-9
7J
ul-
97
Ja
n-9
8J
ul-
98
Ja
n-9
9J
ul-
99
Ja
n-0
0J
ul-
00
Ja
n-0
1J
ul-
01
Ja
n-0
2J
ul-
02
Ja
n-0
3J
ul-
03
Ja
n-0
4J
ul-
04
Ja
n-0
5J
ul-
05
Ja
n-0
6J
ul-
06
Ja
n-0
7J
ul-
07
Ja
n-0
8
Month
Fre
igh
t In
dex
200
0=10
0
6,000
7,000
8,000
9,000
10,000
11,000
12,000
Rea
l G
DP
($
bil
lio
n)
Freight Index
Real GDP

Transportation and Food Security Slide 5
Freight Costs and the Economy
Rail PPI & All Items CPI Relationship
2008
198519861987
1988
1989
1990
19911992
19931994199519961997
19981999
20002001
20022003
2004
2005
2006
2007
90
110
130
150
170
190
210
230
90 100 110 120 130 140 150 160 170 180
Line-Haul, PPI
All
Ite
ms,
CP
I
Transportation and Food Security Slide 6
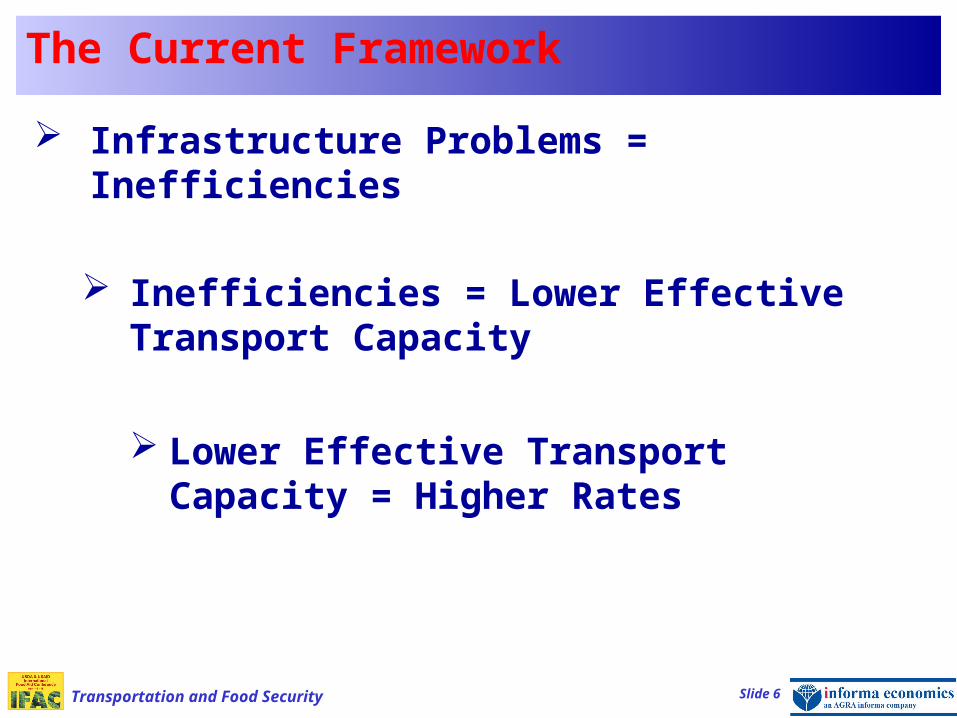
The Current Framework
Infrastructure Problems = Inefficiencies
Inefficiencies = Lower Effective Transport Capacity
Lower Effective Transport Capacity = Higher Rates
Transportation and Food Security Slide 7
Ocean Freight Rolling Along
Monthly Average Baltic Dry Index
0
2,000
4,000
6,000
8,000
10,000
12,000
Ja
n-0
0
May
-00
Se
p-0
0
Ja
n-0
1
May
-01
Se
p-0
1
Ja
n-0
2
May
-02
Se
p-0
2
Ja
n-0
3
May
-03
Se
p-0
3
Ja
n-0
4
May
-04
Se
p-0
4
Ja
n-0
5
May
-05
Se
p-0
5
Ja
n-0
6
May
-06
Se
p-0
6
Ja
n-0
7
May
-07
Se
p-0
7
Ja
n-0
8
Month and Year
Ind
ex

Transportation and Food Security Slide 8
Transportation Transformation
Monthly Grain and Oilseed Exports by Container
0
5,000
10,000
15,000
20,000
25,000
30,000
35,000
Ja
n-0
3
Mar
-03
May
-03
Ju
l-0
3
Se
p-0
3
No
v-0
3
Ja
n-0
4
Mar
-04
May
-04
Ju
l-0
4
Se
p-0
4
No
v-0
4
Ja
n-0
5
Mar
-05
May
-05
Ju
l-0
5
Se
p-0
5
No
v-0
5
Ja
n-0
6
Mar
-06
May
-06
Ju
l-0
6
Se
p-0
6
No
v-0
6
Ja
n-0
7
Mar
-07
May
-07
Ju
l-0
7
Se
p-0
7
No
v-0
7
Ja
n-0
8
Month
Nu
mb
er C
on
tain
ers

Transportation and Food Security Slide 9
Transportation Transformation
Share of Grains and Soybean Exports by Container
0.0%
0.5%
1.0%
1.5%
2.0%
2.5%
3.0%
3.5%
4.0%
4.5%
5.0%
2000 2001 2002 2003 2004 2005 2006 2007 2008
Year
Sh
are
(%)
NOTE: ThroughMarch 27

Transportation and Food Security Slide 10
Container Rates Holding Water
Ocean Container IndexAverage of Container Vessel Charters, 520 teu to 4,500 teu
1,000
1,050
1,100
1,150
1,200
1,250
1,300
1,350
1,400
1,450
4-J
an
-06
3-F
eb
-06
5-M
ar-
06
4-A
pr-
06
4-M
ay-
06
3-J
un
-06
3-J
ul-
06
2-A
ug
-06
1-S
ep
-06
1-O
ct-
06
31
-Oc
t-0
6
30
-No
v-0
6
30
-De
c-0
6
29
-Ja
n-0
7
28
-Fe
b-0
7
30
-Mar
-07
29
-Ap
r-0
7
29
-May
-07
28
-Ju
n-0
7
28
-Ju
l-0
7
27
-Au
g-0
7
26
-Se
p-0
7
26
-Oc
t-0
7
25
-No
v-0
7
25
-De
c-0
7
24
-Ja
n-0
8
23
-Fe
b-0
8
24
-Mar
-08
Date
Ind
ex

Transportation and Food Security Slide 11
Fuel Costs Rising
Weekly Retail On-Higway Diesel Prices
$1.00
$1.50
$2.00
$2.50
$3.00
$3.50
$4.00
$4.50
Jan
-00
May
-00
Sep
-00
Jan
-01
May
-01
Sep
-01
Jan
-02
May
-02
Sep
-02
Jan
-03
May
-03
Sep
-03
Jan
-04
May
-04
Sep
-04
Jan
-05
May
-05
Sep
-05
Jan
-06
May
-06
Sep
-06
Jan
-07
May
-07
Sep
-07
Jan
-08
Date
Do
llar
s p
er G
allo
n
Source: EIA

Transportation and Food Security Slide 12
The Current Framework
Infrastructure Problems = Inefficiencies
Inefficiencies = Lower Effective Transport Capacity
Lower Effective Transport Capacity = Higher Rates
April 15, 2008Kansas City, MO
Global Agriculture and Transportation Price
Trends and the Relation to Food Security
Presented byKen Eriksen
Senior Vice President
Global Agriculture and Transportation Price
Trends and the Relation to Food Security
Presented byKen Eriksen
Senior Vice President