Embed Size (px)
Citation preview
2model the unique characteristics of aerobatic routines that are performed in APAs. The study expanded upon a study completed by Volpe that was documented in a May 5, 2006 memo with the subject Aerobatic Aircraft Noise Study Technical memorandum to AQS. In addition, this report enhanced the data in the 2006 memo by remodeling the routines in a more recent version of INM and should be used in place of the 2006 memo results where the same aircraft and routines were modeled. This study was performed at a figurative airport at mean sea level and used seven aircraft to represent one of each of seven different types of aircraft categories: low weight piston, mid weight piston, high weight piston, high weight radial, high power radial (warbird), mid power jet, and high power jet. See Appendix B in the Volpe Report for how the aerobatic aircraft considered in this study were mapped to each of these categories. Each of the aircraft was modeled using one or more of five aerobatic routines: sportsman, intermediate freestyle, advanced, unlimited (to 328 ft above ground level (AGL)), and unlimited (to 20 feet AGL). Appendix E of the Volpe report contains descriptions of each of the routines. The resulting analysis provides a non-standard methodology to determine the noise consequence of an APA on the surrounding communities. The methodology is outlined in Section 4.2 of the Volpe report (with examples in Appendix D). AEE has reviewed the methodologies and data used to create the Volpe report and approves the use of the data in the report for determining the noise consequence of a proposed certificate of waiver for APAs where the routines and maneuvers2 listed above are equivalent to those that are being flown by one of the aircraft listed in Attachment 2 in this memorandum. If an analysis for an APA waiver includes a routine or maneuver that is not equivalent to one listed above (and described in Appendix E of the report) or an aircraft other than those listed in Attachment 2 of this memorandum, per Section 14.2b and 14.2c, separate prior written approval from AEE is needed because they are considered new methodologies and non-standard data. Attachment 3 provides a flow diagram with step-by-step instructions for using this memorandum and the Volpe Report for determining the noise consequence of a proposed certificate of waiver for APAs.
2 The routines modeled represent a compilation of maneuvers provided by the IAC, available in Appendix E of the Volpe Report. These routines can be considered a conservative representation of the routines that would be flown in any APA.

3
Attachment 1
Volpe Report DOT-VNTSC-FAA-12-06 “Use of Analysis of Aerobatic Aircraft Noise using the FAA’s Integrated Noise Model”
DOT/FAA/AEE/2012-06 DOT-VNTSC-FAA-12-06
ANALYSIS OF AEROBATIC
AIRCRAFT NOISE USING THE
FAA’S INTEGRATED NOISE
MODEL
Eric R. Boeker
David A. Senzig
Christopher J. Roof
U.S. Department of Transportation
Research and Innovative Technology Administration
John A. Volpe National Transportation Systems Center
Environmental Measurement and Modeling Division, RVT-41
Kendall Square
Cambridge, MA 02142
September 2012
Final Report
U.S. Department of Transportation
Federal Aviation Administration
ii
Notice
This document is disseminated under the sponsorship of the Department of Transportation in the interest of information exchange. The United States Government assumes no liability for its contents or use thereof.
Notice
The United States Government does not endorse products or manufacturers. Trade or manufacturers’ names appear herein solely because they are considered essential to the objective of this report.
iii
REPORT DOCUMENTATION PAGE Form Approved OMB No. 0704-0188
Public reporting burden for this collection of information is estimated to average 1 hour per response, including the time for reviewing instructions, searching existing data sources, gathering and maintaining the data needed, and completing and reviewing the collection of information. Send comments regarding this burden estimate or any other aspect of this collection of information, including suggestions for reducing this burden, to Washington Headquarters Services, Directorate for Information Operations and Reports, 1215 Jefferson Davis Highway, Suite 1204, Arlington, VA 22202-4302, and to the Office of Management and Budget, Paperwork Reduction Project (0704-0188), Washington, DC 20503.
1. AGENCY USE ONLY (Leave blank) 2. REPORT DATE September 2012
3. REPORT TYPE AND DATES COVERED Final Report
4. TITLE AND SUBTITLE Analysis of Aerobatic Aircraft Noise Using the FAA’s Integrated Noise Model
5. FUNDING NUMBERS FA4SB4 - KLE36
6. AUTHOR(S) Eric R. Boeker, David A. Senzig, Christopher J. Roof
7. PERFORMING ORGANIZATION NAME(S) AND ADDRESS(ES) U.S. Department of Transportation Research and Innovative Technology Administration John A. Volpe National Transportation Systems Center Environmental Measurement and Modeling Division, RVT-41 Cambridge, MA 02142-1093
8. PERFORMING ORGANIZATION REPORT NUMBER DOT-VNTSC-FAA-12-06
9. SPONSORING/MONITORING AGENCY NAME(S) AND ADDRESS(ES) U.S. Department of Transportation Federal Aviation Administration Office of Aviation Safety, AVS Washington, DC 20591
10. SPONSORING/MONITORING AGENCY REPORT NUMBER
DOT/FAA/AEE/2012-06
11. SUPPLEMENTARY NOTES FAA Program Manager: Eric Dunlap
12a. DISTRIBUTION/AVAILABILITY STATEMENT 12b. DISTRIBUTION CODE
13. ABSTRACT (Maximum 200 words) This project has three main objectives. The first objective is to model noise from complete aerobatic routines for a range of aircraft. The second is to compare modeled and previously measured aircraft noise from complete aerobatic routines for a range of aircraft. The third is to model the noise from up to 50 daily aerobatic routines for a range of aircraft. The end result of this analysis is a matrix of modeled noise results for a range of aircraft performing a variety of aerobatic routines. The FAA can now utilize these results to help set the technical threshold for approving NEPA analyses for aircraft performing aerobatic routine represented within the matrix.
14. SUBJECT TERMS Aircraft Noise, Noise Prediction, Noise Model, Integrated Noise Model, INM, Aerobatic Aircraft, National Environmental Policy Act, NEPA
15. NUMBER OF PAGES 111
16. PRICE CODE
17. SECURITY CLASSIFICATION OF REPORT Unclassified
18. SECURITY CLASSIFICATION OF THIS PAGE Unclassified
19. SECURITY CLASSIFICATION OF ABSTRACT Unclassified
20. LIMITATION OF ABSTRACT
NSN 7540-01-280-5500 Standard Form 298 (Rev. 2-89) Prescribed by ANSI Std. 239-18
298-102
iv
METRIC/ENGLISH CONVERSION FACTORS
ENGLISH TO METRIC METRIC TO ENGLISH
LENGTH (APPROXIMATE) LENGTH (APPROXIMATE)
1 inch (in) = 2.5 centimeters (cm) 1 millimeter (mm) = 0.04 inch (in)
1 foot (ft) = 30 centimeters (cm) 1 centimeter (cm) = 0.4 inch (in)
1 yard (yd) = 0.9 meter (m) 1 meter (m) = 3.3 feet (ft)
1 mile (mi) = 1.6 kilometers (km) 1 meter (m) = 1.1 yards (yd)
1 kilometer (km) = 0.6 mile (mi)
AREA (APPROXIMATE) AREA (APPROXIMATE)
1 square inch (sq in, in2) = 6.5 square centimeters (cm2)
1 square centimeter (cm2) = 0.16 square inch (sq in, in2)
1 square foot (sq ft, ft2) = 0.09 square meter (m2) 1 square meter (m2) = 1.2 square yards (sq yd, yd2)
1 square yard (sq yd, yd2) = 0.8 square meter (m2) 1 square kilometer (km2) = 0.4 square mile (sq mi, mi2)
1 square mile (sq mi, mi2) = 2.6 square kilometers (km2)
10,000 square meters (m2) = 1 hectare (ha) = 2.5 acres
1 acre = 0.4 hectare (he) = 4,000 square meters (m2)
MASS – WEIGHT (APPROXIMATE) MASS – WEIGHT (APPROXIMATE)
1 ounce (oz) = 28 grams (gm) 1 gram (gm) = 0.036 ounce (oz)
1 pound (lb) = 0.45 kilogram (kg) 1 kilogram (kg) = 2.2 pounds (lb)
1 short ton = 2,000 pounds (lb)
= 0.9 tonne (t) 1 tonne (t)
=
=
1,000 kilograms (kg)
1.1 short tons
VOLUME (APPROXIMATE) VOLUME (APPROXIMATE)
1 teaspoon (tsp) = 5 milliliters (ml) 1 milliliter (ml) = 0.03 fluid ounce (fl oz)
1 tablespoon (tbsp) = 15 milliliters (ml) 1 liter (l) = 2.1 pints (pt)
1 fluid ounce (fl oz) = 30 milliliters (ml) 1 liter (l) = 1.06 quarts (qt)
1 cup (c) = 0.24 liter (l) 1 liter (l) = 0.26 gallon (gal)
1 pint (pt) = 0.47 liter (l)
1 quart (qt) = 0.96 liter (l)
1 gallon (gal) = 3.8 liters (l)
1 cubic foot (cu ft, ft3) = 0.03 cubic meter (m3) 1 cubic meter (m3) = 36 cubic feet (cu ft, ft3)
1 cubic yard (cu yd, yd3) = 0.76 cubic meter (m3) 1 cubic meter (m3) = 1.3 cubic yards (cu yd, yd3)
TEMPERATURE (EXACT) TEMPERATURE (EXACT)
[(x-32)(5/9)] °F = y °C [(9/5) y + 32] °C = x °F
QUICK INCH - CENTIMETER LENGTH CONVERSION
10 2 3 4 5
Inches
Centimeters 0 1 3 4 52 6 1110987 1312
QUICK FAHRENHEIT - CELSIUS TEMPERATURE CONVERSIO -40° -22° -4° 14° 32° 50° 68° 86° 104° 122° 140° 158° 176° 194° 212°
°F
°C -40° -30° -20° -10° 0° 10° 20° 30° 40° 50° 60° 70° 80° 90° 100°
For more exact and or other conversion factors, see NIST Miscellaneous Publication 286, Units of Weights and Measures. SD Catalog No. C13 10286

v
TABLE OF CONTENTS Section Page
EXECUTIVE SUMMARY .......................................................................................................................1
1 INTRODUCTION ..........................................................................................................................3
2 NOISE MODELING OF AEROBATIC AIRCRAFT WITH INM ...............................................................5 2.1 AEROBATIC AIRCRAFT ACOUSTIC SOURCE DATA .......................................................................... 5 2.2 PERFORMANCE MODELING OF AEROBATIC ROUTINES ................................................................ 6
3 NOISE MODELING RESULTS .........................................................................................................9 3.1 PREVIOUS ANALYSIS NOISE RESULTS ............................................................................................ 9 3.2 NOISE RESULTS FOR AEROBATIC ROUTINES PERFORMED BY THE EDGE 540 AND SUKHOI SU-29 (TASK 1A) ................................................................................................................................................. 14 3.3 NOISE RESULTS FOR AEROBATIC ROUTINES PERFORMED BY THE EXTRA EA-230 AND PITTS S-2C (TASK 1B) ................................................................................................................................................. 16 3.4 NOISE RESULTS FOR AEROBATIC ROUTINES PERFORMED BY THE MIKOYAN-GUREVICH MIG-15, MCDONNELL DOUGLAS F-15 AND GRUMMAN F7F (TASK 1B) ............................................................... 17
4 SUMMARY AND ANALYSIS ........................................................................................................ 21 4.1 ANALYSIS OF NOISE RESULTS FOR MODELED AEROBATIC ROUTINES ........................................ 21 4.2 METHOD FOR ESTIMATING NOISE RESULTS FOR COMIBNATIONS OF AEROBATIC ROUTINES .. 23 4.3 APPLICABILITY OF STUDY ANALYSIS ............................................................................................ 26
5 CONCLUSIONS AND RECOMMENDATIONS ................................................................................. 29
Appendix A References ............................................................................................................. 31
Appendix B Substitution Aerobatic Aircraft ............................................................................. 33
Appendix C INM 7.0c Noise Results for the 2012 Study ............................................................ 39
Appendix D Example of Estimating Noise from Multiple Different Aircraft Performing Aerobatic Routines ......................................................................................................................... 57
D.1 Example of 20 Edge 540 Advanced Routines .............................................................................. 57 D.2 Example of 7 Different Sportsman Routines ............................................................................... 58 D.3 Example of 2 Occurrences of Each of the 7 Noisiest Routines ................................................... 59
Appendix E Aerobatic Routines ................................................................................................ 63
Appendix F Previous Aerobatic Aircraft Noise Memorandum ................................................. 69

vi
Page left blank intentionally.
EXECUTIVE SUMMARY
This report presents an analysis of noise from complete aerobatic routines for a range of aircraft
modeled with the Federal Aviation Administration’s (FAA) Integrated Noise Model (INM)
Version 7.0c. The project has three main objectives. The first objective is to model noise from
complete aerobatic routines for a range of aircraft in INM. The second is to compare INM
modeled and previously measured aircraft noise from complete aerobatic routines for a range of
aircraft. The third is to model the noise from up to 50 daily aerobatic routines for a range of
aircraft in INM.
Seven aircraft (representing a range of aircraft that typically perform aerobatic routines) are
modeled performing a range of aerobatic routines in INM. These modeled noise results are
found to be in good agreement with the noise results from the 2006 analysis report “Aerobatic
Aircraft Noise Study: Technical Memorandum”, which were estimated from noise measurement
data.
The aircraft are subdivided into two analysis categories ((1) medium to light propeller aircraft,
and (2) heavy propeller aircraft and jets), and the corresponding noise results are compared
against the 0.5 mile recommended distance between the aerobatic routine (at a point directly
below the center of the aerobatic box) and noise sensitive receivers, established in the 2006
report. When considering the noise from 50 identical aerobatic routines, all four light to medium
weight propeller aircraft result in noise levels well below the Federal land use guideline of 65
dBA DNL at a distance of 0.5 miles between the aerobatic routine and noise sensitive receivers.
For the one heavy weight propeller aircraft and two jets, the noise from 50 identical aerobatic
routines exceeds the 65 dBA DNL threshold at 0.5 miles, but meets the threshold at a distance of
2 miles.
The end result of this analysis is a matrix of modeled noise results for a range of aerobatic
aircraft performing a variety of aerobatic routines, along with a method to estimate the general
noise from a combination of different aerobatic routines performed by different aircraft. The

Executive Summary Analysis of Aerobatic Aircraft Noise Using the FAA’s Integrated Noise Model
2
results may be used to inform National Environmental Policy Act (NEPA) analyses for aircraft
performing aerobatic routine represented within the matrix.
1 INTRODUCTION
The noise due to aircraft operations in the vicinity of airports is commonly modeled with Federal
Aviation Administration’s (FAA) Integrated Noise Model (INM)1 for National Environmental
Policy Act (NEPA) analyses. Although aerobatic maneuvers are often undertaken in the vicinity
of airports, aerobatic routines have not historically been modeled in these analyses, primarily due
to a lack of aerobatic maneuver noise source data.
In 2005 and 2006, the United States Department of Transportation (USDOT) John A. Volpe
National Transportation Systems Center (Volpe) conducted a noise measurement and modeling
study of aerobatic aircraft at the request of the FAA2. The two objectives of this previous study
were to: (1) measure high quality aerobatic source noise data for several representative aircraft
for inclusion in INM; and (2) model complete aerobatic routines in INM and compare those
results with measured noise levels. Noise source data were measured and processed for five
aerobatic aircraft; the Zivko Edge 540 (Edge), the Extra EA-230 (Extra), the Sukhoi SU-29
(Sukhoi), the Aviat Pitts S-2C (Pitts), and the American Champion Decathlon (Decathlon).
International Aerobatic Club (IAC) Sportsman Known 2005 routines were measured and
modeled in INM for the Extra and the Pitts, and an IAC Intermediate 2005 Freestyle routine was
measured and modeled for the Sukhoi. The measured noise levels were then used to estimate the
day night average sound level metric (Ldn or DNL) for up to 50 identical aerobatic routines. The
results for this study were summarized in “Aerobatic Aircraft Noise Study: Technical
Memorandum” in 20062, which is included in Appendix F of this report.
While the 2006 report concluded that the noise from the aerobatic routines flown in that study
would not have exceeded 65 dBA DNL at distances 0.5 mile or more from the center of the
practice box*, the study was limited to estimated noise levels for only three aircraft, each
performing a single aerobatic routine (although up to 50 identical routines were estimated). The
* The 2006 report concluded that the noise from the aerobatic routines flown in that study would not have exceeded 65 dBA DNL at distances 0.25 mile or more from the center of the practice box, and then made a conservative recommendation to locate heavily utilized aerobatics practice boxes 0.5 mile or more from noise sensitive receivers.
Introduction Analysis of Aerobatic Aircraft Noise Using the FAA’s Integrated Noise Model
4
goal of this report is to present a noise analysis for a range of complete aerobatic routines and
aircraft modeled with INM. This will provide a matrix of modeled noise results that the FAA
can utilize for performing NEPA analyses that include a range of aircraft performing aerobatic
routines.
This report is organized into five sections. In Section 2, aerobatic aircraft noise modeling in INM
is discussed focusing on aircraft acoustic source data (Section 2.1) and the performance
modeling of aerobatic routines (Section 2.2). Section 3 presents INM noise modeling results.
These results include remodeled aerobatic routines presented in the 2006 study (Section 3.1),
aerobatic routines for the Edge and Sukhoi (Section 3.2), and a complete range of aerobatic
routines for a range of aerobatic aircraft (Sections 3.3 and 3.4). Section 4 presents a summary
and analysis of the results, including a method for estimating general noise from a combination
of aircraft performing different aerobatic routines. Conclusions and recommendations are
presented in Section 5. References can be found in Appendix A, and the complete INM input
data and results are presented in Appendix B and Appendix C. Examples of computing the
estimated noise from a combination of aircraft performing different aerobatic routines is
presented in Appendix D. Appendix E includes the descriptions of the aerobatic routines
modeled in this analysis. Finally, the 2006 technical memorandum is provided in Appendix F
for reference.
2 NOISE MODELING OF AEROBATIC AIRCRAFT WITH INM
The technical goal of this research was to model a range of complete aerobatic routines for a
range of aerobatic aircraft modeled with INM. Seven aircraft categories were modeled in this the
study: low weight piston engine aircraft (represented by the Pitts), mid weight piston engine
aircraft (represented by the Edge), high weight piston engine aircraft (represented by the Extra),
high weight radial engine aircraft (represented by the Sukhoi), mid power jet (represented by the
Mikoyan-Gurevich MiG-15 [MiG-15]), high power jet (represented by the Boeing (formerly
McDonnell Douglas) F-15 Eagle [F-15]) and high power radial engine aircraft or “warbird”
(represented by the Grumman F7F Tigercat [F7F]). Five different aerobatic routines were
modeled in this study: IAC Sportsman, Intermediate, Advanced, Unlimited and a modified
Unlimited routine scaled to a minimum altitude of 20 feet above field elevation (AFE). The
Extra, Edge, Sukhoi and Pitts were all modeled flying all five aerobatic routines. The two jets
and the warbird were only modeled flying the Sportsman routine, as they do not typically fly the
other four routines. The aircraft acoustic source data required to model these seven aircraft in
INM are discussed in Section 2.1. The methods for modeling the aircraft performance of the
aerobatic routines in INM are discussed in Section 2.2.
2.1 AEROBATIC AIRCRAFT ACOUSTIC SOURCE DATA The aerobatic aircraft acoustic source data used in this study are a combination of previously
measured data and traditional INM data. The source data for the Pitts, Edge, Extra and Sukhoi
were measured and reported on in the 2006 report2. The MiG-15, F-15 and F7F utilize noise
data from the INM 7.0c database, with the MiG-15 based on the INM noise data for the Hawker
Hunter with a Rolls-Royce Avon 207 turbojet engine, and the F7F similarly based on the noise
data for the Convair C-131 Samaritan with Pratt & Whitney R-2800 radial engines. Note that the
performance characteristics of the MiG-15, F-15, and F7F were developed from data collected
by the FAA from actual aerobatic routines flown with these aircraft – the performance data used
in the aerobatic modeling for these aircraft did not come from the INM. The seven aerobatic
aircraft modeled in this study represent a range of aerobatic aircraft presented in Appendix A,
and are considered conservative representations of those aircraft in each respective category.
Noise Modeling of Aerobatic Analysis of Aerobatic Aircraft Noise Aircraft with INM Using the FAA’s Integrated Noise Model
6
The aircraft acoustic source data in the INM database are represented by Noise-Power-Distance
(NPD) and spectral class data. NPDs are a set of aircraft-, noise metric-, and operational mode-
specific noise levels at given thrust level over a range of distances from the aircraft source (200
ft to 25,000 ft). NPDs represent both the aircraft acoustic source and acoustic propagation in
INM for aircraft approach, departure and level flight operations. A modified set of NPD data
were developed for the four aerobatic aircraft in the 2006 report (Pitts, Edge, Extra and Sukhoi),
that included additional aircraft attitudes that are typical for aerobatic routines: high speed
(around 135 mph in both directions of travel; North to South, and South to North), low speed
(around 70 mph), acceleration (accelerating using full power), inverted (at high speed), knife-
edge facing left and facing right (at high speed)*. The aerobatic maneuvers in the study were
modeled as sequences of these four or six altitude-specific NPDs for each aircraft. These
altitude-specific NPDs were utilized in conjunction with the aircraft position and speed
information to model aircraft level-flight events and aerobatic sequences.
The F-15, F7F and MiG-15 were all modeled with noise data from the INM 7.0c database, which
only include approach and departure NPD data.
2.2 PERFORMANCE MODELING OF AEROBATIC ROUTINES Because INM was primarily designed to model aircraft operations in the vicinity of an airport
and not aerobatic maneuvers, special INM profiles were developed to model the aircraft
performance during aerobatic routines. The aerobatic routines modeled in this analysis are the
IAC Sportsman Known 2005, Intermediate Known 2005, Advanced Known 2011, Unlimited
Known 2011 and a modified Unlimited Known 2011 routine scaled to a minimum altitude of 20
feet above field elevation (AFE)†. These routines are described in Appendix E. The methods for
modeling the performance of the aerobatic routines in INM are documented in the 2006 report
* Some of the aircraft were unable to perform all six types of aircraft attitudes as level-flight events. For these
aircraft, a smaller amount of aircraft attitudes were measured, which resulted in a smaller modified NPD data set. As such, knife-edge facing left and facing right NPDs could not be developed for the Extra and the Pitts.
† The IAC 2005 Known routines were modeled for the Sportsman and Intermediate routines in this analysis, to be consistent with the modeling in the 2006 letter report. The latest routines (2011 Known, at the start of this analysis) were used to model the remainder of the aerobatic routines (Advanced and Unlimited).
Noise Modeling of Aerobatic Analysis of Aerobatic Aircraft Noise Aircraft with INM Using the FAA’s Integrated Noise Model
7
(also included in Appendix F of this report) It is important to note that the modeled aerobatic
routines did take into account the aircraft entering and exiting the practice box, but they did not
account for approaches to and departures from the study airport.
For the Extra, Pitts, and Sukhoi, actual aerobatic routines were measured and translated to INM
model performance data as part of the 2006 report. For this report, translations of the 2011
Advanced and Intermediate routines provided by the FAA were used as the source for the INM
performance data. Additional data on the minimum altitude threshold for all five aerobatic
routines were also provided by the FAA. The data were translated into the same format as that
used in the 2006 report. The data required the segments of each maneuver is:
• Direction of travel
• Airspeed
• Duration
• Flight path angle relative to the ground
• Thrust
These data are sufficient to produce the Profile Points data required by the INM. These INM
required data are the distance along the flight track, altitude above the ground, speed of the
aircraft and thrust. The same data are also used to calculate the flight track (i.e., position of the
aircraft in an X-Y coordinate system relative to the INM study center).
Note that for the four original aerobatic aircraft, the noise data were associated with a particular
flight mode, and not an actual thrust value. These flight modes were used as surrogates for
thrust. For the jets and the F7F, the thrust settings associated with full power departures (without
afterburner, in the case of the F-15) were used for the high power segments of the maneuvers,
and the lowest departure power setting available was used for the low power segments of the
maneuvers. In general, level and ascending segments were modeled with full power, while
descents were modeled with the lowest power settings.
A minor error in the 2006 process was also corrected in the modeling of vertical maneuvers. The
2006 error resulted in a misalignment of the profile points and the flight track during vertical
maneuvers. The small number of vertical maneuvers in the original 2006 work meant the error

Noise Modeling of Aerobatic Analysis of Aerobatic Aircraft Noise Aircraft with INM Using the FAA’s Integrated Noise Model
8
was relatively small (and hence was undiscovered in that work); but in the current work, with the
large percentage of vertical maneuvers in the Advanced and Unlimited routines, this error was
quite pronounced. The original routines, as well as the new routines, were run with the corrected
process in this analysis.
3 NOISE MODELING RESULTS
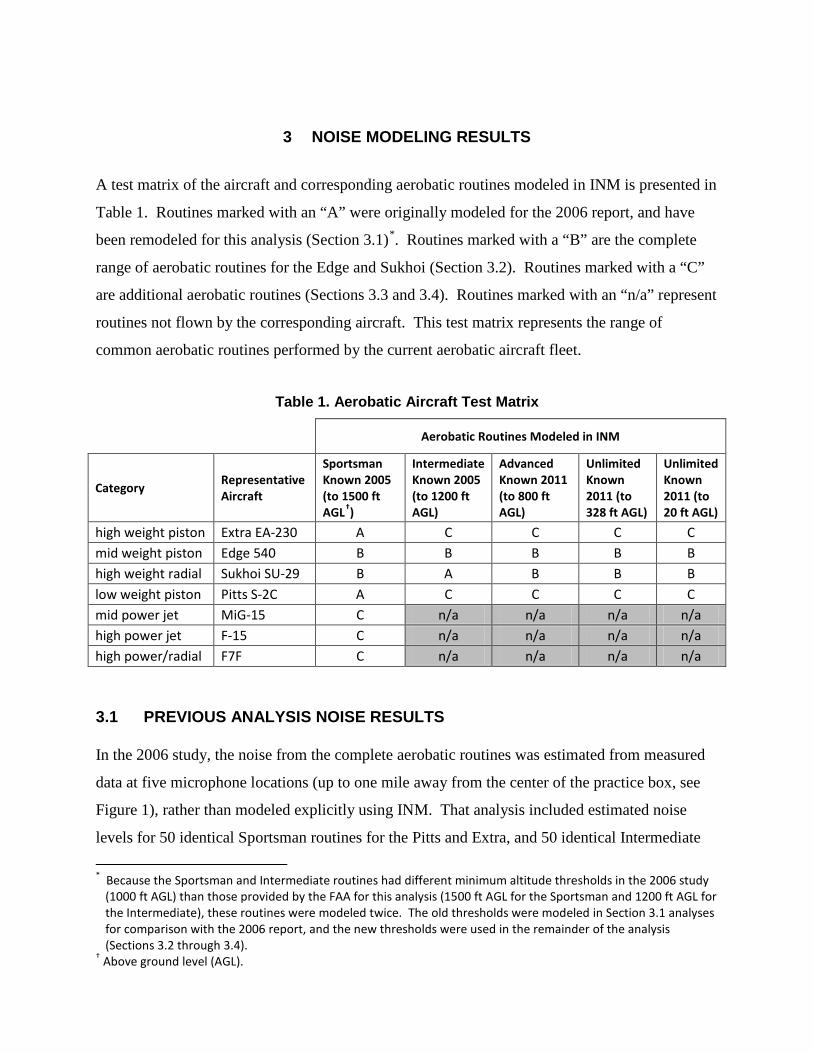
A test matrix of the aircraft and corresponding aerobatic routines modeled in INM is presented in
Table 1. Routines marked with an “A” were originally modeled for the 2006 report, and have
been remodeled for this analysis (Section 3.1)*. Routines marked with a “B” are the complete
range of aerobatic routines for the Edge and Sukhoi (Section 3.2). Routines marked with a “C”
are additional aerobatic routines (Sections 3.3 and 3.4). Routines marked with an “n/a” represent
routines not flown by the corresponding aircraft. This test matrix represents the range of
common aerobatic routines performed by the current aerobatic aircraft fleet.
Table 1. Aerobatic Aircraft Test Matrix
Aerobatic Routines Modeled in INM
Category Representative Aircraft
Sportsman Known 2005 (to 1500 ft AGL†)
Intermediate Known 2005 (to 1200 ft AGL)
Advanced Known 2011 (to 800 ft AGL)
Unlimited Known 2011 (to 328 ft AGL)
Unlimited Known 2011 (to 20 ft AGL)
high weight piston Extra EA-230 A C C C C mid weight piston Edge 540 B B B B B high weight radial Sukhoi SU-29 B A B B B low weight piston Pitts S-2C A C C C C mid power jet MiG-15 C n/a n/a n/a n/a high power jet F-15 C n/a n/a n/a n/a high power/radial F7F C n/a n/a n/a n/a
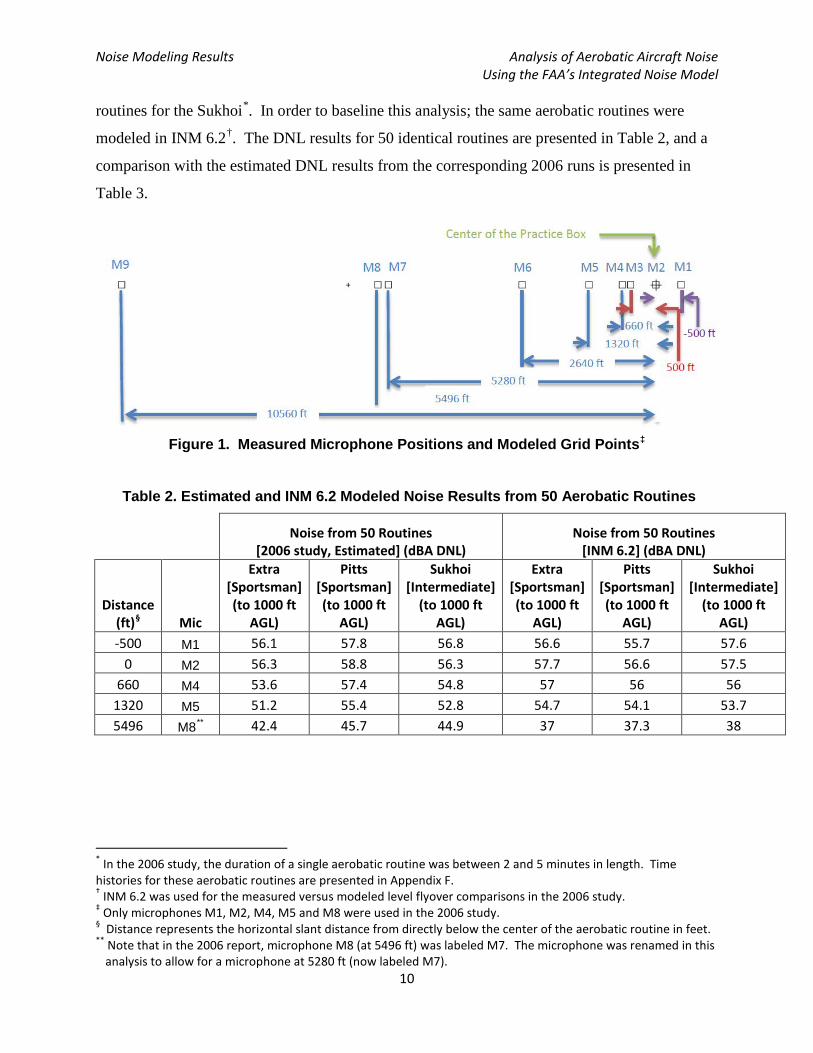
3.1 PREVIOUS ANALYSIS NOISE RESULTS In the 2006 study, the noise from the complete aerobatic routines was estimated from measured
data at five microphone locations (up to one mile away from the center of the practice box, see
Figure 1), rather than modeled explicitly using INM. That analysis included estimated noise
levels for 50 identical Sportsman routines for the Pitts and Extra, and 50 identical Intermediate
* Because the Sportsman and Intermediate routines had different minimum altitude thresholds in the 2006 study
(1000 ft AGL) than those provided by the FAA for this analysis (1500 ft AGL for the Sportsman and 1200 ft AGL for the Intermediate), these routines were modeled twice. The old thresholds were modeled in Section 3.1 analyses for comparison with the 2006 report, and the new thresholds were used in the remainder of the analysis (Sections 3.2 through 3.4).
† Above ground level (AGL).
Noise Modeling Results Analysis of Aerobatic Aircraft Noise Using the FAA’s Integrated Noise Model
10
routines for the Sukhoi*. In order to baseline this analysis; the same aerobatic routines were
modeled in INM 6.2†. The DNL results for 50 identical routines are presented in Table 2, and a
comparison with the estimated DNL results from the corresponding 2006 runs is presented in
Table 3.
Figure 1. Measured Microphone Positions and Modeled Grid Points‡
Table 2. Estimated and INM 6.2 Modeled Noise Results from 50 Aerobatic Routines
Noise from 50 Routines
[2006 study, Estimated] (dBA DNL) Noise from 50 Routines
[INM 6.2] (dBA DNL)
Distance (ft)§ Mic
Extra [Sportsman] (to 1000 ft
AGL)
Pitts [Sportsman] (to 1000 ft
AGL)
Sukhoi [Intermediate]
(to 1000 ft AGL)
Extra [Sportsman] (to 1000 ft
AGL)
Pitts [Sportsman] (to 1000 ft
AGL)
Sukhoi [Intermediate]
(to 1000 ft AGL)
-500 M1 56.1 57.8 56.8 56.6 55.7 57.6 0 M2 56.3 58.8 56.3 57.7 56.6 57.5
660 M4 53.6 57.4 54.8 57 56 56 1320 M5 51.2 55.4 52.8 54.7 54.1 53.7 5496 M8** 42.4 45.7 44.9 37 37.3 38
* In the 2006 study, the duration of a single aerobatic routine was between 2 and 5 minutes in length. Time histories for these aerobatic routines are presented in Appendix F. † INM 6.2 was used for the measured versus modeled level flyover comparisons in the 2006 study. ‡ Only microphones M1, M2, M4, M5 and M8 were used in the 2006 study. § Distance represents the horizontal slant distance from directly below the center of the aerobatic routine in feet. ** Note that in the 2006 report, microphone M8 (at 5496 ft) was labeled M7. The microphone was renamed in this
analysis to allow for a microphone at 5280 ft (now labeled M7).
Noise Modeling Results Analysis of Aerobatic Aircraft Noise Using the FAA’s Integrated Noise Model
11
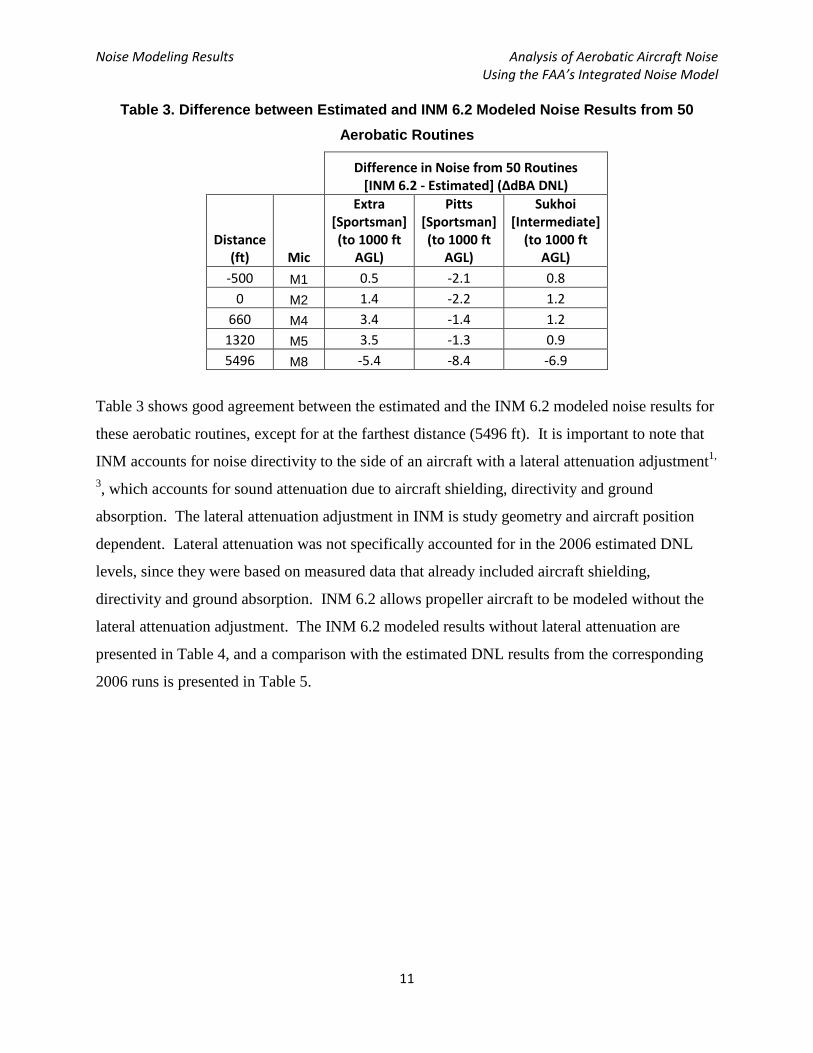
Table 3. Difference between Estimated and INM 6.2 Modeled Noise Results from 50
Aerobatic Routines
Difference in Noise from 50 Routines
[INM 6.2 - Estimated] (ΔdBA DNL)
Distance (ft) Mic
Extra [Sportsman] (to 1000 ft
AGL)
Pitts [Sportsman] (to 1000 ft
AGL)
Sukhoi [Intermediate]
(to 1000 ft AGL)
-500 M1 0.5 -2.1 0.8 0 M2 1.4 -2.2 1.2
660 M4 3.4 -1.4 1.2 1320 M5 3.5 -1.3 0.9 5496 M8 -5.4 -8.4 -6.9
Table 3 shows good agreement between the estimated and the INM 6.2 modeled noise results for
these aerobatic routines, except for at the farthest distance (5496 ft). It is important to note that
INM accounts for noise directivity to the side of an aircraft with a lateral attenuation adjustment1,
3, which accounts for sound attenuation due to aircraft shielding, directivity and ground
absorption. The lateral attenuation adjustment in INM is study geometry and aircraft position
dependent. Lateral attenuation was not specifically accounted for in the 2006 estimated DNL
levels, since they were based on measured data that already included aircraft shielding,
directivity and ground absorption. INM 6.2 allows propeller aircraft to be modeled without the
lateral attenuation adjustment. The INM 6.2 modeled results without lateral attenuation are
presented in Table 4, and a comparison with the estimated DNL results from the corresponding
2006 runs is presented in Table 5.

Noise Modeling Results Analysis of Aerobatic Aircraft Noise Using the FAA’s Integrated Noise Model
12
Table 4. INM 6.2 Modeled Noise Results from 50 Aerobatic Routines (without Lateral
Attenuation)
Noise from 50 Routines [INM 6.2] (dBA DNL)
Distance (ft)* Mic
Extra [Sportsman] (to 1000 ft
AGL)
Pitts [Sportsman] (to 1000 ft
AGL)
Sukhoi [Intermediate]
(to 1000 ft AGL)
-500 M1 56.6 55.7 57.6 0 M2 57.7 56.6 57.5
660 M4 57 56.1 56 1320 M5 54.8 54.1 53.9 5496 M8 42.4 43 43.1
Table 5. Difference between Estimated and INM 6.2 Modeled Noise Results from 50
Aerobatic Routines (without Lateral Attenuation)
Difference in Noise from 50 Routines [INM 6.2 - Estimated] (ΔdBA DNL)
Distance (ft) Mic
Extra [Sportsman] (to 1000 ft
AGL)
Pitts [Sportsman] (to 1000 ft
AGL)
Sukhoi [Intermediate]
(to 1000 ft AGL)
-500 M1 0.5 -2.1 0.8 0 M2 1.4 -2.2 1.2
660 M4 3.4 -1.3 1.2 1320 M5 3.6 -1.3 1.1 5496 M8 0 -2.7 -1.8
Table 5 shows much better agreement between the estimated noise levels and the INM 6.2 noise
levels at the farthest distance when lateral attenuation is turned off (within -2.7 to 3.6 dBA DNL
up to 1 mile from directly below the center of the aerobatic routine). Not only do these
comparisons shows that the INM 6.2 modeled results are in reasonably close agreement with the
2006 results, they also indicate that the lateral attenuation adjustment in INM 6.2 should not be
used in this analysis.
* The analysis points selected in Table 4 through Table 8 correspond to the measurement positions in the 2006
study.
Noise Modeling Results Analysis of Aerobatic Aircraft Noise Using the FAA’s Integrated Noise Model
13
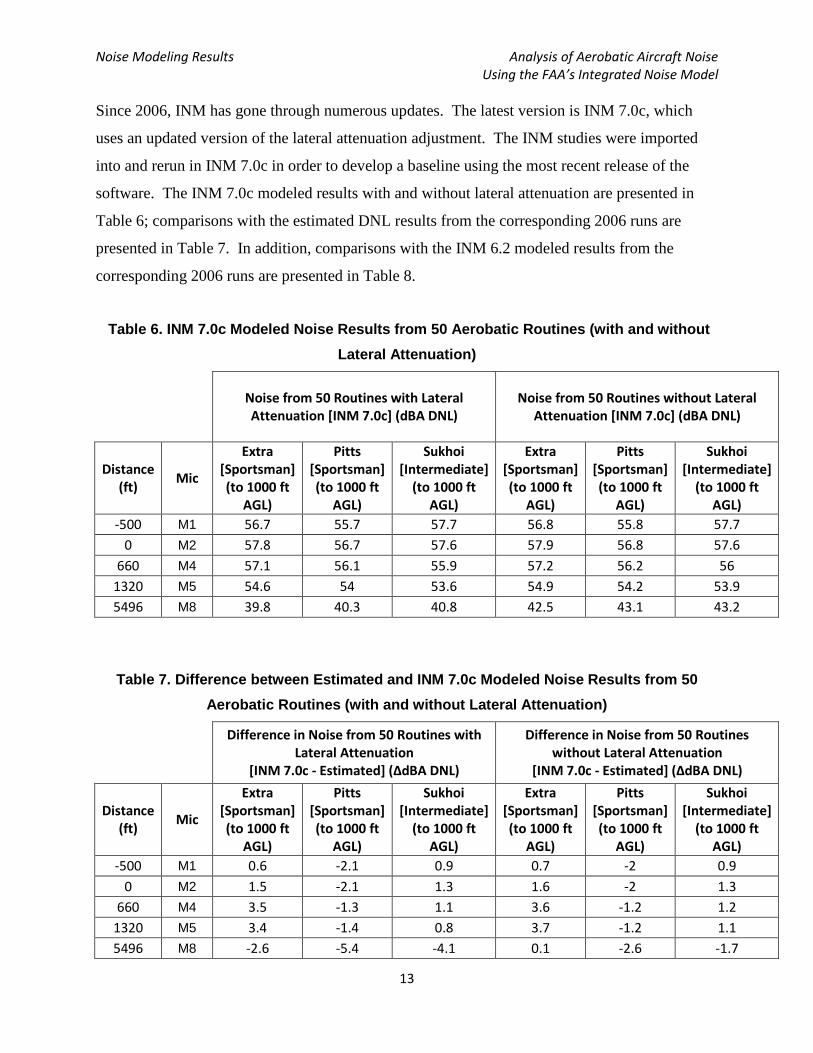
Since 2006, INM has gone through numerous updates. The latest version is INM 7.0c, which
uses an updated version of the lateral attenuation adjustment. The INM studies were imported
into and rerun in INM 7.0c in order to develop a baseline using the most recent release of the
software. The INM 7.0c modeled results with and without lateral attenuation are presented in
Table 6; comparisons with the estimated DNL results from the corresponding 2006 runs are
presented in Table 7. In addition, comparisons with the INM 6.2 modeled results from the
corresponding 2006 runs are presented in Table 8.
Table 6. INM 7.0c Modeled Noise Results from 50 Aerobatic Routines (with and without
Lateral Attenuation)
Noise from 50 Routines with Lateral Attenuation [INM 7.0c] (dBA DNL)
Noise from 50 Routines without Lateral Attenuation [INM 7.0c] (dBA DNL)
Distance (ft) Mic
Extra [Sportsman] (to 1000 ft
AGL)
Pitts [Sportsman] (to 1000 ft
AGL)
Sukhoi [Intermediate]
(to 1000 ft AGL)
Extra [Sportsman] (to 1000 ft
AGL)
Pitts [Sportsman] (to 1000 ft
AGL)
Sukhoi [Intermediate]
(to 1000 ft AGL)
-500 M1 56.7 55.7 57.7 56.8 55.8 57.7 0 M2 57.8 56.7 57.6 57.9 56.8 57.6
660 M4 57.1 56.1 55.9 57.2 56.2 56 1320 M5 54.6 54 53.6 54.9 54.2 53.9 5496 M8 39.8 40.3 40.8 42.5 43.1 43.2
Table 7. Difference between Estimated and INM 7.0c Modeled Noise Results from 50
Aerobatic Routines (with and without Lateral Attenuation)
Difference in Noise from 50 Routines with
Lateral Attenuation [INM 7.0c - Estimated] (ΔdBA DNL)
Difference in Noise from 50 Routines without Lateral Attenuation
[INM 7.0c - Estimated] (ΔdBA DNL)
Distance (ft) Mic
Extra [Sportsman] (to 1000 ft
AGL)
Pitts [Sportsman] (to 1000 ft
AGL)
Sukhoi [Intermediate]
(to 1000 ft AGL)
Extra [Sportsman] (to 1000 ft
AGL)
Pitts [Sportsman] (to 1000 ft
AGL)
Sukhoi [Intermediate]
(to 1000 ft AGL)
-500 M1 0.6 -2.1 0.9 0.7 -2 0.9 0 M2 1.5 -2.1 1.3 1.6 -2 1.3
660 M4 3.5 -1.3 1.1 3.6 -1.2 1.2 1320 M5 3.4 -1.4 0.8 3.7 -1.2 1.1 5496 M8 -2.6 -5.4 -4.1 0.1 -2.6 -1.7

Noise Modeling Results Analysis of Aerobatic Aircraft Noise Using the FAA’s Integrated Noise Model
14
Table 8. Difference between INM 7.0c and INM 6.2 Modeled Noise Results from 50
Aerobatic Routines (with and without Lateral Attenuation)
Difference in Noise from 50 Routines with
Lateral Attenuation [INM 7.0c - INM 6.2] (ΔdBA DNL)
Difference in Noise from 50 Routines without Lateral Attenuation
[INM 7.0c - INM 6.2] (ΔdBA DNL)
Distance (ft) Mic
Extra [Sportsman] (to 1000 ft
AGL)
Pitts [Sportsman] (to 1000 ft
AGL)
Sukhoi [Intermediate]
(to 1000 ft AGL)
Extra [Sportsman] (to 1000 ft
AGL)
Pitts [Sportsman] (to 1000 ft
AGL)
Sukhoi [Intermediate]
(to 1000 ft AGL)
-500 M1 0.1 0 0.1 0.2 0.1 0.1 0 M2 0.1 0.1 0.1 0.2 0.2 0.1
660 M4 0.1 0.1 -0.1 0.2 0.1 0 1320 M5 -0.1 -0.1 -0.1 0.1 0.1 0 5496 M8 2.8 3 2.8 0.1 0.1 0.1
Table 7 and Table 8 show that the difference between the INM 6.0 and INM 7.0c noise results
are due to the lateral attenuation adjustment update in INM 7.0c; when it is turned off, INM 7.0c
noise results are in good agreement with the noise results estimated in the 2006 report.
Therefore, INM 7.0c noise results without lateral attenuation are used in this analysis.
3.2 NOISE RESULTS FOR AEROBATIC ROUTINES PERFORMED BY THE EDGE 540 AND SUKHOI SU-29 (TASK 1A)
Based on field observations, the Edge and Sukhoi were expected to produce the loudest noise
levels of the five aircraft from the 2006 study. Therefore, the complete range of aerobatic
routines was modeled for both the Edge and the Sukhoi in INM 7.0c first. INM 7.0c modeled
results for 50 identical routines without lateral attenuation are presented in Table 9 and Table 10.
These results represent a conservative, “worst case” scenario. Results for a range of routines
(from 1 to 50 identical routines) for the Edge and Sukhoi are presented in Appendix C.

Noise Modeling Results Analysis of Aerobatic Aircraft Noise Using the FAA’s Integrated Noise Model
15
Table 9. INM 7.0c Modeled Noise Results the Edge 540 Performing 50 Aerobatic Routines
(without Lateral Attenuation)
Modeled DNL values (dBA)
Distance (ft)
Grid Point
Sportsman Known
2005 (to 1500 ft
AGL)
Intermediate Known 2005 (to 1200 ft
AGL)
Advanced Known
2011 (to 800 feet
AGL)
Unlimited Known
2011 (to 328 feet
AGL)
Unlimited Known
2011 (to 20 feet
AGL) -500 M1 55.7 58.3 60 62.6 64.9
0 M2 56.1 58.1 59.2 64.4 72.8 500 M3 56 57.4 58.1 62.7 65 660 M4 55.8 57.1 57.5 61.8 63.7
1320 M5 54.8 55.7 55.3 58.6 59.9 2640 M6 51.8 52.5 51.3 54 54.7 5280 M7 46.6 47.2 45.6 47.9 48.2 5496 M8 46.2 46.8 45.2 47.5 47.8
10560 M9 39.2 39.7 38.1 40.2 40.3
Table 10. INM 7.0c Modeled Noise Results the Sukhoi SU-29 Performing 50 Aerobatic
Routines (without Lateral Attenuation)
Modeled DNL values (dBA)
Distance (ft)
Grid Point
Sportsman Known
2005 (to 1500 ft
AGL)
Intermediate Known 2005 (to 1200 ft
AGL)
Advanced Known
2011 (to 800 feet
AGL)
Unlimited Known
2011 (to 328 feet
AGL)
Unlimited Known
2011 (to 20 feet
AGL) -500 M1 52.9 55.5 57.9 61.0 63.4
0 M2 53.3 55.4 57.2 62.6 70.0 500 M3 53.2 54.7 56.2 61.0 63.4 660 M4 53.1 54.3 55.7 60.0 62.1
1320 M5 51.9 52.7 53.3 56.5 57.8 2640 M6 48.5 49.1 49.2 51.4 52.2 5280 M7 42.6 43.2 43.2 44.8 45.1 5496 M8 42.2 42.8 42.8 44.3 44.7
10560 M9 34.7 35.1 35.2 36.3 36.5
Note that the Advanced routines for some of these aircraft produce less noise than the Sportsman
or Intermediate routines. This is because the Advanced routine has more vertical maneuvers than
the others; these vertical maneuvers have less of the routine at high power settings since the
descending maneuvers typically use idle power. In addition, the Intermediate routine has
Noise Modeling Results Analysis of Aerobatic Aircraft Noise Using the FAA’s Integrated Noise Model
16
horizontal maneuver which are generally lower than the vertical maneuvers of the Advanced
routine, and these high power settings at relatively low altitudes can dominate the noise levels at
the closer distances.
Overall, the loudest noise levels for both the Edge and the Sukhoi were the results of modeling
50 identical, modified Unlimited routines scaled to a minimum altitude of 20 feet AFE, with the
Edge being 1-4 dBA DNL louder than the Sukhoi.
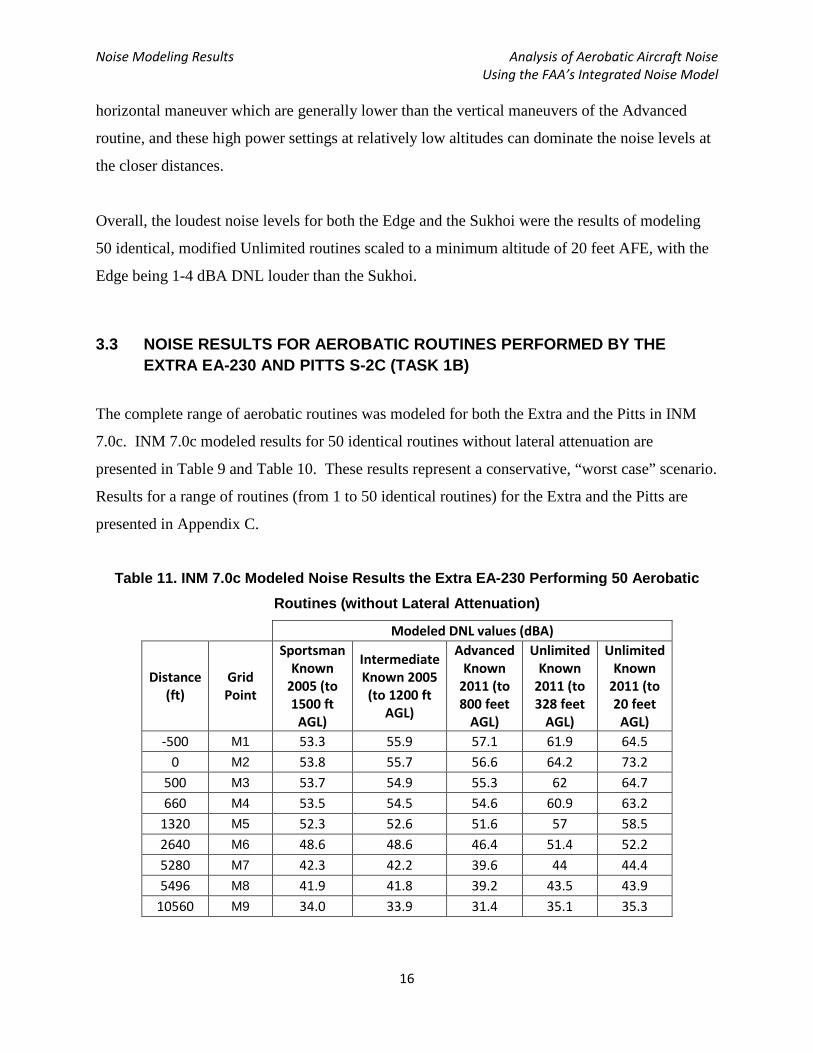
3.3 NOISE RESULTS FOR AEROBATIC ROUTINES PERFORMED BY THE EXTRA EA-230 AND PITTS S-2C (TASK 1B)
The complete range of aerobatic routines was modeled for both the Extra and the Pitts in INM
7.0c. INM 7.0c modeled results for 50 identical routines without lateral attenuation are
presented in Table 9 and Table 10. These results represent a conservative, “worst case” scenario.
Results for a range of routines (from 1 to 50 identical routines) for the Extra and the Pitts are
presented in Appendix C.
Table 11. INM 7.0c Modeled Noise Results the Extra EA-230 Performing 50 Aerobatic
Routines (without Lateral Attenuation)
Modeled DNL values (dBA)
Distance (ft)
Grid Point
Sportsman Known
2005 (to 1500 ft
AGL)
Intermediate Known 2005 (to 1200 ft
AGL)
Advanced Known
2011 (to 800 feet
AGL)
Unlimited Known
2011 (to 328 feet
AGL)
Unlimited Known
2011 (to 20 feet
AGL) -500 M1 53.3 55.9 57.1 61.9 64.5
0 M2 53.8 55.7 56.6 64.2 73.2 500 M3 53.7 54.9 55.3 62 64.7 660 M4 53.5 54.5 54.6 60.9 63.2
1320 M5 52.3 52.6 51.6 57 58.5 2640 M6 48.6 48.6 46.4 51.4 52.2 5280 M7 42.3 42.2 39.6 44 44.4 5496 M8 41.9 41.8 39.2 43.5 43.9
10560 M9 34.0 33.9 31.4 35.1 35.3
Noise Modeling Results Analysis of Aerobatic Aircraft Noise Using the FAA’s Integrated Noise Model
17
Table 12. INM 7.0c Modeled Noise Results the Pitts S-2C Performing 50 Aerobatic
Routines (without Lateral Attenuation)
Modeled DNL values (dBA)
Distance (ft)
Grid Point
Sportsman Known
2005 (to 1500 ft
AGL)
Intermediate Known 2005 (to 1200 ft
AGL)
Advanced Known
2011 (to 800 feet
AGL)
Unlimited Known
2011 (to 328 feet
AGL)
Unlimited Known
2011 (to 20 feet
AGL) -500 M1 52.6 55.2 56.6 60.6 63.1
0 M2 53 57.8 55.8 63.3 72.9 500 M3 53 54 54.4 60.8 63.4 660 M4 52.8 53.7 53.8 59.8 62.1
1320 M5 51.7 52.2 51.2 56.5 58.3 2640 M6 48.5 48.9 46.9 51.8 52.9 5280 M7 42.9 43.3 40.8 45.1 45.8 5496 M8 42.5 43 40.4 44.7 45.3
10560 M9 34.7 35.1 32.6 36.3 36.6
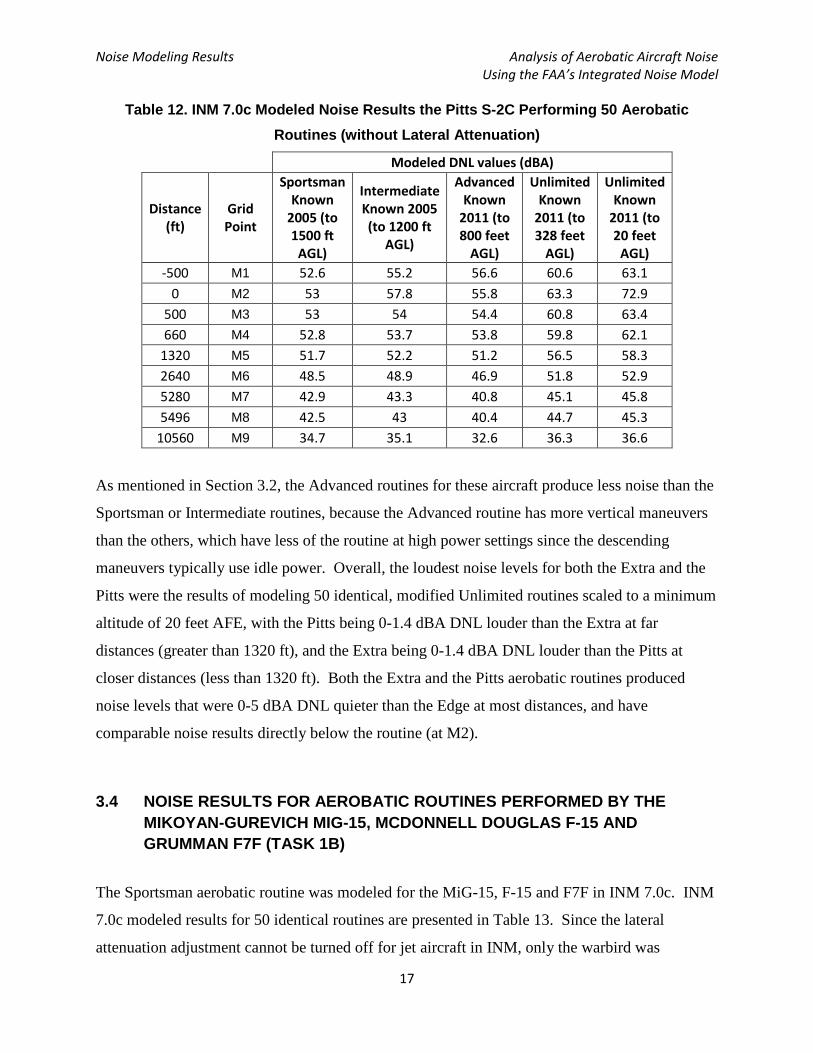
As mentioned in Section 3.2, the Advanced routines for these aircraft produce less noise than the
Sportsman or Intermediate routines, because the Advanced routine has more vertical maneuvers
than the others, which have less of the routine at high power settings since the descending
maneuvers typically use idle power. Overall, the loudest noise levels for both the Extra and the
Pitts were the results of modeling 50 identical, modified Unlimited routines scaled to a minimum
altitude of 20 feet AFE, with the Pitts being 0-1.4 dBA DNL louder than the Extra at far
distances (greater than 1320 ft), and the Extra being 0-1.4 dBA DNL louder than the Pitts at
closer distances (less than 1320 ft). Both the Extra and the Pitts aerobatic routines produced
noise levels that were 0-5 dBA DNL quieter than the Edge at most distances, and have
comparable noise results directly below the routine (at M2).
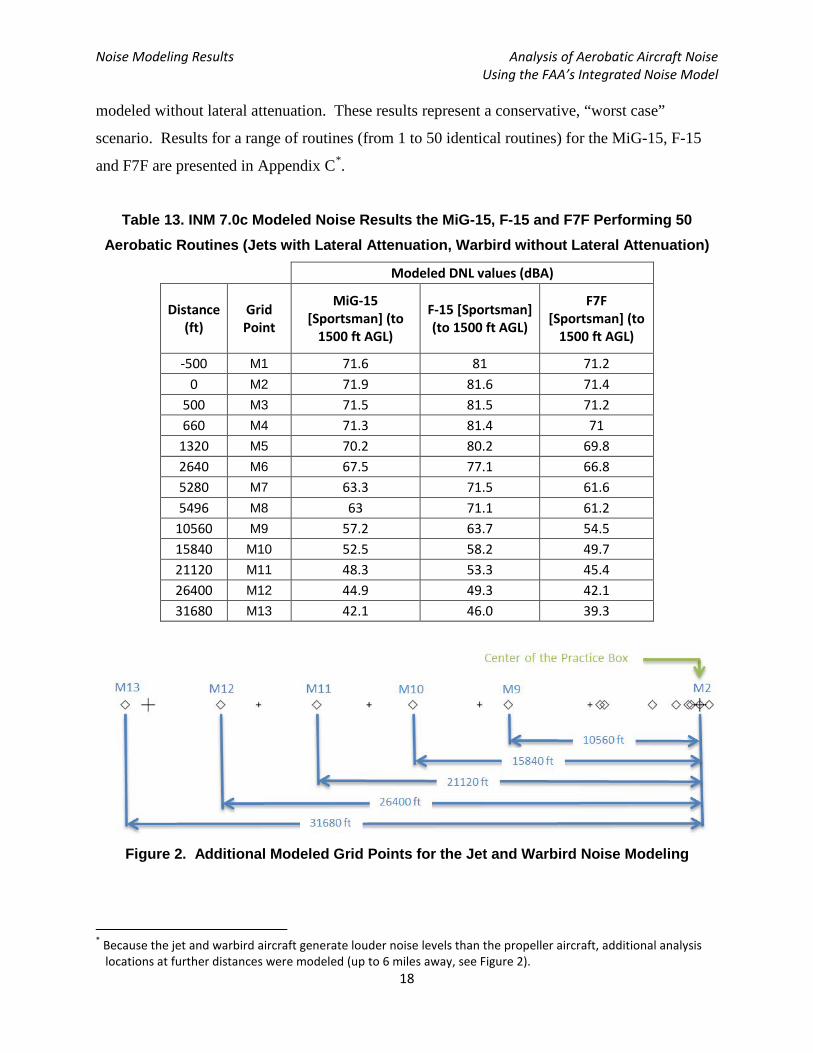
3.4 NOISE RESULTS FOR AEROBATIC ROUTINES PERFORMED BY THE MIKOYAN-GUREVICH MIG-15, MCDONNELL DOUGLAS F-15 AND GRUMMAN F7F (TASK 1B)
The Sportsman aerobatic routine was modeled for the MiG-15, F-15 and F7F in INM 7.0c. INM
7.0c modeled results for 50 identical routines are presented in Table 13. Since the lateral
attenuation adjustment cannot be turned off for jet aircraft in INM, only the warbird was
Noise Modeling Results Analysis of Aerobatic Aircraft Noise Using the FAA’s Integrated Noise Model
18
modeled without lateral attenuation. These results represent a conservative, “worst case”
scenario. Results for a range of routines (from 1 to 50 identical routines) for the MiG-15, F-15
and F7F are presented in Appendix C*.
Table 13. INM 7.0c Modeled Noise Results the MiG-15, F-15 and F7F Performing 50
Aerobatic Routines (Jets with Lateral Attenuation, Warbird without Lateral Attenuation)
Modeled DNL values (dBA)
Distance (ft)
Grid Point
MiG-15 [Sportsman] (to
1500 ft AGL)
F-15 [Sportsman] (to 1500 ft AGL)
F7F [Sportsman] (to
1500 ft AGL)
-500 M1 71.6 81 71.2 0 M2 71.9 81.6 71.4
500 M3 71.5 81.5 71.2 660 M4 71.3 81.4 71
1320 M5 70.2 80.2 69.8 2640 M6 67.5 77.1 66.8 5280 M7 63.3 71.5 61.6 5496 M8 63 71.1 61.2
10560 M9 57.2 63.7 54.5 15840 M10 52.5 58.2 49.7 21120 M11 48.3 53.3 45.4 26400 M12 44.9 49.3 42.1 31680 M13 42.1 46.0 39.3
Figure 2. Additional Modeled Grid Points for the Jet and Warbird Noise Modeling
* Because the jet and warbird aircraft generate louder noise levels than the propeller aircraft, additional analysis
locations at further distances were modeled (up to 6 miles away, see Figure 2).

Noise Modeling Results Analysis of Aerobatic Aircraft Noise Using the FAA’s Integrated Noise Model
19
Overall, the loudest noise levels for 50 identical routines were produced by the F-15, with the
MiG-15 being 6.5-10.1 dBA DNL quieter than the F-15, and the F7F being 9.2-10.4 dBA DNL
quieter than the F-15. All three of these aircraft resulted in noise levels significantly louder than
the Extra, Edge, Sukhoi and Pitts at most distances (greater than 15 dBA DNL).

Noise Modeling Results Analysis of Aerobatic Aircraft Noise Using the FAA’s Integrated Noise Model
20
Page left blank intentionally.
4 SUMMARY AND ANALYSIS Once the INM modeling is complete, the noise results are analyzed for the full range of aircraft
flying aerobatic routines represented in this study (as summarized in Table 1). Section 4.1
presents the analysis of the noise results for the study aircraft performing up to 50 identical
aerobatic routines. Section 4.2 presents a method for estimating the noise results for a
combination of aircraft performing a combination of different aerobatic routines. Section 4.3
discusses the applicability of the INM modeled noise results for evaluating noise from aerobatic
routines not represented in this analysis.
4.1 ANALYSIS OF NOISE RESULTS FOR MODELED AEROBATIC ROUTINES
The goal of this report is to present a noise analysis for a range of complete aerobatic routines
and a range of aircraft modeled with INM, in order to provide a matrix of INM modeled noise
results for a range of aircraft performing aerobatic routines that the FAA can utilize to perform
NEPA analyses. The land-use compatibility threshold for aircraft noise in the vicinity of an
airport is 65 dBA DNL. The noise levels for the aircraft flying aerobatic routines represented in
this study (see Section 3and Appendix C) represent up to 50 identical aerobatic routines
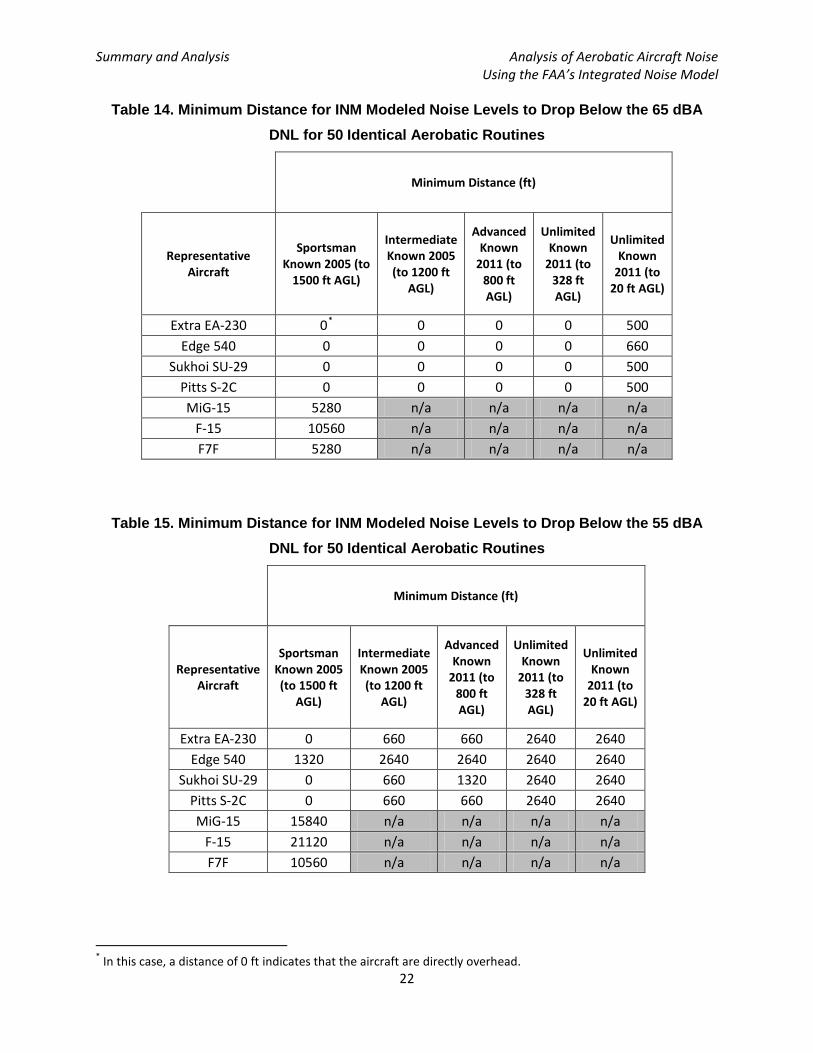
performed by each aircraft that can be evaluated against this threshold. Table 14 presents the
minimum distance (from directly below the center of the aerobatic routine) that result aircraft-
specific INM noise levels for 50 identical aerobatic routines below the 65 dBA DNL threshold.
A conservative 55 dBA DNL threshold is presented in Table 15.
Summary and Analysis Analysis of Aerobatic Aircraft Noise Using the FAA’s Integrated Noise Model
22
Table 14. Minimum Distance for INM Modeled Noise Levels to Drop Below the 65 dBA
DNL for 50 Identical Aerobatic Routines
Minimum Distance (ft)
Representative Aircraft
Sportsman Known 2005 (to
1500 ft AGL)
Intermediate Known 2005 (to 1200 ft
AGL)
Advanced Known
2011 (to 800 ft AGL)
Unlimited Known
2011 (to 328 ft AGL)
Unlimited Known
2011 (to 20 ft AGL)
Extra EA-230 0* 0 0 0 500 Edge 540 0 0 0 0 660
Sukhoi SU-29 0 0 0 0 500 Pitts S-2C 0 0 0 0 500 MiG-15 5280 n/a n/a n/a n/a
F-15 10560 n/a n/a n/a n/a F7F 5280 n/a n/a n/a n/a
Table 15. Minimum Distance for INM Modeled Noise Levels to Drop Below the 55 dBA
DNL for 50 Identical Aerobatic Routines
Minimum Distance (ft)
Representative Aircraft
Sportsman Known 2005 (to 1500 ft
AGL)
Intermediate Known 2005 (to 1200 ft
AGL)
Advanced Known
2011 (to 800 ft AGL)
Unlimited Known
2011 (to 328 ft AGL)
Unlimited Known
2011 (to 20 ft AGL)
Extra EA-230 0 660 660 2640 2640 Edge 540 1320 2640 2640 2640 2640
Sukhoi SU-29 0 660 1320 2640 2640 Pitts S-2C 0 660 660 2640 2640 MiG-15 15840 n/a n/a n/a n/a
F-15 21120 n/a n/a n/a n/a F7F 10560 n/a n/a n/a n/a
* In this case, a distance of 0 ft indicates that the aircraft are directly overhead.
Summary and Analysis Analysis of Aerobatic Aircraft Noise Using the FAA’s Integrated Noise Model
23
When considering the cumulative noise from 50 identical aerobatic routines from the loudest
aircraft represented by this analysis, a minimum separation distance of 10,560 ft (2 miles)
between the center of the aerobatic practice area and noise sensitive receivers is needed to meet
the 65 dBA DNL threshold. The distance needed for the 55 dBA DNL threshold is 21,120 ft (4
miles). However, the results can be subdivided into two categories: (1) medium to light
propeller aircraft, and (2) heavy propeller aircraft and jets. When considering 50 identical
aerobatic routines from any of the medium to light propeller aircraft, the minimum separation
distance needed to meet the 65 dBA DNL threshold is 660 ft, and 2,640 ft for the 55 dBA DNL
threshold. For 50 identical aerobatic routines from any of the heavy propeller aircraft and jets,
the thresholds of 10,560 ft for 65 dBA DNL and 21,120 ft for 55 dBA DNL still apply.
4.2 METHOD FOR ESTIMATING NOISE RESULTS FOR COMIBNATIONS OF AEROBATIC ROUTINES
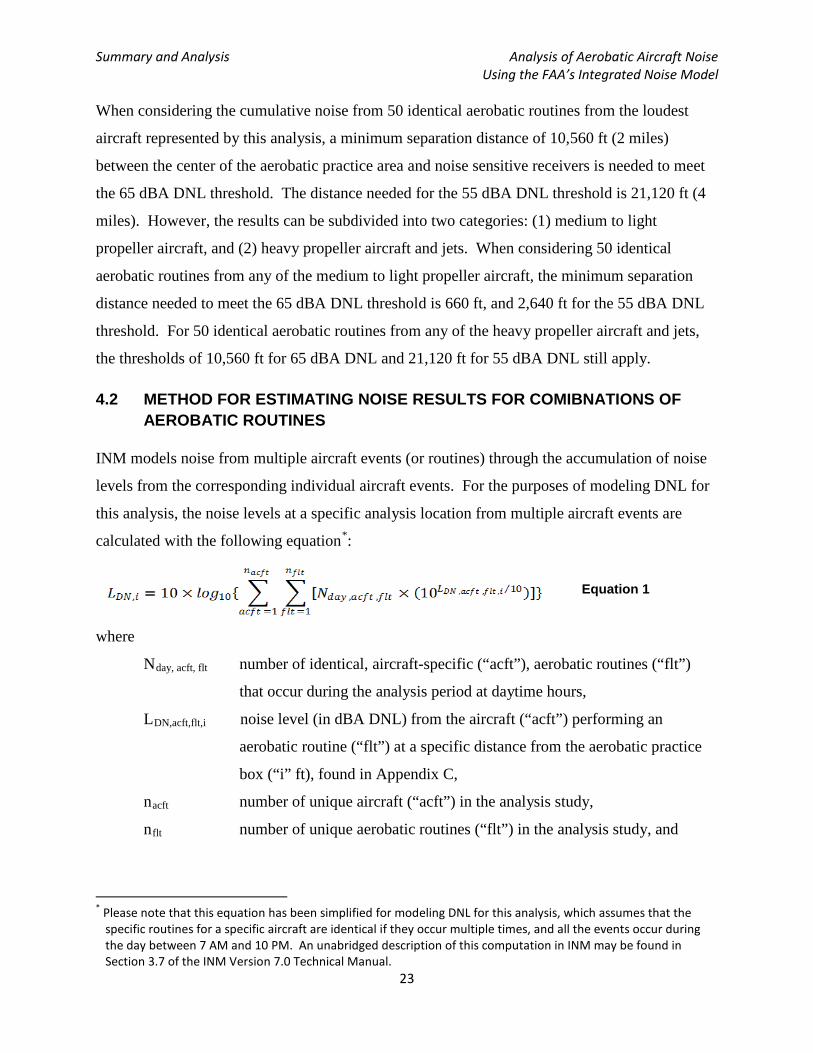
INM models noise from multiple aircraft events (or routines) through the accumulation of noise
levels from the corresponding individual aircraft events. For the purposes of modeling DNL for
this analysis, the noise levels at a specific analysis location from multiple aircraft events are
calculated with the following equation*:
Equation 1
where
Nday, acft, flt number of identical, aircraft-specific (“acft”), aerobatic routines (“flt”)
that occur during the analysis period at daytime hours,
LDN,acft,flt,i noise level (in dBA DNL) from the aircraft (“acft”) performing an
aerobatic routine (“flt”) at a specific distance from the aerobatic practice
box (“i” ft), found in Appendix C,
nacft number of unique aircraft (“acft”) in the analysis study,
nflt number of unique aerobatic routines (“flt”) in the analysis study, and
* Please note that this equation has been simplified for modeling DNL for this analysis, which assumes that the
specific routines for a specific aircraft are identical if they occur multiple times, and all the events occur during the day between 7 AM and 10 PM. An unabridged description of this computation in INM may be found in Section 3.7 of the INM Version 7.0 Technical Manual.

Summary and Analysis Analysis of Aerobatic Aircraft Noise Using the FAA’s Integrated Noise Model
24
LDN, i cumulative day-night average noise level in dBA DNL at a specific
distance from the aerobatic practice box (“i” ft).
When using this equation, INM can account for identical aircraft events with the scaling factor
Nday, acft, flt.
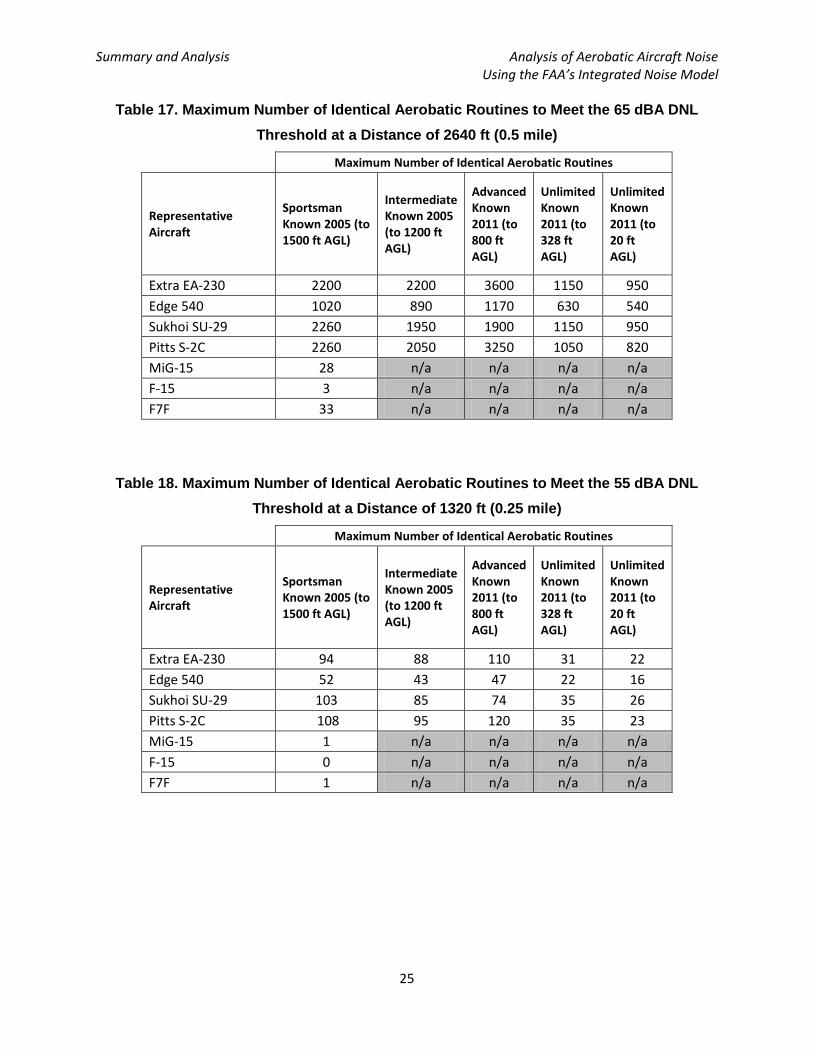
Given the results presented in Appendix C of this report, Equation 1 can be used to estimate the
maximum number of identical aerobatic routines performed by a specific aircraft for a given day.
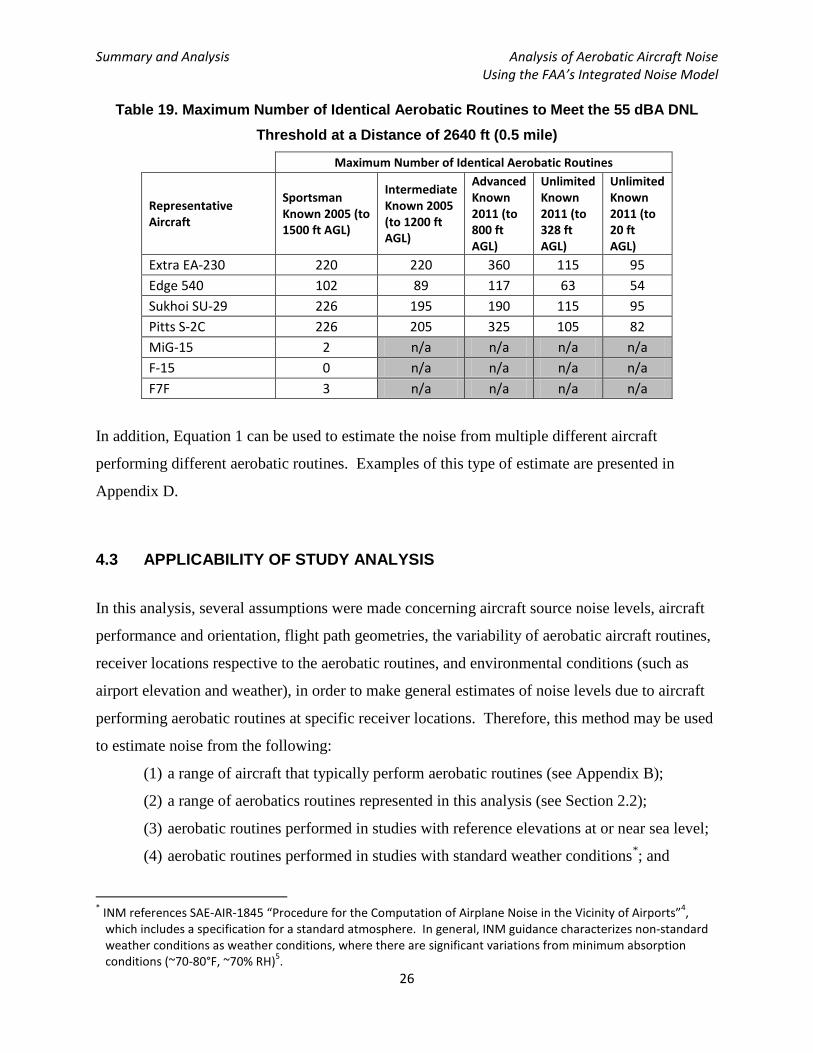
Table 16 and Table 17 present the maximum number identical aerobatic routines that may be
modeled for a given aircraft to meet the 65 dBA DNL threshold at a distance of 0.25 mile and
0.5 mile from directly below the center of the aerobatic routine, respectively*. Table 18 and
Table 19 present the corresponding results for a more conservative 55 dBA DNL threshold.
Table 16. Maximum Number of Identical Aerobatic Routines to Meet the 65 dBA DNL
Threshold at a Distance of 1320 ft (0.25 mile)
Maximum Number of Identical Aerobatic Routines
Representative Aircraft
Sportsman Known 2005 (to 1500 ft AGL)
Intermediate Known 2005 (to 1200 ft AGL)
Advanced Known 2011 (to 800 ft AGL)
Unlimited Known 2011 (to 328 ft AGL)
Unlimited Known 2011 (to 20 ft AGL)
Extra EA-230 940 880 1100 315 225 Edge 540 520 430 470 220 164 Sukhoi SU-29 1030 850 740 355 265 Pitts S-2C 1080 950 1200 355 235 MiG-15 15 n/a n/a n/a n/a F-15 1 n/a n/a n/a n/a F7F 16 n/a n/a n/a n/a
* In the 2006 report, none of the aerobatic routines analyzed would have exceeded 65 dBA DNL at distances 0.25
mile or more from the center of the practice box, and a conservative recommendation was made to locate heavily utilized aerobatics practice boxes 0.5 mile or more from noise sensitive receivers. Therefore, those same 0.25 and 0.5 miles distances were utilized in this analysis.
Summary and Analysis Analysis of Aerobatic Aircraft Noise Using the FAA’s Integrated Noise Model
25
Table 17. Maximum Number of Identical Aerobatic Routines to Meet the 65 dBA DNL
Threshold at a Distance of 2640 ft (0.5 mile)
Maximum Number of Identical Aerobatic Routines
Representative Aircraft
Sportsman Known 2005 (to 1500 ft AGL)
Intermediate Known 2005 (to 1200 ft AGL)
Advanced Known 2011 (to 800 ft AGL)
Unlimited Known 2011 (to 328 ft AGL)
Unlimited Known 2011 (to 20 ft AGL)
Extra EA-230 2200 2200 3600 1150 950 Edge 540 1020 890 1170 630 540 Sukhoi SU-29 2260 1950 1900 1150 950 Pitts S-2C 2260 2050 3250 1050 820 MiG-15 28 n/a n/a n/a n/a F-15 3 n/a n/a n/a n/a F7F 33 n/a n/a n/a n/a
Table 18. Maximum Number of Identical Aerobatic Routines to Meet the 55 dBA DNL
Threshold at a Distance of 1320 ft (0.25 mile)
Maximum Number of Identical Aerobatic Routines
Representative Aircraft
Sportsman Known 2005 (to 1500 ft AGL)
Intermediate Known 2005 (to 1200 ft AGL)
Advanced Known 2011 (to 800 ft AGL)
Unlimited Known 2011 (to 328 ft AGL)
Unlimited Known 2011 (to 20 ft AGL)
Extra EA-230 94 88 110 31 22 Edge 540 52 43 47 22 16 Sukhoi SU-29 103 85 74 35 26 Pitts S-2C 108 95 120 35 23 MiG-15 1 n/a n/a n/a n/a F-15 0 n/a n/a n/a n/a F7F 1 n/a n/a n/a n/a
Summary and Analysis Analysis of Aerobatic Aircraft Noise Using the FAA’s Integrated Noise Model
26
Table 19. Maximum Number of Identical Aerobatic Routines to Meet the 55 dBA DNL
Threshold at a Distance of 2640 ft (0.5 mile)
Maximum Number of Identical Aerobatic Routines
Representative Aircraft
Sportsman Known 2005 (to 1500 ft AGL)
Intermediate Known 2005 (to 1200 ft AGL)
Advanced Known 2011 (to 800 ft AGL)
Unlimited Known 2011 (to 328 ft AGL)
Unlimited Known 2011 (to 20 ft AGL)
Extra EA-230 220 220 360 115 95 Edge 540 102 89 117 63 54 Sukhoi SU-29 226 195 190 115 95 Pitts S-2C 226 205 325 105 82 MiG-15 2 n/a n/a n/a n/a F-15 0 n/a n/a n/a n/a F7F 3 n/a n/a n/a n/a
In addition, Equation 1 can be used to estimate the noise from multiple different aircraft
performing different aerobatic routines. Examples of this type of estimate are presented in
Appendix D.
4.3 APPLICABILITY OF STUDY ANALYSIS
In this analysis, several assumptions were made concerning aircraft source noise levels, aircraft
performance and orientation, flight path geometries, the variability of aerobatic aircraft routines,
receiver locations respective to the aerobatic routines, and environmental conditions (such as
airport elevation and weather), in order to make general estimates of noise levels due to aircraft
performing aerobatic routines at specific receiver locations. Therefore, this method may be used
to estimate noise from the following:
(1) a range of aircraft that typically perform aerobatic routines (see Appendix B);
(2) a range of aerobatics routines represented in this analysis (see Section 2.2);
(3) aerobatic routines performed in studies with reference elevations at or near sea level;
(4) aerobatic routines performed in studies with standard weather conditions*; and
* INM references SAE-AIR-1845 “Procedure for the Computation of Airplane Noise in the Vicinity of Airports”4,
which includes a specification for a standard atmosphere. In general, INM guidance characterizes non-standard weather conditions as weather conditions, where there are significant variations from minimum absorption conditions (~70-80°F, ~70% RH)5.

Summary and Analysis Analysis of Aerobatic Aircraft Noise Using the FAA’s Integrated Noise Model
27
(5) daytime operations.
While it is impossible to predict with 100% certainty the noise produced by any aircraft event,
these assumptions are considered reasonable, and the aircraft noise modeling method developed
for this analysis is considered a good method for estimating general noise from aircraft
performing aerobatic routines.
It is also important to note that the INM modeling for this analysis does not take into account the
following:
(1) noise from aircraft significantly different than those represented in this analysis (see
Appendix B;
(2) noise from aerobatics routines significantly different than those represented in this
analysis (see Section 2.2);
(3) noise from aircraft approaches to or departures from the aerobatic routines;
(4) noise from other sources (including other non-aerobatic flights and ambient noise)
(5) noise from aerobatic routines performed in studies with reference elevations
significantly different from sea level;
(6) noise from aerobatic routines performed in studies with non-standard weather
conditions; and
(7) noise from nighttime operations.
Additional INM modeling may be able to provide reasonable estimates for the noise levels
generated under these conditions not represented in the current analysis. Furthermore, additional
aircraft noise measurements may be able to supplement and validate the noise modeling of these
aircraft and operations (or routines) not represented in this analysis.

Summary and Analysis Analysis of Aerobatic Aircraft Noise Using the FAA’s Integrated Noise Model
28
Page left blank intentionally.
5 CONCLUSIONS AND RECOMMENDATIONS
The 2006 study concluded that none of the aerobatic routines flown in that study (Sportsman
routines for the Extra and the Pitts, and Intermediate routine for the Sukhoi) would have
exceeded 65 dBA DNL at distances 0.25 mile or more from the center of the practice box*. A
conservative recommendation to locate heavily utilized aerobatics practice boxes 0.5 mile or
more from noise sensitive receivers was made in part based on those results. INM 7.0c noise
results for the corresponding aerobatic routines confirmed this recommendation.
INM 7.0c modeled results for the full range of aerobatic routines for the medium to light
propeller aircraft from the 2006 study (Extra, Edge, Pitts and Sukhoi) further support this
recommendation, when modeling noise from 50 identical aerobatic routines. However, it should
be noted that INM 7.0c produces noise levels up to 59.9 dBA DNL at a distance of 0.25 mile for
the Edge, when performing 50 identical Unlimited routines at a minimum altitude of 20 ft AFE.
Noise levels were below 54.7 dBA DNL at a distance of 0.5 mile from the aerobatic practice box
for the full range of aerobatic routines for all four aircraft. Separate aircraft and aerobatic routine
specific thresholds may be determined from the results presented in Section 4.1.
The INM 7.0c modeled noise from heavy propeller aircraft and jets (MiG-15, F-15 and F7F)
performing 50 identical routines exceeded the 65 dBA DNL threshold DNL at a distance of 0.5
mile from the aerobatic practice box. In order to meet the 65 dBA DNL threshold for all three
aircraft, the recommended minimum distance between the aerobatic routines and noise sensitive
receivers should be 2 miles. This minimum distance should be extended to 4 miles, when
considering a 55 dBA DNL threshold. Separate aircraft and aerobatic routine specific thresholds
may be determined from the results presented in Section 4.1.
Finally, when evaluating noise for aircraft, routines or conditions not represented by this
analysis, additional INM noise modeling is recommended. This may be further supplemented
and validated with additional aircraft noise measurements.
* This was a conservative estimate. In the 2006 report, the estimated DNL values for 50 identical routines for each
of the three aircraft were less than 56 dBA DNL.

Conclusions and Analysis of Aerobatic Aircraft Noise Recommendations Using the FAA’s Integrated Noise Model
30
Page left blank intentionally.

Appendix A References
1. Boeker, et al.: Integrated Noise Model (INM) Version 7.0 Technical Manual, Report No. FAA-AEE-08-01, Washington, D.C.: Federal Aviation Administration, January 2008.
2. Boeker, Eric: Aerobatic Aircraft Noise Study: Technical Memorandum, May 2006.
3. Society of Automotive Engineers, Committee A-21, Aircraft Noise, Method for Predicting Lateral Attenuation of Airplane Noise, Aerospace Information Report No. 5662, Warrendale, PA: Society of Automotive Engineers, Inc., April 2006.
4. Society of Automotive Engineers, Committee A-21, Aircraft Noise, Procedure for the
Computation of Airplane Noise in the Vicinity of Airports, Aerospace Information Report No. 1845, Warrendale, PA: Society of Automotive Engineers, Inc., March 1986.
5. INM Version 7.0a Software Update, Release Notes, May 2006.

Appendix A Analysis of Aerobatic Aircraft Noise References Using the FAA’s Integrated Noise Model
32
Page left blank intentionally.
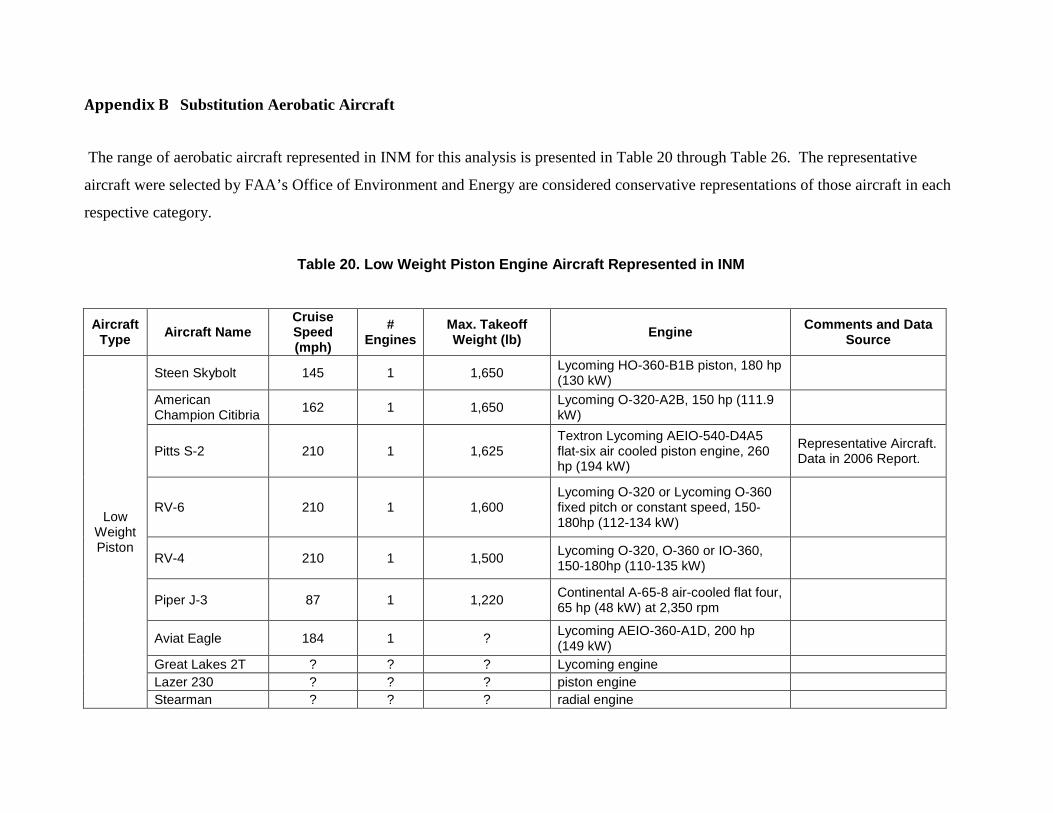
Appendix B Substitution Aerobatic Aircraft
The range of aerobatic aircraft represented in INM for this analysis is presented in Table 20 through Table 26. The representative
aircraft were selected by FAA’s Office of Environment and Energy are considered conservative representations of those aircraft in each
respective category.
Table 20. Low Weight Piston Engine Aircraft Represented in INM
Aircraft Type
Aircraft Name Cruise Speed (mph)
# Engines
Max. Takeoff Weight (lb)
Engine Comments and Data
Source
Low Weight Piston
Steen Skybolt 145 1 1,650 Lycoming HO-360-B1B piston, 180 hp (130 kW)
American Champion Citibria 162 1 1,650 Lycoming O-320-A2B, 150 hp (111.9
kW)
Pitts S-2 210 1 1,625 Textron Lycoming AEIO-540-D4A5 flat-six air cooled piston engine, 260 hp (194 kW)
Representative Aircraft. Data in 2006 Report.
RV-6 210 1 1,600 Lycoming O-320 or Lycoming O-360 fixed pitch or constant speed, 150-180hp (112-134 kW)
RV-4 210 1 1,500 Lycoming O-320, O-360 or IO-360, 150-180hp (110-135 kW)
Piper J-3 87 1 1,220 Continental A-65-8 air-cooled flat four, 65 hp (48 kW) at 2,350 rpm
Aviat Eagle 184 1 ? Lycoming AEIO-360-A1D, 200 hp (149 kW)
Great Lakes 2T ? ? ? Lycoming engine Lazer 230 ? ? ? piston engine Stearman ? ? ? radial engine
Appendix B Analysis of Aerobatic Aircraft Noise Substitution Aerobatic Aircraft Using the FAA’s Integrated Noise Model
34
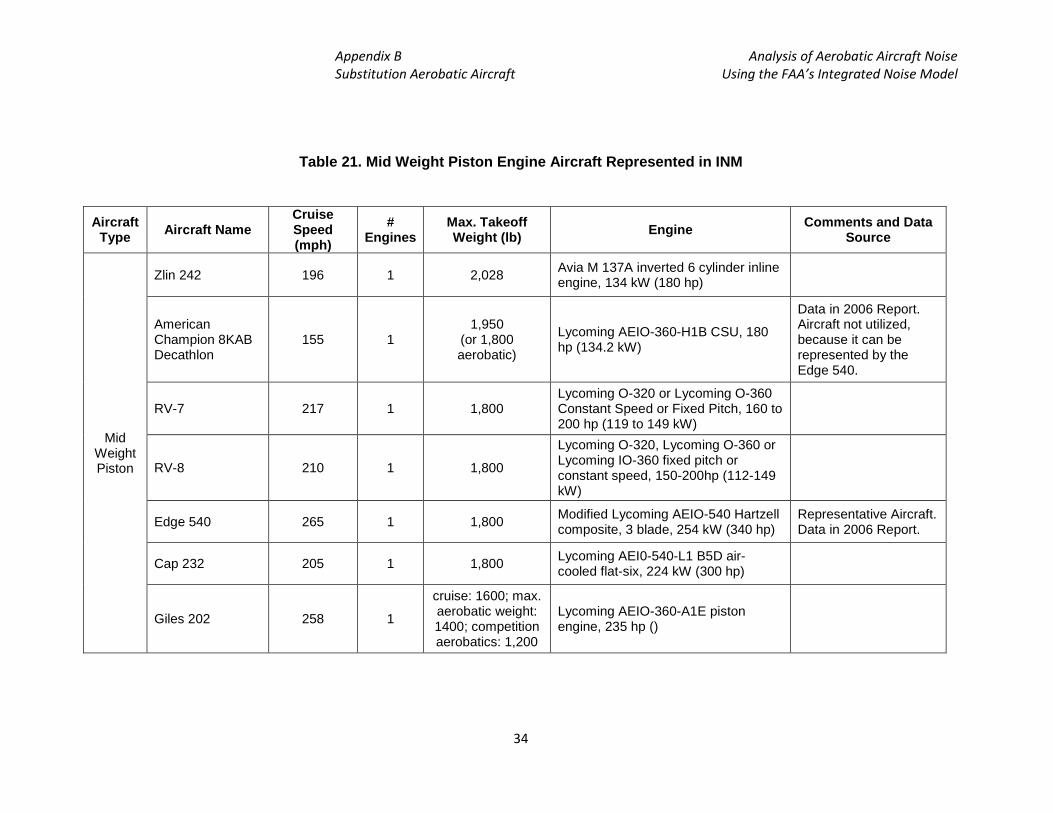
Table 21. Mid Weight Piston Engine Aircraft Represented in INM
Aircraft Type
Aircraft Name Cruise Speed (mph)
# Engines
Max. Takeoff Weight (lb)
Engine Comments and Data
Source
Mid Weight Piston
Zlin 242 196 1 2,028 Avia M 137A inverted 6 cylinder inline engine, 134 kW (180 hp)
American Champion 8KAB Decathlon
155 1 1,950
(or 1,800 aerobatic)
Lycoming AEIO-360-H1B CSU, 180 hp (134.2 kW)
Data in 2006 Report. Aircraft not utilized, because it can be represented by the Edge 540.
RV-7 217 1 1,800 Lycoming O-320 or Lycoming O-360 Constant Speed or Fixed Pitch, 160 to 200 hp (119 to 149 kW)
RV-8 210 1 1,800
Lycoming O-320, Lycoming O-360 or Lycoming IO-360 fixed pitch or constant speed, 150-200hp (112-149 kW)
Edge 540 265 1 1,800 Modified Lycoming AEIO-540 Hartzell composite, 3 blade, 254 kW (340 hp)
Representative Aircraft. Data in 2006 Report.
Cap 232 205 1 1,800 Lycoming AEI0-540-L1 B5D air-cooled flat-six, 224 kW (300 hp)
Giles 202 258 1
cruise: 1600; max. aerobatic weight: 1400; competition aerobatics: 1,200
Lycoming AEIO-360-A1E piston engine, 235 hp ()
Appendix B Analysis of Aerobatic Aircraft Noise Substitution Aerobatic Aircraft Using the FAA’s Integrated Noise Model
35
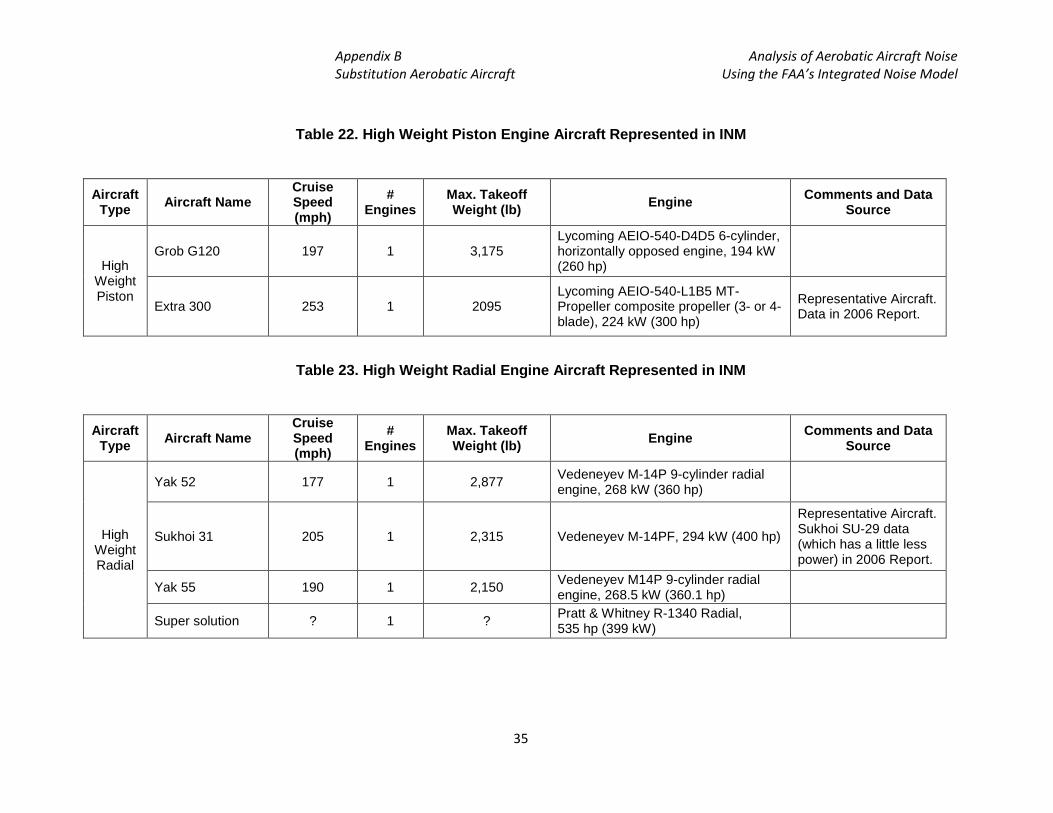
Table 22. High Weight Piston Engine Aircraft Represented in INM
Aircraft Type
Aircraft Name Cruise Speed (mph)
# Engines
Max. Takeoff Weight (lb)
Engine Comments and Data
Source
High Weight Piston
Grob G120 197 1 3,175 Lycoming AEIO-540-D4D5 6-cylinder, horizontally opposed engine, 194 kW (260 hp)
Extra 300 253 1 2095 Lycoming AEIO-540-L1B5 MT-Propeller composite propeller (3- or 4-blade), 224 kW (300 hp)
Representative Aircraft. Data in 2006 Report.
Table 23. High Weight Radial Engine Aircraft Represented in INM
Aircraft Type
Aircraft Name Cruise Speed (mph)
# Engines
Max. Takeoff Weight (lb)
Engine Comments and Data
Source
High Weight Radial
Yak 52 177 1 2,877 Vedeneyev M-14P 9-cylinder radial engine, 268 kW (360 hp)
Sukhoi 31 205 1 2,315 Vedeneyev M-14PF, 294 kW (400 hp)
Representative Aircraft. Sukhoi SU-29 data (which has a little less power) in 2006 Report.
Yak 55 190 1 2,150 Vedeneyev M14P 9-cylinder radial engine, 268.5 kW (360.1 hp)
Super solution ? 1 ? Pratt & Whitney R-1340 Radial, 535 hp (399 kW)
Appendix B Analysis of Aerobatic Aircraft Noise Substitution Aerobatic Aircraft Using the FAA’s Integrated Noise Model
36
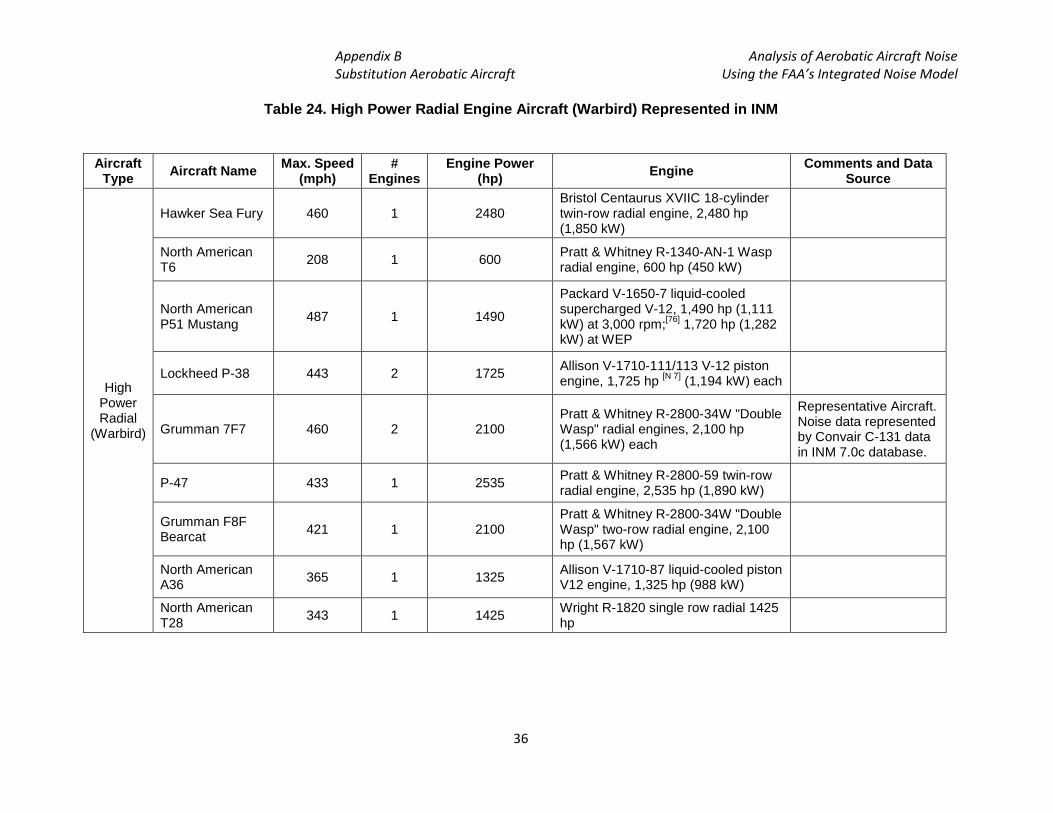
Table 24. High Power Radial Engine Aircraft (Warbird) Represented in INM
Aircraft Type
Aircraft Name Max. Speed
(mph) #
Engines Engine Power
(hp) Engine
Comments and Data Source
High Power Radial
(Warbird)
Hawker Sea Fury 460 1 2480 Bristol Centaurus XVIIC 18-cylinder twin-row radial engine, 2,480 hp (1,850 kW)
North American T6 208 1 600 Pratt & Whitney R-1340-AN-1 Wasp
radial engine, 600 hp (450 kW)
North American P51 Mustang 487 1 1490
Packard V-1650-7 liquid-cooled supercharged V-12, 1,490 hp (1,111 kW) at 3,000 rpm;[76] 1,720 hp (1,282 kW) at WEP
Lockheed P-38 443 2 1725 Allison V-1710-111/113 V-12 piston engine, 1,725 hp [N 7] (1,194 kW) each
Grumman 7F7 460 2 2100 Pratt & Whitney R-2800-34W "Double Wasp" radial engines, 2,100 hp (1,566 kW) each
Representative Aircraft. Noise data represented by Convair C-131 data in INM 7.0c database.
P-47 433 1 2535 Pratt & Whitney R-2800-59 twin-row radial engine, 2,535 hp (1,890 kW)
Grumman F8F Bearcat 421 1 2100
Pratt & Whitney R-2800-34W "Double Wasp" two-row radial engine, 2,100 hp (1,567 kW)
North American A36 365 1 1325 Allison V-1710-87 liquid-cooled piston
V12 engine, 1,325 hp (988 kW)
North American T28 343 1 1425 Wright R-1820 single row radial 1425
hp
Appendix B Analysis of Aerobatic Aircraft Noise Substitution Aerobatic Aircraft Using the FAA’s Integrated Noise Model
37
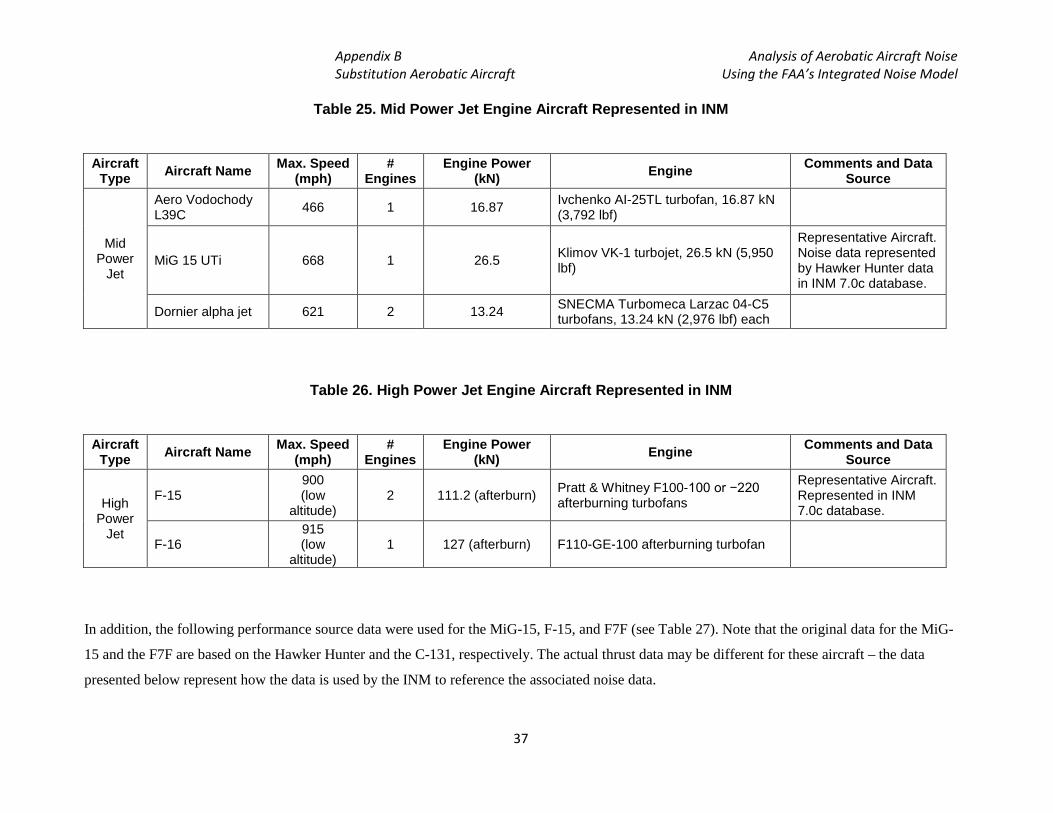
Table 25. Mid Power Jet Engine Aircraft Represented in INM
Aircraft Type
Aircraft Name Max. Speed
(mph) #
Engines Engine Power
(kN) Engine
Comments and Data Source
Mid Power
Jet
Aero Vodochody L39C 466 1 16.87 Ivchenko AI-25TL turbofan, 16.87 kN
(3,792 lbf)
MiG 15 UTi 668 1 26.5 Klimov VK-1 turbojet, 26.5 kN (5,950 lbf)
Representative Aircraft. Noise data represented by Hawker Hunter data in INM 7.0c database.
Dornier alpha jet 621 2 13.24 SNECMA Turbomeca Larzac 04-C5 turbofans, 13.24 kN (2,976 lbf) each
Table 26. High Power Jet Engine Aircraft Represented in INM
Aircraft Type
Aircraft Name Max. Speed
(mph) #
Engines Engine Power
(kN) Engine
Comments and Data Source
High Power
Jet
F-15 900 (low
altitude) 2 111.2 (afterburn) Pratt & Whitney F100-100 or −220
afterburning turbofans
Representative Aircraft. Represented in INM 7.0c database.
F-16 915 (low
altitude) 1 127 (afterburn) F110-GE-100 afterburning turbofan
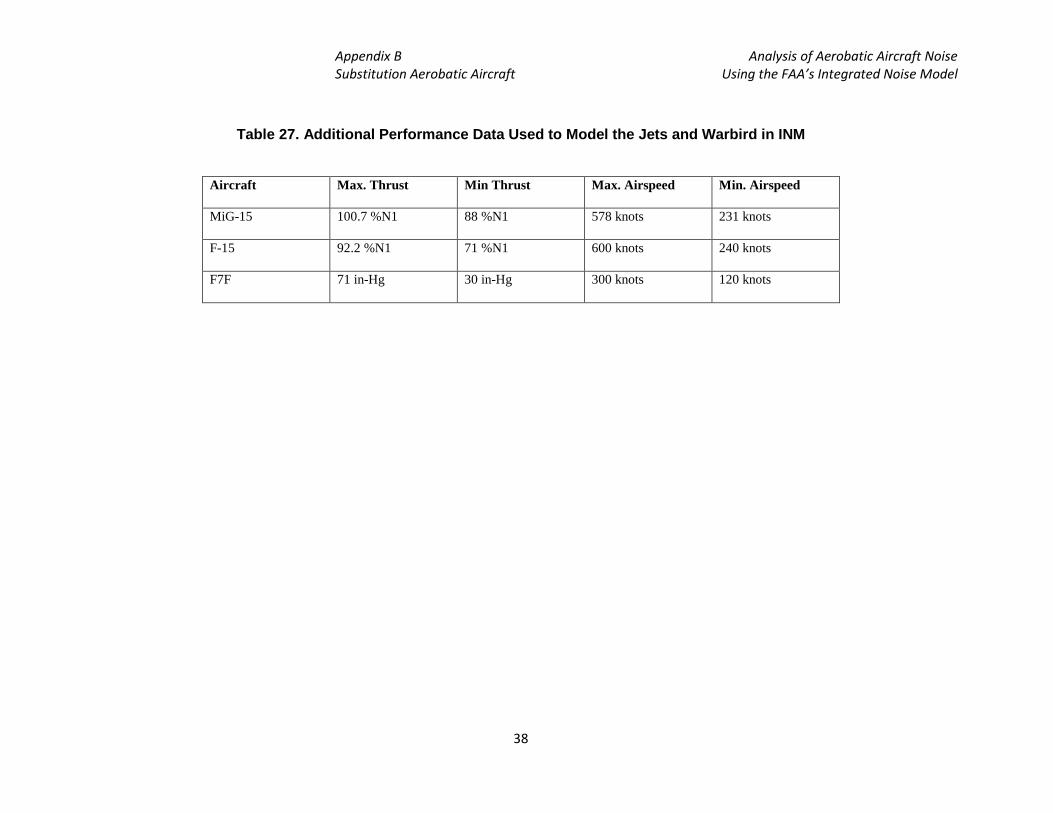
In addition, the following performance source data were used for the MiG-15, F-15, and F7F (see Table 27). Note that the original data for the MiG-
15 and the F7F are based on the Hawker Hunter and the C-131, respectively. The actual thrust data may be different for these aircraft – the data
presented below represent how the data is used by the INM to reference the associated noise data.
Appendix B Analysis of Aerobatic Aircraft Noise Substitution Aerobatic Aircraft Using the FAA’s Integrated Noise Model
38
Table 27. Additional Performance Data Used to Model the Jets and Warbird in INM
Aircraft Max. Thrust Min Thrust Max. Airspeed Min. Airspeed
MiG-15 100.7 %N1 88 %N1 578 knots 231 knots
F-15 92.2 %N1 71 %N1 600 knots 240 knots
F7F 71 in-Hg 30 in-Hg 300 knots 120 knots
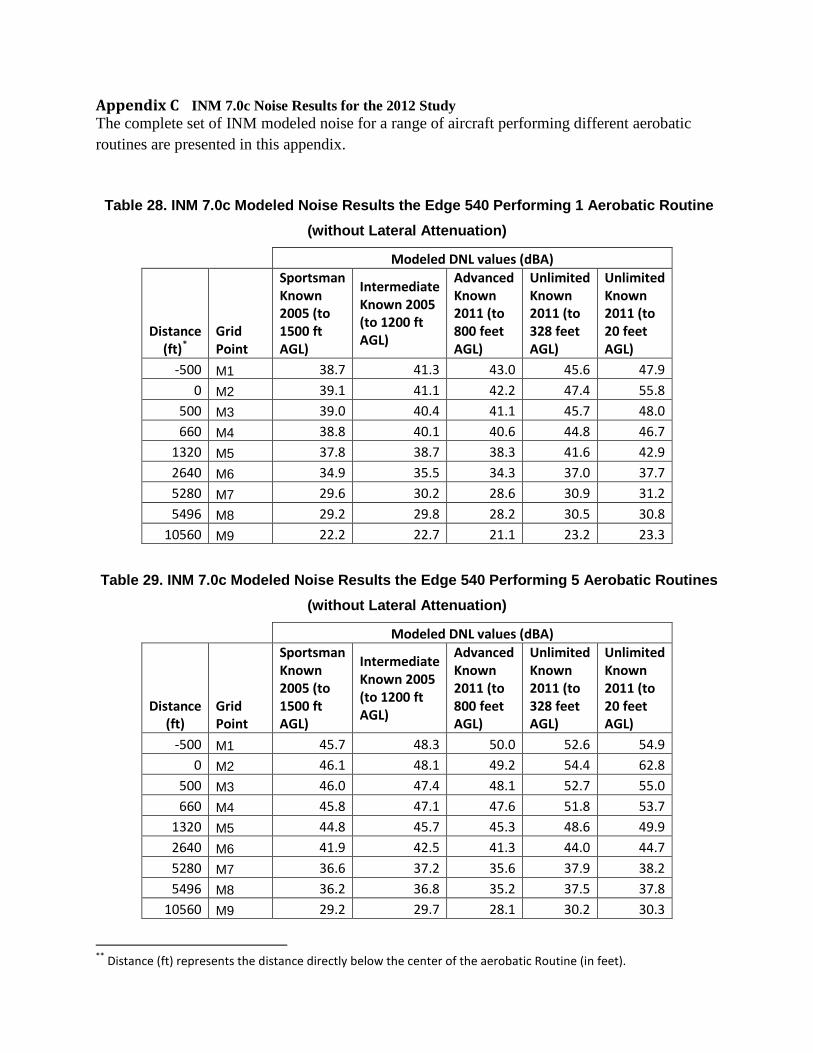
Appendix C INM 7.0c Noise Results for the 2012 Study The complete set of INM modeled noise for a range of aircraft performing different aerobatic routines are presented in this appendix.
Table 28. INM 7.0c Modeled Noise Results the Edge 540 Performing 1 Aerobatic Routine
(without Lateral Attenuation)
Modeled DNL values (dBA)
Distance (ft)*
Grid Point
Sportsman Known 2005 (to 1500 ft AGL)
Intermediate Known 2005 (to 1200 ft AGL)
Advanced Known 2011 (to 800 feet AGL)
Unlimited Known 2011 (to 328 feet AGL)
Unlimited Known 2011 (to 20 feet AGL)
-500 M1 38.7 41.3 43.0 45.6 47.9 0 M2 39.1 41.1 42.2 47.4 55.8
500 M3 39.0 40.4 41.1 45.7 48.0 660 M4 38.8 40.1 40.6 44.8 46.7
1320 M5 37.8 38.7 38.3 41.6 42.9 2640 M6 34.9 35.5 34.3 37.0 37.7 5280 M7 29.6 30.2 28.6 30.9 31.2 5496 M8 29.2 29.8 28.2 30.5 30.8
10560 M9 22.2 22.7 21.1 23.2 23.3
Table 29. INM 7.0c Modeled Noise Results the Edge 540 Performing 5 Aerobatic Routines
(without Lateral Attenuation)
Modeled DNL values (dBA)
Distance (ft)
Grid Point
Sportsman Known 2005 (to 1500 ft AGL)
Intermediate Known 2005 (to 1200 ft AGL)
Advanced Known 2011 (to 800 feet AGL)
Unlimited Known 2011 (to 328 feet AGL)
Unlimited Known 2011 (to 20 feet AGL)
-500 M1 45.7 48.3 50.0 52.6 54.9 0 M2 46.1 48.1 49.2 54.4 62.8
500 M3 46.0 47.4 48.1 52.7 55.0 660 M4 45.8 47.1 47.6 51.8 53.7
1320 M5 44.8 45.7 45.3 48.6 49.9 2640 M6 41.9 42.5 41.3 44.0 44.7 5280 M7 36.6 37.2 35.6 37.9 38.2 5496 M8 36.2 36.8 35.2 37.5 37.8
10560 M9 29.2 29.7 28.1 30.2 30.3
** Distance (ft) represents the distance directly below the center of the aerobatic Routine (in feet).
Appendix C Analysis of Aerobatic Aircraft Noise INM 7.0c Noise Results for the 2012 Study Using the FAA’s Integrated Noise Model
40
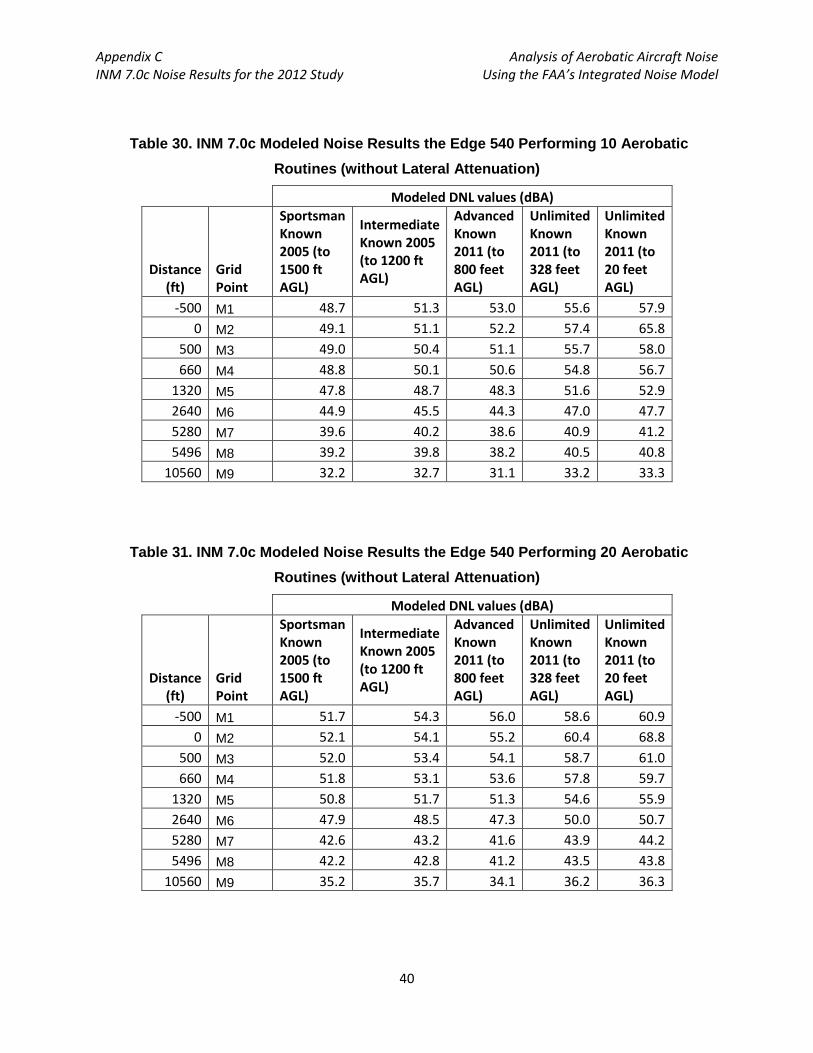
Table 30. INM 7.0c Modeled Noise Results the Edge 540 Performing 10 Aerobatic
Routines (without Lateral Attenuation)
Modeled DNL values (dBA)
Distance (ft)
Grid Point
Sportsman Known 2005 (to 1500 ft AGL)
Intermediate Known 2005 (to 1200 ft AGL)
Advanced Known 2011 (to 800 feet AGL)
Unlimited Known 2011 (to 328 feet AGL)
Unlimited Known 2011 (to 20 feet AGL)
-500 M1 48.7 51.3 53.0 55.6 57.9 0 M2 49.1 51.1 52.2 57.4 65.8
500 M3 49.0 50.4 51.1 55.7 58.0 660 M4 48.8 50.1 50.6 54.8 56.7
1320 M5 47.8 48.7 48.3 51.6 52.9 2640 M6 44.9 45.5 44.3 47.0 47.7 5280 M7 39.6 40.2 38.6 40.9 41.2 5496 M8 39.2 39.8 38.2 40.5 40.8
10560 M9 32.2 32.7 31.1 33.2 33.3
Table 31. INM 7.0c Modeled Noise Results the Edge 540 Performing 20 Aerobatic
Routines (without Lateral Attenuation)
Modeled DNL values (dBA)
Distance (ft)
Grid Point
Sportsman Known 2005 (to 1500 ft AGL)
Intermediate Known 2005 (to 1200 ft AGL)
Advanced Known 2011 (to 800 feet AGL)
Unlimited Known 2011 (to 328 feet AGL)
Unlimited Known 2011 (to 20 feet AGL)
-500 M1 51.7 54.3 56.0 58.6 60.9 0 M2 52.1 54.1 55.2 60.4 68.8
500 M3 52.0 53.4 54.1 58.7 61.0 660 M4 51.8 53.1 53.6 57.8 59.7
1320 M5 50.8 51.7 51.3 54.6 55.9 2640 M6 47.9 48.5 47.3 50.0 50.7 5280 M7 42.6 43.2 41.6 43.9 44.2 5496 M8 42.2 42.8 41.2 43.5 43.8
10560 M9 35.2 35.7 34.1 36.2 36.3
Appendix C Analysis of Aerobatic Aircraft Noise INM 7.0c Noise Results for the 2012 Study Using the FAA’s Integrated Noise Model
41
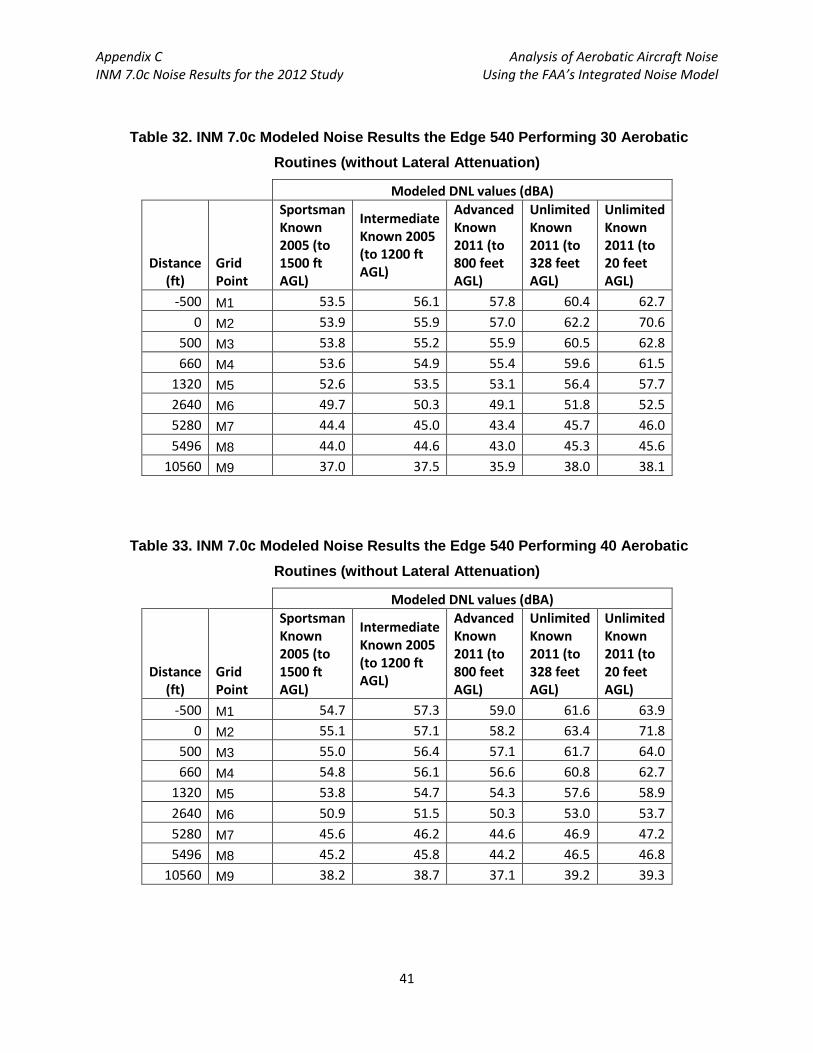
Table 32. INM 7.0c Modeled Noise Results the Edge 540 Performing 30 Aerobatic
Routines (without Lateral Attenuation)
Modeled DNL values (dBA)
Distance (ft)
Grid Point
Sportsman Known 2005 (to 1500 ft AGL)
Intermediate Known 2005 (to 1200 ft AGL)
Advanced Known 2011 (to 800 feet AGL)
Unlimited Known 2011 (to 328 feet AGL)
Unlimited Known 2011 (to 20 feet AGL)
-500 M1 53.5 56.1 57.8 60.4 62.7 0 M2 53.9 55.9 57.0 62.2 70.6
500 M3 53.8 55.2 55.9 60.5 62.8 660 M4 53.6 54.9 55.4 59.6 61.5
1320 M5 52.6 53.5 53.1 56.4 57.7 2640 M6 49.7 50.3 49.1 51.8 52.5 5280 M7 44.4 45.0 43.4 45.7 46.0 5496 M8 44.0 44.6 43.0 45.3 45.6
10560 M9 37.0 37.5 35.9 38.0 38.1
Table 33. INM 7.0c Modeled Noise Results the Edge 540 Performing 40 Aerobatic
Routines (without Lateral Attenuation)
Modeled DNL values (dBA)
Distance (ft)
Grid Point
Sportsman Known 2005 (to 1500 ft AGL)
Intermediate Known 2005 (to 1200 ft AGL)
Advanced Known 2011 (to 800 feet AGL)
Unlimited Known 2011 (to 328 feet AGL)
Unlimited Known 2011 (to 20 feet AGL)
-500 M1 54.7 57.3 59.0 61.6 63.9 0 M2 55.1 57.1 58.2 63.4 71.8
500 M3 55.0 56.4 57.1 61.7 64.0 660 M4 54.8 56.1 56.6 60.8 62.7
1320 M5 53.8 54.7 54.3 57.6 58.9 2640 M6 50.9 51.5 50.3 53.0 53.7 5280 M7 45.6 46.2 44.6 46.9 47.2 5496 M8 45.2 45.8 44.2 46.5 46.8
10560 M9 38.2 38.7 37.1 39.2 39.3

Appendix C Analysis of Aerobatic Aircraft Noise INM 7.0c Noise Results for the 2012 Study Using the FAA’s Integrated Noise Model
42
Table 34. INM 7.0c Modeled Noise Results the Edge 540 Performing 50 Aerobatic
Routines (without Lateral Attenuation)
Modeled DNL values (dBA)
Distance (ft)
Grid Point
Sportsman Known 2005 (to 1500 ft AGL)
Intermediate Known 2005 (to 1200 ft AGL)
Advanced Known 2011 (to 800 feet AGL)
Unlimited Known 2011 (to 328 feet AGL)
Unlimited Known 2011 (to 20 feet AGL)
-500 M1 55.7 58.3 60.0 62.6 64.9 0 M2 56.1 58.1 59.2 64.4 72.8
500 M3 56.0 57.4 58.1 62.7 65.0 660 M4 55.8 57.1 57.5 61.8 63.7
1320 M5 54.8 55.7 55.3 58.6 59.9 2640 M6 51.8 52.5 51.3 54.0 54.7 5280 M7 46.6 47.2 45.6 47.9 48.2 5496 M8 46.2 46.8 45.2 47.5 47.8
10560 M9 39.2 39.7 38.1 40.2 40.3
Table 35. INM 7.0c Modeled Noise Results the Sukhoi SU-29 Performing 1 Aerobatic
Routine (without Lateral Attenuation)
Modeled DNL values (dBA)
Distance (ft)
Grid Point
Sportsman Known 2005 (to 1500 ft AGL)
Intermediate Known 2005 (to 1200 ft AGL)
Advanced Known 2011 (to 800 feet AGL)
Unlimited Known 2011 (to 328 feet AGL)
Unlimited Known 2011 (to 20 feet AGL)
-500 M1 35.9 38.6 40.9 44.0 46.4 0 M2 36.3 38.4 40.2 45.6 53.0
500 M3 36.2 37.7 39.2 44.0 46.4 660 M4 36.1 37.3 38.7 43.0 45.1
1320 M5 34.9 35.7 36.3 39.5 40.8 2640 M6 31.5 32.1 32.2 34.4 35.2 5280 M7 25.7 26.3 26.2 27.8 28.1 5496 M8 25.3 25.9 25.8 27.3 27.7
10560 M9 17.7 18.1 18.2 19.3 19.5

Appendix C Analysis of Aerobatic Aircraft Noise INM 7.0c Noise Results for the 2012 Study Using the FAA’s Integrated Noise Model
43
Table 36. INM 7.0c Modeled Noise Results the Sukhoi SU-29 Performing 5 Aerobatic
Routines (without Lateral Attenuation)
Modeled DNL values (dBA)
Distance (ft)
Grid Point
Sportsman Known 2005 (to 1500 ft AGL)
Intermediate Known 2005 (to 1200 ft AGL)
Advanced Known 2011 (to 800 feet AGL)
Unlimited Known 2011 (to 328 feet AGL)
Unlimited Known 2011 (to 20 feet AGL)
-500 M1 42.9 45.6 47.9 51.0 53.4 0 M2 43.3 45.4 47.2 52.6 60.0
500 M3 43.2 44.7 46.2 51.0 53.4 660 M4 43.1 44.3 45.7 50.0 52.1
1320 M5 41.9 42.7 43.3 46.5 47.8 2640 M6 38.5 39.1 39.2 41.4 42.2 5280 M7 32.7 33.3 33.2 34.8 35.1 5496 M8 32.3 32.9 32.8 34.3 34.7
10560 M9 24.7 25.1 25.2 26.3 26.5
Table 37. INM 7.0c Modeled Noise Results the Sukhoi SU-29 Performing 10 Aerobatic
Routines (without Lateral Attenuation)
Modeled DNL values (dBA)
Distance (ft)
Grid Point
Sportsman Known 2005 (to 1500 ft AGL)
Intermediate Known 2005 (to 1200 ft AGL)
Advanced Known 2011 (to 800 feet AGL)
Unlimited Known 2011 (to 328 feet AGL)
Unlimited Known 2011 (to 20 feet AGL)
-500 M1 45.9 48.6 50.9 54.0 56.4 0 M2 46.3 48.4 50.2 55.6 63.0
500 M3 46.2 47.7 49.2 54.0 56.4 660 M4 46.1 47.3 48.7 53.0 55.1
1320 M5 44.9 45.7 46.3 49.5 50.8 2640 M6 41.5 42.1 42.2 44.4 45.2 5280 M7 35.7 36.3 36.2 37.8 38.1 5496 M8 35.3 35.9 35.8 37.3 37.7
10560 M9 27.7 28.1 28.2 29.3 29.5

Appendix C Analysis of Aerobatic Aircraft Noise INM 7.0c Noise Results for the 2012 Study Using the FAA’s Integrated Noise Model
44
Table 38. INM 7.0c Modeled Noise Results the Sukhoi SU-29 Performing 20 Aerobatic
Routines (without Lateral Attenuation)
Modeled DNL values (dBA)
Distance (ft)
Grid Point
Sportsman Known 2005 (to 1500 ft AGL)
Intermediate Known 2005 (to 1200 ft AGL)
Advanced Known 2011 (to 800 feet AGL)
Unlimited Known 2011 (to 328 feet AGL)
Unlimited Known 2011 (to 20 feet AGL)
-500 M1 48.9 51.6 53.9 57.0 59.4 0 M2 49.3 51.4 53.2 58.6 66.0
500 M3 49.2 50.7 52.2 57.0 59.4 660 M4 49.1 50.3 51.7 56.0 58.1
1320 M5 47.9 48.7 49.3 52.5 53.8 2640 M6 44.5 45.1 45.2 47.4 48.2 5280 M7 38.7 39.3 39.2 40.8 41.1 5496 M8 38.3 38.9 38.8 40.3 40.7
10560 M9 30.7 31.1 31.2 32.3 32.5
Table 39. INM 7.0c Modeled Noise Results the Sukhoi SU-29 Performing 30 Aerobatic
Routines (without Lateral Attenuation)
Modeled DNL values (dBA)
Distance (ft)
Grid Point
Sportsman Known 2005 (to 1500 ft AGL)
Intermediate Known 2005 (to 1200 ft AGL)
Advanced Known 2011 (to 800 feet AGL)
Unlimited Known 2011 (to 328 feet AGL)
Unlimited Known 2011 (to 20 feet AGL)
-500 M1 50.7 53.4 55.7 58.8 61.2 0 M2 51.1 53.2 55.0 60.4 67.8
500 M3 51.0 52.5 54.0 58.8 61.2 660 M4 50.9 52.1 53.5 57.8 59.9
1320 M5 49.7 50.5 51.1 54.3 55.6 2640 M6 46.3 46.9 47.0 49.2 50.0 5280 M7 40.5 41.1 41.0 42.6 42.9 5496 M8 40.1 40.7 40.6 42.1 42.5
10560 M9 32.5 32.9 33.0 34.1 34.3

Appendix C Analysis of Aerobatic Aircraft Noise INM 7.0c Noise Results for the 2012 Study Using the FAA’s Integrated Noise Model
45
Table 40. INM 7.0c Modeled Noise Results the Sukhoi SU-29 Performing 40 Aerobatic
Routines (without Lateral Attenuation)
Modeled DNL values (dBA)
Distance (ft)
Grid Point
Sportsman Known 2005 (to 1500 ft AGL)
Intermediate Known 2005 (to 1200 ft AGL)
Advanced Known 2011 (to 800 feet AGL)
Unlimited Known 2011 (to 328 feet AGL)
Unlimited Known 2011 (to 20 feet AGL)
-500 M1 51.9 54.6 56.9 60.0 62.4 0 M2 52.3 54.4 56.2 61.6 69.0
500 M3 52.2 53.7 55.2 60.0 62.4 660 M4 52.1 53.3 54.7 59.0 61.1
1320 M5 50.9 51.7 52.3 55.5 56.8 2640 M6 47.5 48.1 48.2 50.4 51.2 5280 M7 41.7 42.3 42.2 43.8 44.1 5496 M8 41.3 41.9 41.8 43.3 43.7
10560 M9 33.7 34.1 34.2 35.3 35.5
Table 41. INM 7.0c Modeled Noise Results the Sukhoi SU-29 Performing 50 Aerobatic
Routines (without Lateral Attenuation)
Modeled DNL values (dBA)
Distance (ft)
Grid Point
Sportsman Known 2005 (to 1500 ft AGL)
Intermediate Known 2005 (to 1200 ft AGL)
Advanced Known 2011 (to 800 feet AGL)
Unlimited Known 2011 (to 328 feet AGL)
Unlimited Known 2011 (to 20 feet AGL)
-500 M1 52.9 55.5 57.9 61.0 63.4 0 M2 53.3 55.4 57.2 62.6 70.0
500 M3 53.2 54.7 56.2 61.0 63.4 660 M4 53.1 54.3 55.7 60.0 62.1
1320 M5 51.9 52.7 53.3 56.5 57.8 2640 M6 48.5 49.1 49.2 51.4 52.2 5280 M7 42.6 43.2 43.2 44.8 45.1 5496 M8 42.2 42.8 42.8 44.3 44.7
10560 M9 34.7 35.1 35.2 36.3 36.5
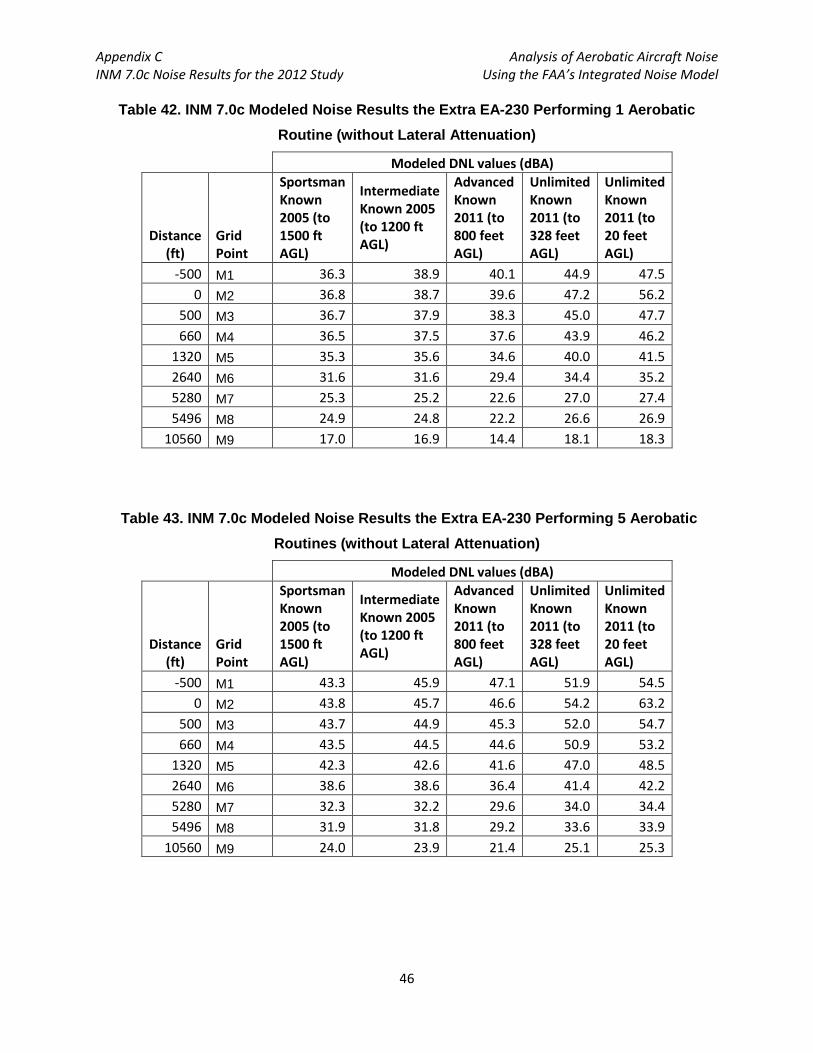
Appendix C Analysis of Aerobatic Aircraft Noise INM 7.0c Noise Results for the 2012 Study Using the FAA’s Integrated Noise Model
46
Table 42. INM 7.0c Modeled Noise Results the Extra EA-230 Performing 1 Aerobatic
Routine (without Lateral Attenuation)
Modeled DNL values (dBA)
Distance (ft)
Grid Point
Sportsman Known 2005 (to 1500 ft AGL)
Intermediate Known 2005 (to 1200 ft AGL)
Advanced Known 2011 (to 800 feet AGL)
Unlimited Known 2011 (to 328 feet AGL)
Unlimited Known 2011 (to 20 feet AGL)
-500 M1 36.3 38.9 40.1 44.9 47.5 0 M2 36.8 38.7 39.6 47.2 56.2
500 M3 36.7 37.9 38.3 45.0 47.7 660 M4 36.5 37.5 37.6 43.9 46.2
1320 M5 35.3 35.6 34.6 40.0 41.5 2640 M6 31.6 31.6 29.4 34.4 35.2 5280 M7 25.3 25.2 22.6 27.0 27.4 5496 M8 24.9 24.8 22.2 26.6 26.9
10560 M9 17.0 16.9 14.4 18.1 18.3
Table 43. INM 7.0c Modeled Noise Results the Extra EA-230 Performing 5 Aerobatic
Routines (without Lateral Attenuation)
Modeled DNL values (dBA)
Distance (ft)
Grid Point
Sportsman Known 2005 (to 1500 ft AGL)
Intermediate Known 2005 (to 1200 ft AGL)
Advanced Known 2011 (to 800 feet AGL)
Unlimited Known 2011 (to 328 feet AGL)
Unlimited Known 2011 (to 20 feet AGL)
-500 M1 43.3 45.9 47.1 51.9 54.5 0 M2 43.8 45.7 46.6 54.2 63.2
500 M3 43.7 44.9 45.3 52.0 54.7 660 M4 43.5 44.5 44.6 50.9 53.2
1320 M5 42.3 42.6 41.6 47.0 48.5 2640 M6 38.6 38.6 36.4 41.4 42.2 5280 M7 32.3 32.2 29.6 34.0 34.4 5496 M8 31.9 31.8 29.2 33.6 33.9
10560 M9 24.0 23.9 21.4 25.1 25.3

Appendix C Analysis of Aerobatic Aircraft Noise INM 7.0c Noise Results for the 2012 Study Using the FAA’s Integrated Noise Model
47
Table 44. INM 7.0c Modeled Noise Results the Extra EA-230 Performing 10 Aerobatic
Routines (without Lateral Attenuation)
Modeled DNL values (dBA)
Distance (ft)
Grid Point
Sportsman Known 2005 (to 1500 ft AGL)
Intermediate Known 2005 (to 1200 ft AGL)
Advanced Known 2011 (to 800 feet AGL)
Unlimited Known 2011 (to 328 feet AGL)
Unlimited Known 2011 (to 20 feet AGL)
-500 M1 46.3 48.9 50.1 54.9 57.5 0 M2 46.8 48.7 49.6 57.2 66.2
500 M3 46.7 47.9 48.3 55.0 57.7 660 M4 46.5 47.5 47.6 53.9 56.2
1320 M5 45.3 45.6 44.6 50.0 51.5 2640 M6 41.6 41.6 39.4 44.4 45.2 5280 M7 35.3 35.2 32.6 37.0 37.4 5496 M8 34.9 34.8 32.2 36.6 36.9
10560 M9 27.0 26.9 24.4 28.1 28.3
Table 45. INM 7.0c Modeled Noise Results the Extra EA-230 Performing 20 Aerobatic
Routines (without Lateral Attenuation)
Modeled DNL values (dBA)
Distance (ft)
Grid Point
Sportsman Known 2005 (to 1500 ft AGL)
Intermediate Known 2005 (to 1200 ft AGL)
Advanced Known 2011 (to 800 feet AGL)
Unlimited Known 2011 (to 328 feet AGL)
Unlimited Known 2011 (to 20 feet AGL)
-500 M1 49.3 51.9 53.1 57.9 60.5 0 M2 49.8 51.7 52.6 60.2 69.2
500 M3 49.7 50.9 51.3 58.0 60.7 660 M4 49.5 50.5 50.6 56.9 59.2
1320 M5 48.3 48.6 47.6 53.0 54.5 2640 M6 44.6 44.6 42.4 47.4 48.2 5280 M7 38.3 38.2 35.6 40.0 40.4 5496 M8 37.9 37.8 35.2 39.6 39.9
10560 M9 30.0 29.9 27.4 31.1 31.3

Appendix C Analysis of Aerobatic Aircraft Noise INM 7.0c Noise Results for the 2012 Study Using the FAA’s Integrated Noise Model
48
Table 46. INM 7.0c Modeled Noise Results the Extra EA-230 Performing 30 Aerobatic
Routines (without Lateral Attenuation)
Modeled DNL values (dBA)
Distance (ft)
Grid Point
Sportsman Known 2005 (to 1500 ft AGL)
Intermediate Known 2005 (to 1200 ft AGL)
Advanced Known 2011 (to 800 feet AGL)
Unlimited Known 2011 (to 328 feet AGL)
Unlimited Known 2011 (to 20 feet AGL)
-500 M1 51.1 53.7 54.9 59.7 62.3 0 M2 51.6 53.5 54.4 62.0 71.0
500 M3 51.5 52.7 53.1 59.8 62.5 660 M4 51.3 52.3 52.4 58.7 61.0
1320 M5 50.1 50.4 49.4 54.8 56.3 2640 M6 46.4 46.4 44.2 49.2 50.0 5280 M7 40.1 40.0 37.4 41.8 42.2 5496 M8 39.7 39.6 37.0 41.4 41.7
10560 M9 31.8 31.7 29.2 32.9 33.1
Table 47. INM 7.0c Modeled Noise Results the Extra EA-230 Performing 40 Aerobatic
Routines (without Lateral Attenuation)
Modeled DNL values (dBA)
Distance (ft)
Grid Point
Sportsman Known 2005 (to 1500 ft AGL)
Intermediate Known 2005 (to 1200 ft AGL)
Advanced Known 2011 (to 800 feet AGL)
Unlimited Known 2011 (to 328 feet AGL)
Unlimited Known 2011 (to 20 feet AGL)
-500 M1 52.3 54.9 56.1 60.9 63.5 0 M2 52.8 54.7 55.6 63.2 72.2
500 M3 52.7 53.9 54.3 61.0 63.7 660 M4 52.5 53.5 53.6 59.9 62.2
1320 M5 51.3 51.6 50.6 56.0 57.5 2640 M6 47.6 47.6 45.4 50.4 51.2 5280 M7 41.3 41.2 38.6 43.0 43.4 5496 M8 40.9 40.8 38.2 42.6 42.9
10560 M9 33.0 32.9 30.4 34.1 34.3

Appendix C Analysis of Aerobatic Aircraft Noise INM 7.0c Noise Results for the 2012 Study Using the FAA’s Integrated Noise Model
49
Table 48. INM 7.0c Modeled Noise Results the Extra EA-230 Performing 50 Aerobatic
Routines (without Lateral Attenuation)
Modeled DNL values (dBA)
Distance (ft)
Grid Point
Sportsman Known 2005 (to 1500 ft AGL)
Intermediate Known 2005 (to 1200 ft AGL)
Advanced Known 2011 (to 800 feet AGL)
Unlimited Known 2011 (to 328 feet AGL)
Unlimited Known 2011 (to 20 feet AGL)
-500 M1 53.3 55.9 57.1 61.9 64.5 0 M2 53.8 55.7 56.6 64.2 73.2
500 M3 53.7 54.9 55.3 62.0 64.7 660 M4 53.5 54.5 54.6 60.9 63.2
1320 M5 52.3 52.6 51.6 57.0 58.5 2640 M6 48.6 48.6 46.4 51.4 52.2 5280 M7 42.3 42.2 39.6 44.0 44.4 5496 M8 41.9 41.8 39.2 43.5 43.9
10560 M9 34.0 33.9 31.4 35.1 35.3
Table 49. INM 7.0c Modeled Noise Results the Pitts S-2C Performing 1 Aerobatic Routine
(without Lateral Attenuation)
Modeled DNL values (dBA)
Distance (ft)
Grid Point
Sportsman Known 2005 (to 1500 ft AGL)
Intermediate Known 2005 (to 1200 ft AGL)
Advanced Known 2011 (to 800 feet AGL)
Unlimited Known 2011 (to 328 feet AGL)
Unlimited Known 2011 (to 20 feet AGL)
-500 M1 35.6 38.2 39.6 43.6 46.1 0 M2 36.1 37.8 38.8 46.3 55.9
500 M3 36.0 37.0 37.4 43.9 46.4 660 M4 35.8 36.7 36.8 42.9 45.1
1320 M5 34.7 35.2 34.2 39.5 41.3 2640 M6 31.5 31.9 29.9 34.8 35.9 5280 M7 25.9 26.4 23.8 28.2 28.8 5496 M8 25.5 26.0 23.4 27.7 28.3
10560 M9 17.7 18.1 15.6 19.3 19.6
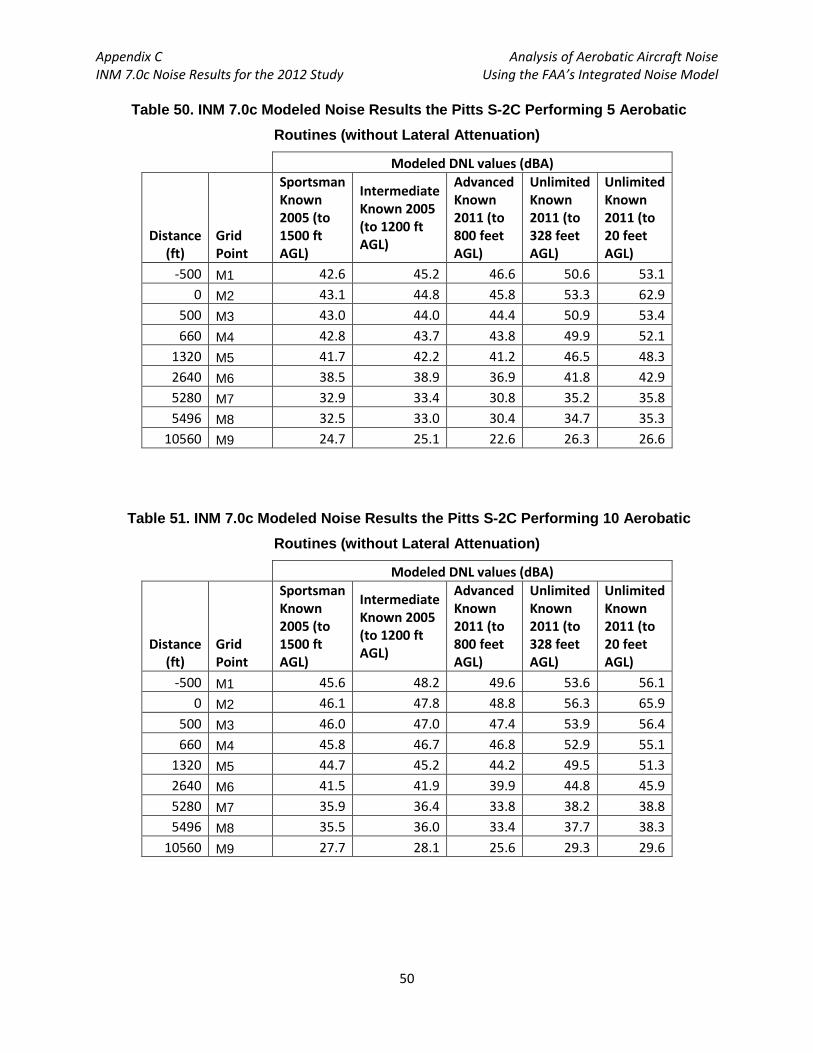
Appendix C Analysis of Aerobatic Aircraft Noise INM 7.0c Noise Results for the 2012 Study Using the FAA’s Integrated Noise Model
50
Table 50. INM 7.0c Modeled Noise Results the Pitts S-2C Performing 5 Aerobatic
Routines (without Lateral Attenuation)
Modeled DNL values (dBA)
Distance (ft)
Grid Point
Sportsman Known 2005 (to 1500 ft AGL)
Intermediate Known 2005 (to 1200 ft AGL)
Advanced Known 2011 (to 800 feet AGL)
Unlimited Known 2011 (to 328 feet AGL)
Unlimited Known 2011 (to 20 feet AGL)
-500 M1 42.6 45.2 46.6 50.6 53.1 0 M2 43.1 44.8 45.8 53.3 62.9
500 M3 43.0 44.0 44.4 50.9 53.4 660 M4 42.8 43.7 43.8 49.9 52.1
1320 M5 41.7 42.2 41.2 46.5 48.3 2640 M6 38.5 38.9 36.9 41.8 42.9 5280 M7 32.9 33.4 30.8 35.2 35.8 5496 M8 32.5 33.0 30.4 34.7 35.3
10560 M9 24.7 25.1 22.6 26.3 26.6
Table 51. INM 7.0c Modeled Noise Results the Pitts S-2C Performing 10 Aerobatic
Routines (without Lateral Attenuation)
Modeled DNL values (dBA)
Distance (ft)
Grid Point
Sportsman Known 2005 (to 1500 ft AGL)
Intermediate Known 2005 (to 1200 ft AGL)
Advanced Known 2011 (to 800 feet AGL)
Unlimited Known 2011 (to 328 feet AGL)
Unlimited Known 2011 (to 20 feet AGL)
-500 M1 45.6 48.2 49.6 53.6 56.1 0 M2 46.1 47.8 48.8 56.3 65.9
500 M3 46.0 47.0 47.4 53.9 56.4 660 M4 45.8 46.7 46.8 52.9 55.1
1320 M5 44.7 45.2 44.2 49.5 51.3 2640 M6 41.5 41.9 39.9 44.8 45.9 5280 M7 35.9 36.4 33.8 38.2 38.8 5496 M8 35.5 36.0 33.4 37.7 38.3
10560 M9 27.7 28.1 25.6 29.3 29.6

Appendix C Analysis of Aerobatic Aircraft Noise INM 7.0c Noise Results for the 2012 Study Using the FAA’s Integrated Noise Model
51
Table 52. INM 7.0c Modeled Noise Results the Pitts S-2C Performing 20 Aerobatic
Routines (without Lateral Attenuation)
e
Modeled DNL values (dBA)
Distance (ft)
Grid Point
Sportsman Known 2005 (to 1500 ft AGL)
Intermediate Known 2005 (to 1200 ft AGL)
Advanced Known 2011 (to 800 feet AGL)
Unlimited Known 2011 (to 328 feet AGL)
Unlimited Known 2011 (to 20 feet AGL)
-500 M1 48.6 51.2 52.6 56.6 59.1 0 M2 49.1 50.8 51.8 59.3 68.9
500 M3 49.0 50.0 50.4 56.9 59.4 660 M4 48.8 49.7 49.8 55.9 58.1
1320 M5 47.7 48.2 47.2 52.5 54.3 2640 M6 44.5 44.9 42.9 47.8 48.9 5280 M7 38.9 39.4 36.8 41.2 41.8 5496 M8 38.5 39.0 36.4 40.7 41.3
10560 M9 30.7 31.1 28.6 32.3 32.6
Table 53. INM 7.0c Modeled Noise Results the Pitts S-2C Performing 30 Aerobatic
Routines (without Lateral Attenuation)
Modeled DNL values (dBA)
Distance (ft)
Grid Point
Sportsman Known 2005 (to 1500 ft AGL)
Intermediate Known 2005 (to 1200 ft AGL)
Advanced Known 2011 (to 800 feet AGL)
Unlimited Known 2011 (to 328 feet AGL)
Unlimited Known 2011 (to 20 feet AGL)
-500 M1 50.4 53.0 54.4 58.4 60.9 0 M2 50.9 52.6 53.6 61.1 70.7
500 M3 50.8 51.8 52.2 58.7 61.2 660 M4 50.6 51.5 51.6 57.7 59.9
1320 M5 49.5 50.0 49.0 54.3 56.1 2640 M6 46.3 46.7 44.7 49.6 50.7 5280 M7 40.7 41.2 38.6 43.0 43.6 5496 M8 40.3 40.8 38.2 42.5 43.1
10560 M9 32.5 32.9 30.4 34.1 34.4

Appendix C Analysis of Aerobatic Aircraft Noise INM 7.0c Noise Results for the 2012 Study Using the FAA’s Integrated Noise Model
52
Table 54. INM 7.0c Modeled Noise Results the Pitts S-2C Performing 40 Aerobatic
Routines (without Lateral Attenuation)
Modeled DNL values (dBA)
Distance (ft)
Grid Point
Sportsman Known 2005 (to 1500 ft AGL)
Intermediate Known 2005 (to 1200 ft AGL)
Advanced Known 2011 (to 800 feet AGL)
Unlimited Known 2011 (to 328 feet AGL)
Unlimited Known 2011 (to 20 feet AGL)
-500 M1 51.6 54.2 55.6 59.6 62.1 0 M2 52.1 53.8 54.8 62.3 71.9
500 M3 52.0 53.0 53.4 59.9 62.4 660 M4 51.8 52.7 52.8 58.9 61.1
1320 M5 50.7 51.2 50.2 55.5 57.3 2640 M6 47.5 47.9 45.9 50.8 51.9 5280 M7 41.9 42.4 39.8 44.2 44.8 5496 M8 41.5 42.0 39.4 43.7 44.3
10560 M9 33.7 34.1 31.6 35.3 35.6
Table 55. INM 7.0c Modeled Noise Results the Pitts S-2C Performing 50 Aerobatic
Routines (without Lateral Attenuation)
Modeled DNL values (dBA)
Distance (ft)
Grid Point
Sportsman Known 2005 (to 1500 ft AGL)
Intermediate Known 2005 (to 1200 ft AGL)
Advanced Known 2011 (to 800 feet AGL)
Unlimited Known 2011 (to 328 feet AGL)
Unlimited Known 2011 (to 20 feet AGL)
-500 M1 52.6 55.2 56.6 60.6 63.1 0 M2 53.0 57.8 55.8 63.3 72.9
500 M3 53.0 54.0 54.4 60.8 63.4 660 M4 52.8 53.7 53.8 59.8 62.1
1320 M5 51.7 52.2 51.2 56.5 58.3 2640 M6 48.5 48.9 46.9 51.8 52.9 5280 M7 42.9 43.3 40.8 45.1 45.8 5496 M8 42.5 43.0 40.4 44.7 45.3
10560 M9 34.7 35.1 32.6 36.3 36.6
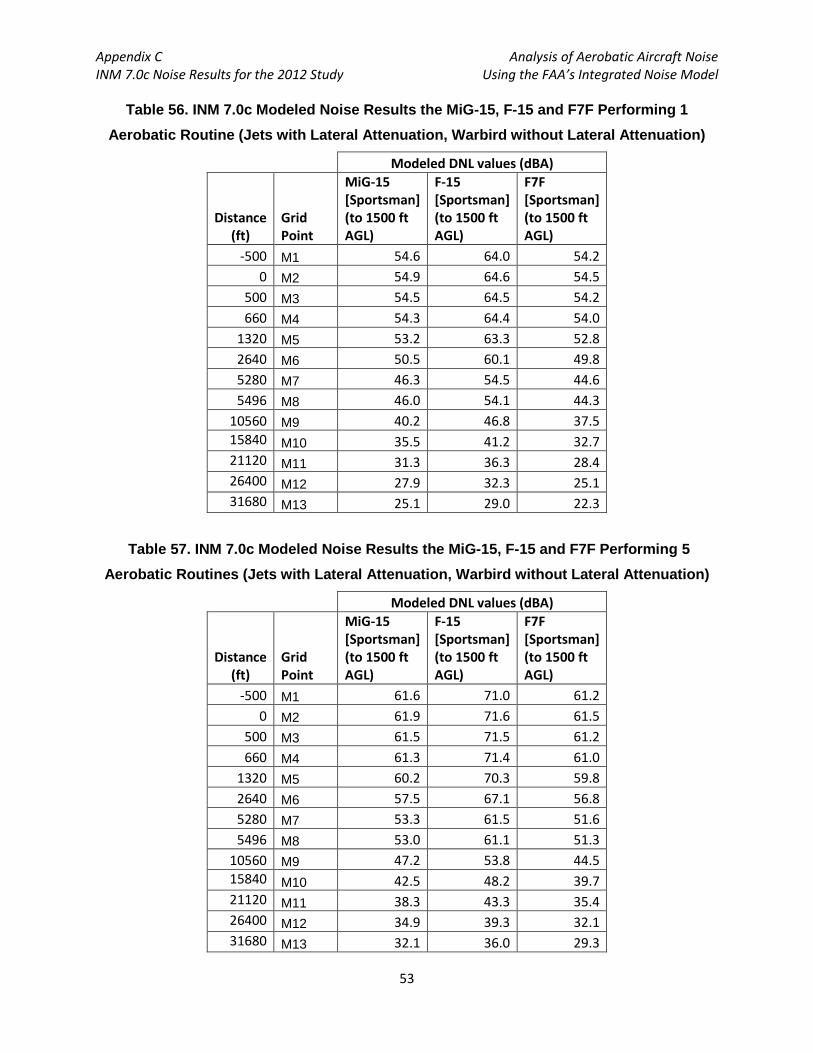
Appendix C Analysis of Aerobatic Aircraft Noise INM 7.0c Noise Results for the 2012 Study Using the FAA’s Integrated Noise Model
53
Table 56. INM 7.0c Modeled Noise Results the MiG-15, F-15 and F7F Performing 1
Aerobatic Routine (Jets with Lateral Attenuation, Warbird without Lateral Attenuation)
Modeled DNL values (dBA)
Distance (ft)
Grid Point
MiG-15 [Sportsman] (to 1500 ft AGL)
F-15 [Sportsman] (to 1500 ft AGL)
F7F [Sportsman] (to 1500 ft AGL)
-500 M1 54.6 64.0 54.2 0 M2 54.9 64.6 54.5
500 M3 54.5 64.5 54.2 660 M4 54.3 64.4 54.0
1320 M5 53.2 63.3 52.8 2640 M6 50.5 60.1 49.8 5280 M7 46.3 54.5 44.6 5496 M8 46.0 54.1 44.3
10560 M9 40.2 46.8 37.5 15840 M10 35.5 41.2 32.7 21120 M11 31.3 36.3 28.4 26400 M12 27.9 32.3 25.1 31680 M13 25.1 29.0 22.3
Table 57. INM 7.0c Modeled Noise Results the MiG-15, F-15 and F7F Performing 5
Aerobatic Routines (Jets with Lateral Attenuation, Warbird without Lateral Attenuation)
Modeled DNL values (dBA)
Distance (ft)
Grid Point
MiG-15 [Sportsman] (to 1500 ft AGL)
F-15 [Sportsman] (to 1500 ft AGL)
F7F [Sportsman] (to 1500 ft AGL)
-500 M1 61.6 71.0 61.2 0 M2 61.9 71.6 61.5
500 M3 61.5 71.5 61.2 660 M4 61.3 71.4 61.0
1320 M5 60.2 70.3 59.8 2640 M6 57.5 67.1 56.8 5280 M7 53.3 61.5 51.6 5496 M8 53.0 61.1 51.3
10560 M9 47.2 53.8 44.5 15840 M10 42.5 48.2 39.7 21120 M11 38.3 43.3 35.4 26400 M12 34.9 39.3 32.1 31680 M13 32.1 36.0 29.3

Appendix C Analysis of Aerobatic Aircraft Noise INM 7.0c Noise Results for the 2012 Study Using the FAA’s Integrated Noise Model
54
Table 58. INM 7.0c Modeled Noise Results the MiG-15, F-15 and F7F Performing 10
Aerobatic Routines (Jets with Lateral Attenuation, Warbird without Lateral Attenuation)
Modeled DNL values (dBA)
Distance (ft)
Grid Point
MiG-15 [Sportsman] (to 1500 ft AGL)
F-15 [Sportsman] (to 1500 ft AGL)
F7F [Sportsman] (to 1500 ft AGL)
-500 M1 64.6 74.0 64.2 0 M2 64.9 74.6 64.5
500 M3 64.5 74.5 64.2 660 M4 64.3 74.4 64.0
1320 M5 63.2 73.3 62.8 2640 M6 60.5 70.1 59.8 5280 M7 56.3 64.5 54.6 5496 M8 56.0 64.1 54.3
10560 M9 50.2 56.8 47.5 15840 M10 45.5 51.2 42.7 21120 M11 41.3 46.3 38.4 26400 M12 37.9 42.3 35.1 31680 M13 35.1 39.0 32.3
Table 59. INM 7.0c Modeled Noise Results the MiG-15, F-15 and F7F Performing 20
Aerobatic Routines (Jets with Lateral Attenuation, Warbird without Lateral Attenuation)
Modeled DNL values (dBA)
Distance (ft)
Grid Point
MiG-15 [Sportsman] (to 1500 ft AGL)
F-15 [Sportsman] (to 1500 ft AGL)
F7F [Sportsman] (to 1500 ft AGL)
-500 M1 67.6 77.0 67.2 0 M2 67.9 77.6 67.5
500 M3 67.5 77.5 67.2 660 M4 67.3 77.4 67.0
1320 M5 66.2 76.3 65.8 2640 M6 63.5 73.1 62.8 5280 M7 59.3 67.5 57.6 5496 M8 59.0 67.1 57.3
10560 M9 53.2 59.8 50.5 15840 M10 48.5 54.2 45.7 21120 M11 44.3 49.3 41.4 26400 M12 40.9 45.3 38.1 31680 M13 38.1 42.0 35.3
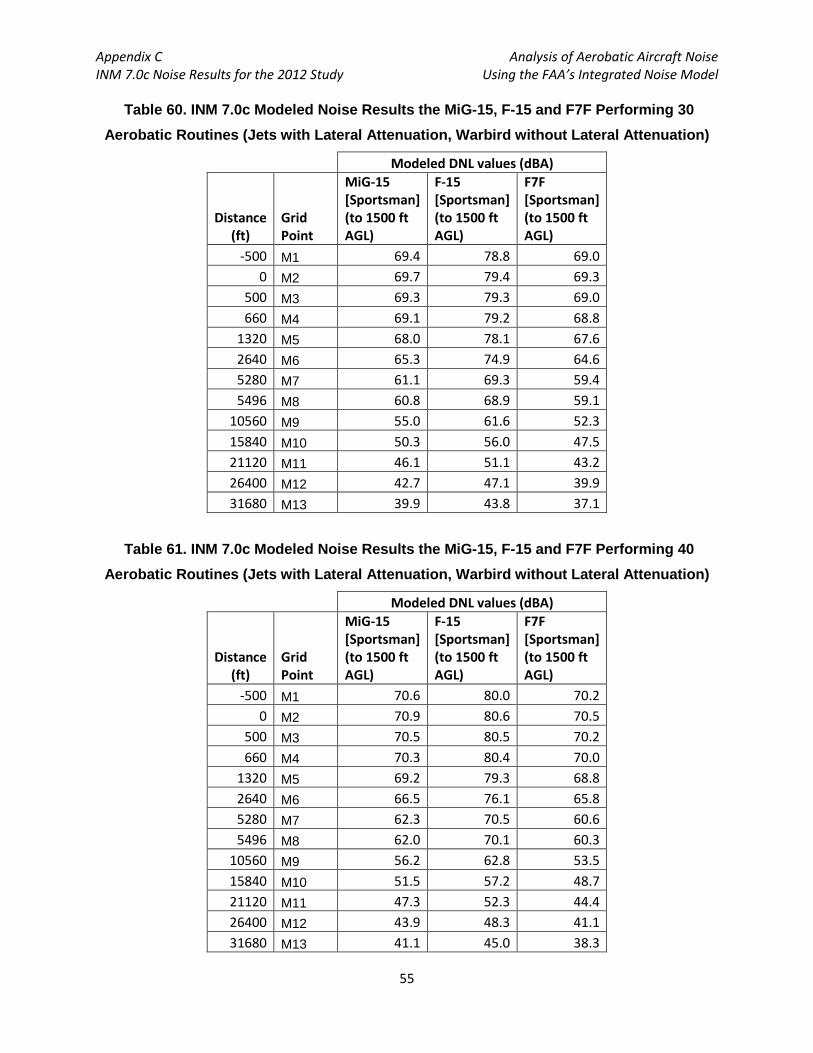
Appendix C Analysis of Aerobatic Aircraft Noise INM 7.0c Noise Results for the 2012 Study Using the FAA’s Integrated Noise Model
55
Table 60. INM 7.0c Modeled Noise Results the MiG-15, F-15 and F7F Performing 30
Aerobatic Routines (Jets with Lateral Attenuation, Warbird without Lateral Attenuation)
Modeled DNL values (dBA)
Distance (ft)
Grid Point
MiG-15 [Sportsman] (to 1500 ft AGL)
F-15 [Sportsman] (to 1500 ft AGL)
F7F [Sportsman] (to 1500 ft AGL)
-500 M1 69.4 78.8 69.0 0 M2 69.7 79.4 69.3
500 M3 69.3 79.3 69.0 660 M4 69.1 79.2 68.8
1320 M5 68.0 78.1 67.6 2640 M6 65.3 74.9 64.6 5280 M7 61.1 69.3 59.4 5496 M8 60.8 68.9 59.1
10560 M9 55.0 61.6 52.3 15840 M10 50.3 56.0 47.5 21120 M11 46.1 51.1 43.2 26400 M12 42.7 47.1 39.9 31680 M13 39.9 43.8 37.1
Table 61. INM 7.0c Modeled Noise Results the MiG-15, F-15 and F7F Performing 40
Aerobatic Routines (Jets with Lateral Attenuation, Warbird without Lateral Attenuation)
Modeled DNL values (dBA)
Distance (ft)
Grid Point
MiG-15 [Sportsman] (to 1500 ft AGL)
F-15 [Sportsman] (to 1500 ft AGL)
F7F [Sportsman] (to 1500 ft AGL)
-500 M1 70.6 80.0 70.2 0 M2 70.9 80.6 70.5
500 M3 70.5 80.5 70.2 660 M4 70.3 80.4 70.0
1320 M5 69.2 79.3 68.8 2640 M6 66.5 76.1 65.8 5280 M7 62.3 70.5 60.6 5496 M8 62.0 70.1 60.3
10560 M9 56.2 62.8 53.5 15840 M10 51.5 57.2 48.7 21120 M11 47.3 52.3 44.4 26400 M12 43.9 48.3 41.1 31680 M13 41.1 45.0 38.3

Appendix C Analysis of Aerobatic Aircraft Noise INM 7.0c Noise Results for the 2012 Study Using the FAA’s Integrated Noise Model
56
Table 62. INM 7.0c Modeled Noise Results the MiG-15, F-15 and F7F Performing 50
Aerobatic Routines (Jets with Lateral Attenuation, Warbird without Lateral Attenuation)
Modeled DNL values (dBA)
Distance (ft)
Grid Point
MiG-15 [Sportsman] (to 1500 ft AGL)
F-15 [Sportsman] (to 1500 ft AGL)
F7F [Sportsman] (to 1500 ft AGL)
-500 M1 71.6 81.0 71.2 0 M2 71.9 81.6 71.4
500 M3 71.5 81.5 71.2 660 M4 71.3 81.4 71.0
1320 M5 70.2 80.2 69.8 2640 M6 67.5 77.1 66.8 5280 M7 63.3 71.5 61.6 5496 M8 63.0 71.1 61.2
10560 M9 57.2 63.7 54.5 15840 M10 52.5 58.2 49.7 21120 M11 48.3 53.3 45.4 26400 M12 44.9 49.3 42.1 31680 M13 42.1 46.0 39.3
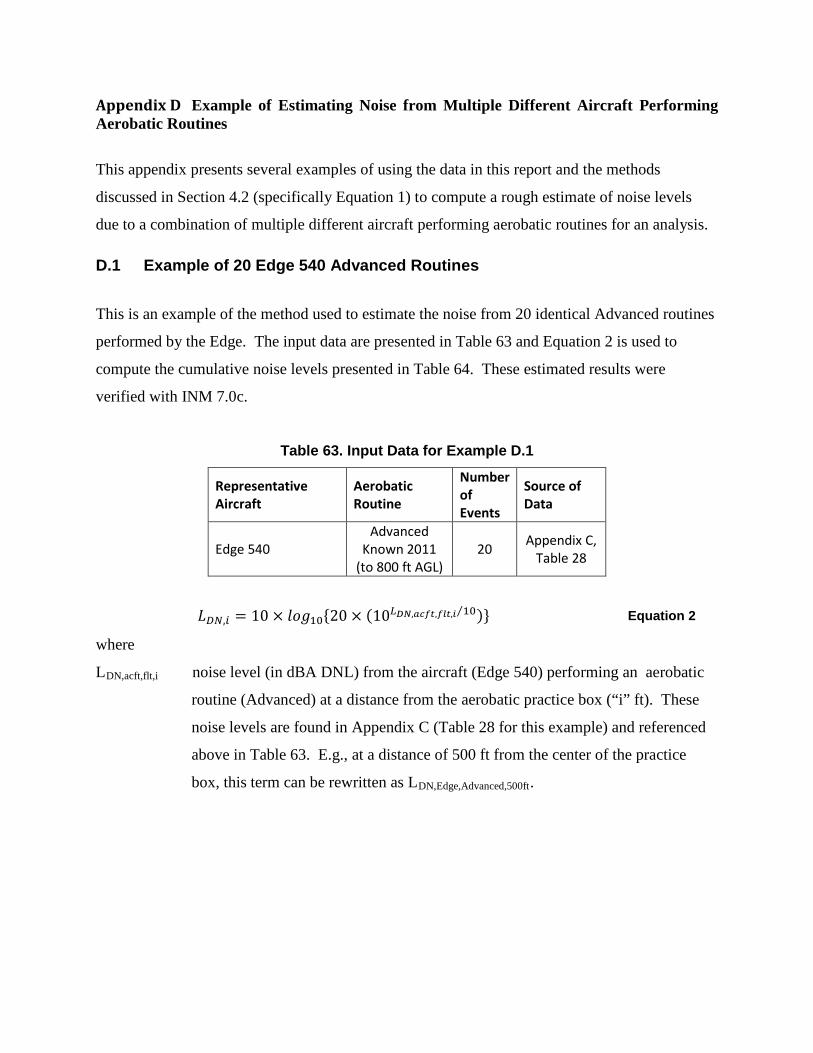
Appendix D Example of Estimating Noise from Multiple Different Aircraft Performing Aerobatic Routines
This appendix presents several examples of using the data in this report and the methods
discussed in Section 4.2 (specifically Equation 1) to compute a rough estimate of noise levels
due to a combination of multiple different aircraft performing aerobatic routines for an analysis.
D.1 Example of 20 Edge 540 Advanced Routines
This is an example of the method used to estimate the noise from 20 identical Advanced routines
performed by the Edge. The input data are presented in Table 63 and Equation 2 is used to
compute the cumulative noise levels presented in Table 64. These estimated results were
verified with INM 7.0c.
Table 63. Input Data for Example D.1
Representative Aircraft
Aerobatic Routine
Number of Events
Source of Data
Edge 540 Advanced
Known 2011 (to 800 ft AGL)
20 Appendix C, Table 28
𝐿𝐷𝑁,𝑖 = 10 × 𝑙𝑜𝑔10{20 × (10𝐿𝐷𝑁,𝑎𝑐𝑓𝑡,𝑓𝑙𝑡,𝑖 10⁄ )} Equation 2
where
LDN,acft,flt,i noise level (in dBA DNL) from the aircraft (Edge 540) performing an aerobatic
routine (Advanced) at a distance from the aerobatic practice box (“i” ft). These
noise levels are found in Appendix C (Table 28 for this example) and referenced
above in Table 63. E.g., at a distance of 500 ft from the center of the practice
box, this term can be rewritten as LDN,Edge,Advanced,500ft.

Appendix D Example of Estimating Noise from Analysis of Aerobatic Aircraft Noise Multiple Different Aircraft Performing Aerobatic Routines Using the FAA’s Integrated Noise Model
58
Table 64. Noise Results for Example D.1
Distance (ft) Grid Point Output Noise
Levels (dBA DNL)
-500 M1 56.0 0 M2 55.2
500 M3 54.1 660 M4 53.6
1320 M5 51.3 2640 M6 47.3 5280 M7 41.6 5496 M8 41.2
10560 M9 34.1
D.2 Example of 7 Different Sportsman Routines
This is an example of the method used to estimate the noise from seven different aircraft
performing the Sportsman Routine. The input data are presented in Table 65 and Equation 3 is
used to compute the cumulative noise levels presented in Table 66. These estimated results were
verified with INM 7.0c.
Table 65. Input Data for Example D.2
Representative Aircraft Aerobatic Routine Number of
Events Source of Data
Extra EA-230 Sportsman Known 2005 (to 1500 ft AGL) 1 Appendix C,
Table 42
Edge 540 Sportsman Known 2005 (to 1500 ft AGL) 1 Appendix C,
Table 28
Sukhoi SU-29 Sportsman Known 2005 (to 1500 ft AGL) 1 Appendix C,
Table 35
Pitts S-2C Sportsman Known 2005 (to 1500 ft AGL) 1 Appendix C,
Table 49
MiG-15 Sportsman Known 2005 (to 1500 ft AGL) 1 Appendix C,
Table 56
F-15 Sportsman Known 2005 (to 1500 ft AGL) 1 Appendix C,
Table 56
F7F Sportsman Known 2005 (to 1500 ft AGL) 1 Appendix C,
Table 56
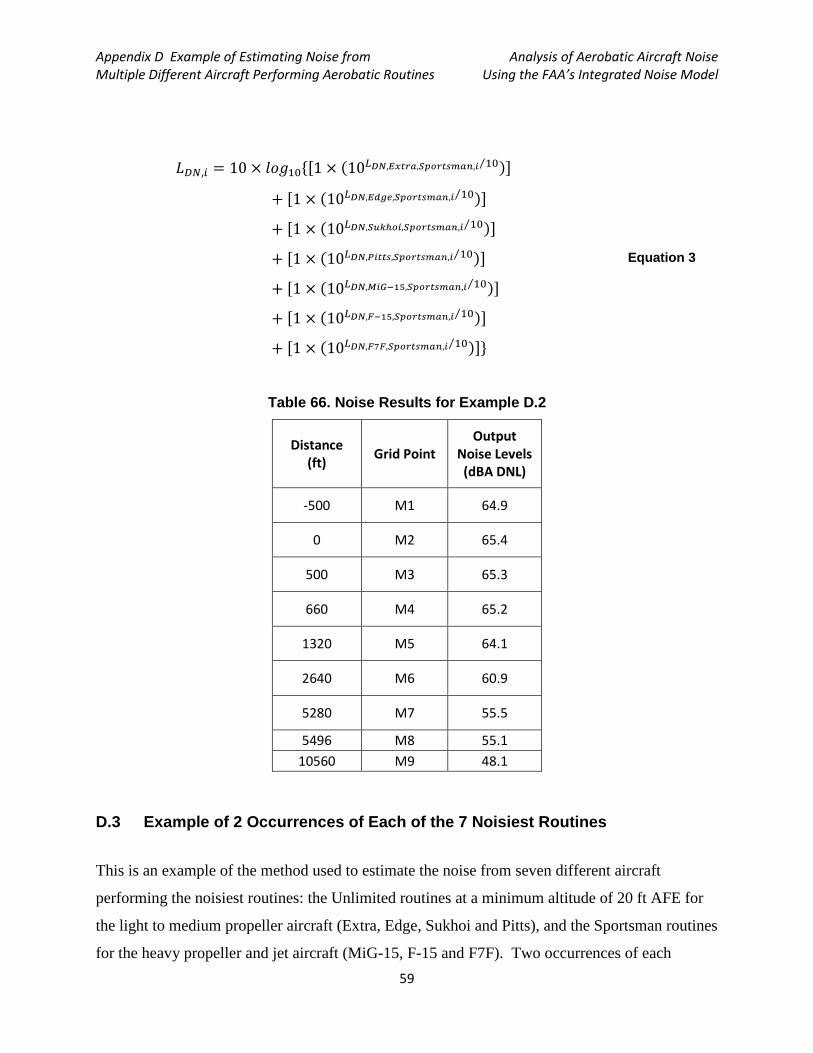
Appendix D Example of Estimating Noise from Analysis of Aerobatic Aircraft Noise Multiple Different Aircraft Performing Aerobatic Routines Using the FAA’s Integrated Noise Model
59
𝐿𝐷𝑁,𝑖 = 10 × 𝑙𝑜𝑔10{[1 × (10𝐿𝐷𝑁,𝐸𝑥𝑡𝑟𝑎,𝑆𝑝𝑜𝑟𝑡𝑠𝑚𝑎𝑛,𝑖 10⁄ )]
+ [1 × (10𝐿𝐷𝑁,𝐸𝑑𝑔𝑒,𝑆𝑝𝑜𝑟𝑡𝑠𝑚𝑎𝑛,𝑖 10⁄ )]
+ [1 × (10𝐿𝐷𝑁,𝑆𝑢𝑘ℎ𝑜𝑖,𝑆𝑝𝑜𝑟𝑡𝑠𝑚𝑎𝑛,𝑖 10⁄ )]
+ [1 × (10𝐿𝐷𝑁,𝑃𝑖𝑡𝑡𝑠,𝑆𝑝𝑜𝑟𝑡𝑠𝑚𝑎𝑛,𝑖 10⁄ )]
+ [1 × (10𝐿𝐷𝑁,𝑀𝑖𝐺−15,𝑆𝑝𝑜𝑟𝑡𝑠𝑚𝑎𝑛,𝑖 10⁄ )]
+ [1 × (10𝐿𝐷𝑁,𝐹−15,𝑆𝑝𝑜𝑟𝑡𝑠𝑚𝑎𝑛,𝑖 10⁄ )]
+ [1 × (10𝐿𝐷𝑁,𝐹7𝐹,𝑆𝑝𝑜𝑟𝑡𝑠𝑚𝑎𝑛,𝑖 10⁄ )]}
Equation 3
Table 66. Noise Results for Example D.2
Distance (ft) Grid Point
Output Noise Levels (dBA DNL)
-500 M1 64.9
0 M2 65.4
500 M3 65.3
660 M4 65.2
1320 M5 64.1
2640 M6 60.9
5280 M7 55.5
5496 M8 55.1 10560 M9 48.1
D.3 Example of 2 Occurrences of Each of the 7 Noisiest Routines
This is an example of the method used to estimate the noise from seven different aircraft
performing the noisiest routines: the Unlimited routines at a minimum altitude of 20 ft AFE for
the light to medium propeller aircraft (Extra, Edge, Sukhoi and Pitts), and the Sportsman routines
for the heavy propeller and jet aircraft (MiG-15, F-15 and F7F). Two occurrences of each

Appendix D Example of Estimating Noise from Analysis of Aerobatic Aircraft Noise Multiple Different Aircraft Performing Aerobatic Routines Using the FAA’s Integrated Noise Model
60
routine were modeled. The input data are presented in Table 67 and Equation 4 is used to
compute the cumulative noise levels presented in Table 68. These estimated results were
verified with INM 7.0c.
Table 67. Input Data for Example D.3
Representative Aircraft Aerobatic Routine
Number of Events
Source of Data
Extra EA-230 Unlimited Known 2011 (to 20 ft AGL) 2 Appendix C,
Table 42
Edge 540 Unlimited Known 2011 (to 20 ft AGL) 2 Appendix C,
Table 28
Sukhoi SU-29 Unlimited Known 2011 (to 20 ft AGL) 2 Appendix C,
Table 35
Pitts S-2C Unlimited Known 2011 (to 20 ft AGL) 2 Appendix C,
Table 49
MiG-15 Sportsman Known 2005 (to 1500 ft AGL) 2 Appendix C,
Table 56
F-15 Sportsman Known 2005 (to 1500 ft AGL) 2 Appendix C,
Table 56
F7F Sportsman Known 2005 (to 1500 ft AGL) 2 Appendix C,
Table 56
𝐿𝐷𝑁,𝑖 = 10 × 𝑙𝑜𝑔10{[2 × (10𝐿𝐷𝑁,𝐸𝑥𝑡𝑟𝑎,𝑈𝑛𝑙𝑖𝑚𝑖𝑡𝑒𝑑 𝑡𝑜 20𝑓𝑡,𝑖 10⁄ )]
+ [2 × (10𝐿𝐷𝑁,𝐸𝑑𝑔𝑒,𝑈𝑛𝑙𝑖𝑚𝑖𝑡𝑒𝑑 𝑡𝑜 20𝑓𝑡,𝑖 10⁄ )]
+ [2 × (10𝐿𝐷𝑁,𝑆𝑢𝑘ℎ𝑜𝑖,𝑈𝑛𝑙𝑖𝑚𝑖𝑡𝑒𝑑 𝑡𝑜 20𝑓𝑡,𝑖 10⁄ )]
+ [2 × (10𝐿𝐷𝑁,𝑃𝑖𝑡𝑡𝑠,𝑈𝑛𝑙𝑖𝑚𝑖𝑡𝑒𝑑 𝑡𝑜 20𝑓𝑡,𝑖 10⁄ )]
+ [2 × (10𝐿𝐷𝑁,𝑀𝑖𝐺−15,𝑆𝑝𝑜𝑟𝑡𝑠𝑚𝑎𝑛,𝑖 10⁄ )]
+ [2 × (10𝐿𝐷𝑁,𝐹−15,𝑆𝑝𝑜𝑟𝑡𝑠𝑚𝑎𝑛,𝑖 10⁄ )]
+ [2 × (10𝐿𝐷𝑁,𝐹7𝐹,𝑆𝑝𝑜𝑟𝑡𝑠𝑚𝑎𝑛,𝑖 10⁄ )]}
Equation 4
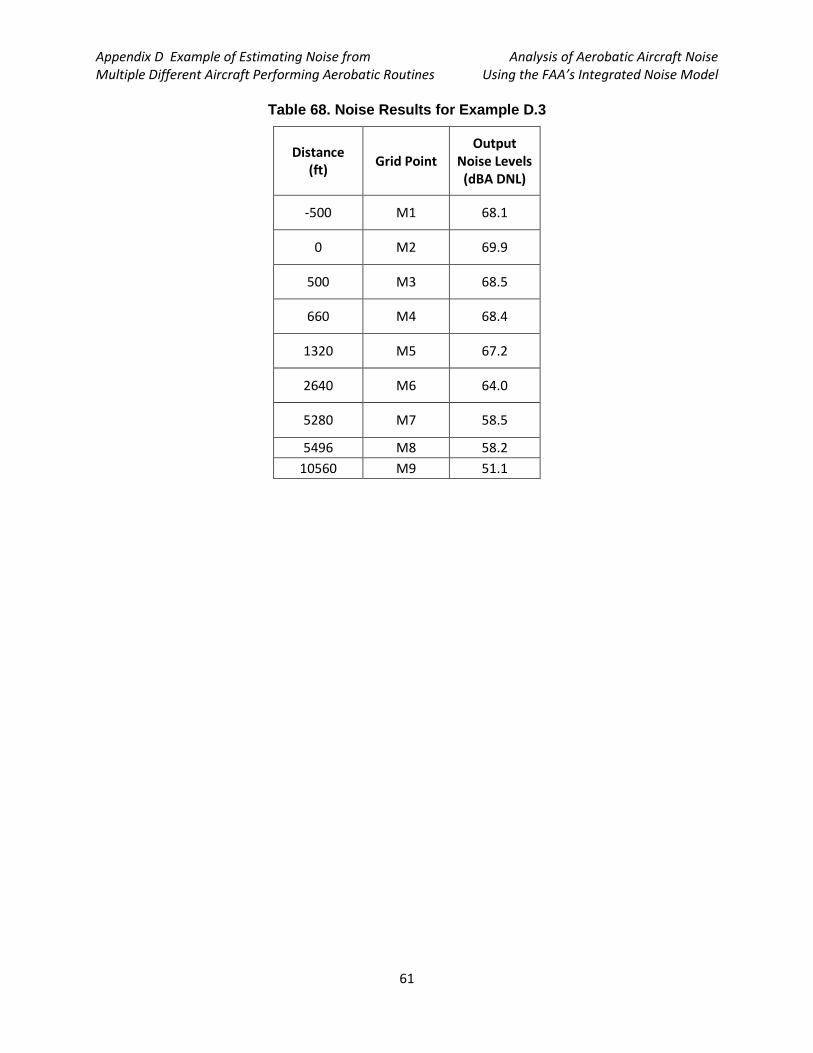
Appendix D Example of Estimating Noise from Analysis of Aerobatic Aircraft Noise Multiple Different Aircraft Performing Aerobatic Routines Using the FAA’s Integrated Noise Model
61
Table 68. Noise Results for Example D.3
Distance (ft) Grid Point
Output Noise Levels (dBA DNL)
-500 M1 68.1
0 M2 69.9
500 M3 68.5
660 M4 68.4
1320 M5 67.2
2640 M6 64.0
5280 M7 58.5
5496 M8 58.2 10560 M9 51.1

Appendix D Example of Estimating Noise from Analysis of Aerobatic Aircraft Noise Multiple Different Aircraft Performing Aerobatic Routines Using the FAA’s Integrated Noise Model
62
Page left blank intentionally.

Appendix E Aerobatic Routines
The descriptions of the aerobatic routines modeled in INM for this analysis are presented in this
appendix. The minimum and maximum altitudes modeled for each aerobatic routine in INM are
presented in Table 69 and Table 70. The IAC scoresheets used to define the aerobatic
maneuvers that make up each aerobatic routine are presented in Figure 3 through Figure 6.
Additional documentation on these aerobatic routines, including detailed definitions of each
aerobatic maneuver, is available through IAC*.
Table 69. Minimum Altitude of Aerobatic Routines Modeled in INM
Minimum Altitude of Aerobatic Routines Modeled in INM (in ft AGL)
Category Representative Aircraft
Sportsman Known 2005
Intermediate Known 2005
Advanced Known 2011
Unlimited Known 2011
Unlimited Known 2011 - Adjusted
high weight piston Extra EA-230 1500.6 1200.1 800.5 331.2 22.6
mid weight piston Edge 540 1500.6 1200.1 800.5 331.2 22.6 high weight radial Sukhoi SU-29 1500.6 1200.1 800.5 331.2 22.6 low weight piston Pitts S-2C 1500.6 1200.1 800.5 331.2 22.6 mid power jet MiG-15 1499.6 n/a n/a n/a n/a high power jet F-15 1498.8 n/a n/a n/a n/a high power/radial F7F 1500 n/a n/a n/a n/a
Table 70. Maximum Altitude of Aerobatic Routines Modeled in INM
Maximum Altitude of Aerobatic Routines Modeled in INM (in ft AGL)
Category Representative Aircraft
Sportsman Known 2005
Intermediate Known 2005
Advanced Known 2011
Unlimited Known 2011
Unlimited Known 2011 - Adjusted
high weight piston Extra EA-230 2454.6 2689.3 2673.7 2187.8 1879.2
mid weight piston Edge 540 2454.6 2689.3 2673.7 2187.8 1879.2 high weight radial Sukhoi SU-29 2454.6 2689.3 2673.7 2187.8 1879.2 low weight piston Pitts S-2C 2454.6 2689.3 2673.7 2187.8 1879.2 mid power jet MiG-15 11924.7 n/a n/a n/a n/a high power jet F-15 16167.8 n/a n/a n/a n/a high power/radial F7F 3669.8 n/a n/a n/a n/a
* http://www.iac.org/

Appendix E Analysis of Aerobatic Aircraft Noise Aerobatic Routines Using the FAA’s Integrated Noise Model
64
Figure 3. Description of the IAC Sportsman Known 2005 Aerobatic Routine

Appendix E Analysis of Aerobatic Aircraft Noise Aerobatic Routines Using the FAA’s Integrated Noise Model
65
Figure 4. Description of the IAC Intermediate Known 2005 Aerobatic Routine
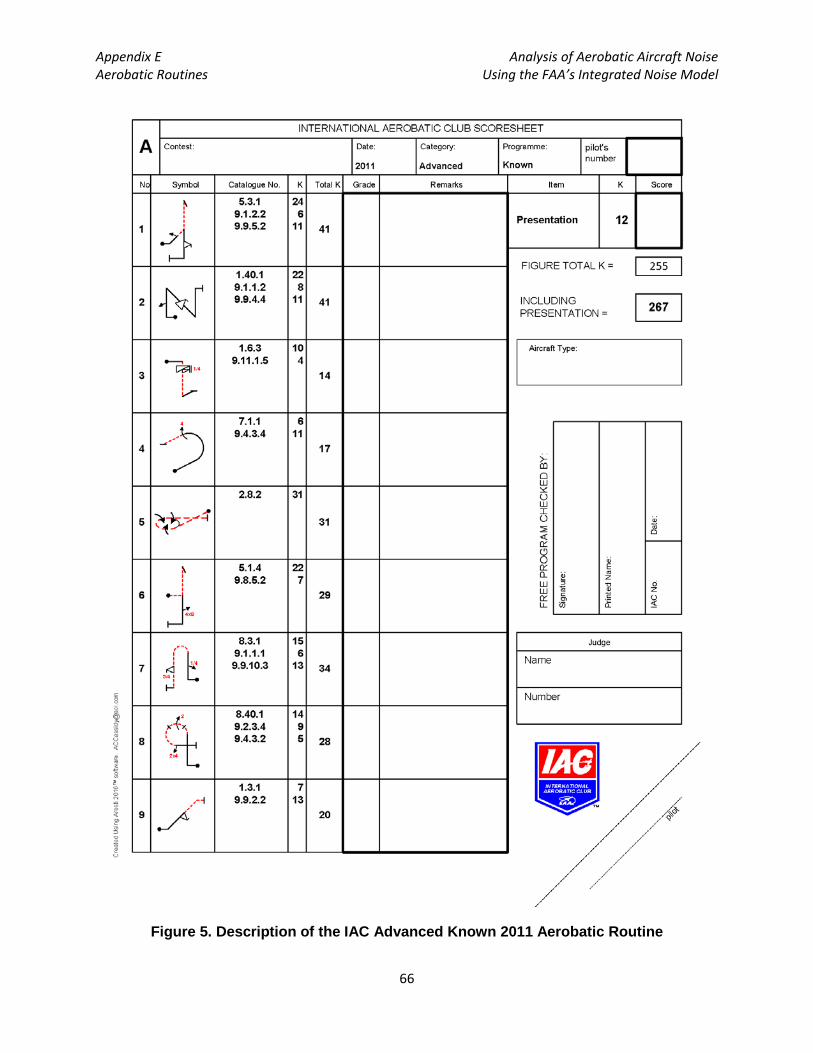
Appendix E Analysis of Aerobatic Aircraft Noise Aerobatic Routines Using the FAA’s Integrated Noise Model
66
Figure 5. Description of the IAC Advanced Known 2011 Aerobatic Routine

Appendix E Analysis of Aerobatic Aircraft Noise Aerobatic Routines Using the FAA’s Integrated Noise Model
67
Figure 6. Description of the IAC Unlimited Known 2011 Aerobatic Routine

Appendix E Analysis of Aerobatic Aircraft Noise Aerobatic Routines Using the FAA’s Integrated Noise Model
68
Page left blank intentionally.

Appendix F Previous Aerobatic Aircraft Noise Memorandum
This original 2006 technical report entitled “Aerobatic Aircraft Noise Study: Technical
Memorandum” is included in this Appendix for completeness.

USDOT Research & Innovative Technology Administration Aerobatic Aircraft Noise Study: Environmental Measurement and Modeling Division Technical Memorandum
Volpe Center Acoustics Facility
_______________________________
Subject: Aerobatic Aircraft Noise Study Date: May 5, 2006 Technical Memorandum From: Eric Boeker Reply to
Volpe TSC, Acoustics Facility Attn. of: DTS-34
To: Gene Kirkendall FAA
CC: Jeff Weller (FAA), Ed Kelleher (FAA), Gregg Fleming (Volpe)
At the Federal Aviation Administration’s (FAA) request, the Volpe Center Acoustics Facility (Volpe) conducted a noise measurement study of aerobatic aircraft. The study was conducted at the Galt Airport in Greenwood, IL from August 22nd to 26th, 2005. This study had two main objectives. The first objective was to measure high quality source noise data for several representative aerobatic aircraft for inclusion in the FAA’s Integrated Noise Model (INM). The second objective was to measure noise from complete aerobatic routines, in order to evaluate the: (1) noise levels at specific microphone locations, and (2) modeling of aerobatic routines in INM through a comparison of modeled versus measured noise levels. This memorandum provides a summary of the measurements (Appendix A), and the results from the analysis of all five aerobatic aircraft; the Zivko Edge 540 (Edge), the Extra EA-230 (Extra), the Sukhoi SU-29 (Sukhoi), the Aviat Pitts S-2C (Pitts), and the American Champion Decathlon (Decathlon). An initial analysis of the Sukhoi was undertaken as a verification of principals, prior to analyzing the data from the remaining four aircraft. The Sukhoi was selected for the initial analysis because it is one of the louder aerobatic aircraft in use today. A technical memorandum on this initial analysis was generated on February 28th, 2006, and those findings have been incorporated into this document. Source noise measurements were conducted for the Edge, the Extra and the Sukhoi on August 23rd, 2005 and for the Pitts, and the Decathlon on August 24th, 2005. In addition, noise measurements of full aerobatic routines were conducted on August 25th, 2005 for three of the aircraft, where the Extra and the Pitts performed International Aerobatic Club (IAC) Sportsman 2005 Known routines, and the Sukhoi performed the IAC Intermediate 2005 Freestyle routine. A summary of these measurements and the subsequent data processing and analysis is presented in Appendix A of this memorandum. The measurements resulted in noise data for 82 level-flight events1 and five full aerobatic sequences measured at several positions. These results are presented in Appendix B.
1 Six different types of level-flight events were conducted for this noise measurement study; high speed (around 135 mph in both directions of travel; North to South, and South to North), low speed (around 70 mph), acceleration (accelerating to full throttle), inverted (at high speed), knife-edge facing left and facing right (at high speed). Not all of the aerobatic aircraft were able to perform all six types of level-flight events.
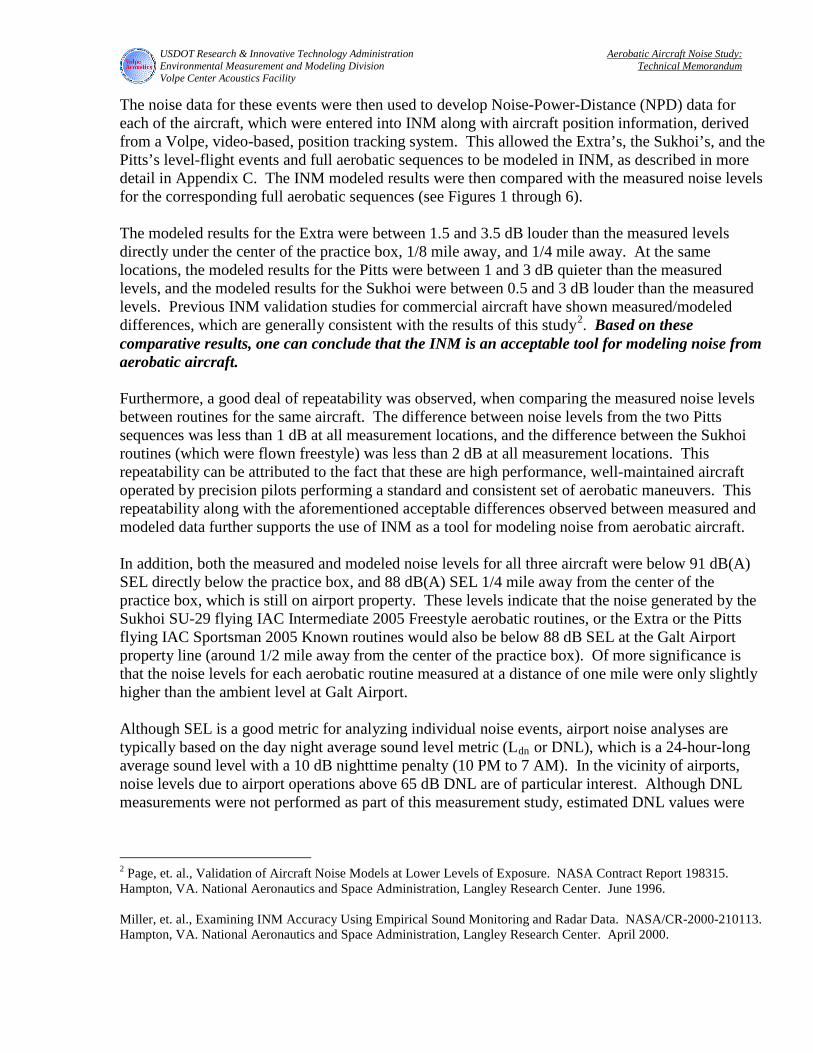
USDOT Research & Innovative Technology Administration Aerobatic Aircraft Noise Study: Environmental Measurement and Modeling Division Technical Memorandum
Volpe Center Acoustics Facility
The noise data for these events were then used to develop Noise-Power-Distance (NPD) data for each of the aircraft, which were entered into INM along with aircraft position information, derived from a Volpe, video-based, position tracking system. This allowed the Extra’s, the Sukhoi’s, and the Pitts’s level-flight events and full aerobatic sequences to be modeled in INM, as described in more detail in Appendix C. The INM modeled results were then compared with the measured noise levels for the corresponding full aerobatic sequences (see Figures 1 through 6). The modeled results for the Extra were between 1.5 and 3.5 dB louder than the measured levels directly under the center of the practice box, 1/8 mile away, and 1/4 mile away. At the same locations, the modeled results for the Pitts were between 1 and 3 dB quieter than the measured levels, and the modeled results for the Sukhoi were between 0.5 and 3 dB louder than the measured levels. Previous INM validation studies for commercial aircraft have shown measured/modeled differences, which are generally consistent with the results of this study2. Based on these comparative results, one can conclude that the INM is an acceptable tool for modeling noise from aerobatic aircraft. Furthermore, a good deal of repeatability was observed, when comparing the measured noise levels between routines for the same aircraft. The difference between noise levels from the two Pitts sequences was less than 1 dB at all measurement locations, and the difference between the Sukhoi routines (which were flown freestyle) was less than 2 dB at all measurement locations. This repeatability can be attributed to the fact that these are high performance, well-maintained aircraft operated by precision pilots performing a standard and consistent set of aerobatic maneuvers. This repeatability along with the aforementioned acceptable differences observed between measured and modeled data further supports the use of INM as a tool for modeling noise from aerobatic aircraft. In addition, both the measured and modeled noise levels for all three aircraft were below 91 dB(A) SEL directly below the practice box, and 88 dB(A) SEL 1/4 mile away from the center of the practice box, which is still on airport property. These levels indicate that the noise generated by the Sukhoi SU-29 flying IAC Intermediate 2005 Freestyle aerobatic routines, or the Extra or the Pitts flying IAC Sportsman 2005 Known routines would also be below 88 dB SEL at the Galt Airport property line (around 1/2 mile away from the center of the practice box). Of more significance is that the noise levels for each aerobatic routine measured at a distance of one mile were only slightly higher than the ambient level at Galt Airport. Although SEL is a good metric for analyzing individual noise events, airport noise analyses are typically based on the day night average sound level metric (Ldn or DNL), which is a 24-hour-long average sound level with a 10 dB nighttime penalty (10 PM to 7 AM). In the vicinity of airports, noise levels due to airport operations above 65 dB DNL are of particular interest. Although DNL measurements were not performed as part of this measurement study, estimated DNL values were
2 Page, et. al., Validation of Aircraft Noise Models at Lower Levels of Exposure. NASA Contract Report 198315. Hampton, VA. National Aeronautics and Space Administration, Langley Research Center. June 1996. Miller, et. al., Examining INM Accuracy Using Empirical Sound Monitoring and Radar Data. NASA/CR-2000-210113. Hampton, VA. National Aeronautics and Space Administration, Langley Research Center. April 2000.
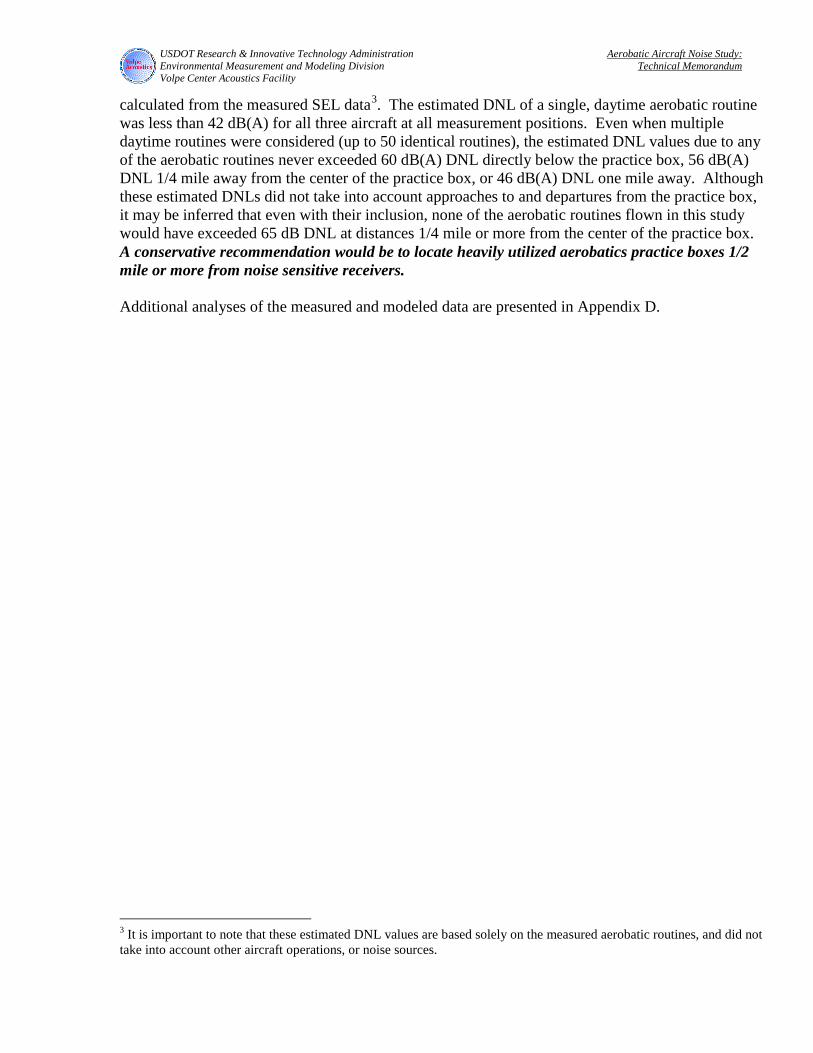
USDOT Research & Innovative Technology Administration Aerobatic Aircraft Noise Study: Environmental Measurement and Modeling Division Technical Memorandum
Volpe Center Acoustics Facility
calculated from the measured SEL data3. The estimated DNL of a single, daytime aerobatic routine was less than 42 dB(A) for all three aircraft at all measurement positions. Even when multiple daytime routines were considered (up to 50 identical routines), the estimated DNL values due to any of the aerobatic routines never exceeded 60 dB(A) DNL directly below the practice box, 56 dB(A) DNL 1/4 mile away from the center of the practice box, or 46 dB(A) DNL one mile away. Although these estimated DNLs did not take into account approaches to and departures from the practice box, it may be inferred that even with their inclusion, none of the aerobatic routines flown in this study would have exceeded 65 dB DNL at distances 1/4 mile or more from the center of the practice box. A conservative recommendation would be to locate heavily utilized aerobatics practice boxes 1/2 mile or more from noise sensitive receivers. Additional analyses of the measured and modeled data are presented in Appendix D.
3 It is important to note that these estimated DNL values are based solely on the measured aerobatic routines, and did not take into account other aircraft operations, or noise sources.
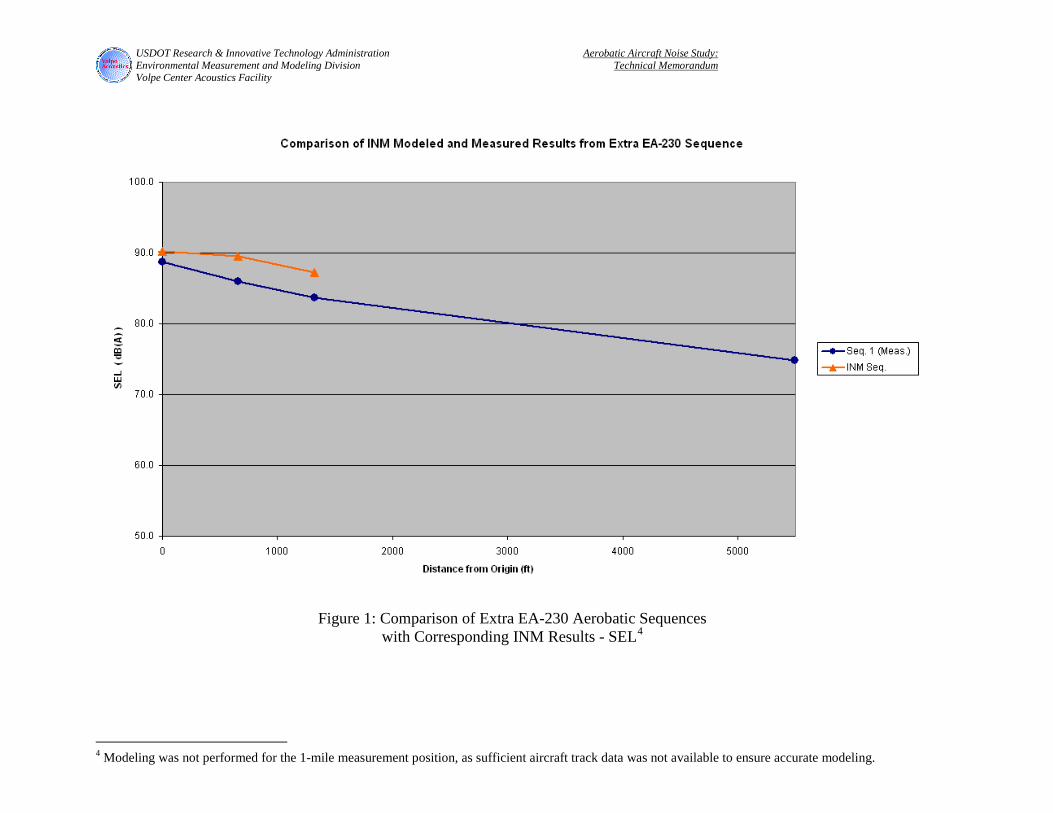
USDOT Research & Innovative Technology Administration Aerobatic Aircraft Noise Study: Environmental Measurement and Modeling Division Technical Memorandum
Volpe Center Acoustics Facility
Figure 1: Comparison of Extra EA-230 Aerobatic Sequences
with Corresponding INM Results - SEL4
4 Modeling was not performed for the 1-mile measurement position, as sufficient aircraft track data was not available to ensure accurate modeling.
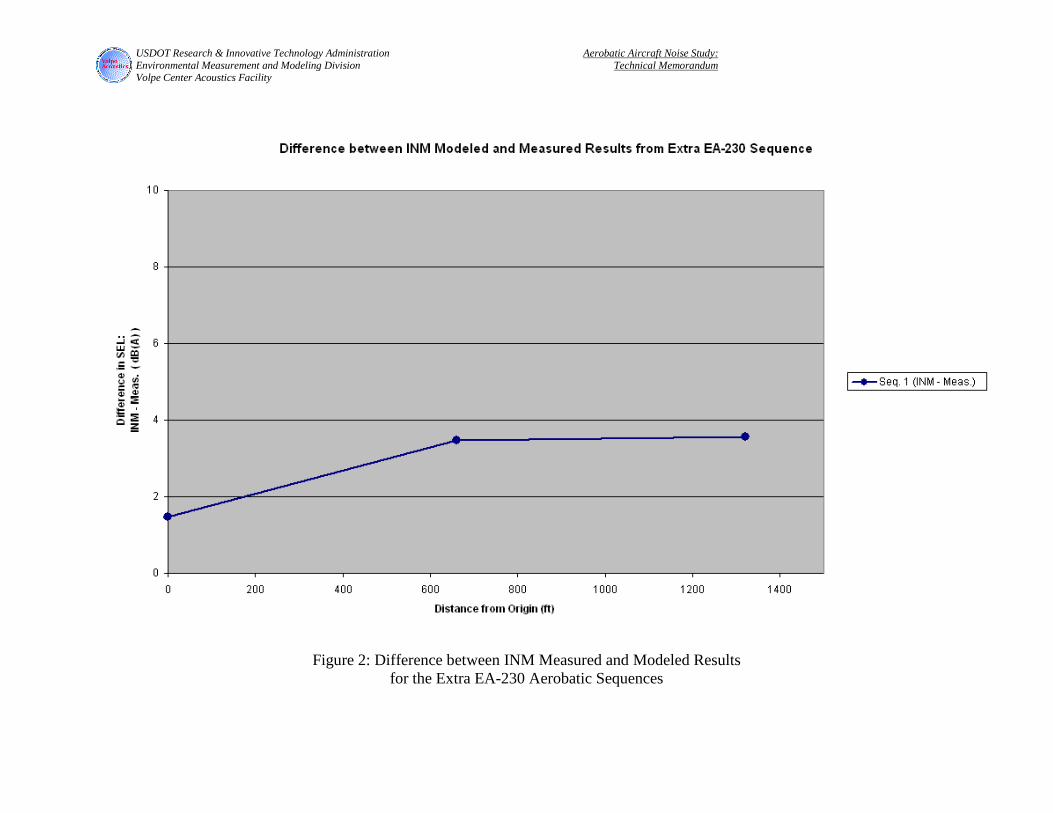
USDOT Research & Innovative Technology Administration Aerobatic Aircraft Noise Study: Environmental Measurement and Modeling Division Technical Memorandum
Volpe Center Acoustics Facility
Figure 2: Difference between INM Measured and Modeled Results
for the Extra EA-230 Aerobatic Sequences

USDOT Research & Innovative Technology Administration Aerobatic Aircraft Noise Study: Environmental Measurement and Modeling Division Technical Memorandum
Volpe Center Acoustics Facility
Figure 3: Comparison of Aviat Pitts S-2C Aerobatic Sequences
with Corresponding INM Results - SEL5
5 The two Pitts aerobatic sequences were similar enough, that they could be represented by a single INM sequence.
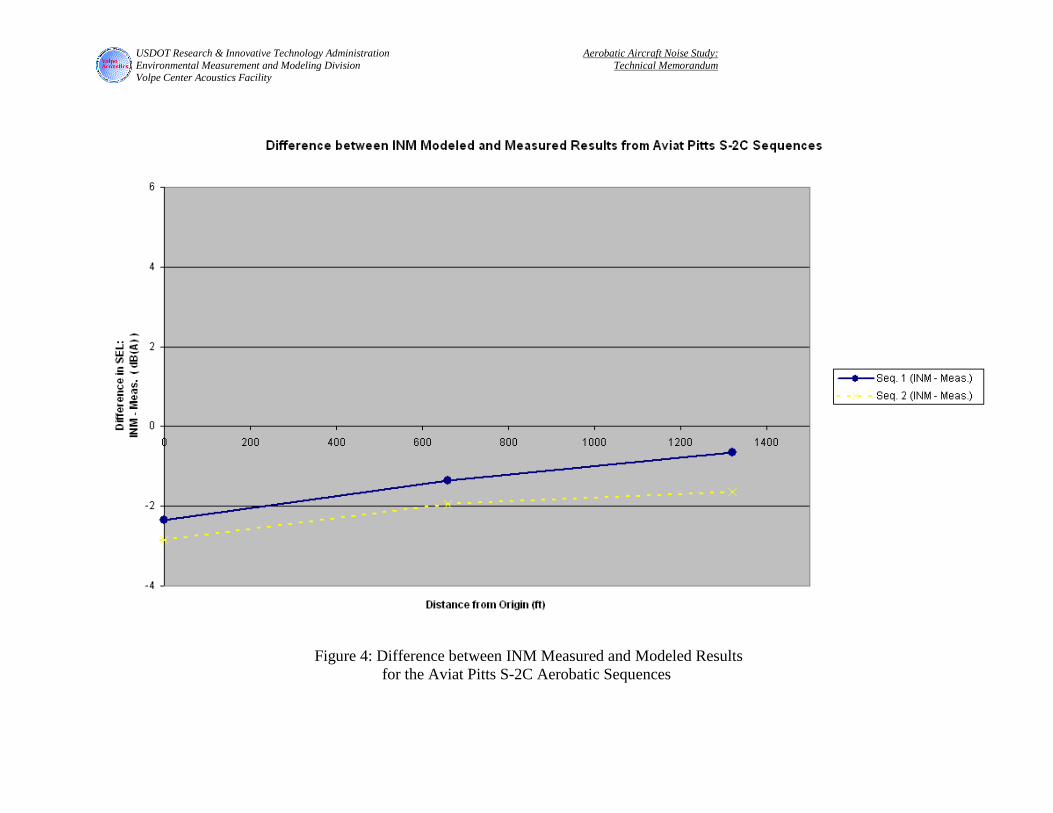
USDOT Research & Innovative Technology Administration Aerobatic Aircraft Noise Study: Environmental Measurement and Modeling Division Technical Memorandum
Volpe Center Acoustics Facility
Figure 4: Difference between INM Measured and Modeled Results
for the Aviat Pitts S-2C Aerobatic Sequences
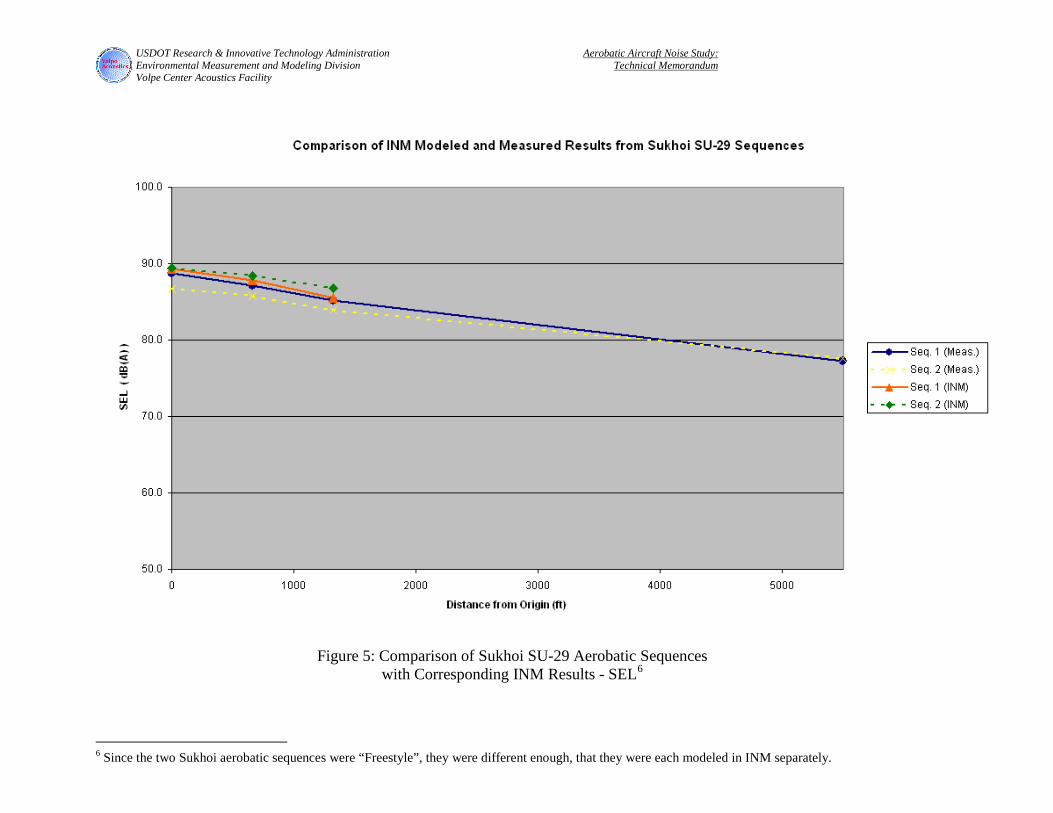
USDOT Research & Innovative Technology Administration Aerobatic Aircraft Noise Study: Environmental Measurement and Modeling Division Technical Memorandum
Volpe Center Acoustics Facility
Figure 5: Comparison of Sukhoi SU-29 Aerobatic Sequences
with Corresponding INM Results - SEL6
6 Since the two Sukhoi aerobatic sequences were “Freestyle”, they were different enough, that they were each modeled in INM separately.
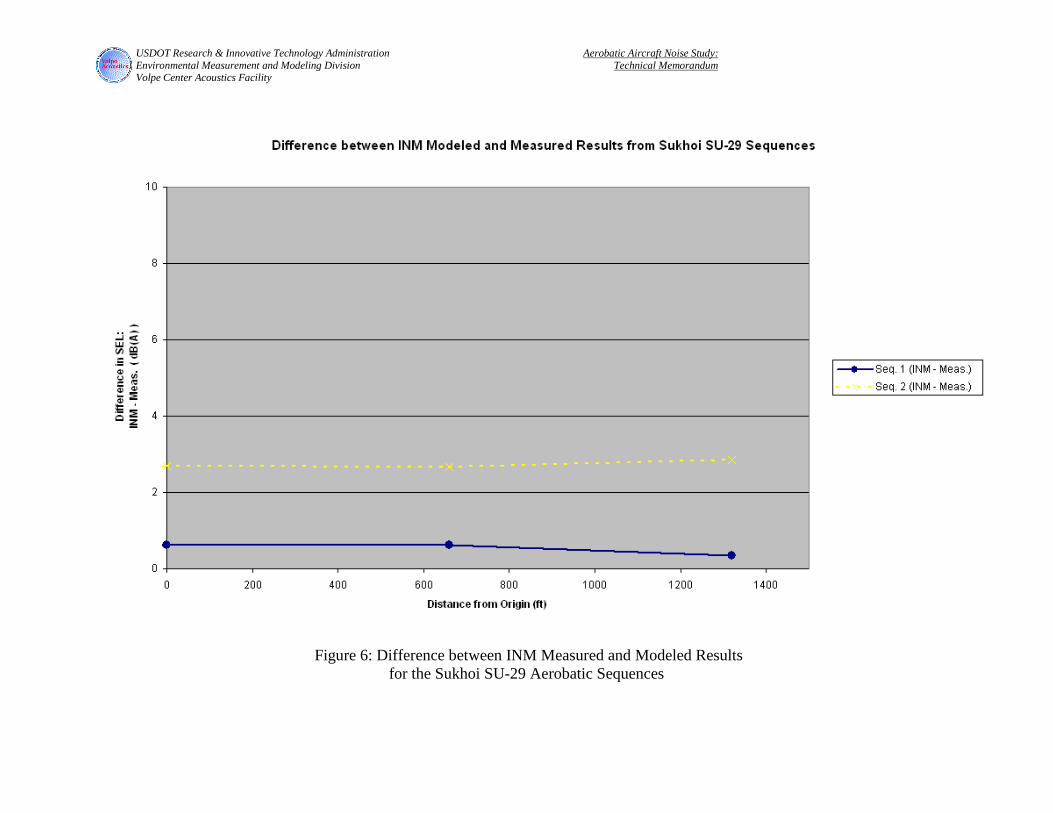
USDOT Research & Innovative Technology Administration Aerobatic Aircraft Noise Study: Environmental Measurement and Modeling Division Technical Memorandum
Volpe Center Acoustics Facility
Figure 6: Difference between INM Measured and Modeled Results
for the Sukhoi SU-29 Aerobatic Sequences
USDOT Research & Innovative Technology Administration Aerobatic Aircraft Noise Study: Environmental Measurement and Modeling Division Technical Memorandum
Volpe Center Acoustics Facility
Appendix A. Noise Measurement Summary Source noise measurements were conducted for the Extra, the Edge and the Sukhoi on August 23rd, 2005 and for the Pitts, and the Decathlon on August 24th, 2005. Noise and aircraft position data were measured for a series of different level-flight events, representing a range of operational conditions. All of the events were conducted at an altitude of 500 ft above field elevation and were centered over the west edge of the north-south runway at Galt Airport. This measurement program focused on six different types of events: high speed (around 135 mph)7, low speed (around 70 mph), acceleration (accelerating to full throttle), inverted (at high speed), knife-edge facing left and facing right (at high speed)8. Each type of event was repeated until a minimum of three acceptable events were measured. The acceptability criteria were based on observed aircraft performance, meteorological and ambient noise conditions. For each event, aircraft source noise data were measured at microphones located 500 ft East of the origin (M1 [Left]), at the origin (M2 [Center]) and 500 ft West (M3 [Right]), as shown in Figures 7 and 89. One-second, A-weighted, equivalent sound pressure level (LAeq) data and the corresponding 1/3-octave-band spectra were measured and stored for each event, and the corresponding audio signal was recorded to digital audio tape (DAT). Aircraft position information for each event was captured by the cameras of the video tracking system. A detailed description of all measurement equipment utilized during this study was presented in the study test plan10. In addition, noise measurements of full aerobatic routines were conducted on August 25th, 2005 for three of the aircraft; the Extra, the Pitts and the Sukhoi. The Extra and the Pitts performed International Aerobatic Club (IAC) Sportsman 2005 Known routines, and the Sukhoi performed the IAC Intermediate 2005 Freestyle routine. These routines were centered above the intersection of the two runways. For each sequence, noise data were measured at microphones located 500 ft East of the origin (M1), at the origin (M2), at 1/8 mile West (M4), ¼ mile West (M5) and 1 mile West (M7, off of airport property), as shown in Figure 9. Noise data were not measured at ½ mile West of the origin (M6), because that position was located in the middle of a concert-stage construction area. One-second LAeq data and the corresponding 1/3-octave-band spectra were measured continuously for each aerobatic routine, and the time histories were recorded to digital audio tape (DAT). Position information for each sequence was also captured by the video tracking system.
7 For the Sukhoi, Pitts and Decathlon, high speed events were conducted in both directions of travel; North to South, and South to North. These directional high speed events were handled separately in the data processing, analysis and INM modeling. 8 It is important to note that not all of the aircraft were able to perform all six types of level-flight events. Only the Edge 540 and the Sukhoi SU-29 were able to perform all six types of events. The Extra 230 and the Pitts were able to perform the high speed, slow speed, accelerating and inverted events, while the Decathlon was only able to perform high speed, slow speed and accelerating events. 9 The Left-Center-Right naming convention is relative to a flight track flown North to South, which applies to all level-flight events in this study, except for a handful of high speed events flown South to North. 10 Boeker, et. al., Test Plan for Aerobatic Aircraft Noise Measurements. Cambridge, MA: John A Volpe National Transportations Systems Center Acoustics Facility, June 2005
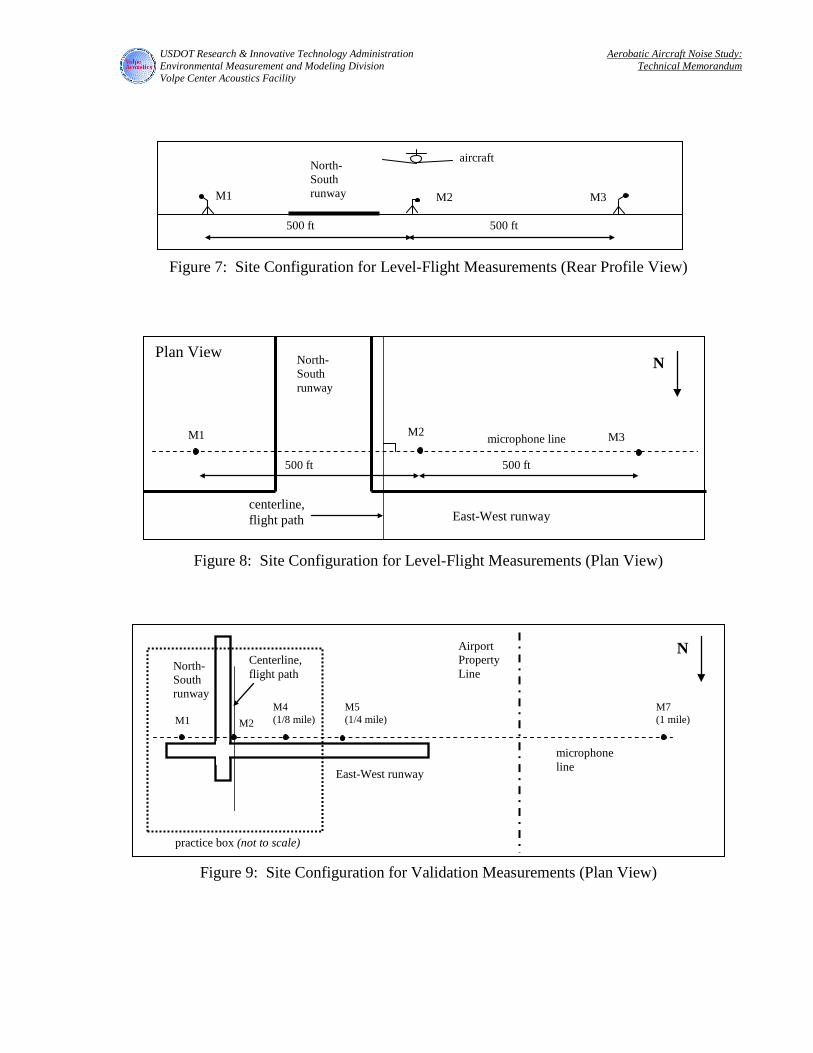
USDOT Research & Innovative Technology Administration Aerobatic Aircraft Noise Study: Environmental Measurement and Modeling Division Technical Memorandum
Volpe Center Acoustics Facility
Figure 7: Site Configuration for Level-Flight Measurements (Rear Profile View)
Figure 8: Site Configuration for Level-Flight Measurements (Plan View)
Figure 9: Site Configuration for Validation Measurements (Plan View)
North-South runway
aircraft
M1 M2 M3
500 ft 500 ft
North-South runway
centerline, flight path
microphone line
500 ft 500 ft
M2 M3 M1
Plan View
East-West runway
N
East-West runway
practice box (not to scale)
microphone line
Centerline, flight path
M7 (1 mile)
M5 (1/4 mile)
M4 (1/8 mile)
North-South runway
N Airport Property Line
M2 M1

USDOT Research & Innovative Technology Administration Aerobatic Aircraft Noise Study: Environmental Measurement and Modeling Division Technical Memorandum
Volpe Center Acoustics Facility
Appendix B. Noise Data Processing Summary Data processing for this study was separated into three major tasks; video processing, acoustic processing, and Noise-Power-Distance (NPD) data generation. Position information for each event and each aerobatic sequence were captured with Volpe’s video tracking system. The video data were processed with Volpe-developed video processing software, which calculates aircraft position and speed information for each event. Because of large elevation changes in the vicinity of Galt Airport and physical constraints of the video tracking system11, some portions of the aerobatic sequences were outside of the camera views and could not be processed with the video tracking software. These portions of the routines (which were utilized in the INM Modeling portion of this study) were then estimated. This estimation process was supplemented by audio descriptions of the sequences provided by Jeff Weller and Gerry Molidor (IAC). Acoustic data for each level-flight event and each aerobatic sequences were measured with integrating-averaging sound level meters (measuring and storing one-second LAeq data and the corresponding 1/3-octave-band spectra), and recorded to digital audio tape. The noise data processing procedure consisted of data quality evaluation, and noise metric calculation. Data quality was verified through the evaluation of calibration information12, meteorological data13, ambient noise data14, and observer logs of interfering sounds15 over the course of each level-flight event. Although these measurements were not conducted for the purpose of aircraft noise certification, they were generally consistent with the procedures of Federal Aviation Regulation Part 36 (FAR 36). For example, the meteorological criteria in FAR 36 Appendix G were used in the data quality determination for this study. Next, the desired noise metrics were calculated for each of the level-flight events and full aerobatic sequences. For the purpose of this study, A-weighted maximum sound pressure levels with slow exponential response (LAMAX) were determined for each of the events, and A-weighted sound exposure levels (SEL) were calculated for each event and each aerobatic sequence. The data reduction and analysis process yielded 82 acceptable level-flight events16 and five acceptable full aerobatic sequences17. The results for the level-flight events are presented in Table 1 through 5, and the results for the aerobatic sequences are presented in Table 6 through 8. A small amount of ambient noise data was also measured at each of the microphone positions immediately following the two of the aerobatic routines. It is important to note, that this ambient data in no way indicates a definitive description of the ambient noise at Galt Airport. It was only
11 Some physical constraints of the video tracking system are that it must remain in a fixed position. 12 Acceptable calibration drift of 0.3 dB or less at 1 kHz. 13 Acceptable temperature range of 35-95 F, relative humidity range of 20-95%, wind limit of 10 kts, and cross wind limit of 5 kts. 14 A rise and fall of 10 dB or more above the ambient noise for each level-flight event. 15 Lack of audible interference from other noise sources at each microphone location. 16 There were 22 events for the Edge, 16 events for the Extra, 21 events for the Sukhoi, 10 events for the Pitts, and 13 events for the Decathlon. As mentioned earlier, not all of the aerobatic aircraft were able to perform all six types of level-flight events. 17 There was 1 complete sequence for the Extra, 2 for the Pitts, and 2 for the Sukhoi. The Extra sequence lasted 171 seconds, the two Pitts sequences lasted 172 seconds and 197 seconds respectively, and the two Sukhoi sequences lasted 285 seconds and 233 seconds respectively.
USDOT Research & Innovative Technology Administration Aerobatic Aircraft Noise Study: Environmental Measurement and Modeling Division Technical Memorandum
Volpe Center Acoustics Facility
meant to provide a brief, cursory indication of if the noise from the aerobatic sequences were discernable from the ambient noise at those microphone positions. The results are presented in Table 9. Longer-duration ambient noise measurements were not possible due to air traffic and other noise sources outside of the measurement team’s control (construction noise, road traffic noise, farm noise, etc.)18. In order to verify that the noise levels from the five aerobatic sequences were above the ambient, the sound pressure level time histories for each sequence were plotted against the ambient noise LAeq (see Figures 10 through 14). The louder of the two ambients (Ambient 2) directly under the practice box (M2) was used in this analysis. As Figures 10 through 14 indicate, the aerobatic maneuvers making up each sequence were well above the ambient noise, except for a few quiet lulls in the sequence. The only major exception was the microphone 1-mile away from the practice box (M7), which was only slightly louder than the ambient noise for all five aerobatic sequences. The SELs for each level-flight event, along with the 1/3-octave-band spectra corresponding to the maximum sound pressure level (LAMAX) and the aircraft position information, were then used to generate Noise-Power-Distance (NPD) data for each level-flight event. NPDs, which were generated using the procedures of SAE-AIR-1845, are used by the FAA’s Integrated Noise Model (INM) as aircraft source noise data. For this study, the NPDs consist of aircraft-specific noise source data expressed as function of aerobatic attitude19 and distance, and are corrected for aircraft speed, atmospheric absorption, distance duration, and divergence. These corrections are applied by Volpe-developed acoustic processing software used specifically to generate INM NPDs. These NPDs were then averaged for each type of aerobatic attitude, and were utilized in the INM modeling portion of this study. The resulting NPDs are presented in Tables 10 through 24 in Appendix C.
18 Ambient Event 1 lasted 81 seconds, and Ambient Event 2 lasted 65 seconds. 19 The six aerobatic attitude types are high speed, low speed, accelerating, inverted, knife edge (left wing down) and knife edge (right wing down). Only high speed events flown North to South were used in the calculations of the high speed NPDs.

USDOT Research & Innovative Technology Administration Aerobatic Aircraft Noise Study: Environmental Measurement and Modeling Division Technical Memorandum
Volpe Center Acoustics Facility
B.1. Measured LAMAX and SEL20 Noise Levels for Level-Flight Events
Table 1: LAMAX and SEL levels for Zivko Edge 540 Level-Flight Events LAMAX ( dB(A) ) SEL ( dB(A) )
Event Type Speed (kts) M1
[Left] M2
[Center] M3
[Right] M1
[Left] M2
[Center] M3
[Right]
110
High Speed
130.5 81.4 85.6 81.7 85.7 88.4 86.1
120 133.8 83.6 84.2 79.4 87.8 88.3 84.3
130 169.5 82.2 86.7 80.6 86.5 89.5 85.1 220
Low Speed 73.4 78.1 81.3 75.5 83.0 85.9 81.2
240 67.6 74.2 77.5 70.2 80.6 82.6 77.3 250 64.5 71.6 73.4 69.2 78.3 79.8 76.0 310
Accelerating
104.1 85.7 86.3 80.5 90.1 91.3 86.1 320 105.4 82.6 88.1 83.4 88.3 92.2 88.6 330 99.0 82.8 85.3 81.4 88.5 91.0 87.1 340 99.5 82.2 85.4 81.4 88.5 91.1 87.0 350 101.4 83.6 85.9 82.2 89.5 91.3 86.8 370 97.3 82.9 86.5 82.1 88.3 91.5 87.7 410
Inverted
128.1 80.1 83.3 80.4 83.2 85.5 84.1 420 128.4 79.0 81.4 79.6 83.6 85.1 83.3 430 124.8 78.0 80.3 78.3 82.2 84.4 82.9 440 146.0 79.7 82.9 78.5 83.8 85.8 83.5 520
Knife Edge (left wing down)
131.0 95.6 96.8 85.2 98.6 98.5 88.0 530 123.1 94.6 95.3 86.4 97.3 98.1 89.8 550 135.3 96.4 94.8 84.4 98.1 96.9 87.8 630
Knife Edge (right wing down)
125.6 96.3 93.6 85.1 98.6 97.5 89.9
640 133.2 92.5 92.4 86.6 95.8 95.3 90.4
650 124.6 97.1 95.2 85.3 98.8 97.8 90.5
20 These SEL values are presented as-measured, and correspond to the speeds listed in these tables.
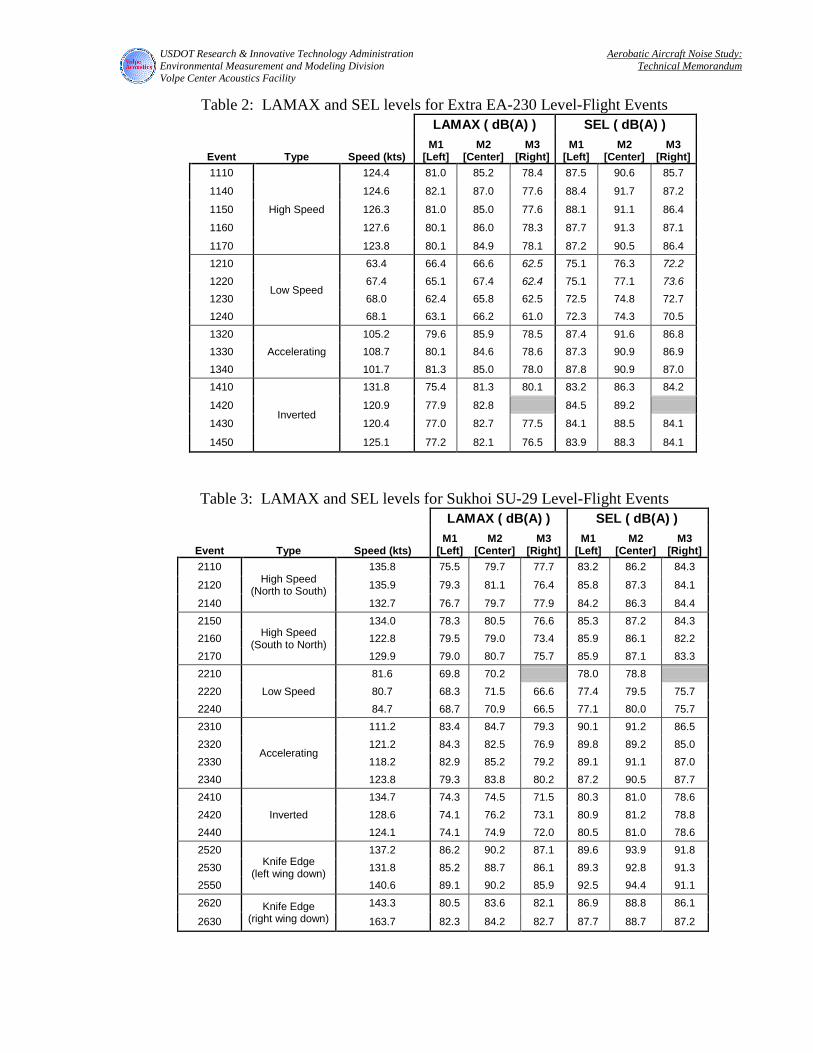
USDOT Research & Innovative Technology Administration Aerobatic Aircraft Noise Study: Environmental Measurement and Modeling Division Technical Memorandum
Volpe Center Acoustics Facility
Table 2: LAMAX and SEL levels for Extra EA-230 Level-Flight Events LAMAX ( dB(A) ) SEL ( dB(A) )
Event Type Speed (kts) M1
[Left] M2
[Center] M3
[Right] M1
[Left] M2
[Center] M3
[Right]
1110
High Speed
124.4 81.0 85.2 78.4 87.5 90.6 85.7
1140 124.6 82.1 87.0 77.6 88.4 91.7 87.2
1150 126.3 81.0 85.0 77.6 88.1 91.1 86.4
1160 127.6 80.1 86.0 78.3 87.7 91.3 87.1
1170 123.8 80.1 84.9 78.1 87.2 90.5 86.4 1210
Low Speed
63.4 66.4 66.6 62.5 75.1 76.3 72.2
1220 67.4 65.1 67.4 62.4 75.1 77.1 73.6 1230 68.0 62.4 65.8 62.5 72.5 74.8 72.7 1240 68.1 63.1 66.2 61.0 72.3 74.3 70.5 1320
Accelerating 105.2 79.6 85.9 78.5 87.4 91.6 86.8
1330 108.7 80.1 84.6 78.6 87.3 90.9 86.9 1340 101.7 81.3 85.0 78.0 87.8 90.9 87.0 1410
Inverted
131.8 75.4 81.3 80.1 83.2 86.3 84.2
1420 120.9 77.9 82.8 84.5 89.2
1430 120.4 77.0 82.7 77.5 84.1 88.5 84.1
1450 125.1 77.2 82.1 76.5 83.9 88.3 84.1
Table 3: LAMAX and SEL levels for Sukhoi SU-29 Level-Flight Events LAMAX ( dB(A) ) SEL ( dB(A) )
Event Type Speed (kts) M1
[Left] M2
[Center] M3
[Right] M1
[Left] M2
[Center] M3
[Right]
2110 High Speed
(North to South)
135.8 75.5 79.7 77.7 83.2 86.2 84.3
2120 135.9 79.3 81.1 76.4 85.8 87.3 84.1
2140 132.7 76.7 79.7 77.9 84.2 86.3 84.4 2150
High Speed (South to North)
134.0 78.3 80.5 76.6 85.3 87.2 84.3 2160 122.8 79.5 79.0 73.4 85.9 86.1 82.2 2170 129.9 79.0 80.7 75.7 85.9 87.1 83.3 2210
Low Speed 81.6 69.8 70.2 78.0 78.8
2220 80.7 68.3 71.5 66.6 77.4 79.5 75.7 2240 84.7 68.7 70.9 66.5 77.1 80.0 75.7 2310
Accelerating
111.2 83.4 84.7 79.3 90.1 91.2 86.5 2320 121.2 84.3 82.5 76.9 89.8 89.2 85.0 2330 118.2 82.9 85.2 79.2 89.1 91.1 87.0 2340 123.8 79.3 83.8 80.2 87.2 90.5 87.7 2410
Inverted 134.7 74.3 74.5 71.5 80.3 81.0 78.6
2420 128.6 74.1 76.2 73.1 80.9 81.2 78.8 2440 124.1 74.1 74.9 72.0 80.5 81.0 78.6 2520
Knife Edge (left wing down)
137.2 86.2 90.2 87.1 89.6 93.9 91.8 2530 131.8 85.2 88.7 86.1 89.3 92.8 91.3 2550 140.6 89.1 90.2 85.9 92.5 94.4 91.1 2620 Knife Edge
(right wing down) 143.3 80.5 83.6 82.1 86.9 88.8 86.1
2630 163.7 82.3 84.2 82.7 87.7 88.7 87.2
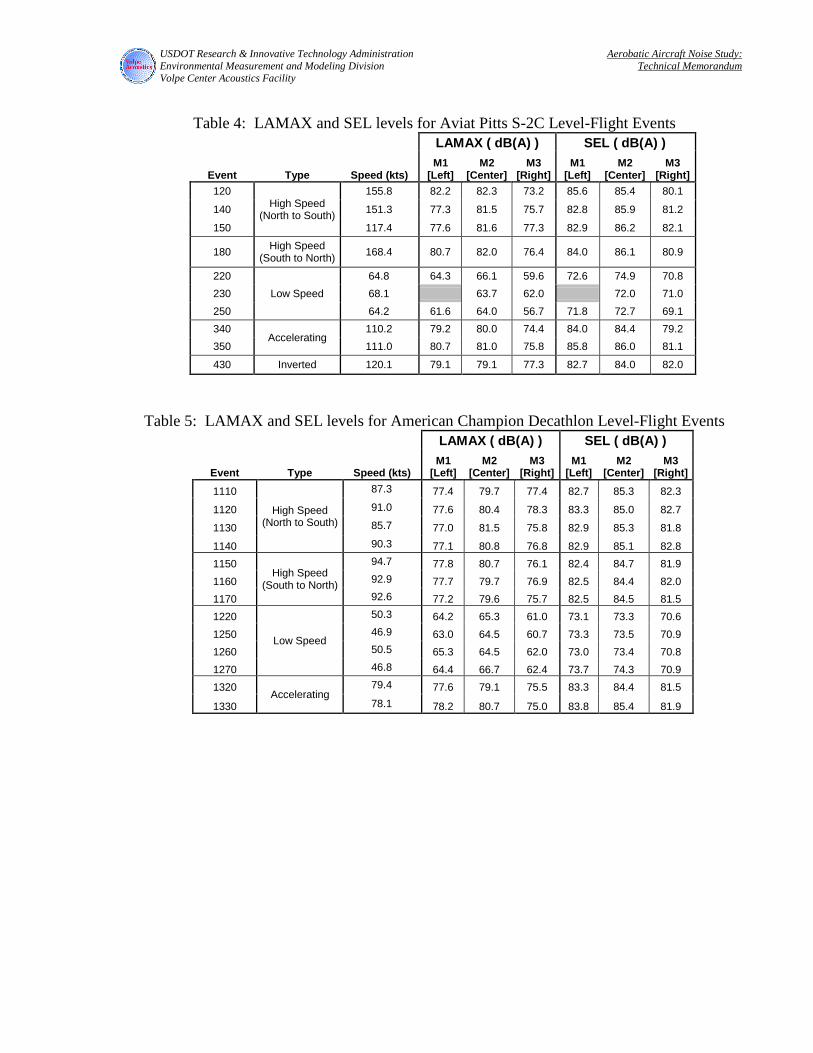
USDOT Research & Innovative Technology Administration Aerobatic Aircraft Noise Study: Environmental Measurement and Modeling Division Technical Memorandum
Volpe Center Acoustics Facility
Table 4: LAMAX and SEL levels for Aviat Pitts S-2C Level-Flight Events
LAMAX ( dB(A) ) SEL ( dB(A) )
Event Type Speed (kts) M1
[Left] M2
[Center] M3
[Right] M1
[Left] M2
[Center] M3
[Right]
120 High Speed
(North to South)
155.8 82.2 82.3 73.2 85.6 85.4 80.1
140 151.3 77.3 81.5 75.7 82.8 85.9 81.2
150 117.4 77.6 81.6 77.3 82.9 86.2 82.1
180 High Speed (South to North) 168.4 80.7 82.0 76.4 84.0 86.1 80.9
220 Low Speed
64.8 64.3 66.1 59.6 72.6 74.9 70.8 230 68.1 63.7 62.0 72.0 71.0 250 64.2 61.6 64.0 56.7 71.8 72.7 69.1 340
Accelerating 110.2 79.2 80.0 74.4 84.0 84.4 79.2
350 111.0 80.7 81.0 75.8 85.8 86.0 81.1
430 Inverted 120.1 79.1 79.1 77.3 82.7 84.0 82.0
Table 5: LAMAX and SEL levels for American Champion Decathlon Level-Flight Events LAMAX ( dB(A) ) SEL ( dB(A) )
Event Type Speed (kts) M1
[Left] M2
[Center] M3
[Right] M1
[Left] M2
[Center] M3
[Right]
1110
High Speed (North to South)
87.3 77.4 79.7 77.4 82.7 85.3 82.3
1120 91.0 77.6 80.4 78.3 83.3 85.0 82.7
1130 85.7 77.0 81.5 75.8 82.9 85.3 81.8
1140 90.3 77.1 80.8 76.8 82.9 85.1 82.8 1150
High Speed (South to North)
94.7 77.8 80.7 76.1 82.4 84.7 81.9 1160 92.9 77.7 79.7 76.9 82.5 84.4 82.0 1170 92.6 77.2 79.6 75.7 82.5 84.5 81.5 1220
Low Speed
50.3 64.2 65.3 61.0 73.1 73.3 70.6 1250 46.9 63.0 64.5 60.7 73.3 73.5 70.9 1260 50.5 65.3 64.5 62.0 73.0 73.4 70.8 1270 46.8 64.4 66.7 62.4 73.7 74.3 70.9 1320
Accelerating 79.4 77.6 79.1 75.5 83.3 84.4 81.5
1330 78.1 78.2 80.7 75.0 83.8 85.4 81.9
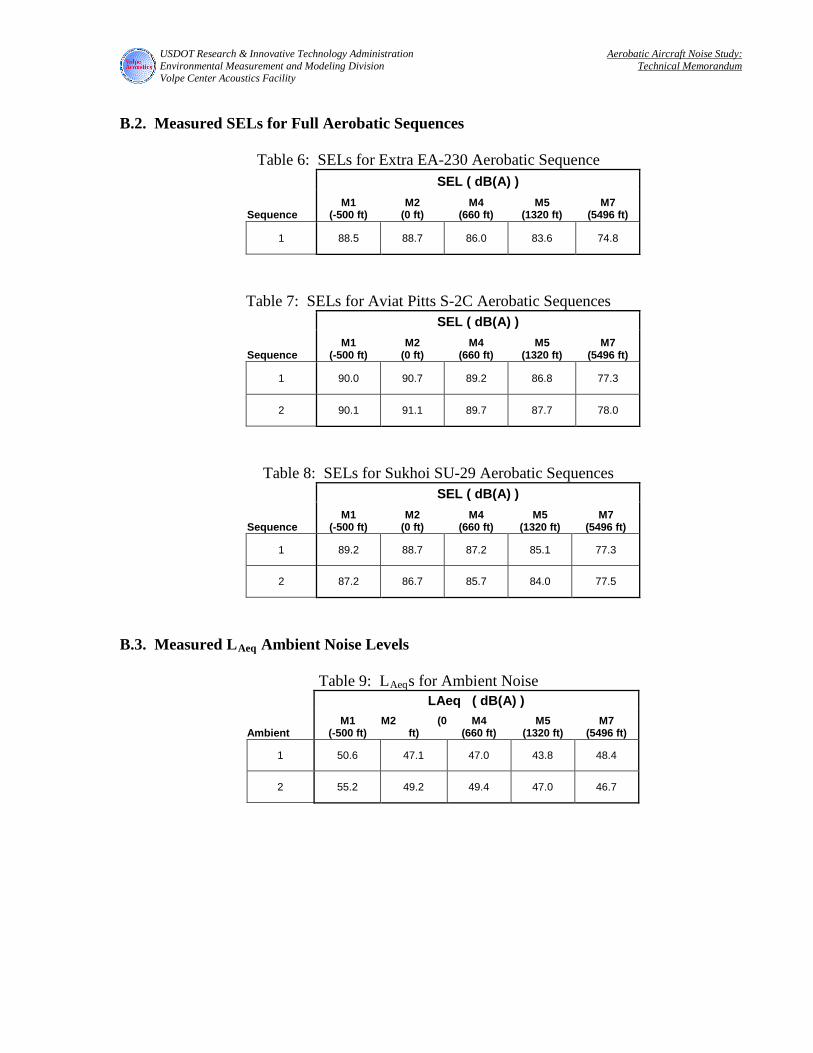
USDOT Research & Innovative Technology Administration Aerobatic Aircraft Noise Study: Environmental Measurement and Modeling Division Technical Memorandum
Volpe Center Acoustics Facility
B.2. Measured SELs for Full Aerobatic Sequences
Table 6: SELs for Extra EA-230 Aerobatic Sequence
SEL ( dB(A) )
Sequence M1
(-500 ft) M2
(0 ft) M4
(660 ft) M5
(1320 ft) M7
(5496 ft)
1 88.5 88.7 86.0 83.6 74.8
Table 7: SELs for Aviat Pitts S-2C Aerobatic Sequences
SEL ( dB(A) )
Sequence M1
(-500 ft) M2
(0 ft) M4
(660 ft) M5
(1320 ft) M7
(5496 ft)
1 90.0 90.7 89.2 86.8 77.3
2 90.1 91.1 89.7 87.7 78.0
Table 8: SELs for Sukhoi SU-29 Aerobatic Sequences SEL ( dB(A) )
Sequence M1
(-500 ft) M2
(0 ft) M4
(660 ft) M5
(1320 ft) M7
(5496 ft)
1 89.2 88.7 87.2 85.1 77.3
2 87.2 86.7 85.7 84.0 77.5
B.3. Measured LAeq Ambient Noise Levels
Table 9: LAeqs for Ambient Noise LAeq ( dB(A) )
Ambient M1
(-500 ft) M2 (0
ft) M4
(660 ft) M5
(1320 ft) M7
(5496 ft)
1 50.6 47.1 47.0 43.8 48.4
2 55.2 49.2 49.4 47.0 46.7
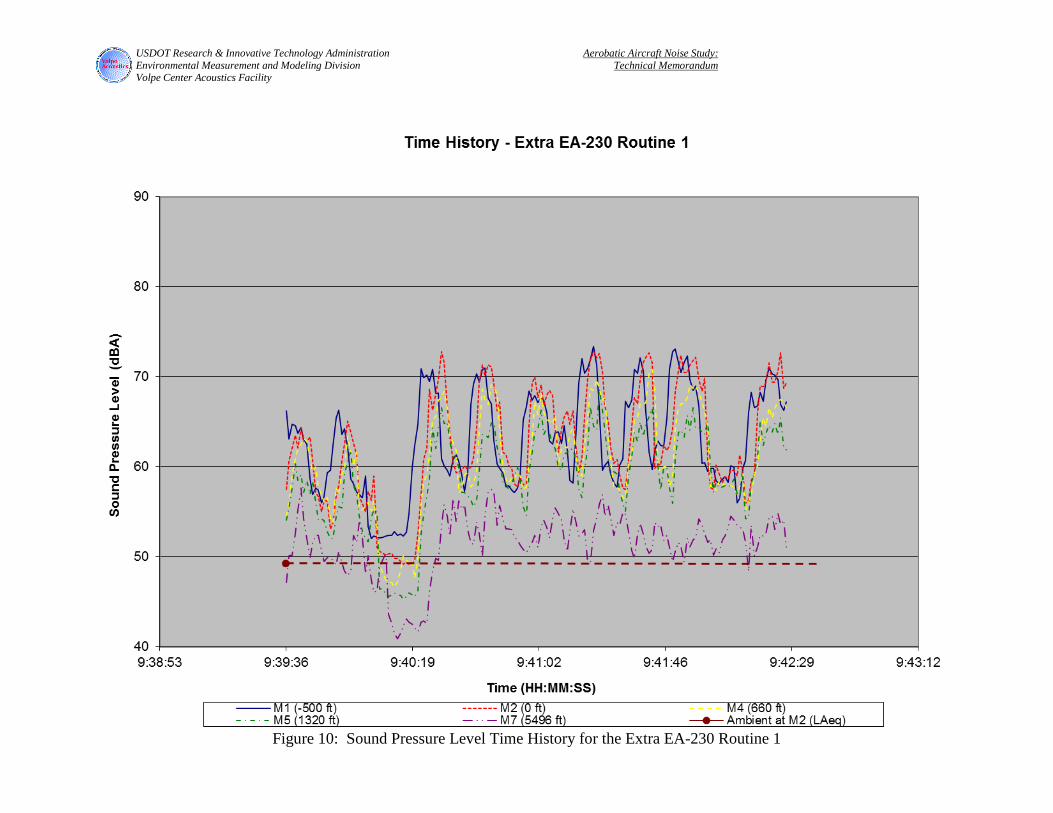
USDOT Research & Innovative Technology Administration Aerobatic Aircraft Noise Study: Environmental Measurement and Modeling Division Technical Memorandum
Volpe Center Acoustics Facility
Figure 10: Sound Pressure Level Time History for the Extra EA-230 Routine 1
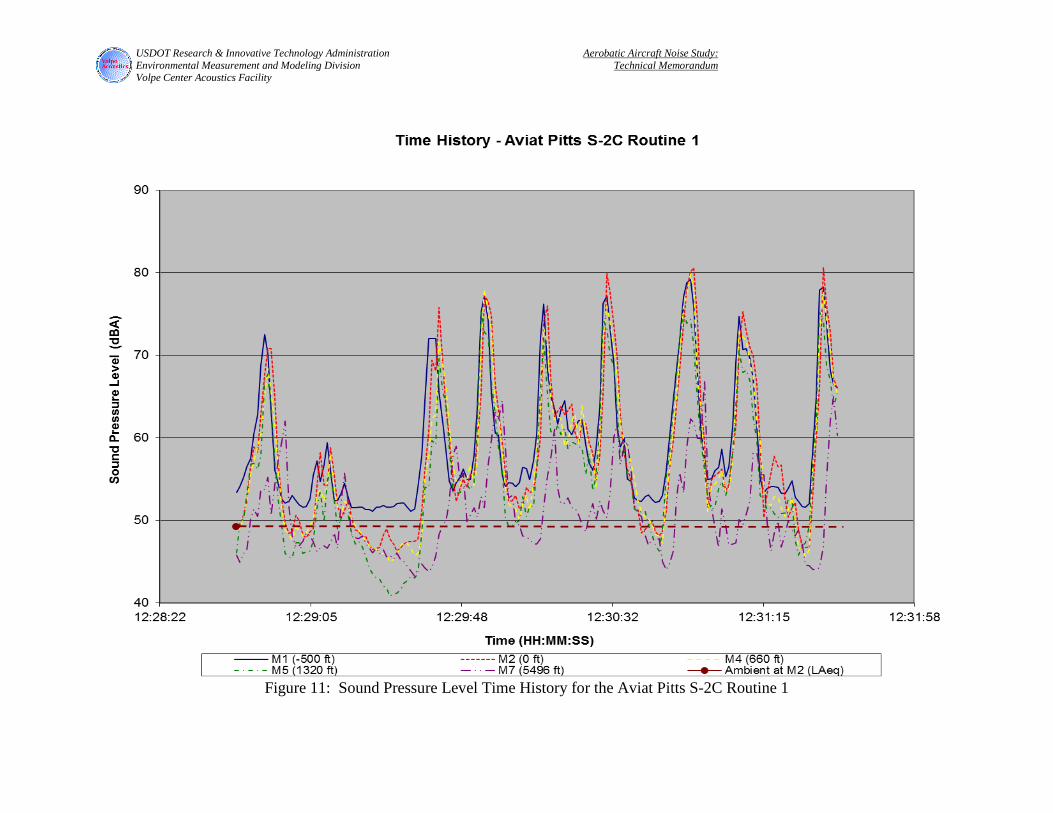
USDOT Research & Innovative Technology Administration Aerobatic Aircraft Noise Study: Environmental Measurement and Modeling Division Technical Memorandum
Volpe Center Acoustics Facility
Figure 11: Sound Pressure Level Time History for the Aviat Pitts S-2C Routine 1

USDOT Research & Innovative Technology Administration Aerobatic Aircraft Noise Study: Environmental Measurement and Modeling Division Technical Memorandum
Volpe Center Acoustics Facility
Figure 12: Sound Pressure Level Time History for the Aviat Pitts S-2C Routine 2
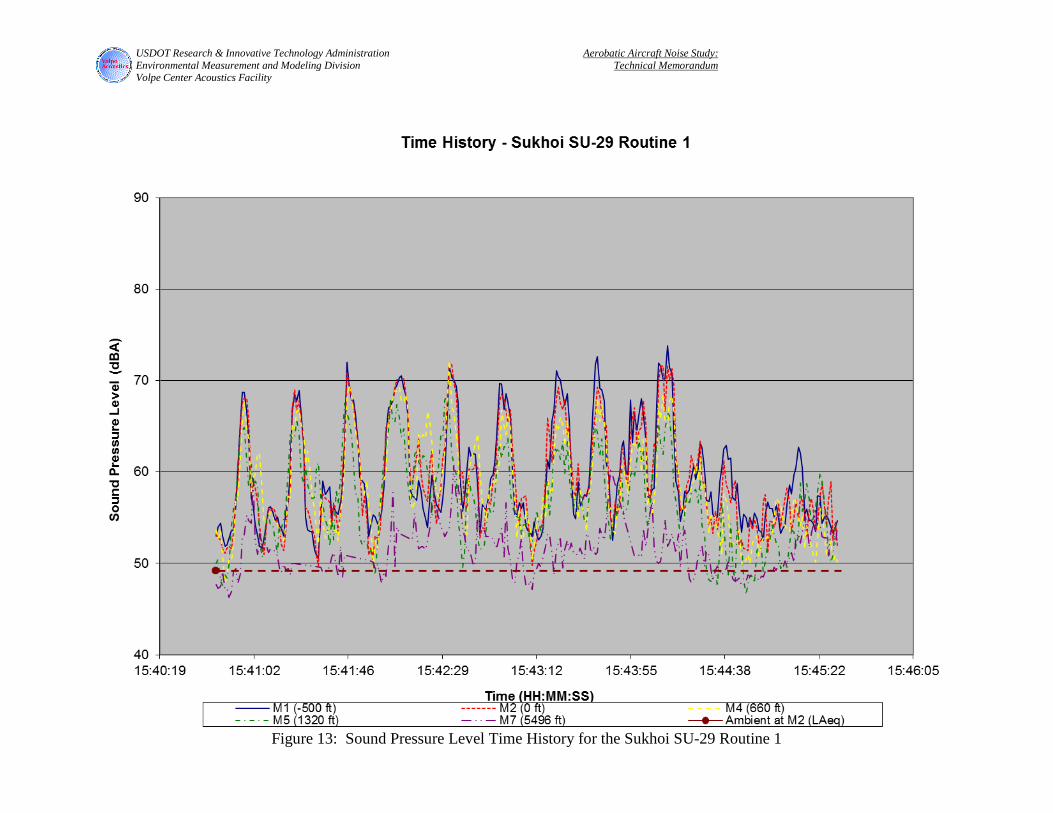
USDOT Research & Innovative Technology Administration Aerobatic Aircraft Noise Study: Environmental Measurement and Modeling Division Technical Memorandum
Volpe Center Acoustics Facility
Figure 13: Sound Pressure Level Time History for the Sukhoi SU-29 Routine 1
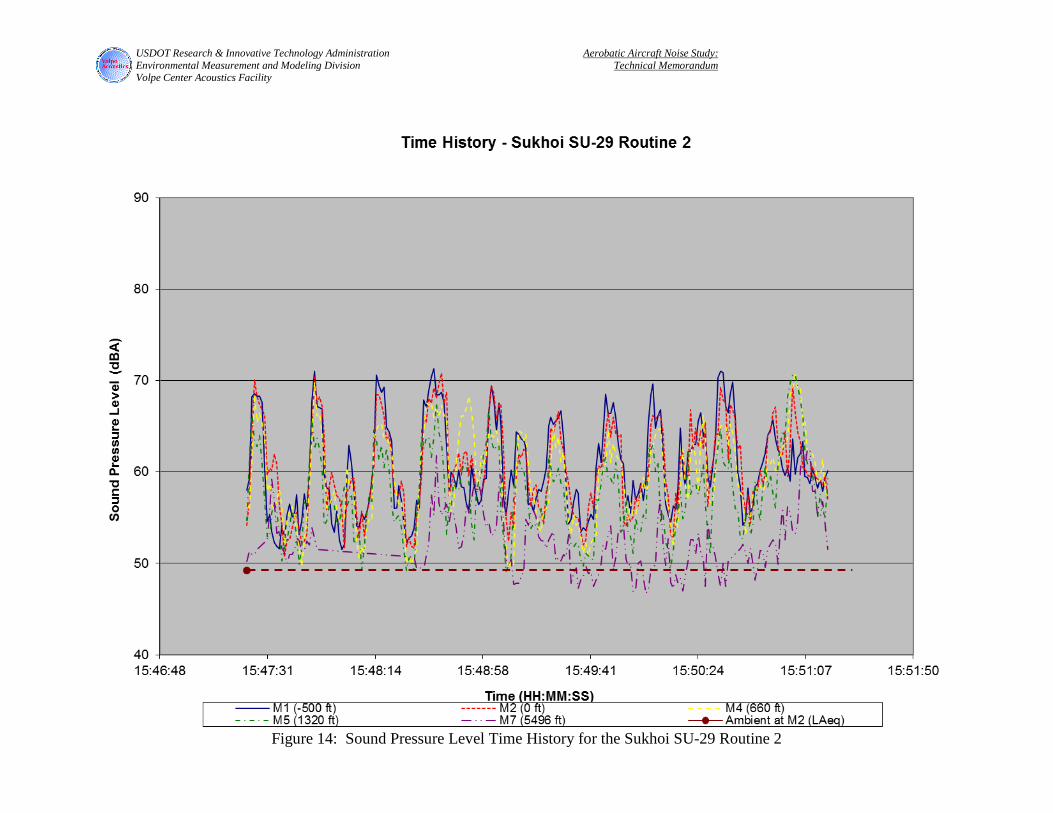
USDOT Research & Innovative Technology Administration Aerobatic Aircraft Noise Study: Environmental Measurement and Modeling Division Technical Memorandum
Volpe Center Acoustics Facility
Figure 14: Sound Pressure Level Time History for the Sukhoi SU-29 Routine 2


USDOT Research & Innovative Technology Administration Aerobatic Aircraft Noise Study: Environmental Measurement and Modeling Division Technical Memorandum
Volpe Center Acoustics Facility
Appendix C. INM Modeling Overview The modeling effort for this study consisted of representing the aircraft as user-defined aircraft in the INM with the different attitude-specific NPDs, and modeling the flight tracks and profiles of each aerobatic event (both individual level-flight events and aerobatic sequences). For this study, INM Version 6.2 was used. Only the Extra EA-230, the Sukhoi SU-29 and the Aviat Pitts S-2C were modeled in INM for this study, because they were the only ones to perform full aerobatic routines during the noise measurements. To aid future modeling efforts, INM input data for all five aircraft are presented in this Appendix and can be made available in INM database format for direct inclusion in the model. Each aircraft was modeled as a user-defined aircraft in INM, using aircraft-specific NPDs generated for this study (see Tables 10 through 24), and representative spectral classes21 (see Table 25). Although the NPDs in the standard INM database are organized according to thrust values (the ‘P -power’ in NPD is usually expressed in terms of corrected net thrust in pounds), the NPDs for the aerobatic aircraft were organized and referenced according to aircraft attitude. Even though three NPDs were generated for each aerobatic attitude of each aircraft, only the center NPD curves were used to represent the aerobatic flights of these aircraft in INM22, 23. These NPDs are presented in the following Tables: the Extra in Table 14, the Sukhoi in Table 17, and the Pitts in Table 20. These NPDs were all setup as Departure NPDs. In addition, only departure spectral classes were utilized in the INM modeling. Both individual level-flight events and aerobatic sequences were modeled in INM with unique flight tracks and profiles. The aerobatic maneuvers in the study were modeled as sequences of either four or six attitude-specific NPDs for each aircraft. These attitude-specific NPDs were utilized in conjunction with the aircraft position and speed information to model aircraft level-flight events and aerobatic sequences24, 25. As an example of modeling methodology, one of the aerobatic routines modeled in INM was the IAC Sportsman 2005 Known Aerobatic Routine, which was flown by both the Pitts and the Extra26. Each aerobatic maneuver in this routine was modeled using attitude-specific NPDs in conjunction with the aircraft position and speed information, as mentioned above. Figure 15 illustrates this procedure for the Half Cuban Eight maneuver.
21 Existing INM spectral classes were utilized in the modeling portion of this study. These spectral classes were selected by comparing measured one-third octave spectra for each aerobatic aircraft against the existing spectral classes in the INM database, and assigning those aerobatic aircraft spectral classes that resemble their noise spectra. 22 Only high speed events flown North to South were utilized in the calculation of these high speed NPDs. 23 It is important to note, that INM 7.0 (which is currently under development ) has the capability to model simplified aircraft noise directivity by utilizing Left, Center and Right NPDs. This is primarily utilized to model helicopter noise, which is not axi-symmetric. Although aircraft are typically modeled with only a single (Center) NPD, Left, Center and Right NPDs were generated for this aircraft. Although they were not utilized in this initial modeling effort, they may be utilized in future modeling efforts using INM 7.0. 24 Only aerobatic routines were modeled in this study. Aircraft approaches/landings and departures/takeoffs were not modeled. 25 Although, the resolution of the video tracking system alone wasn’t sufficient to determine the attitude of the aircraft during the full aerobatic routines, complete position information for each aerobatic routine was compiled from a combination of video tracking data, maneuver information given in the Known Sportsman routine diagram, and position information and commentary from a third video camera manually tracking each aircraft. 26 Documentation on the IAC aerobatic routines is available through the IAC (http://www.iac.org/).

USDOT Research & Innovative Technology Administration Aerobatic Aircraft Noise Study: Environmental Measurement and Modeling Division Technical Memorandum
Volpe Center Acoustics Facility
It is worthwhile to note that the transitions between vertical and horizontal flight in the aerobatic sequences were modeled with high speed level flight NPDs for the Suhkoi and accelerating NPDs for the Pitts and Extra. The initial strategy was to model all transitional maneuvers as accelerations. However, it was determined that this procedure would be unrepresentative for the Sukhoi; because the exhaust from the Suhkoi’s radial engine dominated the acceleration NPDs, but not the actual transition maneuvers, where the propeller noise dominates. Therefore, the high speed NPD was used to model the transition maneuvers for the Sukhoi. Both the Pitts and Extra, which have opposed-cylinder engines, did not show this trait, so they were modeled with the acceleration NPD for the transitions, as initially intended. The significance of the above detailed description of the modeling procedure adopted for this study is that the noise from aerobatic aircraft can be accurately modeled with the INM, as long as sufficient aircraft source data are available. The amount and type of data collected in this measurement study should be considered the minimum amount of data needed, in order to add an additional aerobatic aircraft. It is strongly recommended that inverted and knife edge level-flight data be collected for all aircraft, barring any safety or aircraft performance issues. While it is also recommended that level-flight data be collected at all three measurement positions (M1 [Left], M2 [Center], and M3 [Right]), their collection should not be considered absolutely necessary, until the implementation of Left, Center, and Right NPDs for aerobatic aircraft in INM 7.0 has been investigated further. Finally, it is also strongly recommended that all future aerobatic aircraft data collection efforts include measurements of multiple, full aerobatic sequences, especially for Advanced and Unlimited routines, since those routines are typically performed at lower altitudes with higher performance (louder) aircraft.
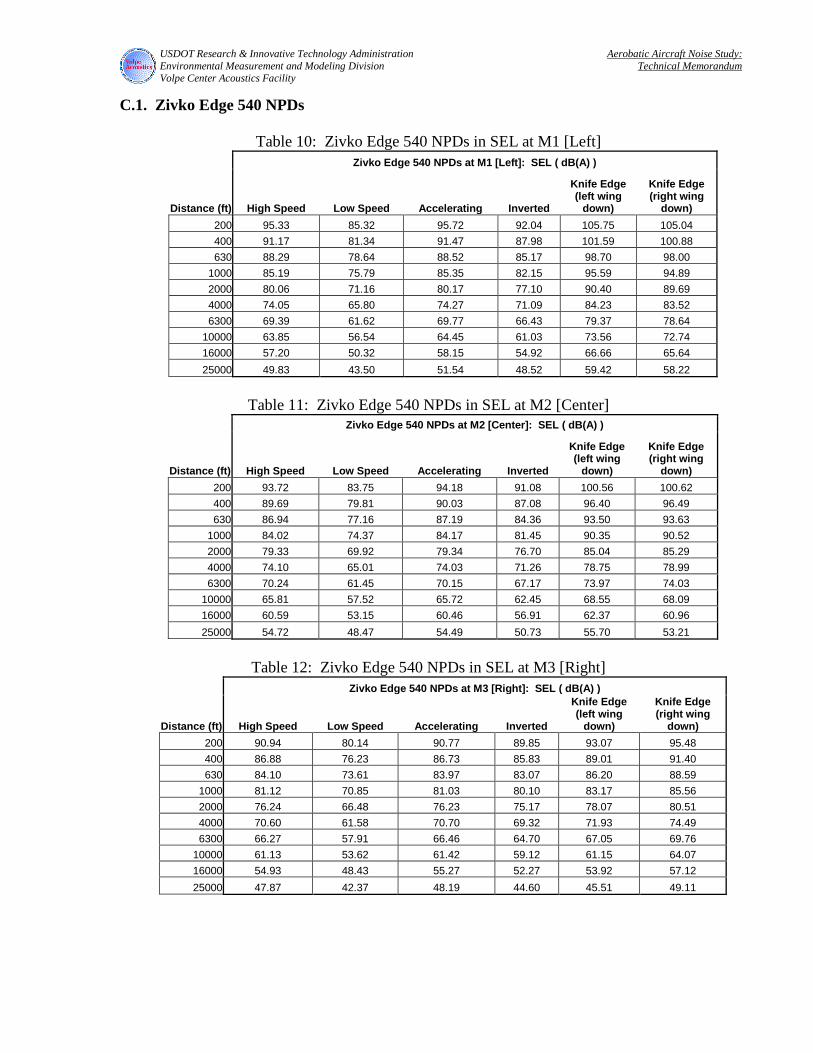
USDOT Research & Innovative Technology Administration Aerobatic Aircraft Noise Study: Environmental Measurement and Modeling Division Technical Memorandum
Volpe Center Acoustics Facility
C.1. Zivko Edge 540 NPDs
Table 10: Zivko Edge 540 NPDs in SEL at M1 [Left] Zivko Edge 540 NPDs at M1 [Left]: SEL ( dB(A) )
Distance (ft) High Speed Low Speed Accelerating Inverted
Knife Edge (left wing
down)
Knife Edge (right wing
down)
200 95.33 85.32 95.72 92.04 105.75 105.04 400 91.17 81.34 91.47 87.98 101.59 100.88 630 88.29 78.64 88.52 85.17 98.70 98.00
1000 85.19 75.79 85.35 82.15 95.59 94.89 2000 80.06 71.16 80.17 77.10 90.40 89.69 4000 74.05 65.80 74.27 71.09 84.23 83.52 6300 69.39 61.62 69.77 66.43 79.37 78.64
10000 63.85 56.54 64.45 61.03 73.56 72.74 16000 57.20 50.32 58.15 54.92 66.66 65.64 25000 49.83 43.50 51.54 48.52 59.42 58.22
Table 11: Zivko Edge 540 NPDs in SEL at M2 [Center]
Zivko Edge 540 NPDs at M2 [Center]: SEL ( dB(A) )
Distance (ft) High Speed Low Speed Accelerating Inverted
Knife Edge (left wing
down)
Knife Edge (right wing
down)
200 93.72 83.75 94.18 91.08 100.56 100.62 400 89.69 79.81 90.03 87.08 96.40 96.49 630 86.94 77.16 87.19 84.36 93.50 93.63
1000 84.02 74.37 84.17 81.45 90.35 90.52 2000 79.33 69.92 79.34 76.70 85.04 85.29 4000 74.10 65.01 74.03 71.26 78.75 78.99 6300 70.24 61.45 70.15 67.17 73.97 74.03
10000 65.81 57.52 65.72 62.45 68.55 68.09 16000 60.59 53.15 60.46 56.91 62.37 60.96 25000 54.72 48.47 54.49 50.73 55.70 53.21
Table 12: Zivko Edge 540 NPDs in SEL at M3 [Right]
Zivko Edge 540 NPDs at M3 [Right]: SEL ( dB(A) )
Distance (ft) High Speed Low Speed Accelerating Inverted
Knife Edge (left wing
down)
Knife Edge (right wing
down)
200 90.94 80.14 90.77 89.85 93.07 95.48 400 86.88 76.23 86.73 85.83 89.01 91.40 630 84.10 73.61 83.97 83.07 86.20 88.59
1000 81.12 70.85 81.03 80.10 83.17 85.56 2000 76.24 66.48 76.23 75.17 78.07 80.51 4000 70.60 61.58 70.70 69.32 71.93 74.49 6300 66.27 57.91 66.46 64.70 67.05 69.76
10000 61.13 53.62 61.42 59.12 61.15 64.07 16000 54.93 48.43 55.27 52.27 53.92 57.12 25000 47.87 42.37 48.19 44.60 45.51 49.11

USDOT Research & Innovative Technology Administration Aerobatic Aircraft Noise Study: Environmental Measurement and Modeling Division Technical Memorandum
Volpe Center Acoustics Facility
C.2. Extra EA-230 NPDs
Table 13: Extra EA-230 NPDs in SEL at M1 [Left] Extra EA-230 NPDs at M1 [Left]: SEL ( dB(A) )
Distance (ft) High Speed Low Speed Accelerating Inverted
200 95.01 78.69 94.94 91.15 400 90.54 74.31 90.35 87.10 630 87.36 71.26 87.02 84.32
1000 83.86 68.02 83.31 81.33 2000 78.01 62.86 77.05 76.40 4000 71.34 57.25 70.04 70.63 6300 66.47 53.22 65.11 66.18
10000 61.10 48.67 59.76 60.96 16000 55.26 43.41 53.91 54.85 25000 49.38 37.72 47.94 48.21
Table 14: Extra EA-230 NPDs in SEL at M2 [Center] (Used in INM Modeling)
Extra EA-230 NPDs at M2 [Center]: SEL ( dB(A) )
Distance (ft) High Speed Slow Speed Accelerating Inverted
200 94.03 77.38 95.40 91.59 400 89.44 73.15 90.76 87.57 630 86.12 70.22 87.37 84.83
1000 82.38 67.06 83.57 81.91 2000 75.95 61.94 77.11 77.13 4000 68.60 56.32 69.93 71.65 6300 63.39 52.30 65.01 67.53
10000 57.83 47.85 59.87 62.82 16000 51.85 42.85 54.40 57.38 25000 45.71 37.56 48.78 51.42
Table 15: Extra EA-230 NPDs in SEL at M3 [Right]
Extra EA-230 NPDs at M3 [Right]: SEL ( dB(A) )
Distance (ft) High Speed Low Speed Accelerating Inverted
200 92.17 75.05 92.68 88.67 400 87.74 70.99 88.09 84.63 630 84.57 68.21 84.77 81.86
1000 81.05 65.27 81.02 78.88 2000 75.09 60.57 74.55 73.94 4000 68.24 55.36 67.13 68.04 6300 63.25 51.51 61.81 63.39
10000 57.70 47.09 56.02 57.80 16000 51.44 41.84 49.71 51.03 25000 44.71 35.88 43.35 43.46
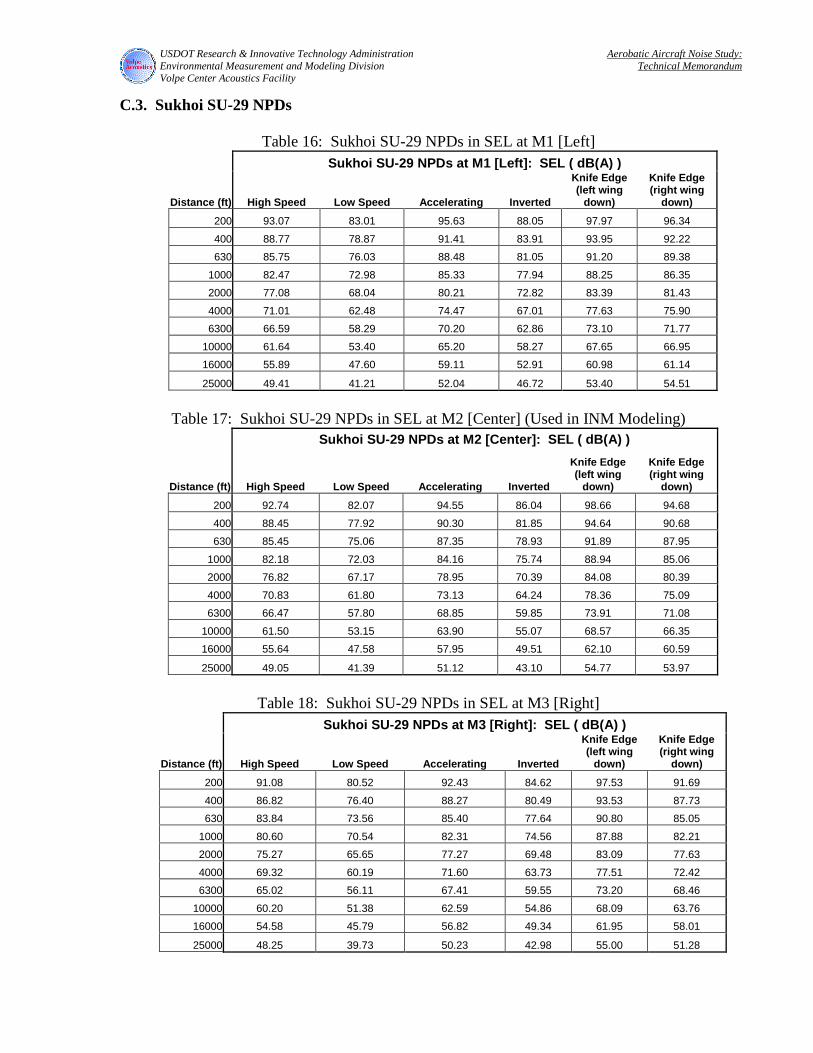
USDOT Research & Innovative Technology Administration Aerobatic Aircraft Noise Study: Environmental Measurement and Modeling Division Technical Memorandum
Volpe Center Acoustics Facility
C.3. Sukhoi SU-29 NPDs
Table 16: Sukhoi SU-29 NPDs in SEL at M1 [Left] Sukhoi SU-29 NPDs at M1 [Left]: SEL ( dB(A) )
Distance (ft) High Speed Low Speed Accelerating Inverted
Knife Edge (left wing
down)
Knife Edge (right wing
down)
200 93.07 83.01 95.63 88.05 97.97 96.34
400 88.77 78.87 91.41 83.91 93.95 92.22
630 85.75 76.03 88.48 81.05 91.20 89.38
1000 82.47 72.98 85.33 77.94 88.25 86.35
2000 77.08 68.04 80.21 72.82 83.39 81.43
4000 71.01 62.48 74.47 67.01 77.63 75.90
6300 66.59 58.29 70.20 62.86 73.10 71.77
10000 61.64 53.40 65.20 58.27 67.65 66.95
16000 55.89 47.60 59.11 52.91 60.98 61.14
25000 49.41 41.21 52.04 46.72 53.40 54.51
Table 17: Sukhoi SU-29 NPDs in SEL at M2 [Center] (Used in INM Modeling) Sukhoi SU-29 NPDs at M2 [Center]: SEL ( dB(A) )
Distance (ft) High Speed Low Speed Accelerating Inverted
Knife Edge (left wing
down)
Knife Edge (right wing
down)
200 92.74 82.07 94.55 86.04 98.66 94.68
400 88.45 77.92 90.30 81.85 94.64 90.68
630 85.45 75.06 87.35 78.93 91.89 87.95
1000 82.18 72.03 84.16 75.74 88.94 85.06
2000 76.82 67.17 78.95 70.39 84.08 80.39
4000 70.83 61.80 73.13 64.24 78.36 75.09
6300 66.47 57.80 68.85 59.85 73.91 71.08
10000 61.50 53.15 63.90 55.07 68.57 66.35
16000 55.64 47.58 57.95 49.51 62.10 60.59
25000 49.05 41.39 51.12 43.10 54.77 53.97
Table 18: Sukhoi SU-29 NPDs in SEL at M3 [Right]
Sukhoi SU-29 NPDs at M3 [Right]: SEL ( dB(A) )
Distance (ft) High Speed Low Speed Accelerating Inverted
Knife Edge (left wing
down)
Knife Edge (right wing
down)
200 91.08 80.52 92.43 84.62 97.53 91.69
400 86.82 76.40 88.27 80.49 93.53 87.73
630 83.84 73.56 85.40 77.64 90.80 85.05
1000 80.60 70.54 82.31 74.56 87.88 82.21
2000 75.27 65.65 77.27 69.48 83.09 77.63
4000 69.32 60.19 71.60 63.73 77.51 72.42
6300 65.02 56.11 67.41 59.55 73.20 68.46
10000 60.20 51.38 62.59 54.86 68.09 63.76
16000 54.58 45.79 56.82 49.34 61.95 58.01
25000 48.25 39.73 50.23 42.98 55.00 51.28
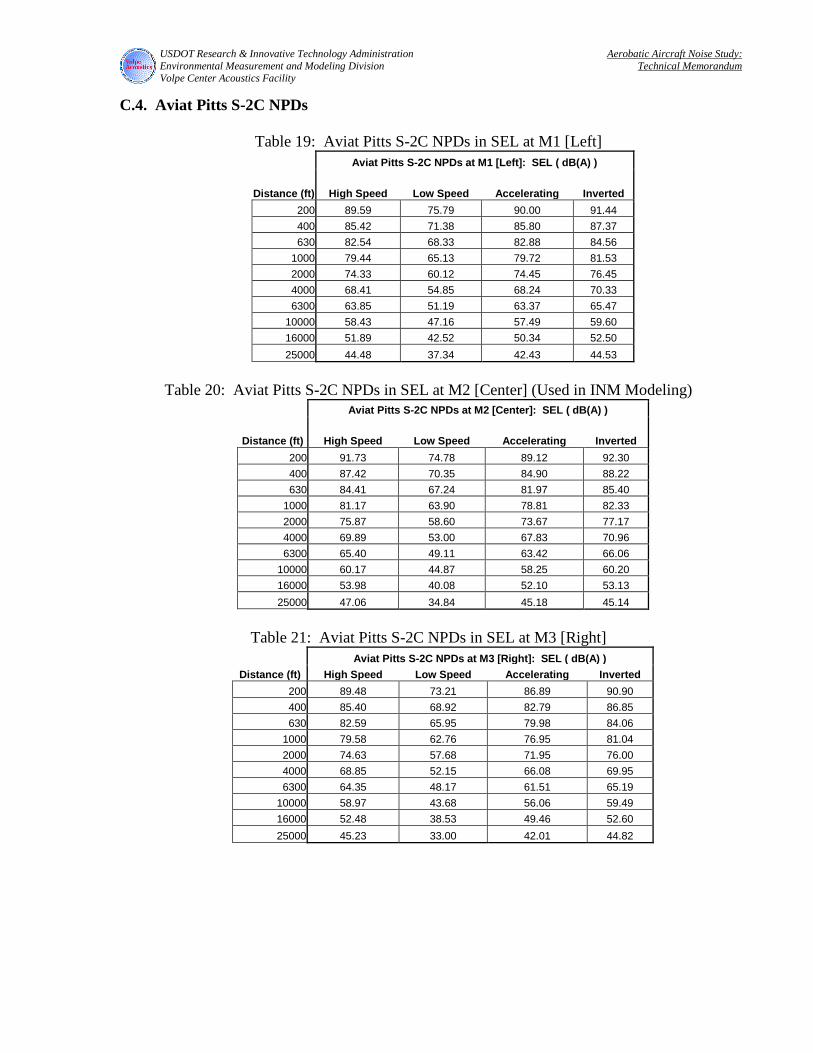
USDOT Research & Innovative Technology Administration Aerobatic Aircraft Noise Study: Environmental Measurement and Modeling Division Technical Memorandum
Volpe Center Acoustics Facility
C.4. Aviat Pitts S-2C NPDs
Table 19: Aviat Pitts S-2C NPDs in SEL at M1 [Left] Aviat Pitts S-2C NPDs at M1 [Left]: SEL ( dB(A) )
Distance (ft) High Speed Low Speed Accelerating Inverted
200 89.59 75.79 90.00 91.44 400 85.42 71.38 85.80 87.37 630 82.54 68.33 82.88 84.56
1000 79.44 65.13 79.72 81.53 2000 74.33 60.12 74.45 76.45 4000 68.41 54.85 68.24 70.33 6300 63.85 51.19 63.37 65.47
10000 58.43 47.16 57.49 59.60 16000 51.89 42.52 50.34 52.50 25000 44.48 37.34 42.43 44.53
Table 20: Aviat Pitts S-2C NPDs in SEL at M2 [Center] (Used in INM Modeling)
Aviat Pitts S-2C NPDs at M2 [Center]: SEL ( dB(A) )
Distance (ft) High Speed Low Speed Accelerating Inverted
200 91.73 74.78 89.12 92.30 400 87.42 70.35 84.90 88.22 630 84.41 67.24 81.97 85.40
1000 81.17 63.90 78.81 82.33 2000 75.87 58.60 73.67 77.17 4000 69.89 53.00 67.83 70.96 6300 65.40 49.11 63.42 66.06
10000 60.17 44.87 58.25 60.20 16000 53.98 40.08 52.10 53.13 25000 47.06 34.84 45.18 45.14
Table 21: Aviat Pitts S-2C NPDs in SEL at M3 [Right]
Aviat Pitts S-2C NPDs at M3 [Right]: SEL ( dB(A) )
Distance (ft) High Speed Low Speed Accelerating Inverted
200 89.48 73.21 86.89 90.90 400 85.40 68.92 82.79 86.85 630 82.59 65.95 79.98 84.06
1000 79.58 62.76 76.95 81.04 2000 74.63 57.68 71.95 76.00 4000 68.85 52.15 66.08 69.95 6300 64.35 48.17 61.51 65.19
10000 58.97 43.68 56.06 59.49 16000 52.48 38.53 49.46 52.60 25000 45.23 33.00 42.01 44.82
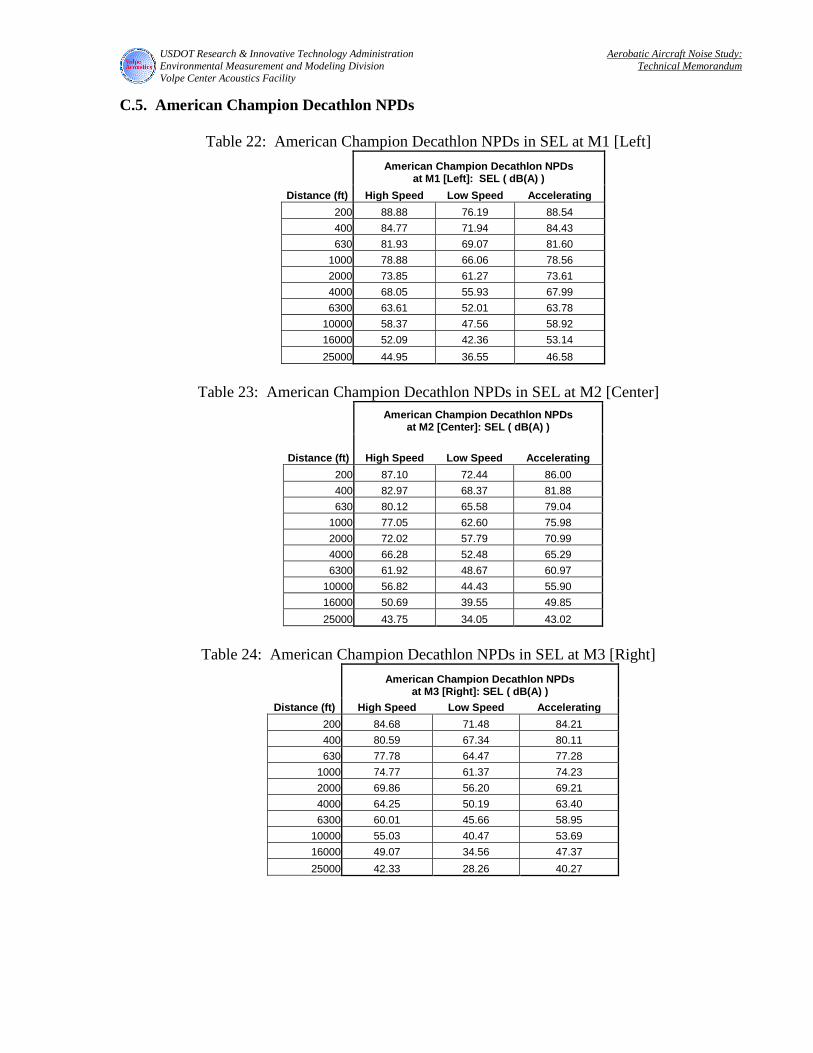
USDOT Research & Innovative Technology Administration Aerobatic Aircraft Noise Study: Environmental Measurement and Modeling Division Technical Memorandum
Volpe Center Acoustics Facility
C.5. American Champion Decathlon NPDs
Table 22: American Champion Decathlon NPDs in SEL at M1 [Left]
American Champion Decathlon NPDs
at M1 [Left]: SEL ( dB(A) )
Distance (ft) High Speed Low Speed Accelerating
200 88.88 76.19 88.54 400 84.77 71.94 84.43 630 81.93 69.07 81.60
1000 78.88 66.06 78.56 2000 73.85 61.27 73.61 4000 68.05 55.93 67.99 6300 63.61 52.01 63.78
10000 58.37 47.56 58.92 16000 52.09 42.36 53.14 25000 44.95 36.55 46.58
Table 23: American Champion Decathlon NPDs in SEL at M2 [Center]
American Champion Decathlon NPDs
at M2 [Center]: SEL ( dB(A) )
Distance (ft) High Speed Low Speed Accelerating
200 87.10 72.44 86.00 400 82.97 68.37 81.88 630 80.12 65.58 79.04
1000 77.05 62.60 75.98 2000 72.02 57.79 70.99 4000 66.28 52.48 65.29 6300 61.92 48.67 60.97
10000 56.82 44.43 55.90 16000 50.69 39.55 49.85 25000 43.75 34.05 43.02
Table 24: American Champion Decathlon NPDs in SEL at M3 [Right]
American Champion Decathlon NPDs
at M3 [Right]: SEL ( dB(A) )
Distance (ft) High Speed Low Speed Accelerating
200 84.68 71.48 84.21 400 80.59 67.34 80.11 630 77.78 64.47 77.28
1000 74.77 61.37 74.23 2000 69.86 56.20 69.21 4000 64.25 50.19 63.40 6300 60.01 45.66 58.95
10000 55.03 40.47 53.69 16000 49.07 34.56 47.37 25000 42.33 28.26 40.27
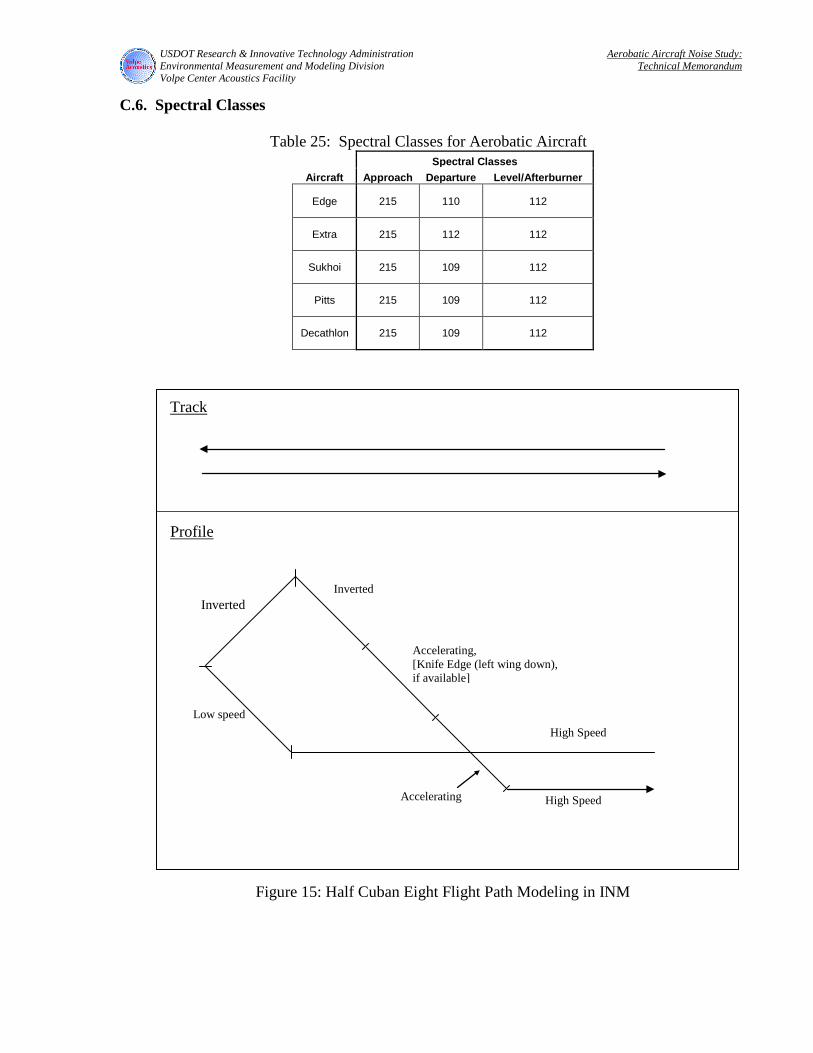
USDOT Research & Innovative Technology Administration Aerobatic Aircraft Noise Study: Environmental Measurement and Modeling Division Technical Memorandum
Volpe Center Acoustics Facility
C.6. Spectral Classes
Table 25: Spectral Classes for Aerobatic Aircraft Spectral Classes
Aircraft Approach Departure Level/Afterburner
Edge 215 110 112
Extra 215 112 112
Sukhoi 215 109 112
Pitts 215 109 112
Decathlon 215 109 112
Figure 15: Half Cuban Eight Flight Path Modeling in INM
Track
Profile
High Speed
High Speed
Low speed
Accelerating
Accelerating, [Knife Edge (left wing down), if available]
Inverted Inverted
USDOT Research & Innovative Technology Administration Aerobatic Aircraft Noise Study: Environmental Measurement and Modeling Division Technical Memorandum
Volpe Center Acoustics Facility
Appendix D. Data Analysis Summary The analysis of the aerobatic aircraft noise data was separated into two major tasks: the evaluation of the level-flight event data, and the comparison of the modeled results generated by INM with measured noise data for the full aerobatic sequences. The LAMAX values for all 82 level-flight events are plotted in Figure 16 through 20 according to aircraft type. The LAMAX metric was used for this comparison, so that the loudest noise events could be used as a basis of comparison between different types of level-flight events. For the Edge and the Sukhoi, the loudest of the six types of level-flight events were the knife edge events with the left wing down (94-97 dB(A) at M2 [Center] for the Edge, and 88-90 dB(A) at M2 [Center] for the Sukhoi). For the remaining aircraft, both the high speed and accelerating events were the loudest types of maneuvers (85-87 dB(A) at M2 [Center] for the Extra, 80-82 dB(A) at M2 [Center] for the Pitts, and 80-82 dB(A) at M2 [Center] for the Decathlon). For all five aircraft, the low speed events were the quietest of all six maneuvers (around 70-71 dB(A) at M2). By looking at the noise levels at M1 [Left], M2 [Center] and M3 [Right] separately for each event, M2 always resulted in the loudest noise levels due to its closer proximity to the aircraft during the level-flight events. The data also indicates a difference between the noise levels at M1 [Left] and M3 [Right], which can be attributed to aircraft directivity and to constant, relatively high cross winds coming from the West27. The level-flight data for all five aircraft were also compared against each other for each of the six event types. Overall, the Edge was the loudest of the five aircraft, closely followed by the Sukhoi. Although it varied slightly by event type, the Extra was typically the third loudest aircraft, then the Pitts. For all event types, the Decathlon was the quietest aircraft. This pattern was also reflected in the NPD data. The measured noise levels were then compared to results generated by INM for the level-flight events for the Extra, Pitts and Sukhoi aircraft. The results are plotted alongside the level-flight event data in Figure 17 for the Extra, Figure 18 for the Sukhoi and Figure 19 for the Pitts. To enhance this comparison, the difference between the modeled results and the average measured results for each of the six types of level-flight events are present in Figures 21 through 23. For the Pitts and the Sukhoi, this comparison shows good agreement between measured and modeled data for all of the maneuver types, with an average difference within +/-2 dB for each maneuver type. The Extra also shows good agreement between measured and modeled data for all of the maneuver types, with an average difference +/- 3 dB for each maneuver type. Measured noise levels were also compared to results generated by INM for the five aerobatic sequences. Since the main concern is with the overall noise produced by an aerobatic sequence, SEL values for each sequence were calculated and compared with corresponding measured data. The results are plotted in Figures 1 through 6, at the beginning of this technical memorandum. A detailed discussion of those results has already been presented. Given the measured SEL data for each aerobatic sequence, rough estimates of the day-night average sound levels (Ldn or DNL) due to those sequences can be made. In Tables 26 through 28, the estimated DNL values are presented for each aircraft, based on the loudest measured aerobatic
27 The cross winds were in compliance with the meteorological criteria in FAR 36 Appendix G.

USDOT Research & Innovative Technology Administration Aerobatic Aircraft Noise Study: Environmental Measurement and Modeling Division Technical Memorandum
Volpe Center Acoustics Facility
sequence for that aircraft repeated multiple times during daytime hours28. It is important to note that these estimated DNL values are based solely on the measured aerobatic routines, and did not take into account aircraft approaches/landings, aircraft departures/takeoffs, variations on the aerobatic routine, nighttime operations, other aircraft, or other noise sources. A detailed discussion of those results has already been presented.
28 DNL has a 10 dB penalty associated with nighttime noise levels.
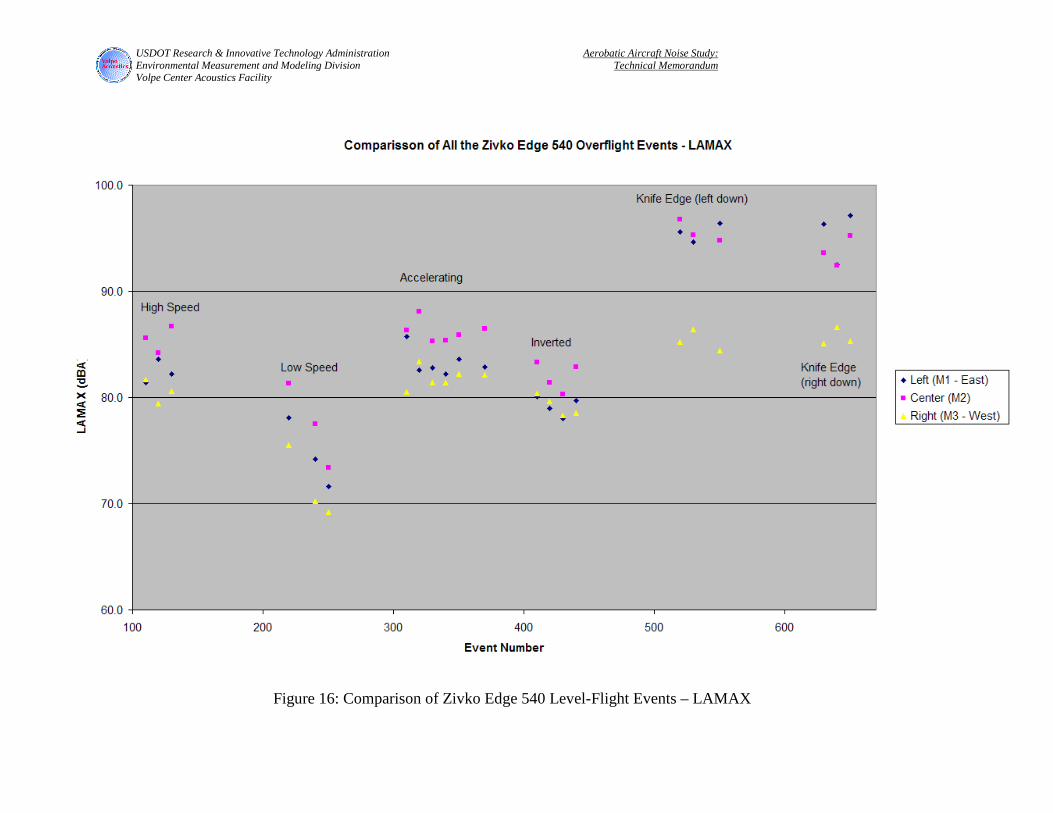
USDOT Research & Innovative Technology Administration Aerobatic Aircraft Noise Study: Environmental Measurement and Modeling Division Technical Memorandum
Volpe Center Acoustics Facility
Figure 16: Comparison of Zivko Edge 540 Level-Flight Events – LAMAX
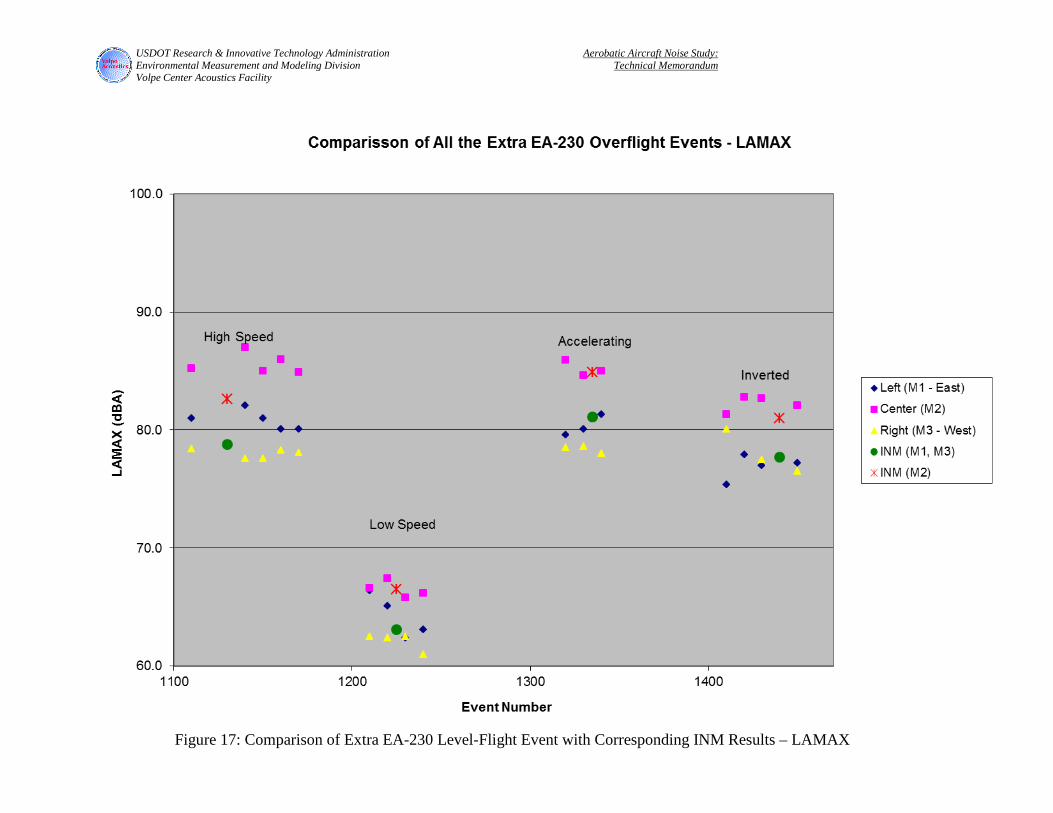
USDOT Research & Innovative Technology Administration Aerobatic Aircraft Noise Study: Environmental Measurement and Modeling Division Technical Memorandum
Volpe Center Acoustics Facility
Figure 17: Comparison of Extra EA-230 Level-Flight Event with Corresponding INM Results – LAMAX
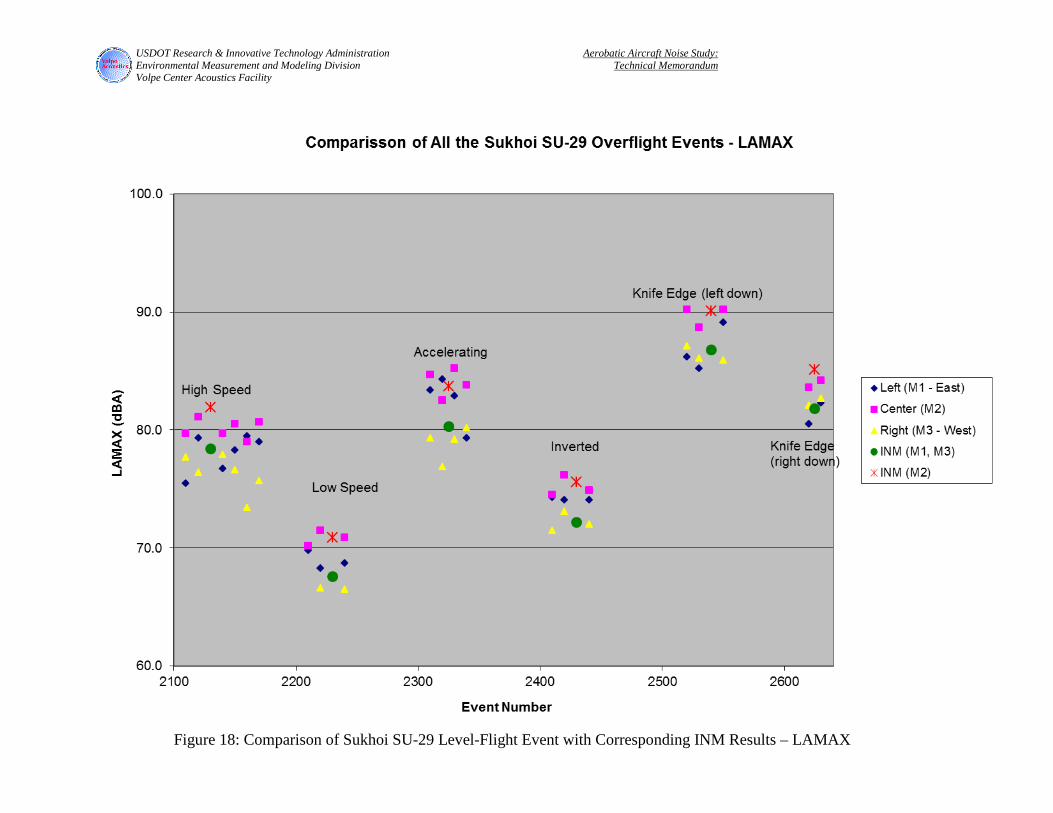
USDOT Research & Innovative Technology Administration Aerobatic Aircraft Noise Study: Environmental Measurement and Modeling Division Technical Memorandum
Volpe Center Acoustics Facility
Figure 18: Comparison of Sukhoi SU-29 Level-Flight Event with Corresponding INM Results – LAMAX
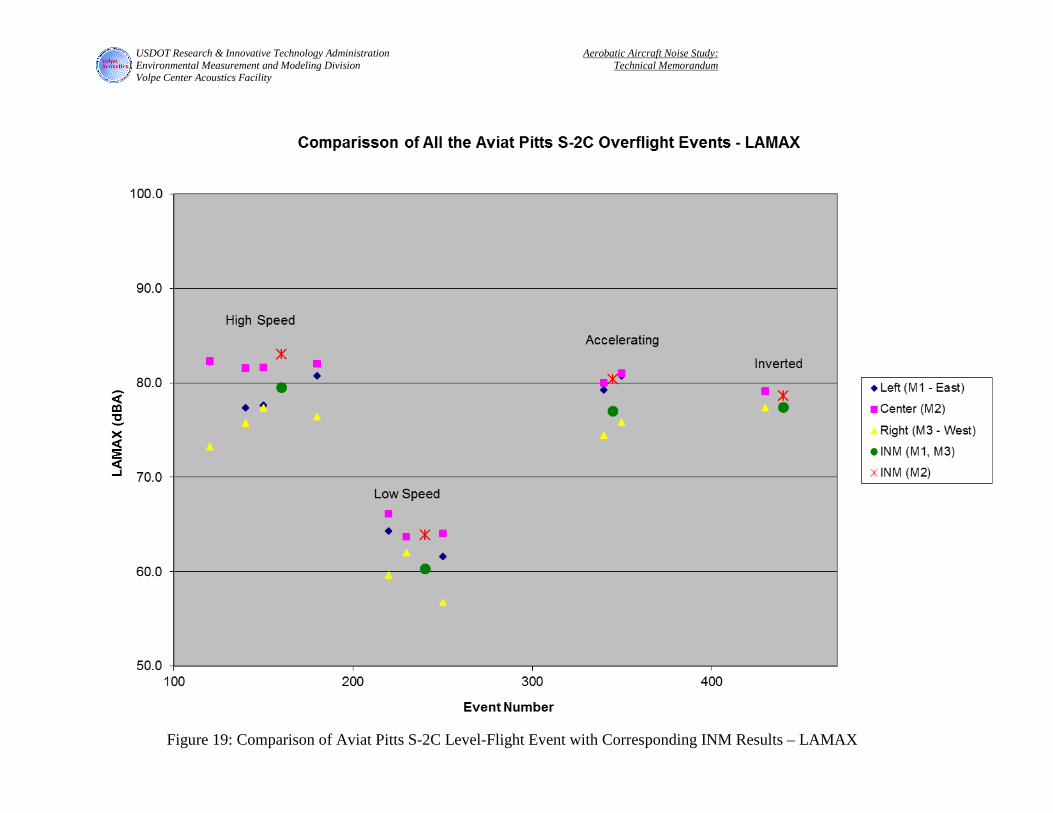
USDOT Research & Innovative Technology Administration Aerobatic Aircraft Noise Study: Environmental Measurement and Modeling Division Technical Memorandum
Volpe Center Acoustics Facility
Figure 19: Comparison of Aviat Pitts S-2C Level-Flight Event with Corresponding INM Results – LAMAX
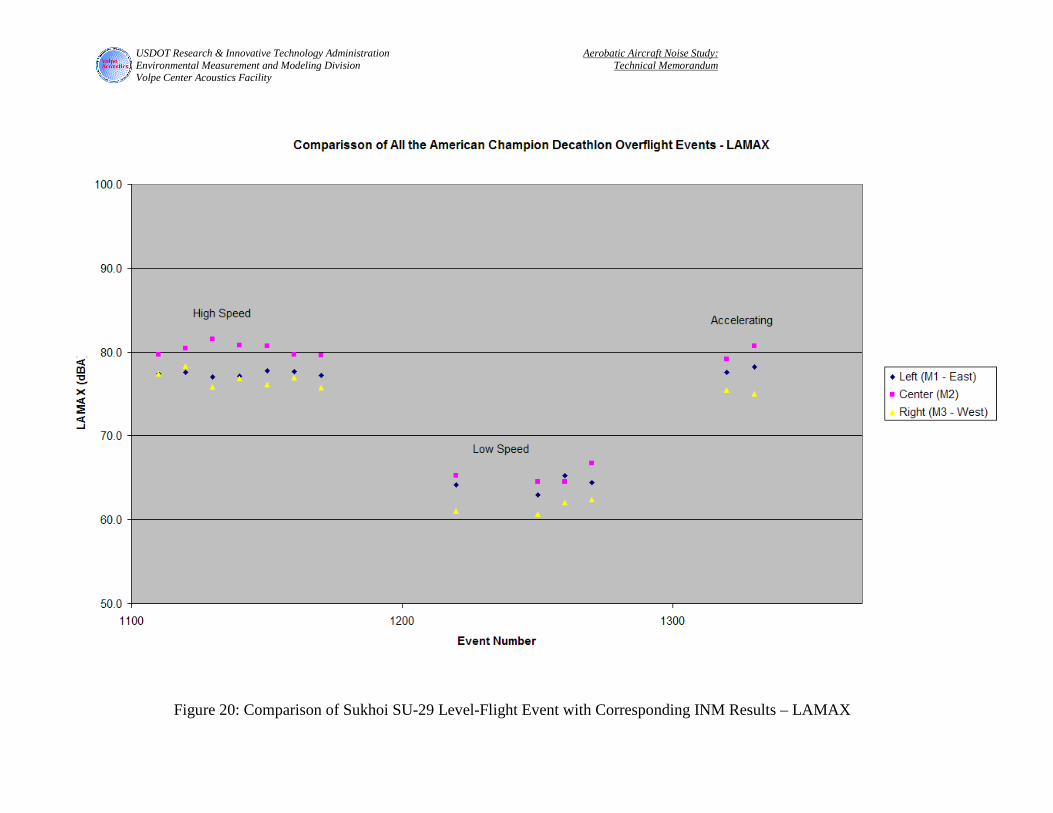
USDOT Research & Innovative Technology Administration Aerobatic Aircraft Noise Study: Environmental Measurement and Modeling Division Technical Memorandum
Volpe Center Acoustics Facility
Figure 20: Comparison of Sukhoi SU-29 Level-Flight Event with Corresponding INM Results – LAMAX
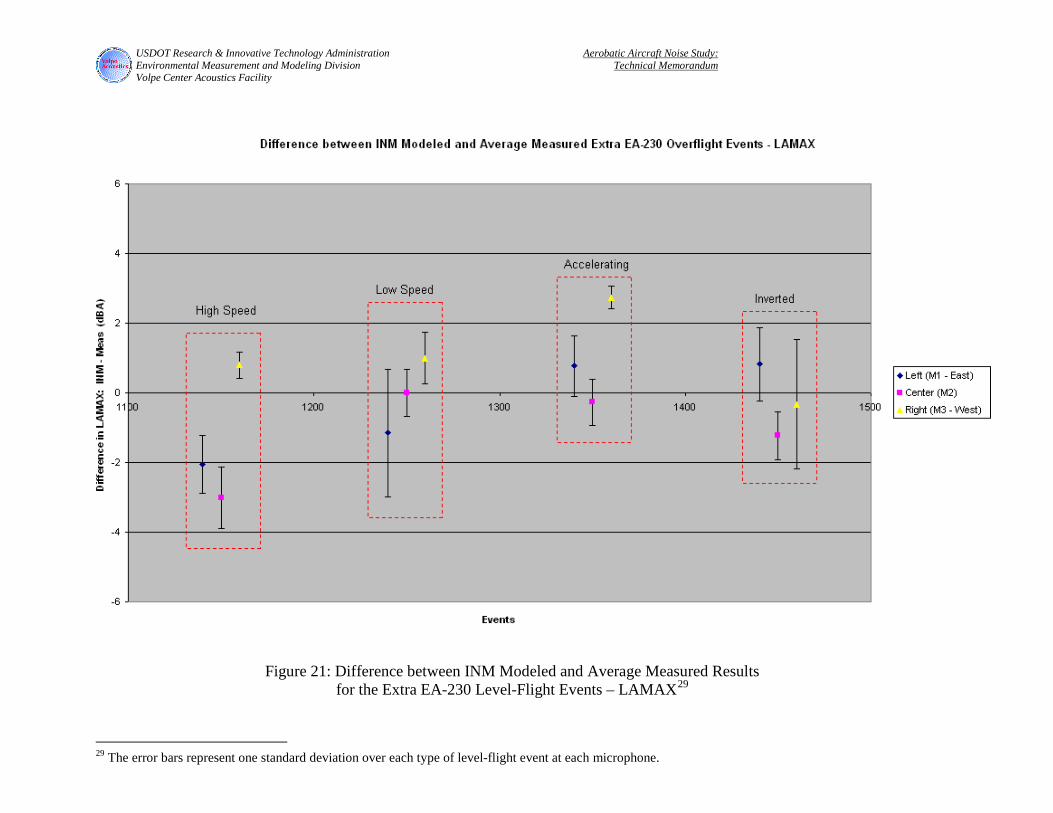
USDOT Research & Innovative Technology Administration Aerobatic Aircraft Noise Study: Environmental Measurement and Modeling Division Technical Memorandum
Volpe Center Acoustics Facility
Figure 21: Difference between INM Modeled and Average Measured Results
for the Extra EA-230 Level-Flight Events – LAMAX29
29 The error bars represent one standard deviation over each type of level-flight event at each microphone.

USDOT Research & Innovative Technology Administration Aerobatic Aircraft Noise Study: Environmental Measurement and Modeling Division Technical Memorandum
Volpe Center Acoustics Facility
Figure 22: Difference between INM Modeled and Average Measured Results
for the Aviat Pitts S-2C Level-Flight Events – LAMAX
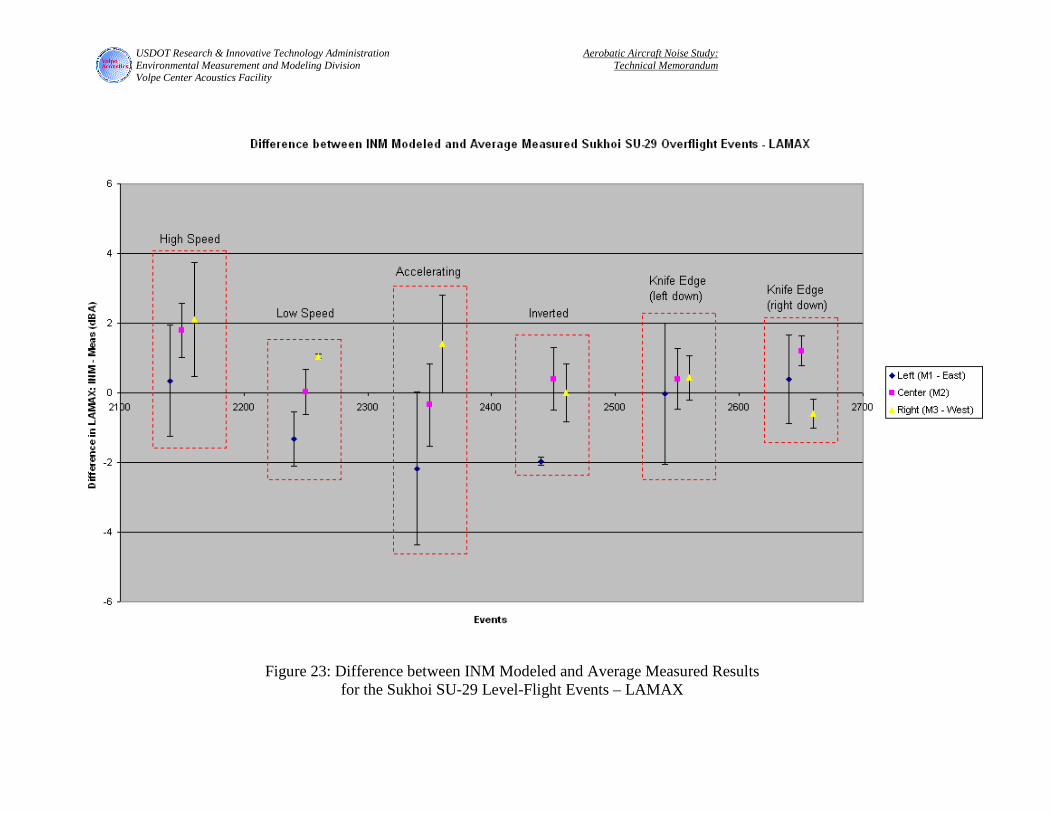
USDOT Research & Innovative Technology Administration Aerobatic Aircraft Noise Study: Environmental Measurement and Modeling Division Technical Memorandum
Volpe Center Acoustics Facility
Figure 23: Difference between INM Modeled and Average Measured Results
for the Sukhoi SU-29 Level-Flight Events – LAMAX
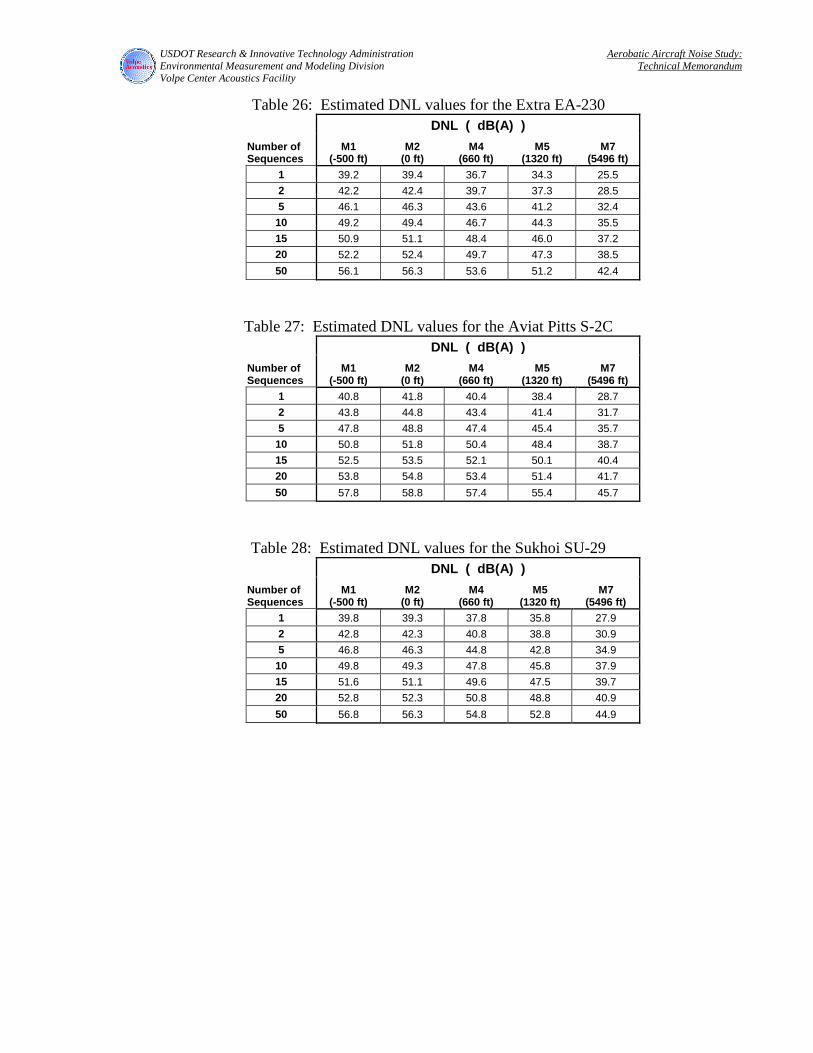
USDOT Research & Innovative Technology Administration Aerobatic Aircraft Noise Study: Environmental Measurement and Modeling Division Technical Memorandum
Volpe Center Acoustics Facility
Table 26: Estimated DNL values for the Extra EA-230 DNL ( dB(A) )
Number of Sequences
M1 (-500 ft)
M2 (0 ft)
M4 (660 ft)
M5 (1320 ft)
M7 (5496 ft)
1 39.2 39.4 36.7 34.3 25.5 2 42.2 42.4 39.7 37.3 28.5 5 46.1 46.3 43.6 41.2 32.4
10 49.2 49.4 46.7 44.3 35.5 15 50.9 51.1 48.4 46.0 37.2 20 52.2 52.4 49.7 47.3 38.5 50 56.1 56.3 53.6 51.2 42.4
Table 27: Estimated DNL values for the Aviat Pitts S-2C DNL ( dB(A) )
Number of Sequences
M1 (-500 ft)
M2 (0 ft)
M4 (660 ft)
M5 (1320 ft)
M7 (5496 ft)
1 40.8 41.8 40.4 38.4 28.7 2 43.8 44.8 43.4 41.4 31.7 5 47.8 48.8 47.4 45.4 35.7
10 50.8 51.8 50.4 48.4 38.7 15 52.5 53.5 52.1 50.1 40.4 20 53.8 54.8 53.4 51.4 41.7 50 57.8 58.8 57.4 55.4 45.7
Table 28: Estimated DNL values for the Sukhoi SU-29 DNL ( dB(A) )
Number of Sequences
M1 (-500 ft)
M2 (0 ft)
M4 (660 ft)
M5 (1320 ft)
M7 (5496 ft)
1 39.8 39.3 37.8 35.8 27.9 2 42.8 42.3 40.8 38.8 30.9 5 46.8 46.3 44.8 42.8 34.9
10 49.8 49.3 47.8 45.8 37.9 15 51.6 51.1 49.6 47.5 39.7 20 52.8 52.3 50.8 48.8 40.9 50 56.8 56.3 54.8 52.8 44.9
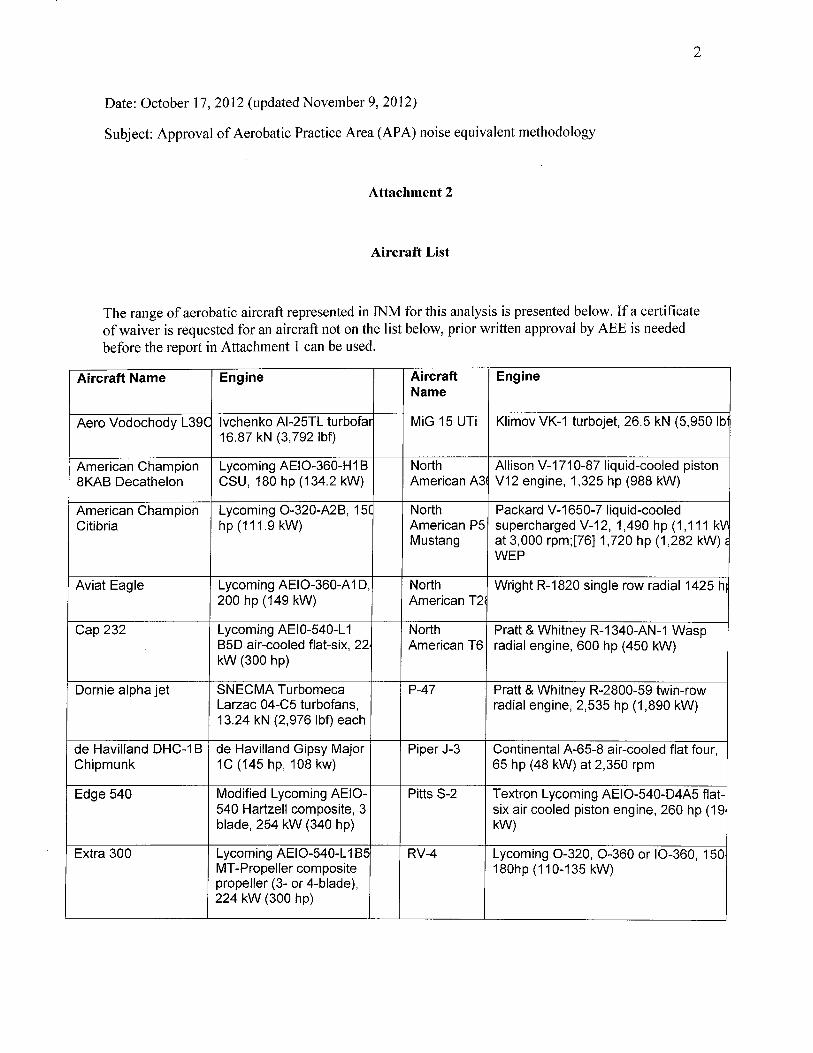
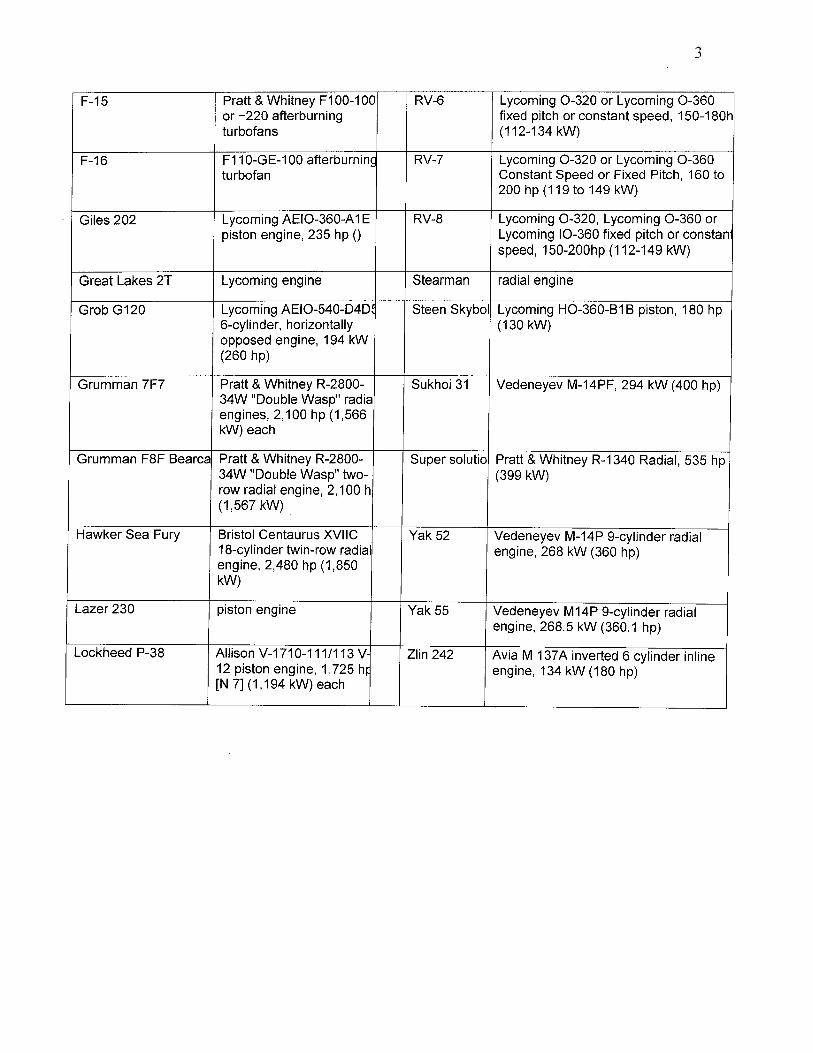
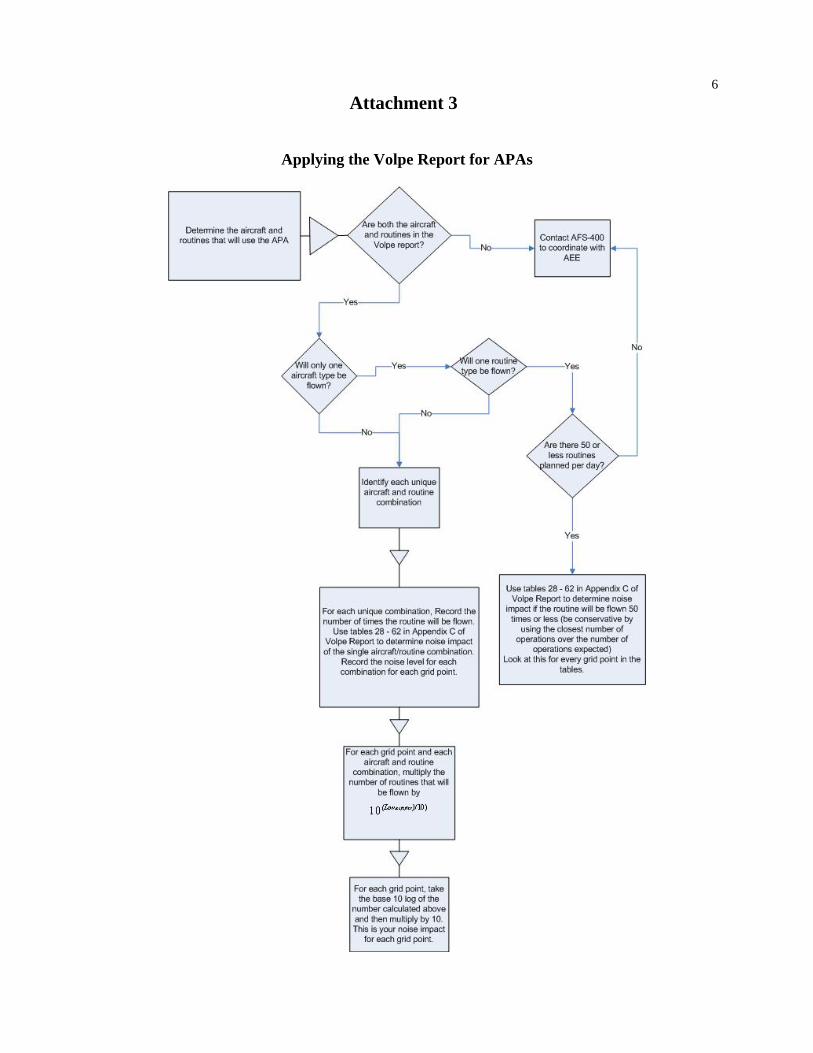
6
Attachment 3
Applying the Volpe Report for APAs