Embed Size (px)
DESCRIPTION
Approaches to influencing energy saving without capital investments. Joanna Simpson, University of Cambridge David Green, University of Cambridge Mate Lorincz, University of Keele. Estates & Operations. Agenda. Introduction - PowerPoint PPT Presentation
Citation preview

1
Joanna Simpson, University of CambridgeDavid Green, University of CambridgeMate Lorincz, University of Keele
Estates & Operations
Approaches to influencing energy saving without capital investments

2
Agenda
Introduction
Electricity Incentivisation Scheme (EIS) at the University of Cambridge
How has the EIS influenced behaviour? A case study from the Department of Engineering at the University of Cambridge
The relationship between personal values and energy efficiency. A case study from the University of Keele
Q&A and discussion

3
Energy and Carbon Reduction Project
Supports implementation of the Carbon Management Plan
Five pilot departmentsLearning to be rolled out across the estate
£2M per annum budget
Energy dashboard
Engagement activities
Gurdon Institute
Library
Engineering
Chemistry
Plant Sciences

4
What is the Electricity Incentivisation Scheme?
Financial incentives to use electricity more efficiently
Annual allowances at departmental level
Financial reward if use less than allowance
Financial penalty if exceed allowance
Implemented 1 August 2008

5
How does it work?
Value of any saving or cost made using the University’s average electricity price
Quarterly reports sent to departments
Financial transactions made once a year by the Finance Division
Cost neutral to the central chest
Scheme originally approved by Resource Management Committee (RMC)
Annual targets approved by and results reported to RMC

6
How does it work?
Annual allowances (August – July) are based on historic data
2008/09 allowances were equal to 2007/06 plus 3%
2009/10 and 2011/12 allowances were based on the average of the target and the actual consumption for the previous year, plus an uplift of 2%
Post 2011/12 allowances now capped at 2009/10 usage.
Newly occupied buildings - “settling down” period (3 years) before setting the baseline target

7
Measures of success
Prior to 2008, electricity consumption was increasing at around 4% per annum
In 2010/11 electricity usage was 4.4% below target, saving:
£0.51 million
4,950 MWh
2,678 tonnes CO2
Raised profile of electricity consumption and carbon is now in annual University planning round

8
University wide results
2005/06 (baseline)
2008/09 2009/10 2010/11 2011/1250000
100000
150000
200000
250000
300000
Research income (£000's)
Electricity con-sumption (MWh)
9
University wide results
2005/06 (baseline)
2008/09 2009/10 2010/11 2011/12300
350
400
450
500
550
Electricity consumption (MWh) per £M of research income
Electricity consumption (MWh) per £M of research income (ad-justed for inflation)

10
Departmental examples
William Gates Building - 12mth Rolling Average Electricity Usage
0
20
40
60
80
100
120
140
160
180Ju
l-08
Sep
-08
Nov
-08
Jan-
09
Mar
-09
May
-09
Jul-0
9
Sep
-09
Nov
-09
Jan-
10
Mar
-10
May
-10
Jul-1
0
Sep
-10
Nov
-10
Jan-
11
Mar
-11
May
-11
Jul-1
1
Sep
-11
Nov
-11
Jan-
12
Mar
-12
May
-12
Jul-1
2
MW
h
Not an ECRP Pilot
LED lighting and power supply trials
Power-down public computer workstations
sub-metering
Server Virtualisation
William Gates Building Electricity consumption – 12 month moving average
Reduced consumption by 26% since the start of EIS

11
Departmental examples
2011/12Two departments received approximately £27,000
One department was charged almost £70,000

12
Challenges and lessons learnt
Agreeing annual allowances
Dealing with new academic activity
Senior level support
Keep it simple – reduced administration burden by using existing electricity metering infrastructure and floor space allocation data
Communication – at all levels

13
Case Study – Department of Engineering
Background
Accounts for around 10% of university.
Activities based in 7 buildings.
Around 600 members of staff – academic, research, administrative and technical roles.
Four year MEng course – around 1,200 students.
Postgraduate students numbers:
2011 (792)
2012 (830)

14
Engineering Year 1 (2007-2008)
Pre EIS levels indicated year on year increase, typically around 8%.
Energy review arrangements - ad hoc and typically linked to plant replacement.
Engineering’s bill for 2007-2008 was £35k.
High consumption buildings.
Energy intensive activities.

15
Review of Energy Usage
Historical and current
Building maintenance staff.
Consultant based surveys.
Summer student appointments included:
IES-VE modelling of buildingsPV Survey
Façade Optimisation
-0.50
0.00
0.50
1.00
1.50
2.00
2.50
3.00
3.50
4.00
4.50
Jan Feb Mar Apr May Jun Jul Aug Sep Oct Nov Dec
Mon
thly
hea
ting
dem
and
(ISG
-01-
13) M
Wh/
mon
th
Baseline
135mm Celotex

16
Committees & Communications
Energy and Environmental Committees established.
Regular agenda item at existing committees – Council, Staff, Safety etc.
Promote energy performance and sustainability at all levels.
Embrace interest shown from students and staff.
Student and staff involvement: MEng projects, research, undergraduate teaching modules established.

17
Teaching and Research
Teaching
4th year MEng projects include: fabric optimisation, PV modelling.3rd year renewable module – PV inverter technologies, string and micro.MPhil Energy Technology – PV and Dashboard.Many 4th Year MEng projects are environmental based and popular.
Research
Doubly fed generator.PV micro inverter technology.Cleaning of emissions from combustion processes.Fuel efficiency in IC engines and compressors.Sustainable Development Group.
Student Organisations &University Projects
GreenBRIDGELiving Laboratory for Sustainability.
18
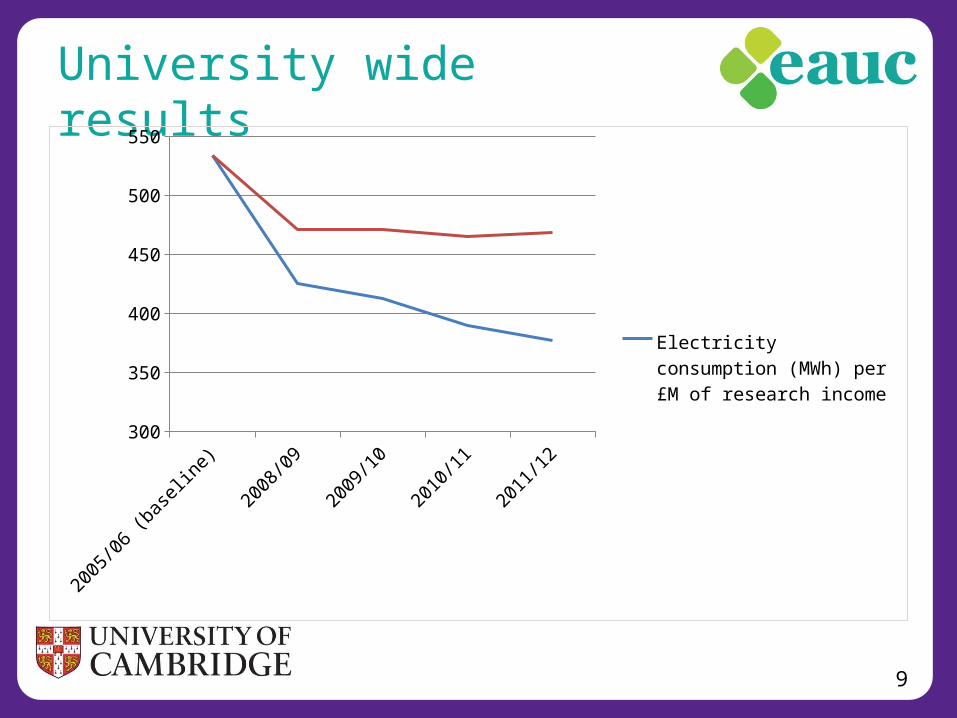
Visibility of Building Performance
Introduction of Energy Dashboard.
Visibility of actual building performance.
Digital signage.
Encourage individuals to ‘own’ and take responsibility.
‘Buy-in’ now apparent in some equipment purchases.
Data being used in undergraduate teaching exercises.

19
DEC / EPC Improvements
Completed Schemes include:
Centralisation of compressed air plant (38t C02 pa).Update of heating boilers (115t C02 pa).Centralisation and efficiency of Data Centres (£75k, 200t C02 pa).
Planned Schemes include:
Air conditioning and AHU control.Heating distribution.Centralisation of chilled water plant.

20
Energy and Carbon Reduction Project (ECRP)
Lead pilot department.
Current projects include:
Energy Roof
Upgrade of chilled water supply
Measurement of plug loads and dashboard
Control of air conditioners
Strong links with research activities e.g. building physics, power electronics.
Sharing of information with Estate Management, other departments and colleges.
Presentation at higher education and industry based seminars.
Departmental engagement key.

21
Energy Roof
Analysis
IES-VE modelling of buildingfabric performance.
Review and optimisation of PV panels and inverter types.
Direct DC power usage.
Installation
Insulation savings 46%.
61,188 kWh maximum yield from PV.
Data will be used to support undergraduate teaching.

22
Façade Optimisation
PhD Student - Glass & Façade Group
Analysis
• Current performance and assessment of strategies.
• Building energy optimisation algorithms.
• Based on defined parameters: user comfort, carbon and payback.
Results
• Payback in £, carbon, comfort?• Wall window ratios 20-70%.

23
Building Performance
[1] Based on combined gas and electricity consumptions for the period Aug 2011 to July 2012[2] Includes kWh associated with biomass boiler (based on delivered volumes of wood pellets).
Building Nett Usable Space
2011/12 Energy Consumption
kWh [1]
kWh/m2
Baker 9351 m2 2,838,095 304
Inglis 9198 m2 2,791,659 304
Electrical Engineering 3286 m2 2,944,185 896
Alan Reece 3154 m2 1,237,257 392[2]
Nanoscience Centre 1140 m2 2,198,974 1,929
Whittle Laboratory 1695 m2 1,394,337 823
Schofield Centre 1082 m2 286,721 265

24
Current Energy Performance

25
Next steps?
Implementation of ECRP schemes in new buildings.
Low voltage distribution circuits and lighting.
Further fabric performance modelling.
Review and update of control algorithms for plant including Data Centres.
Transfer of some environmental control to end users.

26
If you don’t do anything else…
Your ‘aha’ moment
Data collection and visibility
Financial rewards/penalties