Embed Size (px)
Citation preview
1
Chapter 2
Commostrum hictati onsequas apiciis alicto estrunt.Aximus ilita sum quost accaepe nullore nos ut rem qui con prestio. Iquoditet
voluptur? Udanimet, simagniet is excepernat ulpa amus, ut et lam, comnienim comnim ent optae est, que rehende llabore ratibusam, nonsedis min consenis in
comniae landam fugia sum eos de volendion repellupis nobita sunt voluptaeEped minctum eicit, simusa volenis natio. Ut lia que cuptaspit et perati apietur, simint ex et aspelib uscitia net quundam, ipis excepuditat ea quatint.Ut ut et andio imus mos nis
suntet et ex eost quid quis et am essini consend iasperi orehent ut experfe rescia
Approach
MASSACHUSETTS 2050 DECARBONIZATION ROADMAP
A report commissioned by the Massachusetts Executive Office of Energy and Environmental Affairs to identify cost-effective and equitable strategies to ensure Massachusetts achieves net-zero greenhouse gas emissions by 2050.
December 2020
2
Project TeamThis report was written by a project team composed of individuals from the Executive Office of Energy and Environmental Affairs and The Cadmus Group.
Executive Office of Energy and Environmental Affairs
The Cadmus Group
David IsmayBenjamin MillerHong-Hanh Chu Claire Miziolek
Michael Walsh
Aurora Edington
Liz Hanson
Debra Perry
Chad Laurent
Acknowledgements
Many additional partners assisted in the foundational analysis and advisory process throughout the 2050 Decarbonization Roadmap Study. The Project team would like to thank members of the Global Warming Solutions Act Implementation Advisory Committee (IAC) and IAC Work Groups for their contribution to the study. Additionally, the Project Team would like to thank the following:
Technical Steering Committee
Ajla Aksamija, UMass Amherst
Ali Malkawi, Harvard
Betar Gallant, MIT
Christopher Knittel, MIT
Christoph Reinhart, MIT
David Cash, UMass Boston
Desiree Plata, MIT
Gilbert Metcalf, Tufts
Gina McCarthy, Formerly at Harvard
Eric Gonzales, UMass Amherst
Heidi Peltier, Boston University
Jennie Stephens, Northeastern
Jesse Jenkins, Formerly at Harvard
Jonathan Buonocore, Harvard School of Public Health
Kelly Sims Gallagher, Tufts
Michael Ahern, Worchester Polytechnical Institute
Patricia Fabian, Boston University
Pamela Templer, Boston University
Randall Field, MIT
Suchi Gopal, Boston University
Sumeeta Srinivasan, Tufts
Analytic Contributors
The Cadmus Group
Evolved Energy Research
Harvard Forest
Arup
VEIC
Resource Systems Group, Inc.
Converge Strategies
Advanced Energy Group
Jonathan Krones
Wendy Cohen
Leah Jacobs
3
°C Degrees Celsius
°F Degrees Fahrenheit
ASHP Air-Source Heat Pump
BEV Battery Electric Vehicle
CCS Carbon Capture and Storage
CDR Carbon Dioxide Removal
CES Clean Energy Standard
CH4 Methane
CO2 Carbon Dioxide
DER Distributed Energy Resources
EEA Massachusetts Executive Office of Energy and Environmental Affairs
EJ Environmental Justice
EV Electric Vehicle
GHG Greenhouse Gas
GSHP Ground-Source Heat Pump
GWP Global Warming Potential
GWSA Global Warming Solutions Act
ICE Internal Combustion Engine
LDV Light-Duty Vehicle
MDHDV Medium- and Heavy-Duty Vehicle
MMTCO2e Million Metric ton (tonne) of CO
2e
N2O Nitrous Oxide
PM2.5
Particulate Matter (2.5 micrometers or less)
PV Photovoltaic
RPS Renewable Portfolio Standard
VMT Vehicle Miles Traveled
W Watt
Wh Watt-hour
ZEV Zero Emissions Vehicle
State Agency Staff
Alexis Washburn, DOER
Ariel Horowitz, MassCEC
Dan Gatti, EEA
Elizabeth Kennedy Cleveland, MassCEC
Eric Steltzer, DOER
Galen Nelson, MassCEC
Ian Finlayson, DOER
Joanna Troy, DOER
John Mirandette, DOER
Jules Williams, MassDOT
Kate Tohme, DPU
Kurt Gaertner, EEA
Marian Swain, DOER
Megan Wu, DPU
Peter McPhee, MassCEC
Robert O'Connor, EEA
Samantha Meserve, DOER
Sharon Weber, MassDEP
Steve Woelfel, MassDOT
William Space, MassDEP
Willam VanDoren, DCR
Acronyms

4
From coast to coast, the impacts of a changing climate are already on full display in the United States. Here in Massachusetts, climate change presents unique challenges, from intense heat waves and droughts, storm surges and flooding, to increases in insect-related diseases such as Eastern Equine Encephalitis and West Nile Virus. The climate crisis is a generational challenge that, without decisive action, leaves residents and communities across the state on the front lines. Recognizing the urgency of this crisis, the Baker-Polito Administration listened to the science, and set Massachusetts on an aggressive path to Net Zero greenhouse gas emissions by 2050
Reducing emissions to achieve Net Zero by 2050 is the Commonwealth’s primary and most important line of defense in preventing the significant threats presented by a changing climate. To achieve this target in a cost-effective and equitable manner, the Baker-Polito Administration launched a comprehensive process to chart pathways and strategies to meet this ambitious commitment. The resulting process, culminating in the 2050 Decarbonization Roadmap, included significant stakeholder engagement, science-based analysis, and a focus on reducing costs for residents and businesses while maintaining a healthy, thriving economy.
Addressing climate change will also protect the Massachusetts economy, as analysis from the U.S. Environmental Protection Agency in 2015 found that reducing emissions will save the Northeast region at least $3 billion per year by 2050 and $42 billion per year by 2090. The 2050 Decarbonization Roadmap also makes clear that achieving Net Zero emissions will lead to the creation of thousands of local jobs while dramatically improving air quality and public health.
At a time when the nation and the world are grappling with a global pandemic, we are reminded that climate change presents a still greater long-term threat, and one for which there will be no vaccine. Achieving Net Zero by 2050 will require deep change and out-of-the-box thinking, and this report underscores the importance of local and regional partnerships to build stronger, more resilient communities, nation-leading clean energy jobs, and a vibrant economy.
Sincerely,
Kathleen Theoharides Secretary of Energy and Environmental Affairs
Letter from the Secretary
4
Table of Contents
1.
2.
3.
4.
6.
Letter from the Secretary
Project Overview and Mission
Approach
Transitioning to Net Zero in 2050
Strategies to Achieve Net Zero
Appendices
Analytical Approach
Equity Considerations for Deep Decarbonization
Stakeholder Engagement
Light-Duty Transportation
Medium- and Heavy-Duty Transportation, Aviation, and Shipping
Residential and Commercial Buildings
Electricity and Energy
Non-Energy and Industry
Natural Carbon Sequestration
Additional Carbon Dioxide Removal
6
19
28
5. Getting to Net Zero: Implications for Policy and Action 81
84
10
Glossary
Modeling and Emissions Accounting of Biogenic Fuels
34394455677278
8588
111718

6
Project Overview and Mission
Chapter 1
v
7
How can the Commonwealth achieve Net Zero while
maintaining a healthy, equitable, and thriving economy?
1 Following the Governor’s Net Zero declaration during his January 21, 2020 State of the Commonwealth address, and pursuant to authority granted by the GWSA, the Executive Office of Energy and Environmental Affairs set the Commonwealth’s 2050 statewide emissions limit to require achievement of Net Zero emissions by 2050, defined as: “A level of statewide greenhouse gas emissions that is equal in quantity to the amount of carbon dioxide or its equivalent that is removed from the atmosphere and stored annually by, or attributable to, the Commonwealth; provided, however, that in no event shall the level of emissions be greater than a level that is 85 percent below the 1990 level.” See Figure 1 for an illustration.
In order to answer that question, this Roadmap Report synthesizes the Roadmap Study’s expansive analytical effort. The full Roadmap Study included integrated, cross-sector energy system analysis (Figure 1) exploring eight distinct emissions reductions “pathways” to 2050, each capable of supporting the achievement of Net Zero emissions statewide in 2050.
Under the Baker-Polito Administration, and within the framework of the Global Warming Solutions Act (GWSA), the Commonwealth of Massachusetts has committed to achieving Net Zero greenhouse gas (GHG) emissions by 2050.1 Commissioned by the Executive Office of Energy and Environmental Affairs (EEA), the 2050 Decarbonization Roadmap Study (Roadmap Study) was designed to support the Commonwealth in this goal and culminates in this 2050 Decarbonization Roadmap Report (Roadmap Report). The goal of the Roadmap Study was to provide the Commonwealth with a comprehensive understanding of the necessary strategies and transitions in the near- and long-term to achieve Net Zero by 2050 using best-available science and research methodology. It also sought to understand the tradeoffs across different pathways to reach the levels of deep decarbonization required by that limit. The Roadmap Study will inform EEA’s determination of the Commonwealth’s interim 2030 emissions limit as well as the forthcoming Clean Energy and Climate Plan for 2030 (2030 CECP), the Commonwealth’s policy action plan to equitably and cost-effectively achieve the 2030 limit while maximizing Massachusetts’ ability to achieve Net Zero by 2050.
The Roadmap Study set out to address many complex issues related to statewide deep decarbonization, but maintained focus on one core question to guide analysis:

8
It also comprised four sector-specific analyses focused on buildings, transportation, non-energy emissions, and the carbon sequestration potential of Massachusetts’ natural and working lands, as well as a separate economic and health impact analysis. The companion technical reports and appendices for each of those elements of the Roadmap Study provide additional detail, context, and analysis that serve as the foundation for the information presented here.
Figure 1. Net Zero requires deeper emissions reductions than the Commonwealth’s previous “80% by 2050” target, as well as a new requirement to balance any remaining emissions with the same amount of carbon removal from the atmosphere.
9
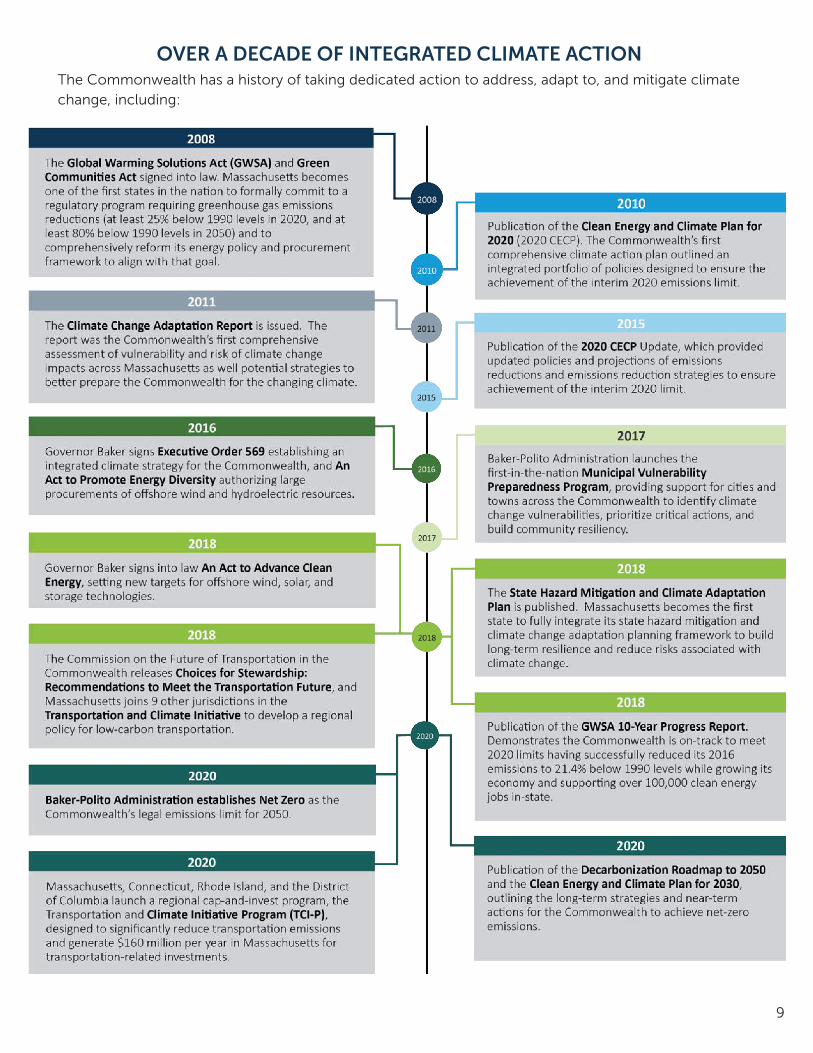
OVER A DECADE OF INTEGRATED CLIMATE ACTIONThe Commonwealth has a history of taking dedicated action to address, adapt to, and mitigate climate change, including:

10
v
Approach
Chapter 2
11
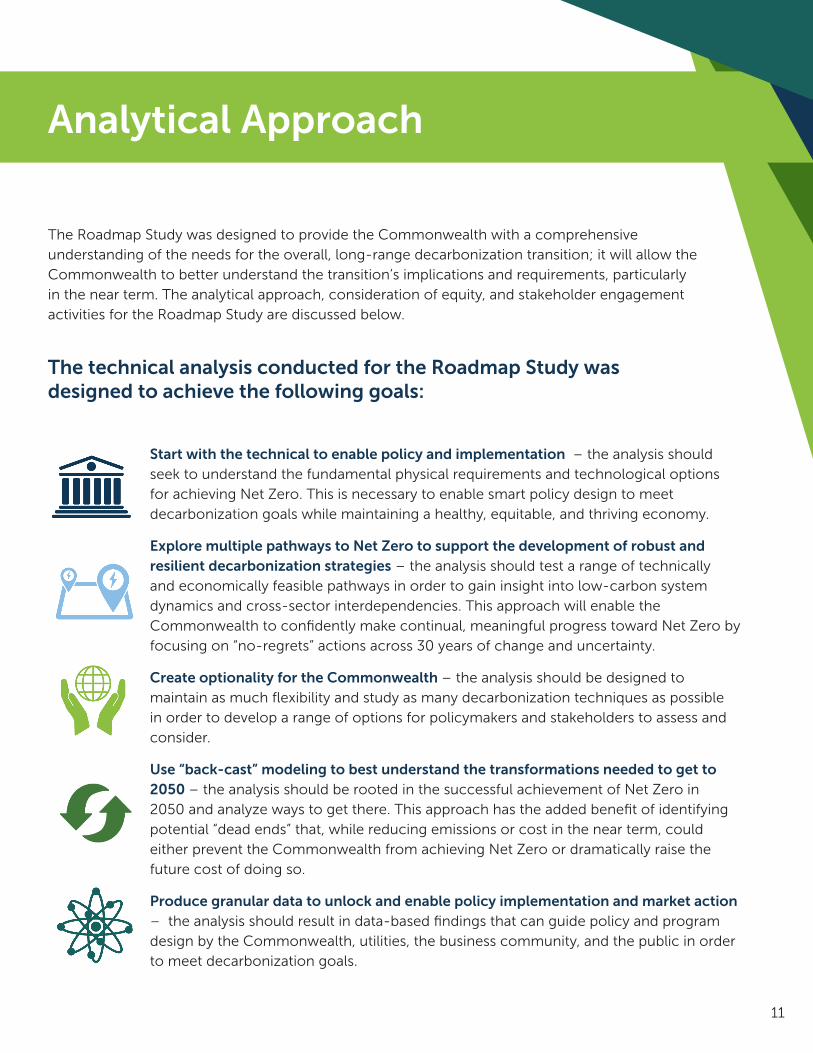
The technical analysis conducted for the Roadmap Study was designed to achieve the following goals:
Start with the technical to enable policy and implementation – the analysis should seek to understand the fundamental physical requirements and technological options for achieving Net Zero. This is necessary to enable smart policy design to meet decarbonization goals while maintaining a healthy, equitable, and thriving economy.
Explore multiple pathways to Net Zero to support the development of robust and resilient decarbonization strategies – the analysis should test a range of technically and economically feasible pathways in order to gain insight into low-carbon system dynamics and cross-sector interdependencies. This approach will enable the Commonwealth to confidently make continual, meaningful progress toward Net Zero by focusing on “no-regrets” actions across 30 years of change and uncertainty.
Create optionality for the Commonwealth – the analysis should be designed to maintain as much flexibility and study as many decarbonization techniques as possible in order to develop a range of options for policymakers and stakeholders to assess and consider.
Use “back-cast” modeling to best understand the transformations needed to get to 2050 – the analysis should be rooted in the successful achievement of Net Zero in 2050 and analyze ways to get there. This approach has the added benefit of identifying potential “dead ends” that, while reducing emissions or cost in the near term, could either prevent the Commonwealth from achieving Net Zero or dramatically raise the future cost of doing so.
Produce granular data to unlock and enable policy implementation and market action – the analysis should result in data-based findings that can guide policy and program design by the Commonwealth, utilities, the business community, and the public in order to meet decarbonization goals.
Analytical Approach
The Roadmap Study was designed to provide the Commonwealth with a comprehensive understanding of the needs for the overall, long-range decarbonization transition; it will allow the Commonwealth to better understand the transition’s implications and requirements, particularly in the near term. The analytical approach, consideration of equity, and stakeholder engagement activities for the Roadmap Study are discussed below.
12
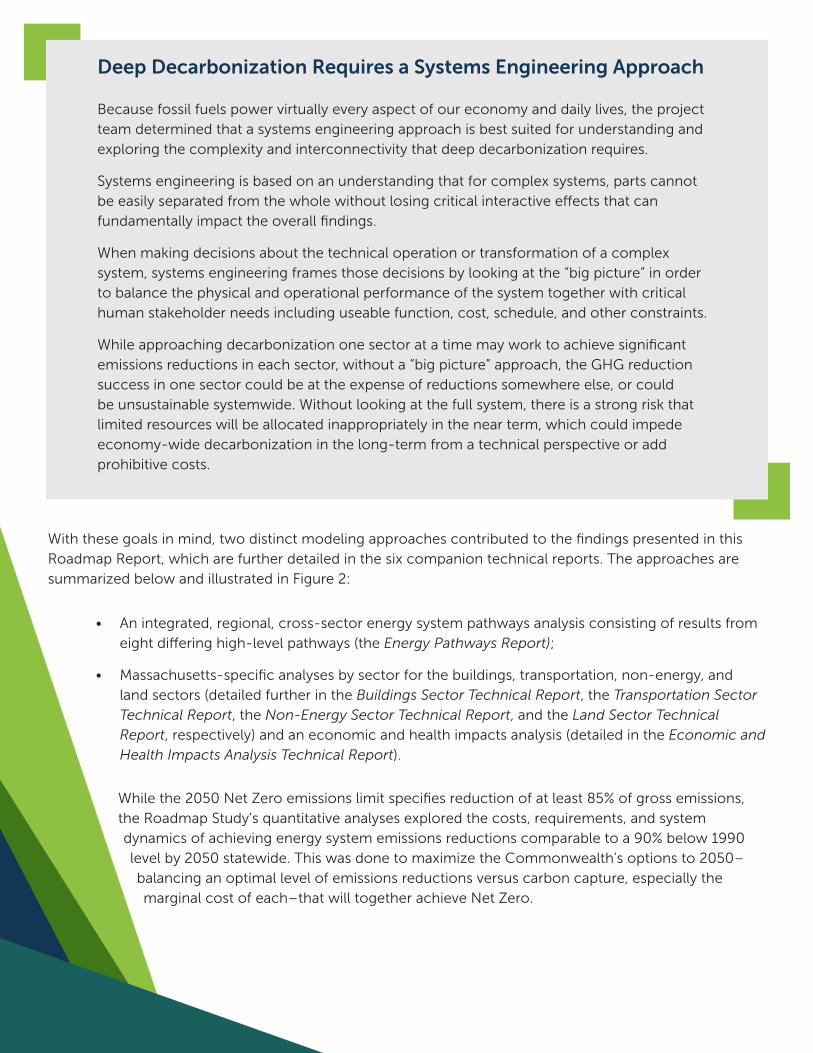
Because fossil fuels power virtually every aspect of our economy and daily lives, the project team determined that a systems engineering approach is best suited for understanding and exploring the complexity and interconnectivity that deep decarbonization requires.
Systems engineering is based on an understanding that for complex systems, parts cannot be easily separated from the whole without losing critical interactive effects that can fundamentally impact the overall findings.
When making decisions about the technical operation or transformation of a complex system, systems engineering frames those decisions by looking at the “big picture” in order to balance the physical and operational performance of the system together with critical human stakeholder needs including useable function, cost, schedule, and other constraints.
While approaching decarbonization one sector at a time may work to achieve significant emissions reductions in each sector, without a “big picture” approach, the GHG reduction success in one sector could be at the expense of reductions somewhere else, or could be unsustainable systemwide. Without looking at the full system, there is a strong risk that limited resources will be allocated inappropriately in the near term, which could impede economy-wide decarbonization in the long-term from a technical perspective or add prohibitive costs.
Deep Decarbonization Requires a Systems Engineering Approach
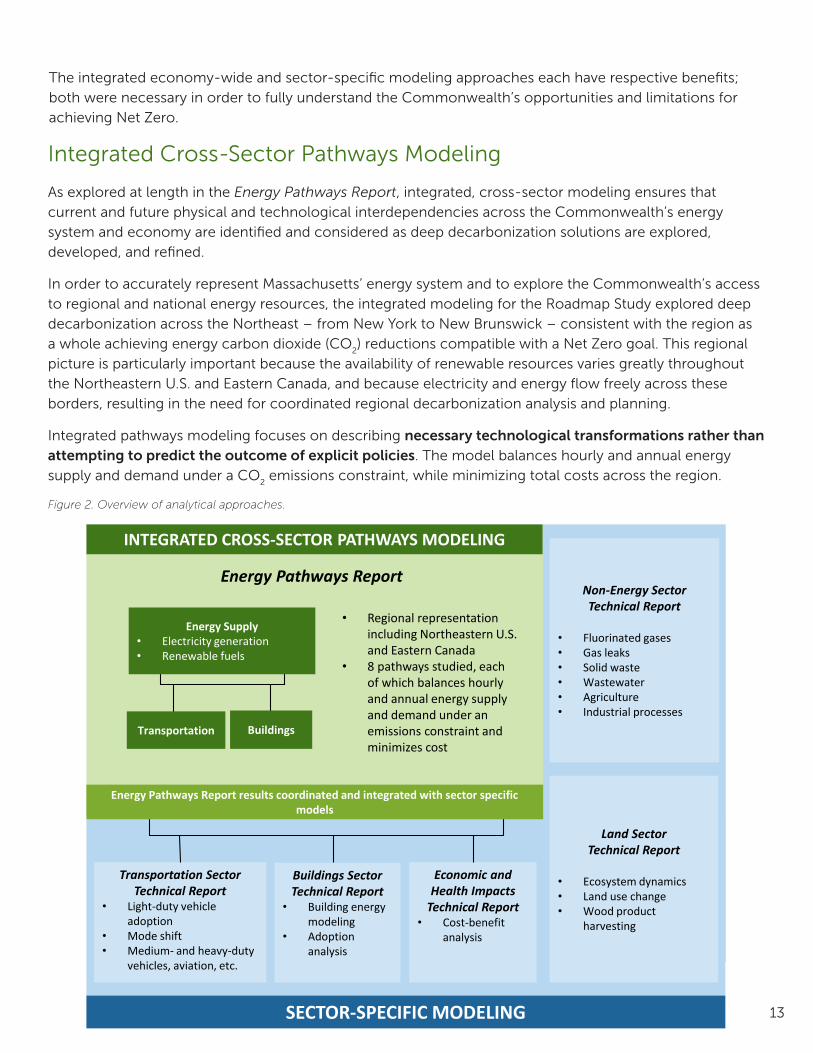
With these goals in mind, two distinct modeling approaches contributed to the findings presented in this Roadmap Report, which are further detailed in the six companion technical reports. The approaches are summarized below and illustrated in Figure 2:
• An integrated, regional, cross-sector energy system pathways analysis consisting of results from eight differing high-level pathways (the Energy Pathways Report);
• Massachusetts-specific analyses by sector for the buildings, transportation, non-energy, and land sectors (detailed further in the Buildings Sector Technical Report, the Transportation Sector Technical Report, the Non-Energy Sector Technical Report, and the Land Sector Technical Report, respectively) and an economic and health impacts analysis (detailed in the Economic and Health Impacts Analysis Technical Report).
While the 2050 Net Zero emissions limit specifies reduction of at least 85% of gross emissions, the Roadmap Study’s quantitative analyses explored the costs, requirements, and system dynamics of achieving energy system emissions reductions comparable to a 90% below 1990 level by 2050 statewide. This was done to maximize the Commonwealth's options to 2050–balancing an optimal level of emissions reductions versus carbon capture, especially the marginal cost of each–that will together achieve Net Zero.
13
Integrated Cross-Sector Pathways Modeling
As explored at length in the Energy Pathways Report, integrated, cross-sector modeling ensures that current and future physical and technological interdependencies across the Commonwealth’s energy system and economy are identified and considered as deep decarbonization solutions are explored, developed, and refined.
In order to accurately represent Massachusetts’ energy system and to explore the Commonwealth’s access to regional and national energy resources, the integrated modeling for the Roadmap Study explored deep decarbonization across the Northeast – from New York to New Brunswick – consistent with the region as a whole achieving energy carbon dioxide (CO
2) reductions compatible with a Net Zero goal. This regional
picture is particularly important because the availability of renewable resources varies greatly throughout the Northeastern U.S. and Eastern Canada, and because electricity and energy flow freely across these borders, resulting in the need for coordinated regional decarbonization analysis and planning.
Integrated pathways modeling focuses on describing necessary technological transformations rather than attempting to predict the outcome of explicit policies. The model balances hourly and annual energy supply and demand under a CO
2 emissions constraint, while minimizing total costs across the region.
Figure 2. Overview of analytical approaches.
Energy Pathways Report
Transportation Sector Technical Report
• Light-duty vehicle adoption
• Mode shift• Medium- and heavy-duty
vehicles, aviation, etc.
Buildings Sector Technical Report
• Building energy modeling
• Adoption analysis
Non-Energy Sector Technical Report
• Fluorinated gases• Gas leaks• Solid waste• Wastewater• Agriculture• Industrial processes
Land Sector Technical Report
• Ecosystem dynamics• Land use change• Wood product
harvesting
Economic and Health Impacts
Technical Report• Cost-benefit
analysis
Fig 4 – Overview of analytical approach
INTEGRATED CROSS-SECTOR PATHWAYS MODELING
SECTOR-SPECIFIC MODELING
• Regional representation including Northeastern U.S. and Eastern Canada
• 8 pathways studied, each of which balances hourly and annual energy supply and demand under an emissions constraint and minimizes cost
Overview of analytical approach
Energy Supply• Electricity generation• Renewable fuels
Transportation Buildings
Energy Pathways Report results coordinated and integrated with sector specific models
The integrated economy-wide and sector-specific modeling approaches each have respective benefits; both were necessary in order to fully understand the Commonwealth’s opportunities and limitations for achieving Net Zero.
14
The modeling encompasses all energy producing, transporting, and consuming equipment in the economy, each having specific costs, performance characteristics, and lifetimes. For example, while almost every house today will still be in use in 2050, most homes will need replacement of their roof, windows, water heater, air conditioner, and heating system at some point in the next thirty years. In fact, some of these elements may need to be replaced multiple times in the thirty-year period. Examining the average replacement cycles – or expected “stock turnover” – of each individual technology allows the model to “back-cast” from an array of equipment that would be compatible with providing required levels of energy services in 2050 given a net-zero emissions limitation, to the population of devices in use today. This helps to define the pace of transformation necessary to achieve specified emissions reduction levels.
Specific technological transitions in this Roadmap Report are referred to as “pathways” and are each compatible with Massachusetts’ emissions targets. The Roadmap Report explores eight unique technological transitions, but this list is by no means exhaustive. For example, emissions from an 18-wheeler could be abated by deploying a carbon-neutral combustion fuel or by replacing the truck’s engine with battery-electric or hydrogen fuel cell-powered motors recharged/refueled with zero-carbon electricity. With few exceptions (such as airplane engines which cannot be electrified with the technology available today), the biggest differences among pathways are assumptions related to equipment cost or availability and, as a result, their modeled level of deployment across the Northeast economy.
In addition to exploring different technological solutions, pathways are also used to evaluate different technological evolutions, advancements, and constraints. In this Roadmap Study, for example, one pathway evaluated how the energy system would adapt to a breakthrough in solar technology and one explored constraints in the development
of offshore wind in the region. The pathways studied are summarized in Table 1. Analyzing the full system across these eight pathways allows for a deeper understanding of the costs, benefits, risks, opportunities, and tradeoffs associated with different decarbonization strategies. Commonalities across the pathways represent robust “no-regrets” strategies that appear to be useful or necessary regardless of which pathway Massachusetts progresses along, while differences across the pathways highlight potential diversions or decision-points for the Commonwealth over the next thirty years.

15
Pathway Research Question Defining Assumptions Key Finding
All Options
Under the most likely assumptions, what is the least-cost deployment of energy system technologies that achieves deep decarbonization?
This is the “benchmark compliant” decarbonization pathway, using midpoint assumptions across most technical parameters.
Deep electrification and broad renewable buildout create a reliable energy system that is only marginally more expensive than today.
Limited Offshore Wind
What are the consequences of limited development in offshore wind?
Northeast offshore wind capacity is capped regionally at 30 gigawatts (GW).
Clean resources including new nuclear power must be built to serve MA. Costs increased modestly.
Limited Efficiency
What are the energy, resource, and transmission & distribution needs that arise from deferring investments in efficiency?
Efficiency gains are reduced to about one-third of those achieved in the All Options pathway in buildings and aviation.
Limiting efficiency gains results in a higher demand for zero-carbon electricity and fuel resources. Costs increase significantly.
Pipeline Gas
What are the impacts of continued reliance on natural gas in buildings? What role can a decarbonized gas product play in a Net Zero MA?
Building electrification is mostly limited to conversion from oil in the near term, with slower rates of gas-to-heat pump conversion in the long term.
Requires a substantial increase in imported low-carbon fuels, possibly above technically feasible quantities. Most of this fuel goes to high-value sectors to compensate for continued emissions from buildings using a fossil/clean fuel blend. Costs increase significantly.
100% Renewable Primary Energy
What does a 100% Renewable Energy Strategy across electricity and all fuels require in terms of resources, storage, and costs?
No fossil fuels allowed; zero-carbon combustion fuels allowed for electricity generation by thermal power plants.
Reliance on zero-carbon fuels needed for grid balancing and end uses leads to dramatically higher costs in 2050; demand may exceed feasible supply. Would likely require technological breakthroughs, yet to be identified, to meet resource constraints and contain costs.
No Thermal
What resources will be needed if thermal generation is not available to provide reliability services?
All thermal capacity retired by 2050.
Substantially higher reliance on solar power, particularly ground-mounted, and new, long-duration utility-scale energy storage to provide grid balancing, leading to dramatically higher costs.
Regional Coordination
What can greater access to regional resources provide as part of decarbonization?
Lower transmission costs. Captured carbon exports allowed for geological sequestration outside of New England.
Additional transmission increases access to, and the ability to share, additional low-cost clean energy resources across the Northeast, lowering costs overall.
Distributed Energy Resources Breakthrough
What are the impacts of greater deployment of behind the meter solar and flexible end uses?
17 GW of behind the meter solar deployed in MA in 2050 as opposed to 7 GW. Higher level of flexible end uses, especially vehicle-to-grid.
Additional demand flexibility lowers local electricity system upgrade costs; very high rates of rooftop solar reduce – but do not eliminate – the need for ground-mounted solar.
Table 1. Summary of Net Zero-compliant pathways examined including, for each, the motivating research question, defining assumptions, and key findings. See the Energy Pathways Report for more details on specific assumptions.

16
Massachusetts-Specific Modeling by SectorSector-specific modeling represents a second perspective on the systems transformations required by 2050 and allowed the Roadmap Study to more closely examine near-term, sectoral transitions through 2030.
Sector-specific modeling examined singular aspects of the economy using more granular, Massachusetts-specific data. Where modeling tools exist to describe the interactions of policy with an activity – such as the representation of electric vehicle (EV) rebates on new car purchases in the Oak Ridge National Lab’s Market Acceptance of Advanced Automotive Technologies (MA3T) model – sector-specific modeling can be used to illustrate what policy interventions might be needed to achieve the pace of transformation found to be both feasible and necessary by the integrated pathways modeling. In other cases, sector-specific modeling can help to assess socioeconomic implications of the transformations and identify key financial or physical constraints at a much finer scale than integrated, cross-sector modeling can achieve. For example, the economic cost-benefit equation for retrofitting a single-family home is dramatically different from that associated with the retrofit of a large apartment building. Understanding the dynamics of who pays the up-front capital
costs; who benefits from the renovation; and how each household, building, or neighborhood contributes to sector-wide energy use and GHG emissions is useful for, and should help enable, the development of effective and equitable policy solutions.
In addition to detailed analysis of the elements of the energy sector, the sector-specific modeling evaluated non-energy GHG emissions, such as from solid waste; the carbon fluxes associated with natural and working lands in Massachusetts; and the public health, workforce, and economic benefits of decarbonization. Each of these elements adds complexity, nuance, and completeness to the Roadmap Study’s findings. The sector-specific modeling sheds light on many of the secondary impacts of decarbonization policies, such as forecasting which communities might benefit from the reduction in air pollution that accompanies electrification or quantifying the new jobs that decarbonization policies might create and support. Deep decarbonization represents a society-wide transformation and each of these study elements enables a more robust understanding of how decarbonization interacts with every level of society.

17
Achieving Net Zero in the next thirty years is an important element of the Commonwealth’s ongoing, formal commitment to ensuring that all people in Massachusetts are protected from environmental pollution and are able to live in and enjoy a clean and healthy environment.2 Indeed, for too long, too many people have disproportionately borne the environmental and health burdens associated with our current energy economy. This is particularly true for those living in Environmental Justice (EJ) communities, both rural and urban,3 who experience higher than average rates of environmentally-related adverse health impacts due to their proximity to the localized cumulative impacts and long-term environmental degradation associated with, among other things, the combustion of fossil fuels. In addition to improving air quality across the entire Commonwealth, decarbonization promises to dramatically reduce many of those on-going, location-specific environmental burdens. It also will bring thirty years of sustained, new economic activity that has the potential to revitalize communities across Massachusetts which have been disadvantaged and at times devastated by historic shifts in the regional, national, and global economies.
Despite the far-reaching positive effects of decarbonization, the ability of Massachusetts residents to participate in this thirty-year transition will differ as a result of income level, race, ability to access and benefit from available resources, location in urban and rural settings, proficiency in English, and previous marginalization. That consideration is particularly important in planning short- and long-term strategies to achieve Net Zero, since the Roadmap Study analysis demonstrates that economy-wide decarbonization can succeed only when all of us–across the Commonwealth and in all our communities–are part of the solution. As a result, broad and sustained public engagement during policy and program development, particularly with EJ populations, communities of color, and low-income residents, will not only be necessary to avoid inequitable outcomes, it will be a key step in achieving a Net Zero future.
Equity Considerations for Deep Decarbonization
2 Protections as defined in Article 97, Constitution of the Commonwealth.
3 As defined in EEA’s 2017 EJ Policy, 33% of the residents of the Commonwealth living on 7% of the land resided in an EJ community. There are EJ communities in every county of the Commonwealth.
Equity Considerations for Deep Decarbonization
18
Stakeholder Engagement
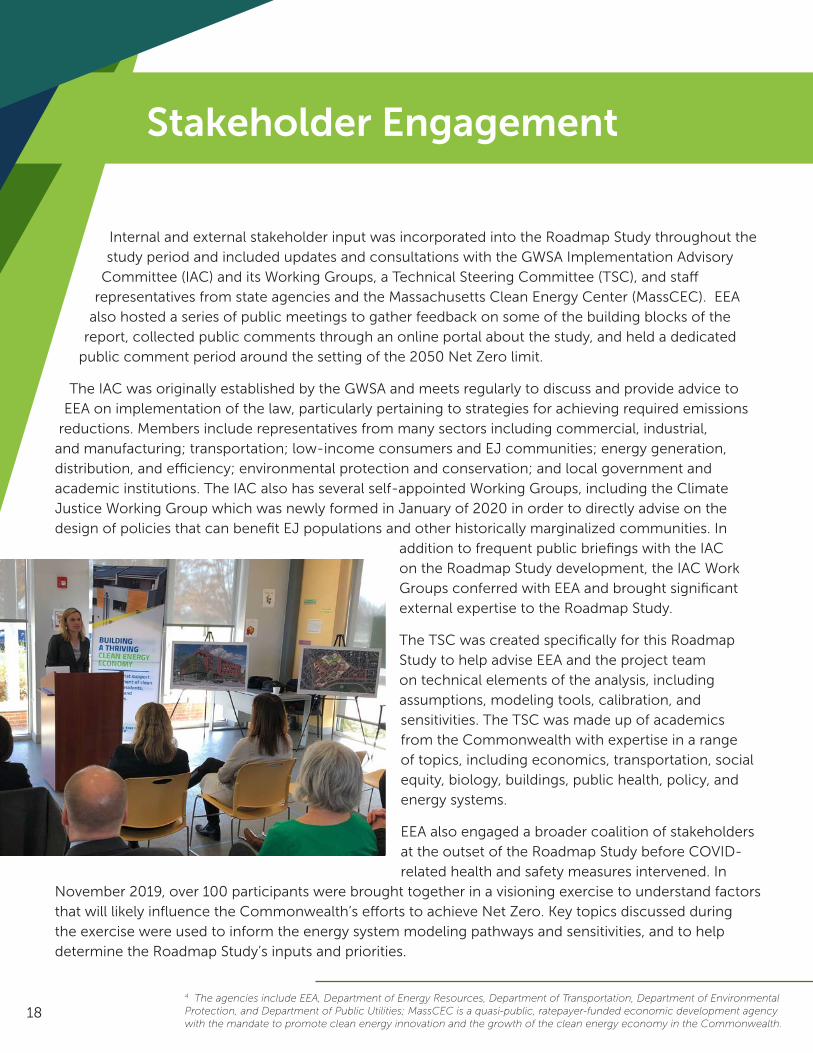
Internal and external stakeholder input was incorporated into the Roadmap Study throughout the study period and included updates and consultations with the GWSA Implementation Advisory
Committee (IAC) and its Working Groups, a Technical Steering Committee (TSC), and staff representatives from state agencies and the Massachusetts Clean Energy Center (MassCEC). EEA
also hosted a series of public meetings to gather feedback on some of the building blocks of the report, collected public comments through an online portal about the study, and held a dedicated
public comment period around the setting of the 2050 Net Zero limit.
The IAC was originally established by the GWSA and meets regularly to discuss and provide advice to EEA on implementation of the law, particularly pertaining to strategies for achieving required emissions
reductions. Members include representatives from many sectors including commercial, industrial, and manufacturing; transportation; low-income consumers and EJ communities; energy generation, distribution, and efficiency; environmental protection and conservation; and local government and academic institutions. The IAC also has several self-appointed Working Groups, including the Climate Justice Working Group which was newly formed in January of 2020 in order to directly advise on the design of policies that can benefit EJ populations and other historically marginalized communities. In
addition to frequent public briefings with the IAC on the Roadmap Study development, the IAC Work Groups conferred with EEA and brought significant external expertise to the Roadmap Study.
The TSC was created specifically for this Roadmap Study to help advise EEA and the project team on technical elements of the analysis, including assumptions, modeling tools, calibration, and sensitivities. The TSC was made up of academics from the Commonwealth with expertise in a range of topics, including economics, transportation, social equity, biology, buildings, public health, policy, and energy systems.
EEA also engaged a broader coalition of stakeholders at the outset of the Roadmap Study before COVID-related health and safety measures intervened. In
November 2019, over 100 participants were brought together in a visioning exercise to understand factors that will likely influence the Commonwealth’s efforts to achieve Net Zero. Key topics discussed during the exercise were used to inform the energy system modeling pathways and sensitivities, and to help determine the Roadmap Study’s inputs and priorities.
4 The agencies include EEA, Department of Energy Resources, Department of Transportation, Department of Environmental Protection, and Department of Public Utilities; MassCEC is a quasi-public, ratepayer-funded economic development agency with the mandate to promote clean energy innovation and the growth of the clean energy economy in the Commonwealth.
19
v
Transitioning to Net Zero in 2050
Chapter 3
20
The Commonwealth’s Emissions Outlook
The Roadmap Study established that multiple viable pathways exist by which the Commonwealth can achieve Net Zero and that there are several robust decarbonization strategies that, together, will allow Massachusetts to achieve that goal affordably, and equitably, while continuing to grow and maintain a vibrant local and regional economy. But the analysis also indicated that the way in which Massachusetts and our neighbors pursue their climate goals – the choice between or among potential pathways – could dramatically impact the costs, risks, and broader environmental impacts associated with the deep decarbonization transformation. Regardless, in addition to achieving the Commonwealth’s climate goals, all Net Zero scenarios will deliver significant economic and health benefits statewide.
While there is always a potential role for new and valuably disruptive technologies, the fundamental challenge in reaching Net Zero is not technical, but practical. The core technologies and techniques Massachusetts needs to achieve Net Zero are known and, for the most part, commercialized, although some significant barriers to deployment exist that must be actively managed and reduced. Achieving Net Zero will require Massachusetts and our neighbors to collaboratively implement a variety of strategies to transform how energy is produced and consumed, and how land resources are managed. A summary of these key transformations and a brief discussion of some of their key implications follows.
5 MassDEP. “Massachusetts Annual Greenhouse Gas Inventory: 1990-2017.” Available at https://www.mass.gov/lists/massdep-emissions-inventories
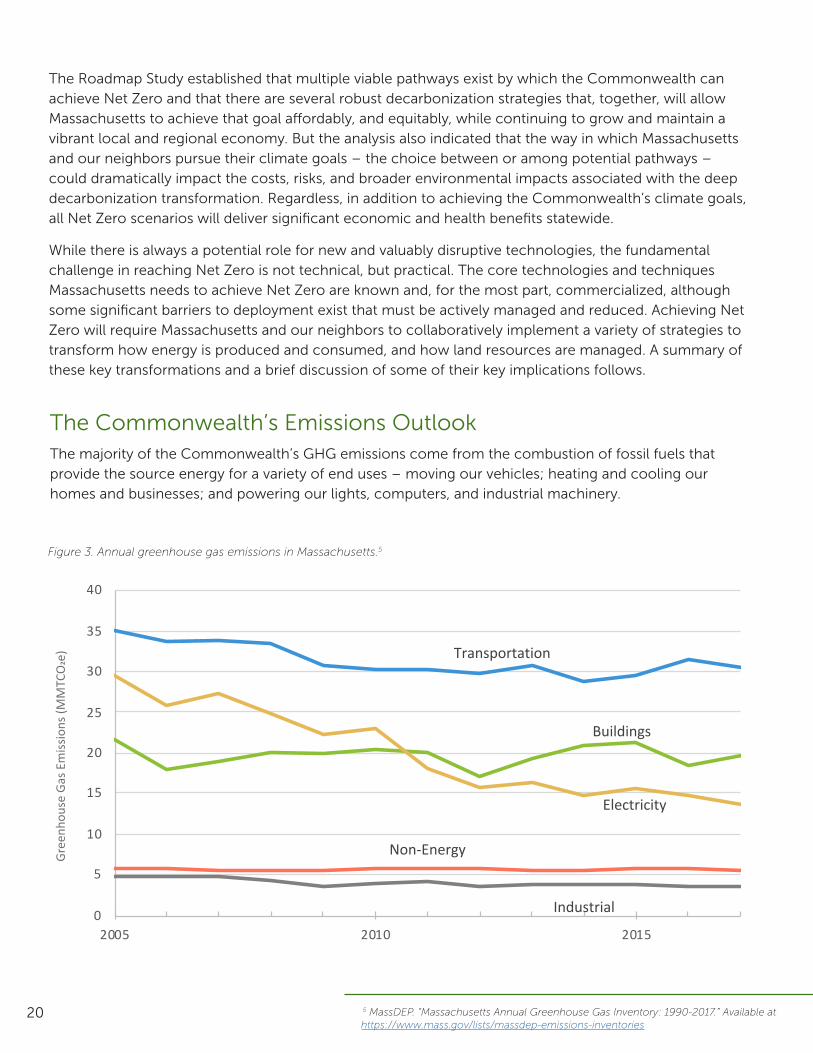
The majority of the Commonwealth’s GHG emissions come from the combustion of fossil fuels that provide the source energy for a variety of end uses – moving our vehicles; heating and cooling our homes and businesses; and powering our lights, computers, and industrial machinery.
Figure 3. Annual greenhouse gas emissions in Massachusetts.5
Transportation
Buildings
Electricity
Industrial
Non-Energy
0
5
10
15
20
25
30
35
40
2005 2010 2015
Gre
enho
use
Gas
Em
issio
ns (M
MTC
O2e
)Gr
eenh
ouse
Gas
Em
issio
ns (M
MTC
O2e
)
21
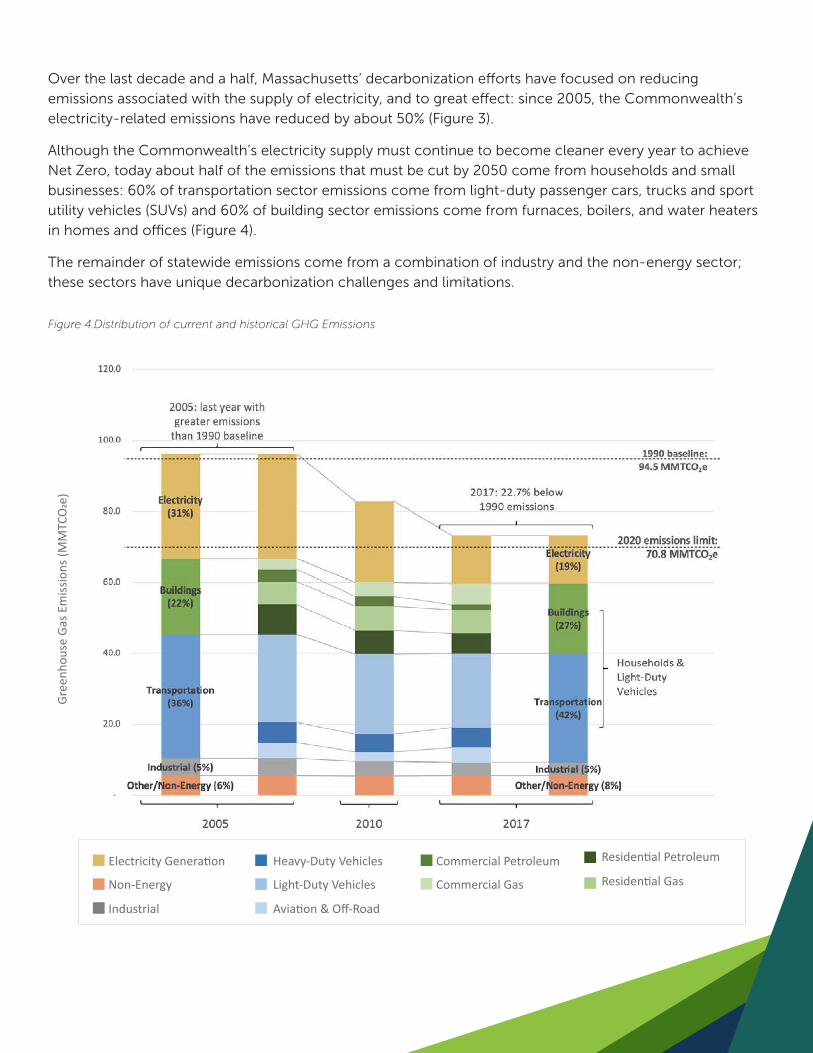
Over the last decade and a half, Massachusetts’ decarbonization efforts have focused on reducing emissions associated with the supply of electricity, and to great effect: since 2005, the Commonwealth’s electricity-related emissions have reduced by about 50% (Figure 3).
Although the Commonwealth’s electricity supply must continue to become cleaner every year to achieve Net Zero, today about half of the emissions that must be cut by 2050 come from households and small businesses: 60% of transportation sector emissions come from light-duty passenger cars, trucks and sport utility vehicles (SUVs) and 60% of building sector emissions come from furnaces, boilers, and water heaters in homes and offices (Figure 4).
The remainder of statewide emissions come from a combination of industry and the non-energy sector; these sectors have unique decarbonization challenges and limitations.
Figure 4.Distribution of current and historical GHG Emissions
Gree
nhou
se G
as E
miss
ions
(MM
TCO
2e)
Electricity Generation Commercial Petroleum Residential Petroleum
Commercial Gas Residential Gas
Industrial
Non-Energy Light-Duty Vehicles
Heavy-Duty Vehicles
Aviation & Off-Road
22
Strategies for Reducing Emissions
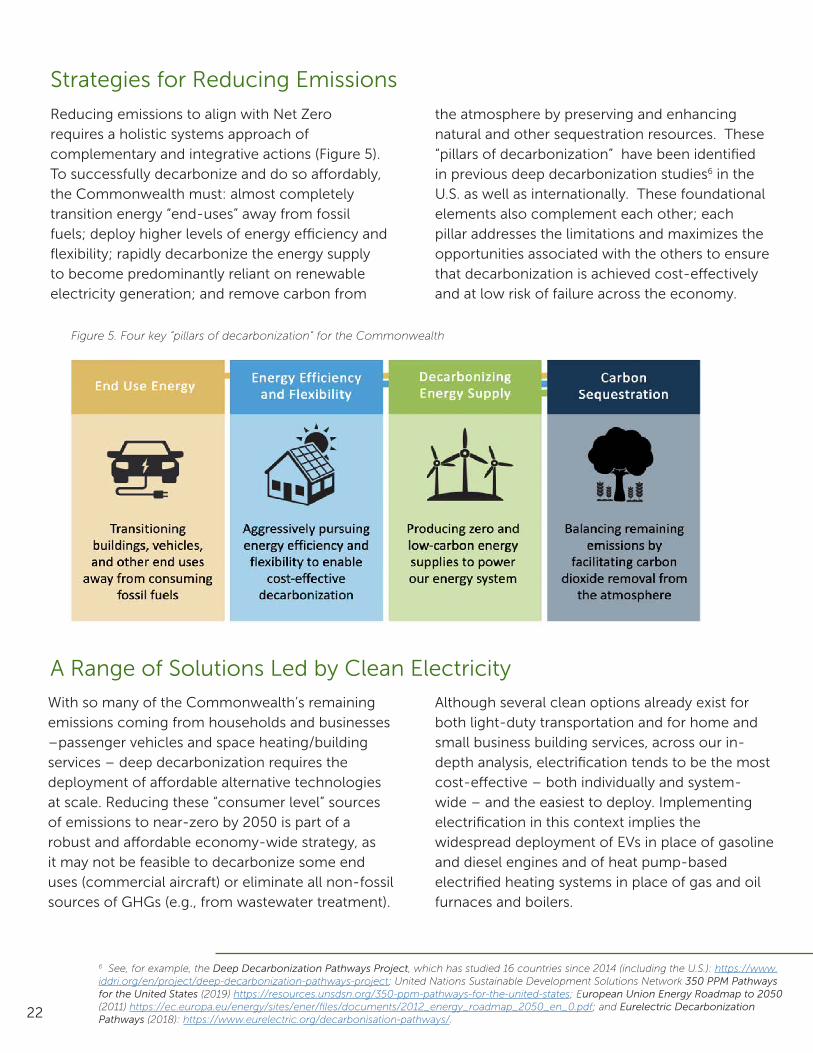
Reducing emissions to align with Net Zero requires a holistic systems approach of complementary and integrative actions (Figure 5). To successfully decarbonize and do so affordably, the Commonwealth must: almost completely transition energy “end-uses” away from fossil fuels; deploy higher levels of energy efficiency and flexibility; rapidly decarbonize the energy supply to become predominantly reliant on renewable electricity generation; and remove carbon from
A Range of Solutions Led by Clean Electricity
With so many of the Commonwealth’s remaining emissions coming from households and businesses –passenger vehicles and space heating/building services – deep decarbonization requires the deployment of affordable alternative technologies at scale. Reducing these “consumer level” sources of emissions to near-zero by 2050 is part of a robust and affordable economy-wide strategy, as it may not be feasible to decarbonize some end uses (commercial aircraft) or eliminate all non-fossil sources of GHGs (e.g., from wastewater treatment).
6 See, for example, the Deep Decarbonization Pathways Project, which has studied 16 countries since 2014 (including the U.S.): https://www.iddri.org/en/project/deep-decarbonization-pathways-project; United Nations Sustainable Development Solutions Network 350 PPM Pathways for the United States (2019) https://resources.unsdsn.org/350-ppm-pathways-for-the-united-states; European Union Energy Roadmap to 2050 (2011) https://ec.europa.eu/energy/sites/ener/files/documents/2012_energy_roadmap_2050_en_0.pdf; and Eurelectric Decarbonization Pathways (2018): https://www.eurelectric.org/decarbonisation-pathways/.
Although several clean options already exist for both light-duty transportation and for home and small business building services, across our in-depth analysis, electrification tends to be the most cost-effective – both individually and system-wide – and the easiest to deploy. Implementing electrification in this context implies the widespread deployment of EVs in place of gasoline and diesel engines and of heat pump-based electrified heating systems in place of gas and oil furnaces and boilers.
the atmosphere by preserving and enhancing natural and other sequestration resources. These “pillars of decarbonization” have been identified in previous deep decarbonization studies6 in the U.S. as well as internationally. These foundational elements also complement each other; each pillar addresses the limitations and maximizes the opportunities associated with the others to ensure that decarbonization is achieved cost-effectively and at low risk of failure across the economy.
Figure 5. Four key “pillars of decarbonization” for the Commonwealth
23
A Balanced Regional Electric Grid Dominated by Renewables
As electrification of buildings and vehicles dramatically increases, Massachusetts will need to significantly expand our clean electricity supply. Based on cost and availability, the vast majority of that new clean electricity will come from renewable generation, particularly the world-class offshore wind resource off the New England coast, which can provide “bulk” low-cost, carbon-free electricity in the majority of hours to the entire region and across the greater Northeast. However, even a massive buildout of offshore wind power will not provide enough carbon-free electricity generation to reach Net Zero. To affordably and reliably operate an electricity grid based on variable renewable generation, a balanced portfolio of clean generation technologies shared across a broad geographical region is needed. Together with offshore wind power, the Commonwealth needs a similarly large volume of solar generation deployed on rooftops and on land, additional energy storage,
and several new high-voltage transmissions lines to Canada and New York that will allow sharing of low-cost clean energy, including hydropower, with the Commonwealth’s neighbors in the Northeast.
Investments in energy efficiency and electric load flexibility are, and will remain, critical to reduce costs and improve system reliability, but do not fundamentally change the pathway forward. Indeed, due to the inherent efficiency of many electrification technologies, particularly EV drivetrains and heat pumps for heating and cooling, the electrification of end uses means that less energy can be used to provide the same service. However, because end-uses will shift from the fossil-based technologies that dominate today to electrified technologies, the demand for clean electricity is projected to nearly double by 2050.
Electrifying everything, however, is not necessary for achieving Net Zero. A variety of decarbonization strategies is preferable and a range of Net Zero-compliant fuels will play an important role in certain sectors and for certain end uses that have infrastructure, cost, and feasibility constraints. Under all scenarios examined, low-carbon fuels
are likely to remain relatively scarce and costly even when scaled. As a result, low-carbon combustible fuels should be used strategically, reserved for those limited, non-consumer applications where they are most needed (or a technical necessity) to help the Commonwealth achieve Net Zero.
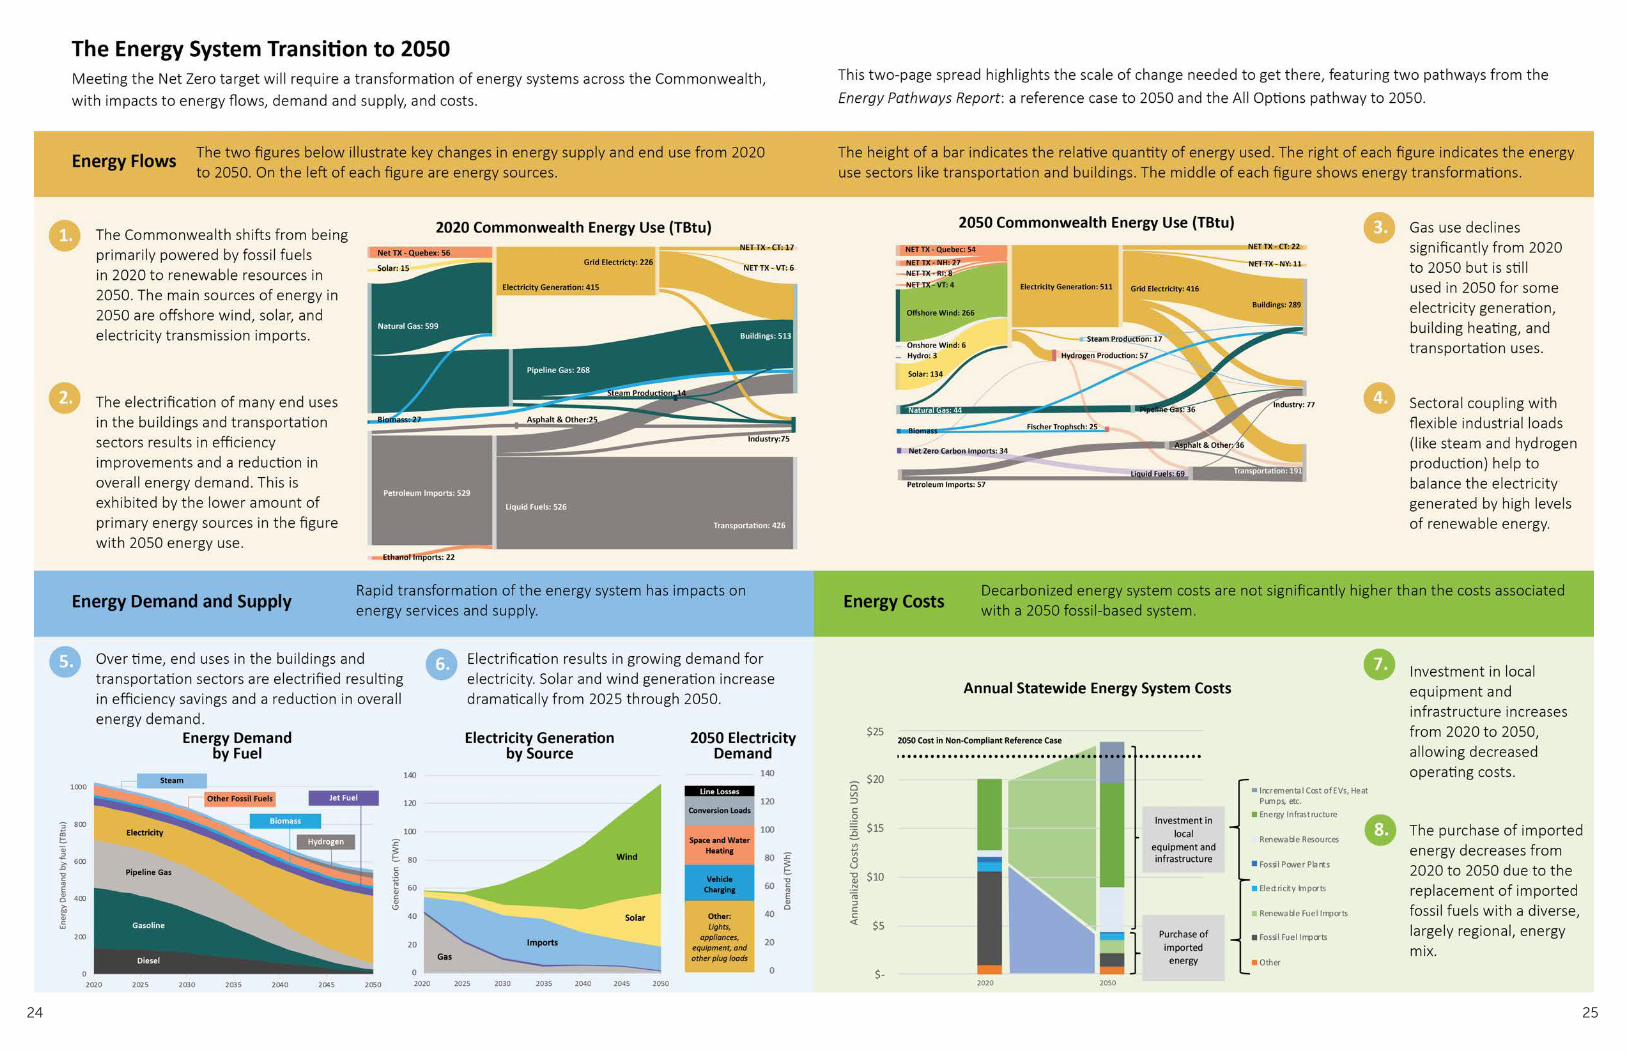
2524
26
Creating Negative Emissions Regionwide
To achieve Net Zero, the Commonwealth must also build and maintain the ability to remove carbon dioxide from the atmosphere and durably store or sequester it. Even after transforming and almost completely decarbonizing the energy system, residual emissions will remain in the Commonwealth’s 2050 energy and non-energy sectors – from residual fossil fuel use, certain industrial processes, agriculture and forestry, solid waste disposal, and wastewater treatment. If properly managed and maintained, natural and working lands – primarily Massachusetts’ 3.3 million
acres of forested land – will play a critical role in absorbing and storing a large portion (about half) of those emissions. To achieve Net Zero by 2050, however, the Commonwealth will need to build and access a new market for carbon sequestration and other “negative emissions” that will help drive the development of mechanical direct air capture sources and will help support and grow the Commonwealth’s natural resources while allowing the Commonwealth to support, grow, and access those of our neighbors across the Northeast.
Achieving Net Zero Affordably for AllDecarbonizing the Commonwealth’s energy systems will require substantial investments over the coming decades, but it is an investment that creates significant economic opportunity and that will pay dividends across the Commonwealth for generations to come. Each year, Massachusetts residents spend more than $15 billion on energy and energy-related equipment and infrastructure. Most of that money flows out of the region to states and countries that produce and refine fossil fuels. Investing a significant portion of that annual expense into clean technologies will reduce and stabilize overall energy demands and costs for businesses and families, providing economic benefits and job growth while improving air quality and resulting in lower healthcare costs. It is estimated that achieving Net Zero by 2050 would lead to a reduction in cardiac and respiratory illness that would result in the avoidance of 400 deaths and 25,000 days of missed work annually. These benefits are valued at $4.5 billion annually, exceeding pathway projected costs; approximately 98% of the benefit is attributable to a reduction in mortality.
In addition, investing in local energy production will recycle that “cost” as direct investment into the Commonwealth’s local economy, creating
growth in emerging clean energy industries and approximately 15,000 jobs annually across the next 30 years and making the Commonwealth and the Northeast region more self-reliant and resilient.
The total investment needed for full decarbonization – for individuals and for the Commonwealth as a whole – can be minimized by transitioning to clean technologies when old equipment reaches the end of its service life and must be replaced. This opportunity also represents a barrier, as such turnover points come infrequently: cars and trucks, for example, usually last for more than ten years, while furnaces and boilers may last for several decades. Achieving Net Zero in order to avoid the worst impacts of global warming thus requires a pace of transformation that will not be easy to achieve and sustain; in certain instances, this pace may feel uncomfortably fast. Massachusetts policy actions can and must help to ensure not only that this technological shift accelerates dramatically in the years to come, but also that it occurs with equitable access to the known benefits of decarbonization, while avoiding the potential inequitable distribution of costs.
27
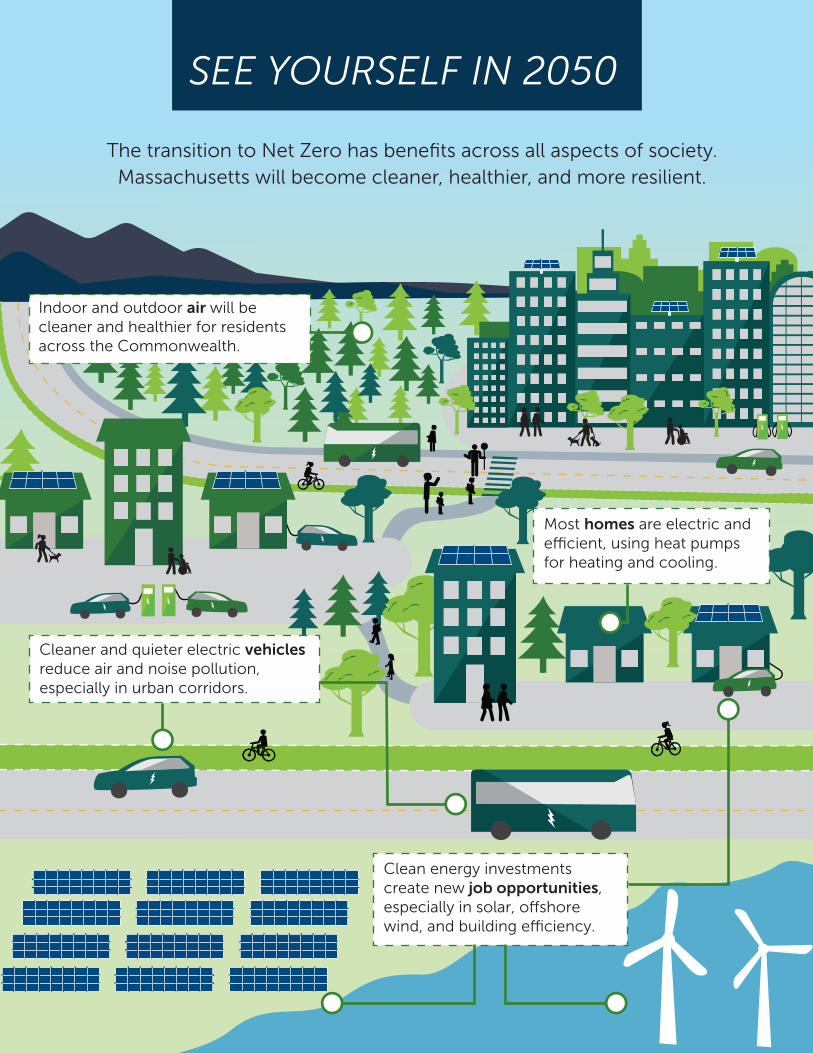
Indoor and outdoor air will be cleaner and healthier for residents across the Commonwealth.
Most homes are electric and ecient, using heat pumps for heating and cooling.
Cleaner and quieter electric vehicles reduce air and noise pollution, especially in urban corridors.
Clean energy investments create new job opportunities, especially in solar, o�shore wind, and building eciency.
SEE YOURSELF IN 2050
The transition to Net Zero has benefits across all aspects of society.Massachusetts will become cleaner, healthier, and more resilient.

28
v
Strategies to Achieve Net Zero
Chapter 4
29
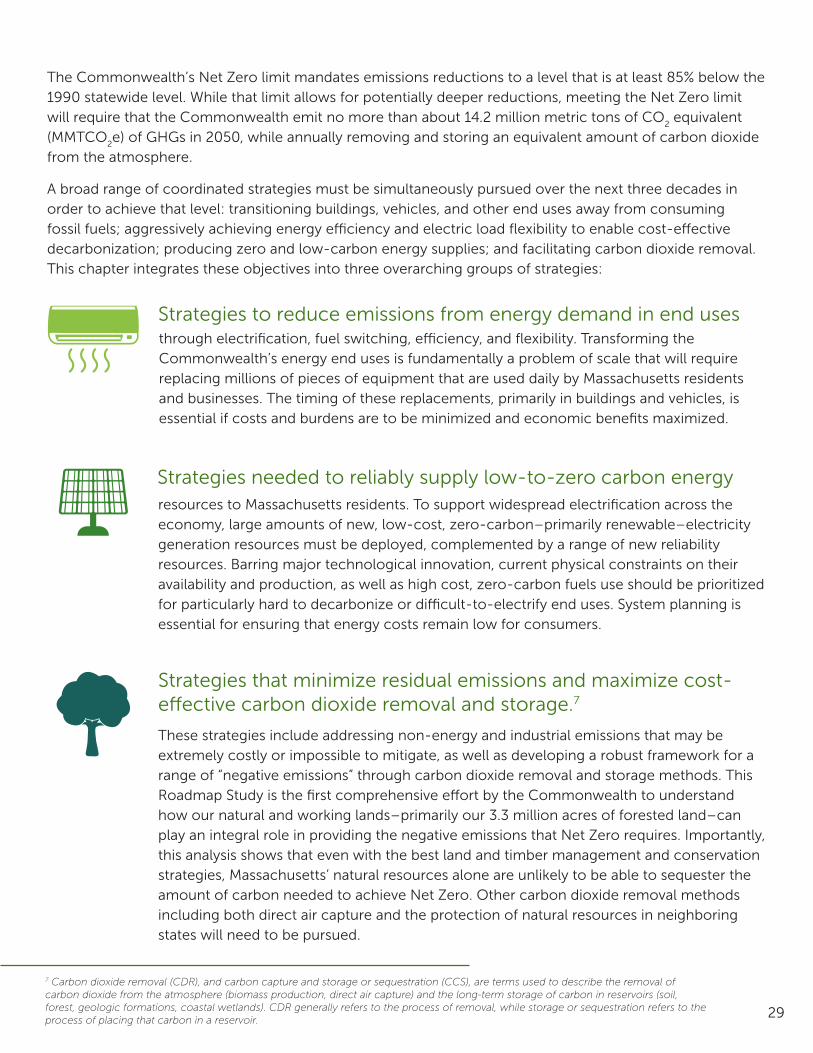
The Commonwealth’s Net Zero limit mandates emissions reductions to a level that is at least 85% below the 1990 statewide level. While that limit allows for potentially deeper reductions, meeting the Net Zero limit will require that the Commonwealth emit no more than about 14.2 million metric tons of CO
2 equivalent
(MMTCO2e) of GHGs in 2050, while annually removing and storing an equivalent amount of carbon dioxide
from the atmosphere.
A broad range of coordinated strategies must be simultaneously pursued over the next three decades in order to achieve that level: transitioning buildings, vehicles, and other end uses away from consuming fossil fuels; aggressively achieving energy efficiency and electric load flexibility to enable cost-effective decarbonization; producing zero and low-carbon energy supplies; and facilitating carbon dioxide removal. This chapter integrates these objectives into three overarching groups of strategies:
through electrification, fuel switching, efficiency, and flexibility. Transforming the Commonwealth’s energy end uses is fundamentally a problem of scale that will require replacing millions of pieces of equipment that are used daily by Massachusetts residents and businesses. The timing of these replacements, primarily in buildings and vehicles, is essential if costs and burdens are to be minimized and economic benefits maximized.
resources to Massachusetts residents. To support widespread electrification across the economy, large amounts of new, low-cost, zero-carbon–primarily renewable–electricity generation resources must be deployed, complemented by a range of new reliability resources. Barring major technological innovation, current physical constraints on their availability and production, as well as high cost, zero-carbon fuels use should be prioritized for particularly hard to decarbonize or difficult-to-electrify end uses. System planning is essential for ensuring that energy costs remain low for consumers.
These strategies include addressing non-energy and industrial emissions that may be extremely costly or impossible to mitigate, as well as developing a robust framework for a range of “negative emissions” through carbon dioxide removal and storage methods. This Roadmap Study is the first comprehensive effort by the Commonwealth to understand how our natural and working lands–primarily our 3.3 million acres of forested land–can play an integral role in providing the negative emissions that Net Zero requires. Importantly, this analysis shows that even with the best land and timber management and conservation strategies, Massachusetts’ natural resources alone are unlikely to be able to sequester the amount of carbon needed to achieve Net Zero. Other carbon dioxide removal methods including both direct air capture and the protection of natural resources in neighboring states will need to be pursued.
Strategies to reduce emissions from energy demand in end uses
7 Carbon dioxide removal (CDR), and carbon capture and storage or sequestration (CCS), are terms used to describe the removal of carbon dioxide from the atmosphere (biomass production, direct air capture) and the long-term storage of carbon in reservoirs (soil, forest, geologic formations, coastal wetlands). CDR generally refers to the process of removal, while storage or sequestration refers to the process of placing that carbon in a reservoir.
Strategies needed to reliably supply low-to-zero carbon energy
Strategies that minimize residual emissions and maximize cost-effective carbon dioxide removal and storage.7

30
System Transformations to 2050

31
Key Constraints
As Net Zero emissions reductions and sequestration strategies are evaluated and deployed, several system level dynamics and constraints become relevant and must be considered.
Land Use and Siting – Several decarbonization strategies require either using or conserving land, and thus have the potential to place various societal goals in conflict with each other. Siting energy projects has been a challenge in both rural and urban areas, and over the next 30 years will be a major priority given the importance of new infrastructure to decarbonization. Among natural systems, land has the potential to be one of the most impacted by human activity given its position at the nexus of food, water, housing, energy production, and other important human needs. That same dynamic is visible among decarbonization strategies and solutions, particularly when net-zero emissions is the goal. In addition to the other essential ecological, economic, and social services they provide, natural lands and ecosystems – particularly forests – serve as a stock of stored carbon and facilitate a flow of carbon from the atmosphere to further build up that stock. As a result, effective, data-driven siting and other land use strategies that balance land use priorities for conservation and sequestration with land use needs for new clean energy production and other human uses will be critically important going forward.
Bioenergy Availability and Impacts – Bioenergy production requires land, water, nutrients, and energy, often outside of a state’s borders. Scaling the production of bioenergy resources in order to meet the fossil fuel replacement needs of whole sectors would put immense pressure on these resources, leading to indirect emissions and a range of socially unacceptable impacts.8 Competition for other critically important uses of land functionally limit the ability to produce bioenergy locally, nationally,9 or even globally. However, bioenergy should not be avoided entirely. Massachusetts currently generates zero-carbon energy from the conversion of organic waste to energy at several anaerobic digesters plants, most notably the resource recovery facility on Deer Island, and even a modest amount of dedicated bioenergy crops nationwide could be sustainably used to generate zero-carbon fuels for hard-to-electrify sectors such as aviation. Bioenergy is a valuable low- or zero-emissions fuel that is likely a necessary component of achieving Net Zero by 2050. However, it must be used strategically and with care to ensure that it avoids creating indirect emissions and stressing natural resources (See Appendix: Modeling and Emissions Accounting of Biogenic Fuels).
Low- and Zero-Carbon Combustible Fuels – Similar carbon tradeoffs, production constraints, and cost constraints also exist for other zero-carbon combustible fuels. First, there are competing needs for biomass or captured carbon, including as a feedstock for certain chemical processes (e.g. for production of plastics) that are anticipated to command a higher commercial value than as a combustion fuel. Second, once a low- or zero-carbon fuel is burned to power a useful energy end use, it releases the carbon back to the atmosphere, when instead the embodied carbon could have been sequestered and stored.
8 Intergovernmental Panel on Climate Change. Special Report on Global Warming of 1.5°C. https://www.ipcc.ch/sr15/ (2018).9 U.S. Department of Energy. 2016 Billion Ton Study Update. https://www.energy.gov/eere/bioenergy/2016-billion-ton-report (2016).

32
These physical and economic constraints, as well as the related current and projected high costs of low- and zero-carbon fuels, are likely to limit their potential uses to certain high-value uses and sectors that are very difficult to electrify or otherwise decarbonize. The Energy Pathways Report demonstrates that net-zero fuels can be deployed more cost–effectively to displace the liquid fossil fuels used in heavy freight, aviation, and industrial processes, that require energy dense fuels. It is also worth noting that while the technologies to produce many zero-carbon fuels are relatively mature, few have yet been proven deployable at scale and at proven low cost. Strategies that rely on such fuels and, as a result, “lock in” combustion equipment for use through or beyond 2050 are at risk of these fuels failing to scale or remaining costly. Finally, dependence on out-of-state bioenergy resources would require spending outside of Massachusetts, lowering the levels of local spending, investment, and job creation that other lower cost and less risky decarbonization strategies promise.
Zero-carbon fuels include combustion fuels derived from biomass as well as those produced from carbon captured directly from the atmosphere. Burning these fuels does not contribute to a net change in atmospheric CO
2 concentrations when the carbon capture is
considered. Their advantage in decarbonizing energy use comes from their ability to directly replace fossil fuels (natural gas, gasoline, diesel or jet fuel) in existing equipment rather than necessitating a switch to electric or hydrogen-consuming alternative technologies, especially when those alternatives may not currently exist or may be prohibitively expensive.
There are various biological and thermochemical processes that produce zero-carbon fuels from carbon feedstocks like organic wastes, dedicated bioenergy crops, and direct-air-captured CO
2. Anaerobic digestion, for example, generates methane gas from organic
waste. Other processes react carbon feedstocks with hydrogen gas to produce synthetic methane or liquid fuels. These processes are described in further detail in the Energy Pathways Report and a generalized overview of zero-carbon fuel production is presented in Figure 6.
In general, such fuels are already several times more expensive than conventional fossil fuels. Natural gas prices are currently around $3-5 per million British thermal units (MMBtu) (not including distribution costs, etc.), while the Energy Pathways Report assumes $30 per MMBtu for renewable gas in 2050.10 Accordingly, strategies that rely on, or require, higher levels of zero-carbon fuels subsequently had higher costs throughout the Roadmap Study’s 2020-2050 analysis timeframe.
Zero-Carbon Fuels And Bioenergy Resources
10 The same $30/MMBtu value was determined to be a reasonable estimate for renewable gas in 2050 based on a survey of recent studies including by the American Gas Foundation and based on consideration of the full range of potential feedstock as part of a recent study on building electrification prepared for the State of Rhode Island. Brattle Group (2020). Heating Sector Transformation in Rhode Island: Pathways to Decarbonization by 2050. http://www.energy.ri.gov/documents/HST/RI%20HST%20Final%20Pathways%20Report%204-22-20.pdf
33
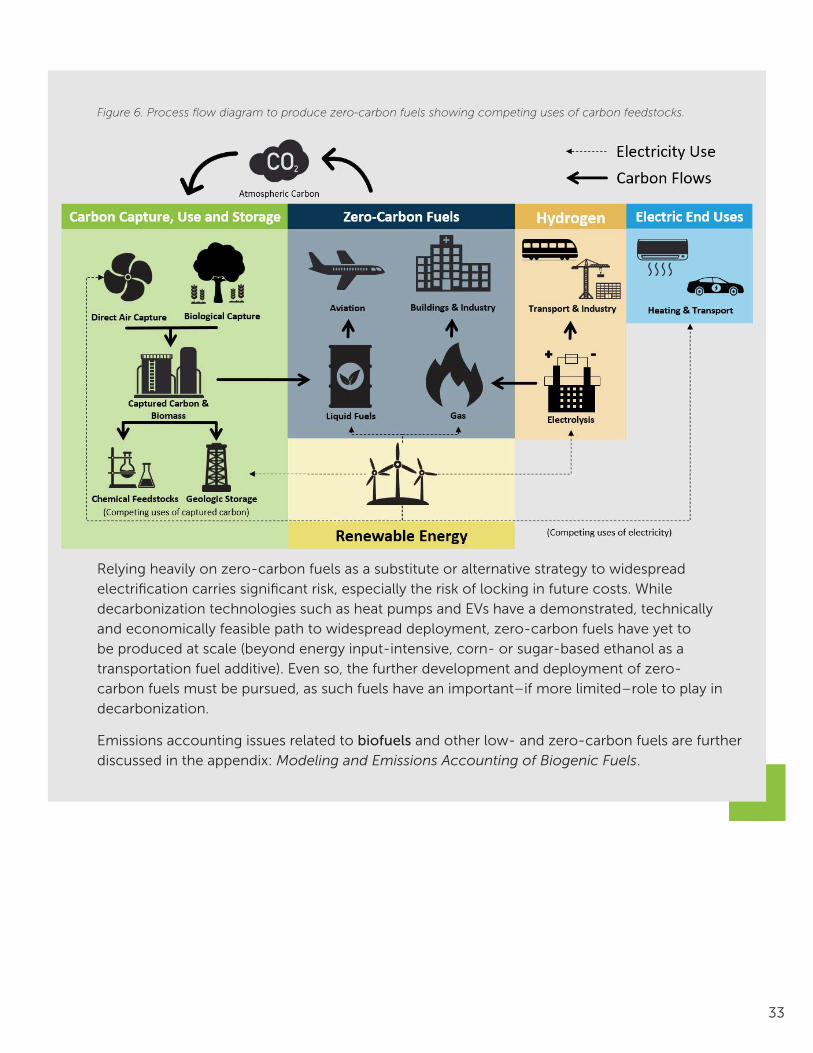
Figure 6. Process flow diagram to produce zero-carbon fuels showing competing uses of carbon feedstocks.
Relying heavily on zero-carbon fuels as a substitute or alternative strategy to widespread electrification carries significant risk, especially the risk of locking in future costs. While decarbonization technologies such as heat pumps and EVs have a demonstrated, technically and economically feasible path to widespread deployment, zero-carbon fuels have yet to be produced at scale (beyond energy input-intensive, corn- or sugar-based ethanol as a transportation fuel additive). Even so, the further development and deployment of zero-carbon fuels must be pursued, as such fuels have an important–if more limited–role to play in decarbonization.
Emissions accounting issues related to biofuels and other low- and zero-carbon fuels are further discussed in the appendix: Modeling and Emissions Accounting of Biogenic Fuels.
34
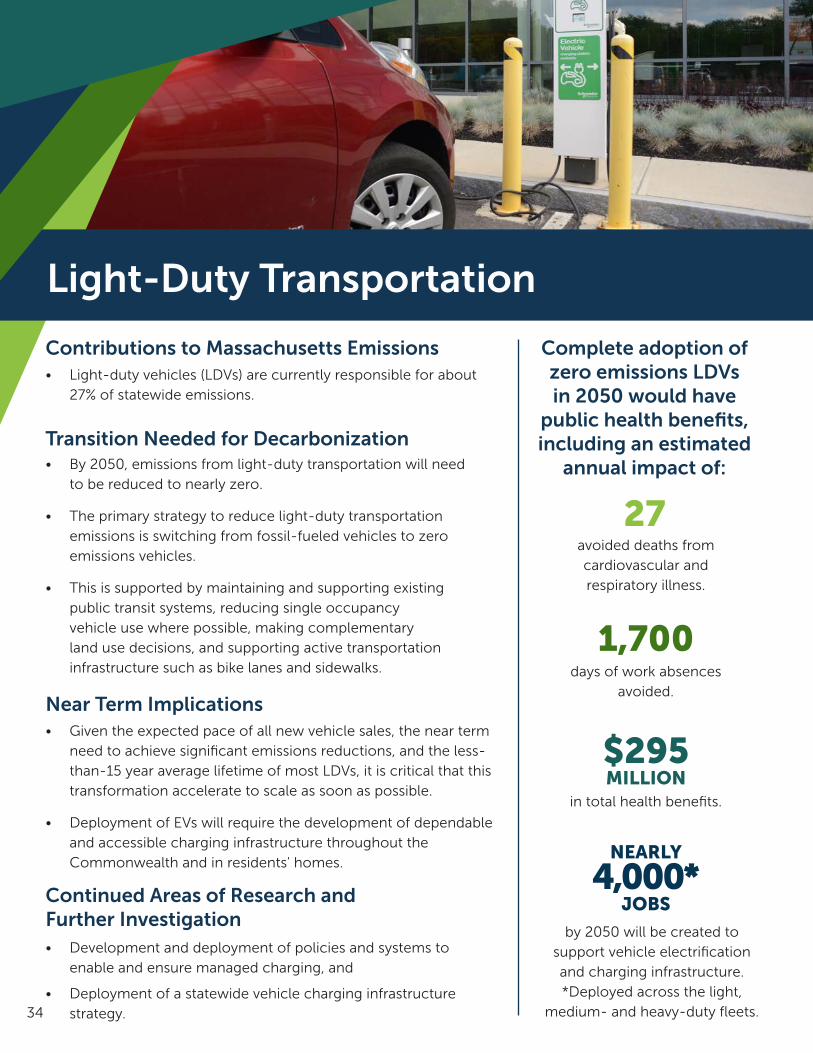
Light-Duty Transportation
• Light-duty vehicles (LDVs) are currently responsible for about 27% of statewide emissions.
avoided deaths from cardiovascular and respiratory illness.
days of work absences avoided.
in total health benefits.
Complete adoption of zero emissions LDVs in 2050 would have
public health benefits, including an estimated
annual impact of:
by 2050 will be created to support vehicle electrification and charging infrastructure. *Deployed across the light,
medium- and heavy-duty fleets.
27
1,700
$295MILLION
NEARLY
4,000*JOBS
Contributions to Massachusetts Emissions
Transition Needed for Decarbonization
Near Term Implications
Continued Areas of Research and Further Investigation
• By 2050, emissions from light-duty transportation will need to be reduced to nearly zero.
• The primary strategy to reduce light-duty transportation emissions is switching from fossil-fueled vehicles to zero emissions vehicles.
• This is supported by maintaining and supporting existing public transit systems, reducing single occupancy vehicle use where possible, making complementary land use decisions, and supporting active transportation infrastructure such as bike lanes and sidewalks.
• Given the expected pace of all new vehicle sales, the near term need to achieve significant emissions reductions, and the less-than-15 year average lifetime of most LDVs, it is critical that this transformation accelerate to scale as soon as possible.
• Deployment of EVs will require the development of dependable and accessible charging infrastructure throughout the Commonwealth and in residents' homes.
• Development and deployment of policies and systems to enable and ensure managed charging, and
• Deployment of a statewide vehicle charging infrastructure strategy.

35
Switching from fossil fuel internal combustion engine vehicles (ICEVs) to zero emissions vehicles (ZEVs) represents the primary strategy for reducing emissions from the light-duty transportation sector to the near-zero levels required for achieving Net Zero emissions statewide. At the same time, concurrent strategies that emphasize the maintenance and support of public transit systems, reduce single occupancy vehicle use, develop land strategically, and support active transportation infrastructure can further reduce fossil fuel use, particularly in the near term, while also delivering significant social co-benefits. However, even with the most impactful vehicle use reduction strategies, there will still be a need to fully transition the Commonwealth’s LDV fleet from fossil fuel powered vehicles to ZEVs.
Electric vehicles (EVs), which offer the most promising long-term replacement technology for light-duty internal combustion engine vehicles (ICEVs); and
The two primary classes of ZEVs include:11
All major automakers and several startups have already invested heavily in EV technology and are expected to release more than a dozen new BEV models (multiple vans, SUVs, pickups, sedans, and crossovers) in the next three years in the U.S. By 2025, over 400 BEV and PHEV models are expected globally. Costs of EVs continue to fall, driven largely by battery cost reductions and other economies of scale. With these cost reductions, many vehicle categories of EVs are anticipated to become fully cost-competitive with ICEVs over the next decade. In contrast, a shift toward large-scale hydrogen FCEV adoption among LDVs is unlikely in the near term given limited FCEV research and development pipelines from major automakers. Although hydrogen vehicles should not be disregarded as viable light-duty decarbonization option, battery-electric vehicles are, currently, more advanced in their development and positioned to become the dominant light-duty vehicle of the future.
11 In addition to battery electric vehicles, plug-in hybrid electric vehicles (PHEVs) have an electric motor powered by both a battery and an internal combustion engine powered by gasoline. They can be considered a ZEV when driven in electric mode. They are a valuable bridge technology today, and through the 2020s as EV options and the region’s electric charging infrastructure expand. As more models of BEVs become commercially available and with even longer driving ranges, PHEVs are expected to be less prevalent.12 While likely important for certain medium- and heavy-duty applications (see next subsection), the same cost and efficiency dynamic discussed in Figure 11 regarding the use of decarbonized fuels in buildings strongly suggest that for light-duty applications, FCEVs will remain more expensive than battery electric vehicles. Furthermore, currently only Toyota, Hyundai, and Honda have announced FCEV research and development efforts.
Hydrogen fuel cell electric vehicles (FCEVs), which are also a possible replacement, but are likely to remain more expensive and would require hydrogen production and distribution at scale.12
36
Massachusetts is home to the oldest subway tunnel in North America. The Tremont Street Subway laid the path for the Green Line’s current route from Boylston to Government Center. Its purpose was to reduce congestion on the streets above, allowing the trolley system to operate unencumbered. Growing out of the Tremont Street Subway and its contemporaries, the Massachusetts Bay Transportation Authority (MBTA)—recognized by the 2018 Commission on the Future of Transportation in the Commonwealth as “the most efficient and sustainable way to move large numbers of people as they go about their daily lives"—was the fourth-most used public transit system in the nation in 2018, behind only New York, Chicago, and Los Angeles.
Within reach of that transit system, the Boston metropolitan statistical area covers about a third of Massachusetts and is home to nearly 70% of the population. Suffolk County (comprising the cities of Boston, Chelsea, Revere, and Winthrop) is home to nearly 800,000 residents on just 58 square miles, achieving a density of 14,000 people per square mile, similar to that of European cities of comparable size, such as Copenhagen (11,000 people/square mile). This density, in turn, helps avoid automobile reliance, with Suffolk County residents averaging about half of the daily per-capita VMT in adjacent Norfolk County.
As the Commonwealth’s population continues to grow, strategies such as dense- or transit-oriented development development that also facilitates the use of walking and biking for everyday trips can help stabilize VMT. Enabling both active transportation and public transit can deliver immense public benefits, including reduced congestion and improved cardiovascular health, although these strategies cannot by themselves drive down GHG emissions statewide on the pace and scale that is needed to achieve Net Zero by 2050.
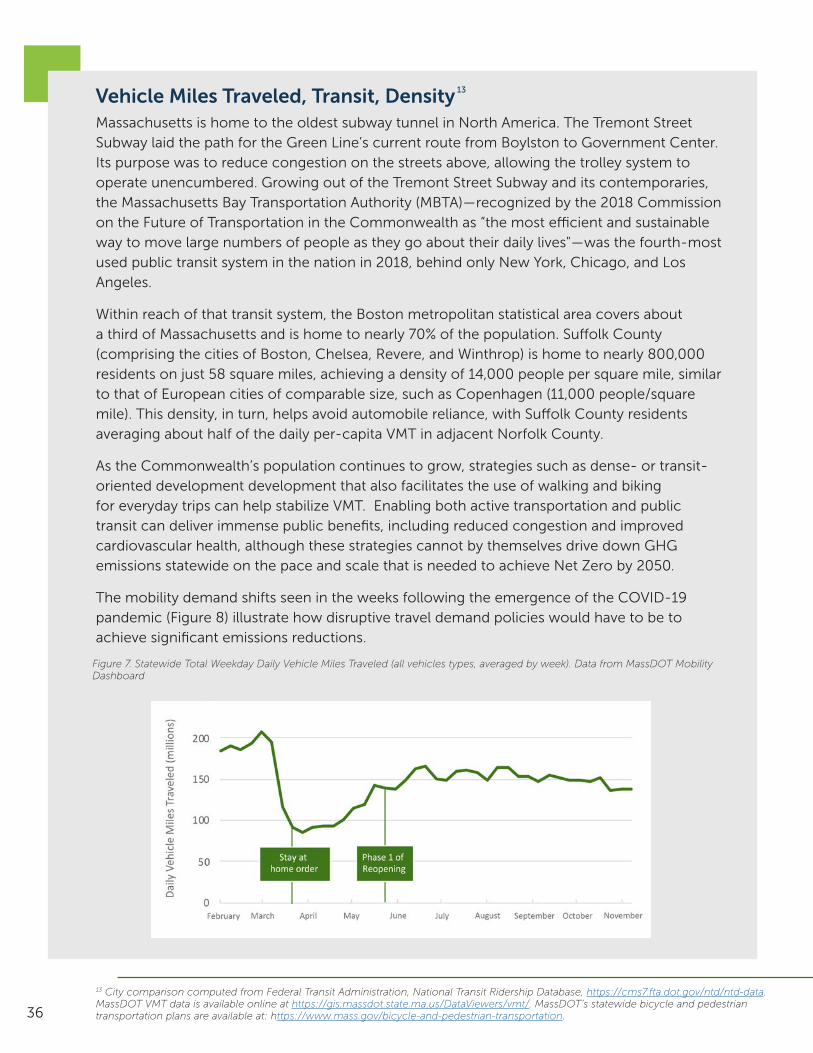
The mobility demand shifts seen in the weeks following the emergence of the COVID-19 pandemic (Figure 8) illustrate how disruptive travel demand policies would have to be to achieve significant emissions reductions.
Figure 7. Statewide Total Weekday Daily Vehicle Miles Traveled (all vehicles types, averaged by week). Data from MassDOT Mobility Dashboard
Vehicle Miles Traveled, Transit, Density
13 City comparison computed from Federal Transit Administration, National Transit Ridership Database, https://cms7.fta.dot.gov/ntd/ntd-data. MassDOT VMT data is available online at https://gis.massdot.state.ma.us/DataViewers/vmt/. MassDOT’s statewide bicycle and pedestrian transportation plans are available at: https://www.mass.gov/bicycle-and-pedestrian-transportation.
13

37
Shifting to EVs will likely deliver significant benefits to consumers, including health benefits. Because electric drivetrains are more efficient and require fewer moving parts than combustion engines, BEVs currently have a competitive total cost of ownership, despite higher up-front purchase costs. As BEV production scales up and battery costs continue to decline over the 2020s, upfront purchase costs are expected to reach parity, meaning that BEVs will have a lower total cost of ownership because of their fuel savings ($300 per year in Massachusetts)14 and lower maintenance costs.15
14 Muratori et al. Levelized Cost of Charging Electric Vehicles in the United States (July 2020). Joule https://www.cell.com/joule/pdfExtended/S2542-4351(20)30231-215 Hagman et al. Total cost of ownership and its potential implications for battery electric vehicle diffusion (March 2016) Research in Transportation Business & Management. https://www.sciencedirect.com/science/article/pii/S221053951600004316 Massachusetts does not have independent authority to regulate vehicle fuel efficiency or tailpipe emissions. However, under a federally granted waiver, California may issue such regulations for vehicles sold in that state, and under the provisions of Section 177 of the U.S. Clean Air Act, other states can adopt California vehicle emissions standards in lieu of otherwise applicable federal fuel efficiency requirements. Massachusetts is required by law (M.G.L. 111§142K) to adopt California’s vehicle emissions regulations if they are more stringent than the federal standards.17 See the Transportation Sector Technical Report for more information on this analysis.
Despite the opportunity presented by readily available EV options on the market, the turnover of vehicle stock represents a limitation for how quickly this transformation can occur cost-effectively. Even though most vehicles turn over relatively quickly in comparison to other types of stocks (for example, building envelopes may get retrofitted less than twice per century), most vehicles will be replaced only twice between now and 2050. The State of California is exploring regulatory options similar to those already in place in many European countries that will require 100% zero emissions LDV sales by 2035. When finalized, those California requirements would also apply to vehicles in Massachusetts.16 Given an average lifetime of less than 15 years, implementation of this regulation or a similar federal one in Massachusetts would likely result in a near-complete transition of the light-duty fleet to ZEVs by 2050.
Implications and Policy Context
However, the current pace of EV adoption in the Commonwealth lags the pace necessary to achieve interim decarbonization targets compliant with the GWSA. Without market intervention, fewer than 500,000 vehicles on the road are projected to be electrified by 2030.17 In contrast, reducing emissions 45% below 1990 levels by 2030 would require that about 1 million of the 5.5 million LDVs projected to be registered in the Commonwealth in 2030 be ZEVs.
Depending on how EV technologies, California and national policies, and local policy priorities evolve, a policy framework to address this transformation should maintain flexibility and serve as a mechanism to ensure the benefits and costs of vehicle electrification are as equitably distributed as possible.
The 50% drop in vehicle use immediately following initial stay at home orders, and the rebound to 80% of pre-pandemic levels, is a far greater reduction than most policy approaches can achieve. An evaluation of VMT-reduction and mode-shift strategies in the Transportation Sector Technical Report found, consistent with other similar studies, that even very aggressive and costly growth in transit or very high pricing policies have the potential to reduce state-wide VMT by just 5-15% in 2050. Transit, walking and biking are therefore a potentially important complement to electrification but by themselves cannot achieve reductions in VMT at the scale needed to achieve Net Zero.
38
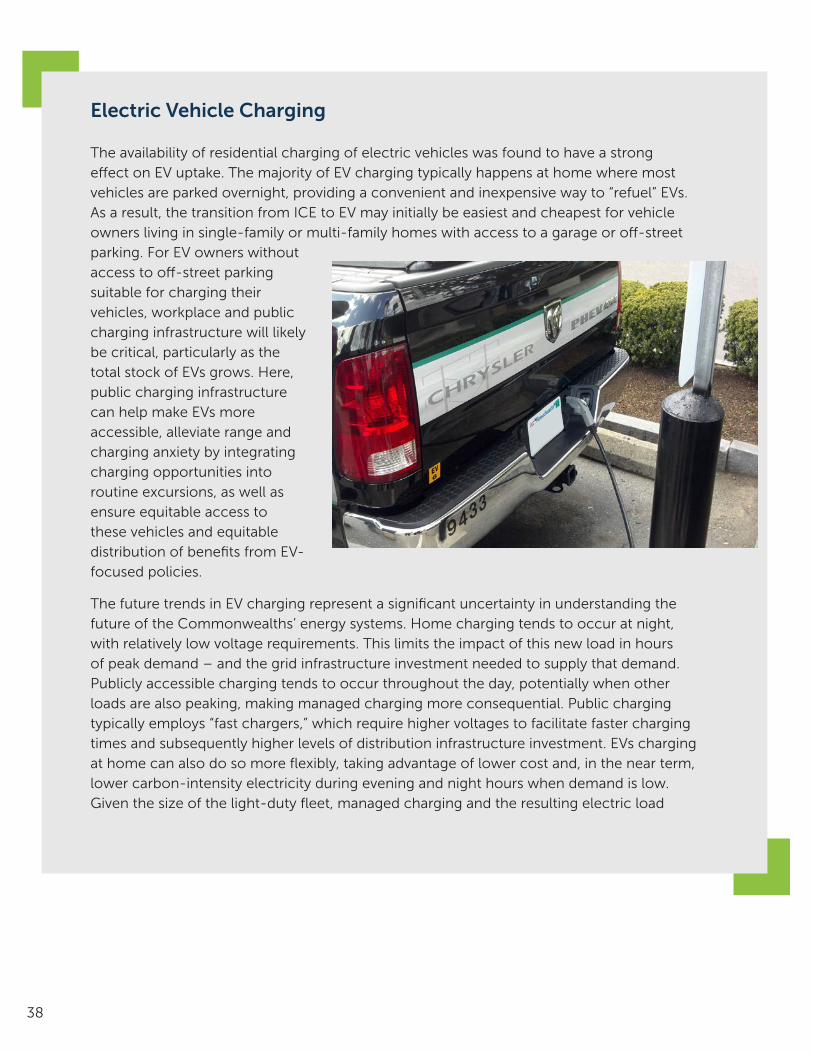
The availability of residential charging of electric vehicles was found to have a strong effect on EV uptake. The majority of EV charging typically happens at home where most vehicles are parked overnight, providing a convenient and inexpensive way to “refuel” EVs. As a result, the transition from ICE to EV may initially be easiest and cheapest for vehicle owners living in single-family or multi-family homes with access to a garage or off-street parking. For EV owners without access to off-street parking suitable for charging their vehicles, workplace and public charging infrastructure will likely be critical, particularly as the total stock of EVs grows. Here, public charging infrastructure can help make EVs more accessible, alleviate range and charging anxiety by integrating charging opportunities into routine excursions, as well as ensure equitable access to these vehicles and equitable distribution of benefits from EV-focused policies.
The future trends in EV charging represent a significant uncertainty in understanding the future of the Commonwealths’ energy systems. Home charging tends to occur at night, with relatively low voltage requirements. This limits the impact of this new load in hours of peak demand – and the grid infrastructure investment needed to supply that demand. Publicly accessible charging tends to occur throughout the day, potentially when other loads are also peaking, making managed charging more consequential. Public charging typically employs “fast chargers,” which require higher voltages to facilitate faster charging times and subsequently higher levels of distribution infrastructure investment. EVs charging at home can also do so more flexibly, taking advantage of lower cost and, in the near term, lower carbon-intensity electricity during evening and night hours when demand is low. Given the size of the light-duty fleet, managed charging and the resulting electric load
Electric Vehicle Charging
39
Medium- and Heavy-Duty Transportation, Aviation, and Shipping
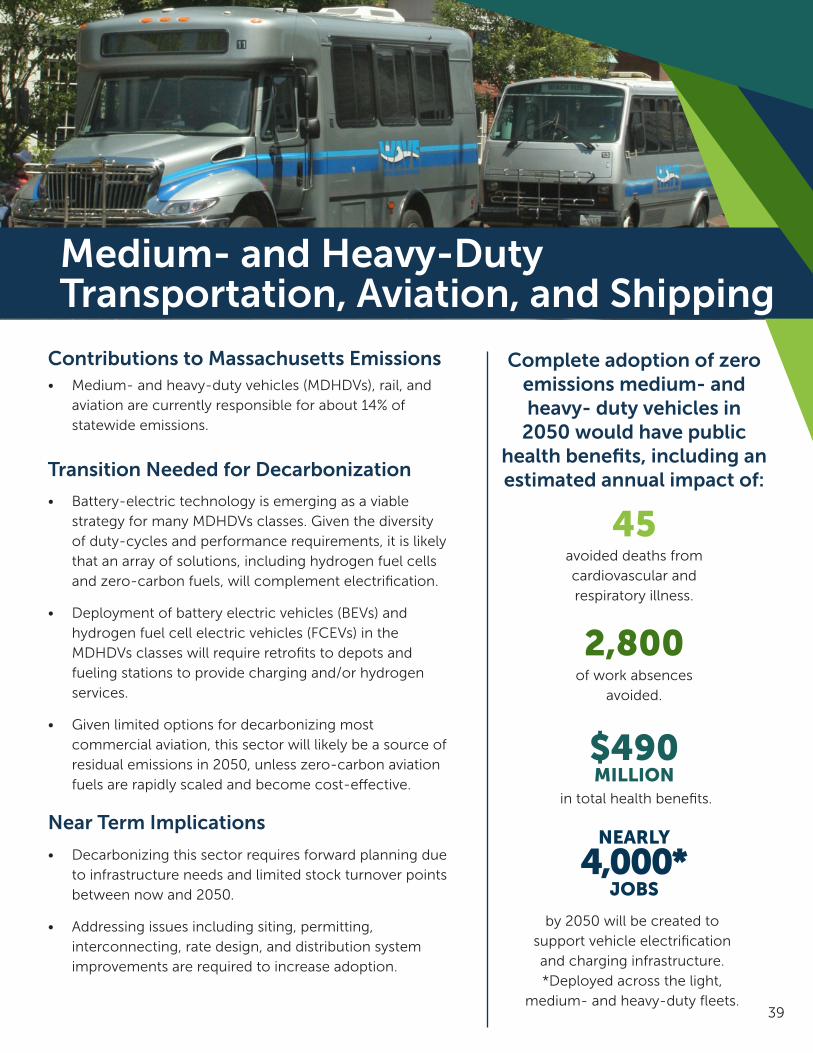
• Medium- and heavy-duty vehicles (MDHDVs), rail, and aviation are currently responsible for about 14% of statewide emissions.
avoided deaths from cardiovascular and respiratory illness.
of work absences avoided.
in total health benefits.
Complete adoption of zero emissions medium- and heavy- duty vehicles in
2050 would have public health benefits, including an estimated annual impact of:
by 2050 will be created to support vehicle electrification and charging infrastructure. *Deployed across the light,
medium- and heavy-duty fleets.
45
2,800
$490MILLION
NEARLY
4,000*JOBS
Contributions to Massachusetts Emissions
Transition Needed for Decarbonization
Near Term Implications
• Battery-electric technology is emerging as a viable strategy for many MDHDVs classes. Given the diversity of duty-cycles and performance requirements, it is likely that an array of solutions, including hydrogen fuel cells and zero-carbon fuels, will complement electrification.
• Deployment of battery electric vehicles (BEVs) and hydrogen fuel cell electric vehicles (FCEVs) in the MDHDVs classes will require retrofits to depots and fueling stations to provide charging and/or hydrogen services.
• Given limited options for decarbonizing most commercial aviation, this sector will likely be a source of residual emissions in 2050, unless zero-carbon aviation fuels are rapidly scaled and become cost-effective.
• Decarbonizing this sector requires forward planning due to infrastructure needs and limited stock turnover points between now and 2050.
• Addressing issues including siting, permitting, interconnecting, rate design, and distribution system improvements are required to increase adoption.
40
While electrification has emerged as the dominant least-cost strategy for decarbonizing light-duty passenger cars and trucks, alternative technologies such as hydrogen fuel cells or low-carbon fuels are likely to complement electrification for the MDHDVs that mostly serve commercial applications like delivery services, transit buses, garbage collection pickup, construction, and long-haul shipping. This may be even more true for off-road modes, such as rail, boats, and aircraft. These vehicle classes often serve longer ranges, frequently have limited downtime, and require higher power outputs than LDVs, and therefore require a broader set of technology solutions and more flexible implementation strategies.
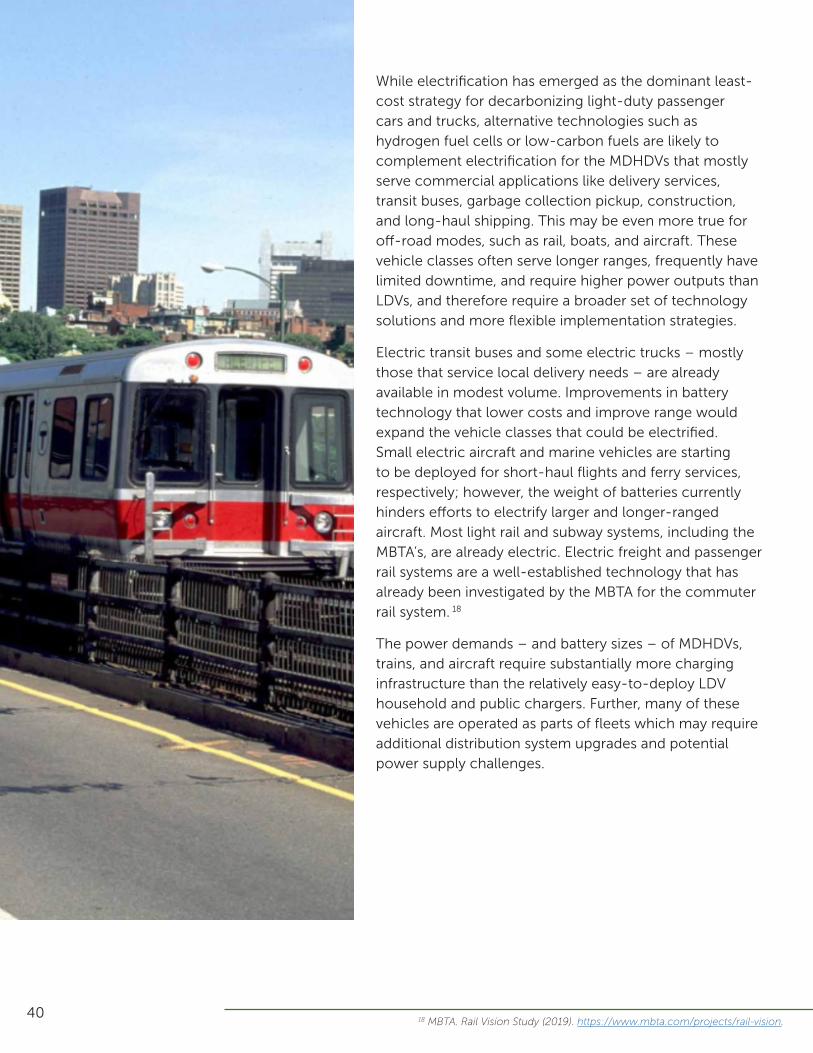
Electric transit buses and some electric trucks – mostly those that service local delivery needs – are already available in modest volume. Improvements in battery technology that lower costs and improve range would expand the vehicle classes that could be electrified. Small electric aircraft and marine vehicles are starting to be deployed for short-haul flights and ferry services, respectively; however, the weight of batteries currently hinders efforts to electrify larger and longer-ranged aircraft. Most light rail and subway systems, including the MBTA’s, are already electric. Electric freight and passenger rail systems are a well-established technology that has already been investigated by the MBTA for the commuter rail system. 18
The power demands – and battery sizes – of MDHDVs, trains, and aircraft require substantially more charging infrastructure than the relatively easy-to-deploy LDV household and public chargers. Further, many of these vehicles are operated as parts of fleets which may require additional distribution system upgrades and potential power supply challenges.
18 MBTA. Rail Vision Study (2019). https://www.mbta.com/projects/rail-vision.
Public transit buses emit only a small fraction of the Commonwealth’s GHG emissions, and also provide a crucial low-emission mode of transportation for many Massachusetts residents. However, as highly visible, publicly-owned assets, they represent a key opportunity for public agencies to lead by example by investing in the cleanest vehicles available. Transit buses run on regular schedules and routes that provide opportunities for layover and on-route charging, making them suitable for early-generation battery-electric powertrains that are not yet ideal for long-haul trucking. Moreover, the early deployment of battery-electric buses by major public transit authorities may help spur technology improvements and catalyze market growth for alternative powertrains across a wider range of duty-cycles.
The Martha’s Vineyard Transit Authority (VTA) has already announced a commitment to move to an all-electric bus fleet, replacing its diesel buses upon their scheduled retirement. The electric buses reduce the fleet’s maintenance costs and have shown improved reliability compared to their diesel counterparts in Martha’s Vineyard’s operating conditions. In addition, they have reduced noise pollution and decreased the agency’s reliance on diesel fuel that must be shipped from the mainland. VTA is also investing in distributed bus charging platforms that give each bus a partial charge at each stop, as well as a bus depot outfitted with solar panels and battery storage in order to minimize reliance on imported electricity, while also allowing the buses to fully charge overnight at the end of their duty-cycles.19 Depot charging supported by energy storage also provides an element of resilience in case of weather disturbances or other power outages.
However, battery-electric bus technology is still developing and is not yet ready for the immediate and cost-effective deployment across all of the Commonwealth’s public transportation agencies. While the powertrain is effective on Martha’s Vineyard, the MBTA’s pilot programs so far have found that battery-electric buses are too limited in range, vulnerable to extremes of weather, and generally less reliable than conventional buses for the specific operating needs of the MBTA and its riders. In addition, the majority of MBTA bus garages will need to be upgraded or replaced before the MBTA can fully shift to a battery-electric fleet, a significant and costly undertaking that is still in its early stages.
Despite these challenges, the MBTA recognizes that battery-electric technology is a crucial component of future bus service, and is working to expand its electric bus fleet by seeking out routes and facilities that are feasible to electrify with the technology and infrastructure that is available today. With each new opportunity, the MBTA is able to learn more about how best to operate battery-electric buses as part of the MBTA system, and to incrementally increase the number of battery-electric buses in its fleet. In addition, the MBTA is pursuing construction of a new $250-million bus facility in Quincy, which will ultimately be home to a substantial fleet of battery-electric buses. With all of these various efforts, the MBTA is looking to a future of a fully electric bus fleet and accompanying infrastructure.
In the interim, the MBTA is also procuring enhanced electric hybrid buses, which provide the operating reliability and meaningful near-term emissions reductions that are on pace to support the economy-wide emissions reductions needed to achieve Net Zero.
Transit Electrification
19 American Public Transportation Association. Working with BEB Charging Infrastructure (2020). https://www.apta.com/wp-content/uploads/Working-with-BEB-Charging-Infrastructure-07-15-2020-FINAL.pdf
42
A recent paper from the Boston University (BU) School of Public Health found substantial improvements in health outcomes associated with reducing fuel combustion in all sectors from the implementation of a net-zero goal for the City of Boston.20 The study found that reductions in particulate matter (PM2.5) and other pollutants from the elimination of fuel combustion solely in Suffolk County would lead to $1.7 billion per year in savings in the county, and a total of $2.4 billion per year across the Metro Boston region. These savings were driven largely by a reduction in 288 deaths per year across the region, along with a reduction in heart attacks, asthma events, related hospitalizations, and more than 26,000 lost days of work per year. The study further demonstrated that these health benefits would be principally realized by people of color, with abatement of PM2.5 emissions leading to the avoidance of three times as many deaths per capita per year among Blacks than Whites in the Boston area (17.6 per 100,000 vs. 5.5 per 100,000). The BU study assumes comprehensive elimination of emissions across all sectors, which differs from health impact estimates reported elsewhere in the Roadmap Study.
Across Massachusetts, medium- and heavy-duty trucks and buses emit more than 1,300 tons of PM2.5 and 30,000 tons of nitrogen oxides (NOx), representing a small but significant source of statewide air pollution.21 While the deployment of liquid zero-carbon fuels in these vehicles may reduce net GHG emissions, adoption of ZEVs offers a key opportunity to drive public health benefits across the Commonwealth. Moreover, as the hub for the Commonwealth‘s economic activity, the majority of emissions generated in Suffolk County come from vehicles driven into the county, not generated by vehicles originating within the county. The residents of Suffolk County – of whom more than 70% live in census blocks designated as EJ communities – thus bear a disproportionate share of the burden of these emissions. Transitioning to primarily ZEVs statewide will dramatically reduce, if not eliminate, these impacts.
Research Highlight: Improved Health Outcomes By Reducing Combustion
20 Raifman et al. Quantifying the health impacts of eliminating air pollution emissions in the City of Boston (2020) Environmental Research Letters 15(9). https://doi.org/10.1088/1748-9326/ab842b.21 U.S. Environmental Protection Agency. COBRA (2020) https://www.epa.gov/stat elocalenergy/co-benefits-risk-assessment-cobra-health-impacts-screening-and-mapping-tool#2.
43
Implications and Policy Context
Despite being smaller contributors to Massachusetts’ emissions than LDVs, emissions from MDHDVs, aviation, and rail still make up a considerable portion of the GHG inventory. If left reliant on fossil fuels, emissions from these subsectors alone would approach Massachusetts’ statewide 2050 emission limit. Compared to LDVs, the technological solutions are less certain, and in the next 30 years, most vehicles in these classes will only turn over once, ideally coinciding with commercial availability of a suitable, competitively priced zero-emissions alternative. Given this constraint, transit agencies and private sector fleet operators will need to start planning for fleet-wide decarbonization by identifying the most appropriate solutions early. At the same time, the Commonwealth, together with regional and federal partners, must pursue strategies that encourage decarbonized options for MDHDVs to mature to meet the needs of these subsectors in a timely and cost-effective manner.
Because the MDHDV decarbonization strategies still lag those for LDVs, early piloting and planning through the 2020s will be necessary to prepare for more deeply decarbonizing these fleets in the 2030s. Such first steps include electrifying portions
of an operational fleet to build experience with managing electrified fleets or piloting hydrogen solutions where appropriate. For example, the MBTA, the Worcester Regional Transit Authority, the Pioneer Valley Transit Authority, and Martha’s Vineyard Transit Authority have piloted battery-electric buses. The Commonwealth has already begun supporting these efforts with funding from both the Massachusetts Department of Environmental Protection and the Massachusetts Clean Energy Center.
The complexity associated with charging and hydrogen infrastructure is a key barrier to the deployment of ZEVs in MDHDV fleets. Increasing adoption will require addressing issues around siting, permitting, interconnecting, and rate design for EV charging and likely significant electrical distribution system improvements needed to support it. Hydrogen requires the development of new storage and safety protocols that will need to be incorporated into siting and permitting processes. Efforts to identify, plan, and build make-ready depots and facilities will expedite ZEV adoption in the 2030s and minimize legacy stock still operating in 2050.
22 World Economic Forum (2020). Clean Skies for Tomorrow; Sustainable Aviation Fuels as a Pathway to Net-Zero Aviation. https://www.mckinsey.com/industries/travel-logistics-and-transport-infrastructure/our-insights/scaling-sustainable-aviation-fuel-today-for-clean-skies-tomorrow.
Today’s emergent hydrogen fuel cell electric MDHDVs tend to support longer ranges than battery-electric MDHDVs, making them applicable to intercity buses, freight trucking, and other longer-range applications. However, deployment of such vehicles would require the development of hydrogen generation and distribution systems, although some garaged fleets may be able to leverage a single distribution system. Ammonia – an alternative form of hydrogen storage – has potential in marine shipping. While hydrogen can be advantageous in some aviation uses, the infrastructure needs of hydrogen fueling at airports have been identified as a key barrier to its applicability in that subsector.22
“Drop-in” zero-carbon liquid fuels – those that could substitute fossil fuels directly within the same vehicle and engine – would not need the infrastructure upgrades required by electric or hydrogen vehicles and avoid the need for full fleet transitions. However, such fuels have not yet emerged at scale. If they do, it is anticipated they will be more expensive than electricity or hydrogen. Despite several constraints that limit their widespread use across the transportation sector (as discussed in the callout box in Chapter 3), they are likely to be the only significant decarbonization solution in subsectors like commercial aviation, particularly given the relatively long lifespans of large aircraft.
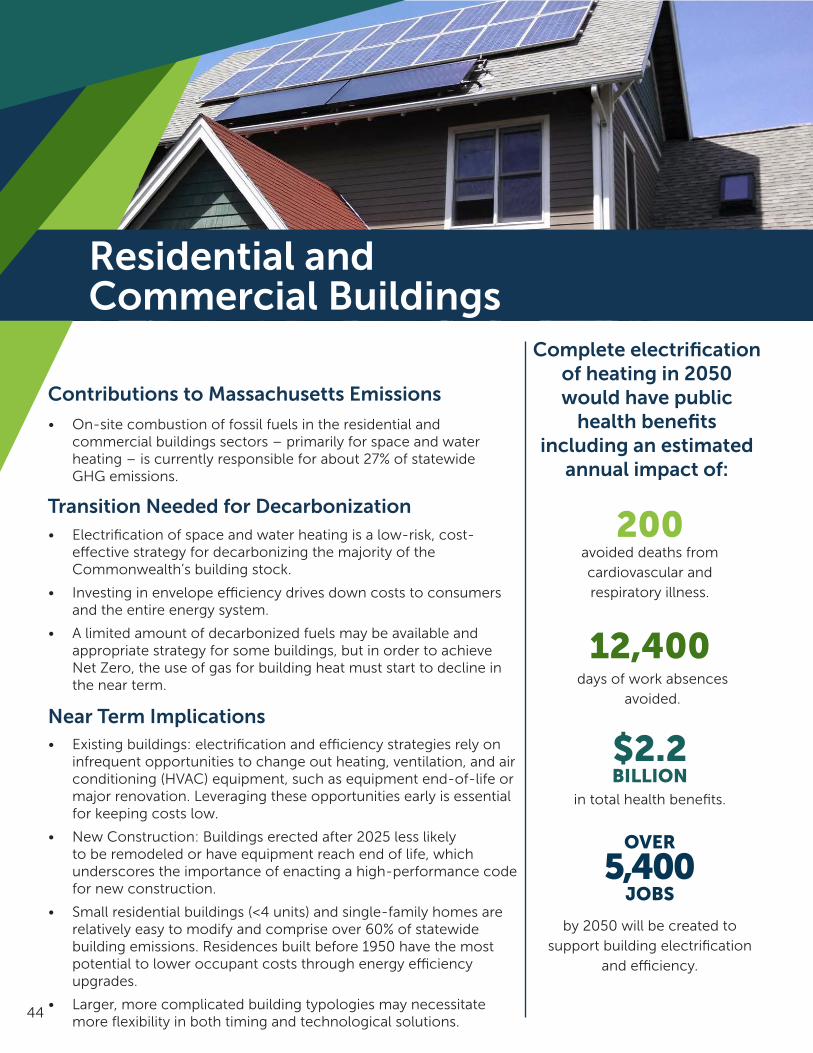
44
Residential and Commercial Buildings
avoided deaths from cardiovascular and respiratory illness
days of work absences avoided; and,
in total health benefits.
• On-site combustion of fossil fuels in the residential and commercial buildings sectors – primarily for space and water heating – is currently responsible for about 27% of statewide GHG emissions.
avoided deaths from cardiovascular and respiratory illness.
days of work absences avoided.
in total health benefits.
Complete electrification of heating in 2050 would have public
health benefits including an estimated
annual impact of:
by 2050 will be created to support building electrification
and efficiency.
200
12,400
$2.2BILLION
OVER
5,400JOBS
Contributions to Massachusetts Emissions
Transition Needed for Decarbonization
Near Term Implications
• Electrification of space and water heating is a low-risk, cost-effective strategy for decarbonizing the majority of the Commonwealth’s building stock.
• Investing in envelope efficiency drives down costs to consumers and the entire energy system.
• A limited amount of decarbonized fuels may be available and appropriate strategy for some buildings, but in order to achieve Net Zero, the use of gas for building heat must start to decline in the near term.
• Existing buildings: electrification and efficiency strategies rely on infrequent opportunities to change out heating, ventilation, and air conditioning (HVAC) equipment, such as equipment end-of-life or major renovation. Leveraging these opportunities early is essential for keeping costs low.
• New Construction: Buildings erected after 2025 less likely to be remodeled or have equipment reach end of life, which underscores the importance of enacting a high-performance code for new construction.
• Small residential buildings (<4 units) and single-family homes are relatively easy to modify and comprise over 60% of statewide building emissions. Residences built before 1950 have the most potential to lower occupant costs through energy efficiency upgrades.
• Larger, more complicated building typologies may necessitate more flexibility in both timing and technological solutions.

45
Widespread Electrification of Space Heat and Other Building Energy Needs
The combustion of natural gas, oil, and propane for building heating is the largest end use contributor to emissions in the buildings sector. This is followed by hot water heating, cooking, and other processes such as clothes drying. Electricity is the primary energy source for all other building energy demands (appliances, entertainment and office equipment, ventilation and HVAC support).23
Across a wide range of potential futures, electrification of end uses, particularly space heating through the use of electric heat pumps, was found to be the most economically advantageous and cost-effective decarbonization strategy for widespread deployment across the Commonwealth’s building sector, especially for residences and homes, which account for about 60% of all buildings sector emissions. As discussed further in this section, depending on the building type and energy needs, the upfront costs associated with electrification vary. Today, they are typically low for buildings with low thermal demands (e.g., offices and schools), modest for small residences, and potentially significant for energy-intensive buildings (e.g., hospitals and convention centers).
As systems that can provide heating, cooling, and dehumidification, electric heat pumps provide a single-equipment solution for meeting the entire typical range of building space conditioning needs. And they can do so extremely efficiently: by extracting and moving ambient heat, rather than producing it through combustion, currently-available heat pumps can deliver two to six24 times the amount of energy that they consume year-round, including during periods of bitter cold winter weather. This high level of energy efficiency drives the cost-effectiveness of heat pump technology, particularly as an affordable solution for widespread deployment. Under all pathways examined in the Roadmap Study,
23 Electricity emissions from building end uses are accounted for in the electricity sector, though managing electric loads at the building scale is an important component of least-cost decarbonization system-wide.
24 The coefficient of performance (COP) ratio of useful heating to energy consumed is used to describe the effectiveness of a heat pump and is directly comparable to the efficiency rating of fuel-consuming furnaces and boilers. Heat pump COPs can range from 2-6.
25 NREL Electrification Futures Study (December 2017): https://www.nrel.gov/docs/fy18osti/70485.pdf.
including one specifically designed to explore the potential for “at scale” blending of zero-carbon gas into the pipeline, increasing penetration of electrified thermal technologies in up to 95% of buildings reduced economy-wide costs. As heat pumps become more widely used, the current market variability of installation costs is expected to stabilize, and equipment performance is anticipated to continue to improve, further improving the long-term advantages of heat pumps relative to fossil fuel equipment, regardless of fuel.25
The most cost-effective time for an existing building to transition to a heat pump system is during routine home improvements or when an older HVAC system must be replaced. However, furnaces and boilers generally turn over just once every 15 to 30 years, leaving relatively few opportunities to decarbonize the two million buildings covering 5.6 billion square feet of floorspace that comprise Massachusetts’ existing built environment.
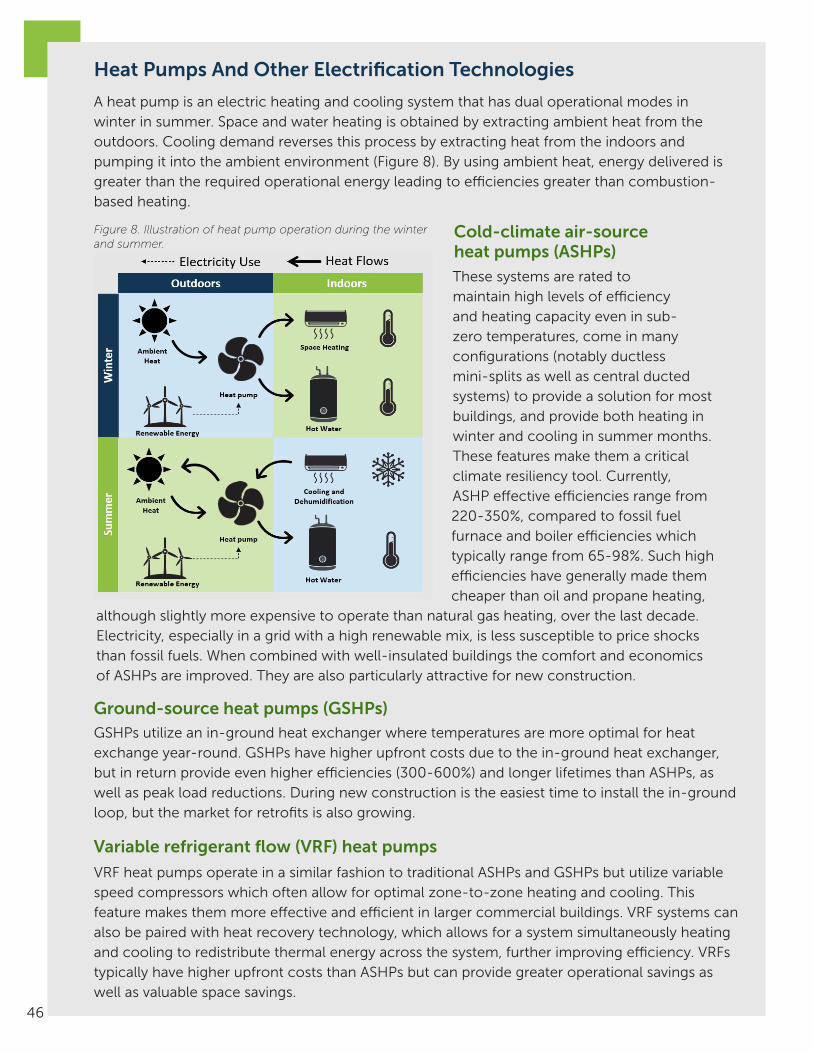
46
VRF heat pumps operate in a similar fashion to traditional ASHPs and GSHPs but utilize variable speed compressors which often allow for optimal zone-to-zone heating and cooling. This feature makes them more effective and efficient in larger commercial buildings. VRF systems can also be paired with heat recovery technology, which allows for a system simultaneously heating and cooling to redistribute thermal energy across the system, further improving efficiency. VRFs typically have higher upfront costs than ASHPs but can provide greater operational savings as well as valuable space savings.
Variable refrigerant flow (VRF) heat pumps
Ground-source heat pumps (GSHPs)GSHPs utilize an in-ground heat exchanger where temperatures are more optimal for heat exchange year-round. GSHPs have higher upfront costs due to the in-ground heat exchanger, but in return provide even higher efficiencies (300-600%) and longer lifetimes than ASHPs, as well as peak load reductions. During new construction is the easiest time to install the in-ground loop, but the market for retrofits is also growing.
Heat Pumps And Other Electrification Technologies
These systems are rated to maintain high levels of efficiency and heating capacity even in sub-zero temperatures, come in many configurations (notably ductless mini-splits as well as central ducted systems) to provide a solution for most buildings, and provide both heating in winter and cooling in summer months. These features make them a critical climate resiliency tool. Currently, ASHP effective efficiencies range from 220-350%, compared to fossil fuel furnace and boiler efficiencies which typically range from 65-98%. Such high efficiencies have generally made them cheaper than oil and propane heating,
although slightly more expensive to operate than natural gas heating, over the last decade. Electricity, especially in a grid with a high renewable mix, is less susceptible to price shocks than fossil fuels. When combined with well-insulated buildings the comfort and economics of ASHPs are improved. They are also particularly attractive for new construction.
Cold-climate air-source heat pumps (ASHPs)
A heat pump is an electric heating and cooling system that has dual operational modes in winter in summer. Space and water heating is obtained by extracting ambient heat from the outdoors. Cooling demand reverses this process by extracting heat from the indoors and pumping it into the ambient environment (Figure 8). By using ambient heat, energy delivered is greater than the required operational energy leading to efficiencies greater than combustion-based heating.
Figure 8. Illustration of heat pump operation during the winter and summer.
47
Figure 9 shows how the potential mitigation costs associated with building electrification change across the Commonwealth’s building stock from both a total cost and a replacement cost perspective. The longest segments in the figure represent small residential buildings (fewer than four units), which have the largest decarbonization opportunity for the Commonwealth’s building stock. These buildings are not particularly difficult to modify, on average, and comprise 60% of both statewide building emissions and floorspace. Residential buildings built before 1950 (32% of the building stock and 21% of the floor space), which tend to have leakier envelopes, have the highest potential for emissions savings though conversion to electric heat, especially when coupled with efficiency. When looked at collectively, these buildings represent the largest mitigation opportunity in the Commonwealth’s building sector. The sheer number of buildings requiring retrofits, however, offers a significant logistical challenge.
This Roadmap Study’s findings regarding the long-term financial benefit that will accrue to most owners who deploy a heat pump-based decarbonization strategy is consistent with the findings of other studies26 and shows modest savings for many, though not all, end-of-life decarbonization-driven conversions across building types. However, the largest barriers to adoption are not based solely on cost. Many residential and small business consumers lack awareness about heat pumps as an alternative to their current furnace or boiler systems. In addition, the availability of trained heat pump installers and equipment must be expanded to allow the industry to scale up. Policy intervention to alleviate these key non-equipment-cost variables can help ensure that heat pumps are successfully deployed when aging fossil fuel systems need replacement, allowing these infrequent transition points to be fully, and most cost-effectively leveraged.
Heat pump water heaters (HPWHs)These water heating systems collect heat from the surrounding air and compress and pump this heat into hot water tanks. They heat water more slowly than combustion systems, but also much more efficiently. Since hot water is not needed at every hour of the day, properly-sized HPWHs are able to maximize efficiency while ensuring sufficient hot water is available when needed.
Induction stove topsThese electric cooking surfaces are cool to the touch, but can bring water to a boil faster than gas or electric coil stoves. By creating an oscillating magnetic field, these cooktops directly heat the cooking vessel and thus create less waste heat while being very responsive to user adjustments. With no combustion, they are both safer to operate and produce no indoor air pollution from heating, which is an important benefit for respiratory illnesses such as asthma.
26 Including: Rocky Mountain Institute. The Economics of Electrifying Buildings (2018) https://rmi.org/wp-content/uploads/2018/06/RMI_Economics_of_Electrifying_Buildings_2018.pdf; State of RI. Heating Sector Transformation. (2020) http://www.energy.ri.gov/documents/HST/RI%20HST%20Final%20Pathways%20Report%204-22-20.pdf, NEEP. ASHP Market Strategies Report (2016) https://neep.org/sites/default/files/NEEP_ASHP_2016MTStrategy_Report_FINAL.pdf, and Synapse. Switch on the Savings (2018) https://www.synapse-energy.com/about-us/blog/switch-savings-heat-pump-cost-effectiveness-study
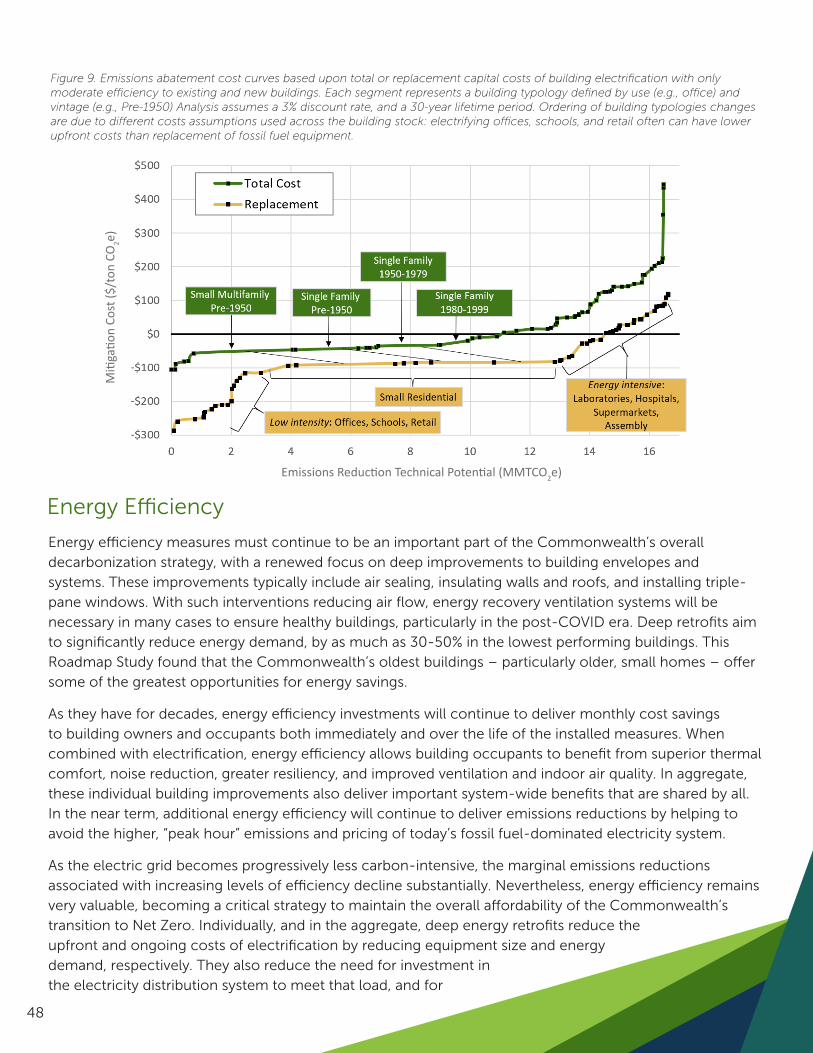
48
Figure 9. Emissions abatement cost curves based upon total or replacement capital costs of building electrification with only moderate efficiency to existing and new buildings. Each segment represents a building typology defined by use (e.g., office) and vintage (e.g., Pre-1950) Analysis assumes a 3% discount rate, and a 30-year lifetime period. Ordering of building typologies changes are due to different costs assumptions used across the building stock: electrifying offices, schools, and retail often can have lower upfront costs than replacement of fossil fuel equipment.
Energy Efficiency
Energy efficiency measures must continue to be an important part of the Commonwealth’s overall decarbonization strategy, with a renewed focus on deep improvements to building envelopes and systems. These improvements typically include air sealing, insulating walls and roofs, and installing triple-pane windows. With such interventions reducing air flow, energy recovery ventilation systems will be necessary in many cases to ensure healthy buildings, particularly in the post-COVID era. Deep retrofits aim to significantly reduce energy demand, by as much as 30-50% in the lowest performing buildings. This Roadmap Study found that the Commonwealth’s oldest buildings – particularly older, small homes – offer some of the greatest opportunities for energy savings.
As they have for decades, energy efficiency investments will continue to deliver monthly cost savings to building owners and occupants both immediately and over the life of the installed measures. When combined with electrification, energy efficiency allows building occupants to benefit from superior thermal comfort, noise reduction, greater resiliency, and improved ventilation and indoor air quality. In aggregate, these individual building improvements also deliver important system-wide benefits that are shared by all. In the near term, additional energy efficiency will continue to deliver emissions reductions by helping to avoid the higher, “peak hour” emissions and pricing of today’s fossil fuel-dominated electricity system.
As the electric grid becomes progressively less carbon-intensive, the marginal emissions reductions associated with increasing levels of efficiency decline substantially. Nevertheless, energy efficiency remains very valuable, becoming a critical strategy to maintain the overall affordability of the Commonwealth’s transition to Net Zero. Individually, and in the aggregate, deep energy retrofits reduce the upfront and ongoing costs of electrification by reducing equipment size and energy demand, respectively. They also reduce the need for investment in the electricity distribution system to meet that load, and for
Miti
gatio
n Co
st ($
/ton
CO
2e)
Emissions Reduction Technical Potential (MMTCO2e)

49
Reducing Heat Stress in a Warming Climate with Cooling
About 20% of Massachusetts households do not have any home air conditioning, and almost 60% more rely on window or wall air conditioning units.27 National data indicate that lower-income populations have less access to air conditioning than higher-income populations. Even in today’s climate, indoor temperatures can rise to unsafe levels, putting occupants at a potential health and safety risk.
In building simulations of a pre-1950 single-family home, indoor temperatures today may exceed 91°F – the temperature above which heat exhaustion and heat stroke become a risk according to the Mayo Clinic – 14% of the time each year (Figure 10). This issue is exacerbated by a warming climate, with indoor temperatures without cooling exceeding the dangerous 91°F threshold 19% of the year under an extreme climate scenario. The installation of a heat pump would negate this effect. Heat pumps are capable of meeting increased cooling demands resulting from a warming climate, and they simultaneously electrify heating demands, all with a single piece of equipment. Heat pumps are also capable of dehumidifying indoor spaces, which improves indoor air quality, reduces mold, and improves health outcomes.
Figure 10. Distribution of present and future indoor temperatures during a 7-day heat wave.
27 U.S. Energy Information Agency. 2009 Residential Energy Consumption Survey. https://www.eia.gov/consumption/residential/reports/2009/state_briefs/pdf/ma.pdf
additional renewable energy generation and reliability resources. While some of these cost reductions are immediately reflected in lower utility bills, many of the benefits of efficiency accrue at the system level and are realized by all, even when paid for by individual building owners. This dynamic underscores the value of a building efficiency financing mechanism that internalizes these system benefits for all users.
0%
10%
20%
30%
40%
50%
60%
70%
80%
70-79 °F 80-89 °F 90-99 °F 100-109 °F >109 °F
Shar
e of
Hou
rs b
y Te
mpe
ratu
re
Indoor Tempaerature
Building with cooling
Building without cooling
High risk of heat stressLow risk of heat stress
Indoor Temperature
Shar
e of
Hou
rs b
y Te
mpe
ratu
re
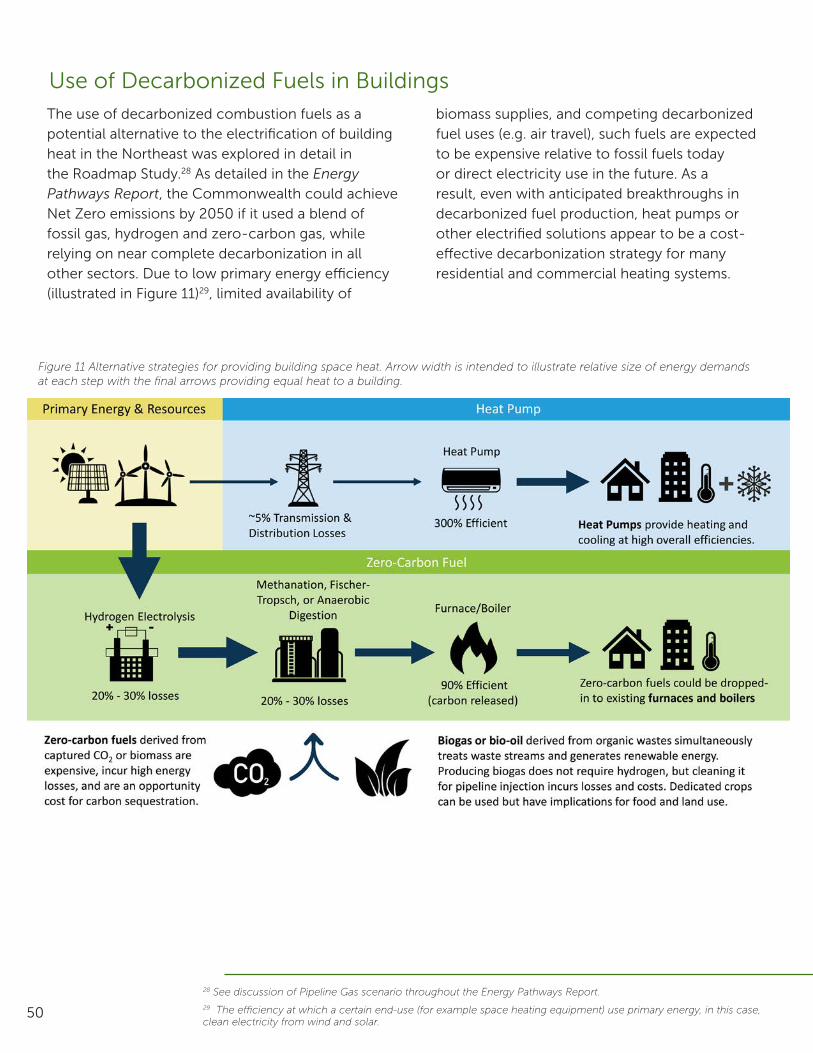
50
Use of Decarbonized Fuels in BuildingsThe use of decarbonized combustion fuels as a potential alternative to the electrification of building heat in the Northeast was explored in detail in the Roadmap Study.28 As detailed in the Energy Pathways Report, the Commonwealth could achieve Net Zero emissions by 2050 if it used a blend of fossil gas, hydrogen and zero-carbon gas, while relying on near complete decarbonization in all other sectors. Due to low primary energy efficiency (illustrated in Figure 11)29, limited availability of
28 See discussion of Pipeline Gas scenario throughout the Energy Pathways Report.29 The efficiency at which a certain end-use (for example space heating equipment) use primary energy, in this case, clean electricity from wind and solar.
biomass supplies, and competing decarbonized fuel uses (e.g. air travel), such fuels are expected to be expensive relative to fossil fuels today or direct electricity use in the future. As a result, even with anticipated breakthroughs in decarbonized fuel production, heat pumps or other electrified solutions appear to be a cost-effective decarbonization strategy for many residential and commercial heating systems.
Figure 11 Alternative strategies for providing building space heat. Arrow width is intended to illustrate relative size of energy demands at each step with the final arrows providing equal heat to a building.
51
As described elsewhere in this report,30 and at length in the Energy Pathways Report, the use of low and zero-carbon fuels, synthesized mainly from biomass and from “green hydrogen” produced by zero-carbon electricity, is likely necessary to achieve Net Zero by 2050 and was present in all pathways the Roadmap Study examined. It is important to note that gas use continues in some quantity across all Net Zero pathways, including for space heating.31 Indeed, even with the widespread deployment of heat pumps, gas-fired heat – whether blended with zero-carbon gas or not – is expected to remain economically viable in certain locations and for a limited number of specific buildings or building types.32 Similarly, limited local use of renewable gas could be both economically viable and desirable.33
Increasing reliance on zero-carbon fuels by 2050, however, raises costs compared to other pathways. This level of demand for expensive, imported biofuels and hydrogen would exceed Massachusetts’ population share after competing uses in other areas of the economy are considered.34 Increasing demand for bioenergy resources beyond this level not only increases costs, but likely increases the risk of environmental degradation and emissions leakage to regions that produce these fuels. For hydrogen, the level of demand exceeds what would be produced at a relatively low cost as part of a strategy to optimize electricity system operations in connection with renewable availability. The marginal cost of hydrogen electrolysis increases when the best sites for renewables are already taken and its co-benefits as a renewable electricity grid asset become saturated. Furthermore, a gas-reliant pathway all but requires widespread deep energy retrofits.35 Deferring efficiency investments will lead to increased demand for bioenergy and hydrogen resources above and beyond what is discussed above, magnifying exposure to high energy costs and risks around fuel supply availability.
In addition to fuel costs, a strategy reliant on the continued use of pipeline gas for building heat carries asymmetric risks compared to electrification.36 A future increase in the price of pipeline gas together with increasing reductions in costs associated with heat pumps could result in a significant cost-driven market advantage for heat pumps that, regardless of policy, leads to a large, uncontrolled customer exit from the gas system. As identified in the Energy Pathways Report,37 and as currently under investigation by the Department of Public Utilities,38 there are risks and challenges in implementing even a controlled or planned exit from widespread, primarily residential, use of the gas system. The potential for an uncontrolled exit driven by market economics raises significant additional equity concerns.
30 See “Key Constraints” and “Zero Carbon Fuels and Bioenergy Resources” in Chapter 4.
31 Energy Pathways Report, Figures 10, 13 – 15.
32 Such use within a Net Zero emissions constraint will likely depend on location – for example, proximity to transportation pipelines and to available space for added electricity infrastructure – and economics, likely restricting such usage, as a practical matter, to high value commercial or industrial businesses with large, complex or unique facilities, like major urban indoor sports arenas or very tall urban office towers.
33 Waste biomass may be advantageous in certain areas for limited biogas production and could provide niche and geographically-specific opportunities for decarbonized space heat; several anaerobic digestors in Massachusetts at farms and wastewater treatment plants currently co-generate electricity and heat for buildings. Cleaning biogas for injection into the gas distribution system, however, normally incurs measurable costs and efficiency losses.
34 See the Energy Pathways Report, Figure 32 and associated text.
35 Modeled as deep envelope efficiency upgrades applied at nearly 100% of stock turnover opportunities, reaching approximately 70% of all buildings by 2050. This level of deep energy retrofit is indicated across scenarios as being cost-effective individually and system-wide. However, as explored in the Limited Energy Efficiency scenario, no similar fuel supply risk is present for scenarios relying primarily on higher levels of building heat electrification.
36 There are also risks and uncertainties associated with a high electrification pathway: risks include impacts on electricity distribution infrastructure and the ability to deploy clean electricity at an accelerated pace and at greater scale; uncertainties include heat pump technology progress, ability to deploy flexible HVAC controls, and as yet unstudied cold weather anomaly events. These risks and uncertainties are discussed further in the Energy Pathways Report but existing analysis and data suggests that the risks between the high electrification and high pipeline gas use pathways are not symmetric, and favor high electrification.
37 Energy Pathways Report, section 5.6.3.
38 See DPU Order 20-80, October 29, 2020 https://fileservice.eea.comacloud.net/FileService.Api/file/FileRoom/12820821.
52
Finally, deferring action toward other pathways requires active reinvestment in and commitment to fossil fuel equipment and infrastructure. Because those investments carry natural lifetimes of many decades, if low-carbon gas resources do not become available at scale, a quick “course correction” is not possible without incurring significant stranded-asset costs. In contrast, electrification investments can be implemented slowly to take advantage of natural stock turnover and are also consistent with (and could be incorporated into) a pathway in which a low-carbon pipeline gas blend becomes viable. Importantly, the
same core, near-term action appears necessary regardless of pathway. In order to achieve near-term emissions reduction targets while preserving the ability of the Commonwealth to potentially use pipeline gas for building heat through 2050, the use of gas for building heat must decline by 2030 and the deployment of heat pump systems must dramatically increase. While pilots and further studies can help maximize the technical and economic viability of continued use of pipeline gas for building heat, electrification represents a “no-regrets” strategy in the near term.
39 This dynamic has been recognized by the Massachusetts Energy Efficiency Advisory Council, http://ma-eeac.org/wordpress/wp-content/uploads/TXC_48_RNCAttribution_24AUG2018_Final.pdf.
Implications and Policy Context
Decarbonizing the buildings sector is a problem of scale and stock turnover. Building energy systems are characterized by their higher capital cost compared to their operating costs. Transitioning from fossil fuel equipment to an electric system is most cost-effective at the time of initial installation or replacement. This tenet also holds for building envelopes, which can be improved at relatively lower cost at an intervention point like a building renovation, roof replacement, or time of sale. Given the lifespan of building equipment, it is important that the deployment of decarbonized solutions begins to scale dramatically and immediately.
New construction offers the easiest and most economically attractive way to start decarbonizing the buildings sector and will have lasting impacts. The implementation of a high-performance, net-zero emissions building energy code will minimize the near-term installation of additional fossil fuel equipment that would require, in the mid- or long-term, either costly zero-carbon fuels, emissions allowances, or early retirement
of a stranded asset. Almost all new buildings can cost-effectively pursue an efficient electric design that increases occupant comfort and pays for itself by reducing heating equipment cost and energy requirements. Initial design considerations can also positively impact other sectors, such as pre-wiring for EV charging or designing a solar-ready roof. Similarly, the use of bio-based products such as insulation or cross-laminated timber in the building structure can help avoid the use of carbon intensive steel. Finally, an increase in consumer and contractor familiarity with high-performance envelope components and electric heat technologies will accelerate their diffusion into the larger and more challenging-to-retrofit stock of existing buildings.39
Electrification and efficiency in existing buildings present a larger challenge, as this stock represents the bulk of emissions reductions needed by 2050. To abate these emissions, just under three million housing units will need some level of heating system retrofit over the next 30 years, including about one million statewide by 2030.
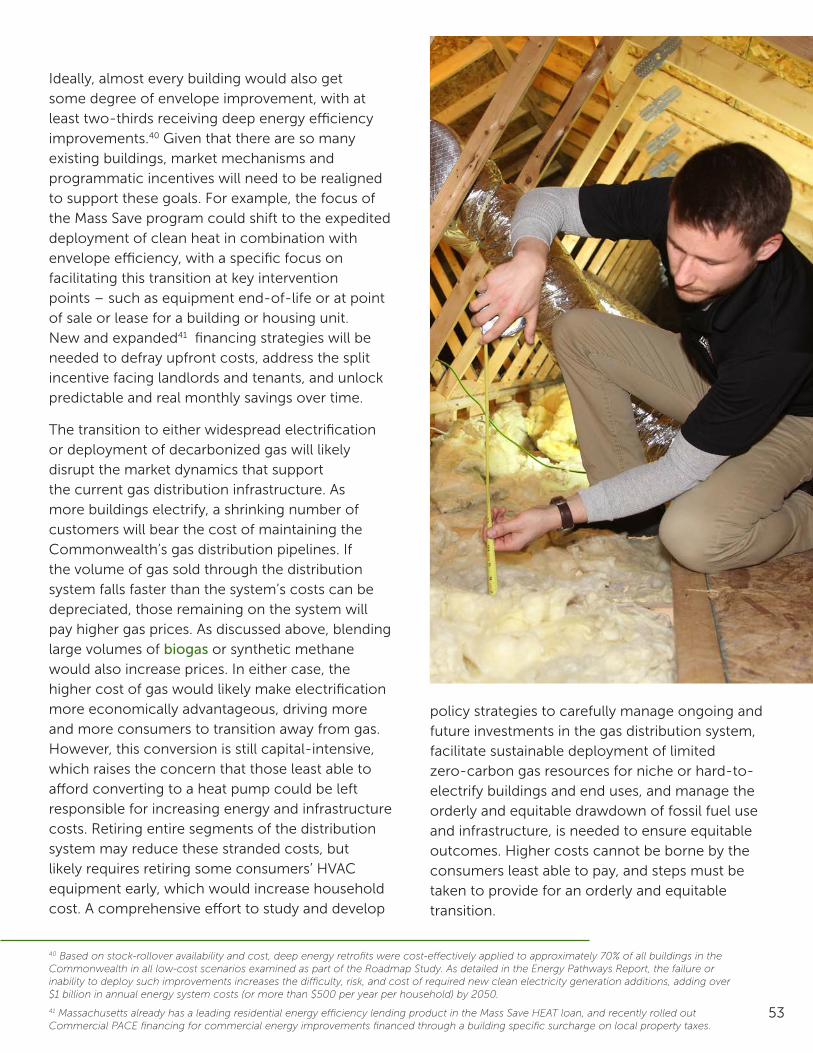
53
Ideally, almost every building would also get some degree of envelope improvement, with at least two-thirds receiving deep energy efficiency improvements.40 Given that there are so many existing buildings, market mechanisms and programmatic incentives will need to be realigned to support these goals. For example, the focus of the Mass Save program could shift to the expedited deployment of clean heat in combination with envelope efficiency, with a specific focus on facilitating this transition at key intervention points – such as equipment end-of-life or at point of sale or lease for a building or housing unit. New and expanded41 financing strategies will be needed to defray upfront costs, address the split incentive facing landlords and tenants, and unlock predictable and real monthly savings over time.
The transition to either widespread electrification or deployment of decarbonized gas will likely disrupt the market dynamics that support the current gas distribution infrastructure. As more buildings electrify, a shrinking number of customers will bear the cost of maintaining the Commonwealth’s gas distribution pipelines. If the volume of gas sold through the distribution system falls faster than the system’s costs can be depreciated, those remaining on the system will pay higher gas prices. As discussed above, blending large volumes of biogas or synthetic methane would also increase prices. In either case, the higher cost of gas would likely make electrification more economically advantageous, driving more and more consumers to transition away from gas. However, this conversion is still capital-intensive, which raises the concern that those least able to afford converting to a heat pump could be left responsible for increasing energy and infrastructure costs. Retiring entire segments of the distribution system may reduce these stranded costs, but likely requires retiring some consumers’ HVAC equipment early, which would increase household cost. A comprehensive effort to study and develop
40 Based on stock-rollover availability and cost, deep energy retrofits were cost-effectively applied to approximately 70% of all buildings in the Commonwealth in all low-cost scenarios examined as part of the Roadmap Study. As detailed in the Energy Pathways Report, the failure or inability to deploy such improvements increases the difficulty, risk, and cost of required new clean electricity generation additions, adding over $1 billion in annual energy system costs (or more than $500 per year per household) by 2050.
41 Massachusetts already has a leading residential energy efficiency lending product in the Mass Save HEAT loan, and recently rolled out Commercial PACE financing for commercial energy improvements financed through a building specific surcharge on local property taxes.
policy strategies to carefully manage ongoing and future investments in the gas distribution system, facilitate sustainable deployment of limited zero-carbon gas resources for niche or hard-to-electrify buildings and end uses, and manage the orderly and equitable drawdown of fossil fuel use and infrastructure, is needed to ensure equitable outcomes. Higher costs cannot be borne by the consumers least able to pay, and steps must be taken to provide for an orderly and equitable transition.
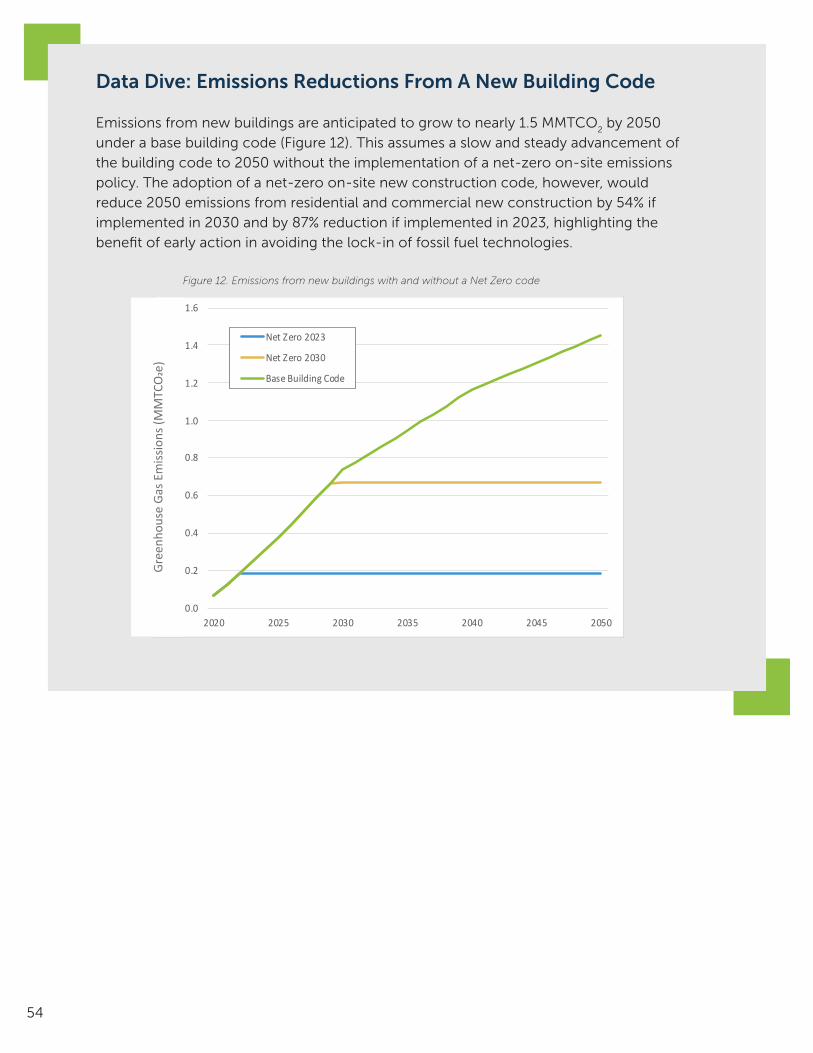
54
Data Dive: Emissions Reductions From A New Building Code
Emissions from new buildings are anticipated to grow to nearly 1.5 MMTCO2 by 2050
under a base building code (Figure 12). This assumes a slow and steady advancement of the building code to 2050 without the implementation of a net-zero on-site emissions policy. The adoption of a net-zero on-site new construction code, however, would reduce 2050 emissions from residential and commercial new construction by 54% if implemented in 2030 and by 87% reduction if implemented in 2023, highlighting the benefit of early action in avoiding the lock-in of fossil fuel technologies.
Figure 12. Emissions from new buildings with and without a Net Zero code
0.0
0.2
0.4
0.6
0.8
1.0
1.2
1.4
1.6
2020 2025 2030 2035 2040 2045 2050
Emis
sion
s (M
MT
CO2e
)
Net Zero 2023
Net Zero 2030
Base Building Code
Gree
nhou
se G
as E
miss
ions
(MM
TCO
2e)
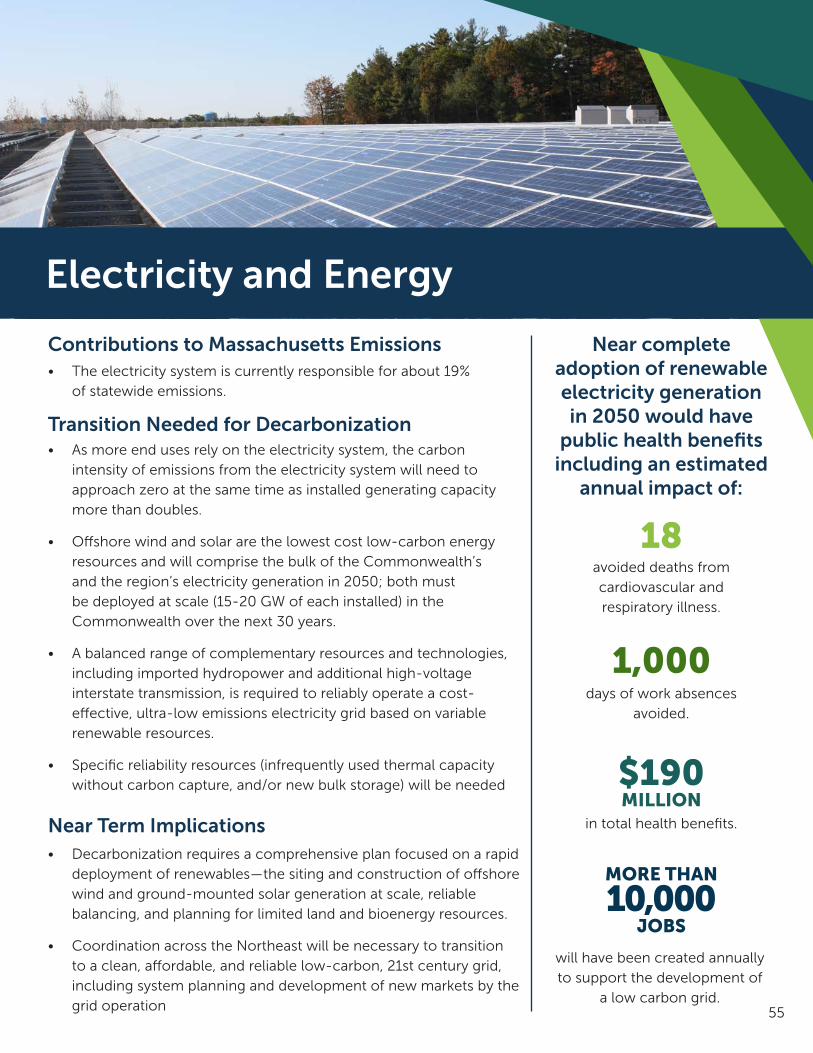
55
Electricity and Energy
• The electricity system is currently responsible for about 19% of statewide emissions.
avoided deaths from cardiovascular and respiratory illness.
days of work absences avoided.
in total health benefits.
Near complete adoption of renewable electricity generation in 2050 would have
public health benefits including an estimated
annual impact of:
will have been created annually to support the development of
a low carbon grid.
18
1,000
$190MILLION
MORE THAN
10,000JOBS
Contributions to Massachusetts Emissions
Transition Needed for Decarbonization
Near Term Implications
• As more end uses rely on the electricity system, the carbon intensity of emissions from the electricity system will need to approach zero at the same time as installed generating capacity more than doubles.
• Offshore wind and solar are the lowest cost low-carbon energy resources and will comprise the bulk of the Commonwealth’s and the region’s electricity generation in 2050; both must be deployed at scale (15-20 GW of each installed) in the Commonwealth over the next 30 years.
• A balanced range of complementary resources and technologies, including imported hydropower and additional high-voltage interstate transmission, is required to reliably operate a cost-effective, ultra-low emissions electricity grid based on variable renewable resources.
• Specific reliability resources (infrequently used thermal capacity without carbon capture, and/or new bulk storage) will be needed
• Decarbonization requires a comprehensive plan focused on a rapid deployment of renewables—the siting and construction of offshore wind and ground-mounted solar generation at scale, reliable balancing, and planning for limited land and bioenergy resources.
• Coordination across the Northeast will be necessary to transition to a clean, affordable, and reliable low-carbon, 21st century grid, including system planning and development of new markets by the grid operation
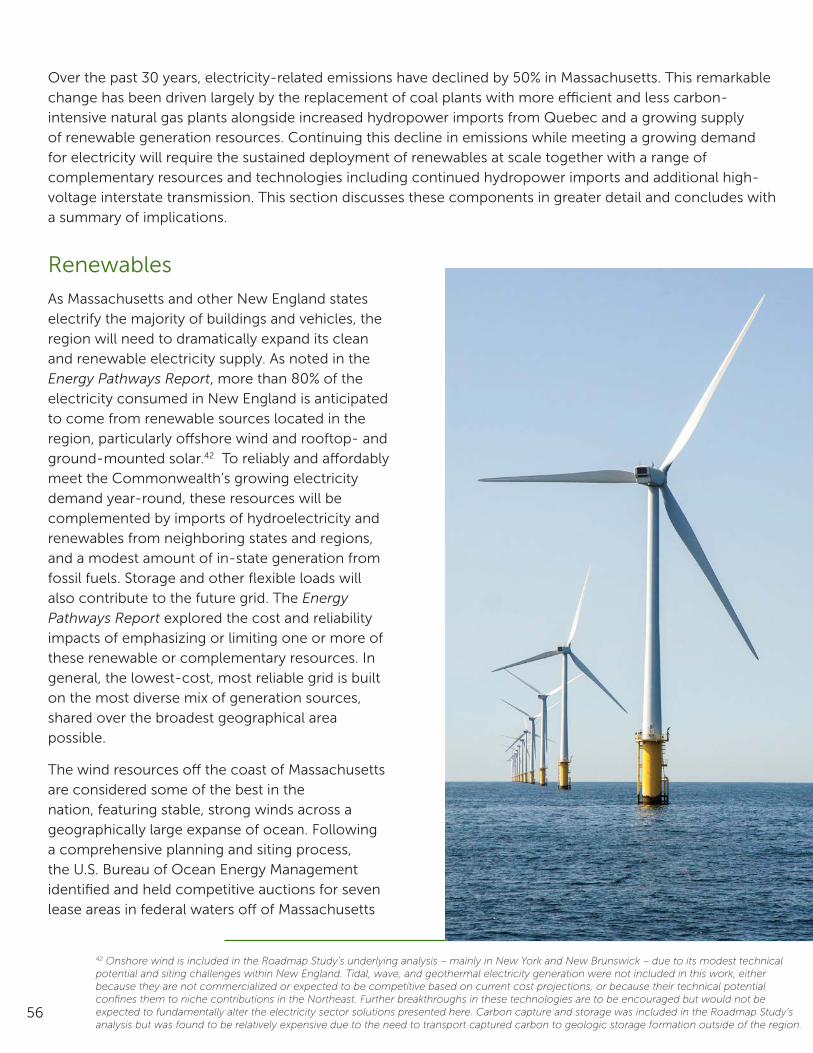
56
Renewables
Over the past 30 years, electricity-related emissions have declined by 50% in Massachusetts. This remarkable change has been driven largely by the replacement of coal plants with more efficient and less carbon-intensive natural gas plants alongside increased hydropower imports from Quebec and a growing supply of renewable generation resources. Continuing this decline in emissions while meeting a growing demand for electricity will require the sustained deployment of renewables at scale together with a range of complementary resources and technologies including continued hydropower imports and additional high-voltage interstate transmission. This section discusses these components in greater detail and concludes with a summary of implications.
As Massachusetts and other New England states electrify the majority of buildings and vehicles, the region will need to dramatically expand its clean and renewable electricity supply. As noted in the Energy Pathways Report, more than 80% of the electricity consumed in New England is anticipated to come from renewable sources located in the region, particularly offshore wind and rooftop- and ground-mounted solar.42 To reliably and affordably meet the Commonwealth’s growing electricity demand year-round, these resources will be complemented by imports of hydroelectricity and renewables from neighboring states and regions, and a modest amount of in-state generation from fossil fuels. Storage and other flexible loads will also contribute to the future grid. The Energy Pathways Report explored the cost and reliability impacts of emphasizing or limiting one or more of these renewable or complementary resources. In general, the lowest-cost, most reliable grid is built on the most diverse mix of generation sources, shared over the broadest geographical area possible.
The wind resources off the coast of Massachusetts are considered some of the best in the nation, featuring stable, strong winds across a geographically large expanse of ocean. Following a comprehensive planning and siting process, the U.S. Bureau of Ocean Energy Management identified and held competitive auctions for seven lease areas in federal waters off of Massachusetts
42 Onshore wind is included in the Roadmap Study’s underlying analysis – mainly in New York and New Brunswick – due to its modest technical potential and siting challenges within New England. Tidal, wave, and geothermal electricity generation were not included in this work, either because they are not commercialized or expected to be competitive based on current cost projections, or because their technical potential confines them to niche contributions in the Northeast. Further breakthroughs in these technologies are to be encouraged but would not be expected to fundamentally alter the electricity sector solutions presented here. Carbon capture and storage was included in the Roadmap Study’s analysis but was found to be relatively expensive due to the need to transport captured carbon to geologic storage formation outside of the region.
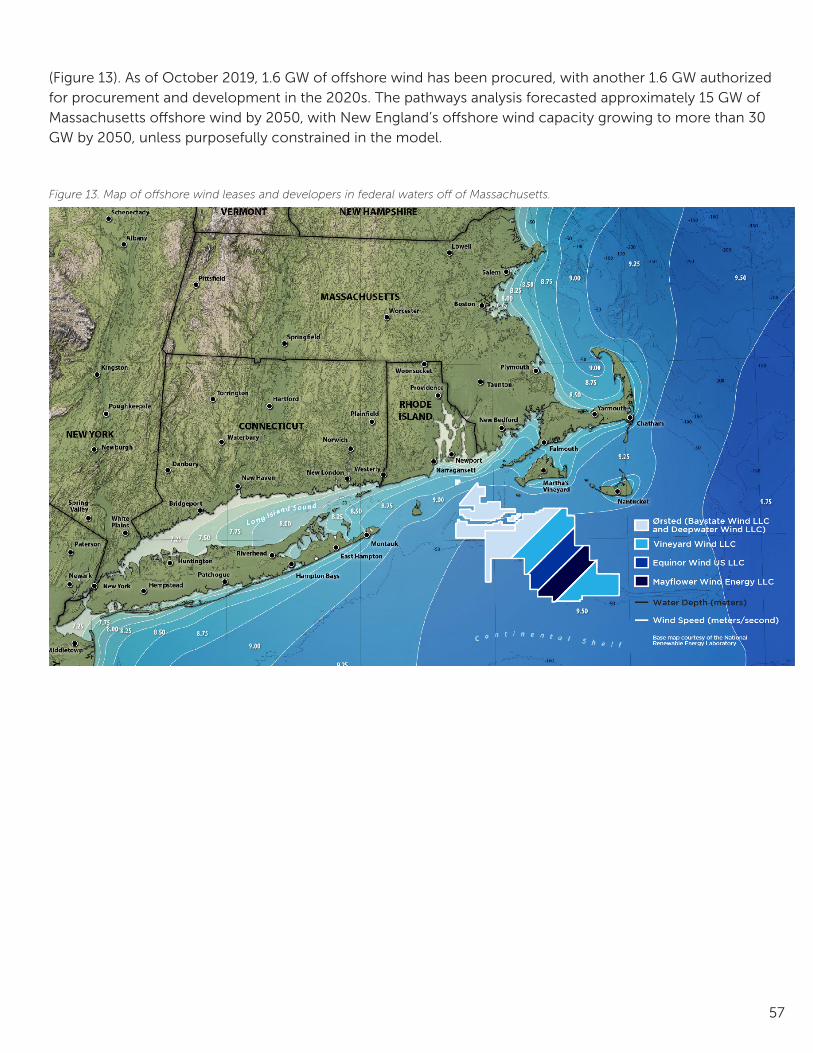
57
Figure 13. Map of offshore wind leases and developers in federal waters off of Massachusetts.
(Figure 13). As of October 2019, 1.6 GW of offshore wind has been procured, with another 1.6 GW authorized for procurement and development in the 2020s. The pathways analysis forecasted approximately 15 GW of Massachusetts offshore wind by 2050, with New England’s offshore wind capacity growing to more than 30 GW by 2050, unless purposefully constrained in the model.
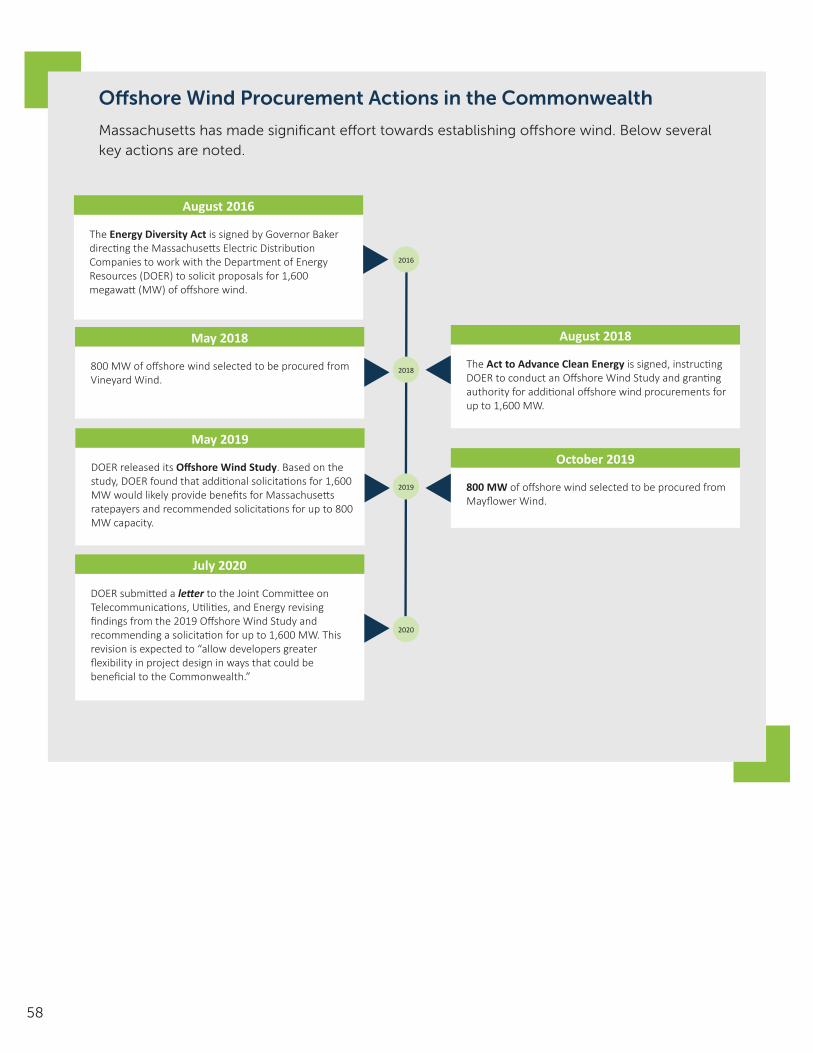
58
Offshore Wind Procurement Actions in the Commonwealth
August 2016
The Energy Diversity Act is signed by Governor Baker direc�ng the Massachuse�s Electric Distribu�on Companies to work with the Department of Energy Resources (DOER) to solicit proposals for 1,600 megawa� (MW) of offshore wind.
May 2018
800 MW of offshore wind selected to be procured from Vineyard Wind.
August 2018
The Act to Advance Clean Energy is signed, instruc�ng DOER to conduct an Offshore Wind Study and gran�ng authority for addi�onal offshore wind procurements for up to 1,600 MW.
October 2019
800 MW of offshore wind selected to be procured from Mayflower Wind.
May 2019
DOER released its Offshore Wind Study. Based on the study, DOER found that addi�onal solicita�ons for 1,600 MW would likely provide benefits for Massachuse�s ratepayers and recommended solicita�ons for up to 800 MW capacity.
2016
2018
2019
2020
July 2020
DOER submi�ed a letter to the Joint Commi�ee on Telecommunica�ons, U�li�es, and Energy revising findings from the 2019 Offshore Wind Study and recommending a solicita�on for up to 1,600 MW. This revision is expected to “allow developers greater flexibility in project design in ways that could be beneficial to the Commonwealth.”
Massachusetts has made significant effort towards establishing offshore wind. Below several key actions are noted.
59
As technology for offshore wind develops and the supply chain advances in the region, the cost of offshore wind is projected to decline and the pace of deployment to increase. MassCEC constructed and operates an offshore wind staging and installation port facility in New Bedford (the New Bedford Marine Commerce Terminal) as well as a Wind Turbine Testing Center in Charlestown. It is also supporting workforce and supply chain development programs in order to catalyze industry growth, reduce deployment costs, and ensure that these investments return dividends to our local economy.
A large volume of solar power complements and supports a deeply decarbonized, offshore wind-heavy electricity supply.43 While wind speeds in the North Atlantic tend to be at their strongest and most stable during the winter and at night, solar power peaks about midday and in the summer, both in terms of intensity and hours of insolation. This makes solar and offshore wind complementary resources, rather than interchangeable. The Energy Pathways Report found that 20-23 GW of solar capacity is optimal from a system-balancing perspective. Higher amounts of solar require deployment of more storage to better utilize those resources, while lower levels would require the addition of more expensive alternative generation sources.
Solar and wind also have differing transmission and operating implications. Offshore wind presents the challenge of bringing large volumes of high-voltage current to customers through a limited number of onshore interconnection sites. Bringing large volumes of offshore wind onshore and delivering it to demand centers will require substantial upgrades to the onshore bulk power grid. However, the onshore
transmission infrastructure built to collect and distribute electricity from large fossil fuel and nuclear power plants, including Brayton Point (the site of a former coal plant in Somerset) may be repurposed as interconnection sites for electricity generated by offshore wind farms. Additionally, to support the scale of offshore wind envisioned by 2050, the federal Bureau of Ocean Energy Management would need to work with stakeholders to identify and auction substantial new offshore wind lease areas on the Outer Continental Shelf.
Solar deployment involves several challenges as well, such as land use concerns and the need to interconnect and manage many small, distributed energy resources on the grid. Siting solar on rooftops and parking canopies can lessen, but not eliminate (due to insufficient total area), the need to build ground-mounted solar on open land and is usually more expensive. Limits to solar development in Massachusetts will likely encourage solar deployment in other states, especially in Northern New England where the cost of land is lower. Solar deployment in these areas is also likely to require the buildout of new transmission lines to transmit that power to consumers in Southern New England. In contrast, the strategic implementation of solar more locally may result in distribution system benefits, including line loss savings and reduced costs to build out and maintain transmission and distribution infrastructure, as well as improved local resilience.
43 There are two main options for deploying solar power: on building roofs and other structures, and on ground-mounted arrays. From an operational perspective, both types of solar are similar. The Energy Pathways Report determined that the amount of solar power needed by 2050 exceeds the full technical potential in the Commonwealth for rooftop solar, indicating that substantial deployment of ground-mounted solar is needed under any circumstance in order to achieve Net Zero.

60
Reliability ResourcesAlthough highly reliable and predictable on a daily and seasonal basis, renewable resources such as wind and solar power must be complemented by a range of resources both on the demand-side and on the supply-side, due to their inherent variability and in order to ensure the reliability of the electricity grid in every hour of the year.
A variety of different demand-side technologies – many in use today – can help to manage hourly and daily flows and peaks in electricity demand. Flexible loads improve system-wide performance by shifting the time of energy demand from periods with low electricity supply to periods of higher supply. Notably, buildings with tighter envelopes allow for more flexibility in space heating while maintaining indoor comfort due to lower levels of thermal losses. Many flexible loads are enabled by small-scale battery storage, such as those found in EVs, which can shift charging from the early evening to later at night. Load shifting flexibility is already offered in many high-efficiency electric end uses, but it requires deployment of millions of devices in order to aggregate to a useful grid asset. In general, with flexible end uses widely deployed, these resources will enable power grid operators to compensate for short periods – a few
minutes or hours at a time – in which electricity demand exceeds renewable supply.
Sometimes renewable supply may be far greater than electricity demand, especially at night when most household and business energy use is dormant, but wind is still blowing steadily off the coast. Industrial electric conversion loads are large, flexible sources of electricity demand which are connected to the electricity system and operate when renewable generation is abundant. While flexible loads play a role when supply is insufficient to meet demand and electricity prices are high, electric conversion loads operate when supply is consistently greater than demand. They help optimize the energy system so that renewable production exceeding demand can be harnessed for useful purposes, rather than being curtailed (wasted). Examples of such loads include hydrogen electrolysis (the process of making hydrogen using electricity), and other innovative solutions like using electricity instead of fuel in dual-fueled boilers for industrial applications.42 Note that electric conversion technologies do not need to run at any specific time but can be dispatched on an as-needed basis.
The University of Massachusetts Amherst Central Heating Plant, pictured above, provides 70% of the campus’ electricity and 100% of its steam needs from natural gas. In the future, district heat systems such as this could operate using the dual-fuel approach that leverages electric boilers when renewable energy is abundant and low-carbon gas at other times. Photo credit: UMass Amherst
44 The Commonwealth supports development of both technologies through grant programs at MassCEC.
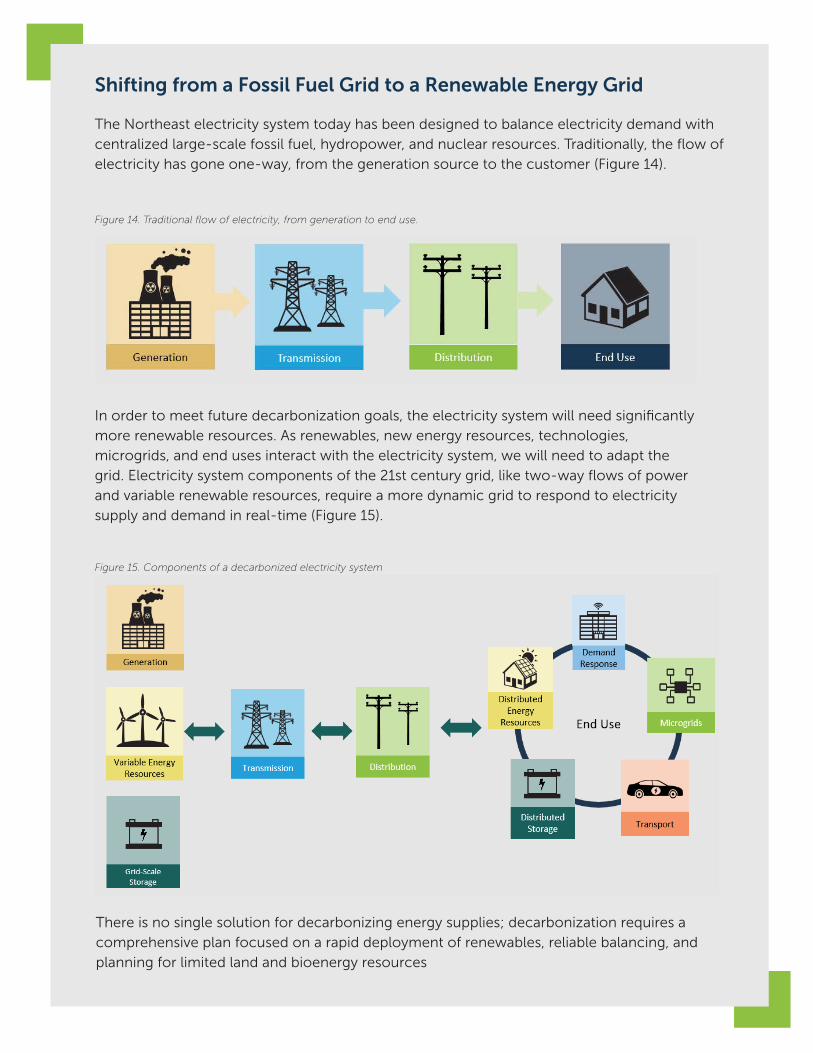
61
Shifting from a Fossil Fuel Grid to a Renewable Energy Grid
The Northeast electricity system today has been designed to balance electricity demand with centralized large-scale fossil fuel, hydropower, and nuclear resources. Traditionally, the flow of electricity has gone one-way, from the generation source to the customer (Figure 14).
Figure 14. Traditional flow of electricity, from generation to end use.
In order to meet future decarbonization goals, the electricity system will need significantly more renewable resources. As renewables, new energy resources, technologies, microgrids, and end uses interact with the electricity system, we will need to adapt the grid. Electricity system components of the 21st century grid, like two-way flows of power and variable renewable resources, require a more dynamic grid to respond to electricity supply and demand in real-time (Figure 15).
Figure 15. Components of a decarbonized electricity system
There is no single solution for decarbonizing energy supplies; decarbonization requires a comprehensive plan focused on a rapid deployment of renewables, reliable balancing, and planning for limited land and bioenergy resources

62
Two Days In February 2050: An Illustration Of Reliable Low-Carbon Electricity Supply In An Electrified Future
Figure 16 illustrates how an integrated portfolio of clean energy, flexibility, and other reliability resources are used to meet electricity demand with an electricity grid dominated by variable renewable generation. Two example days in 2050 are shown, February 1 and February 16, with the generation mix for each day in the top row and the overall demand in the bottom row. These generation mixes illustrate the performance and operation of a Net Zero-compliant 2050 generation fleet using actual New England weather data from 2012. The key difference between the two days is that there is ample wind resource available on February 1 and nearly none on February 16, as was the case in February 2012 and can be expected normally around a dozen times a year, for up to several days at a time.
The system that results from a lack of offshore wind generation is illustrated on the right-hand side of Figure 16. Resources needed to ensure a reliable electricity supply during such a sustained low-wind period include clean electricity imported over interstate transmission lines, wholesale “bulk” energy storage, flexible demand-side load (including from EV charging and other distributed batteries and resources), and gas-fired thermal generation. For the vast majority (~95%) of hours and days, renewable generation either meets or exceeds the bulk of Massachusetts’ demand – as shown by the February 1 day – facilitated by shifting flexible loads, like EV charging, to late-evening hours. Note the significantly different role transmission imports and gas generation play to meet demand across these two days.
Figure 16. Example days illustrating the variability of renewables and the need for balancing resources. Data from the All Options pathway in the Energy Pathways Report.
0
5
10
15
20
25
30
0 2 4 6 8 10 12 14 16 18 20 22
February 16
0
5
10
15
20
25
30
0 2 4 6 8 10 12 14 16 18 20 22
Gen
erat
ion
(GW
)
February 1
0
5
10
15
20
25
30
0 2 4 6 8 10 12 14 16 18 20 22
Load
(GW
)
Hour
0
5
10
15
20
25
30
0 2 4 6 8 10 12 14 16 18 20 22Hour
Wind
Solar
Solar
Imports
Exports
Bulk Load Bulk Load
Gas
Electric conversion
Storage charging
FlexibleLoad
Storage discharging
Bulk Load
Electric Conversion
Other
Solar
Renewable Curtailment
Flexible Load
Net Transmission Flow
Gas
Energy Storage
Gene
ratio
n (G
W)
Load
(GW
)
Hour Hour
63
Longer periods of low renewable generation require a different scale of resources to help maintain the reliability of the grid. Although offshore wind represents a rich renewable resource for New England, episodically throughout the year (a total of about 12 days during the 2012 data year used for the Roadmap Study), the wind can be expected to “die down” for as many as 36 hours at a time.45 A variety of resources is expected to be the most economical solution to provide the large-scale, long-duration reliability services necessary to complement offshore wind.
Particularly in this respect, the abundant hydropower available in New England, New York, Quebec, and New Brunswick represents a valuable resource for New England. The cumulative quantity of stored energy in dammed reservoirs is a key solution to balance and manage a regional electricity system with high penetrations of renewable generation. Unlike most traditional dispatchable generation resources, such as coal power, gas generators, and oil plants, hydropower is a clean generation resource that is nevertheless highly controllable and effectively dispatchable at-will. The New England Clean Energy Connect 100% Hydro project46 will provide 9.5 Terawatt-hours of clean hydropower and increase regional transmission capacity by more than 1 GW.47 Because renewable generation variability is rooted in geographically distinct zones, transmission capacity can be used to optimize systemwide efficiency across broader geographies. Since, on any given day, it might be sunny in Rhode Island, but cloudy in New Hampshire – or perhaps windy off Long Island but calm in the Gulf of Maine – intrastate and intraregional transmission can be used to export excess generation during times of high renewables and import external resources during times of low renewables.
With the closure of Pilgrim Nuclear Power Station in Plymouth in 2019, New England currently has two nuclear generating facilities – in Seabrook, NH, and Millstone, CT – supplying about 20% of load in New England.48 However, nuclear reactors take considerable time to heat up and cool down, meaning that these resources cannot easily respond to fluctuations in electricity demand. Further, the high construction costs of nuclear make it a very expensive resource to use only intermittently. If offshore wind resources cannot be fully realized, new nuclear resources would be an economically viable alternative for supplying low-carbon electricity, but concerns about safety and the disposal of radioactive waste make it unlikely that new nuclear resources would be sited in New England in the future. Future breakthroughs in small modular reactor technology or even fusion technology could change both of these dynamics, but neither technology has been, or appears likely to be, commercialized and affordably deployable during the timeframe of the Roadmap Study.
Currently, the lowest cost method for maintaining reliability on the few days each year with very low renewable energy production is the intermittent use of thermal power plants, primarily gas-fired power plants. Due to the low capital costs associated with gas-fired electricity, their relatively low emissions profile, and because of the speed with which a gas plant can be turned on to produce electricity, these already-existing resources are compatible with providing electricity when wind power is unavailable. As the quantity of renewables on the system grows, Massachusetts’ use of, and reliance on, gas-fired generation will decline precipitously; these units could continue to be both useful and valuable but serve in a new role as a long-duration reliability resource. In such a role, the use of gas-fired generation in 2050 would be minimal and fully consistent with achieving
45 Solar has a more variable daily and seasonal production potential but is not as abundant of a resource in New England as in other parts of the country with much greater average solar irradiance.
46 Awarded under the charge of Section 83D of the Massachusetts Green Communities Act.
47 Green Communities Act, Ch. 169 of the Acts of 2008, §83D, as amended by the Act to Promote Energy Diversity, Ch. 188 of the Acts of 2016, §12. https://malegislature.gov/Laws/SessionLaws/Acts/2016/Chapter188.
48 ISO New England. Resource Mix (2020). https://www.iso-ne.com/about/key-stats/resource-mix/.
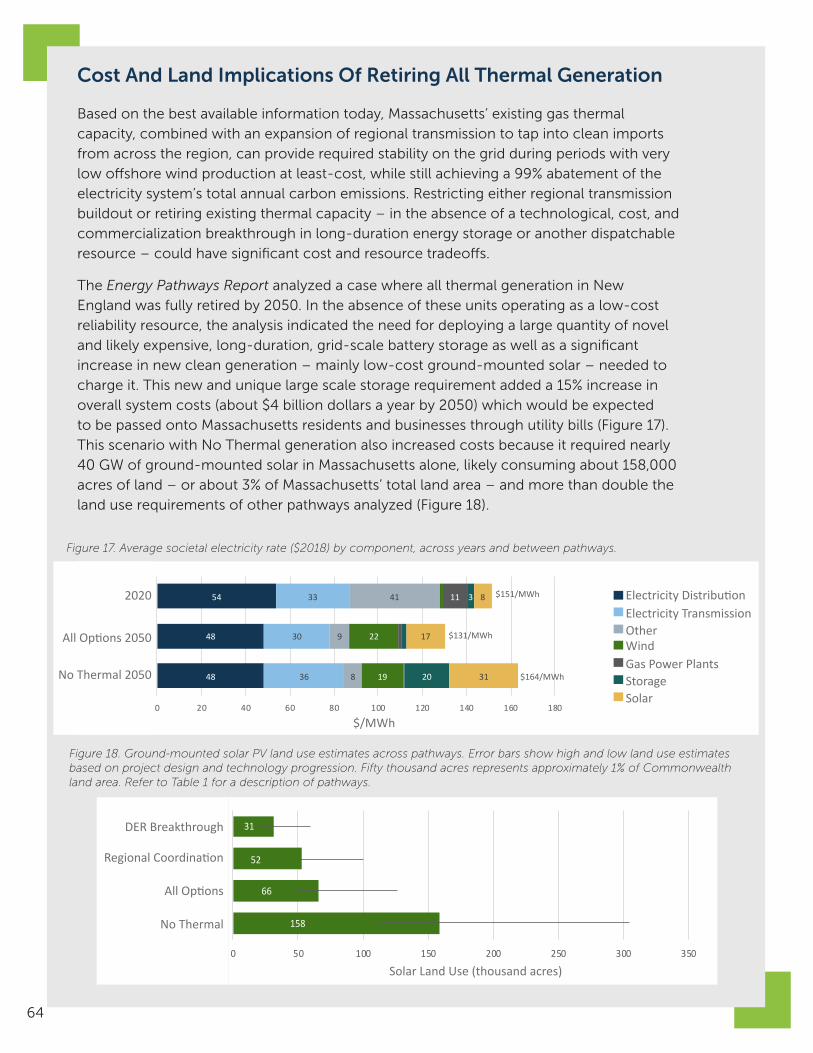
64
Cost And Land Implications Of Retiring All Thermal Generation
Based on the best available information today, Massachusetts’ existing gas thermal capacity, combined with an expansion of regional transmission to tap into clean imports from across the region, can provide required stability on the grid during periods with very low offshore wind production at least-cost, while still achieving a 99% abatement of the electricity system’s total annual carbon emissions. Restricting either regional transmission buildout or retiring existing thermal capacity – in the absence of a technological, cost, and commercialization breakthrough in long-duration energy storage or another dispatchable resource – could have significant cost and resource tradeoffs.
The Energy Pathways Report analyzed a case where all thermal generation in New England was fully retired by 2050. In the absence of these units operating as a low-cost reliability resource, the analysis indicated the need for deploying a large quantity of novel and likely expensive, long-duration, grid-scale battery storage as well as a significant increase in new clean generation – mainly low-cost ground-mounted solar – needed to charge it. This new and unique large scale storage requirement added a 15% increase in overall system costs (about $4 billion dollars a year by 2050) which would be expected to be passed onto Massachusetts residents and businesses through utility bills (Figure 17). This scenario with No Thermal generation also increased costs because it required nearly 40 GW of ground-mounted solar in Massachusetts alone, likely consuming about 158,000 acres of land – or about 3% of Massachusetts’ total land area – and more than double the land use requirements of other pathways analyzed (Figure 18).
Figure 17. Average societal electricity rate ($2018) by component, across years and between pathways.
Figure 18. Ground-mounted solar PV land use estimates across pathways. Error bars show high and low land use estimates based on project design and technology progression. Fifty thousand acres represents approximately 1% of Commonwealth land area. Refer to Table 1 for a description of pathways.
31
52
66
158
0 50 100 150 200 250 300 350
DER Breakthrough
Regional Coordination
All Options
No Thermal
Solar Land Use (thousand acres)
No Thermal
All Options
Regional Coordination
DER Breakthrough
Solar Land Use (thousand acres)
54
48
48
33
30
36
41
9
8
22
19
11 3
20
8
17
31
0 20 40 60 80 100 120 140 160 180
2020
All Options 2050
No Thermal 2050
$/MWh
Electricity Distribution Electricity Transmission Other Wind Gas Power Plants Storage Solar
$164/MWh
$131/MWh
$151/MWh Electricity DistributionElectricity TransmissionOtherWindGas Power PlantsStorageSolar
No Thermal 2050
All Options 2050
2020
$/MWh

65
Implications and Policy Context
The deployment of renewable energy resources is the foundational step in developing a low-cost and largely decarbonized energy supply for Massachusetts. The development of offshore wind not only provides an affordable, clean energy resource for the Commonwealth, but also the region more broadly. Offshore wind development at the scale forecasted by the Energy Pathways Report will allow Massachusetts to become an energy exporter during many high-generation hours of the year. This is particularly valuable for neighboring states and provinces, which may not have as direct access to or the ability to actively develop large offshore wind resources. Further, the ability to export offshore wind power to Quebec can enable the optimal use of hydropower and offshore wind resources across the broader Northeastern region, with Canadian hydropower serving effectively as a regional storage resource for hours when wind is less abundant in New England. This sharing of resources has an added benefit of reducing costs for ratepayers in the Commonwealth and across the Northeast. Massachusetts’ commitment to the responsible development of local renewable offshore wind resources off the New England coast not only helps to facilitate decarbonization in the Commonwealth, but also helps to drive down emissions and costs across the Northeast.
In order to support decarbonization across the economy in the timeframe required to achieve Net Zero by 2050, new renewable generation
and necessary supporting infrastructure must be sited and placed in operation at a pace that is much faster than historic or current levels. Under all scenarios examined, several new, large transmission lines (to the North and to the West) – each of which will take almost a decade to plan, site, and construct – are required in order for Massachusetts to have access to sufficient clean electricity and to maintain system reliability. At the same time, Massachusetts and the region must site and construct offshore wind and ground-mounted solar generation at scale,49 installing on average about 1 GW each year, from 2030 to 2050, regionwide.
49 As explored in detail in the Energy Pathways Report, even if every rooftop with solar access in Massachusetts was covered in solar panels, some 30,000 - 40,000 acres of ground-mounted solar installed in the Commonwealth would still be required to achieve Net Zero.
Net Zero emissions statewide. Electricity-sector emissions with infrequent gas generation used only for system balance would closely approach, but not reach, zero by 2050. Blending hydrogen produced from excess renewables during periods of high production and low demand could further reduce those residual electricity sector emissions, as could deploying zero-carbon fuels or employing carbon capture (although carbon storage is extremely limited in New England).
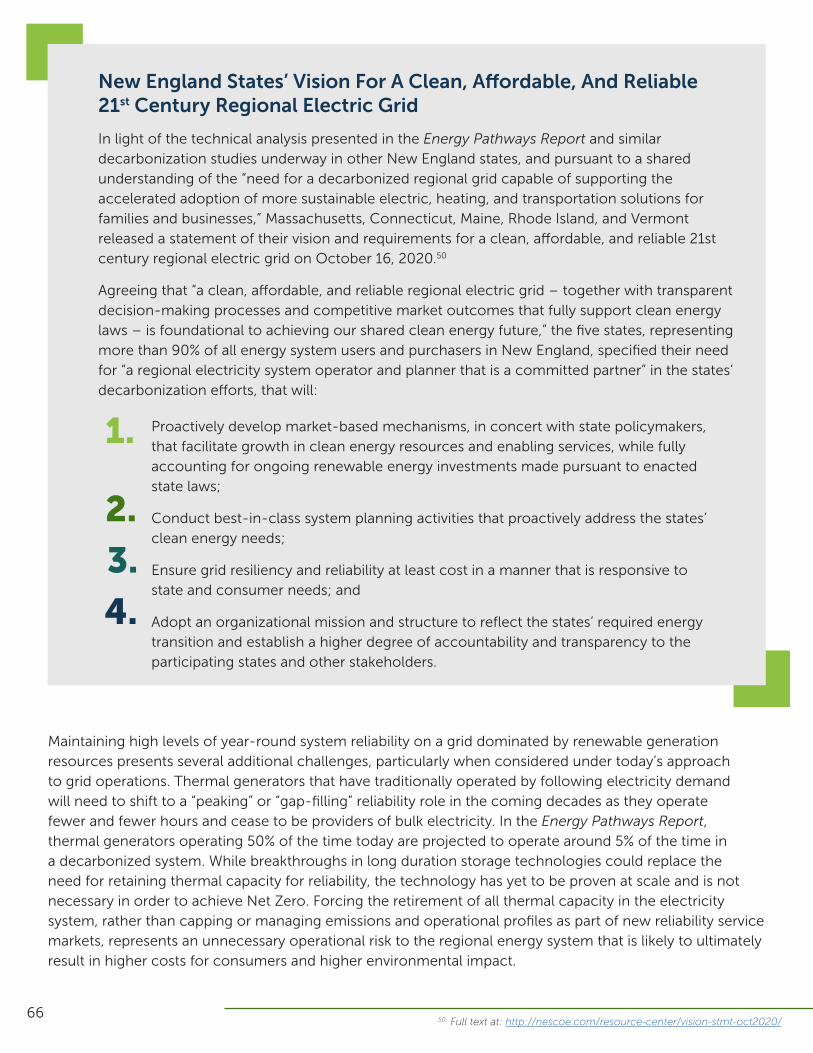
66
New England States’ Vision For A Clean, Affordable, And Reliable 21st Century Regional Electric Grid
In light of the technical analysis presented in the Energy Pathways Report and similar decarbonization studies underway in other New England states, and pursuant to a shared understanding of the “need for a decarbonized regional grid capable of supporting the accelerated adoption of more sustainable electric, heating, and transportation solutions for families and businesses,” Massachusetts, Connecticut, Maine, Rhode Island, and Vermont released a statement of their vision and requirements for a clean, affordable, and reliable 21st century regional electric grid on October 16, 2020.50
Agreeing that “a clean, affordable, and reliable regional electric grid – together with transparent decision-making processes and competitive market outcomes that fully support clean energy laws – is foundational to achieving our shared clean energy future,” the five states, representing more than 90% of all energy system users and purchasers in New England, specified their need for “a regional electricity system operator and planner that is a committed partner” in the states’ decarbonization efforts, that will:
Proactively develop market-based mechanisms, in concert with state policymakers, that facilitate growth in clean energy resources and enabling services, while fully accounting for ongoing renewable energy investments made pursuant to enacted state laws;
Conduct best-in-class system planning activities that proactively address the states’ clean energy needs;
Ensure grid resiliency and reliability at least cost in a manner that is responsive to state and consumer needs; and
Adopt an organizational mission and structure to reflect the states’ required energy transition and establish a higher degree of accountability and transparency to the participating states and other stakeholders.
1.
2.
3.
4.
50 Full text at: http://nescoe.com/resource-center/vision-stmt-oct2020/
Maintaining high levels of year-round system reliability on a grid dominated by renewable generation resources presents several additional challenges, particularly when considered under today’s approach to grid operations. Thermal generators that have traditionally operated by following electricity demand will need to shift to a “peaking” or “gap-filling” reliability role in the coming decades as they operate fewer and fewer hours and cease to be providers of bulk electricity. In the Energy Pathways Report, thermal generators operating 50% of the time today are projected to operate around 5% of the time in a decarbonized system. While breakthroughs in long duration storage technologies could replace the need for retaining thermal capacity for reliability, the technology has yet to be proven at scale and is not necessary in order to achieve Net Zero. Forcing the retirement of all thermal capacity in the electricity system, rather than capping or managing emissions and operational profiles as part of new reliability service markets, represents an unnecessary operational risk to the regional energy system that is likely to ultimately result in higher costs for consumers and higher environmental impact.
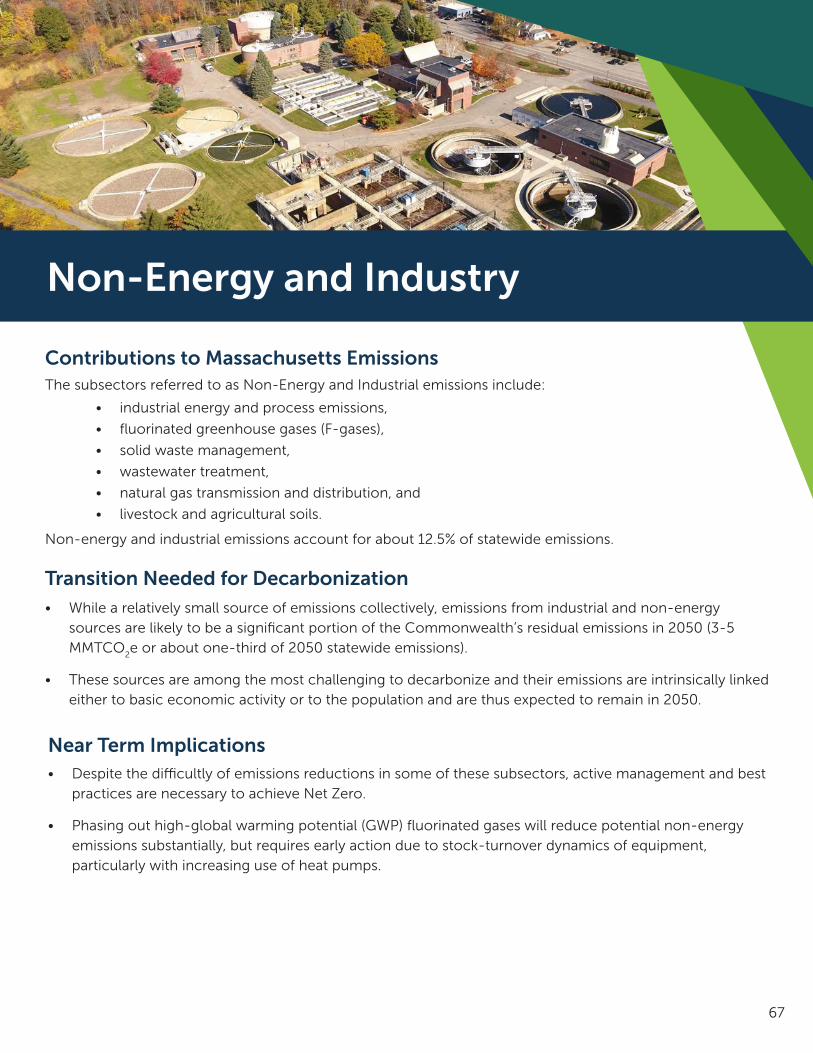
67
Non-Energy and Industry
The subsectors referred to as Non-Energy and Industrial emissions include:
Contributions to Massachusetts Emissions
Near Term Implications• Despite the difficultly of emissions reductions in some of these subsectors, active management and best
practices are necessary to achieve Net Zero.
• Phasing out high-global warming potential (GWP) fluorinated gases will reduce potential non-energy emissions substantially, but requires early action due to stock-turnover dynamics of equipment, particularly with increasing use of heat pumps.
• industrial energy and process emissions,
• fluorinated greenhouse gases (F-gases),
• solid waste management,
• wastewater treatment,
• natural gas transmission and distribution, and
• livestock and agricultural soils.
Non-energy and industrial emissions account for about 12.5% of statewide emissions.
Transition Needed for Decarbonization• While a relatively small source of emissions collectively, emissions from industrial and non-energy
sources are likely to be a significant portion of the Commonwealth’s residual emissions in 2050 (3-5 MMTCO
2e or about one-third of 2050 statewide emissions).
• These sources are among the most challenging to decarbonize and their emissions are intrinsically linked either to basic economic activity or to the population and are thus expected to remain in 2050.
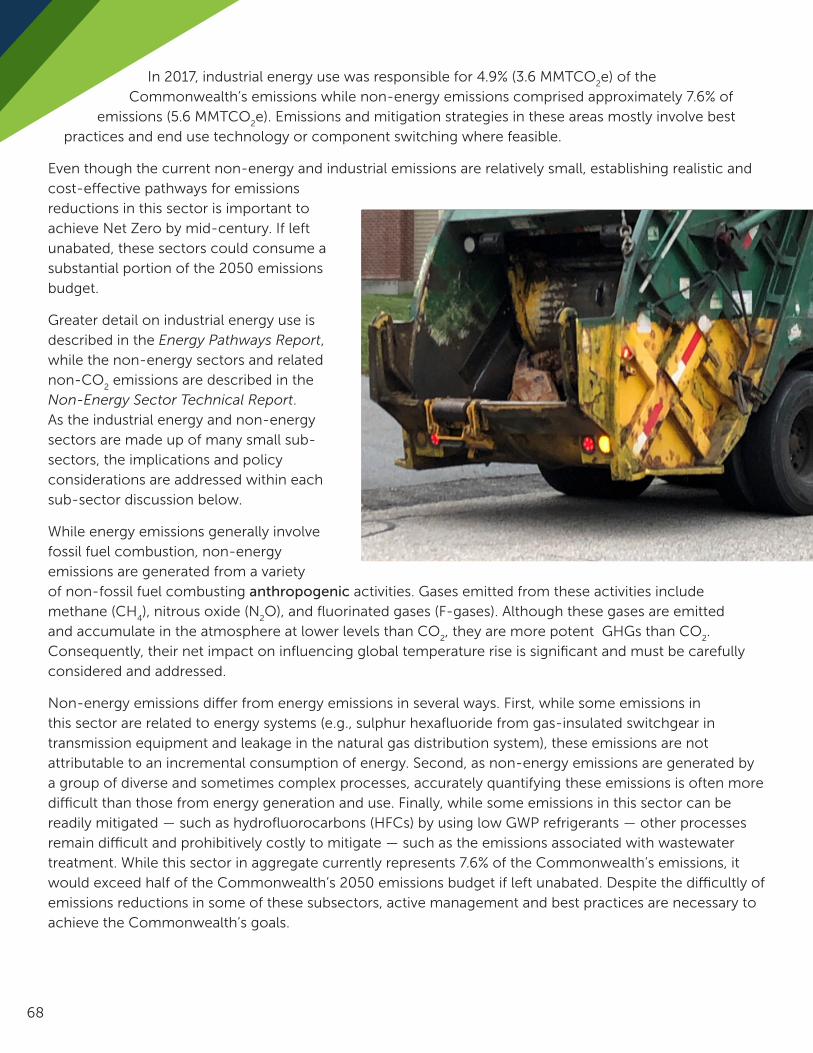
68
In 2017, industrial energy use was responsible for 4.9% (3.6 MMTCO2e) of the
Commonwealth’s emissions while non-energy emissions comprised approximately 7.6% of emissions (5.6 MMTCO
2e). Emissions and mitigation strategies in these areas mostly involve best
practices and end use technology or component switching where feasible.
Even though the current non-energy and industrial emissions are relatively small, establishing realistic and cost-effective pathways for emissions reductions in this sector is important to achieve Net Zero by mid-century. If left unabated, these sectors could consume a substantial portion of the 2050 emissions budget.
Greater detail on industrial energy use is described in the Energy Pathways Report, while the non-energy sectors and related non-CO
2 emissions are described in the
Non-Energy Sector Technical Report. As the industrial energy and non-energy sectors are made up of many small sub-sectors, the implications and policy considerations are addressed within each sub-sector discussion below.
While energy emissions generally involve fossil fuel combustion, non-energy emissions are generated from a variety of non-fossil fuel combusting anthropogenic activities. Gases emitted from these activities include methane (CH
4), nitrous oxide (N
2O), and fluorinated gases (F-gases). Although these gases are emitted
and accumulate in the atmosphere at lower levels than CO2, they are more potent GHGs than CO
2.
Consequently, their net impact on influencing global temperature rise is significant and must be carefully considered and addressed.
Non-energy emissions differ from energy emissions in several ways. First, while some emissions in this sector are related to energy systems (e.g., sulphur hexafluoride from gas-insulated switchgear in transmission equipment and leakage in the natural gas distribution system), these emissions are not attributable to an incremental consumption of energy. Second, as non-energy emissions are generated by a group of diverse and sometimes complex processes, accurately quantifying these emissions is often more difficult than those from energy generation and use. Finally, while some emissions in this sector can be readily mitigated — such as hydrofluorocarbons (HFCs) by using low GWP refrigerants — other processes remain difficult and prohibitively costly to mitigate — such as the emissions associated with wastewater treatment. While this sector in aggregate currently represents 7.6% of the Commonwealth’s emissions, it would exceed half of the Commonwealth’s 2050 emissions budget if left unabated. Despite the difficultly of emissions reductions in some of these subsectors, active management and best practices are necessary to achieve the Commonwealth’s goals.
69
Industrial Energy and Process Emissions
The industrial sector within Massachusetts constitutes a smaller share of final energy demand than is the case in many parts of the U.S. The largest subsectors within industry in the Commonwealth are construction (including materials use), followed by various small manufacturing processes (including paper products), and agriculture. Some of these applications can be readily electrified while energy and heat intensive processes could leverage hydrogen or zero-carbon fuels. On top of electrification, efficiency can play a role here, as in other parts of the economy, in reducing energy demands.
Fluorinated GasesF-gases are widely used as refrigerants in chillers, air conditioners, and heat pumps; blowing agents for foam insulation; propellants for aerosols and fire suppression systems; industrial solvents used in metals and electronics manufacturing; and dielectric substances used in electrical switchgear. As a category, F-gases are extremely powerful GHGs. Even small quantities of F-gases can have major effects on the climate, as commonly used F-gases have GWPs thousands of times larger than that of CO
2.51
As buildings electrify, the F-gas emissions from residential and commercial heat pumps are anticipated to become an important source of HFC emissions in 2050 if mitigation actions are not taken. Phasing-out high GWP HFCs over the 2020s can reduce emissions substantially. Assuming heat pumps are adopted widely by
51 World Meteorological Organization. Scientific Assessment of Ozone Depletion: 2018. Global Ozone Research and Monitoring Project—Report No. 58. Geneva, Switzerland.52 Along with sixteen other states including Maine and Rhode Island, Massachusetts is in the process of implementing regulations that will prohibit the use of HFCs for a range of existing, high-volume end use products such as aerosol propellants, air conditioning and chillers, refrigeration equipment, and foams. Although these efforts could be strengthened and broadened to respond to the widespread deployment of heat pumps, a more widespread federal regulatory effort would be required to fully achieve the mitigation levels called for in the Kigali Amendment.
Massachusetts residents, annual HFC emissions have the potential to rise to nearly 2 MMTCO
2e
by 2050; with reasonable and technically feasible mitigation measures consistent with those agreed to in the 2016 Kigali Amendment to the Montreal Protocol, emissions from the residential sector are manageable and would remain nearly constant at 0.3 MMTCO
2e.52 Because of the dependency on
stock-turnover, the full impact of F-gas emissions reduction policies has significant delays. Therefore, it is important to ensure low-GWP refrigerants are in use immediately, as the Commonwealth has recently committed to, as well as improve refrigerant management practices; equipment installed today will be a leakage risk over its entire lifetime.
There are industrial processes that emit non-energy GHGs including industrial lime manufacturing and the consumption of limestone, dolomite, and soda ash. These processes involve the reduction of a carbonate to an oxide, producing CO
2 in the process. No practical
alternatives to these processes have been identified for Massachusetts industry, although this may represent the best source of capturable CO
2 for the production of synthetic fuels or for
export for geologic sequestration, as discussed in the Energy Pathways Report. Emissions from this subsector are very small, less than 0.2 MMTCO
2e
annually.

70
Wastewater TreatmentEmissions from wastewater treatment are about 0.5 MMTCO
2e per year and come from biological
degradation of organic waste in septic systems, wastewater treatment plants, and effluent and sludge management. The largest contributors are CH
4 from septic systems and N
2O from sludge
management and effluent. Emissions in this sector will likely grow as population increases. There are no clear pathways for significant and reliable emissions reductions from this subsector; however, given that septic systems are usually more emissions-intensive than municipal systems, connecting more homes to sewers could provide a modest reduction. Increasing anaerobic digestion capacity in treatment plants would allow such facilities to generate renewable energy from sludge and displace fossil fuel consumption.
53 Emissions from the combustion of municipal solid waste for electricity generation are evaluated in detail in the Non-Energy Sector Technical Report but are accounted for in MassDEP’s energy sector inventory.54 While current waste-to-energy facilities may be challenged by future feedstock and grid changes, emerging technologies may improve their ability to dispose of solid waste.
Solid Waste ManagementSolid waste system emissions include CH
4
and N2O generation from organic waste
decomposition in both landfills and organics treatment facilities like composting and anaerobic digestion.53 Currently, all operating Massachusetts landfills are planned to close by the early 2030s, however, these sites will continue to produce CH
4 as a result of slowly
decaying organic matter, mostly food waste.
As solid waste is directly linked to population, reducing the quantity of waste as well as improving waste management practices are the dominant strategies for managing these emissions. Diverting organic waste to compost facilities with best practices in place or to anaerobic digestion facilities is an advantageous strategy for treating organic wastes. Nevertheless, both composting and anaerobic digestion facilities are themselves potential
sources of CH4 and N
2O depending on how
they are managed and designed. Well-managed composting facilities can control emissions through proper nutrient management and aeration. Anaerobic digesters can limit emissions through leak monitoring and management.
The combustion of petroleum-based municipal solid waste (e.g., plastics) at Massachusetts’ seven municipal waste combustors is the largest source of emissions from the solid waste stream. These facilities burn municipal solid waste to dispose of it while producing modest amounts of useful heat and electricity. Diversion of plastic, paper, and other incinerable materials from the waste stream reduces GHG emissions but also reduces the technical and economic viability of the facilities. The future role of plastics and their end-of-life treatment merits additional analysis that was beyond the scope of this Roadmap Study.54
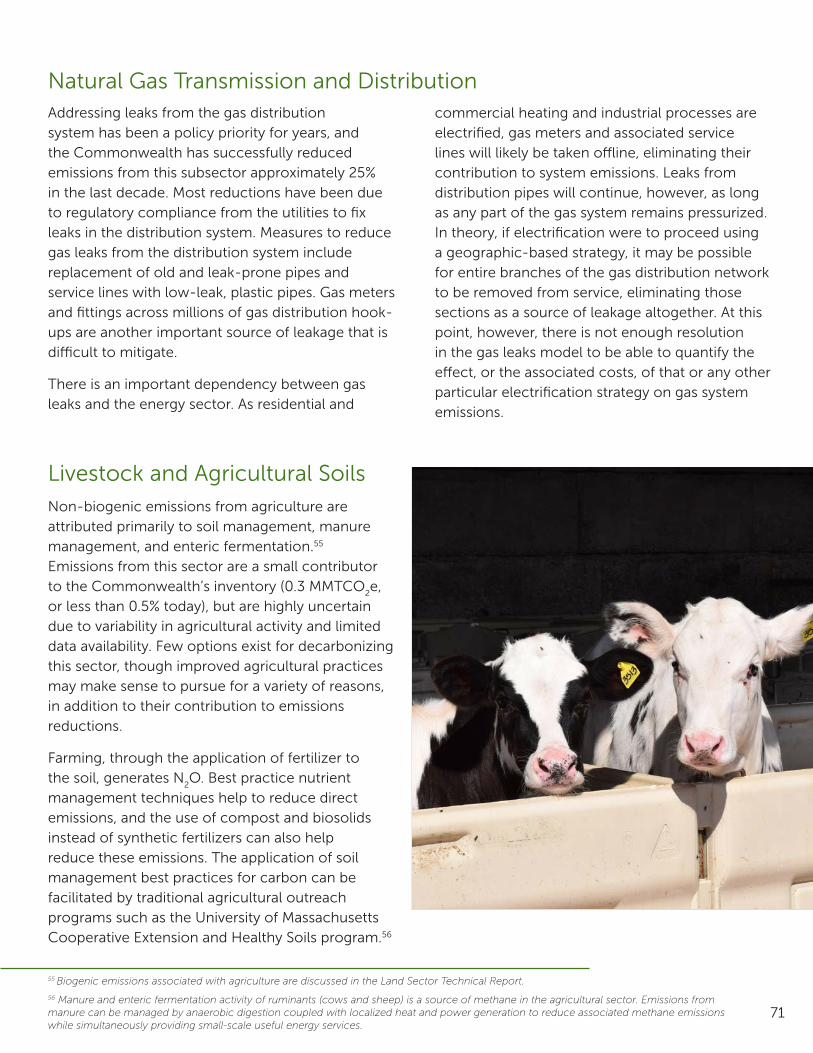
71
Natural Gas Transmission and DistributionAddressing leaks from the gas distribution system has been a policy priority for years, and the Commonwealth has successfully reduced emissions from this subsector approximately 25% in the last decade. Most reductions have been due to regulatory compliance from the utilities to fix leaks in the distribution system. Measures to reduce gas leaks from the distribution system include replacement of old and leak-prone pipes and service lines with low-leak, plastic pipes. Gas meters and fittings across millions of gas distribution hook-ups are another important source of leakage that is difficult to mitigate.
There is an important dependency between gas leaks and the energy sector. As residential and
commercial heating and industrial processes are electrified, gas meters and associated service lines will likely be taken offline, eliminating their contribution to system emissions. Leaks from distribution pipes will continue, however, as long as any part of the gas system remains pressurized. In theory, if electrification were to proceed using a geographic-based strategy, it may be possible for entire branches of the gas distribution network to be removed from service, eliminating those sections as a source of leakage altogether. At this point, however, there is not enough resolution in the gas leaks model to be able to quantify the effect, or the associated costs, of that or any other particular electrification strategy on gas system emissions.
Livestock and Agricultural Soils Non-biogenic emissions from agriculture are attributed primarily to soil management, manure management, and enteric fermentation.55 Emissions from this sector are a small contributor to the Commonwealth’s inventory (0.3 MMTCO
2e,
or less than 0.5% today), but are highly uncertain due to variability in agricultural activity and limited data availability. Few options exist for decarbonizing this sector, though improved agricultural practices may make sense to pursue for a variety of reasons, in addition to their contribution to emissions reductions.
Farming, through the application of fertilizer to the soil, generates N
2O. Best practice nutrient
management techniques help to reduce direct emissions, and the use of compost and biosolids instead of synthetic fertilizers can also help reduce these emissions. The application of soil management best practices for carbon can be facilitated by traditional agricultural outreach programs such as the University of Massachusetts Cooperative Extension and Healthy Soils program.56
55 Biogenic emissions associated with agriculture are discussed in the Land Sector Technical Report.
56 Manure and enteric fermentation activity of ruminants (cows and sheep) is a source of methane in the agricultural sector. Emissions from manure can be managed by anaerobic digestion coupled with localized heat and power generation to reduce associated methane emissions while simultaneously providing small-scale useful energy services.
72
Natural Carbon Sequestration
Massachusetts forests are projected to have the capacity to sequester about 5 MMTCO2e per year from
now through 2050. This is equivalent to roughly 7% of the Commonwealth’s current emissions and roughly half of allowable residual emissions in 2050.
Contributions to Massachusetts Emissions
Near Term Implications• Encouraging dense development and best management practices for commercial timber harvesting can
increase forest carbon sequestration, but only minimally; neither has the potential to significantly alter the 2050 sequestration potential of Massachusetts forests.
Transition Needed for Decarbonization• Ensuring the viability and health of the Commonwealth’s existing 3.3 million acres of forested land is the
primary strategy to ensure this sequestration potential is available in 2050.
Continued Areas of Research and Further Investigation
1. Gaining a more complete accounting of land use impacts on human and natural systems to understand the long-term systemic effects and the balance of ecosystem benefits, and
2. Exploring the treatment of atmospheric carbon removals outside of Massachusetts’ borders.
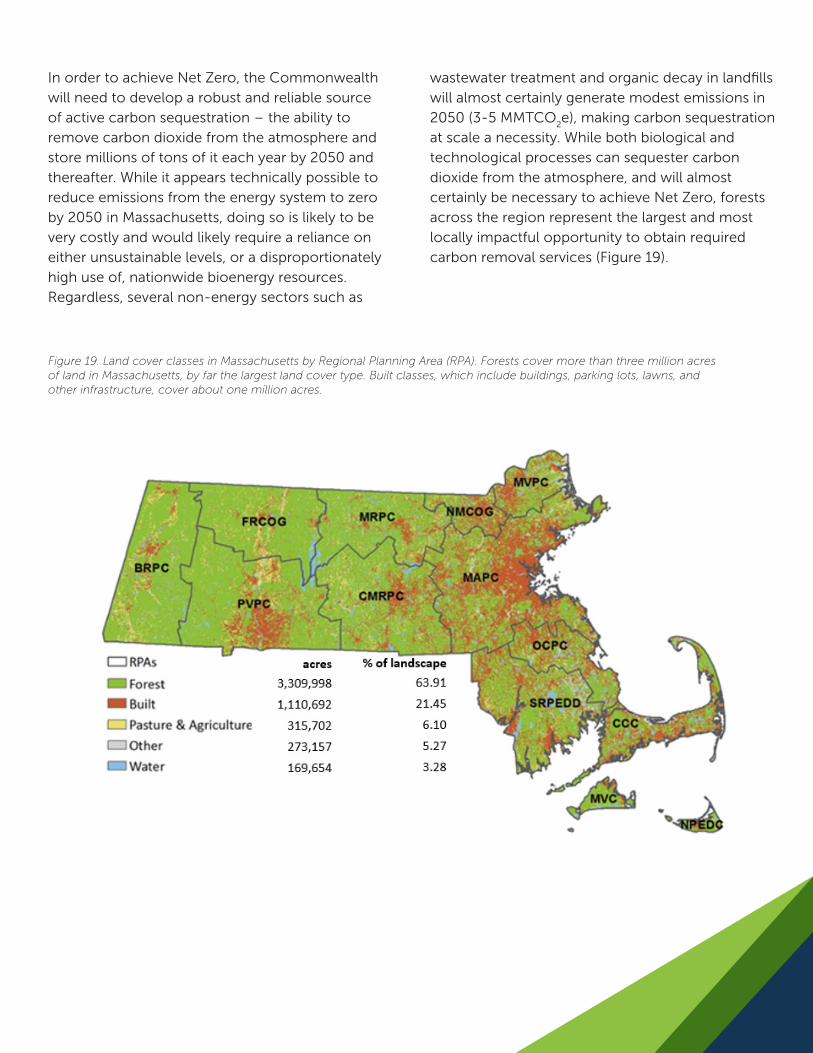
73
In order to achieve Net Zero, the Commonwealth will need to develop a robust and reliable source of active carbon sequestration – the ability to remove carbon dioxide from the atmosphere and store millions of tons of it each year by 2050 and thereafter. While it appears technically possible to reduce emissions from the energy system to zero by 2050 in Massachusetts, doing so is likely to be very costly and would likely require a reliance on either unsustainable levels, or a disproportionately high use of, nationwide bioenergy resources. Regardless, several non-energy sectors such as
wastewater treatment and organic decay in landfills will almost certainly generate modest emissions in 2050 (3-5 MMTCO
2e), making carbon sequestration
at scale a necessity. While both biological and technological processes can sequester carbon dioxide from the atmosphere, and will almost certainly be necessary to achieve Net Zero, forests across the region represent the largest and most locally impactful opportunity to obtain required carbon removal services (Figure 19).
Figure 19. Land cover classes in Massachusetts by Regional Planning Area (RPA). Forests cover more than three million acres of land in Massachusetts, by far the largest land cover type. Built classes, which include buildings, parking lots, lawns, and other infrastructure, cover about one million acres.
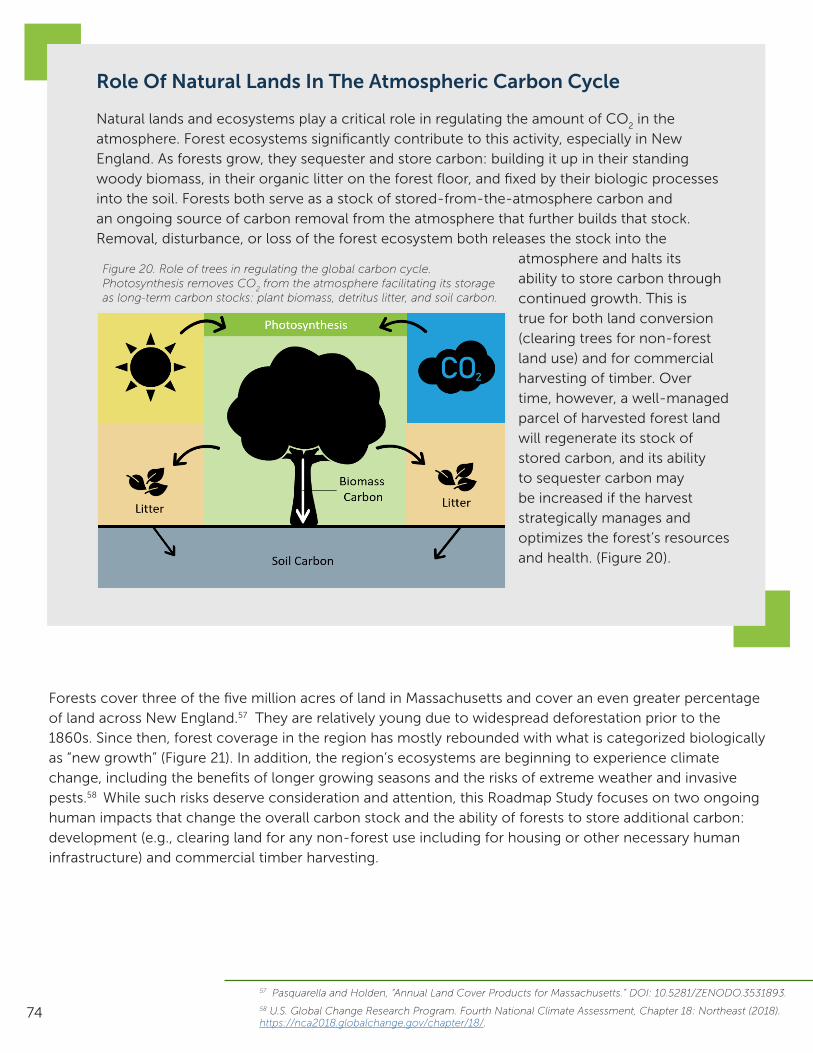
74
Role Of Natural Lands In The Atmospheric Carbon Cycle
Natural lands and ecosystems play a critical role in regulating the amount of CO2 in the
atmosphere. Forest ecosystems significantly contribute to this activity, especially in New England. As forests grow, they sequester and store carbon: building it up in their standing woody biomass, in their organic litter on the forest floor, and fixed by their biologic processes into the soil. Forests both serve as a stock of stored-from-the-atmosphere carbon and an ongoing source of carbon removal from the atmosphere that further builds that stock. Removal, disturbance, or loss of the forest ecosystem both releases the stock into the
atmosphere and halts its ability to store carbon through continued growth. This is true for both land conversion (clearing trees for non-forest land use) and for commercial harvesting of timber. Over time, however, a well-managed parcel of harvested forest land will regenerate its stock of stored carbon, and its ability to sequester carbon may be increased if the harvest strategically manages and optimizes the forest’s resources and health. (Figure 20).
Forests cover three of the five million acres of land in Massachusetts and cover an even greater percentage of land across New England.57 They are relatively young due to widespread deforestation prior to the 1860s. Since then, forest coverage in the region has mostly rebounded with what is categorized biologically as “new growth” (Figure 21). In addition, the region’s ecosystems are beginning to experience climate change, including the benefits of longer growing seasons and the risks of extreme weather and invasive pests.58 While such risks deserve consideration and attention, this Roadmap Study focuses on two ongoing human impacts that change the overall carbon stock and the ability of forests to store additional carbon: development (e.g., clearing land for any non-forest use including for housing or other necessary human infrastructure) and commercial timber harvesting.
Figure 20. Role of trees in regulating the global carbon cycle. Photosynthesis removes CO
2 from the atmosphere facilitating its storage
as long-term carbon stocks: plant biomass, detritus litter, and soil carbon.
57 Pasquarella and Holden, “Annual Land Cover Products for Massachusetts.” DOI: 10.5281/ZENODO.3531893.58 U.S. Global Change Research Program. Fourth National Climate Assessment, Chapter 18: Northeast (2018). https://nca2018.globalchange.gov/chapter/18/.
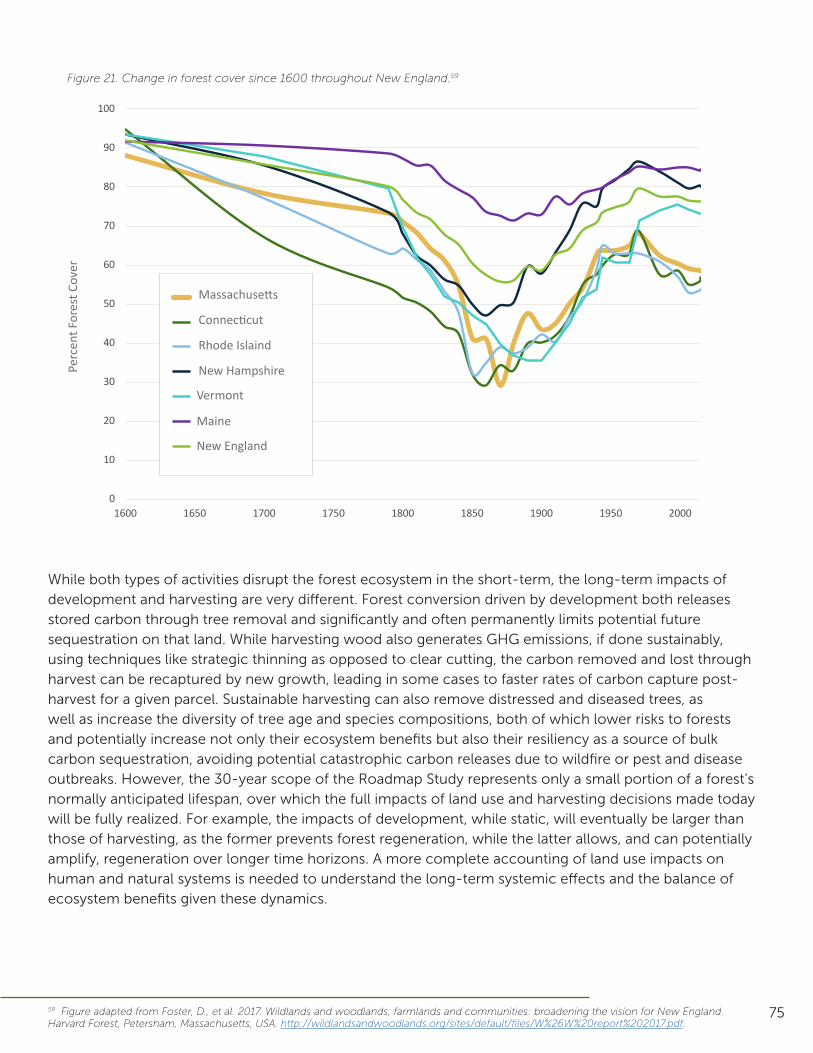
75
0
10
20
30
40
50
60
70
80
90
100
1600 1650 1700 1750 1800 1850 1900 1950 2000
Perc
ent F
ores
t Cov
er
Year
Figure 21. Change in forest cover since 1600 throughout New England.59
59 Figure adapted from Foster, D., et al. 2017. Wildlands and woodlands, farmlands and communities: broadening the vision for New England. Harvard Forest, Petersham, Massachusetts, USA. http://wildlandsandwoodlands.org/sites/default/files/W%26W%20report%202017.pdf.
While both types of activities disrupt the forest ecosystem in the short-term, the long-term impacts of development and harvesting are very different. Forest conversion driven by development both releases stored carbon through tree removal and significantly and often permanently limits potential future sequestration on that land. While harvesting wood also generates GHG emissions, if done sustainably, using techniques like strategic thinning as opposed to clear cutting, the carbon removed and lost through harvest can be recaptured by new growth, leading in some cases to faster rates of carbon capture post-harvest for a given parcel. Sustainable harvesting can also remove distressed and diseased trees, as well as increase the diversity of tree age and species compositions, both of which lower risks to forests and potentially increase not only their ecosystem benefits but also their resiliency as a source of bulk carbon sequestration, avoiding potential catastrophic carbon releases due to wildfire or pest and disease outbreaks. However, the 30-year scope of the Roadmap Study represents only a small portion of a forest’s normally anticipated lifespan, over which the full impacts of land use and harvesting decisions made today will be fully realized. For example, the impacts of development, while static, will eventually be larger than those of harvesting, as the former prevents forest regeneration, while the latter allows, and can potentially amplify, regeneration over longer time horizons. A more complete accounting of land use impacts on human and natural systems is needed to understand the long-term systemic effects and the balance of ecosystem benefits given these dynamics.
Perc
ent F
ores
t Cov
er
Massachusetts
Connecticut
Rhode Islaind
New Hampshire
Vermont
Maine
New England
0
10
20
30
40
50
60
70
80
90
100
1600 1650 1700 1750 1800 1850 1900 1950 2000
Perc
ent F
ores
t Cov
er
Year
Massachusetts
Connecticut
Rhode Island
New Hampshire
Vermont
Maine
New England
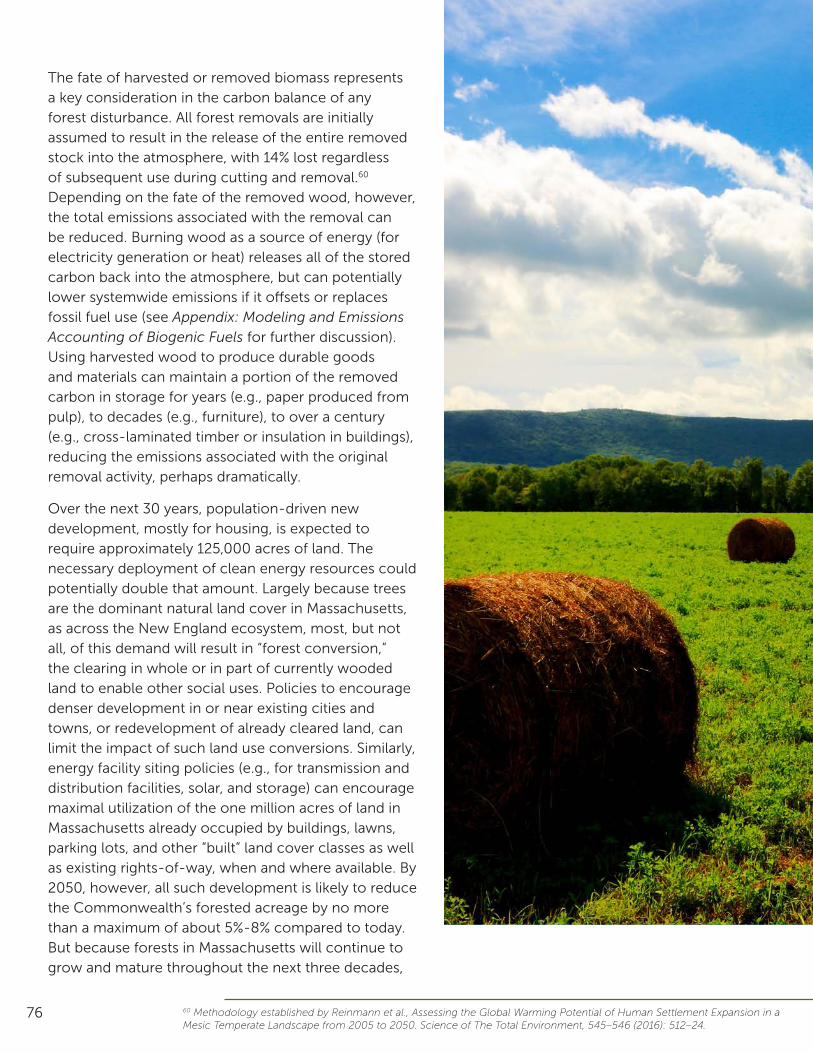
76
The fate of harvested or removed biomass represents a key consideration in the carbon balance of any forest disturbance. All forest removals are initially assumed to result in the release of the entire removed stock into the atmosphere, with 14% lost regardless of subsequent use during cutting and removal.60 Depending on the fate of the removed wood, however, the total emissions associated with the removal can be reduced. Burning wood as a source of energy (for electricity generation or heat) releases all of the stored carbon back into the atmosphere, but can potentially lower systemwide emissions if it offsets or replaces fossil fuel use (see Appendix: Modeling and Emissions Accounting of Biogenic Fuels for further discussion). Using harvested wood to produce durable goods and materials can maintain a portion of the removed carbon in storage for years (e.g., paper produced from pulp), to decades (e.g., furniture), to over a century (e.g., cross-laminated timber or insulation in buildings), reducing the emissions associated with the original removal activity, perhaps dramatically.
Over the next 30 years, population-driven new development, mostly for housing, is expected to require approximately 125,000 acres of land. The necessary deployment of clean energy resources could potentially double that amount. Largely because trees are the dominant natural land cover in Massachusetts, as across the New England ecosystem, most, but not all, of this demand will result in “forest conversion,” the clearing in whole or in part of currently wooded land to enable other social uses. Policies to encourage denser development in or near existing cities and towns, or redevelopment of already cleared land, can limit the impact of such land use conversions. Similarly, energy facility siting policies (e.g., for transmission and distribution facilities, solar, and storage) can encourage maximal utilization of the one million acres of land in Massachusetts already occupied by buildings, lawns, parking lots, and other “built” land cover classes as well as existing rights-of-way, when and where available. By 2050, however, all such development is likely to reduce the Commonwealth’s forested acreage by no more than a maximum of about 5%-8% compared to today. But because forests in Massachusetts will continue to grow and mature throughout the next three decades,
60 Methodology established by Reinmann et al., Assessing the Global Warming Potential of Human Settlement Expansion in a Mesic Temperate Landscape from 2005 to 2050. Science of The Total Environment, 545–546 (2016): 512–24.
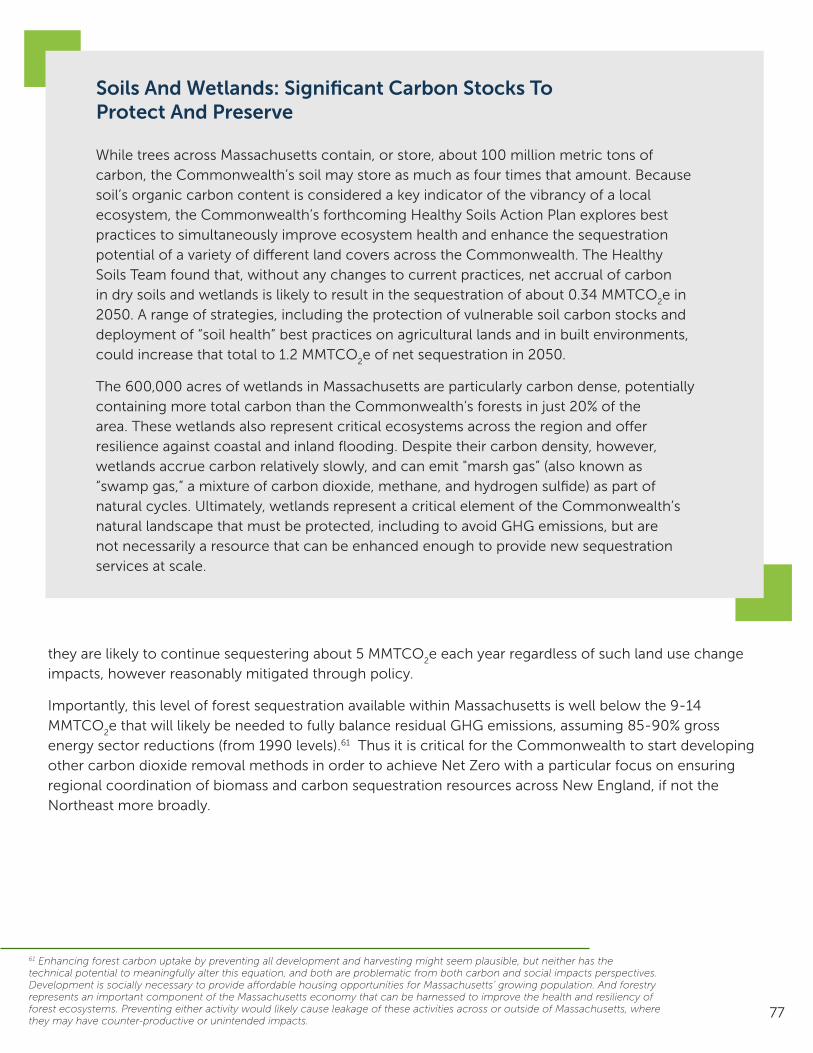
77
Soils And Wetlands: Significant Carbon Stocks To Protect And Preserve
While trees across Massachusetts contain, or store, about 100 million metric tons of carbon, the Commonwealth’s soil may store as much as four times that amount. Because soil’s organic carbon content is considered a key indicator of the vibrancy of a local ecosystem, the Commonwealth’s forthcoming Healthy Soils Action Plan explores best practices to simultaneously improve ecosystem health and enhance the sequestration potential of a variety of different land covers across the Commonwealth. The Healthy Soils Team found that, without any changes to current practices, net accrual of carbon in dry soils and wetlands is likely to result in the sequestration of about 0.34 MMTCO
2e in
2050. A range of strategies, including the protection of vulnerable soil carbon stocks and deployment of “soil health” best practices on agricultural lands and in built environments, could increase that total to 1.2 MMTCO
2e of net sequestration in 2050.
The 600,000 acres of wetlands in Massachusetts are particularly carbon dense, potentially containing more total carbon than the Commonwealth’s forests in just 20% of the area. These wetlands also represent critical ecosystems across the region and offer resilience against coastal and inland flooding. Despite their carbon density, however, wetlands accrue carbon relatively slowly, and can emit "marsh gas” (also known as “swamp gas,” a mixture of carbon dioxide, methane, and hydrogen sulfide) as part of natural cycles. Ultimately, wetlands represent a critical element of the Commonwealth’s natural landscape that must be protected, including to avoid GHG emissions, but are not necessarily a resource that can be enhanced enough to provide new sequestration services at scale.
they are likely to continue sequestering about 5 MMTCO2e each year regardless of such land use change
impacts, however reasonably mitigated through policy.
Importantly, this level of forest sequestration available within Massachusetts is well below the 9-14 MMTCO
2e that will likely be needed to fully balance residual GHG emissions, assuming 85-90% gross
energy sector reductions (from 1990 levels).61 Thus it is critical for the Commonwealth to start developing other carbon dioxide removal methods in order to achieve Net Zero with a particular focus on ensuring regional coordination of biomass and carbon sequestration resources across New England, if not the Northeast more broadly.
61 Enhancing forest carbon uptake by preventing all development and harvesting might seem plausible, but neither has the technical potential to meaningfully alter this equation, and both are problematic from both carbon and social impacts perspectives. Development is socially necessary to provide affordable housing opportunities for Massachusetts’ growing population. And forestry represents an important component of the Massachusetts economy that can be harnessed to improve the health and resiliency of forest ecosystems. Preventing either activity would likely cause leakage of these activities across or outside of Massachusetts, where they may have counter-productive or unintended impacts.
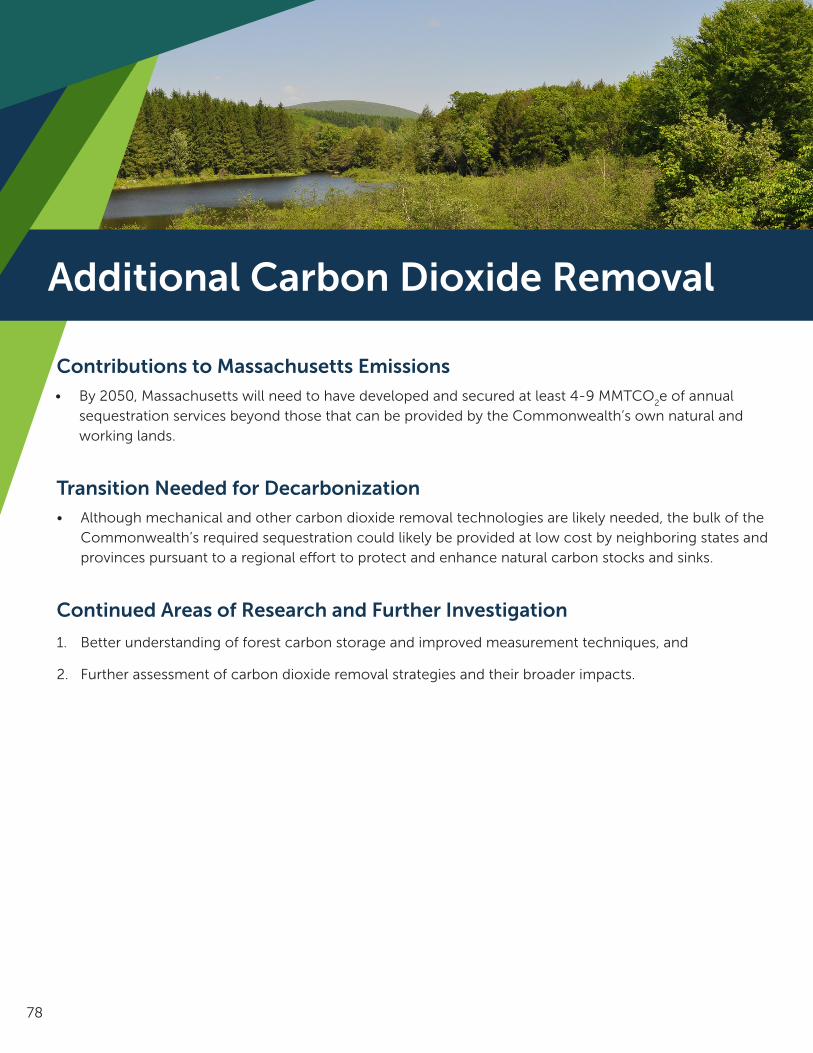
78
Additional Carbon Dioxide Removal
Contributions to Massachusetts Emissions
Transition Needed for Decarbonization• Although mechanical and other carbon dioxide removal technologies are likely needed, the bulk of the
Commonwealth’s required sequestration could likely be provided at low cost by neighboring states and provinces pursuant to a regional effort to protect and enhance natural carbon stocks and sinks.
Continued Areas of Research and Further Investigation
1. Better understanding of forest carbon storage and improved measurement techniques, and
2. Further assessment of carbon dioxide removal strategies and their broader impacts.
• By 2050, Massachusetts will need to have developed and secured at least 4-9 MMTCO2e of annual
sequestration services beyond those that can be provided by the Commonwealth’s own natural and working lands.

79
Lands in Massachusetts are unlikely to be able to sequester enough CO
2 to balance
Massachusetts’ residual emissions as will be required to achieve Net Zero by 2050. Given this limitation, as well as inherent existing and climate change-related future risks in relying solely on forest sequestration to meet Net Zero compliance, the Commonwealth will need to explore other strategies within and outside of our own boundaries, just as we will need to leverage renewable and clean energy resources beyond our boundaries to build an affordable and reliable clean energy supply.
The approaches used to preserve and enhance natural carbon stocks within the Commonwealth could be extended across the entire Northeast as part of a regional effort (discussed in the section on Natural Carbon Sequestration). Such a regional effort would further deepen the connection between states that lack sequestration potential – primarily the smaller, more densely-populated states in Southern New England – with the states that have a surplus of sequestration potential – primarily the larger, less-densely populated states in Northern New England. Doing so would also allow states to combine monitoring and measurement resources while being able to manage a connected ecosystem as a whole, rather than in parts, driving further economic and ecosystem co-benefits. Such a program, especially if extended broadly from New York to New Brunswick, could be aligned with existing North American and emerging global programs aimed at managing natural carbon stocks.
While collaboration to preserve and enhance the region’s forest and natural lands provides benefits for the region, diversifying the Commonwealth’s sources of carbon sink by leveraging other carbon dioxide removal (CDR) approaches and technologies such as those listed in Table 2, can also be advantageous in terms of minimizing costs, risks, and impacts. Defining a CDR strategy, concurrent with protecting existing forests, is an important next step for the Commonwealth. Doing so will require setting up a clear and transparent tracking system that ensures that removals are permanent, have little to no leakage, and appropriately address various risks while maximizing co-benefits.
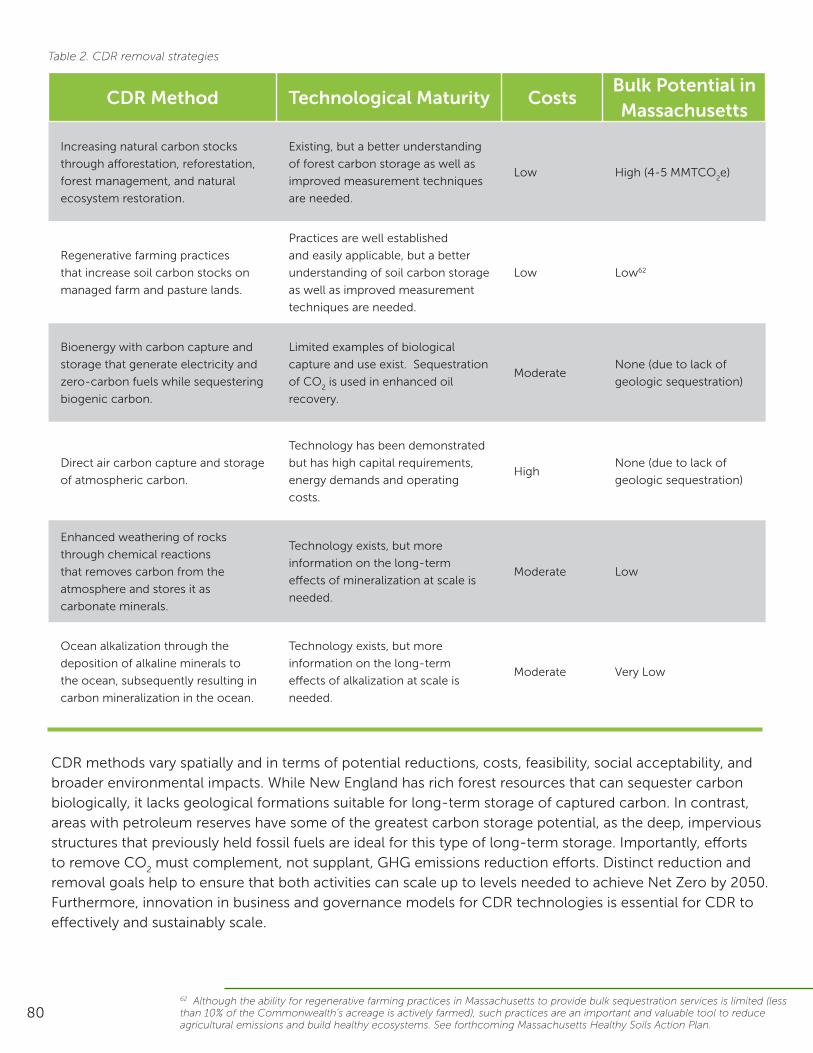
80
CDR Method Technological Maturity CostsBulk Potential in Massachusetts
Increasing natural carbon stocks
through afforestation, reforestation,
forest management, and natural
ecosystem restoration.
Existing, but a better understanding
of forest carbon storage as well as
improved measurement techniques
are needed.
Low High (4-5 MMTCO2e)
Regenerative farming practices
that increase soil carbon stocks on
managed farm and pasture lands.
Practices are well established
and easily applicable, but a better
understanding of soil carbon storage
as well as improved measurement
techniques are needed.
Low Low62
Bioenergy with carbon capture and
storage that generate electricity and
zero-carbon fuels while sequestering
biogenic carbon.
Limited examples of biological
capture and use exist. Sequestration
of CO2 is used in enhanced oil
recovery.
ModerateNone (due to lack of
geologic sequestration)
Direct air carbon capture and storage
of atmospheric carbon.
Technology has been demonstrated
but has high capital requirements,
energy demands and operating
costs.
HighNone (due to lack of
geologic sequestration)
Enhanced weathering of rocks
through chemical reactions
that removes carbon from the
atmosphere and stores it as
carbonate minerals.
Technology exists, but more
information on the long-term
effects of mineralization at scale is
needed.
Moderate Low
Ocean alkalization through the
deposition of alkaline minerals to
the ocean, subsequently resulting in
carbon mineralization in the ocean.
Technology exists, but more
information on the long-term
effects of alkalization at scale is
needed.
Moderate Very Low
Table 2. CDR removal strategies
CDR methods vary spatially and in terms of potential reductions, costs, feasibility, social acceptability, and broader environmental impacts. While New England has rich forest resources that can sequester carbon biologically, it lacks geological formations suitable for long-term storage of captured carbon. In contrast, areas with petroleum reserves have some of the greatest carbon storage potential, as the deep, impervious structures that previously held fossil fuels are ideal for this type of long-term storage. Importantly, efforts to remove CO
2 must complement, not supplant, GHG emissions reduction efforts. Distinct reduction and
removal goals help to ensure that both activities can scale up to levels needed to achieve Net Zero by 2050. Furthermore, innovation in business and governance models for CDR technologies is essential for CDR to effectively and sustainably scale.
62 Although the ability for regenerative farming practices in Massachusetts to provide bulk sequestration services is limited (less than 10% of the Commonwealth’s acreage is actively farmed), such practices are an important and valuable tool to reduce agricultural emissions and build healthy ecosystems. See forthcoming Massachusetts Healthy Soils Action Plan.
v
Getting to Net Zero: Implications for
Policy and Action
Chapter 5
82
Achieving Net Zero by 2050 will require significant transformations across the Commonwealth. The strategies and findings described in this Roadmap Report illustrate
that Massachusetts has a robust, though not unlimited, range of viable options for deep decarbonization which will allow us to achieve our climate change mitigation goals at
reasonable costs and using technologies and solutions that are known and, for the most part, available today. Importantly, these findings also demonstrate that working to achieve
Net Zero will also provide broad and substantial economic opportunity and public health benefits to everyone in Massachusetts. In particular, transitioning away from the use of fossil
fuels across the economy promises to deliver significant improvements in air quality and health benefits to overburdened Environmental Justice populations and communities of color.
As discussed herein, there are distinct tradeoffs in terms of costs, co-benefits, and risks among and between decarbonization pathways more broadly, and specific implementation actions more narrowly. But across pathways, certain strategies emerge as, essentially, “no regrets” near-term opportunities that can deliver required emissions reductions while maintaining future optionality and reducing future risk. Key among those opportunities is beginning to leverage stock roll-over, and its inherent cost-savings, immediately by accelerating the deployment of 2050-compliant solutions today across the buildings, transportation, and electricity sectors. The most cost-effective (and perhaps the only feasible) ways for Massachusetts to achieve our required near-term emissions reductions include increased regional coordination – particularly regarding transportation fuels and energy system planning – and the electrification of residential and small business building heating and of passenger cars and trucks. These near-term actions also set the Commonwealth up to achieve the much deeper reductions and carbon removal that Net Zero requires in the longer-term.
We have decided not to aim for what we know to
be possible, but what we know to be necessary. Our
task is now to make the necessary possible.
Dan Jørgensen, Danish Minister for Climate, Energy and Utilities
New, transformed, and expanded markets will play a critical role in achieving Net Zero. Many, if not most, of the Commonwealth’s and the region’s existing energy-related markets will need to be reshaped either directly through intentional redesign or indirectly in response to increasingly stringent, mandatory emissions limits. Investments made today in new, innovative technologies and approaches to decarbonization – particularly in the transportation and buildings sectors, where success depends upon millions of individual transactions – can help the Commonwealth achieve our Net Zero emissions goal at a faster pace and at a lower cost. Continued active leadership from the Commonwealth in this respect will be instrumental in achieving Net Zero by 2050 and doing
83
so affordably; but it appears practically, if not technically, impossible for Massachusetts to reach that overall goal in isolation or through state-level policies alone. Federal policies that actively support state decarbonization efforts, as well as strong regional coordination, are necessary for the Commonwealth’s ultimate success.
The pace and scale of transformation that will be required to achieve Net Zero demands that close attention and vigilant care is given to mitigate any undue or avoidable impact or burden on Massachusetts’ residents across the Commonwealth’s entire economic, social, and geographic diversity. While similar care and attention must also be paid to potential impacts and burdens on the Commonwealth’s natural resources and on our economy-sustaining business community, the greatest concern and urgency pertains to the Commonwealth’s disproportionately over-burdened EJ populations. It is a top priority to ensure that the benefits from climate mitigation actions are realized by those who have borne the disproportionate burden of historic and current fossil fuel pollution.
Despite the clarity that the Roadmap Study has provided regarding the main strategies and dynamics that will shape the Commonwealth’s achievement of Net Zero in 2050, many details of this major, long-term transition must still be carefully and thoughtfully determined with widespread, active public engagement. However, with a sincere commitment to on-time, near-term action and sustained collaboration, the Commonwealth can and will achieve Net Zero and the widespread environmental, economic, and health benefits it will deliver.

84
v
Appendices
Chapter 6
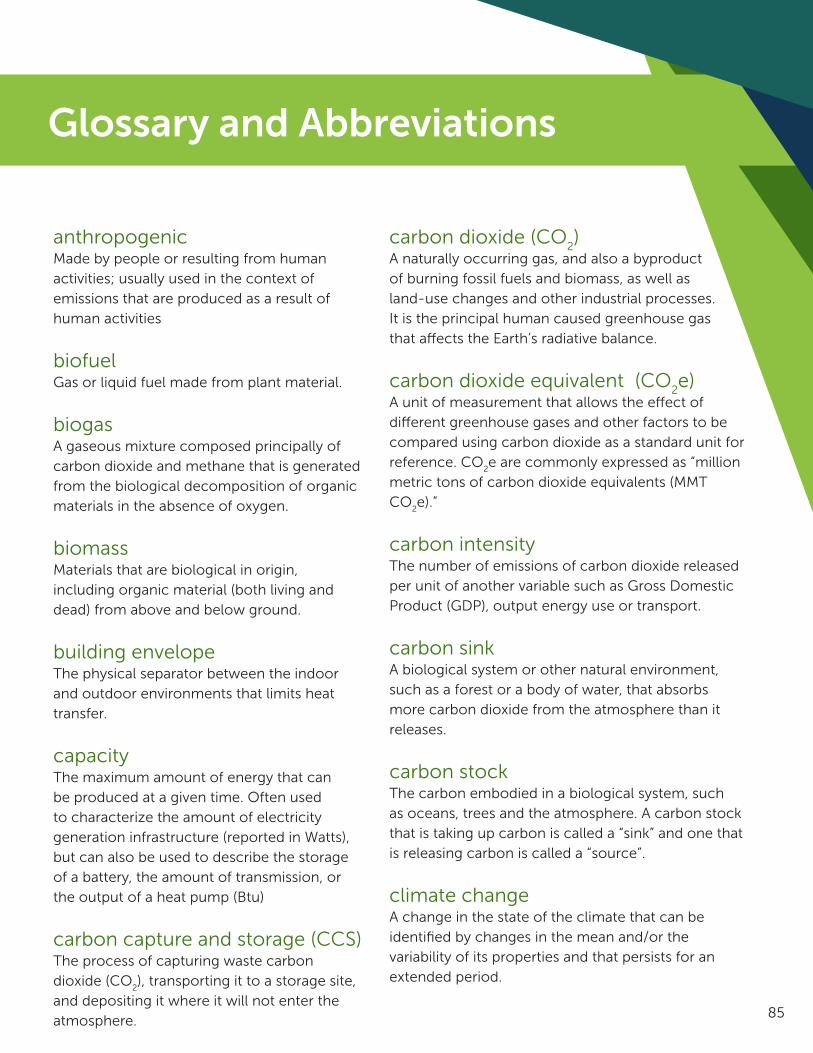
85
anthropogenic Made by people or resulting from human activities; usually used in the context of emissions that are produced as a result of human activities
biofuelGas or liquid fuel made from plant material.
biogas A gaseous mixture composed principally of carbon dioxide and methane that is generated from the biological decomposition of organic materials in the absence of oxygen.
biomass Materials that are biological in origin, including organic material (both living and dead) from above and below ground.
building envelopeThe physical separator between the indoor and outdoor environments that limits heat transfer.
capacityThe maximum amount of energy that can be produced at a given time. Often used to characterize the amount of electricity generation infrastructure (reported in Watts), but can also be used to describe the storage of a battery, the amount of transmission, or the output of a heat pump (Btu)
carbon capture and storage (CCS)The process of capturing waste carbon dioxide (CO
2), transporting it to a storage site,
and depositing it where it will not enter the atmosphere.
Glossary and Abbreviations
carbon dioxide (CO2)
A naturally occurring gas, and also a byproduct of burning fossil fuels and biomass, as well as land-use changes and other industrial processes. It is the principal human caused greenhouse gas that affects the Earth’s radiative balance.
carbon dioxide equivalent (CO2e)
A unit of measurement that allows the effect of different greenhouse gases and other factors to be compared using carbon dioxide as a standard unit for reference. CO
2e are commonly expressed as “million
metric tons of carbon dioxide equivalents (MMT CO
2e).”
carbon intensity The number of emissions of carbon dioxide released per unit of another variable such as Gross Domestic Product (GDP), output energy use or transport.
carbon sink A biological system or other natural environment, such as a forest or a body of water, that absorbs more carbon dioxide from the atmosphere than it releases.
carbon stockThe carbon embodied in a biological system, such as oceans, trees and the atmosphere. A carbon stock that is taking up carbon is called a “sink” and one that is releasing carbon is called a “source”.
climate change A change in the state of the climate that can be identified by changes in the mean and/or the variability of its properties and that persists for an extended period.

86
co-benefitsThe positive effects that a policy or measure aimed at one objective might have on other objectives, irrespective of the net effect on overall social welfare.
decarbonization The process by which countries or other entities aim to achieve a low-carbon economy, or by which individuals aim to reduce their consumption of carbon.
dispatch/dispatchable resourcesThe schedule or calculation used to determine what energy generating resources to call upon. Typically, dispatchable resources are responsive to the requests of grid operators and can adjust their power output according to needs.
distributionThe process and system of moving electricity from the transmission system to individual consumers.
distributed energy resources (DER)Electricity-producing resources or controllable loads that are either connected to a local distribution system or connected to a facility within the distribution system. DERs are typically smaller than traditional generation facilities.
direct emissionsGreenhouse gas emissions from sources that are attributed to the reporting entity.
emissions The release of a substance (usually a gas when referring to the subject of climate change) into the atmosphere.
energy efficiency Using less energy to provide the same service (lighting, mobility, cooling/heating, etc).
final energy The total energy consumed by end users, such as households or businesses. Final energy is what reaches the final consumer’s equipment; it excludes the energy used by the energy sector itself.
flexible loads Energy using devices where their energy demands can be shifted according to user needs and/or requirement of power balance.
fossil fuelA general term for organic materials formed from decayed plants and animals that have been converted to crude oil, coal, natural gas, or heavy oils by exposure to heat and pressure in the earth’s crust over hundreds of millions of years.
generationThe production electric power from a primary energy resource: natural gas, wind, solar. Typically reported in Watt-hours.
global warming potential (GWP) A measure allowing comparisons of different gasses across a common unit.
greenhouse gas (GHG)Any gas that absorbs infrared radiation in the atmosphere.
hydrogen electrolysis The process of using electricity to produce hydrogen and oxygen from water.
indirect emissionsGHG emissions that are a consequence of the activities of the reporting entity, but occur at sources owned or controlled by another entity.
inventory A comprehensive, quantified list of an entity’s or
jurisdiction’s GHG emissions and sources.
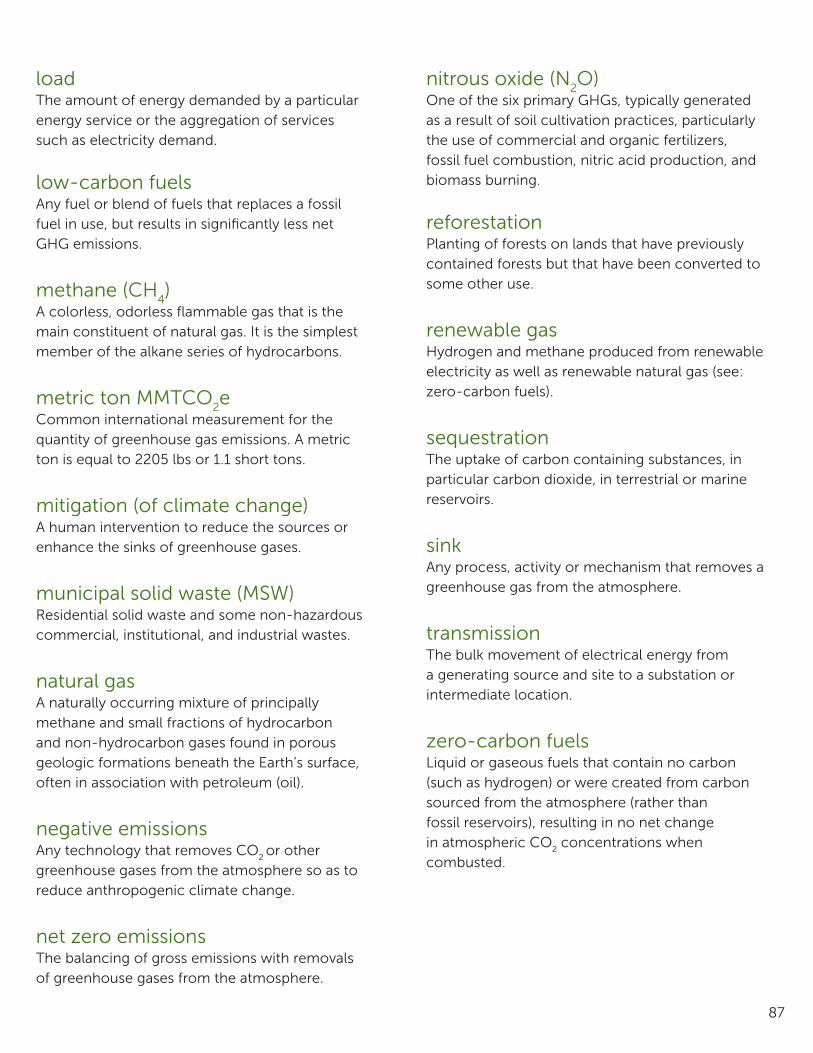
87
load The amount of energy demanded by a particular energy service or the aggregation of services such as electricity demand.
low-carbon fuelsAny fuel or blend of fuels that replaces a fossil fuel in use, but results in significantly less net GHG emissions.
methane (CH4)
A colorless, odorless flammable gas that is the main constituent of natural gas. It is the simplest member of the alkane series of hydrocarbons.
metric ton MMTCO2e
Common international measurement for the quantity of greenhouse gas emissions. A metric ton is equal to 2205 lbs or 1.1 short tons.
mitigation (of climate change) A human intervention to reduce the sources or enhance the sinks of greenhouse gases.
municipal solid waste (MSW) Residential solid waste and some non-hazardous commercial, institutional, and industrial wastes.
natural gas A naturally occurring mixture of principally methane and small fractions of hydrocarbon and non-hydrocarbon gases found in porous geologic formations beneath the Earth’s surface, often in association with petroleum (oil).
negative emissions Any technology that removes CO
2 or other
greenhouse gases from the atmosphere so as to reduce anthropogenic climate change.
net zero emissionsThe balancing of gross emissions with removals of greenhouse gases from the atmosphere.
nitrous oxide (N2O)
One of the six primary GHGs, typically generated as a result of soil cultivation practices, particularly the use of commercial and organic fertilizers, fossil fuel combustion, nitric acid production, and biomass burning.
reforestation Planting of forests on lands that have previously contained forests but that have been converted to some other use.
renewable gas Hydrogen and methane produced from renewable electricity as well as renewable natural gas (see: zero-carbon fuels).
sequestration The uptake of carbon containing substances, in particular carbon dioxide, in terrestrial or marine reservoirs.
sinkAny process, activity or mechanism that removes a greenhouse gas from the atmosphere.
transmission The bulk movement of electrical energy from a generating source and site to a substation or intermediate location.
zero-carbon fuels Liquid or gaseous fuels that contain no carbon (such as hydrogen) or were created from carbon sourced from the atmosphere (rather than fossil reservoirs), resulting in no net change in atmospheric CO
2 concentrations when
combusted.
88
Modeling and Emissions Accounting of Biogenic Fuels
For end uses that are difficult to electrify (e.g., commercial aviation, certain heavy-duty vehicles, and some large or complex building types), other low- or net-zero-carbon fuels will likely be
necessary to reduce end use emissions to levels consistent with Net Zero by 2050. As described in chapters 3 and 4, all such “drop-in” fuels must be synthesized (for example, from captured CO
2 and
electrolysis-derived hydrogen) or refined from biomass resources.
This appendix primarily addresses certain issues related to low- and net-zero-carbon fuels derived from biomass – that is organic material that comes from plants. In general, biomass feedstocks sequester
atmospheric CO2 as they grow, converting that CO
2 into carbohydrates through photosynthesis. The
energy stored in biomass can be utilized in place of fossil fuels, but doing so releases CO2 back into the
atmosphere. Ideally this cycle forms a closed loop, leading to no net emissions of CO2. However, this is not
necessarily the case in practice as crop production, fuel refinement, and transportation each may consume additional energy, releasing additional CO
2. This appendix discusses how this distinction plays out in the
Roadmap Study’s modeling, as well as implications for how to track sequestration and emission of biogenic fluxes in Massachusetts’ GHG Inventory.
Gross and Net Emissions Accounting
The use of biomass energy in the Commonwealth is not new. Certain forms of biomass energy have been included in the Renewable Energy Portfolio Standard (RPS) since its inception in 2003, and the state’s gasoline supply has included a blend of (largely corn-based, Midwestern U.S.) ethanol since 2001.
Since 2008, Massachusetts has worked toward gross emissions limits set forth by the GWSA, tracking compliance using a gross emissions accounting framework. The recent establishment of a statewide Net Zero emissions limit in 2050, however, requires ultimately that compliance be tracked on a statewide net emissions accounting framework. Under the current emissions inventory, emissions from burning biogenic fuels have been tracked but not counted against GWSA compliance (see Table 1). Similarly, some carbon dioxide removed from the atmosphere and sequestered by natural and working lands has been tracked, but not counted toward compliance. In a net emissions accounting framework, both of these biogenic carbon fluxes will likely need to be factored into GWSA compliance accounting.
In addition, the likely evolution and potential expanded use of biogenic fuels, described in the Energy Pathways Technical Report, will interact with, and has the potential to impact, land resources, food-crop cultivation, and chemical feedstocks.63 Switching from gross to a net emissions accounting framework provides the opportunity for the Commonwealth to proactively align credit eligibility and emissions accounting, as well as add consideration of, or otherwise address, other externalities associated with biofuel production and use.
63 To minimize the likelihood that such future use might negatively impact other important land-centered uses, the Energy Pathways Technical Report build on U.S. Department of Energy findings contained in its Billion Ton Study (2016) which addressed such trade-offs and potential impacts (e.g., of the demand for arable land to supply long-range food production needs versus the ability of the U.S. to dedicate farmland to the production of biomass energy feedstocks) at length and in great detail for the U.S. as a whole, including regional analysis covering New England.
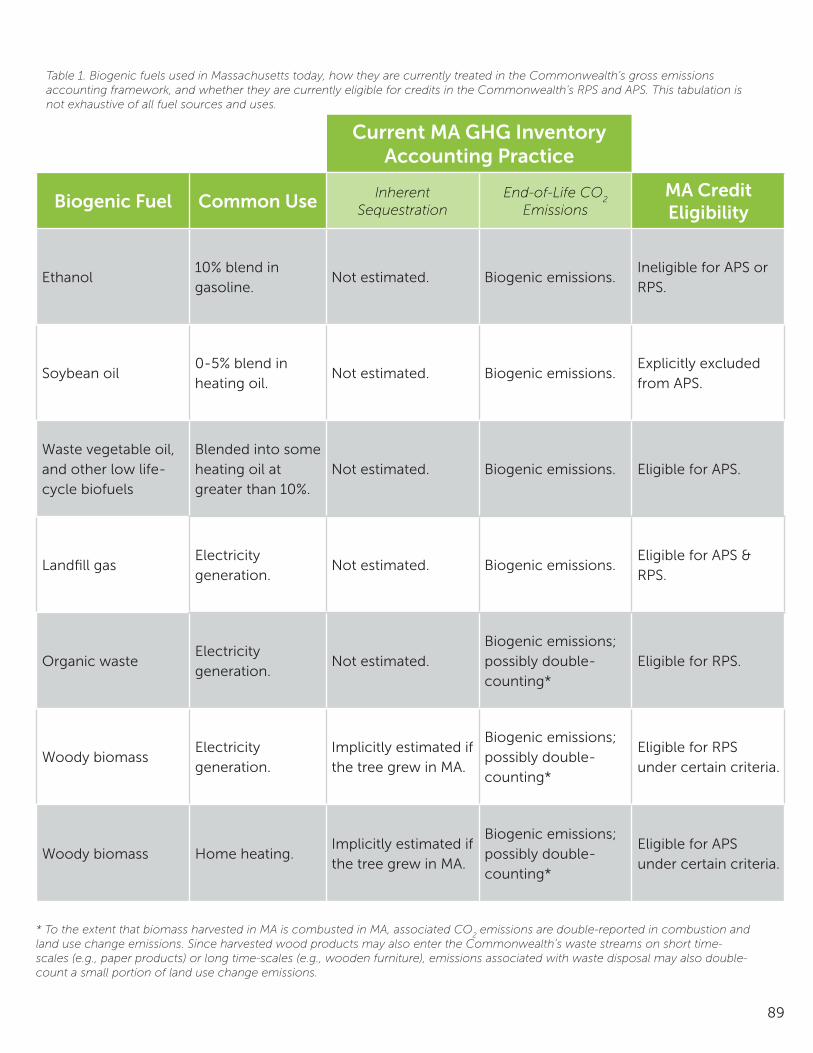
89
Table 1. Biogenic fuels used in Massachusetts today, how they are currently treated in the Commonwealth’s gross emissions accounting framework, and whether they are currently eligible for credits in the Commonwealth’s RPS and APS. This tabulation is not exhaustive of all fuel sources and uses.
Biogenic Fuel Common Use Inherent Sequestration
End-of-Life CO2
EmissionsMA Credit Eligibility
Ethanol10% blend in gasoline.
Not estimated. Biogenic emissions.Ineligible for APS or RPS.
Soybean oil0-5% blend in heating oil.
Not estimated. Biogenic emissions.Explicitly excluded from APS.
Waste vegetable oil, and other low life-cycle biofuels
Blended into some heating oil at greater than 10%.
Not estimated. Biogenic emissions. Eligible for APS.
Landfill gasElectricity generation.
Not estimated. Biogenic emissions.Eligible for APS & RPS.
Organic wasteElectricity generation.
Not estimated.Biogenic emissions; possibly double-counting*
Eligible for RPS.
Woody biomassElectricity generation.
Implicitly estimated if the tree grew in MA.
Biogenic emissions; possibly double-counting*
Eligible for RPS under certain criteria.
Woody biomass Home heating.Implicitly estimated if the tree grew in MA.
Biogenic emissions; possibly double-counting*
Eligible for APS under certain criteria.
Current MA GHG Inventory Accounting Practice
* To the extent that biomass harvested in MA is combusted in MA, associated CO2 emissions are double-reported in combustion and
land use change emissions. Since harvested wood products may also enter the Commonwealth’s waste streams on short time-scales (e.g., paper products) or long time-scales (e.g., wooden furniture), emissions associated with waste disposal may also double-count a small portion of land use change emissions.
90
Net-Zero Emissions Considerations
The scientific and regulatory processes for identifying low- and net-zero-carbon fuels are well established in regulatory programs around the world, including Massachusetts. Important considerations in categorizing low and net-zero-carbon fuels are:
• the length of the biogenic fuel’s life-cycle, that is, the respective durations of carbon accumulation and carbon release;
• the emissions associated with biogenic fuel’s life cycle (from feedstock growth to fuel production/conversion to transportation and finally to combustion);
• the jurisdictional boundaries that determine which emissions or sequestration are, or are not, attributable to the Commonwealth and its emissions inventory; and
• the legal standard, or standards, by which low- and zero-carbon fuels and their attributes (emissions and carbon storage) should be accepted, and accounted for, across and between jurisdictions and entities.
These factors are closely inter-linked and are important in determining whether, when, and where a biogenic fuel can be properly considered low- or zero-carbon. Each is discussed further below:
Biogenic fuel carbon cycle: In general, biofuel feedstocks sequester atmospheric carbon dioxide as they grow, converting that CO
2 into carbohydrates through photosynthesis. Because emission inventories
track carbon fluxes over a period of time (usually one year), the length of time that a biofuel’s feedstock requires to build up its carbon can complicate the fuel’s net emissions accounting. For example, the current feedstocks of most liquid biofuels (corn and soybeans) grow in a single season; this results in a simple comparison to annual fuel consumption volumes used to estimate CO
2 emissions in an annual inventory.
Compared to liquid biofuels, woody biomass has a longer cycle, since most trees grow for years to decades before being harvested; this allows for the possibility that decades of sequestration could be emitted in a single year. Furthermore, thinning and sustainable harvest may result in new growth beyond the growth anticipated without any harvest, which might potentially be understood to reasonably offset a portion of biogenic emissions from woody biomass. This set of multi-year interactions must be resolved into an annual accounting framework.
Life cycle emissions and Inventory boundaries: There are, potentially, additional emissions associated with the production, processing, and transportation of these feedstocks and fuels which may be important in a net emissions accounting framework. Such “full life cycle” emissions, however, are not unique to biogenic fuels and may not be appropriate for inclusion in the Commonwealth’s emissions accounting framework even in a future “net emissions” system.
Importantly, the interaction of different land covers and uses may need to be considered. Increasing demand for biofuels, for example, could lead to the conversion of forest land into agricultural land in order to augment crop yields without impacting current uses (e.g., food production). With no adjustments to the Commonwealth’s current emissions accounting practices, the emissions associated with felling trees and plowing soil, as well as any foregone future sequestration due to the land cover change, would only be considered if they occurred in Massachusetts. However, these impacts are much more likely to occur outside of Massachusetts (e.g., in the Midwestern United States or perhaps South America). In the context of the GWSA, these out-of-state GHG emissions could be considered “leakage” and are therefore appropriate

91
to consider in GWSA implementation (for example, by certification, discussed below), even if they are not explicitly estimated in the Inventory.
Credit Standards: As with renewable electricity, where the environmental attributes of an otherwise indistinguishable commodity (power) are recognized, traded, and owned pursuant to accepted regulatory standards, many of the issues identified regarding biogenic fuels can likely be addressed through similar means. Renewable Energy Portfolio Standard, Clean Energy Standard (CES), and APS eligibility for biofuels generally requires that they achieve at least a 50% reduction in life-cycle GHG emissions compared to similar fossil-fueled end uses (like electricity generation or space heating). The life-cycle emissions assessments required under RPS, APS, and CES are meant to protect against adverse environmental impacts, including out-of-state impacts not reflected in the GHG inventory. It is reasonable to assume that biogenic fuels—whether low- or zero-carbon—could be accepted together with regulatory or market certificates indicating that such fuels meet certain standards, which could include minimum life-cycle emissions reductions or related policy goals around waste utilization, feedstock competition, land cover protection, etc. Ideally, as with renewable electricity, these standards should likely also recognize any technically relevant geographic boundaries and be reasonably consistent across New England, if not more broadly.
Study Assumptions
The terms “low carbon” and “net-zero-carbon” are used to refer to fuels that may play a role in reducing GHG emissions. In general, these terms are used to refer to fuels that have lower emissions, on a lifecycle basis, than fossil fuels or “conventional” crop-based biofuels such as fuels produced from corn or soy crops. Some low-carbon biogenic fuels derived from sources such as forestry and agricultural byproducts are in limited use today. As technology continues to improve, net-zero biogenic fuels, likely derived from similar feedstocks, are assumed to become more widely available over time. Massachusetts’ current gross emissions inventory generally excludes all such biogenic fuel emissions, while a future net emissions accounting framework may include some or all of them.
For arithmetic simplicity, across the modeling in the Decarbonization Roadmap Study, when certain “zero-carbon” fuels are discussed, they are assumed to meet the kind of accreditation discussed above and so are assumed to have a GHG emissions value of 0 (i.e., net-zero emissions). In most cases, the zero-carbon resource is meant to represent a component that is blended into broader fuel supplies, resulting a lower-carbon product. In practice, particularly in the near to mid-term, it is possible – if not likely – that any modeled low-carbon fuel reflects a blend of a non-zero-carbon fuel with a conventional fossil fuel. For example, a 10% “zero-carbon” resource could be achieved by an 80/20 blend of fossil fuel and a biofuel with a 50% carbon content reduction. However, as the rest of nation engages more broadly in the deep emissions reductions Massachusetts is pursuing, the life-cycle emissions associated with the production and transportation of biofuels would also decline toward zero, bringing their final “total life-cycle” emissions to, or very close to, zero.
Consistent with the Commonwealth’s current emissions accounting framework, further assumptions made in the Study that relate to biogenic fuels include:
• Fuel Production: Emissions associated with the production of the biofuels (e.g., distillation and refinement of feedstock crops) are assumed to be accounted for in the jurisdiction where the production activities take place.
92
• Equipment: Emissions from farm and forestry equipment are assumed to be accounted for in the jurisdiction where the biofuel feedstock and trees are cultivated and grown.
• Consumable Resources: Emissions from fertilizer use and other consumable resources are assumed to be accounted for in the jurisdiction in which they are produced.
• Fuel Delivery: Emissions from the transportation of the biofuel and biomass are assumed to be accounted for in Massachusetts, to the extent that the emissions from the vehicle or vessel transporting the fuel would already be included in MA’s GHG Inventory.
• Waste products: Waste products, such as crop residues, landfill gas, and woody debris, represent byproducts of other processes (both anthropogenic and natural). To the extent that any emissions would be associated with those processes, the re-use of these waste resources for fuel can be assumed to have zero emissions.
Synthetic Fuels
Instead of biogenic feedstock, captured CO2 combined with hydrogen to make a hydrocarbon, represents an
alternative pathway for producing low- or zero-carbon alternatives to liquid and gaseous fossil fuels. Much like biofuels, the life-cycle of synthetic fuels would likely also need to be assessed, particularly in the near to mid-term regarding both the source of the carbon (e.g., captured in a smoke-stack, or removed from the atmosphere by direct air capture?) and the source of the hydrogen (e.g., steam reformation of methane, or water electrolysis with clean electricity?).

93