Embed Size (px)
DESCRIPTION
sdf sdf
Citation preview

Application Note
Copyright © 2010 Alex Walker
The author has granted to CMC Microsystems in perpetuity, permission to distribute this application note.
Application Note: Understanding Synopsys Sentaurus Page 1 of 14
Understanding Synopsys Sentaurus by Simulating a P-N Junction
Alex Walker, Jeffrey F. Wheeldon, Gilbert Arbez, Karin Hinzer Centre for Research in Photonics, University of Ottawa, Ottawa, ON, Canada
In co-operation with CMC Microsystems
Scope
This application note describes the use of the Sentaurus software by presenting a simple and
practical application: modeling and simulating a Gallium Arsenide (GaAs) p-n junction. This
application note is not an in-depth user guide to the software. Instead, it is a simple tutorial for
understanding how the software models and simulates a semiconductor device and how to launch
and run the software. After reviewing this application note, you should consult the user guides
for each tool within the Sentaurus framework for more details.
Background
Sentaurus is a software environment capable of simulating the electrical, thermal, and optical
behaviour of semiconductor devices. The software is produced by Synopsys, Inc.
(www.synopsys.com).
The modeling and simulation of integrated circuit (IC) devices is an integral phase of research
and development (R&D) that minimizes fabrication and processing stages, while testing the
state-of-the-art theoretical understanding of the operation and behaviour of such devices. Once a
conceptual model has been developed and tested through experimental verification, the device
performance can be studied and optimized, thereby advancing the technology to new levels.
Developing the conceptual model representative of the device is of utmost importance, where
models within the scientific literature must be carefully selected to describe the behaviour of the
device. Sentaurus, with its large material parameter database, has several parameter and physical
models to choose from for the most important semiconductor materials. Simulations (one-, two-,
or three-dimensional) typically utilize several Sentaurus tools that communicate via input/output
files. All of the important simulated properties, such as current–voltage characteristics, carrier
lifetimes, electric fields, etc, can be plotted using the Inspect and Tecplot tools.
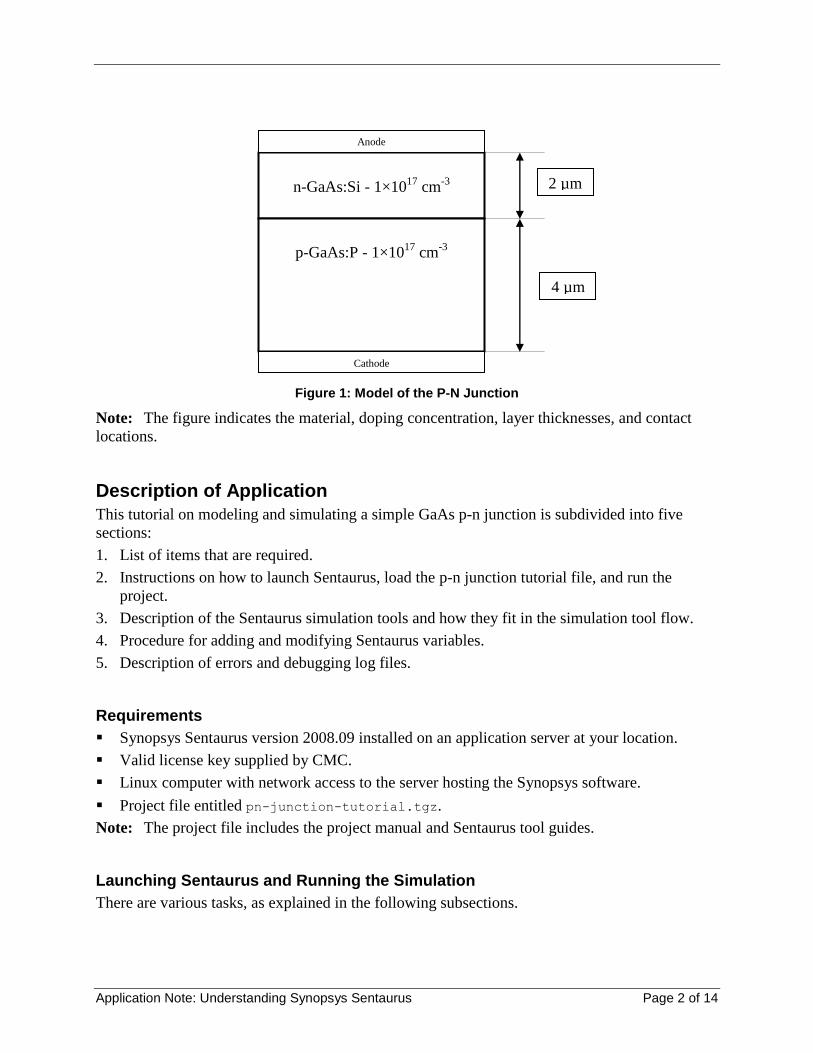
This application note focuses on the modeling and simulation of a GaAs/GaAs p-n junction, as
illustrated in Figure 1.
Application Note: Understanding Synopsys Sentaurus Page 2 of 14
Figure 1: Model of the P-N Junction
Note: The figure indicates the material, doping concentration, layer thicknesses, and contact
locations.
Description of Application
This tutorial on modeling and simulating a simple GaAs p-n junction is subdivided into five
sections:
1. List of items that are required.
2. Instructions on how to launch Sentaurus, load the p-n junction tutorial file, and run the
project.
3. Description of the Sentaurus simulation tools and how they fit in the simulation tool flow.
4. Procedure for adding and modifying Sentaurus variables.
5. Description of errors and debugging log files.
Requirements
Synopsys Sentaurus version 2008.09 installed on an application server at your location.
Valid license key supplied by CMC.
Linux computer with network access to the server hosting the Synopsys software.
Project file entitled pn-junction-tutorial.tgz.
Note: The project file includes the project manual and Sentaurus tool guides.
Launching Sentaurus and Running the Simulation
There are various tasks, as explained in the following subsections.
n-GaAs:Si - 1×10¹⁷
cm-3
p-GaAs:P - 1×10¹⁷
cm-3
Anode
Cathode
2 µm
4 µm

Application Note: Understanding Synopsys Sentaurus Page 3 of 14
Unzipping the tutorial file
To unzip the tutorial file:
1. From a command line, unzip the project file pn-junction-tutorial.tgz in a new directory
of your choice (for example, /home/Sentaurus/Projects/pn-junction-tutorial/).
tar –xvf pn-junction-tutorial.tgz
Setting up environment variables
To define the necessary environment variables:
1. Export the license file:
export LM_LICENSE_FILE=nnnnnn
where „nnnnnn‟ is the license key.
Note: This assignment can be defined in your .bashrc file in the home directory.
Launch Sentaurus Workbench
To launch Sentaurus Workbench:
1. Execute swb in the directory containing the Sentaurus software (for example,
/CMC/tools/Sentaurus/bin/swb).
Note: So that you do not need to browse to the directory each time you run the software, define
an alias in your .bashrc file to automatically point to the directory.
2. In the pop-up dialog box requesting the STDB, enter the location of your Sentaurus project
directory (for example, /home/Sentaurus/Projects/).
Note: To avoid this prompt in the future, define the variable STDB in your .bashrc file. As
indicated in Figure 2, the author‟s directory is /.automount/csie/h/users/awalk102/STDB/.

Application Note: Understanding Synopsys Sentaurus Page 4 of 14
Figure 2: Sentaurus Workbench Main Window
3. To refresh the directory listing, right-click on the STDB to see the newly added pn-junction-
tutorial project folder.
4. Double-click on the J-V project under the pn-junction-tutorial folder.
The main Sentaurus Workbench window is illustrated in Figure 2.
The pane on the left lists the project directories (outlined in green and identified as
“Sentaurus Workbench STDB”) with the loaded p-n junction tutorial J-V project highlighted.
The black outline indicates the visible tools: epi, SentaurusSE (Structure Editor), MatPar,
SentaurusD (Device), and Inspect.
The red rectangle indicates the variable wtot.
On the toolbar, an orange circle indicates the run and abort icons.
5. Projects are typically run through the following series of manipulations:
a. Unlock the project by either pressing Ctrl+K or, on the main menu, choosing
Project > Unlock.
To unlock, refer to step 5a
(CTRL+K)
Sentaurus
Workbench STDB
directory
Variable
“wtot”
Tools Epi, Sentaurus Structure
Editor, MatPar, Sentaurus Device &
Inspect

Application Note: Understanding Synopsys Sentaurus Page 5 of 14
b. Clean up the temporary files by either pressing Ctrl+L or, on the main menu, choosing
Project > Clean Up (see Figure 3).
Note: This step may not be necessary the first time, but it is important thereafter.
Figure 3: Cleanup Options Dialog Box
c. Run the simulation by doing one of the following:
i. Press Ctrl+R.
ii. On the toolbar, click the run icon.
iii. On the main menu, choose Nodes > Run.

Application Note: Understanding Synopsys Sentaurus Page 6 of 14
A pop-up dialog box describing the steps of the simulation on the Sentaurus Workbench is
shown in Figure 4.
Figure 4: Run Project Dialog Box
Note: In the Nodes drop-down list, it is usually sufficient to select either remaining or all.

Application Note: Understanding Synopsys Sentaurus Page 7 of 14
d. Once the simulation is running, the Project Log window displays (see Figure 5).
Figure 5: Project Log Window and Main Window Status Indicators
As indicated on the figure, note the following:
The status of the project will change from idle to running on the bottom right.
The last node of each tool will change color according to its status.
To view the output of each tool‟s simulation progress, right-click on the highlighted
node of the tool then select either View Output or Node Explorer as illustrated in
Figure 6 for node n96.
Node status
legend
Status:
running
Status:
queued

Application Note: Understanding Synopsys Sentaurus Page 8 of 14
Figure 6: Node ‘n96’ Output Window.
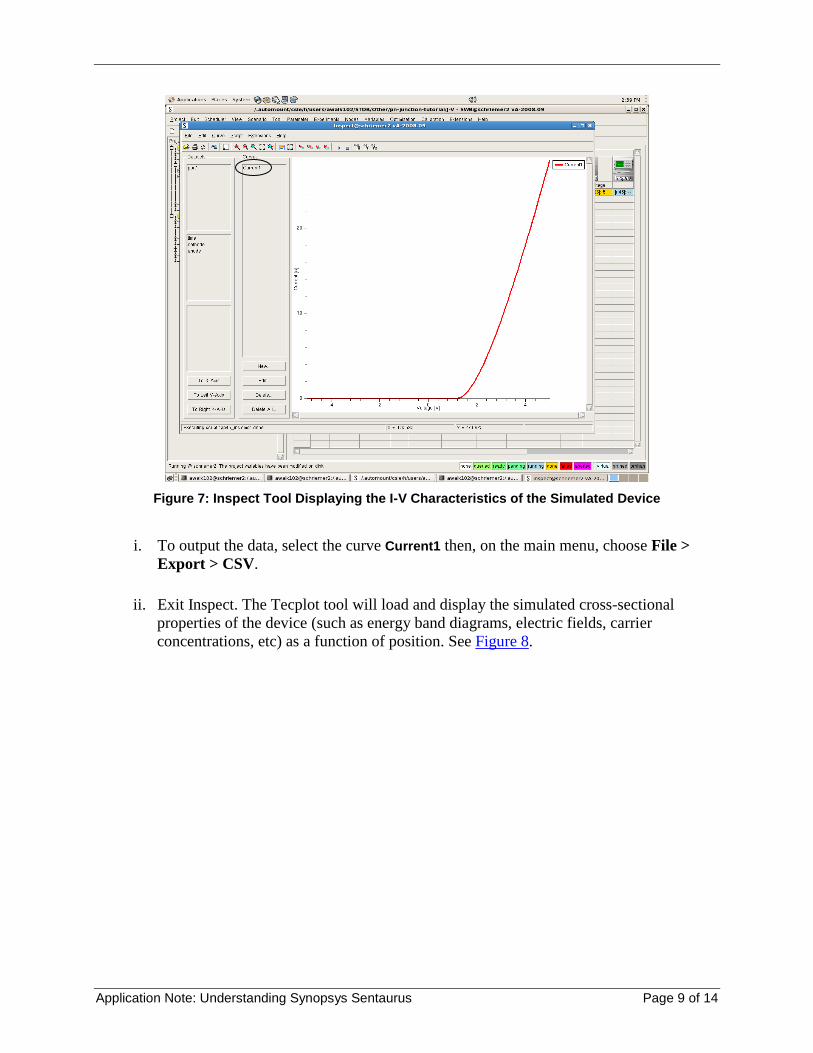
e. Once Sentaurus Device completes the numerical simulation, Inspect will graph the
simulated J-V characteristics, as shown in Figure 7.
Application Note: Understanding Synopsys Sentaurus Page 9 of 14
Figure 7: Inspect Tool Displaying the I-V Characteristics of the Simulated Device
i. To output the data, select the curve Current1 then, on the main menu, choose File >
Export > CSV.
ii. Exit Inspect. The Tecplot tool will load and display the simulated cross-sectional
properties of the device (such as energy band diagrams, electric fields, carrier
concentrations, etc) as a function of position. See Figure 8.

Application Note: Understanding Synopsys Sentaurus Page 10 of 14
Figure 8: Tecplot Tool Showing the Results of the Simulation
Note: The left graph indicates the doping concentration as a function of cross-section; the right
graph indicates the simulated energy band diagram as a function of cross-section.
iii. To output data from this tool, on the main menu choose File > Export > Inspect
graph. Inspect will automatically launch, and the desired data can be plotted. To export,
repeat Step 5.e.i.
6. When the simulation is complete, the Inspect and Tecplot tools can be run individually for
ease of exporting data.
7. In order to run the simulation again if parameters are altered, repeat Step 5.
8. To abort a simulation, either click on the abort icon (to the right of the run icon on
the toolbar) or choose Nodes > Abort on the main menu.
Sentaurus Workbench Tools and Simulation Tool Flow
Upon successfully running the tutorial project in Sentaurus, you may want to modify the
structure or physics under investigation or the output data displayed by either the Inspect or
Tecplot tools.
To make modifications, use the tool‟s command file:
1. Right-click on one of the tool icons (inside the black box in Figure 2).
2. Select Edit Input.
Application Note: Understanding Synopsys Sentaurus Page 11 of 14
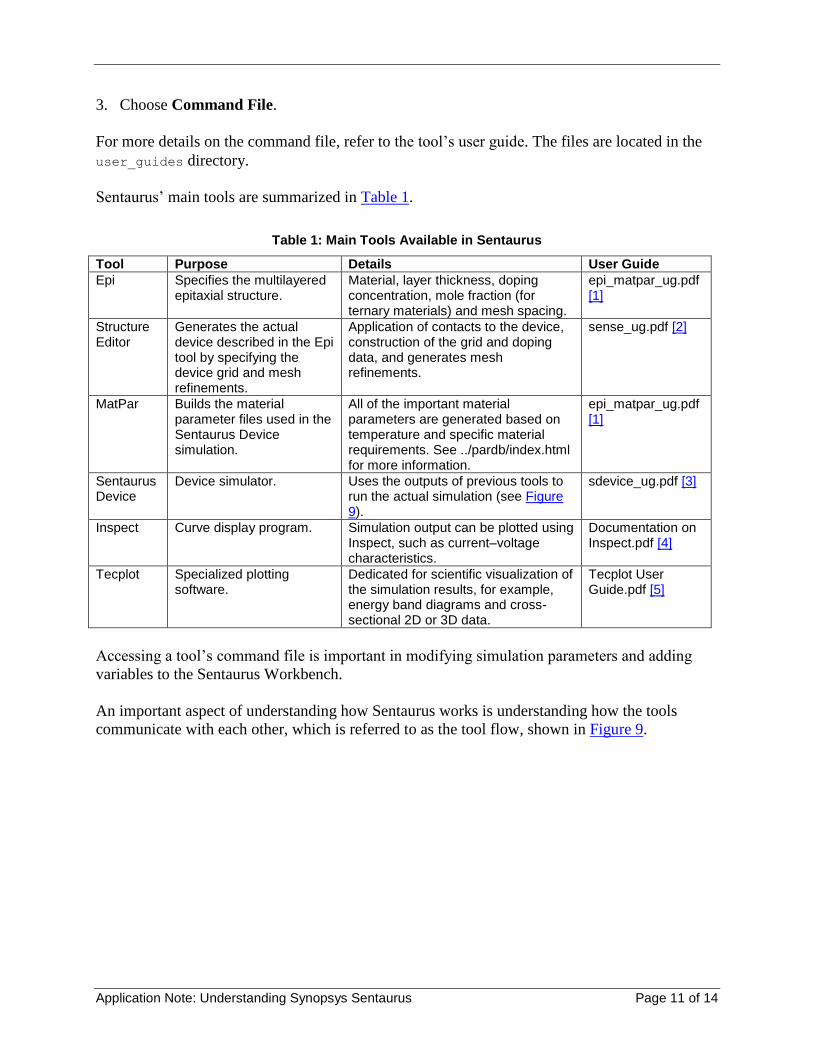
3. Choose Command File.
For more details on the command file, refer to the tool‟s user guide. The files are located in the
user_guides directory.
Sentaurus‟ main tools are summarized in Table 1.
Table 1: Main Tools Available in Sentaurus
Tool Purpose Details User Guide
Epi Specifies the multilayered epitaxial structure.
Material, layer thickness, doping concentration, mole fraction (for ternary materials) and mesh spacing.
epi_matpar_ug.pdf [1]
Structure Editor
Generates the actual device described in the Epi tool by specifying the device grid and mesh refinements.
Application of contacts to the device, construction of the grid and doping data, and generates mesh refinements.
sense_ug.pdf [2]
MatPar Builds the material parameter files used in the Sentaurus Device simulation.
All of the important material parameters are generated based on temperature and specific material requirements. See ../pardb/index.html for more information.
epi_matpar_ug.pdf [1]
Sentaurus Device
Device simulator. Uses the outputs of previous tools to run the actual simulation (see Figure 9).
sdevice_ug.pdf [3]
Inspect Curve display program. Simulation output can be plotted using Inspect, such as current–voltage characteristics.
Documentation on Inspect.pdf [4]
Tecplot Specialized plotting software.
Dedicated for scientific visualization of the simulation results, for example, energy band diagrams and cross-sectional 2D or 3D data.
Tecplot User Guide.pdf [5]
Accessing a tool‟s command file is important in modifying simulation parameters and adding
variables to the Sentaurus Workbench.
An important aspect of understanding how Sentaurus works is understanding how the tools
communicate with each other, which is referred to as the tool flow, shown in Figure 9.

Application Note: Understanding Synopsys Sentaurus Page 12 of 14
Figure 9: Simulation Tool Flow in Sentaurus Workbench
Epi tool
Purpose: Easily creates a multilayered epitaxial stack.
Input: command_epi.csv comma separated values (csv) command file which specifies
the material, thickness, doping concentration, mole fraction and mesh size for
each layer.
Output: nX_epi.scm, which becomes input to the Structure Editor tool, and
nX_epi.tcl, which becomes input to the MatPar tool.
Sentaurus Structure Editor tool
Purpose: Generates the actual device described in the Epi tool by specifying the device
grid and mesh refinements.
Input: sde_dvs.cmd (command file), and
nX_epi.scm (output from the Epi tool) which is imported via the command
load @episcm@ that is located in its command file sde_dvs.cmd. The
Structure Editor adds the contacts to the structure and generates the grid,
meshing, and doping information through its output file.
Output: grid_mesh.tdr, which becomes input to the Device tool.
MatPar tool
Purpose: Builds the material parameter files used in the Sentaurus Device simulation.
Input: material.tcl is a tcl based file that allows the user to describe specific
material models (such as bandgap, mobility, etc),
material.par is a file that includes all relevant material parameters required
for Sentaurus Device; this file can be used instead of the material.tcl file,
model.tcl is a tcl based file used to model the parameter of a material as a
function of its dependencies (for example, temperature or doping); these model
command_epi.csv
Epi Sentaurus
Structure Editor MatPar Sentaurus Device
nX_epi.scm
nX_epi.tcl
sde_dvs.cmd
grid_msh.tdr
material.tcl
material.par
model.tcl MatPar_mpr.cmd
nX_mpr.par
sdevice_des.cmd
current_des.plot
plot_des.plot

Application Note: Understanding Synopsys Sentaurus Page 13 of 14
files are found in the material parameter database (../pardb/),
MatPar_mpr.cmd (command file), and
nX_epi.tcl (output from the Epi tool) which is called via the command
source @pwd@/@epitcl@ that loads all the layer variables and generates each
material parameter file to the /npar directory using the material parameter
database directory ../pardb. The command file also specifies the temperature
of the simulation through the variable @temp@ defined in the Workbench. For
more information on this process, refer to [6].
Output: nX_mpr.par, which becomes input to the Device tool as a pointer to all MatPar
generated material parameter files located in the /npar/ directory.
Sentaurus Device tool
Purpose: Specifies the electrodes of the structure, the physical models, the output plot
data, the mathematical parameters for the simulation, and finally, the equations
to simulate (for example, Poisson, electron and hole continuity equations).
Input: sdevice_dvs.cmd (command file) that imports the material parameter files
(outlined in nX_mpr.par) built by MatPar using the material.tcl in
conjunction with the model.tcl files, and
nX_msh.tdr (output from the SentaurusSE tool) that contains the grid and
meshing data.
Output: current_des.plot, which becomes input to the Inspect tool, and
plot_des.plot, which becomes input to the Tecplot tool.
Sentaurus Workbench Variables
The Sentaurus Workbench has specific variables defined for each tool. These allow you greater
flexibility in bypassing the editing of the tool‟s command file, and are useful in studying the
variation of a parameter and its effects on the simulation. For more information on the
Workbench, see [7].
To add a variable:
1. Right-click on the row below the tools.
2. Select Add.
3. Define the string of the variable along with its default value.
Note: Multiple values can be added to a specific variable by right clicking and selecting Add
Values.
This variable will have to be defined in the specific tool‟s command file as @string@. For
example, the width of the p-n junction is defined as “wtot” in the Sentaurus Workbench (see
Figure 2) and is explicitly referred to as @wtot@ in both the Epi and Sentaurus Device command
files.

Application Note: Understanding Synopsys Sentaurus Page 14 of 14
Errors and Debugging
Sentaurus maintains a log for each node‟s simulation activities. Each log file is named in the
format nX_tool.log
where X represents the node number, and tool is a three-letter abbreviation referring to the tool
of the node (for example, mpr for MatPar).
Similarly, Sentaurus generates error files named nX_tool.err that can be accessed easily
through the View Output or Node Explorer options explained on page 7 and shown in Figure 6.
Note: It is important that you know node numbers. They can be seen on the Sentaurus
Workbench by pressing F9.
Summary
Synopsys Sentaurus is a powerful software package capable of simulating the electrical, optical
and thermal properties of complex semiconductor devices. This application note outlines the
necessary steps to launch the software and run the GaAs p-n junction tutorial project developed
by the author. It then describes the tools capable of modeling and simulating the diode and how
they interact in the simulation tool flow. Lastly, errors and debugging were discussed in a way as
to direct the user to the proper error and log files for more specific information.
You are encouraged to read the Template for Creating and Simulating Multilayered
Heterostructure Devices user guide [6] for further information on the use of the Epi and the
Sentaurus Structure Editor tools.
References
[1] “Epi/MatPar User Guide,” Synopsys, Inc. (2008).
[2] “Sentaurus Structure Editor User Guide,” Synopsys, Inc. (2008).
[3] “Sentaurus Device User Guide,” Synopsys, Inc. (2008).
[4] “Inspect User Guide,” Synopsys, Inc. (2008).
[5] “Tecplot User Guide,” Synopsys, Inc. (2008).
[6] “Template for Creating and Simulating Multilayered Heterostructure Devices,” Synopsys,
Inc. (2008).
[7] “Sentaurus Workbench User Guide,” Synopsys, Inc. (2008).