Embed Size (px)
Citation preview
Applying Value Stream Mapping (VSM) Applying Value Stream Mapping (VSM) Tool to Improve Annual Plant Aerosol Tool to Improve Annual Plant Aerosol
Mapping ProcessMapping Process
Maria PryorMaria PryorSr. Industrial HygienistSr. Industrial Hygienist
General MotorsGeneral Motors
What Is Aerosol What Is Aerosol --and Why do we Care?and Why do we Care?
Metal Removal Fluids (Metal Removal Fluids (MRFsMRFs) are used as coolants and/or cutting oils) are used as coolants and/or cutting oils
MRF Aerosols are generated during the machining processMRF Aerosols are generated during the machining process
High levels of MRF Aerosol are associated with lung function chaHigh levels of MRF Aerosol are associated with lung function changes nges and increased risk of asthma. Exposure to mist is also associatand increased risk of asthma. Exposure to mist is also associated ed with hypersensitivity with hypersensitivity pneumonitispneumonitis, a serious lung disease., a serious lung disease.
OSHA has set a Permissible Exposure Limit for MRF Aerosol is 5 OSHA has set a Permissible Exposure Limit for MRF Aerosol is 5 mg/m3, based on eight hours of worker exposure.mg/m3, based on eight hours of worker exposure.
The GM Occupational Exposure Guideline is 1 mg/m3. The GM Occupational Exposure Guideline is 1 mg/m3.
GM GM PowertrainPowertrain Specifications call for new equipment to meet 0.5 Specifications call for new equipment to meet 0.5 mg/mmg/m33..
GM and the UAW have done a lot of work to reduce MRF Aerosol.GM and the UAW have done a lot of work to reduce MRF Aerosol.
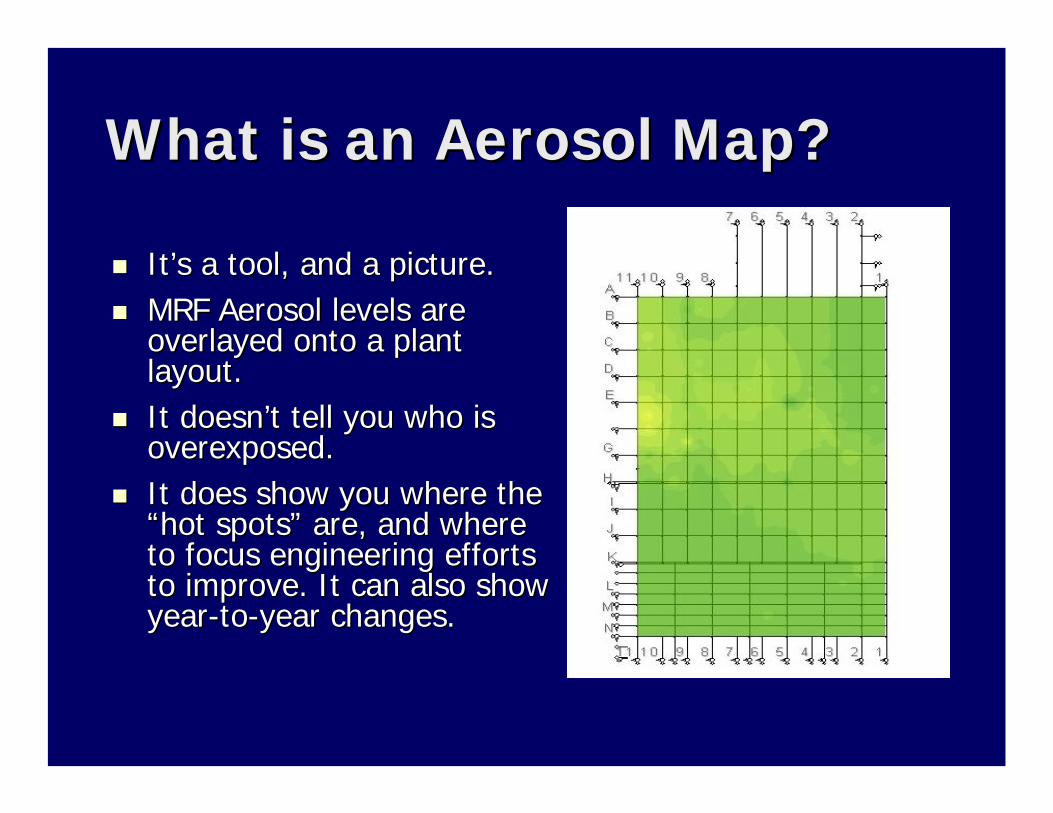
What is an Aerosol Map?What is an Aerosol Map?
ItIt’’s a tool, and a picture.s a tool, and a picture.MRF Aerosol levels are MRF Aerosol levels are overlayedoverlayed onto a plant onto a plant layout.layout.It doesnIt doesn’’t tell you who is t tell you who is overexposed. overexposed. It does show you where the It does show you where the ““hot spotshot spots”” are, and where are, and where to focus engineering efforts to focus engineering efforts to improve. It can also show to improve. It can also show yearyear--toto--year changes.year changes.

Long lead time for aerosol mapLong lead time for aerosol map
Too many handToo many hand--offs for report creationoffs for report creation
Timing of report and map delivery Timing of report and map delivery asynchronousasynchronous
Need more standardized elements in processNeed more standardized elements in process
Need to reduce resources requiredNeed to reduce resources required
Need to improve logisticsNeed to improve logistics
Why Improve the Current Process?Why Improve the Current Process?
Value Stream Map (VSM) ToolValue Stream Map (VSM) Tool
A Value Stream Map (VSM) involves all the A Value Stream Map (VSM) involves all the steps, both value added and nonsteps, both value added and non--value value added, required to complete a product or added, required to complete a product or service from beginning to end.service from beginning to end.
It makes the process more visual in order to It makes the process more visual in order to identify hidden wastes.identify hidden wastes.
It shows bottlenecks, rework or waiting that It shows bottlenecks, rework or waiting that affect the flow of the product or service.affect the flow of the product or service.
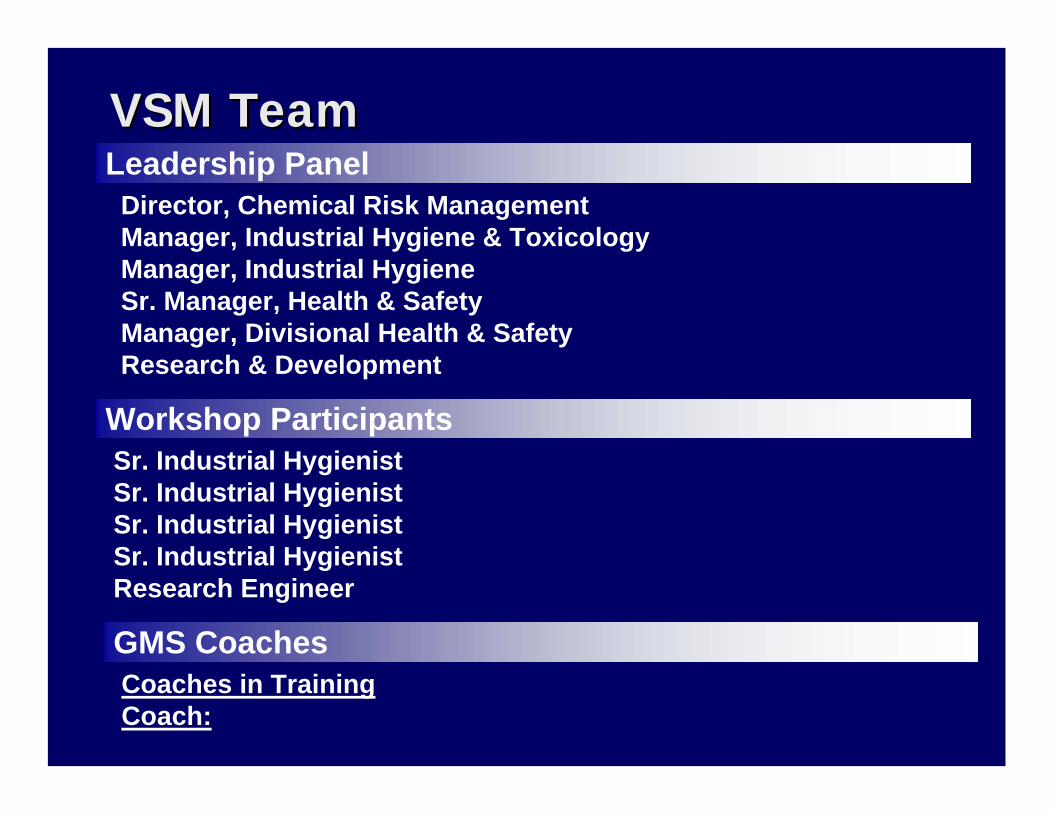
Leadership PanelVSM TeamVSM Team
Workshop Participants
GMS CoachesCoaches in TrainingCoach:
Director, Chemical Risk ManagementManager, Industrial Hygiene & ToxicologyManager, Industrial HygieneSr. Manager, Health & SafetyManager, Divisional Health & SafetyResearch & Development
Sr. Industrial HygienistSr. Industrial HygienistSr. Industrial HygienistSr. Industrial HygienistResearch Engineer
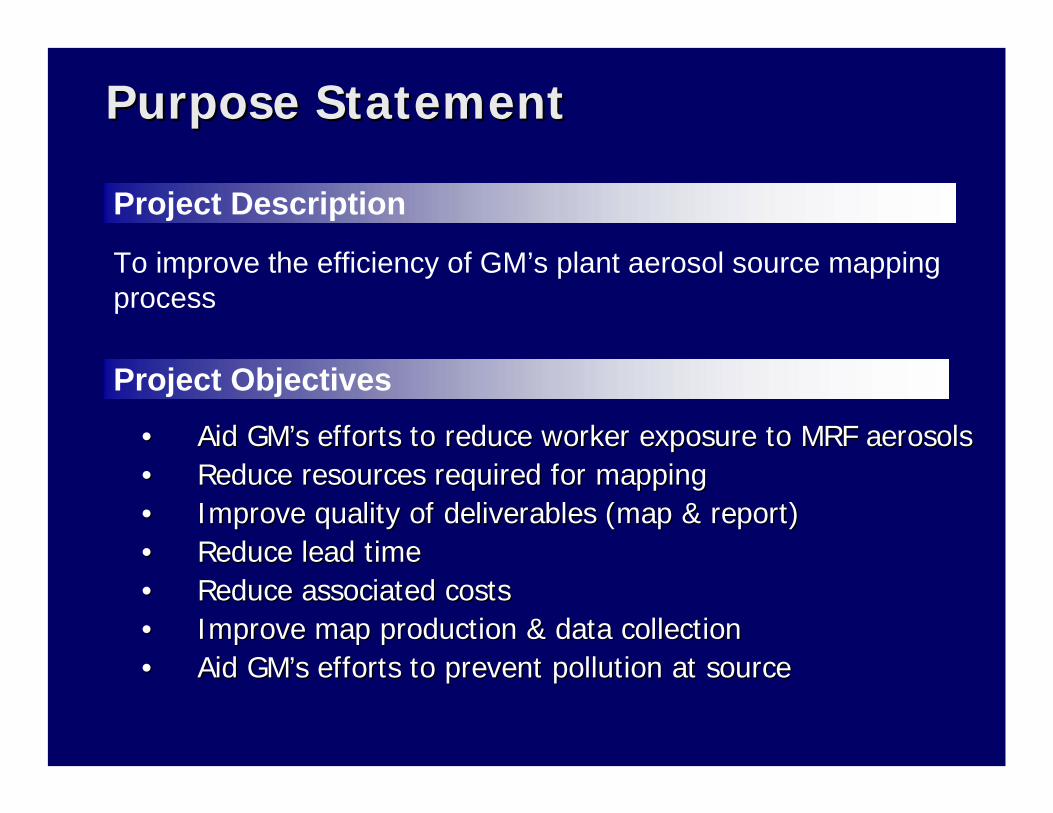
Purpose StatementPurpose Statement
•• Aid GMAid GM’’s efforts to reduce worker exposure to MRF aerosolss efforts to reduce worker exposure to MRF aerosols•• Reduce resources required for mappingReduce resources required for mapping•• Improve quality of deliverables (map & report)Improve quality of deliverables (map & report)•• Reduce lead timeReduce lead time•• Reduce associated costsReduce associated costs•• Improve map production & data collectionImprove map production & data collection•• Aid GMAid GM’’s efforts to prevent pollution at sources efforts to prevent pollution at source
Project Objectives
Project Description
To improve the efficiency of GM’s plant aerosol source mapping process

Decide Sample Points
1
Prepare MappingHandouts
1
Aerosol Mapping Process Current State MapAerosol Mapping Process Current State Map
P/T = 1-5 days
FTQ = 75%
Data Entry into Excel
1
Data Processing
1
Set up PlantGrid
1
Export data toDeltaGraph
1
Map Production in DeltaGraph
1
Final Map Print& Ship
1
Add Dummy Points
1
I IIIIII
2 0 00 0 00Secure Plant Layout CAD
1-3
Aerosol Mapping Team
WFG ES Chem. Mgmt. Industrial Hygiene
UAW
Deliverables
• Aerosol Map• Yearly data comparison• Mapping Report• PSRB Presentation
Research & Development
YearlyScheduleYearly
Schedule
CentralLayout
PlantIE/PE
LeadI.H.
Request Plant layout CAD
Data Sheets
PlantI.H.T.
Data Sheets
Research EngineerYearly
Schedule
Day of Mapping
P/T = 1 day
FTQ = 90%
P/T =1 day
FTQ = 85%
P/T = 1-3 days
FTQ = 70%
P/T =2 days
FTQ = 90%
P/T =0.5 day
FTQ = 90%
P/T =0.5 day
FTQ = 90%
P/T =5 min
FTQ = 99%
P/T =1 day
FTQ = 90%
P/T =0.25 day
FTQ = 95%
P/T =0.5 day
FTQ = 90%
YearlySchedule
Type Observations
1-9
Pool Obs. &Make Report
1
II0
P/T = 60 min
FTQ = 90%
P/T =10 min
FTQ = 99%
P/T = 1 day
FTQ = 90%
0
60 min 1 day10 min
01-10 days
Aerosol Maps Database
Send Obs.To Lead I.H.
1-9
Maintain & Update
Data Sheets
CollectAerosol Data
1-9
ShipReport
1
P/T = 30 min
FTQ = 99%
0
30 min
3 days
Sid Kinare, Sandeep PavnaskarAerosol Map VSM Team:Jim D’Arcy, Jim Griffin, Dave ThorpeMaria Pryor, Bob Chapman, Graham ParrAugust 10, 2004
Prepared by
NJC,Div. Board
Plant
PE, ME
WFG
20%20%Value added ratioValue added ratio
22.30447%22.30447%FTQFTQ
6 days6 daysNet value added timeNet value added time
15 days15 daysNet cycle timeNet cycle time
30 days30 daysTotal lead timeTotal lead time
Data Sheets
I
One way information flowOne way information flow
Two way information flowTwo way information flow
Work document generatedWork document generated
InventoryInventory
# of operators# of operators
Iterative workIterative work
First Time QualityFirst Time QualityFTQFTQ
Value added process timeValue added process timeP/TP/T
InterpretationInterpretationIconIcon
LegendLegend
Iteration
I
Iteration
Iteration
Iteration
Iteration
3 days005 days 00 0 000 0-2 days
1 – 3 days 0.25 day0.5 day2 days 1 day0.5 day5 min0.5 days1-5 days 1 day1 day
Iteration
Yearly Aerosol Mapping Review
Communicate with Team
Secure instruments
Calibrate instruments
Pool data sheets

Out of scopeDevelop Master schedule for Develop Master schedule for contract periodcontract period
Standardize data collection Standardize data collection sheets for all plantssheets for all plants
Standardization of report Standardization of report elementselements
Reduce data collection runs Reduce data collection runs for nonfor non--production areasproduction areas
Develop Develop ““aerosol mapperaerosol mapper””training moduletraining module
Identify and increase qualified Identify and increase qualified ““mappermapper”” poolpool
Pilot aerosol map production Pilot aerosol map production & deployment using software & deployment using software
Develop an electronic data Develop an electronic data collection systemcollection system
Pilot electronic data collectionPilot electronic data collection
Automate the mapping reportAutomate the mapping report
Secure funding for Secure funding for continuous improvements continuous improvements
Annual aerosol maps reportAnnual aerosol maps report
Data analysis and statistics Data analysis and statistics
Migration of historical aerosol Migration of historical aerosol maps into softwaremaps into software
In scopeIn scope
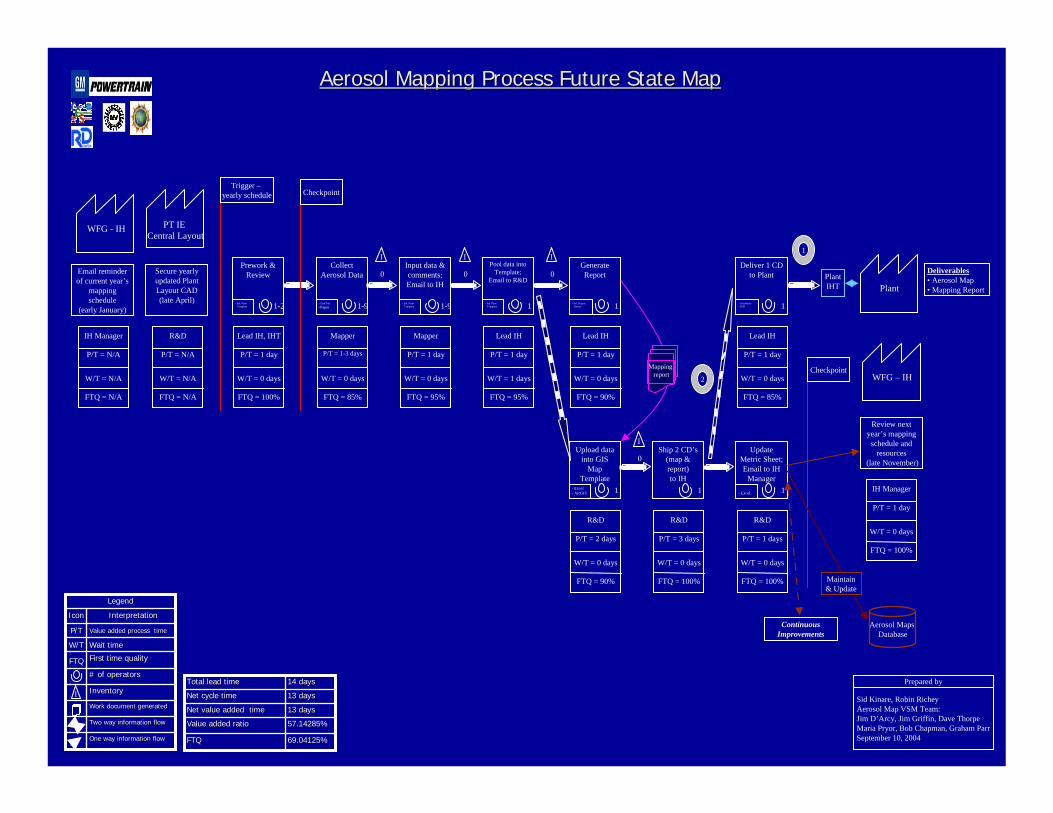
Aerosol Mapping Process Future State MapAerosol Mapping Process Future State Map
57.14285%57.14285%Value added ratioValue added ratio
69.04125%69.04125%FTQFTQ
13 days13 daysNet value added timeNet value added time
13 days13 daysNet cycle timeNet cycle time
14 days14 daysTotal lead timeTotal lead time
Sid Kinare, Robin RicheyAerosol Map VSM Team:Jim D’Arcy, Jim Griffin, Dave ThorpeMaria Pryor, Bob Chapman, Graham ParrSeptember 10, 2004
Prepared by
Continuous Improvements
Aerosol Maps Database
CollectAerosol Data
1-9- DustTrak-Paper
Mapper
P/T = 1-3 days
W/T = 0 days
FTQ = 85%
Pool data into Template;
Email to R&D
1- Std. PlantTemplate
Lead IH
P/T = 1 day
W/T = 1 days
FTQ = 95%
Input data & comments; Email to IH
1-9- Std. PlantTemplate
Mapper
P/T = 1 day
W/T = 0 days
FTQ = 95%
Prework & Review
1-2- Std. PlantTemplate
Lead IH, IHT
P/T = 1 day
W/T = 0 days
FTQ = 100%
Generate Report
1- Std. ReportFormat
Lead IH
P/T = 1 day
W/T = 0 days
FTQ = 90%
Upload data into GIS
Map Template
1- Excel - ArcGIS
R&D
P/T = 2 days
W/T = 0 days
FTQ = 90%
Ship 2 CD’s(map & report)to IH
1
R&D
P/T = 3 days
W/T = 0 days
FTQ = 100%
I
0
I
0
I
0
I
0
Mapping report
Deliver 1 CD to Plant
1- ArceRader- PDF
Lead IH
P/T = 1 day
W/T = 0 days
FTQ = 85%
Deliverables• Aerosol Map• Mapping ReportPlant
PlantIHT
2
1
Update Metric Sheet; Email to IH
Manager1- Excel
R&D
P/T = 1 days
W/T = 0 days
FTQ = 100%
WFG – IH
IH Manager
P/T = 1 day
W/T = 0 days
FTQ = 100%
Review next year’s mapping schedule and
resources(late November)
PT IE Central Layout
Secure yearly updated Plant Layout CAD(late April)
R&D
P/T = N/A
W/T = N/A
FTQ = N/A
Email reminder of current year’s
mapping schedule
(early January)
IH Manager
P/T = N/A
W/T = N/A
FTQ = N/A
WFG - IH
Trigger –yearly schedule Checkpoint
Checkpoint
One way information flowOne way information flow
Two way information flowTwo way information flow
Work document generatedWork document generated
InventoryInventory
# of operators# of operators
First time qualityFirst time quality
Wait timeWait timeW/TW/T
Value added process timeValue added process timeP/TP/T
InterpretationInterpretationIconIcon
LegendLegend
I
FTQFTQ
Maintain & Update
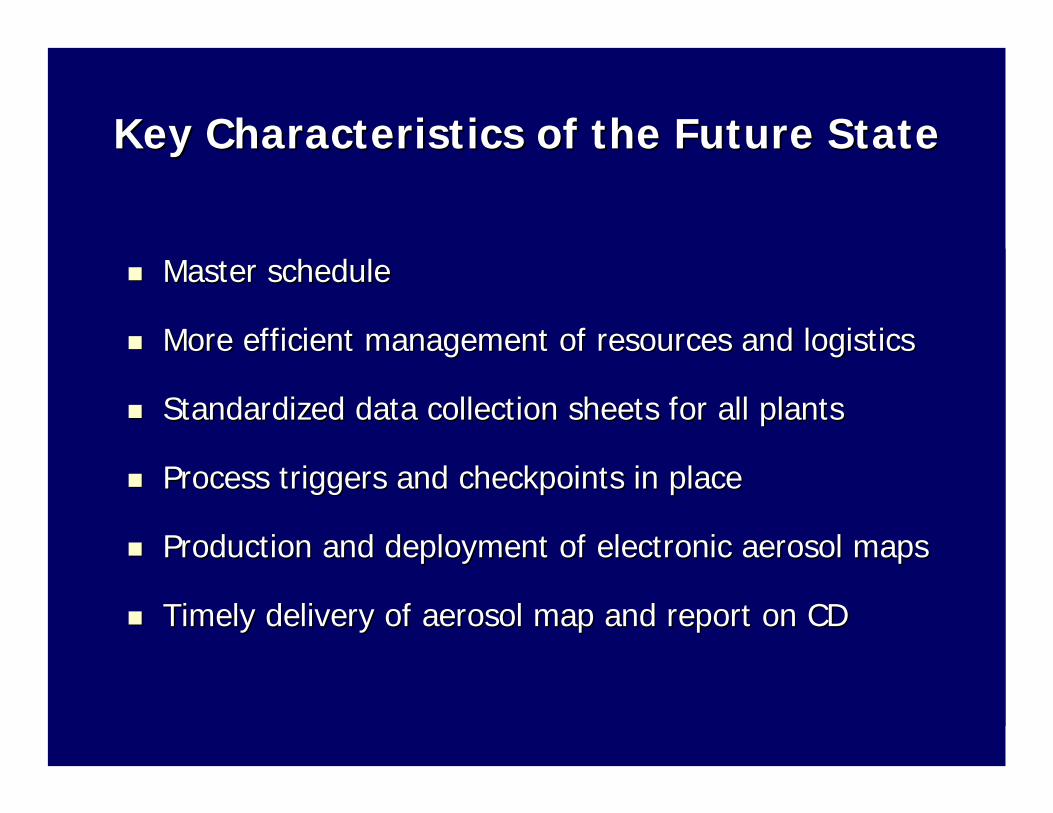
Key Characteristics of the Future StateKey Characteristics of the Future State
Master schedule Master schedule
More efficient management of resources and logisticsMore efficient management of resources and logistics
Standardized data collection sheets for all plantsStandardized data collection sheets for all plants
Process triggers and checkpoints in placeProcess triggers and checkpoints in place
Production and deployment of electronic aerosol maps Production and deployment of electronic aerosol maps
Timely delivery of aerosol map and report on CDTimely delivery of aerosol map and report on CD
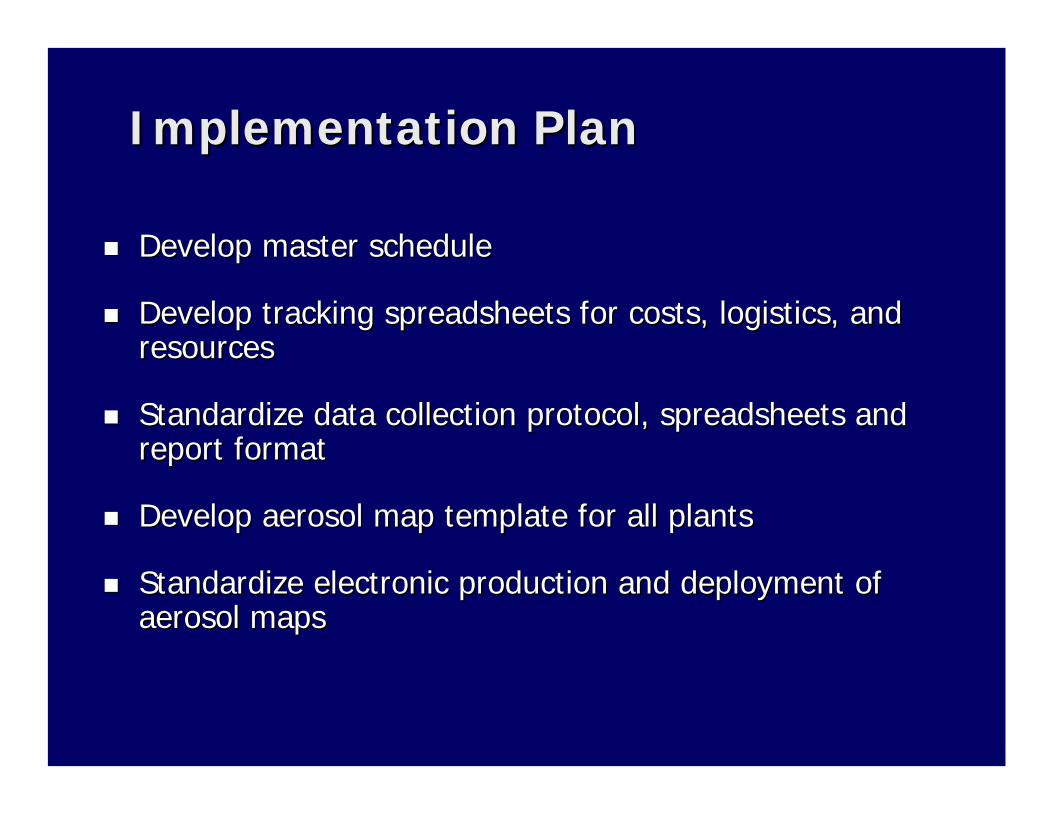
Implementation PlanImplementation Plan
Develop master scheduleDevelop master schedule
Develop tracking spreadsheets for costs, logistics, and Develop tracking spreadsheets for costs, logistics, and resourcesresources
Standardize data collection protocol, spreadsheets and Standardize data collection protocol, spreadsheets and report formatreport format
Develop aerosol map template for all plantsDevelop aerosol map template for all plants
Standardize electronic production and deployment of Standardize electronic production and deployment of aerosol mapsaerosol maps

Business Plan Deployment (BPD)Business Plan Deployment (BPD)
Current State BPD Future State

ResultsResults
SafetySafety–– Enhance engineering response to areas of Enhance engineering response to areas of
concern reducing overall worker exposure concern reducing overall worker exposure to aerosol mistto aerosol mist
PeoplePeople–– Reduce resources required for yearly Reduce resources required for yearly
mapping by 40% (120 days to 70 days)mapping by 40% (120 days to 70 days)
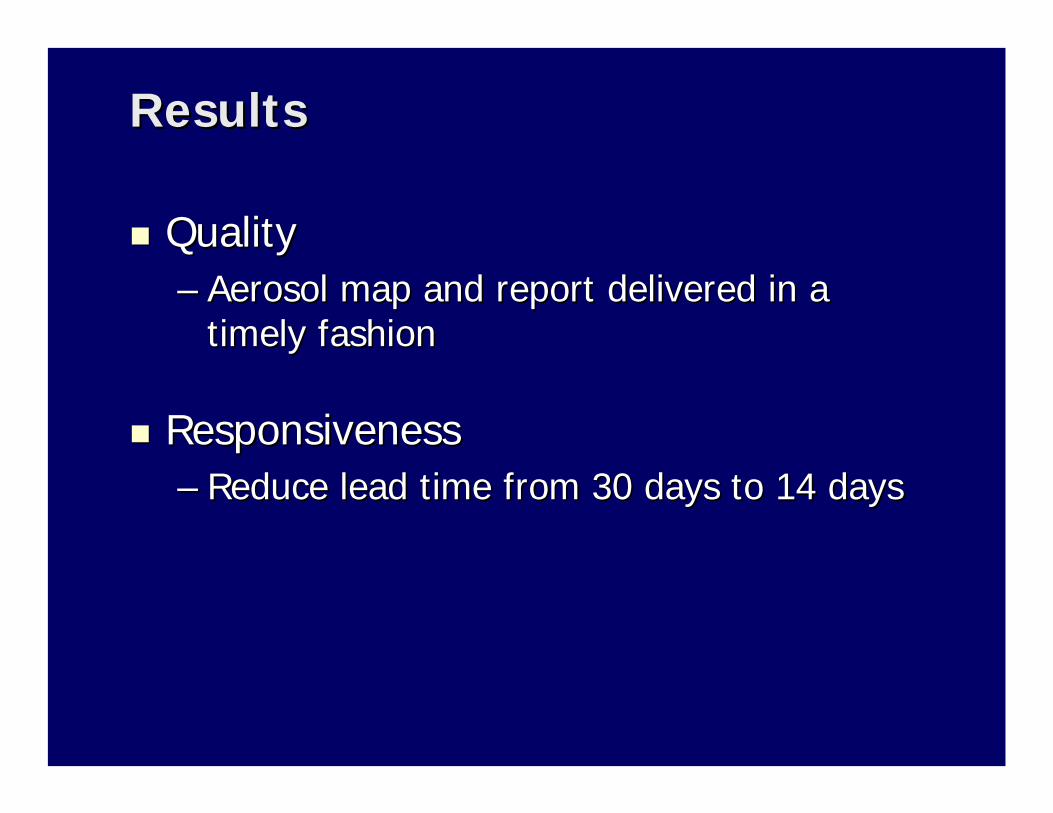
QualityQuality–– Aerosol map and report delivered in a Aerosol map and report delivered in a
timely fashion timely fashion
ResponsivenessResponsiveness–– Reduce lead time from 30 days to 14 daysReduce lead time from 30 days to 14 days
ResultsResults
CostCost–– Reduce travel cost by 50%Reduce travel cost by 50%
TechnologyTechnology–– Production and deployment of electronic aerosol Production and deployment of electronic aerosol
maps using special softwaremaps using special software
ResultsResults
Continuous ImprovementsContinuous Improvements
Pilot electronic data collection Pilot electronic data collection
Develop scripts for automated report generationDevelop scripts for automated report generation
Migration of all historical aerosol maps into software Migration of all historical aerosol maps into software packagepackage
Data analysis and spatial statistics using historical mapsData analysis and spatial statistics using historical maps
Pilot project to overlay plant people locations, ASP, Pilot project to overlay plant people locations, ASP, ventilation, etc. onto aerosol mapventilation, etc. onto aerosol map


