Embed Size (px)
Citation preview

Applying System-Theoretic Accident Model and
Processes (STAMP) to Hazard Analysis

APPLYING SYSTEM-THEORETIC ACCIDENT MODEL AND
PROCESSES (STAMP) TO HAZARD ANALYSIS
BY
YAO SONG, M.Eng.
a thesis
submitted to the department of computing & software engineering
and the school of graduate studies
of mcmaster university
in partial fulfilment of the requirements
for the degree of
Master of Applied Science
c© Copyright by Yao Song, January 2012
All Rights Reserved

Master of Applied Science (2012) McMaster University
(Computing and Software) Hamilton, Ontario, Canada
TITLE: Applying System-Theoretic Accident Model and Pro-
cesses (STAMP) to Hazard Analysis
AUTHOR: Yao Song
M.Eng., Southeast University, Nanjing, China
SUPERVISOR: Dr. Alan Wassyng
NUMBER OF PAGES: x, 95
ii

Abstract
Although traditional hazard analysis techniques, such as failure modes and effect anal-
ysis (FMEA), and fault tree analysis (FTA) have been used for a long time, they are
not well-suited to handling modern systems with complex software, human-machine
interactions, and decision-making procedures. This is mainly because traditional
hazard analysis techniques rely on a direct cause-effect chain and have no unified
guidance to lead the hazard analysis. The Systems Theoretic Accident Model and
Process (STAMP) is based on systems theory to try to find out as much as possible
about the factors involved in a hazard, and with providing clear guidance as to the
control structure leading to the hazard.
The Darlington Nuclear Power Generating Station was the first nuclear plant in
the world in which the safety shutdown systems are computer controlled. Although
FTA and FMEA have already been applied to these shutdown systems, Ontario power
generation felt that it is still useful to try recent advances to evaluate whether they
can improve on the previous hazard analysis.
This thesis introduces the two most common traditional techniques of hazard
analysis, FTA and FMEA, as well as two systemic techniques, STPA (which is a
hazard analysis method associated with STAMP), and the Functional Resonance
Accident Model (FRAM). The thesis also explains why we chose STPA to apply to
iii

the Darlington Shutdown System case, and provides an example of the application
as well as an evaluation of its use compared with FMEA and FTA.
iv

Acknowledgements
I would like to express my sincere gratitude and appreciation to my professor Dr. Alan
Wassyng for his support and encouragement, invaluable guidance and suggestions
during my thesis research. I also want to thank Nancy Leveson. It is her new method
for hazard analysis upon which this thesis is dependant.
I would like to thank Dr. Spencer Smith and Dr. Mark Lawford for being on my
thesis committee and for their valuable comments on my thesis.
Thanks also to Ontario Power Generation (OPG), for suggesting the topic and
permission to use information from previous work performed at OPG. In particular,
I want to thank Mike Viola and Greg Moum both from OPG, for the information
they provided, for attending my seminar on the topic, and for their comments on my
work.
Finally, an infinity of thanks goes to my wife. We knew each other, fell in love and
got married during my graduate study at McMaster University. As the most impor-
tant person to me, she is always there with me, with her love, support, understanding
and strength.
v

Contents
Abstract iii
Acknowledgements v
1 Introduction 1
1.1 Motivation . . . . . . . . . . . . . . . . . . . . . . . . . . . . . . . . . 1
1.2 Overview . . . . . . . . . . . . . . . . . . . . . . . . . . . . . . . . . . 3
2 Survey of Traditional Methods for Hazard Analysis 4
2.1 Introduction . . . . . . . . . . . . . . . . . . . . . . . . . . . . . . . . 4
2.2 Fault Tree Analysis (FTA) . . . . . . . . . . . . . . . . . . . . . . . . 5
2.2.1 Basic Concepts . . . . . . . . . . . . . . . . . . . . . . . . . . 6
2.2.2 FTA Process and Dynamic FT . . . . . . . . . . . . . . . . . 9
2.2.3 Types of Fault Trees Analysis . . . . . . . . . . . . . . . . . . 11
2.2.4 Software Fault Tree Analysis (SFTA) . . . . . . . . . . . . . . 14
2.2.5 Summary . . . . . . . . . . . . . . . . . . . . . . . . . . . . . 16
2.3 Failure Modes and Effects Analysis (FMEA) . . . . . . . . . . . . . . 16
2.3.1 Introduction . . . . . . . . . . . . . . . . . . . . . . . . . . . . 16
2.3.2 FMEA Basic Concepts and Process . . . . . . . . . . . . . . . 17
vi

2.3.3 Types of Analysis Approach and Worksheet Format . . . . . . 19
2.3.4 Software Failure Modes and Effects analysis (SFMEA) . . . . 22
2.3.5 Summary . . . . . . . . . . . . . . . . . . . . . . . . . . . . . 22
3 Systemic Methods for Hazard Analysis 23
3.1 Introduction . . . . . . . . . . . . . . . . . . . . . . . . . . . . . . . . 23
3.2 System-Theoretic Accident Model and Processes (STAMP) . . . . . . 24
3.2.1 Basic Concepts for STAMP . . . . . . . . . . . . . . . . . . . 24
3.2.2 Processes for STAMP-Based Process Analysis (STPA) . . . . 30
3.2.3 Summary . . . . . . . . . . . . . . . . . . . . . . . . . . . . . 35
3.3 Functional Resonance Accident Model (FRAM) . . . . . . . . . . . . 36
3.3.1 Basic Concepts for FRAM . . . . . . . . . . . . . . . . . . . . 36
3.3.2 Processes for FRAM . . . . . . . . . . . . . . . . . . . . . . . 38
3.3.3 Summary . . . . . . . . . . . . . . . . . . . . . . . . . . . . . 45
4 Introduction to the Case Study 46
4.1 Project Objectives and Scope . . . . . . . . . . . . . . . . . . . . . . 46
4.1.1 Objectives . . . . . . . . . . . . . . . . . . . . . . . . . . . . . 46
4.1.2 Scope . . . . . . . . . . . . . . . . . . . . . . . . . . . . . . . 47
4.2 System Overview . . . . . . . . . . . . . . . . . . . . . . . . . . . . . 47
4.3 System Decomposition . . . . . . . . . . . . . . . . . . . . . . . . . . 49
4.3.1 Trip Computer . . . . . . . . . . . . . . . . . . . . . . . . . . 49
4.3.2 Watchdog . . . . . . . . . . . . . . . . . . . . . . . . . . . . . 51
4.3.3 Voting Logic sub-system . . . . . . . . . . . . . . . . . . . . . 52
4.3.4 Display/Test Computer . . . . . . . . . . . . . . . . . . . . . 52
vii

4.3.5 Monitor Computer . . . . . . . . . . . . . . . . . . . . . . . . 52
4.3.6 Pushbutton and Keyswitch . . . . . . . . . . . . . . . . . . . . 53
4.3.7 Operator . . . . . . . . . . . . . . . . . . . . . . . . . . . . . . 53
5 Application of STPA for the Darlington Shutdown System 55
5.1 Why Choose STPA and FMEA for the Darlington Case . . . . . . . . 55
5.1.1 Why Not FTA? . . . . . . . . . . . . . . . . . . . . . . . . . . 56
5.1.2 Why Not FRAM? . . . . . . . . . . . . . . . . . . . . . . . . . 57
5.1.3 Why FMEA and STPA? . . . . . . . . . . . . . . . . . . . . . 59
5.2 How to Apply STPA to Improve FMEA . . . . . . . . . . . . . . . . 61
5.2.1 Define System Hazards and Related Safety Constraints . . . . 62
5.2.2 Develop Safety Control Structure . . . . . . . . . . . . . . . . 63
5.2.3 Identify Potentially Inadequate Control Actions . . . . . . . . 65
5.2.4 Determine How Unsafe Control Actions Could Occur . . . . . 68
5.3 Comparison Between the Results Based on STPA and the Original
Darlington FMEA Results . . . . . . . . . . . . . . . . . . . . . . . . 86
5.4 Case Study Conclusion . . . . . . . . . . . . . . . . . . . . . . . . . . 87
6 Conclusions and Future Work 89
6.1 Conclusions . . . . . . . . . . . . . . . . . . . . . . . . . . . . . . . . 89
6.2 Future work . . . . . . . . . . . . . . . . . . . . . . . . . . . . . . . . 90
viii

List of Figures
2.1 Fault tree Symbols for basic events, conditions, and transfers sym-
bols (Ericson, 2005) . . . . . . . . . . . . . . . . . . . . . . . . . . . . 7
2.2 Fault tree symbols for gate events (Ericson, 2005) . . . . . . . . . . . 8
2.3 Alternative fault tree symbols (Ericson, 2005) . . . . . . . . . . . . . 9
2.4 Some gate symbols usually used in dynamic FTA (Coppit et al., 2000) 10
2.5 MOCUS Example (Ericson, 2005) . . . . . . . . . . . . . . . . . . . . 12
2.6 OR Gate Expansion Formula (Ericson, 2005) . . . . . . . . . . . . . . 14
2.7 First and second terms bound the tree probability (Ericson, 2005) . . 15
2.8 FMEA concept (Ericson, 2005) . . . . . . . . . . . . . . . . . . . . . 18
2.9 FMEA overview (Ericson, 2005) . . . . . . . . . . . . . . . . . . . . . 19
2.10 An example of FMEA worksheet (Ericson, 2005) . . . . . . . . . . . . 21
3.1 Communication Channels between Control Levels (Leveson, 2011) . . 27
3.2 A standard control loop (Leveson, 2011) . . . . . . . . . . . . . . . . 28
3.3 A general process model (Leveson, 2011) . . . . . . . . . . . . . . . . 29
3.4 General Form of a Model of Socio-Technical Control (Leveson, 2011) . 32
3.5 A classification of control flaws leading hazards (Leveson, 2011) . . . 34
3.6 Stochastic resonance (Hollnagel, 2004) . . . . . . . . . . . . . . . . . 38
3.7 The hexagonal function representation (Hollnagel et al., 2008) . . . . 39
ix

5.1 FRAM Analysis for Drug Handling Example (Hollnagel, 2004) . . . . 59
5.2 Safety Control Structure of SDS1 on System Level . . . . . . . . . . . 64
5.3 Safety Control Structure of Trip Computers of SDS1 . . . . . . . . . 66
5.4 Causal factors leading to hazard a1 . . . . . . . . . . . . . . . . . . . 71
5.5 Causal factors of hazard a1 . . . . . . . . . . . . . . . . . . . . . . . . 72
5.6 Causal factors leading to hazard c1 . . . . . . . . . . . . . . . . . . . 76
5.7 The relationship between mental models (Leveson, 2011) . . . . . . . 77
5.8 Causal factors of hazard c1 . . . . . . . . . . . . . . . . . . . . . . . . 77
5.9 Causal factors of hazard d1 . . . . . . . . . . . . . . . . . . . . . . . 78
5.10 Causal factors of hazard e1 . . . . . . . . . . . . . . . . . . . . . . . . 79
5.11 Causal factors of hazard b1 . . . . . . . . . . . . . . . . . . . . . . . 80
5.12 Causal factors of hazard a2 . . . . . . . . . . . . . . . . . . . . . . . . 81
5.13 Causal factors of hazard b2 . . . . . . . . . . . . . . . . . . . . . . . 81
5.14 Darlington SDS1 Hazard Analysis Results Based on STPA . . . . . . 82
x

Chapter 1
Introduction
1.1 Motivation
Concern about industrial safety dates back many decades and safety engineering as
a discipline has a long and valuable history. Safety engineering is an applied science
strongly related to systems engineering, in particular system safety engineering. An
important aspect of safety engineering is to conduct hazard analysis to identify risks,
and then specify safety features and procedures to mitigate those risks to accept-
able levels before the system is certified. Traditional hazard analysis techniques in
safety engineering were developed to find causal dependencies between a hazard on
the system level and failures of individual components. However, there are always
some scenarios that we cannot predict, that may result in a hazard. This situation
may even be more significant for computer-controlled systems today. One important
reason is that software may contain very complex logic to test (Parnas et al., 1990).
Computers are often used in safety-critical applications and provide information to an
1

M.A.Sc. Thesis - Yao Song McMaster - Computing and Software
operator upon request or issue commands as a result of an operator’s input. There-
fore, when analyzing safety issues of the system, all the components whose operation
can directly or indirectly affect safety must be considered, and the related hazards
must be eliminated or reduced (Leveson, 1995a).
Nuclear power is one of the domains in which a comprehensive hazard analysis
is of vital importance, because an accident in this domain can result in a terrible
catastrophe. Huge effort has been expended, and continues to be spent on the safety
analysis of nuclear power. However, from (Gusterson, 2011), we know that:
“We have now had four grave nuclear reactor accidents: Windscale in
Britain in 1957; Three Mile Island in the United States in 1979; Chernobyl
in the Soviet Union in 1986; and Fukushima in Japan in 2011.”
Although nuclear engineers have learned a lot from each accident as to how to im-
prove nuclear system design so as to diminish the likelihood of that particular accident
repeating itself, the fact is that each accident was unique and supposed to be impos-
sible.
The Darlington Nuclear Power Generating Station, which is operated by Ontario
Power Generation Inc (OPG), was the first Canadian nuclear plant to use digital com-
puters to implement the safety shutdown systems. The most common two traditional
hazard analysis techniques, Failure Modes and Effects Analysis (FMEA) and Fault
Tree Analysis (FTA), were applied to the shutdown system during development of
those systems. However, in keeping with a general interest to keep improving tech-
niques for ensuring the safety of nuclear power plants, OPG was interested in looking
for any new advances in hazard analysis techniques that may be useful in this regard.
After conducting a survey and comparison, we finally chose a hazard analysis from
2

M.A.Sc. Thesis - Yao Song McMaster - Computing and Software
a new causality model called STAMP (Systems-Theoretic Accident Model and Pro-
cesses), developed by Nancy G. Leveson. In STAMP, component failure accidents are
still included, but the conception of causality is extended to include component inter-
action accidents. Safety is reformulated as a control problem rather than a reliability
problem (Leveson, 2011). The hazard analysis itself is called STPA (ST AMP-based
Process Analysis). In addition to STPA, we also looked at the Functional Resonance
Accident Model (FRAM). We believe that STPA is more useful in our context, and
the reasons for this are presented in the thesis. As far as we are able, we used the
Darlington Shutdown Systems (SDS) as a case study to evaluate the use of STPA
compared with FMEA and FTA.
1.2 Overview
The remainder of this thesis is organized as follows:
Chapter 2 presents a survey of the two traditional methods of hazard analysis
which are most widely used.
Chapter 3 introduces two systemic methodologies of hazard analysis, STAMP and
FRAM.
Chapter 4 describes background information of the Darlington SDS and its archi-
tecture and decomposition.
Chapter 5 first discusses the reasons why we chose STPA for the case study, and
then illustrates how to apply STPA to the case study. It also presents the comparison
between the new results based on STPA and the original FMEA results.
Chapter 6 summarizes the conclusions of this thesis and presents suggestions for
future work.
3

Chapter 2
Survey of Traditional Methods for
Hazard Analysis
2.1 Introduction
In this thesis, we use the definition of hazard from (U.S.A. Department of Defense,
2000) as follows:
“A hazard is defined as a real or potential condition that can result in in-
jury, illness, or death to personnel; damage to or loss of a system, equip-
ment or property; or damage to the environment.”
Hazard analysis is conducted to identify hazards and the related causal factors to
mitigate hazards. Traditional methods for hazard analysis describe the hazard as the
result of a sequence of discrete events that occur in a particular order (Hollnagel,
2004). This corresponds to the thinking that was initially based on relatively simple
cause-effect propagations, as in Heinrichs well-known Domino Model (H.W.Heinrich,
4

M.A.Sc. Thesis - Yao Song McMaster - Computing and Software
1931).
Traditional methods for hazard analysis have a clear assumption that there are
identifiable cause-effect links that propagate the effects of the hazards (Hollnagel,
2004). Most of them have been widely used for many years. The best known of these
are Fault Tree Analysis (FTA), Failure Modes and Effects Analysis (FMEA) and
Event Tree Analysis. These methods can be classified into two categories: inductive
and deductive. Inductive methods constitute reasoning from individual cases to a
general conclusion, while deductive methods go from the general to the specific (Misra,
2008). FMEA and Event Tree Analysis belong to the inductive category. FTA belongs
to a deductive category. The following section introduces the two most common
hazard analysis methods – FTA and FMEA.
2.2 Fault Tree Analysis (FTA)
FTA was developed in 1962 for the U.S. Air Force by Bell Telephone Laboratories for
use with the Minuteman missile system. It was later adopted and extensively applied
by the Boeing Company. Today, FTA has become one of the most popular techniques
for safety analysis, and is used in many domains like nuclear power, chemistry and
aerospace. It is used to determine the root causes and probability of occurrence of a
specified undesired event (Ericson, 2005).
Fault trees provide useful information about the likelihood of a failure occurring
and the means by which this failure could occur. They also provide a procedure for
determining the various combinations of basic events that can result in the occurrence
of a specified undesired event, which is referred to as the top event (Misra, 2008). The
basic events represent basic causes for the top event which can be associated with
5

M.A.Sc. Thesis - Yao Song McMaster - Computing and Software
component hardware failures, software failures and human errors. The analysis begins
with clearly defining the top event and then determining the various combinations of
basic events that can lead to the occurrence of the top event (Ericson, 2005).
Since fault trees provide a compact, graphical, and intuitive method to model
the cause-effect relationships, convenient symbols are used to represent the various
combinations of events and failure logic that can cause the top event to occur. In
the construction of a fault tree, after considering the failure scenario, we attempt to
find out what possible causes contribute to it. Once the fault tree is constructed,
the probability of occurrence of the top event can be evaluated using analytical or
statistical methods.
2.2.1 Basic Concepts
A typical fault tree is composed of a number of symbols interlinked together. The
fault tree symbols include primary event symbols, conditioning event symbols, trans-
fer event symbols and gate event symbols. Figure 2.1 introduces the primary, con-
ditioning and transfer event symbols and related descriptions. Figure 2.2 is for gate
event symbols and Figure 2.3 for alternative fault tree symbols.
Below are some important definitions of FTA from (Misra, 2008; Ericson, 2005; Sta-
matelatos and Vesely, 2002):“
• Top event: the undesired event in the top level, usually the system
failure or accident.
• Basic events: represent basic causes for the undesired event. No
further development of failure causes is required for basic events.
6

M.A.Sc. Thesis - Yao Song McMaster - Computing and Software
Figure 2.1: Fault tree Symbols for basic events, conditions, and transfers symbols (Er-icson, 2005)
• Gates: outcomes of one or a combination of basic events or other
gates. The gate events are also referred to as intermediate events.
• Primary failure: Independent component failure that cannot be fur-
ther defined at a lower level.
• Secondary failure: Independent component failure that is caused by
an external force on the system.
• Cut set (CS): set of events that together cause the top event to occur.
Also referred to as a fault path.
• Minimal cut set (MCS): cut set that has been reduced to the minimum
number of events that cause the top event to occur. The MCS cannot
be further reduced and still guarantee occurrence of the top event.
7

M.A.Sc. Thesis - Yao Song McMaster - Computing and Software
Figure 2.2: Fault tree symbols for gate events (Ericson, 2005)
• Exposure time (ET): length of time a component is effectively exposed
to failure during system operation. ET has a large effect on fault
tree probability calculations (P = 1.0 − e−λT ). Exposure time can be
controlled by design, repair, circumvention, testing, and monitoring.
• Critical path: highest probability CS that drives the top undesired
event probability. The most dramatic system improvement is usually
made by reducing the probability of this CS.”
8

M.A.Sc. Thesis - Yao Song McMaster - Computing and Software
Figure 2.3: Alternative fault tree symbols (Ericson, 2005)
2.2.2 FTA Process and Dynamic FT
FTA Process
The following steps have been suggested for constructing a successful fault tree
model: (Misra, 2008; Vesely et al., 1981):
1. Define the undesired event to be analyzed.
2. Define the scope for the analysis.
3. Identify and evaluate fault events which are contributors to the top event. If
a fault event represents a primary failure, it is classified as a basic event. If
the fault event represents a secondary failure, it is classified as an intermediate
event that requires further investigation to identify the prime causes.
4. Complete the gates: all inputs of a particular gate should be completely de-
fined before further analysis of any one of them is undertaken. The fault tree
should be developed in levels, and each level should be completed before any
9

M.A.Sc. Thesis - Yao Song McMaster - Computing and Software
consideration is given to the next level.
Please note that step 3 might be the most important step during the whole FTA
process. The essential part of this step is to use a model/method to present the sys-
tem design and operation. Unfortunately, there is no such a unified method to use.
Fault tree construction is usually based on expert knowledge of the system.
Dynamic FT
Fault trees can be classified as static or dynamic trees depending on the sequence
relationship between the input events. In static fault trees, the system failure is
insensitive to the order of occurrence of component fault events. While in dynamic
fault trees, the system failure is sensitive to the order of fault events. Figure 2.4 shows
some gate symbols which are usually used in dynamic FTA.
Figure 2.4: Some gate symbols usually used in dynamic FTA (Coppit et al., 2000)
A functional dependency (FDEP) gate has a single trigger input event and one or
more dependent basic events. The occurrence of the trigger event forces the dependent
basic events to occur. The separate occurrence of any of the dependent basic events
has no effect on the trigger event. A cold spare (CSP) gate consists of one primary
input event and one or more alternate input events. All the input events are basic
10

M.A.Sc. Thesis - Yao Song McMaster - Computing and Software
events. The primary input represents the component that is initially powered on.
The alternate inputs represent components that are initially un-powered and serve as
replacements for the primary component. The SEQ gate forces all the input events
to occur in a defined order.
2.2.3 Types of Fault Trees Analysis
According to the objectives of the analysis, FTA can be qualitative or quantitative.
Qualitative Analysis
The purpose of qualitative analysis is usually to find minimal cut sets. One of the
most common fault tree algorithms for generating CSs is the MOCUS (method of
obtaining cut sets) algorithm, developed by J. Fussell and W. Vesely (Fussell and
Vesely, 1972).
The algorithm starts at the top gate representing the top event of the fault tree
and constructs the set of cut sets by considering the gates at each lower level (Misra,
2008). AND gate means that all the inputs must occur to activate the gate. Thus,
the AND gate will be replaced at the lower level by a list of all its inputs. OR gate
means that the occurrence of any input can activate the gate. Thus, the cut set being
built is split into several cut sets, one containing each input to the OR gate.
Based on minimal cut sets, it is possible to get all the unique combinations of basic
events that may result in the top event. Each of them is represented by a minimal
cut set. Figure 2.5 provides an example of applying the MOCUS algorithm to an
FT. MOCUS can help to identify system hazards that might lead to failure or unsafe
states so that proper preventive measures can be taken or reactive measures can be
11

M.A.Sc. Thesis - Yao Song McMaster - Computing and Software
planned.
Quantitative Analysis
Figure 2.5: MOCUS Example (Ericson, 2005)
Quantitative analysis is based on fault tree mathematics, which includes Boolean al-
gebra, probability theory, and reliability theory. The purpose of quantitative analysis
is to determine the probability of the top event occurring, if the probability of each
basic event occurring is given. There are three common ways to compute the top
fault tree probability: 1) Direct analytical calculation using the fault tree CSs; 2)
Bottom-up gate-to-gate calculation; 3) Simulation. Below are some definitions for
mathematical terms frequently encountered in FTA from (Ericson, 2005):“
• Probability of success (R) of a component: R = e−λT , where λ =
component failure rate and T = component exposure time.
12

M.A.Sc. Thesis - Yao Song McMaster - Computing and Software
• Probability of failure (Q) of a component: Q = 1 −R = 1 − e−λT .
• Boolean rules for FTA. The following Boolean laws apply directly to
FTA for the reduction of CS to their minimum components. These
rules are required for reducing trees with multiple occurring events
(MOEs) in them.
a× a = a; a+ a = a; a+ ab = a; a(a+ b) = a;
• AND gate probability expansion. The probability for an AND gate is:
P = PAPBPCPD, ...., PN , where N is equal to the number of inputs
to the gate.
• OR gate probability expansion. Probability for an OR gate is:
P = (∑
1stterms)−(∑
2ndterms)+(∑
3rdterms)−(∑
4thterms), ....,
P = (PA + PB + PC) − (PAB + PBC + PAC) + (PABC) (An example
for 3-input AND gate.)
• Fault tree probability expansion. All of the cut sets ORed together
create the Boolean equation for an entire FT. This means that the
probability calculation is the OR expansion formula for all of the CS.
CS = CS1;CS2;CS3;CS4;CS5;
P = (∑
1stterms)−(∑
2ndterms)+(∑
3rdterms)−(∑
4thterms), ....
P = (PCS1 +PCS2 + ...)− (PCS1×PCS2 +PCS2×PCS3 + ...)+(PCS1×
PCS2 × PCS3 + PCS1 × PCS2 × PCS4 + ...) − ...
• Inclusionexclusion approximation. Most FTs have a large number of
CSs. Formulating the exact equation for a large number of cut sets
would result in an unwieldy equation, even for a computer. The in-
clusionexclusion approximation method has been developed to resolve
13

M.A.Sc. Thesis - Yao Song McMaster - Computing and Software
this numerical problem. This approximation says that the first term
in the OR gate expansion is the upper bound probability for the tree.
This means the true probability will be no worse than this value. The
first and second terms together compute the lower bound tree prob-
ability. This means the true probability will be no better than this
value. And, as successive terms are added to the computation, the
tree probability approaches the exact calculation. Figure 2.6 shows
the OR gate expansion formula along with the terms in the formula
for just four CSs. Figure 2.7 shows how, by including each succes-
sive term in the calculation, the probability will approach the exact
probability.”
Figure 2.6: OR Gate Expansion Formula (Ericson, 2005)
2.2.4 Software Fault Tree Analysis (SFTA)
The FTA principles have been applied to software analysis by Leveson et al. (Leveson
et al., 1991; Leveson, 1995b), who introduced templates for the translation of Ada
language elements into fault tree building blocks. Also, Software Fault Tree Analysis
(SFTA) has been used in real software projects in all relevant development stages
– requirements analysis, design and coding (Bowman et al., 2000). It serves as an
14

M.A.Sc. Thesis - Yao Song McMaster - Computing and Software
Figure 2.7: First and second terms bound the tree probability (Ericson, 2005)
additional method to gain confidence in the absence of safety critical errors in the
software. Tools have been developed to assist fault tree generation from design lan-
guages (UML), modelling languages (Matlab/Simulink), or programming languages
(Ada) (Weber et al., 2003).
When applied to software, FTA can be used to identify failure modes without
regard to probability. In general, software modifications are more readily incorporated
than hardware changes, and thus a detailed quantification of the failure probability
is not required to justify any software changes that are required to eliminate failure
modes and to mitigate the consequences of failures (Bowman et al., 2000).
15

M.A.Sc. Thesis - Yao Song McMaster - Computing and Software
2.2.5 Summary
FTA is a popular hazard analysis methodology today. It generates a graphic and
logic tree structure which allows people to read and understand relatively easily. It
can also find root cause for a top event by identifying possible failure causes and their
combinations. Additionally, based on logic structure and component failure data, it
can provide good quantitative analysis for the probability of the top event.
2.3 Failure Modes and Effects Analysis (FMEA)
2.3.1 Introduction
FMEA is the most commonly used and well known hazard analysis technique to eval-
uate the potential for failures that can lead to hazards. Its main purpose is to avoid
as many potential failures as possible by identifying them and taking appropriate ac-
tions in the early stages of design and development (Huang et al., 2000). The FMEA
was developed for the U.S. military at first, and mainly used in the aerospace indus-
try (U.S.A. Department of Defense, 1980). During the 1980s, FMEAs were applied
to manufacturing and assembly processes by Ford Motor Company (Bertsche, 2008).
Today, FMEAs are used in the design of products and processes as well as in the
design of software and services in all industries.
FMEA is a disciplined bottom-up evaluation technique. Its fundamental idea is
the determination of all possible failure modes for systems, subsystems, or compo-
nents (Bertsche, 2008). At the same time, the possible failure effects and failure causes
are presented. FMEA can provide both qualitative analysis and quantitative analysis.
It is a dynamic method which can be used in different development stages (Ericson,
16

M.A.Sc. Thesis - Yao Song McMaster - Computing and Software
2005).
Another well known version of FMEA is Failure Mode, Effects and Criticality
Analysis (FMECA), which enhances the original FMEA by adding criticality evalua-
tion to each failure mode, as well as the evaluation of possible failure mode detection
methods.
2.3.2 FMEA Basic Concepts and Process
Basic Concepts
Below are some important definitions of FMEA from (Ericson, 2005; U.S.A. Depart-
ment of Defense, 1980):“
• Failure: Departure of an item from its required or intended operation,
function, or behavior; problems that users encounter. The inability of
a system, subsystem, or component to perform its required function.
• Failure Mode: The manner by which a failure is observed. Gener-
ally describes the way the failure occurs and its impact on equipment
operation.
• Failure effect: The consequence(s) a failure mode has on the opera-
tion, function, or status of an item. It can be divided into immediate
effect and system effect.
• Failure cause: The physical or chemical processes, design defects,
quality defects, part misapplication, or other processes which are the
basic reasons for failure or which initiate the physical process by which
deterioration proceeds to failure.
17

M.A.Sc. Thesis - Yao Song McMaster - Computing and Software
• Indenture levels: The item levels which identify or describe relative
complexity of assembly or function.
• Critical item list (CIL): List of items that are considered critical for
reliable and/or safe operation of the system.
• Risk priority number (RPN): Risk ranking index for reliability. RPN =
(probability of occurrence) × (severity ranking) × (detection rank-
ing).” Detection ranking ranks the ability of planned tests and in-
spections to detect failure modes in time.
Figure 2.8: FMEA concept (Ericson, 2005)
Figure 2.8 shows a brief concept of FMEA. The subsystem being analyzed is di-
vided into four units. Each unit is further divided into its basic items. Then each
18

M.A.Sc. Thesis - Yao Song McMaster - Computing and Software
item is listed in the left column of the FMEA worksheet and is individually analyzed.
Process
To conduct an FMEA, it is necessary to understand some system characteristics, such
as system functionality, system design and operational constraints. Figure 2.9 depicts
an overview of the basic FMEA process. Table 2.1 provides the basic steps in the
FMEA process.
Figure 2.9: FMEA overview (Ericson, 2005)
2.3.3 Types of Analysis Approach and Worksheet Format
Types of Analysis Approaches
There are two primary approaches for accomplishing an FMEA. One is the hardware
approach which lists individual hardware items and analyzes their possible failure
modes. The other is the functional approach which recognizes that every item is
designed to perform a number of functions.
The hardware approach is normally used when hardware items can be uniquely
identified from schematics, drawings, and other engineering and design data. It is
19

M.A.Sc. Thesis - Yao Song McMaster - Computing and Software
Step Description1. Define the systemor process to be ana-lyzed.
Create the system definition by dividing the system un-der analysis into the smallest segments desired for theanalysis. Complete system definition includes identifi-cation of internal and interface functions, expected per-formance at all indenture levels, system restraints, andfailure definitions.
2. Obtain or constructblock diagrams.
Acquire all of the necessary design and process dataneeded (e.g., functional diagrams, schematics, and draw-ings) that illustrate the operation, interrelationships,and interdependencies of functional entities involved inthe use or operation of the system. Refine the itemindenture levels for analysis. Identify realistic failuremodes of interest for the analysis and obtain componentfailure rates.
3. Identify all poten-tial failure modes.
Determine all of the ways in which the items in the sys-tem definition can potentially fail.
4. Determine worst-case effects and as-sign a severity classifi-cation.
Begin at the lowest level of the breakdown, evaluateeach potential failure mode independently to determinethe worst-case effects that may result due to this failuremode on the immediate function or item, on the system,and on the mission. Assign a severity classification toindicate how harmful the effects of this failure mode areon system operation.
5. Identify failure de-tection methods, cor-rective actions, andthe effects of correc-tive actions.
For critical failure modes, identify failure detectionmethods and compensating provisions should the fail-ure mode occur. Determine the design changes that areneeded to eliminate a critical failure mode or reduceeither the likelihood of its occurrence or impact of itseffects. Once steps have been taken to eliminate, re-duce, or compensate for a critical failure mode, repeatthe analysis until all potential failure modes pose anacceptable level of risk. Once this iterative process iscomplete, the problems that could not be corrected bydesign should be documented in a summary.
Table 2.1: FMEA Process (Ericson, 2005; U.S.A. Department of Defense, 1980)
20

M.A.Sc. Thesis - Yao Song McMaster - Computing and Software
normally used in a bottom-up way. However, it can be initiated at any level of in-
denture and progress in either direction. The functional approach evaluates system
or subsystem based on functions. It is a little more abstract than the hardware ap-
proach. The key is to consider each adverse state that is possible for each function.
It is normally utilized in a top-down way. However, it can be initiated at any level of
indenture and progress in either direction.
Worksheet Format
The FMEA is a detailed analysis of potential failure modes. To provide analysis
structure, consistency, and documentation, a form or worksheet is used to perform
the FMEA (Ericson, 2005). The specific format of the analysis worksheet is not
critical, but a FMEA worksheet usually has the following information: failure mode,
failure effects, causal factors and how the failure mode can be detected. Figure 2.10
gives an example of FMEA worksheet for systems safety.
Figure 2.10: An example of FMEA worksheet (Ericson, 2005)
21

M.A.Sc. Thesis - Yao Song McMaster - Computing and Software
2.3.4 Software Failure Modes and Effects analysis (SFMEA)
The application of FMEA to software is known as SFMEA. Unlike for hardware com-
ponents, software modules can only display behavior(s) or function(s) of the system.
So the analysis approach of SFMEA is functional.
In terms of being used at different levels of system development, SFMEA can be
classified into two categories: system-level SFMEA and detailed SFMEA. System-
level SFMEAs can be performed early in the software design process, allowing safety
assessment of the chosen software architecture. Detailed SFMEAs are applied late
in the design process, once at least pseudo code for the software modules is avail-
able (Goddard et al., 2000).
According to the way in which functional failure modes are found, SFMEA modes
can include: software function fails; function provides incorrect results; software stops
or crashes; software exceeds internal capacity; etc.
2.3.5 Summary
FMEA is a widely-used hazard analysis technique. It can provide both qualitative
and quantitative analysis on different levels. The focus of the FMEA is on how to
consider as many as possible failure modes and failure causes. With a worksheet
structure, FMEA is easily understood and relatively inexpensive to perform. FMEA
is usually used to perform qualitative hazard analysis.
22

Chapter 3
Systemic Methods for Hazard
Analysis
3.1 Introduction
As described in chapter 2, we know that traditional methods for hazard analysis
view hazards as resulting from a chain or sequence of events. The events considered
usually involve some type of component failure or human error. Traditional methods
use forward sequences (as in FMEA) and/or backward ones (as in FTA) to represent
a direct and linear relationship between failure and causality. They maybe work
well for losses caused by failures of physical components and for relatively simple
systems (Leveson, 2004).
However, there is an indisputable fact that modern systems become more and more
complex, which means that more factors no matter whether they be technological,
human or organizational, work together in systems. This chapter introduces two
hazard analysis methods that are different from those in chapter 2. They are systemic,
23

M.A.Sc. Thesis - Yao Song McMaster - Computing and Software
which means that they treat the system as a whole (either with a control structure
or a bundle of process together), to analyze failure and causality of systems. One of
them is called System-Theoretic Accident Model and Processes (STAMP). The other
is Functional Resonance Accident Model (FRAM).
3.2 System-Theoretic Accident Model and Processes
(STAMP)
STAMP was developed by Nancy G. Leveson (Leveson, 2011). It builds on the ideas
used in the upper levels of the Rasmussen-Svedung model (Rasmussen and Svedung,
2000), but it continues the control theoretic approach down through and including
the technical system and its development and operations. The following table 3.1
lists the foundations of STAMP, which are called new assumptions. For comparison,
it also lists the corresponding assumptions of traditional hazard analysis methods,
which are called old assumptions.
3.2.1 Basic Concepts for STAMP
STAMP uses three fundamental concepts from system theory: Emergence and hierar-
chy, Communication and control, and Process models. Detailed instruction for them
is described below.
Emergence and Hierarchy
The concept of emergence means that at a given level of complexity, some properties of
that level (emergent at that level) are irreducible (Leveson, 2011). Safety is clearly an
24

M.A.Sc. Thesis - Yao Song McMaster - Computing and Software
Old Assumption New AssumptionSafety is increased by increasing systemor component reliability; if componentsdo not fail, then accidents will not oc-cur.
High reliability is neither necessary norsufficient for safety.
Accidents are caused by chains of di-rectly related events. We can under-stand accidents and assess risk by look-ing at the chains of events leading tothe loss.
Accidents are complex processes in-volving the entire socio-technical sys-tem. Traditional event-chain mod-els cannot describe this process ade-quately.
Probabilistic risk analysis based onevent chains is the best way to assessand communicate safety and risk infor-mation.
Safety and risk may be best understoodand communicated in ways other thanprobabilistic risk analysis.
Most accidents are caused by operatorerror. Rewarding safe behaviour andpunishing unsafe behaviour will elimi-nate or reduce accidents significantly.
Operator error is a product of the envi-ronment in which it occurs. To reduceoperator error we must change the en-vironment in which the operator works.
Highly reliable software is safe. Highly reliable software is not neces-sarily safe. Increasing software relia-bility will have only minimal impact onsafety.
Major accidents occur from the chancesimultaneous occurrence of randomevents.
Systems will tend to migrate towardstates of higher risk. Such migrationis predictable and can be prevented byappropriate system design or detectedduring operations using leading indica-tors of increasing risk.
Assigning blame is necessary to learnfrom and prevent accidents or inci-dents.
Blame is the enemy of safety. Fo-cus should be on understanding howthe system behaviour as a whole con-tributed to the loss and not on who orwhat to blame for it.
Table 3.1: Foundations of STAMP From (Leveson, 2011)
25
M.A.Sc. Thesis - Yao Song McMaster - Computing and Software
emergent property of systems because safety can only be determined in the context of
the whole (Leveson, 2011). Statements about safety without the context information
are meaningless. Hierarchy theory describes the relationships between different levels,
including what generates the levels, what separates them, and what links them.
In STAMP, safety is treated as an emergent property at each of these hierarchy
levels that arise when the system components interact within an environment. It
depends on the enforcement of constraints on the behavior of the components in the
system, including constraints on their potential interactions.
Communication and Control
Control processes mostly operate at the interfaces between two hierarchy levels and
always are related with the imposition of constraints. STAMP uses the concept of
imposing constraints in system behavior to avoid unsafe events or conditions rather
than focusing on avoiding individual component failures.
Between the hierarchical levels of each safety control structure, effective commu-
nication channels are needed during the control processes. There are two kinds of
communication channels as shown in figure 3.1 (Leveson, 2011). A downward refer-
ence channel provides the information necessary to impose safety constraints on the
level below. An upward measuring channel provides feedback about how effectively
the constraints are being satisfied.
Communication also determines whether the control processes could be established
or achieve the expected goals. Typical control processes often use feedback loops to
keep interrelated components in a state of dynamic equilibrium. A standard control
loop is shown in figure 3.2 (Leveson, 2011).
26

M.A.Sc. Thesis - Yao Song McMaster - Computing and Software
Figure 3.1: Communication Channels between Control Levels (Leveson, 2011)
According to figure 3.2, four conditions are required to establish control processes
from (Leveson, 2011; Ashby, 1956):“
• Goal Condition: The controller must have a goal or goals (for exam-
ple, to maintain the set point).
• Action Condition: The controller must be able to affect the state
of the system. In engineering, control actions are implemented by
actuators.
• Model Condition: The controller must be (or contain) a model of the
system. It will be discussed in the following part of process model.
• Observability Condition: The controller must be able to ascertain the
state of the system. In engineering terminology, observation of the
state of the system is provided by sensors. In STAMP, goal condi-
tion is the safety constraints that must be enforced by each controller
in the hierarchical safety control structure. The action condition is
27

M.A.Sc. Thesis - Yao Song McMaster - Computing and Software
Figure 3.2: A standard control loop (Leveson, 2011)
implemented in the downward control channels and the observability
condition is embodied in the upward feedback or measuring channels.”
Process Model
Process model is actually a concept in control theory. The reason why it is discussed
individually here is just because it is an essential concept of STAMP.
The four conditions required to control a process are already provided above.
The most important condition is the model condition. It means that any controller,
no matter human or automated, needs a model of the process being controlled to
control it effectively. The purpose of using process model is to determine what control
actions are needed based on knowing the current state of the controlled process and
to estimate the effect of various control actions on that state. For software controller,
28

M.A.Sc. Thesis - Yao Song McMaster - Computing and Software
process model refers to software logic, which can be called logic model. A simple
general process model is shown in Figure 3.3.
Figure 3.3: A general process model (Leveson, 2011)
The process model could be very simple with only a few variables or very complex
with a large number of state variables. If the process model does not match the
process, that could result in four different kinds of problems, each of which could lead
to an accident. This is especially true for component interaction accidents.
In summary, this systemic approach considers accidents not only arising from
component failures, but also from the interactions among system components. It
usually does not specify single causal variables for factors (Leplat, 1984). Emergent
properties like safety are controlled or enforced by a set of constraints (control laws)
related to the behavior of the system components. Safety then can be viewed as a
control problem. When control processes provide inadequate control and the safety
constraints are violated in the behavior of the lower level processes, accidents occur. In
other words, accidents occur when component failures, external disturbances, and/or
dysfunctional interactions among system components are not adequately handled by
the control system (Leveson, 2011).
29

M.A.Sc. Thesis - Yao Song McMaster - Computing and Software
3.2.2 Processes for STAMP-Based Process Analysis (STPA)
STPA is a new hazard analysis technique, based on STAMP. It uses a collection of
interacting loops of control to analyze systems. It can be used at any stage of the
system lifecycle, from before designing to after implementation. The processes of
STPA are introduced below (Ishimatsu et al., 2010).
Define System Hazards and Related Safety Constraints
Hazards can be defined in terms of conditions or events, such as loss of equipment
or mission. There are no criteria for defining hazards. It depends on subjective
evaluation by domain experts (Leveson, 2011). After system hazards are defined, the
related safety constraints should be specified by translating the hazards to prevent
the hazards.
For example, a hazard and the related safety constraint in an automated elevator
door controller from (Leveson, 2011) are described as follows:
“ Hazard: A person is present in the doorway when the door is closing.
Safety Constraint: An elevator door must not close while anyone is in the
doorway.”
Develop Safety Control Structure
Once the hazards and related safety constraints have been defined, a typical socio-
technical hierarchical structure with safety control processes, which is called hierar-
chical safety control structure, should be described. Figure 3.4 shows a generalized
safety control structure diagram, which does not represent any one particular system.
30

M.A.Sc. Thesis - Yao Song McMaster - Computing and Software
It has two basic parts: system development and system operation. Different
hierarchical levels, interactions between these levels, feedback control loops and com-
munication channels can be found in this general form. Each node in the graph is
a human or machine component in a socio-technical system. Downward connect-
ing lines show control actions imposed to enforce safety constraints on the system.
Upward connecting lines show feedback that provides information to the controllers
about how effectively the constraints are being satisfied.
Hierarchical safety control structures can be very complex, so, when analyzing
different hazards, only part of the overall structures is considered as the object and
the rest is treated as environment factors.
Identify Potentially Inadequate Control Actions
After the safety control structure in system-level has been defined, the next step is
to identify the potential for inadequate control, which may drive the system into a
hazardous state. A hazardous state is a state that violates the safety constraints that
are already defined for the system (H.W.Heinrich, 1931). Below is the identification
of inadequate controls from (Leveson, 2011), based on the fact that control actions
can be hazardous in four ways:“
1. A control action required for safety is not provided or is not followed.
2. An unsafe control action is provided that leads to a hazard.
3. A potentially safe control action is provided too early, too late, or out
of sequence.
4. A safe control action is stopped too soon (for a continuous or non-
discrete control action). Incorrect or unsafe control actions may
31

M.A.Sc. Thesis - Yao Song McMaster - Computing and Software
Figure 3.4: General Form of a Model of Socio-Technical Control (Leveson, 2011)
32

M.A.Sc. Thesis - Yao Song McMaster - Computing and Software
cause dysfunctional behavior or interactions among components (Ishi-
matsu et al., 2010). To ensure a complete assessment, each control
action must be investigated in turn.”
Determine How potentially Inadequate Control Actions Could Occur
This step can be performed to identify the scenarios leading to the inadequate control
actions that violate the component safety constraints (Leveson, 2011). Once the
potential causes have been identified, some methods can be designed and used to
prevent or mitigate the identified scenarios. STAMP works on functional control
diagrams and is guided by a set of generic control loop flaws (Ishimatsu et al., 2010).
Control flaw refers to any imperfection or defect during the control process. Because
accidents result from inadequate control and enforcement of safety constraints, the
causation of accidents can be understood in terms of control flaws. These control
flaws can be classified in three ways. Figure 3.5 shows a classification of control flaws
that may lead to hazards. As shown in figure 3.5, there are four types of flaws.
The flaw of type 1 is “control input or external information wrong or missing”.
Each controller in the hierarchical control structure is itself controlled by higher level
controllers. The control action and other information provided by the higher level
and required for safe behavior may be missing or wrong. Other types of missing or
wrong non-control inputs may also affect the operation of the controller.
The flaw of type 2 is “inadequate control algorithm”. Algorithm here refers to the
procedures for both hardware controllers and human controllers. It may be inadequate
because the algorithm is inadequately designed originally, or the process may change,
or the algorithm may be inadequately modified (Leveson, 2011). A human control
33

M.A.Sc. Thesis - Yao Song McMaster - Computing and Software
Figure 3.5: A classification of control flaws leading hazards (Leveson, 2011)
algorithm is affected by initial training, by the procedures provided to the operators
to follow, and by feedback and experimentation over time.
The flaw of type 3 is “process model and sensor”. A process model can be incorrect
from the beginning, which means the model is inconsistent with the current process
state. A process model may also become incorrect due to feedback missing, delays or
measurement inaccuracies.
The flaw of type 4 is “actuator and controlled process”. Even if we assume that
34

M.A.Sc. Thesis - Yao Song McMaster - Computing and Software
the control commands maintain the safety constraints, the control still can be in-
adequate because the controlled process may not implement theses commands. The
reason could be transmission channel failure or actuator or controlled object fail-
ure, or the safety of the controlled process may depend on inputs from other system
components (Leveson, 2011).
Besides the above four types of flaws, if there are multiple controllers, communi-
cation flaws among these controllers also should be considered. These same general
factors apply at each level of the socio-technical safety control structure, but the in-
terpretations (applications) of the factor at each level may differ (Ishimatsu et al.,
2010). Additionally, if a human or organization is involved, it is necessary to evaluate
the context and environment. Since contextual and environmental factors are hard
to classify, they will not be discussed here.
3.2.3 Summary
STPA is a systemic method used for hazard analysis. It provides a model-safety
control structure, to implement the hazard analysis of system. This model considers
hazards and causes in a systemic way rather than just based on component failures
or failure events. It also provides guidance to analysts in conducting the hazard
analysis. Safety engineers are not required to fill in a blank page using personal
experience alone.
35

M.A.Sc. Thesis - Yao Song McMaster - Computing and Software
3.3 Functional Resonance Accident Model (FRAM)
Another systemic method is the Functional Resonance Accident Model (FRAM).
The increasing complexity makes the systems become more closely coupled and the
interaction and dependency between individual systems increase (Hollnagel, 2004).
To express and analyze the coupling connection, a systemic method should be used
in the safety engineering. FRAM is such a systemic method. It analyzes hazards
from the coupling connection in the system.
3.3.1 Basic Concepts for FRAM
Concept of Resonance
Resonance is a fundamental concept which is well understood in physical, mechan-
ical, electrical and optical domain. In (Hollnagel and Goteman, 2004), resonance is
described as “a relatively large selective response of an object or a system that vi-
brates in step or phase with an externally applied oscillatory or pushing force, whose
frequency is equal or very close to the natural undamped frequency of the system”.
The difference between normal and stochastic resonance is in the nature of the forcing
function.
Concept of Stochastic Resonance
Below is the concept of stochastic resonance from (Hollnagel and Goteman, 2004):
“ Stochastic resonance is a phenomenon in which a non-linear input is
superimposed on a periodic modulated signal. Generally, the non-linear
36

M.A.Sc. Thesis - Yao Song McMaster - Computing and Software
input is called noise, which is something to be avoided. Noise can be un-
derstood as a signal that includes almost all frequencies within a given
range at equal amplitude. If noise added to another signal – the mes-
sage, some components of the noise will amplify the message, while other
components of the noise will dampen the message. So the message as a
whole becomes distorted and it becomes harder to distinguish the signal
from the noise. However, at some point, with some particular frequency
range, noise may give more amplification than attenuation to the message
when the message is so weak as to be normally undetectable. In this case,
the message becomes detectable due to resonance with the stochastic noise.
Figure 3.6 shows stochastic resonance.”
Concept of Functional Resonance
Complex systems usually are composed of a number of subsystems, which in turn may
comprise multiple functions. If a subsystem or a component is considered by itself,
this performance variability can be seen as a weak modulated signal, which normally
is undetectable. The rest of the system is the environment, which consists of a
number of subsystems, for each of which the performance is variable. The aggregated
performance variability of this “environment” can be understood as random noise,
and it is this random noise that can give rise to resonance – a performance variability
that is too high (Hollnagel and Goteman, 2004).
In the systemic accident model, any part of the system variability can be the signal,
with the rest being the noise. The noise is not truly stochastic but is determined by
the variability of the functions of the system, which means resonance is a consequence
37

M.A.Sc. Thesis - Yao Song McMaster - Computing and Software
Figure 3.6: Stochastic resonance (Hollnagel, 2004)
of functional couplings in the system. So the name functional resonance makes much
more sense than the name stochastic resonance.
3.3.2 Processes for FRAM
Whereas risk analysis normally looks for how individual functions or actions may fail,
FRAM focuses on how conditions leading to accidents may emerge. From (Hollnagel,
2004), there are four steps for FRAM in practical terms:
• Identify and characterize essential system functions.
• Characterize the potential for variability.
• Define functional resonance based on identified dependencies among functions.
38

M.A.Sc. Thesis - Yao Song McMaster - Computing and Software
• Identify barriers for variability (damping factors) and specify required perfor-
mance monitoring.
Step1: Identify and characterize essential system functions
Functional resonance spread through tight couplings rather than via identifiable and
enumerable cause-effect links, so it cannot be described by a simple combination of
causal links.
This means FRAM cannot be captured by any of the tree based representations
such as fault tree and event tree or by simple graphs such as a Petri net. The reason is
that these representations all embody the notion of a sequential development, which is
inadequate to show the functional dependencies that are so important to the systemic
view (Hollnagel, 2004).
So FRAM use hexagonal graphical representation instead of two dimensions to
delineate the functional entities that are of importance for the given scenarios or
tasks. A graphical representation of a generic functional entity is shown in Figure 3.7
and the description is introduced below.
Figure 3.7: The hexagonal function representation (Hollnagel et al., 2008)
39

M.A.Sc. Thesis - Yao Song McMaster - Computing and Software
• Inputs (I): that which the function processes or transforms or that which starts
the function
• Outputs (O): that which is the result of the function, either an entity or a state
change.
• Resource (R): that which the function needs or consumes to produce the output.
• Control (C): how the function is monitored or controlled.
• Precondition (P): conditions that must be exist before a function can be exe-
cuted.
• Time (T): temporal constraints affecting the function (with regard to starting
time, finishing time, or duration).
Notice that input, resource, control, precondition and time are often called inputs.
And it is useful to be concise in the descriptions, and to use similar terms wherever
possible to make matching easier in step 3. Functions can be identified in terms of
their purpose or the goals they can bring about. The whole system can be decom-
posed as a number of functions.
Step 2: Characterize the potential for variability
To figure out how the variability of any function is affected by the variability of the
rest of the system, it should characterize the potential for variability of each function
at first. The potential for variability depends on the nature of the function in question
and on its context. The context is normally considered to be the circumstances in
40

M.A.Sc. Thesis - Yao Song McMaster - Computing and Software
How volatile thefunctions are
How much theydepend on thecontext
Their overallspeed or rate ofchange
Human (M) High High LowTechnological (T) Low Low HighOrganizational (O) Very High Very High Very Low
Table 3.2: The comparison of the features of the three categories (Hollnagel, 2004)
which an event occurs or the environment of a system, i.e., that which is outside the
boundary (Hollnagel, 2004).
In FRAM, three categories, which are called human (M), technological (T) and
organizational (O), are used to classify function. The three main categories of M,
T and O have different features with respect to how volatile the functions are, how
much they depend on the context, and their overall speed or rate of change. The
comparison of the features of the three categories is shown in Table 3.2.
As a conclusion of this, single technological processes typically have a low intrinsic
variability, are relatively independent of the context or operating environment, and
take place at a high speed. In contrast to that, social and psychological processes have
a very high intrinsic variability, depend on the working conditions to a considerable
degree, and take place at a slower speed (Hollnagel, 2004).
To assess the potential for variability in more detail, a number of common per-
formance conditions can be used. The relation between each common performance
condition and whether it primarily applies to M, T or O functions is introduced in
Table 3.3
For the purpose of determining the possibility of functional resonance, each perfor-
mance condition was rated as (1) stable or variable but adequate; (2) stable or variable
41

M.A.Sc. Thesis - Yao Song McMaster - Computing and Software
Common Performance Conditions M T O Functions affectedAvailability of resources M, TTraining and experience MQuality of communication M, THMI and operational support TAccess to procedures and methods MConditions of work T, ONumber of goals and conflict resolution M, OAvailable time / time pressure MCircadian rhythm, stress MCrew collaboration quality MQuality and support of organization O
Table 3.3: The relation between common performance conditions and M, T or Ofunctions (Hollnagel, 2004)
but inadequate and (3) unpredictable. Stable or variable but adequate means the as-
sociated performance variability is low. Conversely, stable or variable but inadequate
means the associated performance variability is high and unpredictable means very
high.
Step 3: Define functional resonance based on identified dependencies among
functions
This step is to describe the dependencies among functions. To find whether the
variability of functions may interact, it requires the functions should be connected
directly or indirectly. That means the outputs from one function provide one or more
of the inputs (input, preconditions, resources, control, time) to other function(s). So
the main purpose of this step is to look for connections that could occur not only
under the normal procedure, which are called expected connections, but also certain
conditions even though they should not, which are called unexpected connections.
42

M.A.Sc. Thesis - Yao Song McMaster - Computing and Software
The expected connections can be found simply by looking for matching descrip-
tions of inputs and outputs. This is why it is useful to be concise in the descriptions,
and to use similar terms wherever possible (Hollnagel, 2004). If the outputs go outside
the system, they need not be considered further. After finding out all the excepted
connections, we should pay more attention to the following situations:
• The functions with high performance variability. Especially some of the inade-
quate or even unpredictable conditions that are common to several functions.
• Special connection structures. Such as the same output goes to more than
one other function; several inputs go to one function; and several qualitatively
different outputs come from one function.
• Not only first-order connections, but further connections should also be noticed.
Based on the situations above, the next procedure is to find the unexpected con-
nections, by imagining specific conditions under which functional resonance may likely
occur. A number of ways of discovering these specific conditions have been useful:
• Consider how specific expected connections may be invalidated or fail, especially
for connections involved preconditions;
• Relax the matching requirements. (Usually the requirement is a complete
match.)
• Consider artifacts factors which may affect common performance conditions of
all the functions.
43

M.A.Sc. Thesis - Yao Song McMaster - Computing and Software
Step 4: Identify barriers for variability (damping factors) and specify re-
quired performance monitoring.
Barriers can be described in terms of barrier systems (the organizational and/or
physical structure of the barrier) and barrier functions (the manner by which the
barrier achieves its purpose) (Hollnagel and Goteman, 2004). The four fundamental
barrier systems are described as follows from (Hollnagel, 2004):“
• Physical or material barrier systems, that prevent an action from be-
ing carried out or an event from taking place or block or mitigate
the effects of an unexpected event, such as fences and a physical hin-
drance for the transportation of mass, energy, or information;
• Functional (active or dynamic) barrier systems, that set up one or
more pre-conditions that must be met before an action (by human
and/or machine) can be carried out, such as air bag of vehicle;
• Symbolic barrier systems, that are indications of constraints on ac-
tion with interpretation needed to achieve their purpose, such as traf-
fic lights;
• Incorporeal barrier systems, that lacks material form or substance in
the situations where it is applied and instead depends on the knowl-
edge of the user to achieve its purpose, such as rules and guidelines.”
When doing accident or risk analysis, prevention and protection should be consid-
ered. That will bring two questions to mind: where barrier functions should be placed
in the system and what type of barrier functions should be used? However, there are
no simple criteria to answer these two questions. The main approach is based on the
44

M.A.Sc. Thesis - Yao Song McMaster - Computing and Software
type of cause for the potential accident, such as functions with high variability or
specific structures of connection. We should also consider other aspects, such as the
effectiveness of the barrier function, and costs and delays in implementation.
3.3.3 Summary
FRAM provides a new model (the hexagonal function model) to describe a system
as well as a new idea (performance variability) to explain why hazards happen. Like
hollnagel said, “FRAM does not endorse the strong assumption that performance
conditions directly cause failures or lead to unsafe acts. Instead it simply proposes
that the context affects the variability of functions. Even though functional resonance
does not provide the final explanation as to why an accident happens, it can serve
as a useful analogy to think about accidents and to understand how large effects can
accrue, and therefore also ultimately how to prevent them (Hollnagel, 2004).”
45

Chapter 4
Introduction to the Case Study
We have been working with industry to apply the STPA approach in practice through
a project supported by Ontario Power Generation (OPG). This chapter gives a brief
introduction to the background of the project, as well as a description of the system
architecture and decomposition.
4.1 Project Objectives and Scope
4.1.1 Objectives
This project applies hazard analysis to the Darlington shutdown system, using a sys-
temic method STPA to evaluate whether or not it improves on the original Darlington
version of FMEA. The project thus requires a comparison between the new hazard
analysis results based on STPA and the previous results.
46

M.A.Sc. Thesis - Yao Song McMaster - Computing and Software
4.1.2 Scope
There are two totally independent shutdown systems, SDS1 and SDS2, for the Dar-
lington nuclear station, with different programs developed by different teams. Each
one uses a different method to shut down the reactors. SDS1 uses cobalt shutoff rods
and SDS2 uses liquid poison injection (Bowman et al., 2000). In this thesis, only one
shutdown system – SDS1 was analyzed.
We start the hazard analysis on the system-level, and then focus on the trip
computer. The document that we have used to understand the system design is the
SDS1 Trip Computer Design Requirements (TCDR) (Wong et al., 2007). So, when
we introduce the system and do the hazard analysis on the system-level, we might
omit some detailed information for the other parts of the system. The hazard analysis
documents for the Darlington shutdown systems SDS1 and SDS2 are (Yu et al., 2002)
and (Guentcheva et al., 2002). STPA can be applied to “system development” and
“system operations” stages. In our case, we do not have access to all the system
development documents for SDS1, we only applied STPA to the “system operations”
stage.
4.2 System Overview
As described above, the Darlington NGS has two independent shutdown systems:
SDS1 and SDS2, and we will restrict our attention to SDS1. In SDS1, there are three
channels. Each of them is composed of a trip computer, a set of sensors, a set of
amplifiers and transmitters, a watchdog, a set of multiplying relays and several logic
gates.
47

M.A.Sc. Thesis - Yao Song McMaster - Computing and Software
The sensors of each channel are used to capture different information from the
reactor according to the different responsibilities of the sensors. The information
captured by the sensors, which are typically analog signals, is connected to the trip
computer by amplifiers and transmitters.
The trip computer in each channel is the core trip logic controller, and replaces the
majority of the relay logic used on previous stations. From the trip logic perspective,
SDS1 is a three-channel general coincidence logic system, in which a trip of any one
or more parameters in a channel can result in a channel trip (Wong et al., 2007). The
trip computer is mainly responsible for implementing the trip logic for the channel
it belongs to. The trip computer provides other functionalities including: a) channel
trip seal-in to ensure that reactor trips, once initiated, go to completion; b) transfer of
data to and from the display/test computer; c) calibration of some sensor parameters,
and d) self-checks to ensure that internal logic components are working correctly and
those external signals are present.
Additionally, each trip computer has an interlock with an external watchdog. The
trip computer provides a signal to the watchdog to make it remain active. Otherwise,
it will result in a watchdog ‘time-out’ and thus cause a channel trip. The output
from the interlock of trip computer and its external watchdog, will be transmitted to
relays through two redundant paths. Each path is connected with two relays. The
two out of three voting and the manual trip logic are implemented by using hardware
logic to determine whether to shut down the reactor or not. There are also two other
computers, the monitor computers and the display/test computers, which interact
with the trip computers.
48

M.A.Sc. Thesis - Yao Song McMaster - Computing and Software
4.3 System Decomposition
The main components and their interactions are described below. Some other compo-
nents such as amplifiers, transmitters and analogue/digital hardware converters are
not described in detail in this thesis.
4.3.1 Trip Computer
Some main features of the trip computer are discussed below:
Trip logic
Each channel has several parameter trips. Each trip parameter has its own trip
setpoint. Each sensor signal that exceeds its current setpoint triggers a sensor trip,
except for the Heat Transport Low Flow sensor trip which is subject to having to be
sustained over a period of time (Wong et al., 2007).
The trip setpoints for some parameters are automatically selected based on reactor
power, while others can be set up directly by the human operator. A change in power
for trip parameters with power dependent setpoints, may cause the trip setpoint to
be switched to a more/less restrictive setpoint depending on the reactor operating
conditions and appropriate logic (Wong et al., 2007).
Note that Neutron Overpower (NOP) Gain factors, Channel Power Peaking Factor
(CPPF), and High Transport Flow (HTF) Gain factors are provided by the operator.
NOP Gain factors are used to calibrate the flux detector signals in the NOP trip.
CPPF is used to calculate Estimated Power. HTF Gain factors are used to calibrate
HTF signals.
49

M.A.Sc. Thesis - Yao Song McMaster - Computing and Software
Hysteresis
A deadband (hysteresis) is specified for each trip setpoint. Hysteresis is provided to
avoid repeated switching of an output when its associated inputs are close to the
trip/conditioning setpoint (Wong et al., 2007). It thus reduces output chatter in the
presence of signal noise. Trip region means any signal in this region will result in
the corresponding sensor trip. For any signal in a non-trip region, the trip status is
untripped. In a hysteresis region, the trip status of any signal inside is not changed.
The hysteresis value is a specific constant, defined automatically.
Parameter Trip
Each sensor trip is associated with a parameter trip. There can be more than one
sensor trip associated with a single parameter trip, but no sensor trip can be associated
with more than one parameter trip (Wong et al., 2007). A sensor trip causes its
associated trip parameter to be tripped unless the parameter is conditioned out, or
there is a more complex logical dependence of the trip parameter on multiple trip
sensor trips.
For all the trip parameters, the logic is such that, when the value is restored to
within the non-trip region after a trip has occurred, the parameter trip is automati-
cally cleared. In the case of low neutron power, some trip parameters are required to
be inhibited. The status whether a parameter is inhibited or not refers to condition-
ing status. The inhibition of trip parameters can be done automatically or by the
operator.
Channel Trip
50

M.A.Sc. Thesis - Yao Song McMaster - Computing and Software
If any parameter within the channel is tripped, then the channel is also tripped. Then
channel trip status is sealed-in if the channel trip lasts longer than the seal-in time. If
it lasts less than the seal-in time, the trip computer does not seal-in the channel trip,
which means the channel is cleared automatically if all parameter trips have cleared
(untripped). A sealed-in channel trip can be cleared only by the operator, and is
permitted only if all parameter trips have cleared.
Performance Timing Requirement
A maximum response time, the performance timing requirement (PTR), is specified
for each trip parameter, and is defined to be the total delay from the measured
parameter signal input reaching its setpoint, to the time at which the associated
parameter trip digital output opens (Wong et al., 2007). Both input and output
times are measured from the time at which the inputs and outputs cross the trip
computer system boundary.
4.3.2 Watchdog
To ensure that the trip computer is able to take appropriate action when required,
the trip computer shall perform a variety of pre-determined self-checks. An impor-
tant component in the self-check strategy is the watchdog. The watchdog is a special
purpose board which must be periodically updated by the trip computer to remain
active (Wong et al., 2007). The most probable failure modes of internal logic compo-
nents will lead to failure to update the watchdog, resulting in a watchdog time-out.
A watchdog time-out will lead to a watchdog trip, which will lead to a corresponding
channel trip.
51

M.A.Sc. Thesis - Yao Song McMaster - Computing and Software
4.3.3 Voting Logic sub-system
The voting Logic sub-system is composed of multiple relays, two-out-of-three logic
components and OR gates. The channel trip status is passed on to the final two-
out-of-three voting logic via two redundant paths. Each path has its own digital
output and buffer relays. If a decision is made to trip the channel, the trip computer
deenergizes the coils of these buffer relays to open the channel trip contacts in the final
voting logic. The OR gate means if any two-out-of-three logic component triggers,
the system will be shut down.
4.3.4 Display/Test Computer
Data are transmitted between the display/test computer and the trip computer via
two one-way optical links. The trip computer sends the process input and output val-
ues and internally generated calculations and status information to the display/test
computer. Some of the data are used for the internal functions of the display/test
computer, such as display of trip parameter values, setpoints, trip logic status and
conditioning status. The communication from the display/test computer to trip com-
puter is called down-link communication. It can be enabled or disabled by the oper-
ator.
4.3.5 Monitor Computer
The monitor computer is the interface between the operator and trip computer. All
the data transmitted from the trip computer to the display/test computer will finally
be shown on the monitor computer. Through the monitor computer, the operator
can determine the trip status and the conditioning status of each parameter, the trip
52

M.A.Sc. Thesis - Yao Song McMaster - Computing and Software
status of each channel and each watchdog, and the value of different gain factors such
as NOP gain factors, CPPF and HTF gain factors.
4.3.6 Pushbutton and Keyswitch
The pushbutton is a special hardware interface that allows the operator to send com-
mands directly to the trip computer, not through the display/test computer. By
using momentary pushbuttons, the operator can condition in/out parameter trips,
clear sealed-in channel trip, and enable or disable the down-link communication. The
keyswitch is another hardware interface through which the operator can send com-
mands to the display/test computer. By setting up commands using the keyswitch,
data can also be transmitted to the trip computer through the display/test computer
for the following purposes: 1) to provide new values of NOP flux detector gains,
CPPF and HTF gains; 2) to initiate a watchdog test.
4.3.7 Operator
In SDS1, as described above, the operator can send commands to the trip computer
either directly by using pushbuttons or the keyswitch. The determination of what
commands should be sent is based on the information shown on the monitor computer
and logic requirement of the system. Several main responsibilities of operator are
described as follows:
• Operator can provide the following three parameters to the trip computer:
Neutron Overpower Trip (NOP) Gain factors, Channel Power Peaking Factor
(CPPF), and Heat Transport Factor (HTF) gains.
53

M.A.Sc. Thesis - Yao Song McMaster - Computing and Software
• The operator can condition out some parameter trips at certain power levels.
• The operator can clear a seal-in channel trip if all parameter trips have cleared.
• The operator can enable or disable the down-link communication (from the
display/test computer to the trip computer).
54

Chapter 5
Application of STPA for the
Darlington Shutdown System
This chapter presents the application of STPA to hazard analysis of the Darlington
Shutdown System. We start from applying STPA to our case, and then compare the
new results with the original Darlington FMEA results. Finally, we conclude this
chapter with the findings and our concerns revealed during the whole process.
5.1 Why Choose STPA and FMEA for the Dar-
lington Case
As described in chapter 3 and chapter 4, there are several hazard analysis methods,
either traditional or systemic. Each method has its own features which may be
suitable for a specific project. So when considering which hazard analysis method
should be chosen, we should at least analyze the features of the project and the
55

M.A.Sc. Thesis - Yao Song McMaster - Computing and Software
feature of the different methods.
5.1.1 Why Not FTA?
There are two reasons that FTA is not suitable for our case.The most important
feature of FTA is that it generates the logic tree structure to represent the logic rela-
tionship among the contributory events on different levels. Based on this structure,
it is easy for people to read and understand. But it is very difficult to represent all
the relationship among all the failure factors, by only using simple symbols such as
AND gate, OR gate etc. Especially for hazard analysis in a complex system, not
only hardware or software component should be considered, but also environmental
factors. For example, when analyzing the hazard “the shutdown system does not shut
down the reactor” in our project, not only the hardware and software failure of trip
computer should be considered, but also the sensor factor, the operator factor etc.
Also, the relationship between them may not be the simple “AND”.
The other important feature of FTA is providing quantitative analysis. We can do
quantitative analysis in FMEA also but it is secondary. By giving probability values
of basic events in a fault tree, FTA provides a method for calculating the probability
of the top event. Sometimes, what people want to have is an “accurate” quantitative
analysis. But for the hazard analysis of a complex system, if quantitative analysis is
needed, there are two problems that cannot be avoided.
The first one is how to get the probability values of basic events. Maybe the prob-
ability values of hardware components, if detailed information from the manufacturer
is available, are not hard to get. But for software components and human factors,
the situation is totally different, because software is a logical construct, instead of a
56

M.A.Sc. Thesis - Yao Song McMaster - Computing and Software
physical entity. It is difficult to make accurate predictions of software reliability and
availability. The amount of testing necessary to establish high confidence levels for
most software products is impractically large (Parnas et al., 1990).
The second one is high sensitivity. That means the probability of the top event
could change significantly even if the probability values of some basic events change
only a little. This situation most likely occurs when the fault tree of a complex system
becomes very large or a software component is involved in the fault tree. That requires
the probability values of basic events in the fault tree to be exactly right; otherwise
the calculated probability value of the top event can be meaningless. Obviously, such
a requirement is not practical.
5.1.2 Why Not FRAM?
There are several reasons why we think FRAM is not suitable for our case. The key
purpose of FRAM is to find out the functional resonance spreading through tight cou-
plings among system functions/procedures. So FRAM is suitable for systems which
can be easily divided into multiple functions/procedures. For example, a drug han-
dling system can be divided into the following procedures: registering prescription,
fetching the drug from supply, verifying that the correct drug has been fetched, check-
ing preparation and dose, and customer dialogue at hand-over. But for the Darlington
shutdown system, there is only one main function/procedure, which is shutting down
the reactor.
The second reason is the subjectivity during the process of characterizing the po-
tential for variability. As described in chapter 3, in FRAM, there exists a criterion
used to assess the potential for variability. This criterion is composed of a number
57

M.A.Sc. Thesis - Yao Song McMaster - Computing and Software
of common performance conditions. Each condition can be rated as (1) stable or
variable but adequate; (2) stable or variable but inadequate and (3) unpredictable.
Obviously, in this process human subjective factors play leading role. And there is
also no standard to define what range should be counted as high variability. Here,
we still use the example of drug handling. In this example, the common performance
conditions related with “fetch the drug from supply” include “training and experi-
ence”, “available time/time pressure” etc. Obviously, it is hard to have a unified
standard to rate these conditions.
The last and the most important reason is that there is no clear way to iden-
tify functional resonance based on identified dependencies among functions. To find
functional resonance requires that the functions should be connected directly or indi-
rectly. It is easy to identify expected connections, which means the connections occur
under the normal conditions. But it is not easy to identify either the unexpected
connections or what kinds of connections are prone to cause functional resonance.
In the drug handling example, it is easy to describe all the expected connections
as shown in figure 5.1. Then according to the summary of some special connection
structures described in chapter 3.3, we may conclude that the connection between
“fetch the drug from supply” and “check preparation” is prone to cause functional
resonance, because the output of “fetch the drug from supply” feeds into several
procedures. But this conclusion seems to represent a random finding, without a clear
guide to follow. And in looking for the unexpected connections, we see a similar case.
58

M.A.Sc. Thesis - Yao Song McMaster - Computing and Software
Figure 5.1: FRAM Analysis for Drug Handling Example (Hollnagel, 2004)
5.1.3 Why FMEA and STPA?
Compared with FTA, FMEA is designed to find out as many as possible failure modes
as well as the related failure cause and effects, rather than to create a logic model to
represent the relationships of the events of system and use mathematical equations
to calculate some kinds of values for failures. In many cases, FMEA is used to pro-
vide qualitative analysis. Sometimes values like failure rates of components (usually
hardware components) would be provided in worksheet, but they are only used to
give reference information, not for calculation. FMEA is a bottom-up approach. But
it can also be used as a top-down way by developing failure modes from high level
to lower level. Additionally, the worksheet format of FMEA is easily understood and
performed.
Like all the other traditional methodologies of hazard analysis, FMEA is designed
59

M.A.Sc. Thesis - Yao Song McMaster - Computing and Software
to find the root cause for the hazard identified. However, it is poor at representing
systemic accident factors such as structural deficiencies in the organization, manage-
ment decision-making, and flaws in the safety culture of the company or industry.
Besides these, there is also one key limitation for FMEA as well as other methods
like FTA and Event Tree Analysis. The limitation is that there is no guidance in
identifying hazards and related causal factors.
In FEMA, the failure mode on the highest level could be called a hazard. In FTA,
it refers to the top event. The selection of it is arbitrary and usually based on an
expert’s knowledge of the system. Sometimes it is selected because it represents a
type of event that is familiar and thus acceptable as an explanation for the accident
or it is a deviation from a standard (Broadbent et al., 1990).
In addition to subjectivity in selecting the events and the root cause event, the
links between the events that are chosen to explain them are subjective and subject to
bias. In FMEA processes, which are introduced in chapter 2, the steps for identifying
all potential failure modes are described as below (Ericson, 2005; U.S.A. Department
of Defense, 1980):
“ Acquire all of the necessary design and process data needed (e.g., func-
tional diagrams, schematics, and drawings) that illustrate the operation,
interrelationships, and interdependencies of functional entities involved in
the use or operation of the system to build block diagrams. Determine all
of the ways in which the items in the system definition can potentially
fail.”
From the description above, we can find that there is no guidance to let people
know: 1) what kinds of block diagrams are needed; 2) how to build a block diagram;
60

M.A.Sc. Thesis - Yao Song McMaster - Computing and Software
and 3) how to determine all of the ways in which the items in the system definition
can potentially fail. Another point is that identifying all potential failure modes is
not realistic, because there is no way to prove completeness.
STPA might make some contributions to these problems. STPA uses a safety
control structure to view the hazards and causal factors in the context whole, and
does not focus on a specific component in isolation. Another important contribution
of STPA is that it provides a systemic way and clear guidance to identify the hazards
(corresponding to the failure modes on highest level in FMEA) and the causal factors
(corresponding to the failure modes on the lower level and failure causes in FMEA),
rather than from an expert’s knowledge or imagination. The following section de-
scribed how to apply STPA to our case.
5.2 How to Apply STPA to Improve FMEA
The hazard analysis for the Darlington case could be classified into three levels. The
first phase focuses on the system level, which considers the software, the hardware
and all the other environmental factors, to identify the system hazards. The second
level focuses on the design of each sub-system/component of the system. The third
level of the process is the lowest level, which could be an extension of the design
analysis to identify all the detailed failure modes of each component. For software, it
could be the source code level.
In this thesis, STPA is applied to the system-level of SDS1. Since there are three
independent channels in SDS1, the trip computer and watchdog described below refer
to the ones in a single channel.
61

M.A.Sc. Thesis - Yao Song McMaster - Computing and Software
5.2.1 Define System Hazards and Related Safety Constraints
The first step of STPA is to define the system-level hazards and ensure that ap-
propriate safety constraints are in place. A safety-driven design should start with
identifying accidents and then defining the system hazards which would cause these
accidents to occur.
The accidents here can be defined as undesired or unplanned events that results in
a loss, including loss of human life or human injury, property damage, environmental
pollution, mission loss, etc (Leveson, 2011). The hazards here can be defined as
system states or a set of conditions that, together with a particular set of hazardous
conditions, will lead to an accident (Leveson, 2011). After the system hazards are
defined, they should be translated into the corresponding safety constraints, which
are restrictions on how the system can achieve its purpose.
For a nuclear power station, obviously the most catastrophic accident is explosion
of the nuclear reactor. It can result in releasing large quantities of radioactive con-
tamination into the atmosphere, which can lead to huge loss of human life, property
damage, environmental pollution, etc.
So for the Darlington shutdown system, the brief system-level hazard should be:
The reactor fails to trip in the required time if conditions are such that at least 2
channel trips should occur. The corresponding system safety constraint is that: The
reactor should trip in the required time if conditions are such that at least 2 channel
trips should occur.
For simple systems, this system-level hazard might be enough. While for complex
systems, further analysis will be needed to identify the lower level hazards. Section
5.2.3 provides the method of hazard identification.
62

M.A.Sc. Thesis - Yao Song McMaster - Computing and Software
5.2.2 Develop Safety Control Structure
The second step is to develop the safety control structure for the system. The main
work for defining this control structure involves identifying the responsibilities of each
component or sub-system as well as all their relationships. It should be in compli-
ance with the System Design Specification. Figure 5.2, below, shows the safety control
structure diagram of SDS1 at the system level. It is composed of the following com-
ponents; Trip Computer, Watchdog, Actuator (Voting Logic sub-system and Rods),
Reactor and Sensor (Sensors and Amplifier and transmitter). Please note that there
is no standard for control structure. It depends on how much detailed information
you want to consider. Here we omit the converters which are used to convert analogue
signals to digital signals.
The whole system could be viewed as a control process. Trip computer is the
controller, the most important part of the control system. In SDS1, there are three
separate trip computers located in three channels. The watchdog could be viewed
as a part of controller. It provides a self-check strategy for the trip computer. The
actuator is the component executing the action to the object being controlled. In
SDS1, there are two separate actuators. Each of them is composed of a number of
rods, which execute the action to shut down the reactor. Between the trip computers
and actuators, there is a voting logic sub-system, which is composed of multiple relays,
two-out-of-three logic components and OR gates. The reactor is the object which is
going to be controlled. Sensors will be separately grouped into three channels to
capture the status information of the reactor. Different sensors are responsible for
capturing different status information of the reactor, such as neutron power, heat
transport flow, heat transport pressure, etc. Amplifiers and transmitters are used to
63

M.A.Sc. Thesis - Yao Song McMaster - Computing and Software
Figure 5.2: Safety Control Structure of SDS1 on System Level
64

M.A.Sc. Thesis - Yao Song McMaster - Computing and Software
amplify and transmit the analogue signals from sensors. After we understand the role
of each component or sub-system as completely as possible, we should add the causal
relationship among the components into the diagram.
Some components or sub-systems can have their own safety control structures in
a lower level or they play another role in another control structure. For example,
the controller – trip computers and voting logic sub-system can be further developed
to have their own control structures. This feature demonstrates that STPA can be
easily expanded and applied to different levels and will be discussed in section 5.2.4.
Figure 5.3 shows the safety control structure of the trip computers of SDS1.
The responsibilities of each component have already been discussed in chapter 4.
In figure 5.3, the operator is the controller. The trip computer becomes the controlled
object. There are two ways that the operator controls the trip computer. The op-
erator can send commands to the trip computer via a keyswitch and the commands
will be transmitted through the display/test computer to the trip computer. This
is the indirect way. Another way is that the operator can directly send commands
to the trip computer by using a pushbutton. The monitor computer acts as sensors
to the operator. It is used to monitor the information of the parameters of the trip
computer.
5.2.3 Identify Potentially Inadequate Control Actions
After the system control structure has been defined, the next step is to identify lower
level hazards for the system. In section 5.2.1, the system-level hazard has been defined
already. For most complex systems, the lower level hazards have to be identified
according to the system design specification. STPA views hazards as potentially
65

M.A.Sc. Thesis - Yao Song McMaster - Computing and Software
Figure 5.3: Safety Control Structure of Trip Computers of SDS1
66

M.A.Sc. Thesis - Yao Song McMaster - Computing and Software
Control Action From To DescriptionTC trip on High-LogNPower
Trip Com-puter
Reactor Shut down the reactor by tripcomputer on high LogN powertrip condition.
WD trip on High-LogNPower
Watchdog Reactor Shut down the reactor by watch-dog.
Table 5.1: Control Actions of High LogN Power Trip
inadequate control actions. So identifying the hazards is actually identifying the
potentially inadequate control actions. In the Darlington shutdown system, there are
several totally independent parameter trips. Each parameter trip can be viewed as a
function of the system. For each function, there are several related control actions.
They can be identified according to what kinds of commands the controller can send to
controlled process/object related to the selected function. In the Darlington shutdown
system, for any parameter trip function in single channel, the trip command that can
be sent from the controller to the controlled process is the channel trip command. It
can be sent from the trip computer or the watchdog.
In the following sections, we only focus on one parameter trip – High LogN Power
Trip to analyze. Because all the parameter trips are separate, the analysis of other
parameter trips will be similar. Table 5.1 lists all the related control actions for
the High LogN Power Trip function. Both trip computer and related watchdog can
send the channel trip command. For each control action, the conditions under which
the control action could become inadequate are identified by using the four general
categories as follows: (Leveson, 2011)
1. A control action required for safety is not provided or is not followed.
2. An unsafe control action is provided that leads to a hazard.
67

M.A.Sc. Thesis - Yao Song McMaster - Computing and Software
3. A potentially safe control action is provided too early, too late, or out of se-
quence.
4. A safe control action is stopped too soon (for a continuous or non-discrete
control action).
Table 5.2 shows the potentially inadequate control actions of High LogN Power
Trip in the four general categories. Each cell in the table describes what kind of
inadequate control action could happen. Each inadequate control action is actually
one lower level hazard. Now four system-level hazards (potentially inadequate control
actions), marked with a1, a2, b1 and b2, for High LogN Power Trip function are
identified.
According to (Yu et al., 2002), in the Darlington shutdown system, hazards can
be divided into three classes: Class III, Class II and Class I, with the severity from
low to high. Class III system hazards refer to the system hazards which only have
a secondary impact in terms of wear and tear on the system as well as economic
impact (Yu et al., 2002). Class II system hazards refer to the hazards that the
trip logic is reduced to a two-out-of-two system and then redundancy for the trip
parameter is reduced. They usually occur when one channel is under testing. Class I
system hazards refer to the hazards which have a direct impact to the key functionality
of the system. So a1 and b1 belong to Class I; a2 and b2 belong to class III.
5.2.4 Determine How Unsafe Control Actions Could Occur
After hazards have been identified, the following step should identify causal factors,
which are very useful to figure out mitigating features against the hazard. Because
hazards result from inadequate control and enforcement of safety constraints, the
68
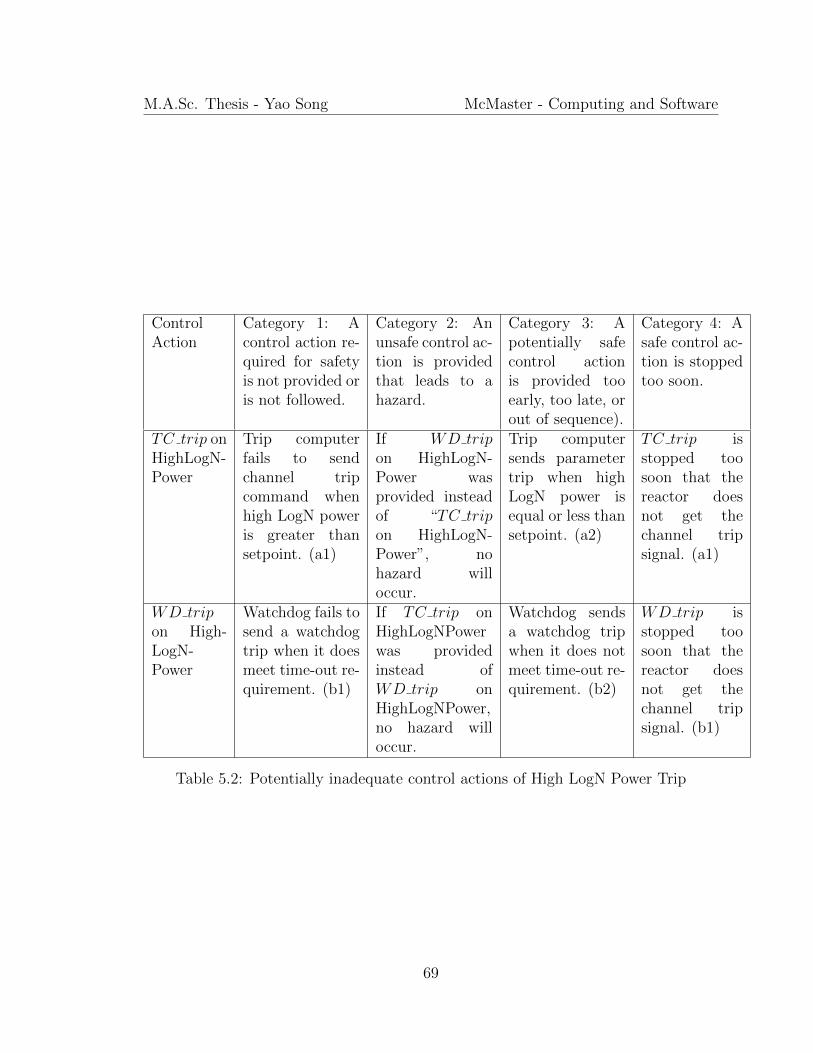
M.A.Sc. Thesis - Yao Song McMaster - Computing and Software
ControlAction
Category 1: Acontrol action re-quired for safetyis not provided oris not followed.
Category 2: Anunsafe control ac-tion is providedthat leads to ahazard.
Category 3: Apotentially safecontrol actionis provided tooearly, too late, orout of sequence).
Category 4: Asafe control ac-tion is stoppedtoo soon.
TC trip onHighLogN-Power
Trip computerfails to sendchannel tripcommand whenhigh LogN poweris greater thansetpoint. (a1)
If WD tripon HighLogN-Power wasprovided insteadof “TC tripon HighLogN-Power”, nohazard willoccur.
Trip computersends parametertrip when highLogN power isequal or less thansetpoint. (a2)
TC trip isstopped toosoon that thereactor doesnot get thechannel tripsignal. (a1)
WD tripon High-LogN-Power
Watchdog fails tosend a watchdogtrip when it doesmeet time-out re-quirement. (b1)
If TC trip onHighLogNPowerwas providedinstead ofWD trip onHighLogNPower,no hazard willoccur.
Watchdog sendsa watchdog tripwhen it does notmeet time-out re-quirement. (b2)
WD trip isstopped toosoon that thereactor doesnot get thechannel tripsignal. (b1)
Table 5.2: Potentially inadequate control actions of High LogN Power Trip
69

M.A.Sc. Thesis - Yao Song McMaster - Computing and Software
causal factors can be understood in terms of control flaws. Figure 3.5 has already
shown a classification of control flaws leading to hazards. The safety control structure
diagram is evaluated by using this classification of control flaws. Please note that not
all the control flaws will contribute to the hazard, which means not all the control
flaws will become the causal factors. It depends on different cases. Here, hazard a1
is selected to be analyzed first. According to figure 3.5 and our system features, we
create figure 5.4 to show Causal factors leading to hazard a1.
For convenience, figure 5.5 is used to record and group the causal factors of hazard
a1. Please note that the causal factor of “control input (from operator) wrong or
missing” needs to be further developed. This is because the trip computer exists
in another control loop which is already shown in figure 5.3. In the system-level
control structure, the trip computer is the controller. While in the lower level control
structure, it becomes the controlled object. Therefore, “control input (from operator)
wrong or missing” has to be developed further for the lower level control structure.
So the analysis will follow the same processes from 5.2.2 to 5.2.4.
For some cells marked with “to be decided”, it means that more detailed informa-
tion is needed. In our case, the only supporting documentation that we have is (Wong
et al., 2007), so the causal factors of other parts in the control loop are marked with
“to be decided”.
Now, we are going to analyze “control input (from operator) wrong or missing”.
Since control input is actually the control command sent from the operator, we will
start with the function “operator sends commands on high LogN power trip condi-
tion”. Table 5.3 lists the control actions related to this function. Since High LogN
Power trip does not need gain factors from the operator, there are only two control
70

M.A.Sc. Thesis - Yao Song McMaster - Computing and Software
Figure 5.4: Causal factors leading to hazard a1
71

M.A.Sc. Thesis - Yao Song McMaster - Computing and Software
Figure 5.5: Causal factors of hazard a1
72

M.A.Sc. Thesis - Yao Song McMaster - Computing and Software
73

M.A.Sc. Thesis - Yao Song McMaster - Computing and Software
Control Action From To DescriptionSending conditionin/out command
Operator(throughpushbutton)
Trip com-puter
Operator enables/disables theparameter trip.
Sending channeltrip reset command
Operator(throughkeyswitch)
Trip com-puter
Operator sends channel trip re-set to clear channel trip.
Table 5.3: Control Actions of “operator sends command on High LogN Power Tripcondition”
actions left.
Table 5.4 identified the potentially inadequate control actions. In table 5.4, three
hazards c1, d1 and e1 are identified. The hazard c1 will be chosen to be analyzed to
identify the causal factors. Figure 5.6 shows the causal factors of hazard c1. Please
note that c1 is quite different with a1, d1 and e1. The hazard c1 refers to incorrect
action which should not occur but does occur. The hazards a1, d1 and e1 refer to
correct actions which should occur but do not occur. So for c1, inadequate operation
for actuator, condition out missing, and operation delays will not lead to the hazard
and will not be considered.
Another special point is that when the controller is a human controller, the analysis
will be complex. Figure 5.7 shows the relationship between mental models. So when
analyzing the operator’s model, including the algorithm model and the logic model
of the operator, we should consider operational procedures, training and operational
experience.
For convenience, figure 5.8 is used to record and group the causal factors of hazard
c1. The analysis of d1 and e1 is similar with a1. Figure 5.9 is for causal factors of d1.
Figure 5.10 is for causal factors of e1. Note that actuator for d1 and e1 are different.
One is using a pushbutton and the other is using the keyswitch.
74

M.A.Sc. Thesis - Yao Song McMaster - Computing and Software
ControlAction
Category 1: Acontrol actionrequired forsafety is notprovided or isnot followed.
Category 2: Anunsafe controlaction is pro-vided that leadsto a hazard.
Category 3: Apotentially safecontrol actionis provided tooearly, too late, orout of sequence).
Category 4: Asafe control ac-tion is stoppedtoo soon.
Sendingcondi-tion outcommand(throughpushbut-ton)
Condition outcommand sentincorrectly.(c1)
If “Sendingcondition outcommand” isnot provided,instead of pro-viding any ofthe other two,no new hazardoccurs.
If “Sending con-dition out com-mand” too early,(c1).
Condition outcommand isstopped too soonthat the tripcomputer doesnot receive thesignal, no newhazard occurs.
Sendingcondi-tion incommand(throughpushbut-ton)
Fail to sendcondition incommand.(d1)
If “Sendingcondition incommand” isnot provided,instead of pro-viding any ofthe other two,no new hazardoccurs.
If “Sending con-dition in com-mand” too late,(d1).
Condition incommand isstopped too soonthat the tripcomputer doesnot receive thesignal. (d1)
Sendingchanneltrip resetcommand(throughkeyswitch)
Channel tripreset com-mand sentincorrectly.(e1)
If “Sendingchannel tripreset command”is not provided,instead of pro-viding any ofthe other two,no new hazardoccurs.
If “Sendingchannel tripreset command”too early, (e1).
Channel trip re-set command isstopped too soonthat the channeltrip is still sealed-in, no new hazardoccurs.
Table 5.4: Potentially Inadequate Control Actions of “operator sends control com-mand” on High LogN Power Trip
75

M.A.Sc. Thesis - Yao Song McMaster - Computing and Software
Figure 5.6: Causal factors leading to hazard c1
76
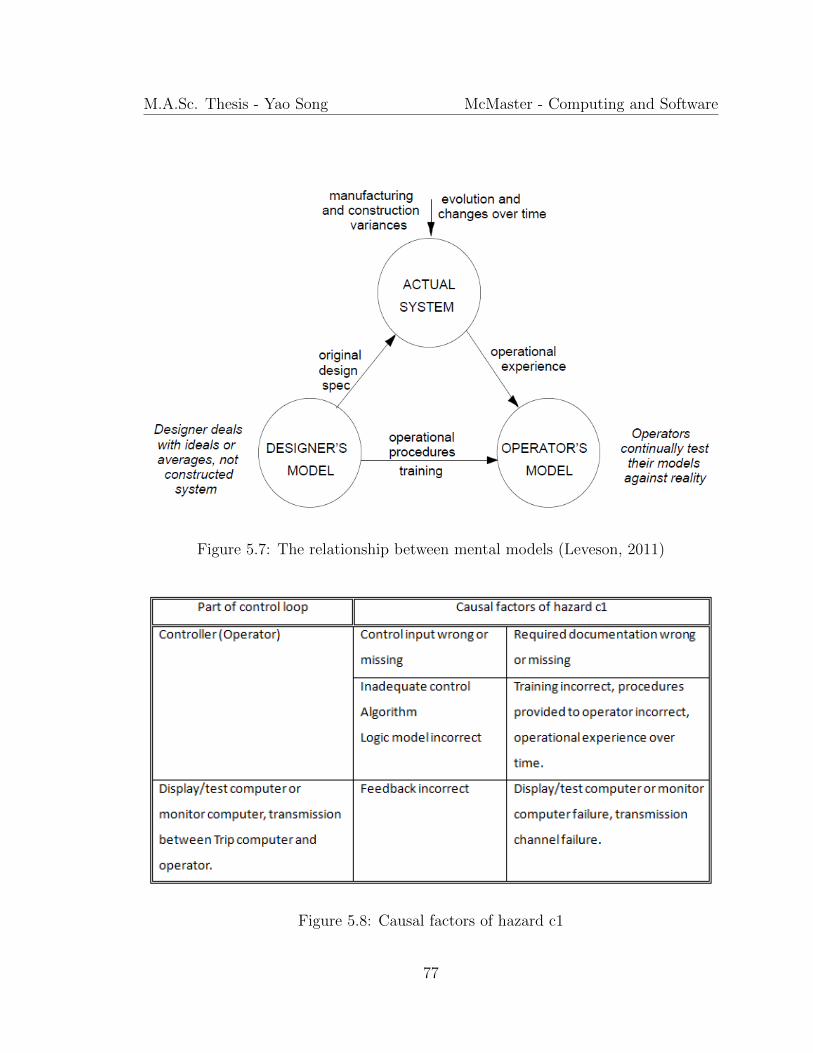
M.A.Sc. Thesis - Yao Song McMaster - Computing and Software
Figure 5.7: The relationship between mental models (Leveson, 2011)
Figure 5.8: Causal factors of hazard c1
77

M.A.Sc. Thesis - Yao Song McMaster - Computing and Software
Figure 5.9: Causal factors of hazard d1
Now, we are going to analyze the hazard b1 – “Watchdog fails to send a watchdog
trip when it does not meet time-out requirement”. According to the design speci-
fication, the watchdog can only send the watchdog trip when the update signal is
missing for a specified period. So in this case, the watchdog acts as a controller.
There is no control input from the trip computer or operator as well as no feedback
from the sensor. The processes of hazard b1 analysis are similar to those of hazard
a1. Figure 5.11 shows the causal factors of hazard b1.
Compared with hazard a1 and b1, hazard a2 is quite different. Hazard a2 and
b2 refer to control actions that occur incorrectly rather than required control actions
that do not occur. The analysis of hazard a2 and b2 is similar to that of hazard c1.
For the analysis of hazard a2, we will omit causal factors related to the actuator and
controlled process because they will not lead to hazard a2. Figure 5.12 shows the
78

M.A.Sc. Thesis - Yao Song McMaster - Computing and Software
Figure 5.10: Causal factors of hazard e1
causal factors of hazard a2. For hazard b2, it is simpler because there is no feedback
from the sensor for the watchdog. Figure 5.13 shows the causal factors of hazard b2.
To compare with the original FMEA results easily, we put the results based on
STPA into the FMEA worksheet. In the function column, it is High LogN Power Trip
in single channel. Then the highest failure modes should be hazard a1, b1, a2 and b2.
The causal factors of each hazard are composed from the lower level failure modes.
The causal factors in the lowest level are the failure causes in FMEA. Figure 5.14
shows the results based on STPA for SDS1.
79

M.A.Sc. Thesis - Yao Song McMaster - Computing and Software
Figure 5.11: Causal factors of hazard b1
80
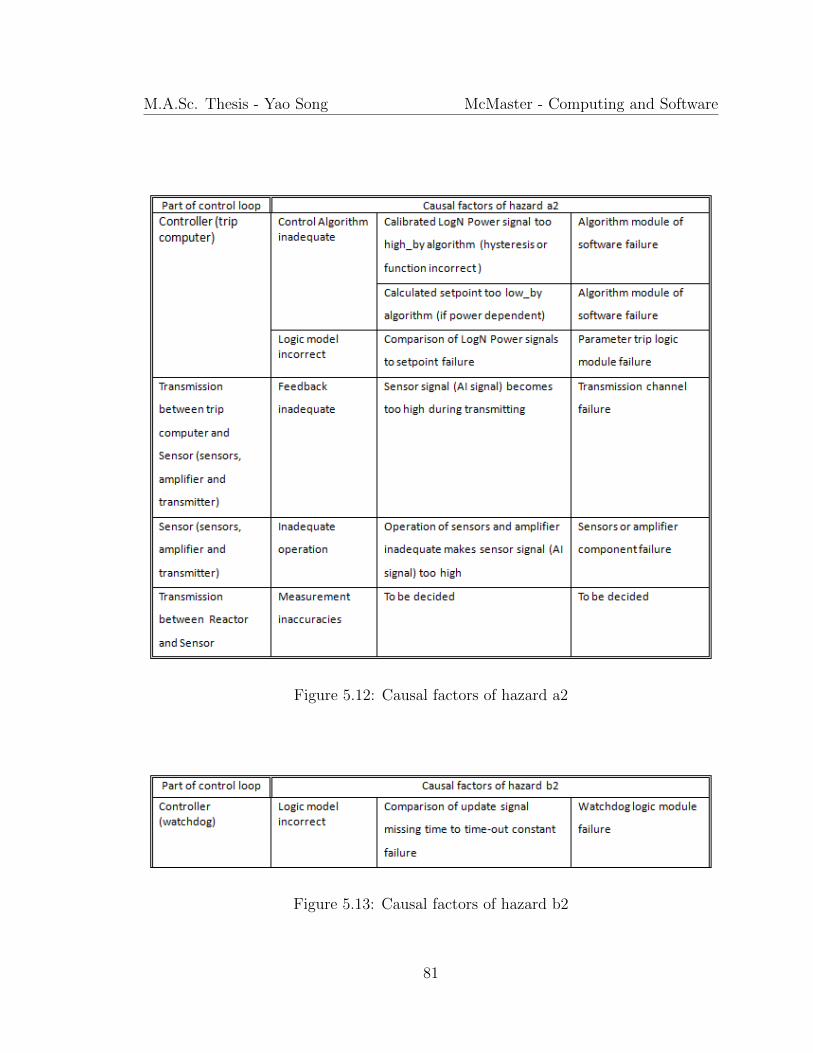
M.A.Sc. Thesis - Yao Song McMaster - Computing and Software
Figure 5.12: Causal factors of hazard a2
Figure 5.13: Causal factors of hazard b2
81

M.A.Sc. Thesis - Yao Song McMaster - Computing and Software
Figure 5.14: Darlington SDS1 Hazard Analysis Results Based on STPA
82

M.A.Sc. Thesis - Yao Song McMaster - Computing and Software
83

M.A.Sc. Thesis - Yao Song McMaster - Computing and Software
84

M.A.Sc. Thesis - Yao Song McMaster - Computing and Software
85

M.A.Sc. Thesis - Yao Song McMaster - Computing and Software
5.3 Comparison Between the Results Based on STPA
and the Original Darlington FMEA Results
To determine the usefulness of STPA as a method for the Darlington shutdown sys-
tem hazard analysis, the FEMA results based on STPA analysis (figure 5.14) are
compared with the original Darlington FMEA results under the same function “High
LogN Power Trip on single channel”. The original Darlington FMEA results can-
not be shown for confidential reasons, but they are essentially the same as the ones
marked as identified in both FMEA and STPA. The conclusions from the comparison
are described as follows.
Clear guidance
In most cases, there is no unified standard to let people know how to identify haz-
ard, failure mode and failure cause in FMEA. Usually analyst has to use professional
knowledge and experience. This situation might make it difficult for other people to
understand how the analysis report is structured and what failure mode might be
missed. However, STPA provides clear guidance for an analyst to develop a hazard
analysis. Figure 5.14 shows us that hazard analysis is well guided by using STPA.
STPA has clear steps for the analyst to follow. These steps are: selecting the specific
function; drawing the control structure for the system; identifying the related poten-
tially inadequate control actions (hazards); and identifying the causal factors.
More hazards and failure modes identified
86

M.A.Sc. Thesis - Yao Song McMaster - Computing and Software
By using STPA in our case, more hazards, failure modes and causal factors are iden-
tified, but the additional ones identified were not significant and do not affect the
conclusions presented in the original report. In figure 5.14, items in red refer to those
identified by STPA only; blue refers to those identified by both; black refers to those
that are not related with the trip computer. The results indicate that not only more
hazards, failure modes and causal factors related to the trip computer were identified,
but more components and their interactions were considered. This is because STPA
analyzes hazards and causal factors in a systematic way. It considers not only compo-
nents themselves, but also the interactions among components or between operator
and components. By using a safety control structure and a general control flaws
classification to analyze causal factors of each identified hazard, STPA may help the
analyst to find more failure modes and causal factors.
Good extension
Figure 5.14 includes three nested tables (figure 5.8, figure 5.9 and figure 5.10), because
the trip computer exists in another control structure. In STPA, if any component in
the control structure is complex such that it has its own logic or algorithm model,
or even its own control structure, or it exists in another control structure, it can
be further developed by following the same process. In our example, “voting logic
sub-system” can be further developed because it has its own logic model.
5.4 Case Study Conclusion
This case study provided a sample of hazard analysis for one function of the Darling-
ton SDS1 based on STPA. The main purpose of this thesis is to examine how to use
87

M.A.Sc. Thesis - Yao Song McMaster - Computing and Software
a systemic way to implement hazard analysis.
We used STPA to identify the related hazards, created the safety control structure
and identified the related causal factors. Finally we compared the results based on
STPA with the original FMEA results. In our case, we demonstrated how to apply
STPA to hazard analysis. We think that STPA provides a different idea and way
to develop hazard analysis, compared with traditional methods. It is worthwhile to
try to use it for hazard analysis in different domains. We are also confident that
our FMEA results based on STPA analysis provide more useful analysis information,
compared with the original Darlington version of FMEA results.
At the same time, it is important to note that the information generated by STPA
did not uncover hazards that had been ignored in the original Darlington Shutdown
Systems. A key principle in developing such safety systems is the principle of defence-
in-depth. This means that other analyses were performed, especially in the context
of nuclear safety analyses, and the additional information provided now by STPA
was already taken into account through these other processes. The advantage of
STPA is that it will add to our ability to provide a defence-in-depth regime, since the
hazards analysis process using STPA will enhance our ability to uncover system level
(environment and operator) potential hazards.
88

Chapter 6
Conclusions and Future Work
This chapter draws conclusions for the thesis, and makes suggestions for future work.
6.1 Conclusions
This is the first time that STPA has been applied to a Darlington shutdown system.
Also, this might be the first time STPA is applied in the nuclear domain. Some
conclusions can be drawn from this work:
• Existing hazard analysis approaches such as FTA and FMEA have been used
for a long period. As demonstrated in earlier chapters, we now realize that
these methods have some limitations. These limitations are of primary concern
for complex systems, and STPA may have some advantages for such systems.
• STPA provides a systemic methodology for hazard analysis as well as clear
guidance for conducting a hazard analysis.
• STPA is usually used at the system level, but it can also be extended for more
89

M.A.Sc. Thesis - Yao Song McMaster - Computing and Software
detailed levels.
• The results based on STPA analysis include not only component failures but
also the interaction failures among components or between components and
human operators within a hierarchical structure.
• Although it has many advantages, STPA still has some subjective aspects. For
different people, safety control structure might be different because their un-
derstanding of the system might be different. The identification of hazards and
causal factors also might be different. The more you understand the system,
the more hazards and causal factors you may find and the more accurate and
useful they could be.
• Like all the other approaches for hazard analysis, STPA cannot provide a proof
for completeness and accuracy of identification of hazards and causal factors.
6.2 Future work
More work and improvement is always necessary in the future to continue this work.
Some of them are listed below.
• In terms of the case study, further analysis can be made for the whole system.
Due to documentation unavailability, we only developed a small example to
demonstrate how to use STPA. If more material is available, each component in
the system-level control structure could be further developed if it had its own
logic model, or even its own control structure, or if it existed in another control
structure.
90
M.A.Sc. Thesis - Yao Song McMaster - Computing and Software
• A tool could be developed to help the analyst create control structures and
automate hazards and causal factors results. Since STPA is a new method, and
mature tool support is lacking. Development of such a tool would be extremely
useful for people working on safety-critical systems.
• The general classification for identifying potentially inadequate control actions
might be improved as well as the classification of control flaws for identifying
causal factors.
• More research could be conducted to ‘prove’ the completeness and accuracy of
identification of hazards and causal factors. Since STPA is based on a control
structure, it might be helpful to use some knowledge related with control theory.
91

Bibliography
Ashby, W. R. (1956). An Introduction to Cybernetics. Chapman and Hall.
Bertsche, B. (2008). Reliability in Automotive and Mechanical Engineering. VDI-Buc.
Bowman, W. C., Archinoff, G. H., Raina, V. M., and Tremaine, D. R. (2000). An
Application of Fault Tree Analysis to Safety Critical Software at Ontario Hydro.
In Probabilistic Safety Assessment and Management (PSAM).
Broadbent, D. E., Reason, J., and Baddeley, A. (1990). Human Factors in Hazardous
Situations. Clarendon Press.
Coppit, D., Sullivan, K., and Dugan, J. B. (2000). Formal Semantics of Models for
Computational Engineering: A Case Study on Dynamic Fault Trees. In Software
Reliability Engineering, 2000. ISSRE 2000. Proceedings. 11th International Sym-
posium on, pages 270–282.
Ericson, C. A. (2005). Hazard Analysis Techniques for System Safety. John Wiley &
Sons, Inc.
Fussell, J. B. and Vesely, W. E. (1972). A New Method for Obtaining Cutsets for
Fault Trees. Trans. ANS, pages 262–263.
92

M.A.Sc. Thesis - Yao Song McMaster - Computing and Software
Goddard, P. L., Raytheon, and Troy (2000). Software FMEA Techniques. In Relia-
bility and Maintainability Symposium, 2000., pages 118–123.
Guentcheva, D., Yu, X., and Diguer, D. (2002). Darlington NGD Loss of Flow Trip
Coverage Project-SDS2 Hazards Analysis Report. Technical report, Ontario Power
Generation (OPG).
Gusterson, H. (2011). The lessons of Fukushima. Bulletin of the Atomic Scientist.
Hollnagel, E. (2004). Barriers and Accident Prevention. Ashgate Publishing Limited.
Hollnagel, E. and Goteman, O. (2004). The Functional Resonance Accident Model.
In Cognitive Systems Engineering in Process Control, 2004.
Hollnagel, E., Pruchnicki, S., Woltjer, R., and Etcher, S. (2008). Analysis of Co-
mair flight 5191 with the Functional Resonance Accident Model. In International
Symposium of the Australian Aviation Psychology Association AAvPA, 2008.
Huang, G. Q., Shi, J., and Mak, K. L. (2000). Failure Mode and Effect Analysis
(FMEA) Over the WWW. The International Journal of Advanced Manufacturing
Technology, 16(8), 603–608.
H.W.Heinrich (1931). Industrial Accident Prevention: A Scientific Approach.
McGraw-Hill.
Ishimatsu, T., Leveson, N. G., Thomas, J., Katahira, M., Miyamoto, Y., and Nakao,
H. (2010). Modeling and Hazard Analysis Using STPA. In International Associa-
tion for the Advancement of Space Safety, 2010.
93

M.A.Sc. Thesis - Yao Song McMaster - Computing and Software
Leplat, J. (1984). Occupational Accident Research and Systems Approach. Occupa-
tional Accidents, 6, 77–89.
Leveson, N. G. (1995a). Safety as a System Property. Communications of the ACM,
38.
Leveson, N. G. (1995b). Safeware: System Safety and Computers. Addison-Wesley.
Leveson, N. G. (2004). A New Accident Model for Engineering Safer Systems. Safety
Science, 42(4).
Leveson, N. G. (2011). Engineering a Safer World. Engineering Systems. The MIT
Press.
Leveson, N. G., Cha, S., and Shimeall, T. (1991). Safety Verification of Ada Programs
Using Software Fault Trees. IEEE Software, 8(4), 48–59.
Misra, K. B. (2008). Handbook of Performability Engineering, volume 38. Springer,
1st edition.
Parnas, D. L., van Schouwen, A. J., and Kwan, S. P. (1990). Evaluation of Safety-
Critical Software. Communications of the ACM, 33.
Rasmussen, J. and Svedung, I. (2000). Proactive Risk Management in a Dynamic
Society. Swedish Rescue Services Agency, 1st edition.
Stamatelatos, M. and Vesely, W. (2002). Fault Tree Handbook with Aerospace Appli-
cations. NASA Office of Safety and Mission Assurance.
U.S.A. Department of Defense (1980). MIL-STD80-1629A: Procedures for Performing
a Failure Mode, Effects and Criticality Analysis. U.S.A. Department of Defense.
94

M.A.Sc. Thesis - Yao Song McMaster - Computing and Software
U.S.A. Department of Defense (2000). MIL-STD80-882D: Standard Practice for Sys-
tem Safety. U.S.A. Department of Defense.
Vesely, W. E., Goldberg, F. F., Roberts, N. H., and Haasl, D. F. (1981). Fault Tree
Handbook. U.S. Nuclear Regulatory Commission.
Weber, W., Tondok, H., and Bachmayer, M. (2003). Enhancing Software Safety by
Fault Trees: Experiences from an Application to Flight Critical SW. In Knowledge-
Based Intelligent Information and Engineering Systems, 2788, 289–302.
Wong, A., Lau, D., M.Viola, and Black, R. (2007). Darlington GSA Design Require-
ments for SDS1 Trip Computer System. Technical Report NK38-DID-68200-001,
Revision 008, Ontario Power Generation (OPG).
Yu, X., Webb, N., and Diguer, D. (2002). Darlington NGD Loss of Flow Trip Cov-
erage Project-SDS1 Hazards Analysis Report. Technical report, Ontario Power
Generation (OPG).
95