Embed Size (px)
DESCRIPTION
Applying Population Ecology: The Human Population. Chapter 7 Sections 1-4. Key Concepts. Factors affecting population size Human population problems Managing population problems Urban growth Resource and environmental problems in urban areas Transportation in urban areas - PowerPoint PPT Presentation
Citation preview

Chapter 7Chapter 7
Sections 1-4Sections 1-4
Applying Population Applying Population Ecology: The Human Ecology: The Human
PopulationPopulation
Key ConceptsKey Concepts
Factors affecting population sizeFactors affecting population size
Human population problemsHuman population problems
Managing population problemsManaging population problems
Urban growthUrban growth
Resource and environmental problems in urban areasResource and environmental problems in urban areas
Transportation in urban areasTransportation in urban areas
Achieving sustainable citiesAchieving sustainable cities
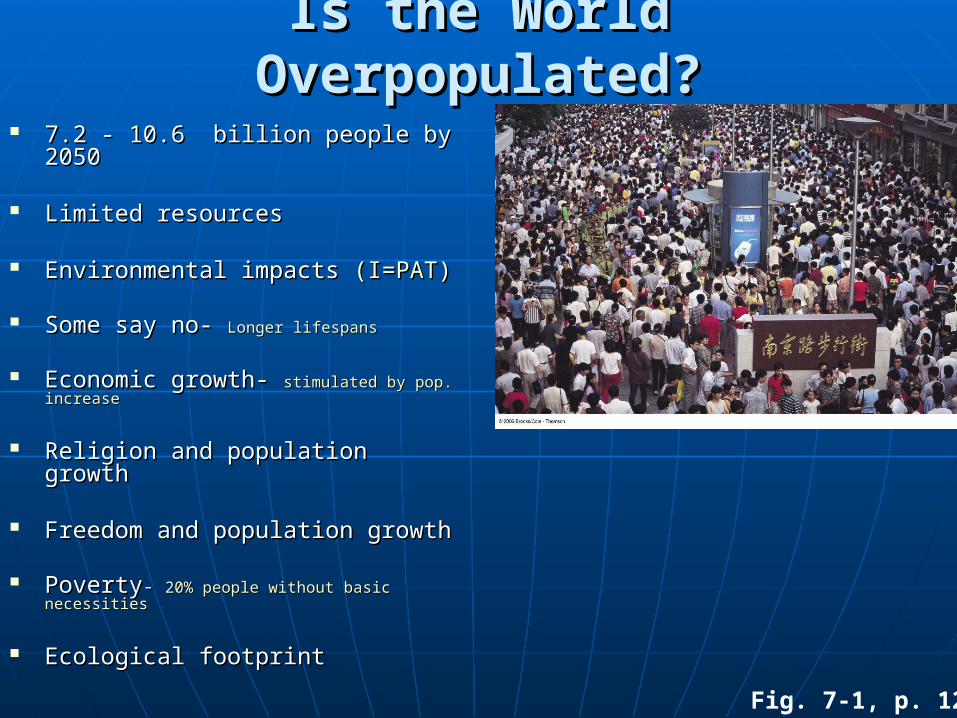
Is the World Overpopulated?Is the World Overpopulated?
7.2 - 10.6 billion people by 20507.2 - 10.6 billion people by 2050
Limited resourcesLimited resources
Environmental impacts Environmental impacts (I=PAT)(I=PAT)
Some say no- Some say no- Longer lifespansLonger lifespans
Economic growth- Economic growth- stimulated by pop. increasestimulated by pop. increase
Religion and population growthReligion and population growth
Freedom and population growthFreedom and population growth
PovertyPoverty- - 20% people without basic necessities20% people without basic necessities
Ecological footprintEcological footprint
Fig. 7-1, p. 128
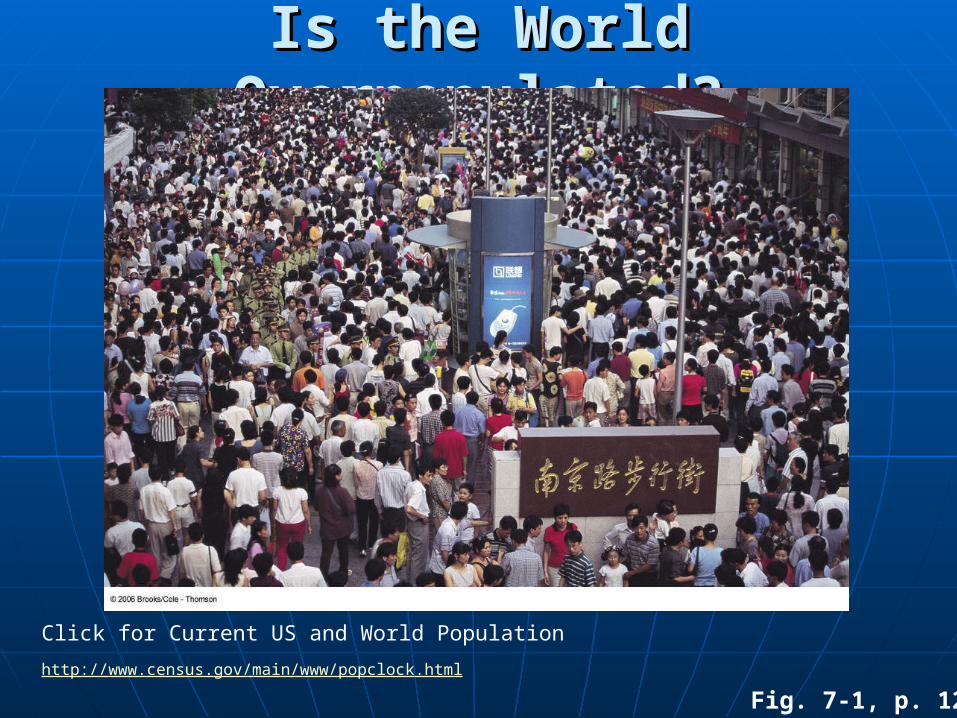
Is the World Overpopulated?Is the World Overpopulated?
Fig. 7-1, p. 128
Click for Current US and World Population
http://www.census.gov/main/www/popclock.html
Factors Affecting Human Factors Affecting Human Population SizePopulation Size
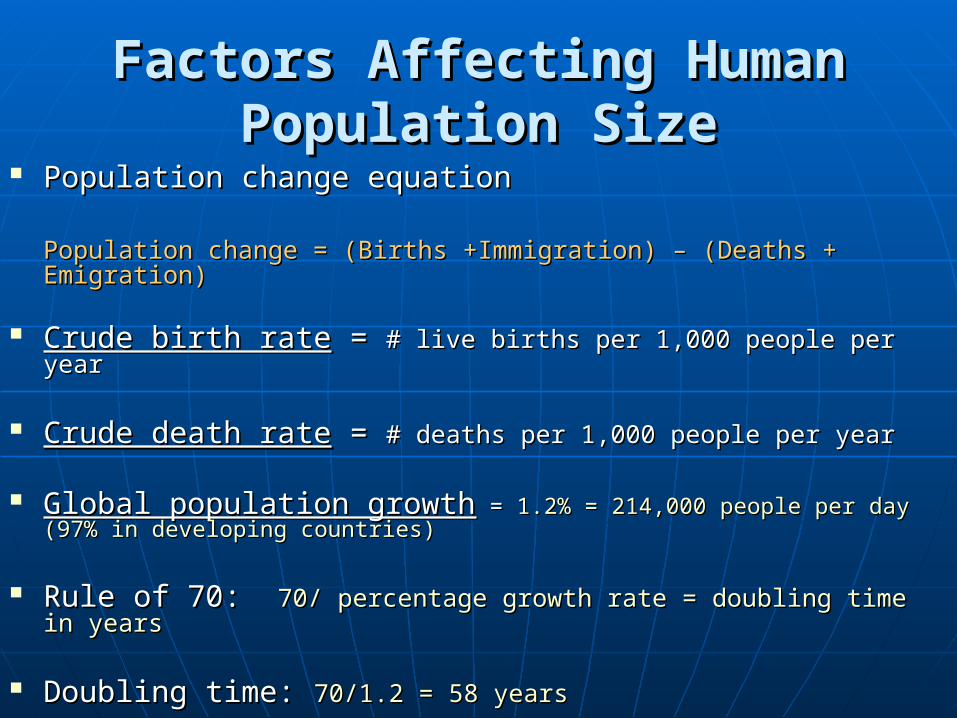
Population change equationPopulation change equation
Population change = (Births +Immigration) – (Deaths + Emigration)Population change = (Births +Immigration) – (Deaths + Emigration)
Crude birth rateCrude birth rate = = # live births per 1,000 people per year# live births per 1,000 people per year
Crude death rateCrude death rate = = # deaths per 1,000 people per year# deaths per 1,000 people per year
Global population growthGlobal population growth = = 1.2% = 214,000 people per day (97% in 1.2% = 214,000 people per day (97% in developing countries)developing countries)
Rule of 70: Rule of 70: 70/ percentage growth rate = doubling time in years70/ percentage growth rate = doubling time in years
Doubling time: Doubling time: 70/1.2 = 58 years70/1.2 = 58 years
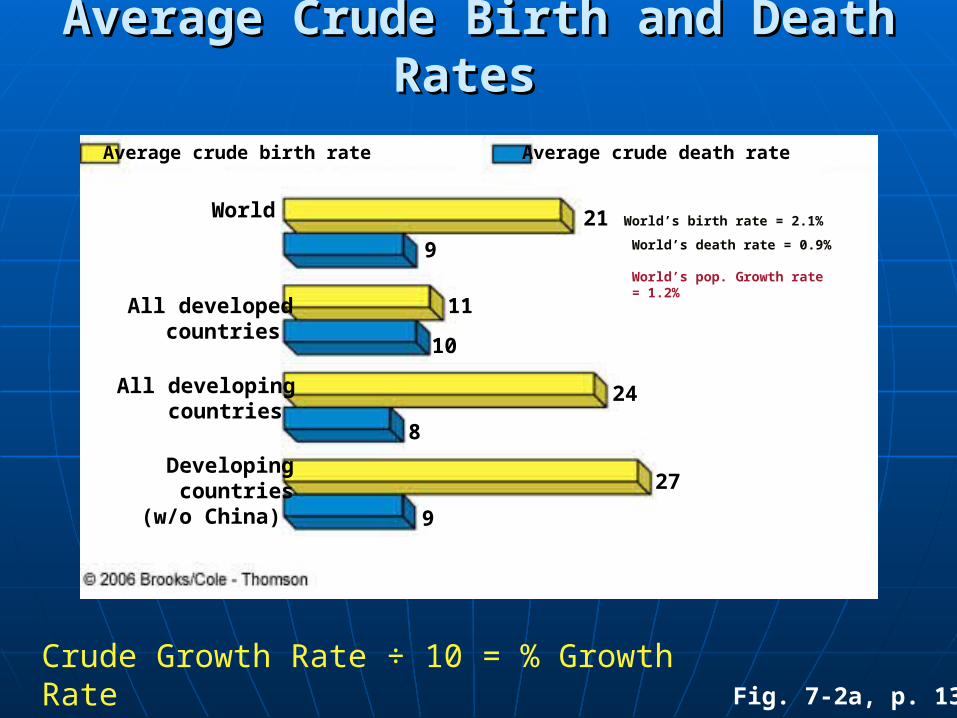
Fig. 7-2a, p. 130
Average crude birth rate Average crude death rate
World
All developedcountries
All developingcountries
Developingcountries
(w/o China)
21
9
11
10
24
8
27
9
Average Crude Birth and Death Rates Average Crude Birth and Death Rates
World’s birth rate = 2.1%
World’s death rate = 0.9%
World’s pop. Growth rate = 1.2%
Crude Growth Rate ÷ 10 = % Growth Rate
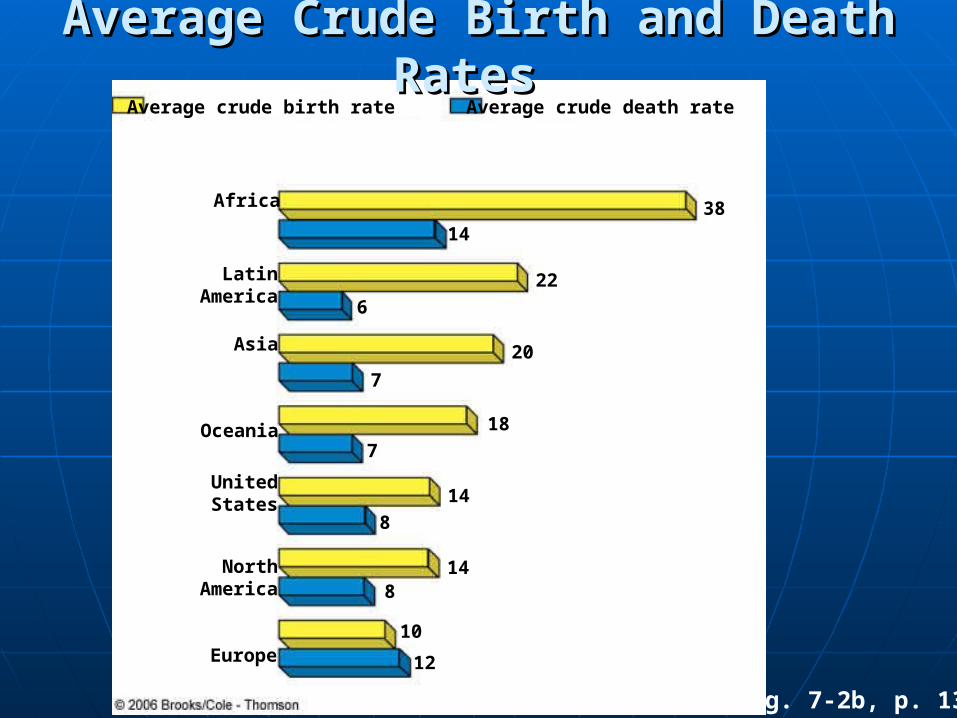
Average crude birth rate Average crude death rate
Africa
LatinAmerica
Asia
Oceania
UnitedStates
NorthAmerica
Europe
3814
22
6
20
7
18
7
14
8
148
10
12
Fig. 7-2b, p. 130
Average Crude Birth and Death Rates Average Crude Birth and Death Rates

AnimationAnimation
Current and projected population sizes by region.
How Did the Human Population How Did the Human Population Increase So Rapidly?Increase So Rapidly?
1.1. Human intelligence and adaptationHuman intelligence and adaptation- - enabled enabled expansion to diverse habitats & new climate zonesexpansion to diverse habitats & new climate zones
2.2. Agriculture - Agriculture - feeds more people per unit areafeeds more people per unit area
3.3. Medical technologies and sanitationMedical technologies and sanitation- - controls controls infectious diseaseinfectious disease
Describing Population ChangesDescribing Population Changes
Replacement-level fertilityReplacement-level fertility= = # children a couple must bear to replace themselves (approx 2.1 - 2.4)# children a couple must bear to replace themselves (approx 2.1 - 2.4)
Total fertility rate (TFR)Total fertility rate (TFR)= = average # children woman has in her reproductive years average # children woman has in her reproductive years (2005 TFR = 2.7) (TFR in MDCs = 1.6 : LDCs = 3.0)(2005 TFR = 2.7) (TFR in MDCs = 1.6 : LDCs = 3.0)
Projecting global populationsProjecting global populations: : 2050 projected pop. = 7.2-10.6 billion2050 projected pop. = 7.2-10.6 billionMost growth (97%) expected in developing countriesMost growth (97%) expected in developing countries
US fertility ratesUS fertility rates- - see figure 7-4, p. 131see figure 7-4, p. 131
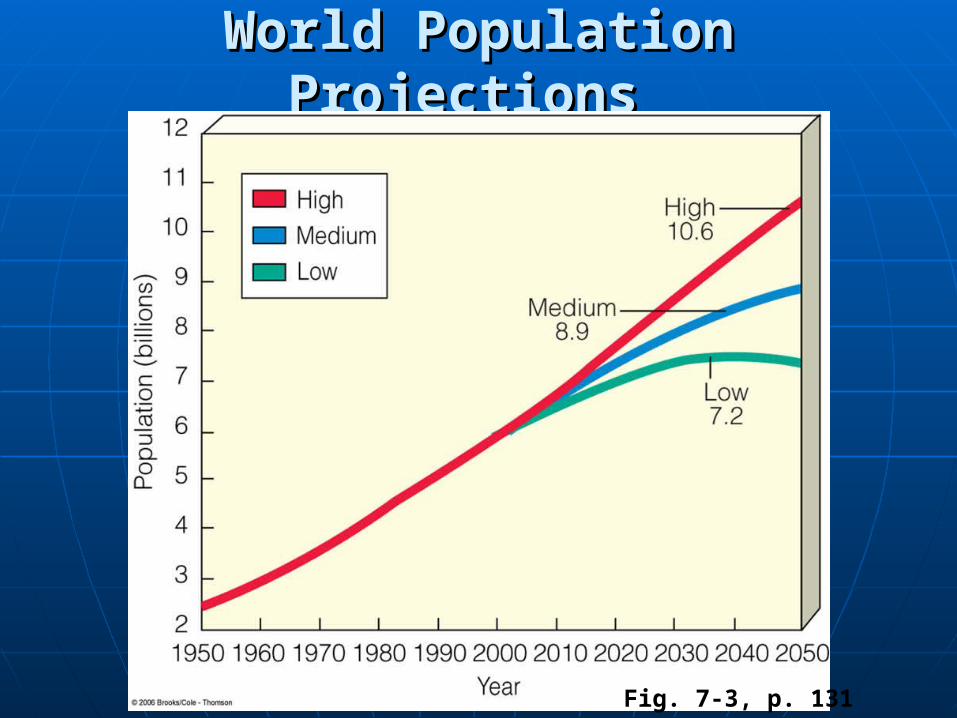
World Population Projections World Population Projections
Fig. 7-3, p. 131
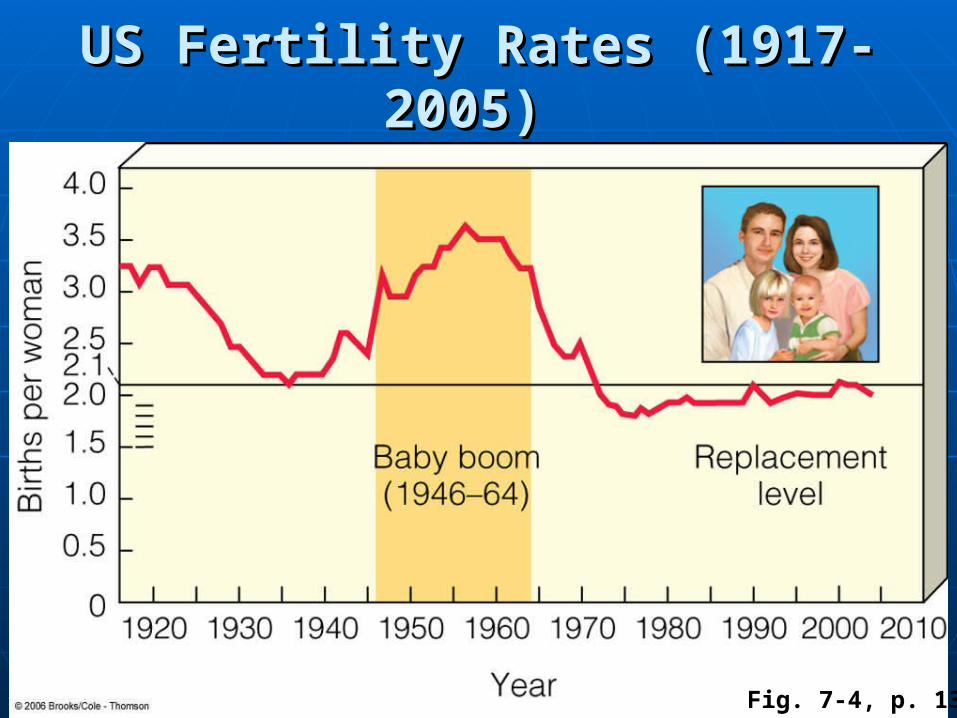
Fig. 7-4, p. 131
US Fertility Rates (1917-2005) US Fertility Rates (1917-2005)

47 years
77 years
8%
81%
15%
83%
10%
98%
2%
99%
10%
52%
$15
$3
1.2
5.8
1900
2000
Life expectancy
Married women workingoutside the home
High school graduates
Homes with flush toilets
Homes with electricity
Living in suburbs
Hourly manufacturing jobwage (adjusted for inflation)
Homocides per100,000 people Fig. 7-5, p. 132
Major Changes in US Society Major Changes in US Society (1900-2000) (1900-2000)
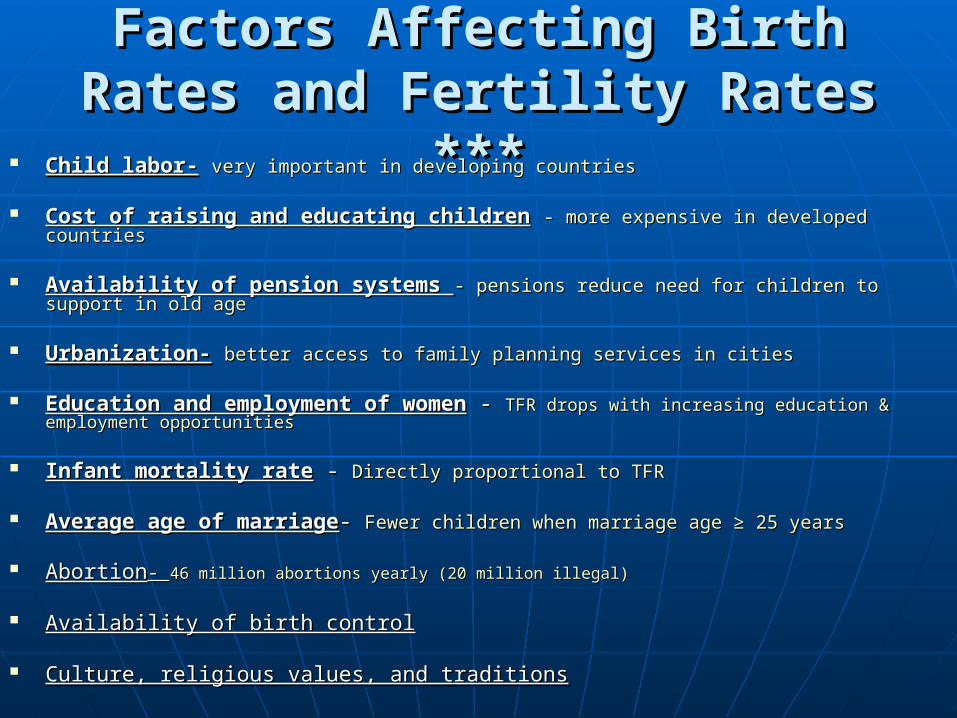
Factors Affecting Birth Rates Factors Affecting Birth Rates and Fertility Rates ***and Fertility Rates ***
Child labor-Child labor- very important in developing countriesvery important in developing countries
Cost of raising and educating childrenCost of raising and educating children - more expensive in developed countries- more expensive in developed countries
Availability of pension systems Availability of pension systems - pensions reduce need for children to support in old age- pensions reduce need for children to support in old age
Urbanization-Urbanization- better access to family planning services in citiesbetter access to family planning services in cities
Education and employment of womenEducation and employment of women - - TFR drops with increasing education & employment opportunitiesTFR drops with increasing education & employment opportunities
Infant mortality rateInfant mortality rate - - Directly proportional to TFRDirectly proportional to TFR
Average age of marriageAverage age of marriage- - Fewer children when marriage age ≥ 25 yearsFewer children when marriage age ≥ 25 years
AbortionAbortion- - 46 million abortions yearly (20 million illegal)46 million abortions yearly (20 million illegal)
Availability of birth controlAvailability of birth control
Culture, religious values, and traditionsCulture, religious values, and traditions
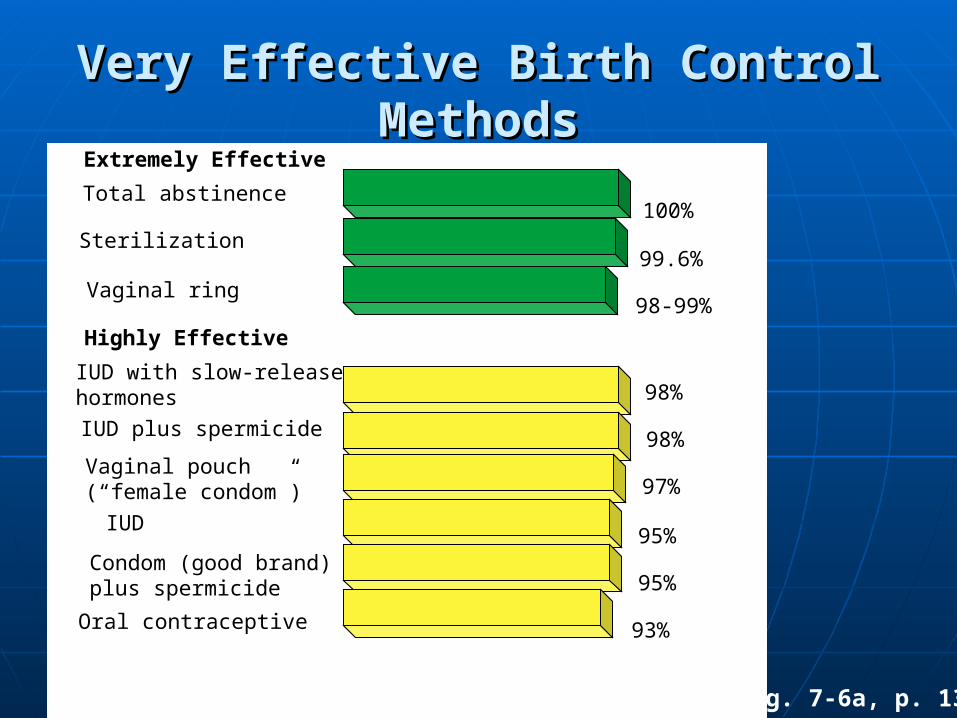
Extremely Effective
Highly Effective
Total abstinence
Sterilization
Vaginal ring
IUD with slow-releasehormones
IUD plus spermicide
Vaginal pouch(“female condom”)
IUD
Condom (good brand)plus spermicide
Oral contraceptive
100%
99.6%
98-99%
98%
98%
97%
95%
95%
93%
Fig. 7-6a, p. 133
Very Effective Birth Control MethodsVery Effective Birth Control Methods

Effective
Cervical cap
Condom (good brand)
Diaphragm plusspermicide
Rhythm method (Billings,Sympto-Thermal)
Vaginal sponge impreg-nated with spermicide
Spermicide (foam)
89%
86%
84%
84%
83%
82%
Fig. 7-6b, p. 133
Mostly Effective Birth Control Mostly Effective Birth Control MethodsMethods
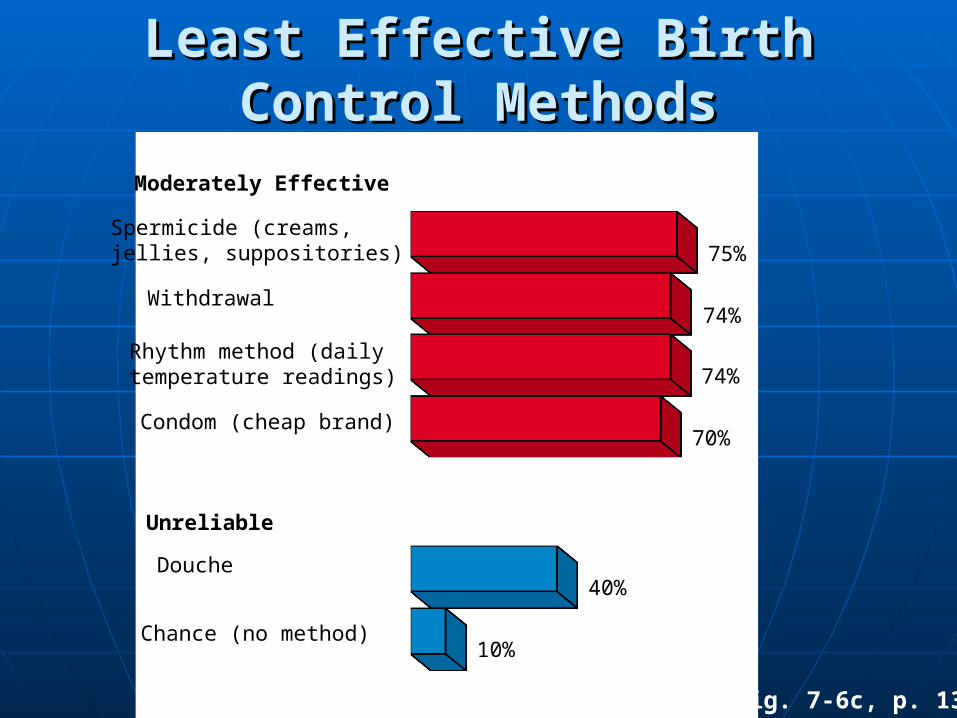
Moderately Effective
Unreliable
Spermicide (creams,jellies, suppositories)
Withdrawal
Rhythm method (dailytemperature readings)
Condom (cheap brand)
Douche
Chance (no method)
75%
74%
74%
70%
40%
10%
Fig. 7-6c, p. 133
Least Effective Birth Control Least Effective Birth Control MethodsMethods
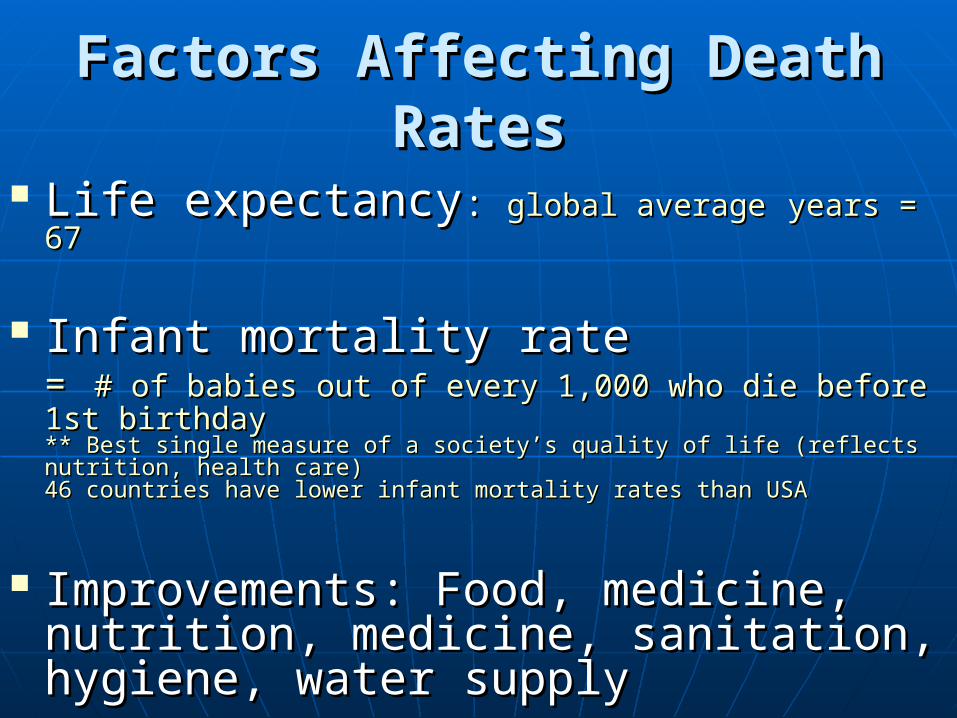
Factors Affecting Death RatesFactors Affecting Death Rates
Life expectancyLife expectancy: : global averageglobal average years = 67 years = 67
Infant mortality rate Infant mortality rate == # of babies out of every 1,000 who die before 1st birthday# of babies out of every 1,000 who die before 1st birthday** Best single measure of a society’s quality of life (reflects nutrition, health care)** Best single measure of a society’s quality of life (reflects nutrition, health care)46 countries have lower infant mortality rates than USA46 countries have lower infant mortality rates than USA
Improvements: Food, medicine, nutrition, Improvements: Food, medicine, nutrition, medicine, sanitation, hygiene, water medicine, sanitation, hygiene, water supplysupply
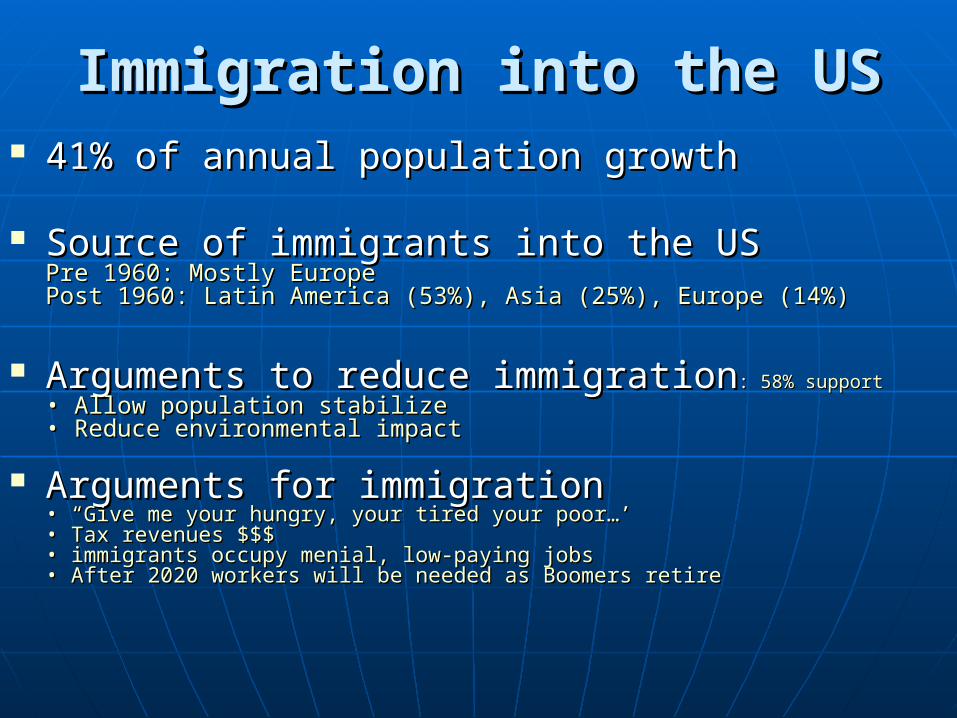
Immigration into the USImmigration into the US 41% of annual population growth41% of annual population growth
Source of immigrants into the USSource of immigrants into the USPre 1960: Mostly EuropePre 1960: Mostly EuropePost 1960: Latin America (53%), Asia (25%), Europe (14%)Post 1960: Latin America (53%), Asia (25%), Europe (14%)
Arguments to reduce immigrationArguments to reduce immigration : : 58% support58% support
• Allow population stabilize • Allow population stabilize • Reduce environmental impact• Reduce environmental impact
Arguments for immigrationArguments for immigration• “Give me your hungry, your tired your poor…’• “Give me your hungry, your tired your poor…’• Tax revenues $$$• Tax revenues $$$• immigrants occupy menial, low-paying jobs• immigrants occupy menial, low-paying jobs• After 2020 workers will be needed as Boomers retire• After 2020 workers will be needed as Boomers retire

CNN Video- “CNN Video- “Immigration”Immigration”
QuickTime™ and aSorenson Video decompressorare needed to see this picture.
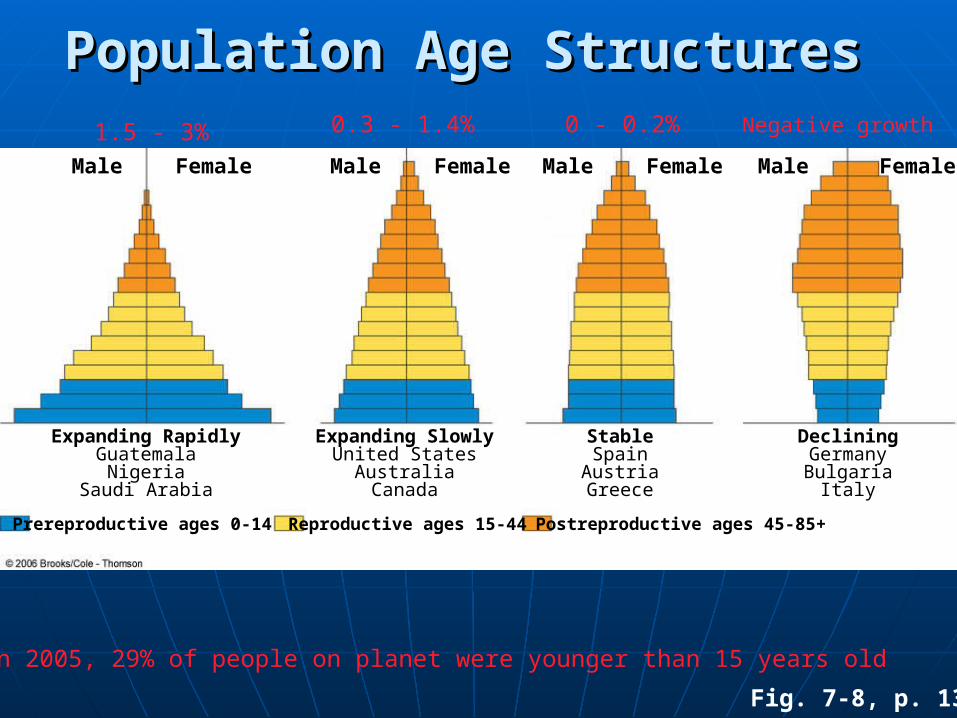
Fig. 7-8, p. 135
Expanding RapidlyGuatemala
NigeriaSaudi Arabia
Male Female
Prereproductive ages 0-14 Reproductive ages 15-44 Postreproductive ages 45-85+
Population Age Structures Population Age Structures
Male Female Male Female Male Female
Expanding SlowlyUnited States
AustraliaCanada
StableSpain
AustriaGreece
DecliningGermanyBulgaria
Italy
In 2005, 29% of people on planet were younger than 15 years old
1.5 - 3% 0.3 - 1.4% 0 - 0.2% Negative growth

AnimationAnimation
Examples of age structure interaction

Fig. 7-10, p. 136
Tracking the US Baby Boom Tracking the US Baby Boom Generation Generation

AnimationAnimation
U.S. age structure interaction.
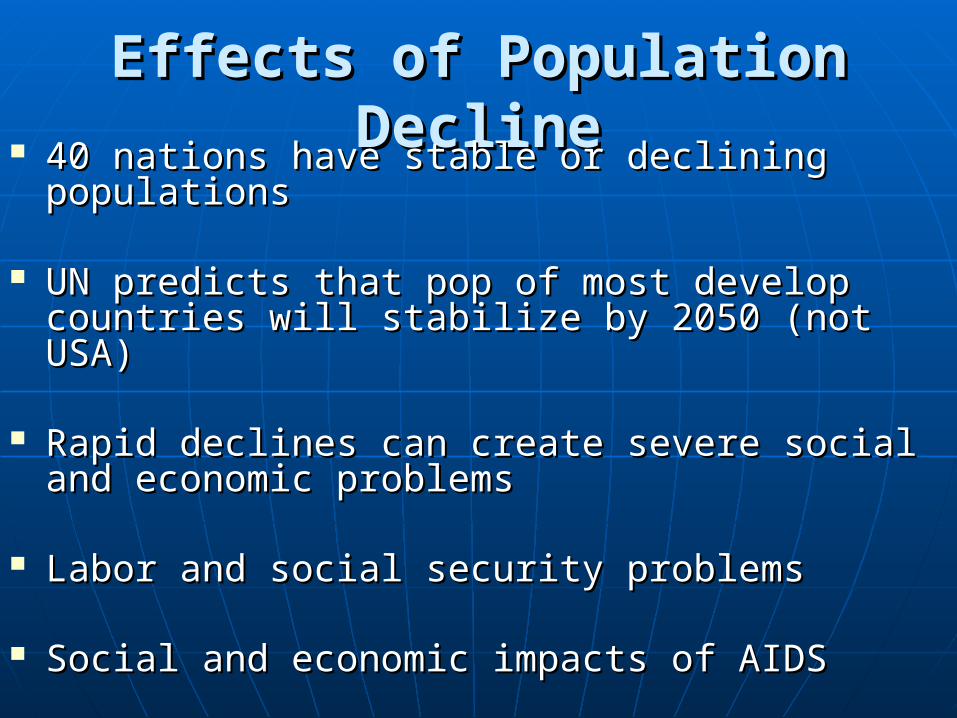
Effects of Population DeclineEffects of Population Decline 40 nations have stable or declining populations40 nations have stable or declining populations
UN predicts that pop of most develop countries will UN predicts that pop of most develop countries will stabilize by 2050 (not USA)stabilize by 2050 (not USA)
Rapid declines can create severe social and economic Rapid declines can create severe social and economic problemsproblems
Labor and social security problemsLabor and social security problems
Social and economic impacts of AIDSSocial and economic impacts of AIDS
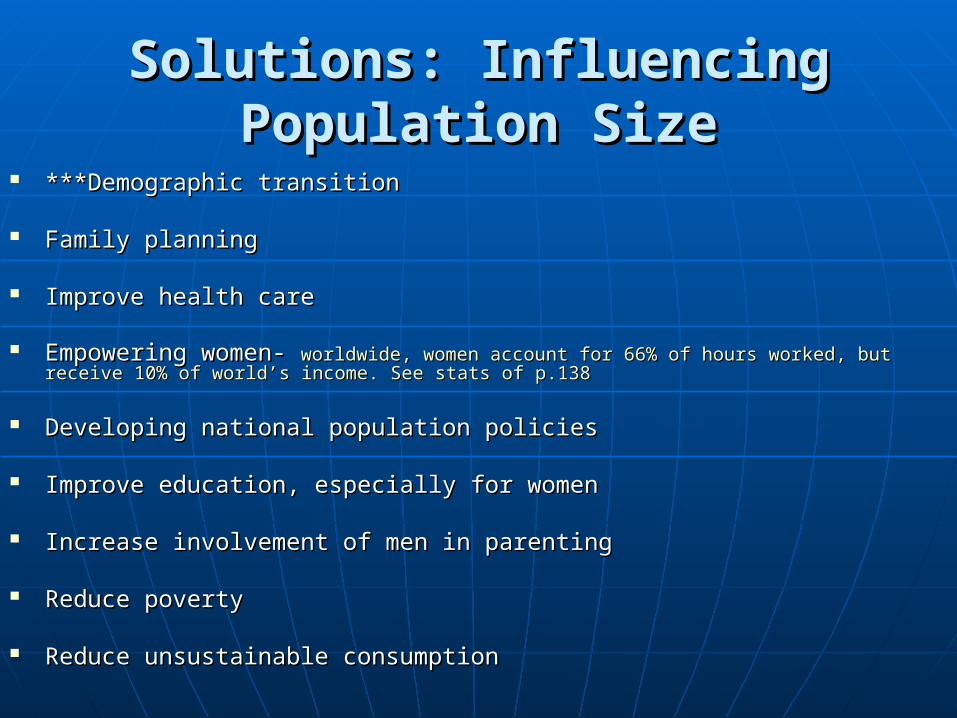
Solutions: Influencing Solutions: Influencing Population SizePopulation Size
***Demographic transition***Demographic transition
Family planningFamily planning
Improve health careImprove health care
Empowering women- Empowering women- worldwide, women account for 66% of hours worked, but receive 10% of world’s worldwide, women account for 66% of hours worked, but receive 10% of world’s income. See stats of p.138income. See stats of p.138
Developing national population policiesDeveloping national population policies
Improve education, especially for womenImprove education, especially for women
Increase involvement of men in parentingIncrease involvement of men in parenting
Reduce povertyReduce poverty
Reduce unsustainable consumptionReduce unsustainable consumption
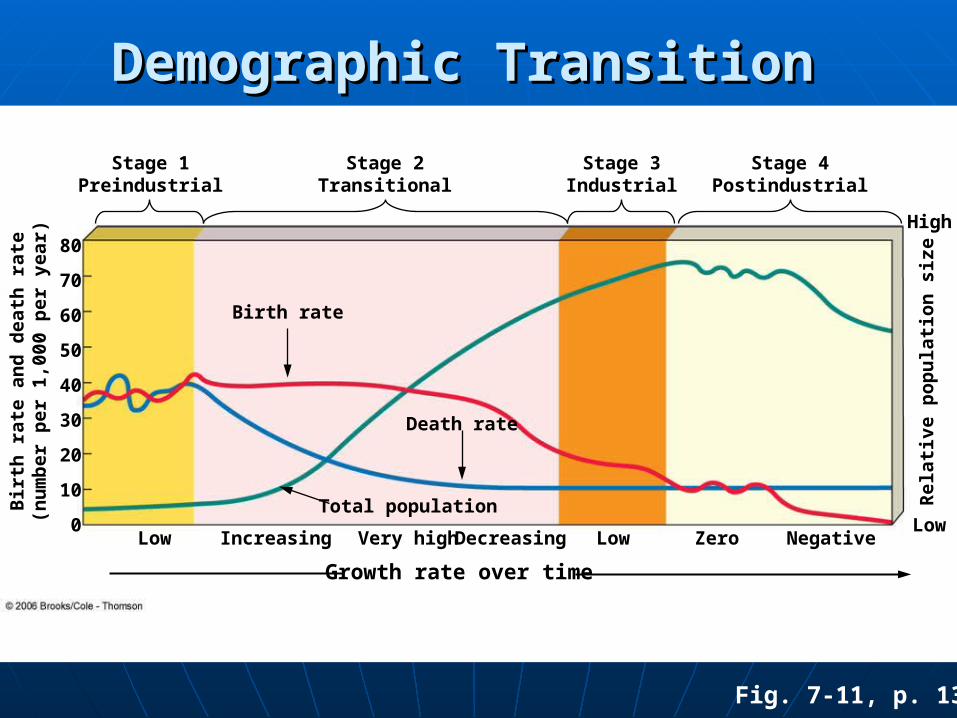
Fig. 7-11, p. 137
Stage 1Preindustrial
Stage 2Transitional
Stage 3Industrial
Stage 4Postindustrial
Low Increasing Very high Decreasing Low Zero Negative
Birth rate
Total population
Death rate
Growth rate over time
Demographic Transition Demographic Transition
Low
High
Rel
ati
ve
po
pu
lati
on
siz
e
Bir
th r
ate
an
d d
eath
rat
e(n
um
ber
per
1,0
00 p
er
yea
r)
0
10
20
30
40
50
60
70
80
Animation- Animation- Demographic transition model

Case Study: Hindrances to Case Study: Hindrances to Family Planning Programs in Family Planning Programs in
IndiaIndia
Poor planning of family planning programsPoor planning of family planning programs
Bureaucratic inefficiencyBureaucratic inefficiency
Low status of womenLow status of women
Extreme povertyExtreme poverty
Lack of administrative and financial supportLack of administrative and financial support

Case Study: Family Planning in Case Study: Family Planning in ChinaChina
Economic incentivesEconomic incentives- - extra food, larger pensions, better housing,extra food, larger pensions, better housing, $$ $$
Free medical care for participantsFree medical care for participants
Preferential treatment for participantsPreferential treatment for participants- free school tuition- free school tuition
Very coercive and intrusiveVery coercive and intrusive- - free sterilization, contraception, free sterilization, contraception,
Human rights violations- Human rights violations- gender imbalance, abortions, infanticidegender imbalance, abortions, infanticide
China’s Pop could peak in 2040, then declineChina’s Pop could peak in 2040, then decline
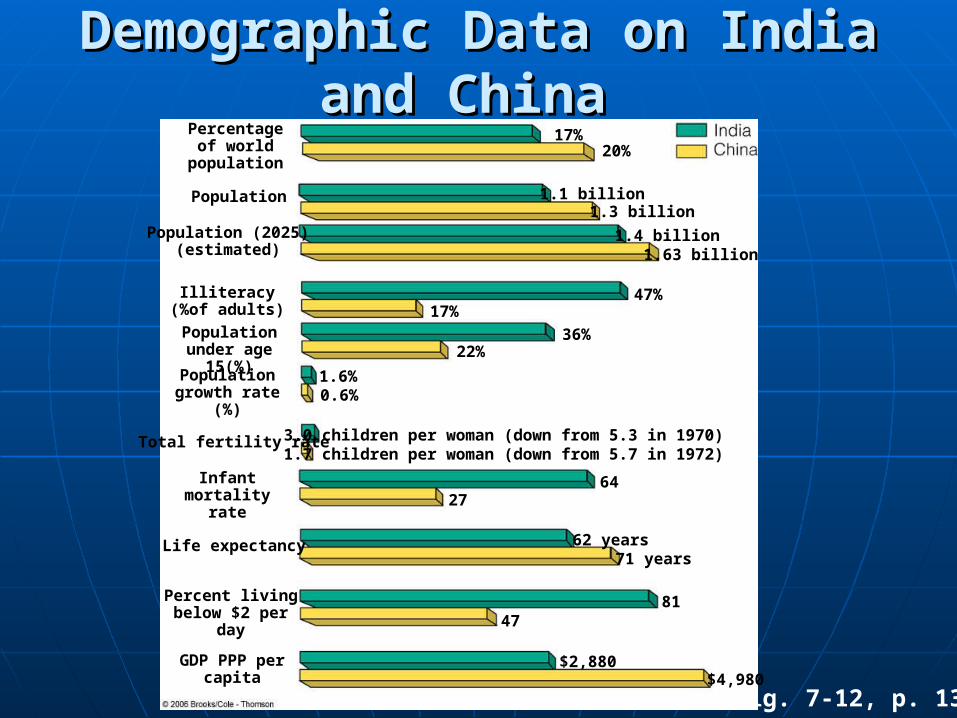
Fig. 7-12, p. 139
Percentageof world
population
Population
Population (2025)(estimated)
Illiteracy (%of adults)
Population under age 15(%)
Population growth rate (%)
Total fertility rate
Infant mortality rate
Life expectancy
GDP PPP per capita
17%20%
1.1 billion1.3 billion
1.4 billion1.63 billion
47%17%
36%22%
1.6%0.6%
3.0 children per woman (down from 5.3 in 1970)1.7 children per woman (down from 5.7 in 1972)
6427
62 years 71 years
$2,880 $4,980
Demographic Data on India and Demographic Data on India and China China
8147
Percent living below $2 per day