Embed Size (px)
Citation preview

Applied Structural Geology – Case Studies of Underground Constructions and Rockslides
Guri Venvik Ganerød
Dissertation for the degree philosophiae doctor (Ph.D.)
The Faculty of Mathematics and Natural Sciences Department of Earth Science
University of Bergen
2008
1

Abstract Ganerød, G.V. 2008: Applied structural geology – case studies of underground constructions and rockslides. Ph.D. thesis, Department of Earth Science, University of Bergen, Norway, pp 210. An understanding of the structural elements in the sub-surface is of great importance when establishing new constructions in bedrock, or surveying areas prone to rockslides. In this thesis the focus has been on combining methods within geology, structural geology, geophysics and engineering geology to reach an interdisciplinary understanding and predict sub-surface structures. Geological feasibility studies for tunnel projects are a good aid to foresee areas of construction problems, such as stability and/or water leakage. With cooperation and advanced use of methods, cost efficiency and reduction in in-situ problem solving may be reached. Landslides have become a center of attention in the recent years, and with the increasing effect of climate changes the need for surveying will enhance. The thesis is based on case studies, where two are concerning tunnel constructions, two are based on the Åknes rockslide in western Norway and one is a laboratory testing of fault rock specimens collected in connection with rockslides. The results are presented in five papers, which form the main part of the thesis. The two first papers concern permeability properties of fault zones and feasibility studies for tunnels. The next three papers concern rockslides in Norway, with a case study from Åknes western Norway, and the influence of faults rocks in the aspect of stability of rockslides.
Paper I: Ganerød, G.V., Braathen, A. and Willemoes-Wissing, B. (Submitted 2007). Predictive Permeability Model of Extensional Faults in Crystalline and Metamorphic Rocks; Verification by pre-Grouting in two sub-sea Tunnels in Norway. In press Journal of Structural Geology, April 2008.
Paper II: Ganerød, G.V., Rønning, J.S., Dalsegg, E., Elvebakk, H., Holmøy, K., Nilsen, B. and Braathen, A. (2006) Comparison of geophysical methods for sub-surface mapping of faults and fracture zones in a section of the Viggja road tunnel, Norway. Bulletin of Engineering Geology and the Environment, 2006. Vol. 65, pg 231-243. DOI 10.1007/s10064-006-0041-6
Paper III: Ganerød, G.V., Grøneng, G., Rønning, J.S., Dalsegg, E., Elvebakk, H., Tønnesen, J.F., Kveldsvik, V., Eiken, T., Blikra, L.H. and Braathen, A. (Submitted 2007) Geological Model of the Åknes Rockslide, Western Norway. In press Engineering Geology, January 2008
Paper IV: Nøttveit, H., Ganerød, G., Grøneng, G. and Braathen, A. (in prep) 3D assessment of effects caused by fault rocks and groundwater using petroleum modeling tools; Åknes rockslide, Western Norway. Submitted to Landslides, February 2008.
Paper V: Henderson, I., Ganerød, G.V. and Braathen, A. (in prep) The relationship between grain characteristics of natural breccias and fault strength: implications for fault rock evolution and rockslide susceptibility. Submitted to Landslides, May 2008.
2

Sammendrag Ganerød, G.V. 2008: Anvendt strukturgeologi – objektstudier av fjellanlegg og fjellskred. PhD oppgave, Institutt for geovitenskap, Universitetet i Bergen, Norge, s 210. Strukturgeologisk kartlegging og forståelse av undergrunnen er et viktig verktøy når nye fjellanlegg skal tilrettelegges, eller områder utsatt for fjellskred skal undersøkes. I denne oppgaven er det fokusert på kombinasjon av eksiterende metoder innenfor geologi, strukturgeologi, geofysikk og ingeniørgeologi for å oppnå et tverrfaglig resultat. Forundersøkelser for tunnelprosjekter har vist seg nyttig i kartlegging av problemsoner, og med økt samarbeid og utbedring av metoder kan en oppnå kostnedeffektivisering og reduksjon av stabilitets- og vannproblematikk. Skred har i den senere tid fått mye fokus, og med økt effekt av klimaendringer, er det et stort behov for kartlegging av områder utsatt for skred. Denne oppgaven er basert på studieobjekt, hvor to angår tunneler, to angår Åknes fjellskred på Vestlandet og en angår analyser av forkastningsbergarter i forbindelse med fjellskred i Norge. Resultatene fra studiet er presentert i artikler som danner hoveddelen av oppgaven. De to første artiklene handler om permeabilitets egenskaper til forkastningssoner og forundersøkelser for tunneler. De tre neste artiklene omhandler fjellskred i Norge, med et studieobjekt representert ved Åknes i Møre og Romsdal, og innvikningen av forkastningsbergarter i forbindelse av stabilitet av fjellskred.
Paper I: Ganerød, G.V., Braathen, A. and Willemoes-Wissing, B. (2008). Predictive Permeability Model of Extensional Faults in Crystalline and Metamorphic Rocks; Verification by pre-Grouting in two sub-sea Tunnels in Norway. På trykk i Journal of Structural Geology, april 2008.
Paper II: Ganerød, G.V., Rønning, J.S., Dalsegg, E., Elvebakk, H., Holmøy, K., Nilsen, B. and Braathen, A. (2006). Comparison of geophysical methods for sub-surface mapping of faults and fracture zones in a section of the Viggja road tunnel, Norway. Bulletin of Engineering Geology and the Environment, 2006. Vol. 65, pg 231-243. DOI 10.1007/s10064-006-0041-6
Paper III: Ganerød, G.V., Grøneng, G., Rønning, J.S., Dalsegg, E., Elvebakk, H., Tønnesen, J.F., Kveldsvik, V., Eiken, T., Blikra, L.H. and Braathen, A. (2008). Geological Model of the Åknes Rockslide, Western Norway. På trykk I Engineering Geology, january 2008
Paper IV: Nøttveit, H., Ganerød, G., Grøneng, G. and Braathen, A. (Submitted). 3D assessment of effects caused by fault rocks and ground water using petroleum modeling tools; Åknes rockslide, Western Norway. Sendt inn til Landslides, februar 2008.
Paper V: Henderson, I., Ganerød, G.V. and Braathen, A. (in prep). The relationship between grain characteristics of natural breccias and fault strength: implications for fault rock evolution and rockslide susceptibility. Sendt inn til Landslides, mai 2008.
3

Preface and Acknowledgement This thesis is the outcome of a Ph. D. scholarship provided through the Geological Survey of Norway (NGU). The educational program is performed in collaboration between NGU and the Department of Earth Science at University of Bergen (UiB). The overall aim of the program is to improve our understanding of structural geology applied to sub-surface interpretation with respect to tunnel construction and rockslides. This focus represents a cross-disciplinary approach to applied sub-surface geology in crystalline and metamorphic rocks, combining knowledge in geology, geophysics and engineering. I was admitted as a Ph.D. student in the spring of 2004. In order to cover all the disciplines comprised in this thesis, several experts were required. My supervisors are Alvar Braathen (UiB, UNIS), Bjørn Nilsen (Norwegian University of Science and Technology, NTNU), Jan Steinar Rønning (NGU), Øystein Nordgulen (NGU) and Jan Cramer (NGU). I have spent my research period at NGU in Trondheim, with exceptions of a 2 ½ months field course at Western Washington University in Bellingham, USA, and a 3 months stay at UNIS, Svalbard. First, I would like to thank all my supervisors during this Ph.D. study, and I would especially like to thank Alvar Braathen, Jan Steinar Rønning and Bjørn Nilsen for fruitful discussions and thorough reviewing of the paper(s). Secondly, a great thanks to NGU who has financed this work. Statens vegvesen (the Norwegian Road Department) provided essential data for two of the studies. The Åknes/Tafjord project and ICG (International Centre of Geohazard) provided the opportunity to work on Åknes rockslide, where I enjoyed good collaboration and companionship in the field. I would also like to thank all my colleagues and friends at NGU and IGB (Institutt for Geologi og Bergteknikk, NTNU). And a special thanks goes to my mother, brother and especially my husband Morgan, whom had to cope with me during this work….
Trondheim, September 2007
Guri Venvik Ganerød
4

Errata
Paper I
Predicative altered to predictive
Page 21: title of paper modified from
Permeability model of extensional faults in metamorphic rocks: verification by pre-grouting in sub-sea tunnels in Norway
to
Predictive Permeability Model of Extensional Faults in Crystalline and Metamorphic Rocks; Verification by pre-Grouting in two sub-sea Tunnels in Norway. Paper V
Missing references
Bruhn, R.L., Parry, W.L., Yonkee, W.A., Thompson, T., 1994. Fracturing and hydrothermal alteration in normal fault zones. Pure and Applied Geophysics, 142, 609-644.
Chester, F.M., Evans, J.P., Biegel, R.L., 1993. Internal structure and weakening mechanisms of the San Andreas Fault. Journal of Geophysical Research, 98, B1, 771-786.
Groshong, R.H., 1988. Low-temperature deformation mechanisms and their interpretation. Geological Society of America Bulletin, 100, 1329-1360.
Handy, M.R., 1989. Deformation regimes and the rheological evolution of fault zones in the lithosphere: the effect of pressure, temperature, grainsize and time. Tectonophysics, 163, 119-152.
Warr, L.N., Cox, S., 2001. Clay mineral transformations and weakening mechanisms along the Alpine Fault, New Zealand. Gological Society, London, Special Publications, 186, 85-101.
Wise, D.U., Dunn, D.E., Engelder, J.T., Geiser, P.A., Hatcher, R.D., Kish, S.A., Odom, A.L., Schamel, S., 1984. Fault-related rocks: suggestions for terminology. Geology, 12, 391-394.
Schmid, S.M., Handy, M.R., 1991. Towards a genetic classification of fault rocks; geological usage and tectonophysical implications. In: Controversies in modern geology;
5

Evolution of geological theories in sedimentology, Earth history and tectonics. Mueller-Daniel-W; McKenzie-Judith-A; Weissert-Helmut (eds.). Acad. Press. London, United Kingdom. 1991. 339-361.
Scholz, 1988 is no longer used as reference and therefore removed.
Sibson 1997a is supposed to be Sibson 1977
Sibson, R.H. 1977. Fault rocks and fault mechanisms. Journal of the Geological Society; 133, 191-213.
Stein, R.S., Aykut A., Dieterich, J.H., 1997. Progressive failure on the North Anatolian fault since 1939 by earthquake stress triggering. Geophysical Journal International 128 594-604.
Stewart et al., 1999 is supposed to be Stewart et al., 2000 as reference below.
Stewart, M., Holdsworth, R.E., Strachan, R.A., 2000. Deformation processes and weakening mechanisms within the frictional-viscous transition zone on major crustal-scale faults: insights from Great Glenn Fault Zone, Scotland. Journal of Structural Geology, 22, 542-560.
Tullis, J., Yund, R.A., 1980. Hydrolytic weakening of experimentally deformed Westerly Granite and Hale Albite rock. Journal of Structural Geology. 2, 4, 439-451.
6

Contents
ABSTRACT …..…………………………………………………………………………………….. 2
SAMMENDRAG …………………………………………………………………………………… 3
PREFACE AND ACKNOWLEDGEMENT ………………………………………………………. 4
ERRATA …………………………………………………………………………………………… 5
CONTENTS ……………………………………………………………………………………….. 7
INTRODUCTION ……………………………………………………………………………………. 9
OBJECTIVES …………………………………………………………………………………
WORK IN PAPERS …………………………………………………………………………..
PAPERS IN THESIS ……………………………………………………………………………… 16
PAPER I ……………………………………………………………………………………16
PAPER II …………………………………………………………………………………… 17
PAPER III ……………………………………………………………………………………18
PAPER IV ……………………………………………………………………………………19
PAPER V …………………………………………………………………………………… 20
DISCUSSION AND FURTHER WORK ………………………………………………………… 21
MAIN RESULTS IN THE THESIS ……………………………………………………………… 26
REFERENCES ……………………………………………………………………………………… 27
PAPER I ………………………………………………………………………………………………29
PERMEABILITY MODEL OF EXTENSIONAL FAULTS IN CRYSTALLINE AND METAMORPHIC ROCKS: VERIFICATION BY PRE-GROUTING IN SUB-SEA TUNNELS IN NORWAY
Guri Venvik Ganerød, Alvar Braathen and Bjørn Willemoes-Wissing
In press Journal of Structural Geology April 2008
PAPER II …………………………………………………………………………………………… 31
COMPARISON OF GEOPHYSICAL METHODS FOR SUB-SURFACE MAPPING OF FAULTS AND FRACTURE ZONES IN A SECTION OF THE VIGGJA TUNNEL, NORWAY
Guri Venvik Ganerød, Jan Steinar Rønning, Einar Dalsegg, Harald Elvebakk, Kristin Holmøy, Bjørn Nilsen and Alvar Braathen
Published in Bulletin of Enginnering Geology and the Environment, 2006. Vol. 65, pp 231-243. DOI: 10.1007/s10064-006-0041-6
7

PAPER III ……………………………………………………………………………………………33
GEOLOGICAL MODEL OF THE ÅKNES ROCKSLIDE, WESTERN NORWAY
Guri Venvik Ganerød, Guro Grøneng, Jan Steinar Rønning, Einar Dalsegg, Harald Elvebakk, Jan Fredrik Tønnesen, Vidar Kveldsvik, Trond Eiken, Lars Harald Blikra and Alvar Braathen
In press Engineering Geology January 2008
PAPER IV ………………………………………………………………………………………… 35
3D ASSESSMENT OF EFFECTS CAUSED BY FAULT ROCKS AND GROUNDWATER USING PERTOLEUM MODELLING TOOLS; ÅKNES ROCKSLIDE, WESTERN NORWAY
Henning Nøttveit, Guri Venvik Ganerød, Guro Grøneng and Alvar Braathen
Submitted to Landslides February 2008
PAPER V …………………………………………………………………………………………… 38
THE RELATIONSHIP BETWEEN GRAIN CHERACTERISTICS OF NATURAL BRECCIAS AND FAULT STRENGTH: IMPLICATIONS FOR FAULT ROCK EVOLUTION AND ROCKSLIDE SUSCEPTIBILITY
Iain H.C. Henderson, Guri Venvik Ganerød and Alvar Braathen
Submitted to Landslides May 2008
APPENDIX ………………………………………………………………………………………… 40
ABSTRACT FOR CONFERENCES
EGU 2007 – Vienna …………………………………………………………………………………
NGF Winter Meeting 2007 – Stavanger …………………………………………………………
AGU Fall Meeting 2006 – San Francisco ………………………………………………………
International Symposium on Stability of Rock Slopes 2006 - South African …………………
NFG Winter Meeting 2005 – Røros ………………………………………………………………
REPORTS
SKB – Swedish Nuclear Fuel and Waste Management Co ……………………………………
Skred – Rockslides …………………………………………………………………………………
Grunnvann – Hydrogeology ………………………………………………………………………
8

Introduction Fluid flow in heterogeneous, fractured bedrock still remains an enigma in geology. In
Norway, where most of the land area consists of metamorphic rocks basically without
primary porosity and permeability, knowledge of the fracture controlled flow system in
rocks is important for the management of infrastructure projects such as underground
constructions, as well as for evaluating rockslides. This field within geology has a vast
potential for further development. Major projects, triggered by nuclear waste programs
(e.g., Sweden, Stanfors et al., 1999, Canada, Serzu et al., 2004), have produced large
amounts of data from underground rock laboratories, however, they have not been able to
come up with universal models for fluid flow in fractured crystalline rocks. Hence,
predictions of fluid flow along fracture systems still remains defiant.
One of the assumptions of fluid flow in hard rock is that fault zones are responsible for
the largest amount of fluid transport in the bedrock (Evans et al., 1997, Gudmundsson
2000, 2001, Gudmundsson et al., 2001). This is based on a general characterisation of
fault zones into a core and surrounding damage zones (Caine et al. 1996), which has been
further divided into distinct fracture sets and systems through the NGU (Geological
Survey of Norway) project - Fracture zones and groundwater in Sunnfjord (1996-1998)
(Braathen & Gabrielsen, 1998, 2000). This project aimed on testing the importance of
fracture systems around large lineaments (faults) in Norwegian bedrock. Extensive
outcrop logging of fracture systems, and detailed studies of numerous fault-cores, were
summarised in a model describing the general architecture of fault zones with
surrounding fracture halos (damage zones), as presented in Braathen and Gabrielsen
(1998, 2000, Figure 1). This model has clear implications for fluid flow, which was
further discussed in Braathen & Gabrielsen (2000). The model divide fault zones into five
classes of different properties; zone A is the fault core consisting of fault rocks that are
assumed to be basically impermeable, zone B represent a part of the fault core solely or
together with zone A, and consists of a high density of short fractures, revealing mainly
porosity. Zone C is characterized by long, parallel fractures and are regarded as the zone
with highest hydraulic conductivity. Zone D is characterized by two sets of long
fractures, which has fairly low permeability due to low fracture frequency and thereby
9

connectivity. Zone E is a transition zone towards background fracturing in the host rock.
During the project period, drilling of 5 inclined wells through faults and a well-field,
yielded results that was supportive of the flow model, however, which were not
conclusive. This thesis pursues this line of studies aiming on new knowledge in our
understanding of faults. Natural laboratories have been tunnel sites and rock slope
failures.
Figure 1. Fault zone model modified after Braathen & Gabrielsen (2000). In this model the fault zone
is divided into five different sections with different characteristics, based on fracture frequency and
orientation, fracture connectivity and fault rock permeability. See the text for further description.
10

Understanding the effects caused by movements in bedrock, either tectonic faults or
sliding planes below rockslides, is commonly addressed through the importance for
enhancing and reducing fluid flow. This subject has been and is extensively studied,
incorporating complex fault zone architectures as well as fracture systems (Caine et al.,
1996, Evans et al., 1997, Odling, 1997, Braathen and Gabrielsen 1998, 2000,
Gudmundsson, 2000, 2001). In order to understand the influence of faults and fracture
zones on hard rock constructions and rockslides several issues need to be addressed.
These relate to methods used to obtain and interpret sub-surface data, interpretation of
sub-surface fault geometries, flow properties of the fault products, the fault rock and
fracture halos, and the general understanding of fault zone architecture.
Objectives
This is a thesis within applied structural geology where the main aim has been to
combine structural geology with geophysical mapping of the sub-surface and engineering
geology data to reach the most comprehensive results for the work and for the cases
studied. The focus has been on the applicability of different methods for data collection
and data quality with respect to the sub-surface problems addressed. In recent years,
NGU (Geological Survey of Norway) has successfully contributed in urban development
projects, such as road and railway tunnel constructions, and landslide projects such as
susceptibility mapping of rockslides. This involvement has improved the access to data
and required that the NGU staff behold crossover knowledge between structural geology
and engineering geology. Furthermore, the outcome of this interdisciplinary study brings
front research results.
In this project, we build on previous ideas and research activity, mainly focusing on fluid
flow in fractured rock. One aim was to further test the permeability properties of fault
zones based on the model by Braathen & Gabrielsen (1998, 2000). In this respect, one
approach to the validation of the flow model is through pre-grouting of tunnels. Cement
injection into the tunnels walls is conducted in order to seal of fracture systems around
the excavation, and thereby avoiding groundwater outburst. In order to do so, we have
11
studied drill cores and tunnel walls of the sub-sea Oslofjord and Frøya tunnels,
classifying different structural zones and describing fault rock types. Fracture frequency
from cores is compared with the production log of injected cement, which reflects the
permeability field of large extensional fault envelopes in crystalline and metamorphic
bedrock. Results from the study of the sub-sea Oslofjord and Frøya tunnels show
correlation between quantities of injected cement and the location of faults, with injection
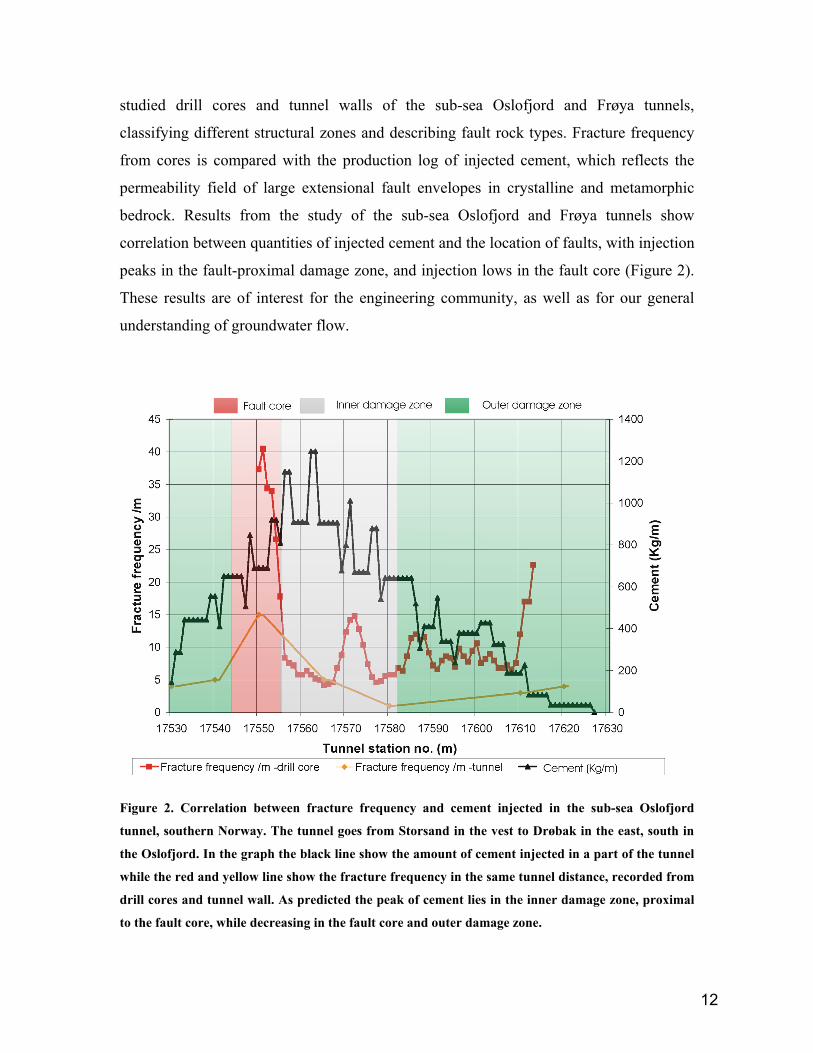
peaks in the fault-proximal damage zone, and injection lows in the fault core (Figure 2).
These results are of interest for the engineering community, as well as for our general
understanding of groundwater flow.
Figure 2. Correlation between fracture frequency and cement injected in the sub-sea Oslofjord
tunnel, southern Norway. The tunnel goes from Storsand in the vest to Drøbak in the east, south in
the Oslofjord. In the graph the black line show the amount of cement injected in a part of the tunnel
while the red and yellow line show the fracture frequency in the same tunnel distance, recorded from
drill cores and tunnel wall. As predicted the peak of cement lies in the inner damage zone, proximal
to the fault core, while decreasing in the fault core and outer damage zone.
12

The scope of feasibility studies is always an issue in tunnel projects. In the case study
from the Viggja tunnel (E39), an aim is to test the most traditional geophysical survey
methods to not so traditional methods, such as seismic, VLF and 2D resistivity profiling,
with respect to sub-surface mapping of structures. Sub-surface responses are further
correlated with borehole information. These data are then compared to structural
mapping, both with remote sensing mapping of lineaments from digital maps and from
outcrop studies in the field. The role of fault architecture with respect to ground water
issues and stability problems is addressed. Field and tunnel observations are correlated
with production logs of water leakage and engineer geological mapping in the tunnel.
These data are then compiled to locate "trouble zones" in the tunnel, where mapping in
the tunnel as well as production data reveal the outcome of the feasibility studies.
Studies of rockslides in Norway indicate that they are commonly structurally controlled
(Henderson et al., 2006). The Åknes rockslide, western Norway, is included as a part of a
large rockslide project where extensive investigations are carried out. Our approach to the
Åknes rockslide, was to combine data from structural mapping, geophysical surveys,
such as seismic, 2D resistivity and GeoRadar, borehole logging, and drill core logging, to
come up with a geological model of the rockslide.
This geological model forms the base for a numerical model built in a reservoir software
(IRAP-RMS). Besides from testing the applicability of such state-of –the-art tools, the
hierarchical approach offered by this software opens a new world when it comes to
assessment of uncertainty. Some of the results have been exported to a flow simulator
(Eclipse) in order to evaluate flow within the rockslide.
Fault rocks, such as breccia and gouge, are of great importance with regards to rockslope
failure; their impermeable nature commonly causes disturbances in groundwater flow,
whereas their relatively low shear strength reduces friction. The last years samples of
13

fault rock have been collected along the sliding surface of rockslides nationwide. These
samples are analysed with wet-sieving for grain size distribution, SEM (Scanning
Electron Microscope) for grain ratio, and ring shear tested for residual shear strength of
the material. Such analyses of fault rocks related to the sliding surfaces of rockslides give
a better understanding of the failure potential of the rockslide and enhance our knowledge
regarding rockslide susceptibility analysis.
This study on fault and fracture systems have also addressed subjects covered by the
following sub-goals:
i) Mapping of structures in the sub-surface with respect to hard-rock construction is an
aid in foreseeing obstacles.
ii) Fault and fracture zones cause a risk of (water) leakage and stability problems, and
understanding the permeability field related to faults will improve the countermeasures.
iii) Comparison of geophysical methods assist in evaluating which method(s) that gives
the best result with respect to mapping of structures in the sub-surface.
iv) Understanding the existing structures in a rockslide area and their role in the
development of displacement.
v) Analysis of fault rock samples helps understand their evolution, and further their
influence on rockslide stability.
vi) The cross-disciplinary resolution presented in this work has an aim of addressing a
multitask challenge, and take into consideration the versatile solution.
14

Work in Papers
As there are two or more co-authors to the papers presented in this thesis, I would like to
specify my contribution to the papers.
• In the first paper (I) I was responsible for the bulk of the writing, research, and
data compilation, whereas Bjørn Willemoes-Wissing did the data collection for
the cores and outcrop study for the Oslofjord tunnel. He also contributed to
editorial reviews. Alvar Braathen contributed with the concept of the study,
background data, logging of the Oslofjord tunnel, and editorial reviews.
• In the second paper (II) I was responsible for the bulk of the writing and research.
The co-authors assisted in fieldwork, data collection and processing, as well as
consultation, and/or provided editorial reviews.
• In the third paper (III) I was responsible for the bulk of the writing and research.
Guro Grøneng contributed with data and figure on displacement, and wrote the
corresponding paragraph. The other co-authors assisted in fieldwork, data
collection and processing, as well as consultation, and/or provided editorial
reviews.
• The fourth paper (IV) is a collaboration between Henning Nøttveit, Guro
Grøneng, Alvar Braathen and me. Henning is responsible for the numeric
modelling of Åknes rockslide, while I have contributed with geological
parameters and geological description of the rockslide. Guro is responsible for
the metrological input data and the analysis of the simulation results. We have all
contributed with equal shares of the writing. Alvar Braathen is the supervisor for
us all, and has contributed with the fundamental idea, guiding and editorial
reviews.
• The fifth paper (V) is written by Iain Henderson. My contribution to the paper is
assistance in the field and lab as well as taking part in the method description for
the lab analysis, figures and editorial reviews. We had an open discussion of
results and scope of the paper.
15

Papers in thesis
Paper I
Predictive Permeability Model of Extensional Faults in Crystalline and
Metamorphic Rocks; Verification by pre-Grouting in two sub-sea Tunnels in
Norway.
Ganerød, G.V., Braathen, A. and Willemoes-Wissing, B.
In press Journal of Structural Geology, April 2008
Abstract
This paper evaluates the permeability model of faults by in situ testing of large-scale extensional faults in igneous and metamorphic bedrock in Norway. The two case studies presented are Oslofjord and Frøya sub-sea tunnels that intersect such large extensional faults. Tunnel injection data reveal a predictive permeability model of faults where the permeability properties can be distinguished in different zones with characteristic fault elements. Permeability zoning relates to the distribution of more or less impermeable fault rocks, as commonly found in the core, and networks of permeable fracture sets of the damage zone. The permeability patterns support a division of the volume affected by the fault, the fault envelope, into sub-zones characterized by fracture distribution and permeability characteristics. Injection of cement (pre-grouting) into the fault envelopes gives systematic, semi-quantitative values for permeability. Further, a correlation between fracture frequency and cement injection in tunnels is present, with an increase in fracture frequency towards the fault core and an increase in cement in fault envelopes compared to areas with background fracturing away from faults. The fault core has injection characteristics nearly as low as the outer damage zone, while the peak of cement injection lies in the inner damage zone, marginal to the fault core. This gives a relative relationship of 1:2:1 between fault core, inner damage zone and outer damage zone of extensional fault envelopes in crystalline rocks. We propose that these data supports a predictive permeability model for faults where the permeability properties can be distinguished in different zones.
16

Paper II
Comparison of geophysical methods for sub-surface mapping of faults and
fracture zones in a section of the Viggja road tunnel, Norway.
Ganerød, G.V., Rønning, J.S., Dalsegg, E., Elvebakk, H., Holmøy, K., Nilsen, B. and
Braathen, A., 2006.
Bulletin of Engineering Geology and the Environment, 2006. Vol. 65, pg 231-243.
DOI 10.1007/s10064-006-0041-6
Abstract
This study focuses on testing different geophysical methods used for feasibility studies
and to reveal their pros and cons. Results from site investigations, 2D resistivity,
refraction seismic and VLF on a section of Viggja tunnel near Trondheim, show that 2D
resistivity data are most valuable for interpreting geological structures in the sub-surface.
VLF only identifies zones and does not indicate thickness, width or dip direction. The
method is also sensitive to technical installations. Refraction seismic is valuable for
mapping depth to bedrock, location and width of fracture zones but cannot indicate the
depth or dip direction of such zones. With 2D resistivity, the position of a zone is well
identified. This method may also provide information on the depth and width of the zone
as well as the dip direction. In most cases 2D resistivity clearly identifies zones in the
bedrock that can be observed as fault and/or fracture zones in the tunnel. The results
described in this paper show a good correlation between the resistivity profiles, mapped
structures on the surface and mapped zones in the tunnel.
17

Paper III
Geological Model of the Åknes Rockslide, Western Norway.
Ganerød, G.V., Grøneng, G., Rønning, J.S., Dalsegg, E., Elvebakk, H., Tønnesen, J.F.,
Kveldsvik, V., Eiken, T., Blikra, L.H. and Braathen, A.
In press Engineering Geology, January 2008
Abstract
This study focuses on structural geology and the usage of geophysical methods to
interpret and understand the structural geometry of the rockslide area. The interpretations
are further used to build a geological model of the site. This is a large rockslide with an
estimated volume of 35-40 million m3 (Derron et al., 2005), defined by a back scarp, a
basal shear zone at about 50 meters depth and an interpreted toe zone where the sliding
surface breaches the surface. The slide is experiencing extension in the upper part and
contraction in the lower part. Structural mapping of the area indicates that the foliation of
the gneiss plays an important role in the development of this rockslide. Both regional and
local folding affects the bedrock in the area. The local, small-scale folds are close to tight
with a short wavelength in the upper part of the slope, while the foliation is more gently
dipping (30-35°) and parallel to the topography further down-slope. The upper boundary
of the rockslide is seen as a back scarp that is controlled by, and parallel to, the pre-
existing, steep foliation planes. Where the foliation is not favourably orientated in regard
to the extensional trend, the back scarp follows an existing fracture set or forms a relay
structure. The foliation seems to control the development of several sliding surfaces in
the subsurface, breaching the surface at different levels. The sliding surfaces are sub-
parallel to the topographic slope and are located to mica-rich layers in the foliation. All
data collected are used to constrain the geometrical and kinematic model of Åknes
rockslide.
18

Paper IV
3D assessment of effects caused by fault rocks and groundwater using
petroleum modeling tools; Åknes rockslide, Western Norway.
Nøttveit, H., Ganerød, G., Grøneng, G. and Braathen, A.
Submitted to Landslide, February 2008
Abstract
In the assessment of stability and slide-dynamics of rock slope failures, the key is
understanding the nature of the basal shear zone (BSZ). Variables include water pressure
and fault rock continuity along the BSZ, since they form important controls on the shear
strength. In this study, state-of-the-art reservoir modeling software, Irap RMSTM and
EclipseTM, is applied to address the effect of the BSZ characteristics on rock slope
stability, the numerical model being based on a real rock slope failure, the Åknes,
western Norway. The objective of this study has been threefold; 1) to test the
applicability of reservoir modeling software for modeling groundwater flow in rock slope
failure problems, 2) to understand the effect of fault rocks along the basal shear zone
(BSZ) on rock slope stability and 3) make some inferences about the stability at Åknes.
Field data from Åknes rockslide have been the input data for the numeric model to
simulate a realistic case study. Results from this study show that 1) the use of reservoir
modeling software has proven highly successful, although there is an upper limit to the
permeability that can be employed (50.000-100.000mD). The software allows for
comprehensive sensitivity testing. 2) The presence of fault rocks along the BSZ
significantly influences the stability of rock slope failures. Fault rocks contribute to lower
the average coefficient of sliding friction and the build-up of water pressure along the
BSZ. And 3) the water flowing through the system influences the stability at Åknes
rockslide by increasing the pore-pressure and thereby reducing the shear strength of the
fault rock material.
19

Paper V
The relationship between grain characteristics of natural breccias and fault
strength: implications for fault rock evolution and rockslide susceptibility.
Henderson, I.H.C., Ganerød, G.V. and Braathen, A.
Submitted to Landslide, May 2008
Abstract
This study focuses on micro-scale characteristic of fault rocks on the Basal Shear Zones
(BSZ’s) of rock slope failures and encompasses analyses from a nationwide study in
Norway. The breccias are a result of block movement on a mm- to 100m scale, below an
overburden of 50-100m of crystalline rocks. We are particularly interested in the
variation of grain characteristics of the different fault breccias and the impact of grain
characteristics on fault strength. Grain-size distribution curves for these samples show a
remarkable variation from grain-supported to matrix-supported, suggesting different fault
rock evolution and breakdown mechanisms. Comparison of ring shear tests demonstrates
that residual shear strength varies from 450-700kPa, corresponding to 40-70m
overburden on top of the BSZ. In most of the field cases this is a critical residual strength
for potential rockslope failure. Grain-supported fault rocks have decidedly higher residual
strength than matrix-supported samples. As the amount of fine material increases, the
residual shear strength of the fault material is reduced. Grain aspect ratio also displays a
remarkable variation in the sample set, possibly suggesting a differences in comminution
mechanism and therefore fault zone evolution. As grain size decreases below 10-20µm,
grain aspect ratio approaches 1:1, suggesting that as the fault rock evolves the grains
become rounder. As aspect ratio increases, fault strength decreases. The strength of these
loose fault rocks underlying potential rockslope failures appears to be dependent on the
microscopic properties of the fault rock. Such analysis should lead to a better
understanding of rockslide potential and enhance our knowledge regarding rockslope
susceptibility analysis.
20

Discussion and further work The thesis covers many methods, and different datasets. In the following, some of the
cross-disciplinary achievements and benefits are discussed. For each subject discussed,
the following section address research challenges and future work.
1. Comparison of geophysical survey methods
Geophysical survey methods such as 2D resistivity, seismics, GeoRadar and VLF (very
low frequency) have been applied for mapping structures in the sub-surface, with respect
to both tunnel construction and rockslides. The results from these surveys are compared,
with respect to the best outcome of structural interpretation. All methods performed in
studies from Viggja tunnel and Åknes rockslide showed similar results by indicating
zones at the same location. However, 2D resistivity profiling gave the best result when it
comes to structural mapping in the subsurface, with a penetration depth that surpass VLF
and GeoRadar, and a degree of details that exceeds seismics. The strength of the 2D
resistivity method is that it can indicate the dip of fault and fracture zones, as well as
detect low angled, undulating surfaces (Papers II and III). Anyhow, it is useful to
combine two or more methods in a study to confirm the presence and character of
structures. Further, different geophysical methods serve different purposes. Seismics is
the traditional method, with application within many fields and is a well-tested method.
Although the studies show clear indications that 2D resistivity profiling is the method
that gives most information of structures in the sub-surface, there is requirement for
further testing of the method. Characterization of mapped zones has still some weakness.
The studies have also shown that to achieve the best results its important to plan the
survey ahead, in order to obtain the best orientation of the profiles with respect to the
structures of interest.
The 2D resistivity method requires further testing especially with regard to different types
of geology and the bedrock mapped. For example, it is not straightforward to differentiate
21

if a low resistivity response (<500Ωm) reflects clay rich material in a fractured rock or
fractured/unfractured rock with high sulphide content. Or does 500-3000 Ωm reflect
fractured bedrock that conducts water, and ≥ 3000 Ωm reflect bedrock with good quality?
Further, can this characterisation with the aid of 2D resistivity responses indicate the core
of the fault zone with densely fractured rock and occurrence of fault rock (clay) (≤ 500
Ωm)? While responses of 500-3000 Ωm indicate the damage zone that has higher
permeability properties than the fault core and host rock, and is responsible for water
leakage.
2. The range of geophysical surveys and the use of boreholes for additional data
The details obtained in geophysical profiles are dependent on the resolution of the data.
High-resolution data are time and cost consuming, and have to be considered with respect
to the aim of the study. Anyhow, boreholes give extra detailed information of the
subsurface from borehole logging and drill cores, which are important for data control
and interpretation (Papers II and III). The borehole should, however, be planned after the
geophysical surveys to obtain the best position and therefore the maximum information
from the data collected. Such boreholes are commonly positioned in or close to a fault or
fracture zone, to establish the characteristics of the zone.
There is still possibility to utilize borehole information with respect to geophysical
surveys. Further, the full potential in geophysical logging and hydrogeological testing in
boreholes has not been exploited. There still is a long way to go before we understand the
complex groundwater system in bedrock.
22
3. Type of faults studied
The faults studies have both local and regional scale, and are set in different times from
the Caledonian mountain building in the Devonian (Roberts and Gee, 1985), to Jurassic
and the Tertiary rifting of the North-Atlantic (Gabrielsen et al., 2002). The range of fault
architecture is large, but mainly at the 100 m scale, with fault envelopes consisting of
wide fault cores containing fault rocks and fracture zones, to cases that lack fault rocks
(Paper I and II). However, for the most fault envelopes studies there is a clearly defined
damage zone with increasing fracture frequency towards the core, and a fault core
consisting of densely fractured rock or fault rock, or a combination of both. This is also
prevailing for the sliding surfaces observed in rockslides, merely the fault envelope is
narrower, commonly with a 2 to 5 meter damage zone and a 0.05 to 0.2 m thick fault core
(Papers III and IV).
In order to see similarities between fault envelopes, data on fault architecture needs to be
compiled and analysed. Further, a comparison of tectonically induced fault envelopes and
sliding surfaces in rockslides will give important information on the development of
rockslides.
4. Permeability in form of groundwater flow in faults
Several faults studied show good indications of groundwater flow in fracture zones or the
damage zone of the fault. This is found for cases where the fractures are long, the fracture
orientation varies and the frequency is high, as well as in cases where there is an absence
of impermeable fault rock. For example in the Viggja tunnel, the largest fault containing
mainly fault rock (gouge) caused stability problems and very low water leakage, while
the largest fracture zone (damage zone) caused water leakage (Paper II). This relation is
also seen in the cement injection data from the Oslofjord and Frøya tunnels, where the
peak of injected cement lies in the damage zone (Paper I). The result of this study shows
23

that there is a relation of relative permeability of 1:2:1 between the outer damage zone,
inner damage zone and the fault core, respectively, in the fault envelopes (Paper I).
Tunnel constructions are a good source for data reflecting the permeability field in large-
scale faulted bedrock. Further in situ permeability testing is required to evaluate the
permeability properties of the sub-zones of fault envelopes. Such permeability testing
with use of cement data in tunnels is also recommended, to further establish the
proportion of cement injected into the sub-zones. An understanding of the permeability
field of faults and fracture zones will give crucial information to tunnel constructors, and
with a tight collaboration between geologist and engineer the most cost efficient and risk
free solution for tunnel construction is believed to be reached. Such data could also be
important for tunnel budgeting.
5. The role of (ground-) water in Åknes rockslide
Precipitation and groundwater is believed to play an important role in the aspect of
stability for Åknes rockslide. A build up in groundwater and therefore pore-pressure
along the sliding surface may trigger a slip along the zone. Rockslides are commonly
gravity driven slope failures, controlled by pre-existing structures (Braathen et al., 2004),
which have topography with gradient. In addition, the unstable rock mass is blocky with a
high fracture frequency. This setting gives a natural drive to the water in the system, and
as water samples have show, the retention period is short compared to groundwater
cycles. Given the nature of the rockslide, with regards to Åknes in particular,
precipitation and surface water can easily flow into the unstable rock mass and reach the
sliding surface, which likely consists of a more or less discontinuous, impermeable fault
rock membrane. The presence of impermeable fault rock will lead to a build up of water
column and pore pressure, which increases the risk of slope failure (Paper IV). Hence, a
full comprehension of the groundwater system of the area is crucial for predicting a
trigger of the rockslide.
24

A more thorough understanding of the ground water network and its influence on the
sliding surfaces is required. This can be accomplished by tracer testing, pump-testing of
boreholes and hydraulic modelling of the system. Several hydrogeologic studies are
ongoing at Åknes, and the challenge is to compile all collected data into one
comprehensive model.
6. Fault rock strength and the influence of (ground-) water
Clay rich material (fault rocks) play an important role in the stability of landslides
(Shuzui, 2001). Groundwater or run off water that reaches the material promotes
formation of smectite, which has a tremendous effect on the stability of the slope since it
has a low frictional resistance (Shuzui, 2001). Therefore, analyses for fault rocks,
commonly found along the sliding surface, give crucial information on understanding the
evolvement of such material and their influence on rock slope failure. Ring shear tests on
fault rock can be used to find the residual strength of the different types of material,
reflecting that the most mature fault rocks (gouge) have the lowest residual strength and
therefore are most likely to cause instability (Paper V). With a buildup in fluid pressure
along the sliding surface consisting of fault rocks, the shear strength will be reduces,
which may induce rock slope failure (Zhang and Wang, 2007).
Another aspect is to evaluate the importance of groundwater and fluid pressure for the
sliding surface, with respect to slope failure. In order to do so, monitor of seasonal and/or
temporal change in groundwater level at Åknes through borehole surveillance is needed.
A further aspect is to compare temporal changes in groundwater level with discharge in
springs and creeks of the area, to calculate expected pressure difference in the fault rock
membrane at the sliding surface.
25

Main results in the thesis Main conclusions reached in this thesis are:
• For a large-scale predictive model for crystalline and/or metamorphic rock, cement injection correlate with fracture mapping. This documents a permeability zoning of fault envelopes.
o This study shows that the highest permeability property lies in the inner damage zone, proximal to the fault core, with a ratio in injected cement close to 2:1 with the fault core.
o The fault core shows a drop relative to its surroundings in cement injected, and has a ratio close to 1:1 with the outer damage zone.
• For feasibility studies for tunnels the geophysical method 2D resistivity showed the best results in mapping structures in the sub-surface, compared to seismic and VLF.
o The 2D resistivity method is an electrical method, which indicates the realistic width of the zone as well as the dip.
o To achieve best results of the 2D resistivity method it is important to plan the orientation of the profiles with regards to the structures of interest.
o To reach the best result of the profiling a structural mapping of the area, regional and local, in advanced of data collection is important.
• Structurally controlled rockslides are the most common type occurring in Norway according to classification. This classification is valid for the Åknes rockslide.
o At Åknes rockslide the foliation of the bedrock is controlling the development of the back scarp. The back scarp follows the foliation where it is favourable orientated, or form a relay structure between foliation parallel structures.
o The bedrock foliation also controls the development of the sliding surfaces, which are sub-parallel to the topographic slope and mappable down-slope.
• Geophysical methods, such as 2D resistivity, seismics and borehole logging, are used to constrain the depths to the sliding surfaces and to understand the lateral, undulating character of them.
• The hydrological aspect of a rockslide is complex, and in an attempt to evaluate the influence of (ground-) water flow on the stability of the Åknes rockslide, numeric modelling is done.
o Fault rocks contribute to lower the average coefficient of sliding friction, and the build-up of water pressure along the basal shear zone.
• Fault rock properties such as grain size distribution and grain shape has influence on the shear strength of the material. The study shows that finer, more mature fault rocks, such as gouge, have lower residual strength than immature fault rocks such as breccia.
26

References
Braathen & Gabrielsen, 1998: Lineament architecture and fracture distribution in metamorphic and sedimentary rocks, with application to Norway. NGU Rapport no. 98.043, pp 79.
Braathen, A. & Gabrielsen, R.H., 2000: Bruddsoner i Fjell – Oppbygning og Definisjoner. Gråsteinen 7, Norges geologiske undersøkelse.
Braathen, A., Blikra, L.H., Berg, S., Karlsen, F. (2004). Rock-slope failures of Norway; types, geometry, deformation mechanisms and stability. Norwegian Journal of Geology 84, (1), pp 67-88
Caine, J.S., Evans, J.P. & Froster, C.B., 1996: Fault zone architecture and permeability structure. Geology 24, pp 1025-1028.
Evans, J.P., Forster, C.B., Goddard, J.V., 1997. Permeability of fault-related rocks, and implications for hydraulic structure of fault zones. Journal of Structural Geology 19, pp 1393-1404
Gabrielsen, R.H., Braathen, A., Dehls, J., Roberts, D., 2002. Tectonic lineaments of Norway. Norwegian Journal of Geology (NGT) 82, 153-174
Gudmundsson, A., 2000. Active fault zones and groundwater flow. Geophysical Research Letter 27, (18) pp 2993-2996
Gudmundsson, A., 2001. Fluid overpressure and flow in fault zones; field measurements and models. Tectonophysics 336, (1-4) pp183-197
Gudmundsson A., Berg S.S, Lyslo K.B., Skurtveit E., 2001. Fracture networks and fluid transport in active fault zones. Journal of Structural Geology 23, (2-3) pp 343-353
Henderson, I.H.C., Saintot, A., Derron, M.H. (2006). Structural mapping of potential rockslide sites in the Storfjorden area, western Norway: the influence of bedrock geology on hazard analysis. NGU report no. 2006.052, pp 1-82
Odling, N.E., 1997. Scaling and connectivety of joint systems in sandstone from western Norway. Journal of Structural Geology 19, (10) pp 1257-1271
Roberts, D., Gee, D.G., 1985. An introduction to the structures of the Scandinavian Caledonides. In Gee, D.G., & Sturt, B.A. (Ed.), Caledonide Orogen – Scandinavia and Related Area. John Wiley & Sons, London
Serzu, M.H., Kozak, E.T., Lodha, G.S., Everitt, R.A., Woodcock, D.R., 2004. Use of borehole radar techniques to characterize fractured granitic bedrock at AECL’s Underground Research Laboratory. Journal of Applied Geophysics 55, pp 137– 150
27

Shuzui, H., 2001. Process of slip-surface development and formation of slip-surface clay in landslides in Tertiary volcanic rocks, Japan. Engineering Geology 61, pp 199-219
Stanfors, R., Rhén, I., Tullborg, E.-L., Wikberg, P., 1999. Overview of geological and hydrogeological conditions of the AÈ spoÈ hard rock laboratory site. Applied Geochemistry 14, pp 819-834
Zang, D., Wang, G., 2007. Study of the 1920 Haiyuan earthquake-induced landslide in loess (China). Engineering Geology. doi: 10.1016/j.enggeo.2007.07.007
28
Paper I
Predictive Permeability Model of Extensional Faults in Crystalline and
Metamorphic Rocks; Verification by pre-Grouting in two sub-sea Tunnels,
Norway.
Guri Venvik Ganerød, Alvar Braathen and Bjørn Willemoes-Wissing
In press Journal of Structural Geology, April 2008
29
UNCORRECTEDPROOF
Predictive permeability model of extensional faults in crystallineand metamorphic rocks; verification by pre-grouting in two sub-seatunnels, Norway
Guri Venvik Ganerød a,b,*, Alvar Braathen b,c, Bjørn Willemoes-Wissing a
a Geological Survey of Norway, 7491 Trondheim, Norwayb Department of Earth Science, University of Bergen, 5007 Bergen, Norwayc Department of Geology, University Centre in Svalbard, 9171 Longyearbyen, Norway
a r t i c l e i n f o
Article history:Received 5 October 2007Received in revised form 1 April 2008Accepted 1 April 2008Available online xxx
Keywords:PermeabilityExtensional faultsFault zonesFracture distributionCement injectionSub-sea tunnels
a b s t r a c t
This paper link quantitative fault zone descriptions, qualitative fracture and fault rock properties, andengineering data in the study of the permeability structure of fault zones. Datasets include scan-lines,drill cores and cement pre-grouting from two sub-sea tunnels in gneissic and granitic rocks, from whichsystematic pre-grouting volumes can be used to analyse the in-site relative permeability both in hostrocks and fault zones. Major extensional faults intersected by the tunnels reveal common fault rockssurrounding intensively fractured rock lenses in the core. Fracture frequencies in these lenses can reach100 fractures/metre (f/m). In the bounding damage zones, networks of fracture sets make up an innerzone of fairly high frequency (20–30 f/m) of fault-parallel, long fractures connected by shorter fractures.An outer zone has lower frequencies (<20 f/m) and more diverse fracture orientations and lengths. Thereis a general increase in fracture frequency from the background level of the protolith towards the faultcore.Tunnel-scale injection of cement reveals patterns that can be ascribed to the impact of faulting; there isan increase in cement injection in fault zones compared to areas with background fracturing away fromfaults. In detail, there is an innate division of the rock volume into sub-zones characterized by distinctstructural style and permeability, with a background level and three fault related sub-zones (fault core,inner damage zone, and outer damage zone). Injection data shows that the background sub-zonecommonly can be injected with less than 0.05 m3 cement per metre tunnel (commonly not injected),whereas the fault core has permeability characteristics nearly as low as the outer damage zone, repre-sented by 0.1–0.2 m3 cement per metre tunnel, with occasional peaks towards 0.5 m3. The maximum ofcement injection lies in the inner damage zone, marginal to the fault core, with 0.3–0.7 m3 cement permetre tunnel, locally exceeding 1 m3. This gives a relative relationship for cement injection of approxi-mately 1:2:1 between fault core, inner damage zone, and outer damage zone of extensional fault zones incrystalline and metamorphic rocks.
2008 Elsevier Ltd. All rights reserved.
1. Introduction
Faults represent a challenge in all type of engineering projects,especially in tunnels and quarries, because of increased fracturedensity, weak rocks, poor rock stability, and enhanced fluid flow(e.g., Hoek and Bray, 1981; Hoek, 2000; Nilsen and Palmstrøm,2000; Blindheim and Øvstedal, 2002). In sedimentary basins, faultsare often analysed due to sealing capacity of gas, oil, and
groundwater (e.g., Manzocchi et al., 2008). Faults also representa major hazard to mankind, in that they locate repeated earth-quakes that can be devastating, for example seen along the SanAndreas Fault (Chester et al., 1993; Chester and Chester, 1998; Evansand Chester, 1995). Earthquakes magnitude and reoccurrence arelinked to fault core mechanical strength (Chester et al., 1993). Thesesubjects have promoted significant attention around faults, withfocuses spanning from fault arrays and displacement fields (e.g.,Walsh et al., 2003a,b), to intrinsic fault geometry and fault archi-tecture (e.g., Chester et al., 1993; Caine et al., 1996; Braathen et al.,2004; Collettini and Holdsworth, 2004), and into the realm offrictional behaviour, linked to mechanical and chemical processes(Sibson, 1986, 2000; Holdsworth et al., 1999; Braathen et al., 2004).Major faults truncate a significant part of the crust, and will reveal
* Corresponding author: Geological Survey of Norway, Underground Construc-tion, Leiv Erikssons vei 39, 7491 Trondheim, Norway. Tel.: þ47 7390 4313; fax: þ477392 1620.
E-mail address: [email protected] (G.V. Ganerød).
Contents lists available at ScienceDirect
Journal of Structural Geology
journal homepage: www.elsevier .com/locate/ jsg
ARTICLE IN PRESS
0191-8141/$ – see front matter 2008 Elsevier Ltd. All rights reserved.doi:10.1016/j.jsg.2008.04.001
Journal of Structural Geology xxx (2008) 1–12
SG2137_proof 26 April 2008 1/12
Please cite this article in press as: Guri Venvik Ganerød et al., Predictive permeability model of extensional faults in crystalline and metamorphic<..., Struct. Geol. (2008), doi:10.1016/j.jsg.2008.04.001
1
2
3
4
5
6
7
8
9
10
11
12
13
14
15
16
17
18
19
20
21
22
23
24
25
26
27
28
29
30
31
32
33
34
35
36
37
38
39
40
41
42
43
44
45
46
47
48
49
50
51
52
53
54
55
56
57
58
59
60
61
62
63
64
65
66
67
68
69
70
71
72
73
74
75
76
77
78
79
80
81
82
83
84
85
86
87
88
89
90
91
92
93
94
95
96
97
98
99
100
101
102
103
104
105
106
107
108
109
30
Paper II
Comparison of geophysical methods for sub-surface mapping of faults and
fracture zones in a section of the Viggja road tunnel, Norway
Guri Venvik Ganerød, Jan Steinar Rønning, Einar Dalsegg, Harald Elvebakk, Kristin
Holmøy, Bjørn Nilsen, and Alvar Braathen
Published in Bulletin of Engineering Geology and the Environment, 2006. Vol. 65,
pg 231-243. DOI 10.1007/s10064-006-0041-6
31

Guri Venvik Ganerød
Jan Steinar Rønning
Einar Dalsegg
Harald Elvebakk
Kristin Holmøy
Bjørn Nilsen
Alvar Braathen
Comparison of geophysical methodsfor sub-surface mapping of faultsand fracture zones in a section of the Viggjaroad tunnel, Norway
Received: 4 July 2005Accepted: 8 February 2006Published online: 26 April 2006 Springer-Verlag 2006
Abstract Results from site investi-gations, 2D resistivity, refractionseismic and VLF on a section oftunnel near Trondheim, show that2D resistivity data are most valuablefor interpreting geological structuresin the sub-surface. VLF only identi-fies zones and does not indicatethickness, width or dip direction.The method is also sensitive totechnical installations. Refractionseismic is valuable for mappingdepth to bedrock, location andwidth of fracture zones but cannotindicate the depth or dip direction ofsuch zones. With 2D resistivity, theposition of a zone is well identified.This method may also provideinformation on the depth and widthof the zone as well as the dip direc-tion. In most cases 2D resistivityclearly identifies zones in the bed-rock that can be observed as faultand/or fracture zones in the tunnel.The results described in this papershow a good correlation between theresistivity profiles, mapped struc-tures on the surface and mappedzones in the tunnel.
Keywords Site investigations ÆFeasibility studies Æ Geophysicalmethods Æ 2D resistivity Æ Tunnels
Resume Les resultats de reconnais-sances geophysiques par les meth-odes de resistivite 2D, de refraction
sismique et d’electromagnetismeVLF, sur une section de tunnel presde Trondheim, montrent que laresistivite 2D est la plus interessantepour la reconnaissance des struc-tures geologiques de sub-surface. Lamethode VLF differencie unique-ment des zones sans en donner lescaracteristiques d’epaisseur, de larg-eur et direction de pendage. Lamethode est par ailleurs influenceepar les installations techniques. Lasismique refraction est interessantepour cartographier la profondeur dusubstratum, identifier les zones frac-turees et leur largeur, mais ne peutindiquer leurs epaisseurs et direc-tions de pendage. La methode desresistivites 2D permet de bien local-iser ces zones. De plus, la methodefournit les informations de largeur,d’epaisseur et de direction de pend-age. Dans la plupart des cas, laresistivite 2D a identifie clairementles zones de substratum reconnuescomme zones de fractures ou de fa-ille dans le tunnel. Les resultatspresentes dans cet article montrentune bonne correlation entre lesprofils de resistivite, les structurescartographiees en surface et les zonescartographiees en tunnel.
Mots cles Reconnaissancesde terrain Æ Etudes de faisabilite ÆMethodes geophysiques ÆResistivite 2D Æ Tunnels
Bull Eng Geol Env (2006) 65: 231–243DOI 10.1007/s10064-006-0041-6 ORIGINAL PAPER
G. V. Ganerød (&) Æ J. S. RønningE. Dalsegg Æ H. ElvebakkGeological Survey of Norway,7491 Trondheim, NorwayE-mail: [email protected].: +47-73-904313Fax: +47-73-921620
G. V. GanerødInstitute of Earth Science,University of Bergen,5007 Bergen, Norway
K. Holmøy Æ B. NilsenDept. of Geology and Mineral ResourcesEngineering, Norwegian Universityof Science and Technology,7491 Trondheim, Norway
A. BraathenCenter for Integrated Petroleum Research,University of Bergen,5007 Bergen, Norway
32

Paper III
Geological Model of the Åknes Rockslide, western Norway
Guri Venvik Ganerød, Guro Grøneng, Jan Steinar Rønning, Einar Dalsegg, Harald
Elvebakk, Jan Fredrik Tønnesen, Vidar Kveldsvik, Trond Eiken, Lars Harald Blikra and
Alvar Braathen
In press Engineering Geology, January 2008 http://dx.doi.org/10.1016/j.enggeo.2008.01.018
33

UNCO
RREC
TEDPR
OOF
1 Geological model of the Åknes rockslide, western Norway
2 Guri Venvik Ganerød a,b,⁎, Guro Grøneng c,d, Jan Steinar Rønning a,c, Einar Dalsegg a, Harald Elvebakk a,3 Jan Fredrik Tønnesen a, Vidar Kveldsvik c,d,e, Trond Eiken f, Lars Harald Blikra d,g, Alvar Braathen h
4 a Geological Survey of Norway (NGU), 7491 Trondheim, Norway5 b Department of Earth Science, University of Bergen, Norway6 c Norwegian University of Science and Technology (NTNU), Norway7 d International Centre for Geohazards (ICG), Norway8 e Norwegian Geotechnical Institute (NGI), Norway9 f Department of Geosciences, University of Oslo, Norway10 g Stranda Municipality, Norway11 h University Centre in Svalbard, Norway
12
a r t i c l e i n f o15 a b s t r a c t
Article history:Received 16 May 2007Received in revised form 25 January 2008Accepted 30 January 2008Available online xxxx
21 Åknes is known as the most hazardous rockslide area in Norway at present, and is among the most22 investigated rockslides in the world, representing an exceptional natural laboratory. This study focuses on23 structural geology and the usage of geophysical methods to interpret and understand the structural geometry24 of the rockslide area. The interpretations are further used to build a geological model of the site. This is a large25 rockslidewith an estimated volume of 35–40millionm3 [Derron, M.H., Blikra, L.H., Jaboyedoff, M. (2005). High26 resolution digital elevation model analysis for landslide hazard assessment (Åkerneset, Norway). In Senneset,27 K., Flaate, K. & Larsen, J.O. (eds.): Landslide and avalanches ICFL 2005 Norway, Taylor & Francis Group, London.],28 defined by a back scarp, a basal shear zone at about 50 m depth and an interpreted toe zone where the sliding29 surface daylights the surface. The rockslide is divided into four sub-domains, experiencing extension in the30 upper part and compression in the lower part. Structural mapping of the area indicates that the foliation of the31 gneiss plays an important role in the development of this rockslide. The upper boundary zone of the rockslide32 is seen as a back scarp that is controlled by, and parallel to, the pre-existing, steep foliation planes. Where the33 foliation is not favourably orientated in regard to the extensional trend, the back scarp follows a pre-existing34 fracture set or forms a relay structure. The foliation in the lower part, dipping 30° to 35° to S–SSE, seems to35 control the development of the basal sliding surface with its subordinate low angle trusts surfaces, which36 daylights at different levels. The sliding surfaces are sub-parallel to the topographic slope and are located37 along mica-rich layers in the foliation.38 Geophysical surveys using Ground Penetrating Radar (GPR), refraction seismic and 2D resistivity profiling,39 give a coherent understanding of undulating sliding surfaces in the subsurface. The geophysical surveys map40 the subsurface in great detail to a depth ranging from 30–40 m for GPR to approximately 125 m for refraction41 seismic and 2D resistivity profiling. This gives a good control on the depth and lateral extent of the basal42 sliding surface, and its subordinate low angle thrusts. Drill cores and borehole logging add important43 information with regard to geological understanding of the subsurface. Fracture frequency, fault rock44 occurrences, geophysical properties and groundwater conditions both in outcrops and/or drill cores constrain45 the geometrical and kinematic model of Åknes rockslide.
© 2008 Published by Elsevier B.V.
Keywords:RockslideGeological and structural modelGeophysical surveys
52
53
54 1. Introduction
55 Unstable rock slopes pose a threat to the inhabitants along Nor-56 wegian fjords, where prehistoric and historic rock avalanches have57 created tsunamis, some causing severe casualties (Blikra et al., 2005a).58 The site presented, Åknes, is located inwestern Norway (Fig. 1). This is a59 large rockslide with an estimated volume of 35–40 million m3 (Derron
60et al., 2005), defined by a back scarp, a basal shear zone at 50 m depth61and a toe zone where the basal sliding surface daylights the surface.62Continuous creep of the rock mass and the fact that Åknes is situated63above the fjord and in the vicinity of several communities aswell as one64ofNorway'smost visited tourist attractions (theGeirangerfjord, listed on65the UNESCO's World heritage list), have triggered a comprehensive66investigation program. The overall aim of the project is firstly, to assess67the likelihood that the rockslidewill accelerate into a rock avalancheand68secondly, to establish an earlywarning systemwith directmonitoring of69deformation (translationand rotation), so that the local communities are70able to evacuate in time.
Engineering Geology xxx (2008) xxx–xxx
⁎ Corresponding author. Geological Survey of Norway (NGU), 7491 Trondheim,Norway. Tel.: +47 73 91 43 13; fax: +47 73 92 16 20.
E-mail address: [email protected] (G.V. Ganerød).
ENGEO-02764; No of Pages 18
0013-7952/$ – see front matter © 2008 Published by Elsevier B.V.doi:10.1016/j.enggeo.2008.01.018
Contents lists available at ScienceDirect
Engineering Geology
j ourna l homepage: www.e lsev ie r.com/ locate /enggeo
ARTICLE IN PRESS
Please cite this article as: Ganerød, G.V., et al., Geological model of the Åknes rockslide, western Norway, Engineering Geology (2008),doi:10.1016/j.enggeo.2008.01.018
34

Paper IV
3D assessment of effects caused by fault rocks and ground water using petroleum
modeling tools; Åknes rockslide, Western Norway.
Henning Nøttveit, Guri Venvik Ganerød, Guro Grøneng, and Alvar Braathen
Submitted to Landslides, February 2008
35

3D assessment of effects caused by fault rocks and groundwater using
petroleum modeling tools; Åknes rockslide, Western Norway
Henning Nøttveita, b, Guri Venvik Ganerødc, b, Guro Grønengd, e & Alvar Braathenf, a, b
a) Centre for Integrated Petroleum Research (CIPR), University of Bergen, Norway b) Department of Earth Science, University of Bergen, Norway c) Geological Survey of Norway (NGU), 7491 Trondheim, Norway. d) Norwegian University of Science and Technology (NTNU) e) International Centre for Geohazards (ICG) f) University Centre in Svalbard (UNIS), Norway * Comm. author. Email: [email protected], phone: +47 55583396, fax: +47 55588265. Abstract When assessing stability and slide-dynamics of rock slope failures, the key is to understand the nature of the basal shear zone (BSZ). Variables include water pressure and fault rock continuity along the BSZ, which form important controls on the total shear strength by reducing the effective normal stress and the average coefficient of friction, respectively. In this study, state-of-the-art reservoir modeling software, Irap RMSTM and Eclipse 100TM, is applied to evaluate the effect of the BSZ characteristics on rock slope stability of the Åknes rockslide in Møre and Romsdal County in Western Norway.
Variables such as rock shear strength and fault rock hydraulic conductivity are well constrained by statistically robust data sets. Other variables, e.g. fault rock continuity and in-situ hydraulic conductivity for the unstable rock masses, the BSZ and the bedrock, are typically less easily constrained as they are less easy to measure and highly case specific. In order to quantify the effect of these critical variables, reservoir modeling software was used to carry out and analyze a comprehensive series of model scenarios. This is particularly interesting in the assessment of rock slope failure problems, where experience show that, with time, collapse is generally inevitable. The results show that the fault rock continuity along the BSZ is a crucial parameter for the stability of rock slope failures, both in its own, by reducing the average coefficient of friction, but also as a membrane facilitating build-up of water pressure. Fault rock continuity also affects subsequent water pressure decline following an event of water pressure build-up. The effects become significant as fault rock continuity exceeds 30-50%. In the modeled case of Åknes, the steep angle of the BSZ (35o) suggests a very high sensitivity with regard to fault rock continuity. The critical average coefficient of friction in the absence of water pressure is estimated to 0.7, whereas the maximum estimated value is 0.85. This implies that the critical water pressure for which the slope-
36

failure becomes unstable is 2 bars at most. In this respect, the numerical modeling suggests that a fault rock continuity of only 30% may cause the slope-failure to overcome critical sliding friction. The numerical modeling also points towards the potential for hazardous water pressures developing during extreme conditions, with rapid melting of large amounts of snow combined with continuous heavy rainfall. Keywords: numerical modeling, rock slope failure, basal shear zone, fault rocks, water pressure build-up.
37

Paper V
The relationship between grain characteristics of natural breccias and fault
strength: implications for fault rock evolution and rockslide susceptibility.
Iain H.C. Henderson, Guri Venvik Ganerød and Alvar Braathen
Submitted to Landslides, May 2008
38

The relationship between grain characteristics of natural breccias and fault strength: implications for fault rock evolution and rockslide susceptibility.
Iain H.C. Henderson1, Guri Venvik Ganerød1, 2 & Alvar Braathen3
1Geological Survey of Norway, Leif Eirikssons Vei 39, 7491 Trondheim, Norway. 2Department of Earth Science, University of Bergen, Norway. 3The University Centre in Svalbard, Postboks 156, 9171 Longyearbyen, Norway. Corresponding author: [email protected]
Abstract
Microstructural analysis of fault-rock breccias along the Basal Shear Zone (BSZ) of potential rock-slope failures in Norway demonstrates that grain-size distribution curves show a spectrum from grain- to matrix-supported. Variation in residual shear strength from 450 to 700kPa is directly related to grain-size and shape characteristics. We contend that these characteristics are dependent on the fault-rock evolution and breakdown mechanism and demonstrate this with ‘simulated’ examples. Grain-supported fault-rocks have higher residual strength than matrix-supported samples. As the amount of fine material increases, the residual shear strength of the fault material decreases. Grain aspect ratio is variable suggesting different comminution mechanisms and fault-zone evolution. As grain size decreases below 10-20µm, grain aspect ratio approaches 1:1, suggesting that as the fault-rock evolves the grains become rounder. As aspect ratio increases, fault strength decreases. Thus the susceptibility of potential rock-slope failures depends partly on the microscopic properties of the underlying fault-rocks.
Keywords: microstructural analysis, fault-rocks, rock-slope susceptibility
39

Appendix
40

Abstracts for conferences
EGU 2007 Vienna
Geophysical Research Abstracts, Vol. 9, 08262, 2007 SRef-ID: 1607-7962/gra/EGU2007-A-08262 © European Geosciences Union 2007 Permeability Model of Extensional Faults in Metamorphic Rocks; Verification by Pre-Grouting in sub-sea Tunnels G. V. Ganerød (1), A. Braathen (2) and B. Willemoes-Wissing (1) (1) Geological Survey of Norway, (2) University Studies in Svalbard, Norway [email protected] Fault models predict a zoned permeability in fault zones. In general, a low permeability fault core is surrounded by a more permeable damage zones towards pristine, lower permeable host rocks (Caine et al. 1996; Evens et al. 1997). We present two case studies of faults in metamorphic and magmatic/crystalline rocks with neglectable primary porosity, in which tunnels-scale injection of cement document consistent permeability contrasts within faults. Permeability zoning relates to the distribution of more or less impermeable fault rocks in the core, and networks of open fracture sets of the damage zone. The permeability patterns support a division of the fault into sub-zones characterised by distinct fracture populations and fracture characteristics (Braathen & Gabrielsen 2000; Braathen et al. 1998; Evens et al. 1997; Caine et al. 1996). An orderly description of fault rocks is reached through the classifications presented in Braathen et al. (2004). In light of the resolution of our injection dataset, we merge these fault sub-zones into three parts, namely (i) extended core, (ii) inner damage zone, and (iii) outer damage zone. The established permeability characteristics come from large extensional faults truncated by sub-sea tunnels. In these tunnels, injection of cement into the faults (pre-grouting) gives semi-quantitative data for permeability and porosity. These data are compared with tunnel and drill core data, which document that the extended fault core consistently in all faults shows a drop in injection volumes compared to the damage zone. The core has injection characteristics close to the host rock outside the fault, while the peak of cement injection lies in the inner damage zone. The study indicates that there is good correlation between fracture frequency and cement injection in tunnels. The fracture frequency and injection volume increase towards the core of the fault and the fault core is commonly nearly impermeable if it contains fault gouge or clay. This demonstrates that fracture frequency obtained during site investigations could found the basis for calculating required cement masses, which can be used to predict the cement mass and thereby improve the budgeting of a tunnel project.
41

References
Braathen, A., Osmundsen, P.T. & Gabrielsen, R.H. 2004: Dynamic development of fault rocks in a crustal-scale detachment: An example from western Norway, 23, TC 4010, pp: 1-21, DOI: 10.1029/2003TC001558
Braathen, A. & Gabrielsen, R.H. 2000: Bruddsoner i fjell - oppbygning og definisjoner, Gråsteinen nr: 7 (in norwegian)
Braathen, A., Gabrielsen, R.H., Henriksen, H., Lothe, A., Midtbø, E., Midtgård, A.K., Berg, S., Lyslo, K. & Skurtveit, E. 1998: Lineament architecture and distribution in metamorphic and sedimentary rocks, with application to Norway, Norges geologiske undersøkelse NGU Report 98.043, 78
Caine, J.S., Evans, J.P. & Forster, C.B. 1996: Fault zone architecture and permeability structure, 24, 11, pp: 1025-1028
Evens, J.P., Forster, C.B. & Goddard, J.V. 1997: Permeability of fault-related rocks, and implications for hydraulic structure of fault zones, 19, pp: 1393-1404
42
Geophysical Research Abstracts, Vol. 9, 07812, 2007 SRef-ID: 1607-7962/gra/EGU2007-A-07812 © European Geosciences Union 2007 A Geological Model based on Structural Interpretations of Multidisciplinary data from the Åknes Rockslide, Western Norway Guri1 Venvik Ganerød, Einar Dalsegg1, Harald Elvebakk1, Jan Steinar Rønning1 and Lars Harald Blikra2
1) Geological Survey of Norway (NGU), 7491 Trondheim, Norway 2) Stranda kommune, Møre og Romsdal [email protected]
Åknes is known as the most hazardous potential rockslide area in Norway at present times. It is one of the most investigated rockslide areas in the world and an exceptional natural laboratory. The main aim for Stranda municipality where the area is situated is to establish a state of readiness for if and when the potential rockslide will evolve into a rock avalanche. This project, called the Åknes/ Tafjord project, has been ongoing since 2004 and involves many participants and aspects in geohazard. This study focuses is on structural geology and the usage of geophysical methods to interpret and understand the structural geometry of the rockslide area. The Åknes rockslide is located in the Western Gneiss Region. Structural mapping of the area indicate that the foliation of the gneiss play an important role in the development of this potential rockslide. Both regional and local folding have developed in the area. The local, small-scale folds are close to tight with short wavelength in the upper part of the slope, while the foliation is gentler dipping (30-35°) and parallel to the topography further down-slope. The development of the main back fracture is controlled by and parallel to the pre-existing, steep foliation planes. Where the foliation is not favourably orientated in regard to the extensional trend the back fracture follows an existing fracture set or forms a relay structure. The foliation also controls the development of several sliding surfaces. These crop out at least at two levels and have been mapped down-slope. Fault rocks occur along sliding planes, indicating activity along the planes. The sliding surfaces are sub-parallel to the topographic slope and along mica-rich layers in the foliation, thus increasing the hazard risk 357 Braathen, A. 2004;477 Henderson, I.H.C. 2006; . Geophysical surveys using 2D resistivity, GeoRadar (GPR) and refraction seismic give an coherent understanding of undulating sliding surfaces in the sub-surface, which crop out at different levels of the slope 485 Rønning, J.S. 2006; . The surface geophysics map the subsurface in great detail to a depth from 30-40 meters for GPR to ~125 meters depth for 2D resistivity. This gives a good control on the depth and lateral extend of the sliding surfaces. Drill cores and borehole monitoring give important information in regards to geological understanding of the sub-surface. Fracture frequency, fault rock occurrence, geophysical properties and ground water conditions have been mapped.
43
Further work that needs to be addressed: The exact location of the sliding surfaces could be found through borehole monitoring. A more thorough understanding of the ground water network and its influence on the sliding surfaces is also required.
References
Braathen, A., Blikra, L.H., Berg, S., Karlsen, F., 2004. Rock-slope failures of Norway; types, geometry, deformation mechanisms and stability. Norwegian journal of geology 84, (1) 67-88
Henderson, I.H.C., Saintot, A., Derron, M.H., 2006. Structural mapping of potential rockslide sites in the Storfjorden area, western Norway: the influence of bedrock geology on hazard analysis. NGU report 2006.052, 1-82
Rønning, J.S., Dalsegg, E., Elvebakk, H., Ganerød, G.V., Tønnesen, J.F., 2006. Geofysiske målinger Åknes og Tafjord, Stranda og Nordal kommune, Møre og Romsdal. NGU rapport 2006.002, 1-66
44
NGF Winter meeting 2007 - Stavanger
NGF Abstract and proceedings of the Geological Society of Norway. Number 1, 2007 Vinterkonferansen Stavanger 8-10 January A Geological Model of Åknes Based on Multidisciplinary Studies to a Better Understanding of Large Potential Rockslides in western Norway Guri1 Venvik Ganerød, Einar Dalsegg1, Harald Elvebakk1, Jan Steinar Rønning1 and Lars Harald Blikra2
1) Geological Survey of Norway (NGU), 7491 Trondheim, Norway 2) Stranda kommune, Møre og Romsdal and International Centre for Geohazards [email protected]
Åknes is known as the most hazardous potential rockslide area in Norway at present times. It is one of the most investigated rockslide areas in the world and an exceptional natural laboratory. The main aim for Stranda municipality where the area is situated is to establish a state of readiness for if and when the potential rockslide will evolve into a rock avalanche. This project, called the Åknes/ Tafjord project, has been ongoing since 2004 and involves many participants and aspects in geohazard. This study focuses is on structural geology and the usage of geophysical methods to interpret and understand the structural geometry of the rockslide area.
The Åknes rockslide is located in the Western Gneiss Region and both regional and local folding has developed in the area. Structural mapping of the area indicate that the foliation of the gneiss play an important role in the development of this potential rockslide. The local, small-scale folds are close to tight with short wavelength in the upper part of the slope, while the foliation is gentler dipping (30-35°) and parallel to the topography further down-slope. The development of the back fracture is controlled by and parallel to the pre-existing, steep foliation planes. Where the foliation is not favourably orientated in regard to the extensional trend the back fracture follows an existing fracture set or forms a relay structure. The foliation also controls the development of several sliding surfaces. These crop out at least at two levels and have been mapped down-slope. Fault rocks occur along sliding planes, indicating activity along the planes. The sliding surfaces are sub-parallel to the topographic slope and along mica-rich layers in the foliation, thus increasing the hazard risk (Braathen et al., 2004, Henderson et al., 2006).
Geophysical surveys using 2D resistivity, GeoRadar (GPR) and refraction seismic give a coherent understanding of undulating sliding surfaces in the sub-surface, which crop out at different levels of the slope (Rønning et al., 2006). The surface geophysics map the subsurface in great detail to a depth from 30-40 meters for GPR to ~125 meters depth for 2D resistivity. This gives a good control on the depth and lateral extend of the sliding surfaces. Drill cores and borehole monitoring give important information in regards to geological understanding of the sub-surface. Fracture frequency, fault rock occurrence, geophysical properties and ground water conditions have been mapped.
45

Further work that needs to be addressed: The exact location of the sliding surfaces could be found through borehole monitoring. A more thorough understanding of the ground water network and its influence on the sliding surfaces is also required. References Braathen, A., Blikra, L.H., Berg, S., Karlsen, F., 2004. Rock-slope failures of Norway; types, geometry, deformation mechanisms and stability. Norwegian journal of geology 84, (1) 67-88 Henderson, I.H.C., Saintot, A., Derron, M.H., 2006. Structural mapping of potential rockslide sites in the Storfjorden area, western Norway: the influence of bedrock geology on hazard analysis. NGU report 2006.052, 1-82 Rønning, J.S., Dalsegg, E., Elvebakk, H., Ganerød, G.V., Tønnesen, J.F., 2006. Geofysiske målinger Åknes og Tafjord, Stranda og Nordal kommune, Møre og Romsdal. NGU rapport 2006.002, 1-66
46

AGU Fall Meeting 2006 San Francisco
Geological Model of Potential Rockslide Based on Structural Mapping, Surface Geophysical Data and Borehole Logging at Åknes, Western Norway Guri Venvik Ganerød, Einar Dalsegg, Harald Elvebakk, Jan Steinar Rønning and Lars Harald Blikra Geological Survey of Norway (NGU), 7491 Trondheim, Norway [email protected]
Unstable rock slopes possess a threat to the inhabitants along Norwegian fjords, where pre-historic and historic rock avalanches have caused tsunamis, some causing severe casualties (Blikra et al. 2005). The presented site, Åknes, is a large potential landslide of minimum 30 - 45 million m3 rock mass. Continuous creep of the rock mass and the fact that Åknes is situated in the vicinity of one of Norway's most visited tourist attractions – the Geiranger fjord, listed on the UNESCO`s World heritage list, have triggered a comprehensive mapping program. The overall aim is to assess the likelihood that the landslide accelerates into a rock avalanche. The potential landslide area at Åknes has been mapped by structurally mapped in detailed, whereas subsurface data come from 2D resistivity, Ground Penetrating Radar (GRP), refraction seismics, core drillings and geophysical logging of the boreholes. In symphony, these data give a detailed 3D geological model of the area, in which the depth to – and the geometry of the basal slide surface(s) can be identified. A grid of 2D resistivity profiles indicate an undulating slide surfaces that can be followed from the large tension fracture in the back to the foot of the mapped slide area. Geophysical borehole logging including resistivity, water conductivity, gamma ray of bedrock, and sonic log are consistent with the properties of the bedrock found in the 2D resistivity profiles and in the drill cores. When correlated with drill cores, the sliding surfaces coincide well with intensely fractured bedrock and layers of fault rocks, such as gouge and breccia. Fracturing along the foliation of the host rock in combination with reactivation of fracture sets controls sub-block sizes as well as the pattern of movement, the latter consistent with a wedge failure model. Trends of fractures follow major trends of lineaments in the area, of which the most pronounced lineaments coincide with major fjords. The importance of fracturing along the foliation in the bedrock can be seen by the geometry of the back fracture. This composite structure is steep to sub vertical, but changes along strike as the foliation is folded. Farther down-slope, the foliations dips moderately towards the fjord and has an undulating geometry. There, the developed subsurface sliding plane shows a similar geometry, basically being sub parallel to the topographic slope. In a regional context, it has been documented that rockslides are more common where the foliation is sub parallel to the slope (Henderson et al. 2006).
47

Through the locating of the sliding surface of the rockslide, a precise estimate of the volume is possibly. Further, it opens for a better understanding of the sliding mechanism(s) of the area. New work, such as borehole monitoring, will contribute to locating the sliding surface more precisely and yield additional quantified data regarding spatial and temporal sliding velocities. The aim of the project is to achieve a state of readiness with direct monitoring of movement, so that the local communities are able to evacuate in time.
References:
Blikra, L.H., Longva, O., Harbitz, C. & Løvholt, F. 2005: Qualification of rock-avalanche and tsunami hazard in Storfjorden, western Norway. In Senneset, K., Flaate, K. & Larsen, J.O. (eds.): Landslide and Avalanches ICFL 2005 Norway, Taylor & Francis Group, London.
Henderson, I.H.C., Saintot, A. & Derron, M.H. 2006: Structural mapping of potential rockslide sites in the Storfjorden area, western Norway: the influence of bedrock geology on hazard analysis, NGU report 2006.052, pp: 1-82
48

The South African Institute of Mining and Metallurgy International Symposium on Stability of Rock Slopes Vidar Kveldsvik, Trond Eiken, Guri V Ganerød, Guro Grøneng and Nicole Ragvin
EVALUATION OF MOVEMENT DATA AND GROUND CONDITIONS FOR THE ÅKNES ROCK SLIDE
Mr V Kveldsvik, Norwegian Geotechnical Institute, Mr T Eiken, University of Oslo,
Ms G V Ganerød, Geological Survey of Norway, Ms G Grøneng, Norwegian University of Science and Technology, Ms N Ragvin, Norwegian University of Science and
Technology
ABSTRACT
Catastrophic rock slope failures have caused destructive tsunamis in Norwegian fjords. At the Åknes rock slope the tsunami generating potential is large due to the potential large volume involved in a possible catastrophic failure. Widening of the upper crack has been recorded since 1986, and in recent years, a quite extensive investigation and monitorin campaign has been conducted. Data from some of these investigations are presented and analysed with respect to a preliminary evaluation of the stability of the slope. 1 INTRODUCTION
Large rock slides represent one of the most serious natural hazards in Norway, as exemplified by the Tafjord disaster of 1934 when 2 – 3 million m3 rock mass and scree material dropped into the fjord (Jørstad, F. 1968). The tsunami generated by the slide reached a maximum of 62 m above sea level, and several villages were destroyed. 41 people were killed by the tsunami. In the 20th century 175 people lost their lives in three such events in the region of northern West Norway (Tafjord 1934 and Loen 1905 and 1936, Figure 2).
Figure 1. Index map showing the location of the area in Figure 2.
Figure 2. Locations of historical rock slides in the county of Møre og Romsdal. Skafjellet (year 1731), Tjellefjellet (1756), Loen (1905 and 1936) and Tafjord (1934) generated destructive tsunamis killing 224 people. At Åknes, a tsunami generating slide is feared.
Page 1 49
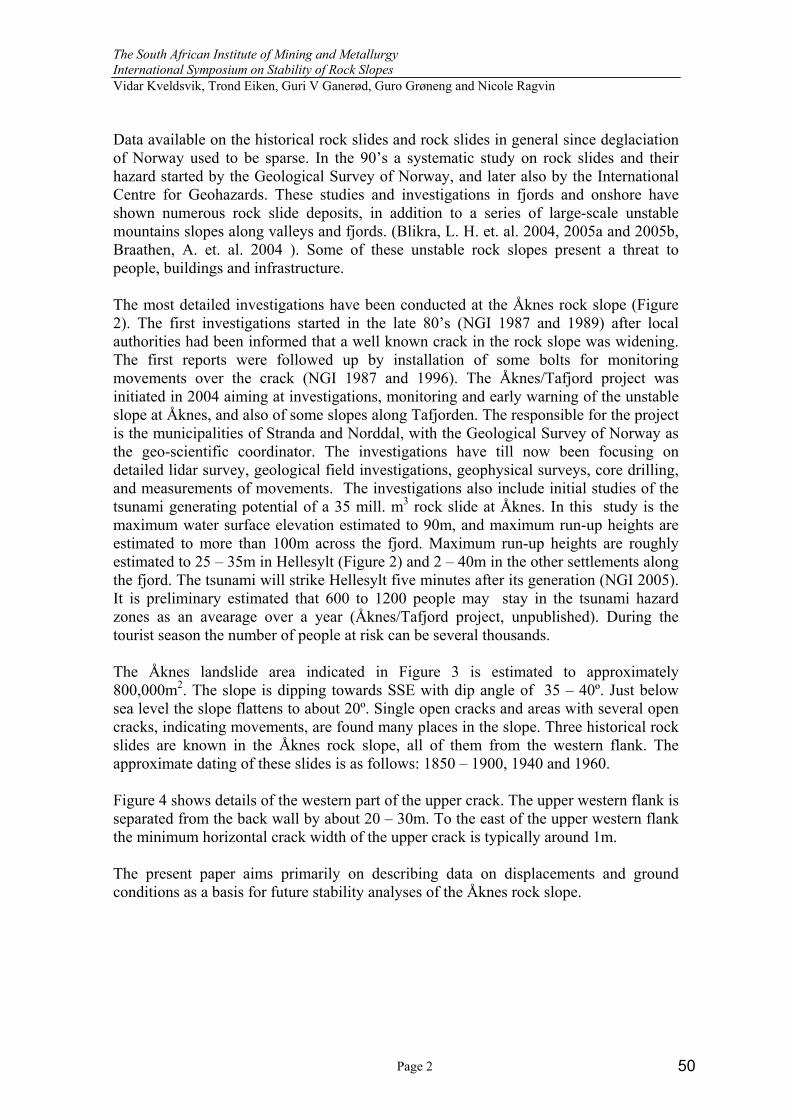
The South African Institute of Mining and Metallurgy International Symposium on Stability of Rock Slopes Vidar Kveldsvik, Trond Eiken, Guri V Ganerød, Guro Grøneng and Nicole Ragvin Data available on the historical rock slides and rock slides in general since deglaciation of Norway used to be sparse. In the 90’s a systematic study on rock slides and their hazard started by the Geological Survey of Norway, and later also by the International Centre for Geohazards. These studies and investigations in fjords and onshore have shown numerous rock slide deposits, in addition to a series of large-scale unstable mountains slopes along valleys and fjords. (Blikra, L. H. et. al. 2004, 2005a and 2005b, Braathen, A. et. al. 2004 ). Some of these unstable rock slopes present a threat to people, buildings and infrastructure. The most detailed investigations have been conducted at the Åknes rock slope (Figure 2). The first investigations started in the late 80’s (NGI 1987 and 1989) after local authorities had been informed that a well known crack in the rock slope was widening. The first reports were followed up by installation of some bolts for monitoring movements over the crack (NGI 1987 and 1996). The Åknes/Tafjord project was initiated in 2004 aiming at investigations, monitoring and early warning of the unstable slope at Åknes, and also of some slopes along Tafjorden. The responsible for the project is the municipalities of Stranda and Norddal, with the Geological Survey of Norway as the geo-scientific coordinator. The investigations have till now been focusing on detailed lidar survey, geological field investigations, geophysical surveys, core drilling, and measurements of movements. The investigations also include initial studies of the tsunami generating potential of a 35 mill. m3 rock slide at Åknes. In this study is the maximum water surface elevation estimated to 90m, and maximum run-up heights are estimated to more than 100m across the fjord. Maximum run-up heights are roughly estimated to 25 – 35m in Hellesylt (Figure 2) and 2 – 40m in the other settlements along the fjord. The tsunami will strike Hellesylt five minutes after its generation (NGI 2005). It is preliminary estimated that 600 to 1200 people may stay in the tsunami hazard zones as an avearage over a year (Åknes/Tafjord project, unpublished). During the tourist season the number of people at risk can be several thousands. The Åknes landslide area indicated in Figure 3 is estimated to approximately 800,000m2. The slope is dipping towards SSE with dip angle of 35 – 40º. Just below sea level the slope flattens to about 20º. Single open cracks and areas with several open cracks, indicating movements, are found many places in the slope. Three historical rock slides are known in the Åknes rock slope, all of them from the western flank. The approximate dating of these slides is as follows: 1850 – 1900, 1940 and 1960. Figure 4 shows details of the western part of the upper crack. The upper western flank is separated from the back wall by about 20 – 30m. To the east of the upper western flank the minimum horizontal crack width of the upper crack is typically around 1m. The present paper aims primarily on describing data on displacements and ground conditions as a basis for future stability analyses of the Åknes rock slope.
Page 2 50

The South African Institute of Mining and Metallurgy International Symposium on Stability of Rock Slopes Vidar Kveldsvik, Trond Eiken, Guri V Ganerød, Guro Grøneng and Nicole Ragvin
Figure 3. Overview of the Åknes rock slope. The white dotted line indicates the contour of the landslide (slightly modified after Derron, M.-H., et.al. 2005). The length of the “top scarp”/upper crack is about 700m measured from west to east. Numbers show approximate dates of known rock slides.
Figure 4. Details of the upper crack. The minimum horizontal crack width at the right hand side of the photo and further towards east (to the right) is typically around 1m
approx. 20m
1850-1900
1960
1940
2 DISPLACEMENTS
2.1 Across the upper crack
The first three extensometers for automatic reading were installed in 1993. Each extensometer is fixed in solid rock at both sides of the upper crack and it measures the distance between these fixed points. Measurement takes place once a day through 40 readings in a short period of time of which the mean value is stored in a computer as the recorded value. The extensometer monitoring programme was extended with two more extensometers in 2004. The locations of the extensometers are shown in Figure 5. The monitoring results are shown in Figure 6 and 7. Figure 8 shows the results of manual measurements which started in 1986. The manual measurements were carried out by measuring manually the distance between fixed bolts on each side of the upper crack with a measuring rod.
Page 3 51

The South African Institute of Mining and Metallurgy International Symposium on Stability of Rock Slopes Vidar Kveldsvik, Trond Eiken, Guri V Ganerød, Guro Grøneng and Nicole Ragvin
Figure 5. Ortophoto of the Åknes Landslide area. The extensometers along the upper crack are marked with circles and numbers (Nos.1 – 5). A detail of Ext 5 is shown. Locations of core borings are marked with triangles. (U = upper, one boring, M = middle, two borings and L = lower, one boring).
Ext 5
~270m
Page 4 52

The South African Institute of Mining and Metallurgy International Symposium on Stability of Rock Slopes Vidar Kveldsvik, Trond Eiken, Guri V Ganerød, Guro Grøneng and Nicole Ragvin
Figure 6. Displacements at the upper crack. Extensometer readings from 1993-08-28 to 2005-11-25. Ext 3b is a replacement of Ext 3a which was destroyed. Ext 3b is aligned more parallel to the slope movement than Ext 3a, which means that Ext 3b picks up a larger portion of the movement.
Figure 7. Displacements at the upper crack. Extensometer readings from 2004-11-25 to 2005-11-25.
Page 5 53

The South African Institute of Mining and Metallurgy International Symposium on Stability of Rock Slopes Vidar Kveldsvik, Trond Eiken, Guri V Ganerød, Guro Grøneng and Nicole Ragvin
Figure 8. Displacements at the upper crack. Manual measurements from 1986-08-26 to 2004-06-22. With reference to Figure 5 Mp 1 is placed 10m east of Ext 1, Mp 3 is placed a few metres east of Ext 1, and Mp 2, Mp 4a and Mp 4b are placed a few metres west of Ext 4. Figure 9 sums up the displacement in terms of mean displacement per year for all the measuring locations at the upper crack. The recorded values have been adjusted to an assumed direction of slope movement. This adjustment should not be regarded as a “correct” adjustment, but is believed to give a better comparison of the results than the measured values since some of the measuring directions are quite oblique to the assumed direction of movement, meaning that they only pick up a fragment of the real displacement. The mean values of the adjusted values for all measuring locations are 21.7mm/year, in the westernmost part 25mm/year and in the eastern part 17.8mm/year. Ext 5 in particular draws down the mean value of the eastern area. Ext 5 is located about 30m west of the point where upper crack dies out as a clearly visible open crack. From Figures 6 – 8 it is clear that the displacements at the upper crack go on with an overall steady pace. Some periods with faster movements and some periods with slower movements can be identified, but there is no general tendency of acceleration or deceleration. It may be noted that some places, near the upper crack, narrow cracks sub-parallel to the upper crack, exist . Up to now, these cracks have not been monitored, but their existence shows that the total displacement in the upper part of the slide area is somewhat larger than shown in Figures 6 – 9.
Page 6 54

The South African Institute of Mining and Metallurgy International Symposium on Stability of Rock Slopes Vidar Kveldsvik, Trond Eiken, Guri V Ganerød, Guro Grøneng and Nicole Ragvin
Figure 9. Displacements at the upper crack in terms of mean values per year. The assumed direction of movement is N157°/35° (dip direction/dip angle), which is sub-parallel to the slope itself. Ext 3a was in operation up to 2003-01-22. Ext 3b was put into operation 2004-11-25 at almost the same location as 3a, but aligned more parallel to the assumed direction of movement. 2.2 At the slope surface
2.2.1 Measuring methods
Several methods are used for measuring movements in the slope: GPS, total station, radar and photogrammetry. This paper presents some main results of the photogrammetry. The photogrammetry covers a period of 43 years. 2.2.2 The photogrammetric method
Photogrammetric studies have been conducted for the periods 1961 – 1983 and 1983 – 2004. Aerial photographs of the scale 1:15000 of 1961 and 1983 were used to make elevation models (Digital Terrain Model) and orthophotos of pixel size 20cm by use of software from ZI-Imaging. For 2004 an orthophoto produced by FUGRO was used. On the orthophotos points that appeared identical have been located, i.e. mainly rock blocks. The coordinates of the apparently identical points have been used to calculate possible displacement vectors. For the 1961 and 1983 aerial photographs the coordinate system was identical. The 2004 orthophoto refers to a different coordinate system, which made it necessary to establish a transformation between apparently identical points in the 1983 and 2004 orhophotos. This transformation routine was established by use of points in the border area of the area covered by the orthophotos. At these points the displacements were presumed equal to or close to zero. Since points at the slope surface are compared, the photogrammetric method does not distinguish between movements that take place just below the slope surface, e.g. solifluction, and surface movements that are a caused by movements at deeper levels in the slope. The accuracy of the method is estimated to be 0.5m.
Page 7 55

The South African Institute of Mining and Metallurgy International Symposium on Stability of Rock Slopes Vidar Kveldsvik, Trond Eiken, Guri V Ganerød, Guro Grøneng and Nicole Ragvin 2.2.3 Results
93 points were analysed in the period 1961 – 1983, of which 62 points showed displacement larger than 0.5m. 122 points were analysed in the period 1983 – 2004, of which 73 points showed displacement larger than 0.5m. Table 1 sums up the results for the two periods based on points that showed displacement larger than 0.5m. Table 1. Displacements derived from photogrammetric studies. Values are given as cm/year, that is the total displacement over the whole period divided by the number of years. Period Mean Median Maximum Variation
coefficient (%)
1961 – 1983 Magnitude 6.4 cm/year 4.6 cm/year 17.0 cm/year 63 1983 – 2004 Magnitude 5.9 cm/year 5.8 cm/year 13.6 cm/year 46 1961 – 1983 Dip direction N202º N189º 33 1983 – 2004 Dip direction N192º N188º 45 Table 1 indicates that the displacement rates on average have been quite stable from 1961 to 2004. It should be noted that displacement measured over the upper crack (Figure 9) are smaller or near the accuracy of the photogrammetric method. In other words; the numbers in Table 1 are almost entirely derived from points that have moved more than upper crack has widened. The results of the photogrammetric studies reflect mostly (but not only) displacements that have taken place in the upper western part of the landslide area, with the largest displacements taking place in the western flank. The other measuring methods (GPS, total station and radar) all demonstrate that the largest movements take place in the western flank, and that the movements are in the order of 10cm per year.
2.3 Evaluation of stability based on displacement rates
Catastrophic failure of creeping slopes is associated with an acceleration phase before the catastrophic failure (e.g. Petley, D. N. et. al. 2002, Kilburn, C. R. J. and Petley, D. N. 2003, Crosta, G. B. and Agliardi, F. 2003). According to idealized creep behaviour the tertiary, accelerating, creep phase, is preceded by a primary, or strain hardening phase, and a secondary steady phase. Use of this idealized creep behaviour on the Åknes rock slope indicates that the rock slope in general must be in the steady (secondary) phase, or perhaps in the primary phase. This implies that there is still some time before a possible catastrophic collapse of the slope. If, or when, the slope will start accelerating is the big question. An extended and improved monitoring programme will be implemented at Åknes for the purpose of an early warning system, and treshold values for different parts of the slope have to be established. 3 GROUND CONDITONS
3.1 Rock types
The general picture from mapping the rock outcrops in the area is that three gneiss variants exist, namely granitic gneiss (pink with dark minerals), dioritic gneiss (light
Page 8 56

The South African Institute of Mining and Metallurgy International Symposium on Stability of Rock Slopes Vidar Kveldsvik, Trond Eiken, Guri V Ganerød, Guro Grøneng and Nicole Ragvin grey with dark minerals) and biotitic gneiss (dark). The granitic gneiss may appear both as massive rock and as quite dense jointed along the foliation. The dioritic gneiss appears as massive, and the biotitic gneiss appears as weak layers with dense jointing along the foliation. A quite typical picture of the rock outcrops is illustrated in Figure 10 which shows general massive rock, and layers with dense jointing along the foliation. The foliation joint spacing may be less than 10cm in some places. The granitic gneiss is dominating in three of the four diamond drilled boreholes; the exception is Borehole L1 (Figure 5) where the dioritic gneiss makes up the largest portion of the rock core. A summary of the rock type distribution is given in Table 2. It should be noted that the rock type classification in Table 2 has been simplified with respect to the original core log where the rock type is described by meter: One single meter rock core may in some cases include three sections of rock, for instance two sections with granitic gneiss separated by a section of biotitic gneiss. In such cases the rock type has been classified as granitic gneiss.
Figure 10. Rock outcrops. Left: dense jointing along the foliation. Right: dense jointing along the foliation with more massive rock above. Table 2. Distribution of rock types in the boreholes Borehole No.
Length (m)
Inclination Granitic gneiss (GG) (%)
Dioritic gneiss (DG) (%)
Biotitic gneiss (BG) (%)
BG/GG and
BG/DG3)
U1 162 Vertical 49.4 22.8 19.8 6.8 M11) 149 60°2) 57.7 2.7 29.5 8.7 M21) 151 Vertical 43.0 13.9 27.8 13.2 L1 150 Vertical 16.2 42.6 33.8 5.4 1) M1 and M2 are spaced apart only a few metres. 2) Drilled nearly perpendicular to the slope. 3) Biotitic gneiss in combination with granitic gneiss or dioritic gneiss. In addition to the rock types listed in Table 2, there are about 1 – 2 % dioritic gneiss in combination with granitic gneiss in the four boreholes. The biotite content in the three rock types has been estimated by visual judgement during logging. The mean biotite content based on all estimates are as follows: 35 % for granitic gneiss, 41 % for dioritic gneiss and 62 % for biotitic gneiss. Probably, this variation of the weak mineral biotite, can explain some of the variation in uniaxial compressive strength (UCS) for the three rock types which have the following mean values: 162MPa for granitic gneiss (23 tests), 134MPa for dioritic gneiss (9 tests) and 113MPa for biotitic gneiss (16 tests).
Page 9 57

The South African Institute of Mining and Metallurgy International Symposium on Stability of Rock Slopes Vidar Kveldsvik, Trond Eiken, Guri V Ganerød, Guro Grøneng and Nicole Ragvin 3.2 Discontinuities
3.2.1 Data collection
Mapping of discontinuities has been carried out by the following methods: measurement of the orientation and spacing of discontinuities in the rock outcrops, core logging and by structural analysis of the Digital Elevation Model (DEM). The structural analysis by DEM is performed by Derron, M.-H., et. al. (2005) for the upper and middle part of the assumed landslide area (the lower part is covered with vegetation), with most data from the upper part. The field mapping has focused on the typical conditions at each location, which particularly for the foliation and foliation parallel joints means that some data are left out; namely the quite large variation that exist at some locations due to small scale folding. The diamond drilled boreholes have mainly intersected the foliation. Joints that are not parallel to the foliation are generally quite steep as registered by the field mapping, and these joints have been intersected only to a small extent, due to steep inclination of the boreholes. Since the attempt to orientate the cores during drilling was unsuccessful, orientation data could only be measured in the three vertical boreholes in form of dip angles of the foliation. The foliation dip angles were measured metre by metre in the three boreholes by the following procedure: If it was concluded by visual inspection that the foliation was overall consistent over the metre, one measurement was done. If variations were detected by the visual inspection two measurements were done trying to capture the minimum and maximum values. 3.2.2 Orientation
All orientation data are given as dip direction and dip angle in degrees unless otherwise is assigned. Derron, M.-H., et.al. (2005) identified three joint sets in the upper part of the landslide area by structural analysis of the DEM (Figure 11). The mean orientations of the joint sets are: J1-N180/45 (foliation parallel joints), J2-260/70 and J3-050/50. Derron, M.-H., et. al. (2005) compared this to field mapping of joints along and near the upper crack and found a fairly good agreement (Figure 12).
Page 10 58

The South African Institute of Mining and Metallurgy International Symposium on Stability of Rock Slopes Vidar Kveldsvik, Trond Eiken, Guri V Ganerød, Guro Grøneng and Nicole Ragvin
Figure 11. A) Orthophoto of the upper part of the Åknes landslide. The white line is the open upper crack. B) Detection of the cells of the DEM which have orientations that correspond to the joint sets J1 (foliation joints, white), J2 (black) and J3 (grey) respectively. From Derron, M.-H., et.al. (2005).
Figure 12. Measurements of the joint orientations of the upper part of the Åknes landslide. Left: DEM analysis. Right: Field measurements (courtesy of Braathen, A.). Lower hemisphere stereographic projections. From Derron, M.-H., et.al. (2005).
246 orientations have been measured by field mapping in the whole landslide area, distributed as 142 foliation parallel joints and 104 joints that are not parallel to the foliation (Figure 13). Figure 13 compared with Figure 12 shows that the joint orientations are much more scattered when measurements from the whole landslide area are included. Figure 13 shows also that the joints that are not parallel with the foliation are generally sub-vertical.
Page 11 59

The South African Institute of Mining and Metallurgy International Symposium on Stability of Rock Slopes Vidar Kveldsvik, Trond Eiken, Guri V Ganerød, Guro Grøneng and Nicole Ragvin
Figure 13. Structural measurements in the landslide area. Top: Pole plot of all the joints. Bottom: Contour plot. Only foliation parallel joints have been plotted in Figure 14. It is clear from the plot that the global mean vector of the foliation joints (N155°/23°) is nearly parallel with the slope orientation (N157°/34°).
Page 12 60

The South African Institute of Mining and Metallurgy International Symposium on Stability of Rock Slopes Vidar Kveldsvik, Trond Eiken, Guri V Ganerød, Guro Grøneng and Nicole Ragvin
Figure 14. Foliation joints. Top: Contour plot with the global mean vector and the slope orientation. Bottom: Rosette plot. Foliation joints from different areas are shown in Figure 15. The figure shows that the foliation generally dips quite parallel to the slope in Zones 1 – 3 whereas the foliation dips more easterly and non-parallel to the slope in the upper part along the upper crack (Zone 4).
Page 13 61
The South African Institute of Mining and Metallurgy International Symposium on Stability of Rock Slopes Vidar Kveldsvik, Trond Eiken, Guri V Ganerød, Guro Grøneng and Nicole Ragvin
Zone 1 – 3
Zone 4 Figure 15. Pole plots showing foliation joints in different areas of the slope. The mean great circle calculated from the pole plot is shown as the dotted line. The slope is shown as the solid line. Table 3 shows the dip angles of the foliation from the field mapping and the core logging. For the calculations reported in Table 3, the borehole data have been treated as follows: Where minimum and maximum values have been measured over 1m core (see Section 3.2.1), three values have been recorded: the minimum value, the maximum value and the mean of the two values. Where only one measurement has been taken, three values have also been recorded such that the each metre of the core has been represented consistently by three values: the measured value and the measured value ±2°. Table 3. Dip angle of the foliation Dataset Mean
(°) Median
(°) Variation coefficient
(%)
Minimum (°)
Maximum(°)
Borehole U1 27.5 28 28.8 4 53 Borehole M2 33.5 33 27.2 8 57 Borehole L1 34.2 34 32.5 3 70 U1+M2+L1 31.4 31 31.3 3 70 Field mapping, all data (142 measurements)
39.9 37 38.8 10 89
Field mapping, selected data (114 measurements)1)
35.6 35 32.6 10 70
Page 14 62

The South African Institute of Mining and Metallurgy International Symposium on Stability of Rock Slopes Vidar Kveldsvik, Trond Eiken, Guri V Ganerød, Guro Grøneng and Nicole Ragvin 1)One series of the field mapping consist only of data collected along the upper crack between 30m west of Ext 1 and some tens of metres east of Ext 3, and these data are not included in the “selected data”. The reason is that the foliation dips steeper in this area than generally elsewhere in the slope, such that the “selected data” appear more comparable with the borehole data. Table 3 shows that there is a considerable difference between minimum and maximum dip angles of the foliation for all five data sets. The mean values of the five data sets are quite similar, and they suggest that the dip angle of the foliation is generally of the same magnitude as the dip angle of the slope (35 – 40°).
3.2.3 Jointing in boreholes
The core logging included counting of number of natural joints, length of core loss and length of crushed core, as described below. Fractures/breakage caused obviously by the drilling itself was not included in the joint count. For the foliation parallel fractures/breakage in the rock cores, it was to some extent difficult to distinguish between a natural joint and a fracture/breakage that was caused by the drilling. Some foliation parallel joints included in the joint count may therefore represent weaknesses along the foliation broken apart by the drilling, rather than natural joints. It should be noted that the majority of joints intersected by the boreholes (and counted during the core logging) are parallel to the foliation. This is certainly due to the drilling direction which favours intersection of the foliation rather than the more vertically inclined joints, but probably also for the reason that the frequency of the foliation parallel joints is higher than for other joints. Core loss is sections of the borehole where the length of collected material is less than the drilling length. Core loss is assumed to represent weak material (e.g. fine grained material) or even voids (e.g. intersection of an open crack) in the rock mass. The term “crushed core” is used for sections where the collected material appears as rock fragments and/or fines. Crushed core is assumed to represent poor rock mass quality (dense jointing and/or low strength of the intact rock). The jointing and core loss / crushed core in the boreholes are summarized in Figure 16.
Page 15 63

The South African Institute of Mining and Metallurgy International Symposium on Stability of Rock Slopes Vidar Kveldsvik, Trond Eiken, Guri V Ganerød, Guro Grøneng and Nicole Ragvin
Figure 16. Cumulative number of joints and cumulative length of core loss / crushed core for Boreholes U1 (vertical), L1 (vertical), M2 (vertical) and M1 (60°). Figure 16 shows that the major part of the core loss / crushed core has occurred from 0m to 50 – 60m depth, and that the joint frequency decreases at about 50m in all four boreholes. It is reasonable to assume that some, perhaps the major part, of the poor rock mass quality leading to core loss / core crushing during drilling is associated with ongoing movements in the slope. It follows from this assumption, that ongoing movements in the slope may be restricted to depths of about 60m. During drilling loss of water was such a problem in the upper part that all the holes except for Borehole L1 had to be lined. Steel casing was used down to 40m in Borehole U1, 20m in M1 and 30m in M2. L1 was only lined through a few metres of soil. These experience show that the rock mass at these shallow depths is very permeable, which may be interpreted as a broken and disturbed rock mass. Figure 17 shows the rock type distribution, joint frequency and core loss / crushed core for the full lengths of the four boreholes. Figure 18 shows the same information, but restricted to the upper 60m of all four boreholes. Figure 17 does not reveal any specific trends with respect to core loss / crushed core and joint frequency versus rock type. Figure 18, however, shows that the biotitic gneiss and biotitic gneiss in combination with granitic or dioritic gneiss has more core loss / crushed core than the other rock types, and also; it is more jointed. Figure 19 shows that the dioritic gneiss has most core loss / crushed core when one looks at the total without considering the distribution in the various boreholes. However, this is caused only by the large portion of core loss / crushed core of dioritic gneiss in Borehole U1.
Page 16 64

The South African Institute of Mining and Metallurgy International Symposium on Stability of Rock Slopes Vidar Kveldsvik, Trond Eiken, Guri V Ganerød, Guro Grøneng and Nicole Ragvin
Figure 17. Rock type distribution, joint frequency and core loss / crushed core for the full lengths of Boreholes U1, M1, M2 and L1. Core loss / crushed core is given as percentage of the total length of the rock type in the borehole.
Figure 18. Rock type distribution, joint frequency and core loss / crushed core for the upper 60m of Boreholes U1, M1, M2 and L1. Core loss / crushed core is given as percentage of the total length of the rock type in the upper 60m of the borehole.
Page 17 65

The South African Institute of Mining and Metallurgy International Symposium on Stability of Rock Slopes Vidar Kveldsvik, Trond Eiken, Guri V Ganerød, Guro Grøneng and Nicole Ragvin
Figure 19. Rock type distribution, joint frequency and core loss / crushed core for the upper 60m of Boreholes U1, M1, M2 and L1 combined.
3.3 Ground water
The depth to the ground water in the four boreholes has been measured a few times during the autumn 2005 (Figure 20). In this period the depth is around 50 – 60m in Borehole U1, and around 40 – 45m in Boreholes M2 and L1. Continuous monitoring of the ground water level in Borehole M2 started in December 2005, and in the period December 2005 – February 2006 the depth to the ground water has fluctuated between 38m and 40m. The period of measurement is too short to draw firm conclusions about the ground water, but pretty large depths to the ground water in the slope are certainly indicated.
Figure 20. Depth to ground water in the vertical boreholes U1, M2 and L1.
Page 18 66

The South African Institute of Mining and Metallurgy International Symposium on Stability of Rock Slopes Vidar Kveldsvik, Trond Eiken, Guri V Ganerød, Guro Grøneng and Nicole Ragvin 3.4 Evaluation of ground conditions with respect to stability
The instability of the Åknes rock slope appears to be caused mainly by unfavourable orientation of the foliation in relation to the orientation of the slope. The presence of gneiss rich in biotite may play an important role due the relative weakness of this rock type. The instability may be restricted to depths of about 60m below the ground. It is suggested that shear movements along the foliation take place at several levels in the rock mass from depths of about 60m and upwards. The possible maximum depth of about 60m may be governed both by the presence of ground water at these depths as well as the slope inclination of 35 – 40°. A possible lower failure plane is indicated in Figure 21.
Figure 21. Profile trough the central part of the landslide area. Possible lowest level of shear movements are indicated (modified after geophysical survey conducted by the Geological Survey of Norway).
Upper crack
Page 19 67

The South African Institute of Mining and Metallurgy International Symposium on Stability of Rock Slopes Vidar Kveldsvik, Trond Eiken, Guri V Ganerød, Guro Grøneng and Nicole Ragvin 4 CONCLUSIONS
The Åknes rock slope is located in a fjord system where several rock slides have occurred since deglaciation. Three slide events from the western flank are known to have occurred in historical times, the latest event occurred around 1960. These facts combined with the documented ongoing movements define the Åknes rock slope as a hazardous object. Because of the possible large volume involved in a possible catastrophic failure, the tsunami generating potential is large, meaning that people and infrastructure are at risk. The rather steady displacements rates that have been recorded over the years, indicate that the slope is in a secondary, or steady, creep phase, which means that one would expect an accelerating phase prior to a possible catastrophic failure. The instability of the Åknes rock slope appears to be caused mainly by unfavourable orientation of the foliation compared to the orientation of the slope. The presence of gneiss rich in biotite may play an important role due the relative weakness of this rock type. The instability may be restricted to maximum depths of about 60m below the ground. Displacements along the foliation may take place at several levels above about 60m. Monitoring of displacements in boreholes is needed to verify or reject this hypothesis. 5 ACKNOWLEDGEMENTS
The work presented here is part of ongoing projects founded by the International Centre for Geohazards, the Gelogical Survey of Norway, Norwegian Geotechnical Institute and National Fund for Natural Damage Assistance and Møre & Romsdal County. The paper has benefited from review by prof. B Nilsen, Norwegian University of Science and Technology, prof. H Einstein, Massachusetts Institute of Technology and dr. L H Blikra, the Gelogical Survey of Norway. REFERENCES BLIKRA, L.H., LONGVA, O., HARBITZ, C. & LØVHOLT, F. (2005a). Quantification of rock-avalanche and tsunami hazard in Storfjorden, western Norway. In: Senneset, K., Flaate, K. & Larsen, J.O. (eds.). Landslide and Avalanches ICFL 2005 Norway. Taylor & Francis Group, London. BLIKRA, L.H., LONGVA, O., BRAATHEN, A., ANDA, E., DEHLS, J. & STALSBERG, K. (2005b). Rock-slope failures in Norwegian fjord areas: examples, spatial distribution and temporal patterns. In: Evans, S.G., Scarawcia Mugnozza, G., Strom, A.L. & Hermanns, R.L. (eds.). Massive rock slope failure: new models for hazard assessment. Kluwer, Dodrecht (in press). BLIKRA, L.H., LONGVA, O., BRAATHEN, A., ANDA, E. & STALSBERG, K. (2004). Rock-slope failures in Norwegian fjord areas: Examples, spatial distribution and temporal pattern. In: Massive Rock Slope Failure NATO Science Series, Edited by S.G. Evans, G. Scarascia Mugnozza, A. Strom and R.L. Hermanns, Kluwer Academic Publishers, Dordrecht.
Page 20 68

The South African Institute of Mining and Metallurgy International Symposium on Stability of Rock Slopes Vidar Kveldsvik, Trond Eiken, Guri V Ganerød, Guro Grøneng and Nicole Ragvin
Page 21
BRAATHEN, A., BLIKRA, L. H., BERG, S. S. & KARLSEN, F. (2004). Rock-slope failures of Norway; type, geometry, deformation mechanisms and stability. Norwegian Journal of Geology (NGT) Vol. 84, p. 67 – 88 CROSTA, G. B. & AGLIARDI, F. (2003). Failure forecast for large rock slides by surface displacement measurements. Canadian Geotechnical Journal. Vol. 40, p. 176 – 191. DERRON, M.-H., BLIKRA, L.H. & JABOYEDOFF, M. (2005). High resolution digital elevation model analysis for landslide hazard assessment (Åkerneset, Norway). In: Senneset, K., Flaate, K. & Larsen, J.O. (eds.). Landslide and Avalanches ICFL 2005 Norway. Taylor & Francis Group, London. JØRSTAD, F. (1968). Waves generated by landslides in Norwegian fjords and lakes. Norwegian Geotechnical Institute. Publication No. 79. KILBURN, C. R. J. & PETLEY, D. N. (2003). Forecasting giant, catastrophic slope collapse: lessons from Vajont, Northern Italy. Geomorphology. Vol. 54. p. 21 – 32. NORWEGIAN GEOTECHNICAL INSTITUTE (EIDSVIG, U. & HARBITZ, C.B.) (2005). NGI-report 20031100-2. Åknes/Tafjord-prosjektet. Innledende numeriske analyser av flodbølger som følge av mulig skred fra Åkernes. (”Preliminary numerical analysis of tsunamis generated by a slide at Åknes”). NORWEGIAN GEOTECHNICAL INSTITUTE (KRISTENSEN, K.) (1996). NGI-report 585910-9. Åkernes landslide. General description of the Åkernes slide area and control measures. NORWEGIAN GEOTECHNICAL INSTITUTE (GRIMSTAD, E.) (1989). NGI-report 85494-2. Stabilitetsvurdering omkring Remnane ved Åkernes i Stranda. (”Stability assessment at Åkernes in Stranda”). NORWEGIAN GEOTECHNICAL INSTITUTE (KRISTENSEN, K.) (1987). NGI-report 85494-1. Remnane ved Åkernes, Stranda commune, Møre og Romsdal. Vurdering av fare for fjellskred. (”Assessment of the rock slide hazard”). PETLEY, D. N., BULMER, M. H. & MURPHY, W (2002). Patterns of movement in rotational and translational landslides. Geology. Vol. 30. no. 8, p. 719 – 722.
69

NGF Winter Meeting 2005 - Røros
NGF Abstract and proceedings of the Geological Society of Norway. Number 1, 2005 Vinterkonferansen Røros 9-12 January
Geological interpretation of geophysical feasibility studies, with application to E39 tunnel project in Sør-Trøndelag, Norway Venvik, R.G.1,2), Dalsegg, E.1), Rønning, J.S.1)
1) Geological Survey of Norway, 7491 Trondheim 2) Department of earth science, University of Bergen, 5007 Norway
Geophysical data are important in order to understand and interpret geological features in the subsurface. We emphasise the significance of such data in feasibility studies of tunnel projects. Our examples come from the feasibility study related to the E39 road-project in Sør-Trøndelag, Norway. This project includes 22 km’s of new road, including 6 tunnels. In the proximity of the tunnels, geophysical methods such as seismic profiling, 2D resistivity and electromagnetic measurements, as VLF profiling, were applied. These methods were considered for mapping of faults and/or fracture zones, aiming on potential problems related to groundwater leakage and rock stability.
The work can be divided into three stages: (1) gathering of geophysical data, (2) mapping of structures with basis in digital topographic models, and (3) geological outcrop studies both in the tunnels and at the surface above the tunnels. The results show that there is good correlation between large structures mapped by the digital topographic model and large zones detected by geophysical data. Zones indicated in the resistivity profile correlate well with fracture zones observed in the tunnel. This was especially well constrained for the Viggja tunnel. The resistivity data also give detailed information on structural zones, which is difficult to obtain at the surface due to extensive bog and superficial sedimentary cover.
This case study indicates that, when comparing the geophysical methods applied, the 2D resistivity profiling gives the best result with respect to geology. This study also has shown that extensive structural mapping is required in order to obtain the best result from the resistivity data. The orientation of large faults and/or fracture zones has great influence on the results achieved by the method and must be taken into consideration when planning the profile(s). Interpretation of the resistivity data is a challenge, and further study of the resistivity method should be conducted, focussing on the effect of fault and fracture zones. Synthetic modelling of different geological situations has been an aid in the interpretation, and is one approach to sensitivity testing of 2D resistivity data.
70

Reports
SKB - Swedish Nuclear Fuel and Waste Management Co
SKB P-06-XXX Oskarshamn site investigation Structural analysis of brittle deformation zones in the Simpevarp-Laxemar area, Oskarshamn, southeast Sweden Report from Phase 1 Giulio Viola & Guri Venvik Ganerød Geological Survey of Norway, N-7491 Trondheim, Norway March 2007 Keywords: Oskarshamn, AP PS 400-05-096, structural geology, deformation zone, fault zone, cataclasite, fault breccia, kinematics This report concerns a study that was conducted for SKB. The conclusions and viewpoints presented in the report are those of the authors only and do not necessarily coincide with those of the client. A pdf version of this document can be downloaded from www.skb.se
71
Abstract
A study of predominantly brittle structures, i.e. brittle deformation zones, faults, fractures and associated fault rocks, was carried out in the Simpevarp–Laxemar area, Oskarshamn. The main aim of the study was to document from a geometric and kinematic point of view the brittle deformation history of the area. Moreover, the study deals with the detailed characterization of the observed deformation zones and fault rocks were systematically investigated in order to improve our understanding of the deformation mechanisms that controlled the local brittle structural evolution. Structural data were obtained from field observations and from detailed logging of selected drill core sections from a variety of boreholes. These results were integrated with observations from thin sections prepared from carefully selected and structurally controlled samples. The structures investigated in the area include low-grade brittle-ductile shear zones, proper brittle faults containing several generations of cataclasites and breccias cemented by diagenetic minerals and systematic sets of hybrid fractures of limited offset.
In most field localities and drill cores there are abundant joints and dilational fracture sets, commonly with only minor offset. These are in most cases coated or filled with a range of different minerals reflecting changing environmental conditions during successive deformation events. Striated surfaces were used to constrain the kinematics of fault zones. Such data were obtained from outcrops and, to a variable extent, from several oriented deformation zones in the drill cores. In total, a considerable amount of new data has been acquired that is crucial to the understanding of the structural evolution of brittle faults, deformation zones and fractures on a local and regional scale and their complete characterization. In detail, the Laxemar area is characterized by conjugate sets of steep strike-slip brittle faults and shear fractures whose orientation allows for their geometric correlation to the lineaments previously identified in the area by SKB. A prominent NS trending set, a ENE-WSW dextral set together with their respective Riedel shears and a well defined family of fractures trending ESE-WNW, whose kinematics remain as yet undetermined, are the most striking features observed in this subarea. Moving eastward towards Simpevarp, the overall fracture/fault orientation pattern becomes more complex and heterogeneous. This is in part due to a gradual change of lineaments' orientation, with a set of NNE-SSW and NE-SW trending lineaments becoming the most characteristic structural orientations. The fracture pattern orientation change may be possibly linked to the presence of the intervening NE-SW trending sinistral Äspö mylonite belt, which may have played a role in controlling the orientation of later brittle structures. Very important is the identification of a set of small-scale, moderately to gently SSW and N/NNE dipping fault planes that are either normal or reverse faults. They occur in Laxemar as well as in the Simpevarp Peninsula and along its coastline. Time relationships among the fractures/faults identified are difficult to constrain, although the general impression is that flat lying structures generally postdate the steep structures. Several deformation zones were logged and characterized in drill cores. They contain very often fault rocks in their cores and they range from cohesive cataclasites to non-cohesive breccias, although cohesive fault rocks dominate. Kinematic indications and the characteristics of the deformation zones found in the oriented cores correlate well with field observations.
72

SKB P-06-XXX Oskarshamn site investigation Structural characterization of deformation zones (faults and ductile shear zones) from selected drill cores and outcrops from the Laxemar area – Results from Phase 2 Giulio Viola and Guri Venvik Ganerød Geological Survey of Norway, N-7491 Trondheim, Norway July 2007 Keywords: Oskarshamn, AP PS 400-05-096, structural geology, shear zone, fault, fault rocks, kinematics This report concerns a study that was conducted for SKB. The conclusions and viewpoints presented in the report are those of the authors and do not necessarily coincide with those of the client. A pdf version of this document can be downloaded from www.skb.se
73

Abstract
A study of predominantly brittle structures, i.e. brittle deformation zones, faults, fractures and associated fault rocks, was carried out on a number of drill cores and outcrops of the Laxemar area, Oskarshamn. The main aim of the study is to document from a geometric and kinematic point of view the brittle deformation history of the region. The study deals with the detailed characterization of the observed deformation zones and fault rocks were systematically investigated in order to improve our understanding of the deformation mechanisms that controlled the local brittle structural evolution. Striated surfaces were used to constrain the kinematics of fault zones. Such data were obtained from outcrops and, to a variable extent, from several oriented deformation zones in the drill cores. DZ1 of KLX03 was logged during this study. It is composed by three different cores. Fault products vary from foliated cataclasites to cataclasites. Clear evidence for structural reactivation is found throughout the section. The three cores have different orientations and the available kinematic evidence gathered during the study does also differ from core to core. In more detail, whereas the uppermost core strikes consistently NE-SW and dips gently to the SE and striated planes within it and in its upper transition zone suggest a normal sense of shear towards the SE the intermediate and deepest cores strike SE-NW, almost at 90° from the uppermost core, and are possibly characterized by reverse kinematics. KLX04 was logged from 223 to 358 m depth. Deformation style is similar throughout the section and, in general, there is convincing evidence of a complex, long-lived brittle deformation history. Hydrofracturing and fluidization are inferred to have been important deformation mechanisms in this section, which lacks any sign of ductile precursors. The orientation of fractures and of the cataclastic cores is rather consistent for all of the investigated deformation zones. The strike of these features is generally SE-NW and their dip is gentle to moderate to the NE and SW. Striated planes indicate the predominance of oblique reverse faulting, with top-to-N/NE or S/SW sense of shear. There are, however, also a few extensional fault planes, generally coaxial with the reverse faulting direction. KLX 08 had DZ 6 and DZ 7 logged during this study. Deformation style is brittle throughout the inspected depth interval and structural evidence suggests multiple cataclastic episodes and a complex reactivation history. The cores of both deformation zones contain fault rocks that cover the whole spectrum of brittle fault products. DZ 6, including its upper and lower transition zones, is characterized by generally NNE-SSW striking and very gently ESE and WNW dipping fractures and striated planes, which bear primarily evidence of reverse faulting. These gently dipping fractures are interpreted, on the ground of the mineral infill, to postdate a set of steep conjugate E-W trending fractures. Fractures within DZ 7 have a similar orientation and dip very gently but no striated planes were observed. KLX 09 DZ 4 was logged in detail. DZ 4 is characterized by the presence of an extremely thick fault core (c. 30 m) formed by cataclastic rocks. No evidence of ductile precursors
74

is observed. DZ 4 contains numerous striated planes that strike roughly NW-SE and dip very consistently to the NE. Kinematic constraints indicate both compression and extension, with a top-to-SW and top-to-NE sense of shear, respectively. Only DZ 9 was logged in KLX10 during this study. DZ 9 has a remarkable core, c. 5 m thick, which consists of a complex sequence of fault rocks, with cataclasites, ultracataclasites and gouge. Orientation data from this depth interval is inconclusive, except for a series of systematic S/SSE dipping open fractures within the upper transition zone. In this study we have logged the whole of KLX 11A. DZ 3, 6, 7, 8, 11, 12 and DZ 14 were identified as real deformation zones. Within these zones there is evidence of pervasive brittle deformation and multiple reactivation. Apart from DZ 11, where most fractures and striated planes strike NW-SE and bear evidence for sinistral and dextral strike-slip and low-obliquity shearing, the remaining deformation zones are oriented roughly WSW-ENE to E-W. KLX12A DZ 10, 11 and 12 were logged in detail during this study. The three zones are developed predominantly within intermediate to mafic rock types, varying from quartz monzodiorites to diorites and gabbros. The deformation style that characterizes these deformation zones is fully ductile, with mylonitic shear zones forming the cores of the deformation zones. Only in DZ 11 there is evidence of cataclasis, whereby mylonites overprint previously formed cataclasites. Whereas the mylonitic fabric in DZ 10 dips moderately to the SW, within the cores of DZ 11 and 12 mylonites dip consistently c. 50-55° to the SE/ESE. In KLX18A we have interpreted as real deformation zones DZ 3, 5, 6, and 9. They are invariably characterized by cataclasites, highly fractured intervals and crush zones. Microstructures indicate multiple episodes of brittle deformation and structural reactivation. In general, fractures and cataclastic bands within these deformation zones strike E-W and dip gently to moderately to the S, SSW. Four different deformation zones (DZ 1 to DZ 4) have been logged in KLX20A. DZ 1, 2 and 3 contain fault cores and significant crush zones, whereas we do not interpret DZ 4 as a proper deformation zone. The most interesting and relevant zone is DZ 1, which contains a large dolerite dyke. Numerous striated planes (particularly within the dolerite) were measured, and two significant and systematic families of fault planes were identified. Generally E-W striking and moderately N- and S-dipping planes show both normal and reverse kinematics, with low obliquity. These are crosscut by sub vertical planes striking from NNW to NNE with a predominantly strike-slip kinematics.
75

SKB P-06-XXX Oskarshamn site investigation Structural characterization of deformation zones (faults and ductile shear zones) from selected drill cores from the Laxemar area – Results from Phase 3 Giulio Viola & Guri Venvik Ganerød Geological Survey of Norway, N-7491 Trondheim, Norway July 2007 Keywords: Oskarshamn, AP PS 400-05-096, structural geology, shear zone, fault, fault rocks, kinematics This report concerns a study that was conducted for SKB. The conclusions and viewpoints presented in the report are those of the authors and do not necessarily coincide with those of the client. A pdf version of this document can be downloaded from www.skb.se
76

Skred - Rockslides
77

78

79

Grunnvann - Hydrogeology
80

81

82