Embed Size (px)
Citation preview
The 2018
Applied Geography Conference The 41st annual conference since 1978
Kent State University Hotel and Conference Center
October 31st to November 2nd, 2018


I
THE 41ST APPLIED GEOGRAPHY CONFERENCE
Board of Directors
President:
Tom Dwyer, Bank of Hope, CA Executive Director:
Jay Lee, Kent State University, OH Incoming Executive Director:
Murray Rice, University of North Texas, TX Members:
Harrison Campbell, Jr., University of North Carolina Charlotte, NC Dawna Cerney, Youngstown State University, OH Jonathan Comer, Oklahoma State University, OK Richard Earl, Texas State University, TX Tony Hernandez, Ryerson University, Canada James Lein, Ohio University, OH Jay Newberry, Binghamton University, NY Michael Ratcliffe, US Census Bureau, Washington, DC Brandon Vogt, University of Colorado Colorado Springs, CO Wei Song, University of Louisville, KY Clayton Whitesides, Coastal Carolina University, NC
II
THE 41ST APPLIED GEOGRAPHY CONFERENCE
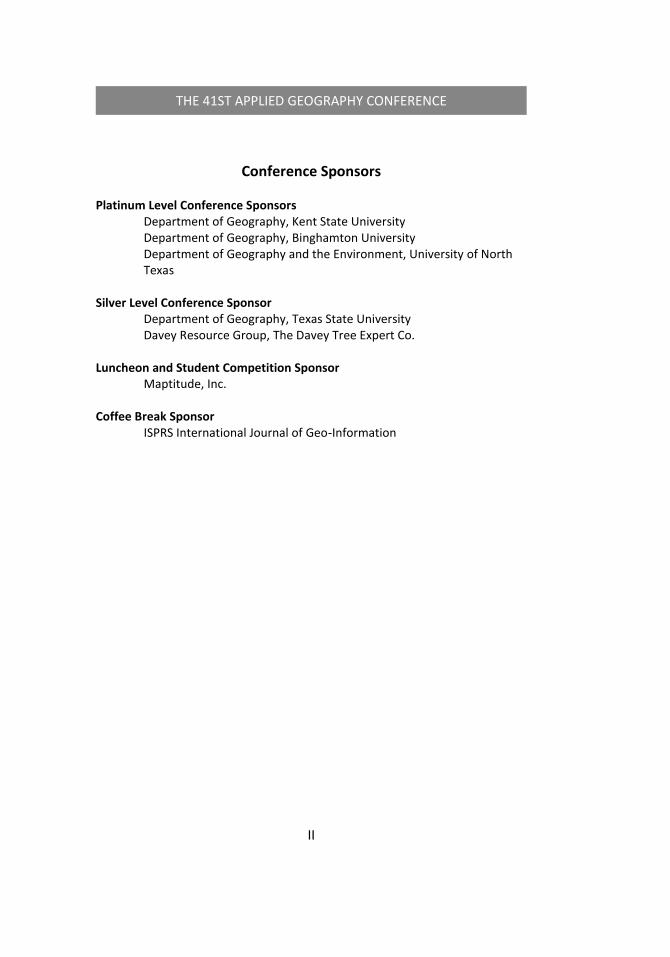
Conference Sponsors
Platinum Level Conference Sponsors
Department of Geography, Kent State University Department of Geography, Binghamton University Department of Geography and the Environment, University of North Texas
Silver Level Conference Sponsor
Department of Geography, Texas State University Davey Resource Group, The Davey Tree Expert Co.
Luncheon and Student Competition Sponsor
Maptitude, Inc. Coffee Break Sponsor
ISPRS International Journal of Geo-Information

III
THE 41ST APPLIED GEOGRAPHY CONFERENCE
Conference Overview
Wednesday, 10/31 to Friday 11/2/2018
Art Exhibit: Beyond Rust Belt Porn
Wednesday, October 31
2:00 pm – 3:30 pm
GENDER CONCERNS IN THE GEOGRAPHY WORKSPACE [CLOSED PANEL SESSION]
TOURISM, PARKS, AND URBAN SPACE [PAPER SESSION]
APPLIED AND SYNOPTIC CLIMATOLOGY [PAPER SESSION]
URBAN AND REGIONAL PLANNING AND DEVELOPMENT I [PAPER SESSION]
4:00 pm – 5:30 pm APPLIED GEOGRAPHY, EDUCATION, AND DISCIPLINARY DEVELOPMENT [PAPER SESSION]
CLIMATOLOGY RESEARCH [PAPER SESSION]
7:30 pm – 9:30 pm RECEPTION – Opening mixer

IV
THE 41ST APPLIED GEOGRAPHY CONFERENCE
Thursday, November 1
8:00 am – 12:00 pm
STUDENT POSTER COMPETITION [POSTER SESSION]
8:30 am – 10:00 am
A GEOGRAPHER IN BANKING [PRESENTATION]
10:15 am – 12:00 pm AIMING FOR A MOVING TARGET: EDUCATION AND CAREER DEVELOPMENT IN APPLIED GEOGRAPHY [PANEL SESSION]
STUDENT PAPER COMPETITION 1 [PAPER SESSION]
GEOGRAPHY OF HAZARDS [PAPER SESSION]
URBAN AND REGIONAL PLANNING AND DEVELOPMENT 2 [PAPER SESSION]
GEOSPATIAL ANALYSIS 1 [PAPER SESSION]
12:10 pm – 1:50 pm
LUNCH (on your own)
2:00 pm – 3:30 pm
USE OF NON-TRADITIONAL GEOSPATIAL TOOLS IN THE ERA OF BIG DATA [WORKSHOP]
STUDENT PAPER COMPETITION 2 [PAPER SESSION]
ENVIRONMENTAL GEOGRAPHY RESEARCH 1 [PAPER SESSION]
OTHERWISE APPLIED GEOGRAPHIES [PAPER SESSION]
GEOSPATIAL ANALYSIS 2 [PAPER SESSION]
4:00 pm – 5:30 pm
BUSINESS AND ECONOMIC GEOGRAPHY 1 [PAPER SESSION]
WHITHER RURAL AND URBAN: RURAL AND URBAN CLASSIFICATION RESEARCH AT THE CENSUS BUREAU [PAPER SESSION]
APPLIED GEOGRAPHY AND THE GREEN INDUSTRY [PAPER SESSION]
6:30 pm – 8:30 pm BOARD OF DIRECTOR MEETING

V
THE 41ST APPLIED GEOGRAPHY CONFERENCE
Friday, November 2
8:00 am – 12:00 pm
POSTER - REGULAR POSTER SESSION
8:30 am – 10:00 am
BUSINESS AND ECONOMIC GEOGRAPHY 2 [PAPER SESSION]
AGRICULTURE, ENTERPRISES, AND SOCIETY [PAPER SESSION]
ENVIRONMENTAL GEOGRAPHY RESEARCH 2 [PAPER SESSION]
PLUS PUBLIC: TRANSFORMING COMMUNITIES VIA PARTICIPATORY DESIGN THINKING [WORKSHOP]
10:15 am – 12:00 pm
TEACHING AND LEARNING WITH BUSINESS ANALYST WEB [WORKSHOP]
HEALTH AND MEDICAL GEOGRAPHY 1 [PAPER SESSION]
BEYOND RUST BELT PORN [PAPER SESSION]
GEOSPATIAL ANALYSIS 3 [PAPER SESSION]
MEETING OF BOARD OF DIRECTORS
12:10 pm – 1:50 pm
CONFERENCE LUNCHEON AND KEYNOTE ADDRESS
2:00 pm – 3:30 pm
BUSINESS AND ECONOMIC GEOGRAPHY 3 [PAPER SESSION]
HEALTH AND MEDICAL GEOGRAPHY 2 [PAPER SESSION]
ARTIST INTERACTION WITH GEOGRAPHY: FROM INSPIRATION OF PLACE TO TRANSFORMATION WITH COMMUNITY SPACE [PANEL SESSION]
GEOGRAPHY, ENVIRONMENT, AND JUSTICE [PAPER SESSION]
GEOSPATIAL ANALYSIS 4 [PAPER SESSION]
3:30 pm – 4:30 pm
EDITORIAL BOARD MEETING FOR PAPERS IN APPLIED GEOGRAPHY Room: 2nd Floor Board Room
VI
THE 41ST APPLIED GEOGRAPHY CONFERENCE
Art Exhibit
Wednesday, 10/31 to Friday 11/2/2018
Beyond Rust Belt Porn
Room: Atrium
The cliché of the Rust Belt as dilapidated communities, abject poverty, abandon relics of bygone industry and hopelessness has been capitalized on by campaigning politicians to photographers. Hazy black and white photos with enhanced green vegetation of a forgotten landscape have become the normative visuals for the Rust Belt. These images along with the stories they tell have come to be known as “Rust Belt Porn”. For the most part they are non-descriptive images that could be from anywhere across Historic Industrial America. Gross generalizations, don’t reflect a dynamic landscape emerging in particular areas of the Rust Belt. Often the leading agent of transformation in communities are artists. Three regional artists are exhibiting pieces of their work that reflect a counter narrative of revival emerging in many Rust Belt communities, including North West Ohio.

1
AGC 2018, WEDNESDAY, 10/31/2018
Wednesday, October 31
2:00 pm – 3:30 pm
GENDER CONCERNS IN THE GEOGRAPHY WORKSPACE [CLOSED PANEL SESSION] Room: Ballroom DIX Organizers: Dawna Cerney, Youngstown State University, Youngstown, OH
Murray D. Rice, University of North Texas, Denton, TX Chair: Dawna Cerney, Youngstown State University, Youngstown, OH Discussants: Lisa Curl, Dominion Ohio, OH, Michael Allen, Old Dominion University Session Description:
This is a preliminary discussion to identify gender challenges and concerns that all individuals face in the workspace. THIS IS NOT AN OPEN SESSION. A room and time is set aside for it but it is not open to all conference attendees.
TOURISM, PARKS, AND URBAN SPACE [PAPER SESSION] Room: Ballroom KENT Chair: James Lein, Ohio University, OH
Applied Community Geography: Open Space Planning Christina Lopez, John Ponstingel, Milad Korde, and Daria Andrievskikh, Texas State University, TX
Exploring Machine Learning Strategies to Predict Sustainable Land Cover Arrangements in an Urban Setting
James K. Lein, Ohio University, OH Space Differentiation Research on Tibet Tourism Climate Resources
Chunhua Li, Qinghai Normal University, China Perception of Public Art
Jia Lu, Valdosta State University, GA: APPLIED AND SYNOPTIC CLIMATOLOGY [PAPER SESSION] Room: Ballroom McGILVREY Organizers: Cameron C. Lee, Kent State University, OH Chair: Cameron Lee, Kent State University, OH Session Description:
Weather and climate influence nearly every aspect of our lives, from agriculture to tourism, transportation, our health and much more. Synoptic

2
AGC 2018, WEDNESDAY, 10/31/2018
climatology utilizes classifications of atmospheric variables to help elucidate relationships between the climate and various climate-related outcomes. As a discipline, synoptic climatology is an applied science, with applications that include human health, hydrology, air quality, oceanography, phenology, agriculture, and extreme weather and climate events and climate change. In this session we welcome research and modeling applications of applied climatology, including synoptic climatological applications and theory. Long-Term Trends in the Frequency of North American Weather Types
Cameron C. Lee and Scott Sheridan, Kent State University, Ohio Temporal Trends in Absolute and Relative Extreme Temperature Ecents Across North America
Scott C. Sheridan and Cameron C. Lee, Kent State University, Ohio Diurnal Temperature Range and the Associated Synoptic Characteristics around Lake Erie, 1986-2015
Ryan Adams, Sam Eitner, and Matthew Stiller, Kent State University, OH
URBAN AND REGIONAL PLANNING AND DEVELOPMENT I [PAPER SESSION] Room: 221 (2nd Floor) Chair: Rajiv Thakur, Missouri State University, MO Organizers: Rajiv Thakur, Missouri State University, MO RajRani Kalra, California State University, San Bernardino, CA Chair: Sudhir Thakur, California State University, Sacramento, CA Session Description:
This session on urban and regional planning and development will investigate the planning and development practices in the twentieth century and ways in which it is being transformed. With the push to adopt a market paradigm in land development and infrastructure the relationship between resource management, sustainable development and the role of governance has transformed. Centralized planning is giving way to privatization not only in the traditional regions but also in newly emerging regions globally. There is an attempt to get planning decision making closer to the people who are most affected by it. This session aims to provide an opportunity for conceptual discussion on planning perspectives and methods. China's Urban and Regional Development and Planning Over the Course of 40 Years
Yichun Xie, Eastern Michigan University, Michigan, Xueliang Zhang, Shanghai University of Finance and Economics, China

3
AGC 2018, WEDNESDAY, 10/31/2018
Urban Planning, Health and Quality of Life: Analyzing the Consistency in Barcelona's Cerdà Grid-Orientation Using LiDAR Technology
Montserrat Pallares-Barbera, Anna Badia, and Meritxell Gisbert, Autonomous University of Barcelona, Cerdanyola (Barcelona), Spain
Multi-fields and Cultural Creative Industrial Clusters Innovation: A Case Study of Jun Porcelain Industry in Shenhou, Henan, China
Kewen Lyu, Henan University, China The Elastic Characteristics of Urban Construction Land Growth in China
Wengang Wang, Hebei Normal University, China
4:00 pm – 5:30 pm APPLIED GEOGRAPHY, EDUCATION, AND DISCIPLINARY DEVELOPMENT [PAPER SESSION] Room: Ballroom KENT Chair: Hyun Joong Kim, Plymouth State University, NH
Community Geography in Action - An Example Partnership Between Texas State University and People United for Sustainable Housing
Christina Lopez, John Ponstingel, Milad Korde, Daria Andrievskikh, and Russell Weaver, Texas State University, TX
A Longitudinal Analysis of Maps Published in Geography Journals, 1987-2017
Michael Larson, Thomas Wikle, Giovanni Penna, and Anthony Pennington, Oklahoma State University, OK
K-12 Education: Solving Real World Issues through NASA Content & GIS Bethany Szijarto, Kent State University, OH
Geography in Korean Early Childhood Education Hyun Joong Kim, Plymouth State University, NH, Yoo Jin Shon, Dong-Eui University, Korea, and Mi Jin Kim, Inej University, Korea
CLIMATOLOGY RESEARCH [PAPER SESSION] Room: Ballroom McGILVREY Chair: Richard Earl, Texas State University, TX
Global Cold Air Outbreaks Erik T. Smith and Scott C. Sheridan, Kent State University, Ohio
Regional Evaluation of Climate Vulnerability at the Start of the 21st Century in Southwest Russia
Maria G. Lebedeva, Belgorod State National Research University, Russia, Anthony R. Lupo, University of Missouri, Missouri, Olga V.

4
AGC 2018, WEDNESDAY, 10/31/2018
Krymskaya, Yury G. Chendev, Alexandr B. Solvev, Belgorod State National Research University, Russia
Summer in the City Heat Trends in Urban Alabama, 1958-2017 Stephen G. Tsikalas, Eastern Washington University; Kennedy Delap, Jacksonville State University, AL
7:30 pm – 9:30 pm
RECEPTION – Opening mixer Room: Atrium

5
AGC 2018, THURSDAY, 11/1/2018
Thursday, November 1
8:00 am – 12:00 pm
STUDENT POSTER COMPETITION [POSTER SESSION] Room: TBA Coordinator: TBA
Deer Detection in a Nature Perspective: Applying Geo-Spatial Analysis Alexa Sikoryak, Binghamton University, NY
State and Local Roles in the Expansion and Redevelopment of a Rust Belt, Johnson City, New York
Frank Tolbert, Binghamton University, NY Urban Revitalization in Small Depressed Cities: Case Studies on the Short-Term Impacts of New Investment in Small-Scale US Cities
Joshua Gonzalez and Dylan Stackpole, Binghamton University, NY Application of Geovisualization Methods for Assessing the Flood of 2011 in Binghamton, NY
Barbara Yarborough and Christopher A. Badurek, State University of New York at Cortland, NY
Gradients of Child Health Across the Geography of India Junaid Khan, International Institute for Population Sciences, India
8:30 am – 10:00 am
A GEOGRAPHER IN BANKING [PRESENTATION] Room: Ballroom DIX Organizer: Lynn Sitler, PNC Bank Presenter: Lynn Sitler, PNC Bank Session Outline:
(1) Introduction, (2) Some Similarities and Differences Between Retail and Banking, (3) Lots of Data, (4) I Have Googlemaps – So Why Do I Need Fieldwork?, (5) Tools and Methodologies – Which to Use When and Why, (6) A Few Risks That A Geographer May Encounter Along the Way, (7) Community Reinvestment Act – What Is It and How Does It Affect the
Work I Do? (8) Some Thoughts on the Future of Bank Location Research, (9) A Couple of Pieces of Advice for Geography Students

6
AGC 2018, THURSDAY, 11/1/2018
10:15 am – 12:00 pm
AIMING FOR A MOVING TARGET: EDUCATION AND CAREER DEVELOPMENT IN APPLIED GEOGRAPHY [PANEL SESSION] Room: Ballroom DIX Organizers: Larry E. Carlson, Larry E. Carlson and Associates, Clarkston MI
Murray D. Rice, University of North Texas, TX Chair: Murray D. Rice, University of North Texas Panelists: Larry E. Carlson, Larry Carlson and Associates, Clarkston MI, Michael Ratcliffe, US Census Bureau, Washington, DC, William Graves, UNC Charlotte, Charlotte, NC; Tony Hernandez, Ryerson University, Toronto ON; Joshua Bova, Invesco, Dallas TX Session Description:
The practice of geography in an applied setting has undergone much change as the competitive landscape has shifted in concert with evolution in technology and society. This session takes off on the initial commentary of Larry Carlson (provided in the preceding session) to explore the current state and future direction of the business geography discipline, and the educational system that supports it.
STUDENT PAPER COMPETITION 1 [PAPER SESSION] Room: Ballroom KENT Chair: Wei Song, University of Louisville, KY
Geography of Food Pantries in Relation to Income - The Case of a Rustbelt City in Up-State New York
Mohammed Rabiu Abubakari, Binghamton University, NY The Access to HIV Care and Addiction Treatment among Stigmatized Population of Opioid-Dependent People Living with HIV
Diane BenBella and Debarchana Ghosh, University of Connecticut, CT, Shan-Estelle Brown, Rollins College, FL, Faye Taxman, George Mason University, VA, and Frederick L. Altice, University of Connecticut, CT and Yale School of Medicine
An Analysis of the Impact of Vacant and Abandoned Properties on Drug-Related Crime in Jefferson County, Kentucky
Jesse Wisdom, University of Louisville, KY Is the Macy's in My Mall Going to Close? Uncovering the Factors Associated with the Closures of Macy's, Sears, and J.C. Penny Stores
Joseph Tokosh, Kent State University, OH

7
AGC 2018, THURSDAY, 11/1/2018
GEOGRAPHY OF HAZARDS [PAPER SESSION] Room: Ballroom McGILVREY Chair: Tim Dolney, Pennsylvania State University, Altoona, PA
Flood Awareness among College Students in Flash Flood Alley Daria Andrievskikh, Richard A. Earl, and Christina W. Lopez, Texas State University, Texas
The Role of Meteorological Hazards in Urban Tourism: The Case of Hampton Roads 2013-17
Nicole Hutton, and Michael Allen, Old Dominion University, Virginia Vulnerability, Pre-disaster Awareness, and Social Media: A Case Study of Hurricane Sandy with Twitter Data
Zheye Wang, Kent State University, OH 30 Years Later. A Spatial Analysis of the May 31, 1985 Tornadoes Using Present-Day Data for the State of Pennsylvania
Tim Dolney, Pennsylvania State University - Altoona College, PA: Tornado Watch #211
URBAN AND REGIONAL PLANNING AND DEVELOPMENT 2 [PAPER SESSION] Room: 221 (2nd Floor) Organizers: Rajiv Thakur, Missouri State University, West Plains; RajRani Kalra, California State University, San Bernardino Chair: George Pomeroy, Shippensburg University, PA Session Description:
This session is a continuation of an earlier session on urban and regional planning and development. It will continue to investigate planning and development practices in the twentieth century and ways in which it is being transformed. With the push to adopt a market paradigm in land development and infrastructure the relationship between resource management, sustainable development and the role of governance has transformed. Centralized planning is giving way to privatization not only in the traditional regions but also in newly emerging regions globally. There is an attempt to get planning decision making closer to the people who are most affected by it. This session aims to focus on national and local responses to urban economic change and provides an opportunity for conceptual discussion of sustainable development practices. Public Debt and Regional Inequality in India: An Exploratory Spatial Data Analysis
Sudhir Thakur, Sacramento State University, CA Studies of Tourism Geography in India: Definition, Approaches, and Prospects

8
AGC 2018, THURSDAY, 11/1/2018
RajRani Kalra, California State University, San Bernardino, CA Leveraging Brewing History: The Case of Cincinnati's Over-the-Rhine Neighborhood
Neil Reid, University of Toledo, Jay D. Gatrell, and Matthew Lehnert, University of Toledo
A Comparative Study on the Softening of Manufacturing Industry Input Structure
Ran Wang, Zhengzhou University of Economics and Law, China GEOSPATIAL ANALYSIS 1 [PAPER SESSION] Room: 321 (3rd Floor) Chair: Lianqi Zhu, Henan University, China
Evaluating the Accuracy of Terrain Data Generated Using the UAS-SfM Workflow
Adam Mathews, Western Michigan University, MI, and Amy Frazier, Arizona State University, AZ
Spatial Variation of Terrain Relief and Its Impacts on Population and Economy Based on Raster Data in West Henan Mountain Area
Lianqi Zhu, Jingjing Zhang, Wenbo Zhu, Shasha He, and Han Ren, Henan University, China
Mapping Fuel Continuity to Prevent and Plan Wildland Urban Interface Using LiDAR Technology
Anna Badia and Meritxell Gisbert, Autonomous University of Barcelona, Cerdanyola (Barcelona), Spain
Utilization of Information and Communication Technologies by Students of the University of Ghana, Legon
James C. Saku, Frostburg State University, MD
12:10 pm – 1:50 pm
LUNCH (on your own)
2:00 pm – 3:30 pm USE OF NON-TRADITIONAL GEOSPATIAL TOOLS IN THE ERA OF BIG DATA [WORKSHOP] Room: Ballroom DIX Session Organizer: Gary Gruccio, Signet Jewelers Session Chair: Gary Gruccio, Signet Jewelers

9
AGC 2018, THURSDAY, 11/1/2018
Presenters: Brian Strickland, Gary Gruccio, Ian Reed, Greg Persons, and Emily Snyder, Signet Jewelers
Session Description: Businesses today have many choices in how they process and analyze geospatial data. While many companies may rely on traditional GIS packages to get to this insight, a new generation of tools have sprung up which allow much faster data processing and speed to insight. Alteryx allows users to build repeatable workflows that pull and blend various data sources, perform complex calculations including geocoding and geospatial calculations and output maps or data sources that can be read into standard GIS software. Tableau allows users to build interactive dashboards that empower businesses to do self-service analytics and queries that include maps and spatial overlays. Mapbox is a web-based service provider that integrates with Tableau and many other systems to allow for scalable and informative background maps. While each of us are classically trained geographers, we have seen the value in the time and efficiency gained in use of these non-traditional tools in our careers, all without violating the basic cartographic principles that we all learned in earning our degrees. These tools combine ease of use with significant analytical capabilities that empower businesses to gain faster insight and make faster decisions. Please join us for a discussion and demonstration of these tools.
STUDENT PAPER COMPETITION 2 [PAPER SESSION] Room: Ballroom KENT Chair: Brandon Vogt, University of Colorado Colorado Springs, CO
The Geography of Financial Complaints in the United States Kuo Siong (Gordon) Tan, State University of New York at Buffalo, NY
The use of VIIRS DNB imagery and social media data as proxies for urban electric consumption estimations at fine spatial and temporal scales
Weiying Lin and Chengbin Deng, Binghamton University, State University of New York
ENVIRONMENTAL GEOGRAPHY RESEARCH 1 [PAPER SESSION] Room: Ballroom McGILVREY Chair: Cuizhen (Susan) Wang, University of South Carolina, SC
Rapid Reconstruction of Flood Inundation by Integrating Social media and Post-Event Satellite Imagery
Cuizhen (Susan) Wang and Xiao Huang, University of South Carolina, SC

10
AGC 2018, THURSDAY, 11/1/2018
Can A Conceptual Model Using Environmental, Economic, and Social Factors Be Used to Guide the Planning and Valuation of Multi-Use Trails in Urban Areas?
Karen Gallagher and Patrick Lawrence, University of Toledo, OH Space Differentiation Research on Tibet Tourism Climate Resources
Chunhua Li, Qinghai Normal University, China Spatial Pattern of Environmental Migration in Oyo State Nigeria
Funmilayo Odubiyi, University of Ibadan, Oyo State, Nigeria and Ahmed Ogunwale, Crescent University, Abeokuta, Ogun State, Nigeria
OTHERWISE APPLIED GEOGRAPHIES [PAPER SESSION] Room: 221 (2nd Floor) Session Organizers: Alex R. Colucci, Kent State University Panelists: James A. Tyner, Kent State University, OH Session Description:
This session is organized in an effort to broaden and deepen the range of so-called “applied geography” so that it more immediately reflects the wide array of modes of scholarship that exist throughout the discipline. Our attempt at adding to what applied geography is necessitates that we assess and engage with—both implicitly and explicitly at times—the language of applied geography. Through this process we make connections between what a language of an applied geographies could be, should it more thoroughly engage with the languages and otherwise applied practices of geographers that thrive elsewhere in the discipline. Therefore, this session deals with scholarly practices that direct diverse geographic knowledges towards activism, protest, public pedagogy, community engagement, social and environmental justice, geographic education, and destabilizing political language. In so doing we ask and seek to answer two related questions: what would it look like to apply geographical knowledge in social contexts beyond the status quo of social relations inside and outside of academia, and how could applied geographical knowledge that is not viewed as “relevant,” “valuable” or “relatable” in this current context of social relations be applied to change it? Biography, Activism, and the Applied Geography of Paul Robeson
Mark Rhode, Kent State University, OH Public Pedagogy as Applied Geography: Youth for Peace, Artistic Expressions, and Understandings of the Cambodian Genocide
James A. Tyner, Kent State University, Kent, OH Assessing the Potential for Urban Agriculture at Religious Institutions in Kent, Ohio
Alex R. Colucci and Amanda N. Colucci, Kent State University, OH

11
AGC 2018, THURSDAY, 11/1/2018
I Can't Walk These Tomatoes 100 Yards': Food Justice on an American University Campus
Chris Post, Kent State University, OH Landscape of Climate Change Resilience
Michael J. Allen, Old Dominion University, VA GEOSPATIAL ANALYSIS 2 [PAPER SESSION] Room: 321 (3rd Floor) Chair: Lee Stocks, Jr. Mansfield University, PA
Riverscapes of Low Order Headwater Streams Using Terrestrial LiDAR Ranbir Singh Kang, Western Illinois University, IL
Spatio-temporal Evolution of Water Areas and Farmlands in Northeast China Based on Remote Sensing Data
Chengpeng Lu, Chinese Academy of Sciences, China GIS Modeling of the Invasive Species Purple Loosestrife and Japanese Stilt Grass in the Southern Appalachians
Christopher A. Badurek, State University of New York at Cortland, NY Application of Ground Penetrating Radar in Clandestine Grave Surveys
Lee Stocks, Jr., Cecil Cooper, and Jesse Olsen, Mansfield University, PA Using Earth Observational Satellite Data to Explore the Influence of Land Use and Land Cover change on Water Quality in Cancer Villages in China
Xin Hong, Kent State University, OH
4:00 pm – 5:30 pm BUSINESS AND ECONOMIC GEOGRAPHY 1 [PAPER SESSION] Room: Ballroom DIX Chair: Tony Hernandez, Ryerson University, Canada
The Role of Demographic Data Bias in the Under-Provision of Retail: A Case of Grocery Desert Tracts in 23 Southern Cities
William Graves and Zoey Zhang, University of North Carolina Charlotte, NC
The Role of Retailing in Inner Urban Space: The Hearth of Small Cities in South Europe
Ana Vera, Àngel Cebollada, Àngels Pèrez, and Marc Castelló, Universitat Autònoma de Barcelona, Cerdanyola (Barcelona), Spain
Exploring brand preference and its spatial patterns in the Chinese automobile market
Wei Song, University of Louisville, KY The Geography of Automobile Retailing in the Toledo Metropolitan Region of Ohio

12
AGC 2018, THURSDAY, 11/1/2018
Kefa M. Otiso, Bowling Green State University, OH From Conspicuous Consumption to Complete Community: Shopping Centre Redevelopment in Canada
Tony Hernandez, Ryerson University, Canada WHITER RURAL AND URBAN: RURAL AND URBAN CLASSIFICATION RESEARCH AT THE CENSUS BUREAU [PAPER SESSION] Room: 221 (2nd Floor) Organizer and Chair: Michael R. Ratcliffe, Census Bureau, Washington, DC Panelists: Michael R. Ratcliffe, Census Bureau, Washington, DC Jennifer Zanoni, Census Bureau, Washington, DC Michael Commons, Census Bureau, Washington, DC Jennifer Mapes, Kent State University Session Description:
Recent years have seen an increase in interest in how best to define “rural” and “urban,” moving away from a simple dichotomy to a range of categories that more appropriately reflect various settlement types and contexts. In this session, we discuss research at the Census Bureau focused on defining rural statistical areas as well as evaluating proposals for global classifications of settlement types. These research and evaluation projects have sparked thoughts about potential changes to the Census Bureau’s urban-rural classification. Our goal for this panel session is to begin a conversation about how best to classify urban and rural landscapes for use in analysis and program implementation.
APPLIED GEOGRAPHY AND THE GREEN INDUSTRY Room: 321 [3rd Floor] Organizers: Deborah Sheeler and Michael Binkley, Davey Tree Expert Company,
OH Chair: Michael Binkley, Davey Tree Expert Company, OH Session Description:
The 2018 edition of the Applied Geography Conference in Kent, Ohio is held right down the street from the headquarters of North America’s oldest tree care business, The Davey Tree Expert Company. Founded in 1880 and currently with operations throughout North America, Davey is committed to scientifically-based horticultural and environmental services combined with outstanding client service. Davey Tree is Ohio’s largest employee-owned company and the twelfth-largest in the nation with a unique focus on employee development and safety. This session will

13
AGC 2018, THURSDAY, 11/1/2018
demonstrate various end points of geographic research with actual practices implemented in a business environment. Utilizing Vegetation Management Software for Utility Mapping
Justin Walters and Kristin Lust, Davey Resource Group, Inc., Ohio A Proactive Approach for ROW Vegetation Management Using GIS and Remotely Sensed Data
Deborah E. Sheeler and William Ayersman, Davey Resource Group, Inc., OH
A Year in the Life of A GIS Analyst at A Tree Care Company Emmanuel Ong and Michael Binkley, The Davey Tree Expert Company, OH
I-Tree: Free Tools to Quantify Tree Benefits Michael Binkley, The Davey Tree Expert Company, OH
6:30 PM – 8:30 PM
BOARD OF DIRECTORS MEETING Room: 2nd Floor Board Room

14
AGC 2018, FRIDAY, 11/2/2018
Friday, November 2
8:00 am – 12:00 pm POSTER - REGULAR POSTER SESSION Room: TBA
High Resolution Mapping of the Urban Heat Island Dillon Tennis and Christopher Labosier, Longwood University, VA
Spline Plots for Time Series Visualization of Annual Heating and Cooling Degree Day Totals in the Climate Divisions of North Carolina
Dennis J. Edgell, University of North Carolina, Pembroke, NC Change Detection in a Post-Industrial Environment
Jacob Taylor, Ohio University, OH Slum Identification Mapping: An Object-Based Image Analysis of Slums in Dares Salaam, Tanzania
Peyton Moran and Ethan Willis, University of North Alabama, AL The Evolution and Reconstruction of Industrial Ecosystems of Mining Cities in the Traditional Industrial Area of Northeastern China: A Case Study of Dashiqiao in Liaoning Province
Yu-Pu Huang, University of Chinese Academy of Sciences, Beijing, China
8:30 am – 10:00 am BUSINESS AND ECONOMIC GEOGRAPHY 2 [PAPER SESSION] Room: Ballroom DIX Chair: Michael Ratcliffe, Census Bureau, Washington, DC
Research on the Space Consistency between Population Distribution and Economic Development in the Yangtze River Economic Belt of China
Huali Xiang, Zhongnan University of Economics and Law, China Spatial Inequality in Ecuador: A Structural Gap Approach
Ramiro Canelos-Salazar, Autonomous University of Barcelona Cerdanyola and Universidad Nacional de Ecuador, Montserrat Pallares-Barbera and Ana Vera, Autonomous University of Barcelona Cerdanyola (Barcelona), Spain
Spatial Differentiation of Digital Economy and Its Influencing Factors in China
Junfeng Tian, Jilin University, Binyan Wang and Shijun Wang, Northeast Normal University, China

15
AGC 2018, FRIDAY, 11/2/2018
AGRICULTURE, ENTERPRISES, AND SOCIETY [PAPER SESSION] Room: Ballroom KENT Chair: Brian Waldron, University of Memphis, TN
Assessing Health of the Cele Oasis for Agricultural Production and Expansion
Brian Waldron, University of Memphis, TN, Dongwei Gui, Institute of Ecology and Geography, Xinjiang, China, and Heng Dai, Jinan University, Guangdong, China
Rice Farming Water Use in Texas, 2012-1016: Quantifying the Effects of Time and Conservation on Purchased Water
Timothy T. Loftus, Russell C. Weaver, John Q. Barnard IV, Texas State University, TX
Expedient Inequity: New York State's Registered Sex Offenders Darrell A. Norris, SUNY College of Geneseo, NY
On the Micro-Geography of An Emergent Entrepreneurial Support Ecosystem: Cooperation, Competition, and Coopetition
John R. Lombard, Old Dominion University, Nofolk, VA ENVIRONMENTAL GEOGRAPHY RESEARCH 2 [PAPER SESSION] Room: Ballroom McGILVREY Organizer: Claton Whiteside, Coastal Carolina University, SC Chair: Dawna Cerney (Youngstown State University)
Trend Analysis of Spatiotemporal Patterns of Shoaling in the Fort-McHenry Channel Chesapeake Bay, Maryland
Abiye Williams and Kang Shou Lu, Towson University, MD Determining Habitat Fragmentation Type, Density, and Distribution in the Castle Crown, Alberta to Identify Ecosystems and Resource Use Management Strategies for Two New Provincial Parks
Dawna Cerney and Peter Kimosop, Youngstown State University, OH and Clayton Whiteside, Coastal Carolina University, SC
Spatial and Temporal Variations of Particulate Matter Concentrations in China in 2015
Pengfei Liu and Ziyun Jing, Henan University, China Perceptual Change of Environment in Sundarban Areas: Vulnerability and Risk Measurement
Ayan Rudra and Aparajita Chattopadhyay, India PLUS PUBLIC: TRANSFORMING COMMUNITIES VIA PARTICIPATORY DESIGN THINKING [WORKSHOP] Room: TBA

16
AGC 2018, FRIDAY, 11/2/2018
Presentor: Raymond J. Thompson, Public Plus, Youngstown, OH Session Description:
Utilizing the discipline of graphic design as a catalytic influencer for social and cultural change can manifest in a variety of ways. Sometimes, though, no matter how good the design is, change can be small and incremental, and small change is usually tethered to budgets, the scope of service, and a specific target audience’s ability to act on what is being communicated to them. Thus, big change requires big thinking and bigger strategy – and one of the most impactful ways to affect community transformation through design is to redefine, through branding, the places in which we all live, work, play, and learn. Plus Public creates transformative stories of the revitalization of people and places by designing scalable and sustainable communication solutions to economically-challenged communities-in-revival. To better articulate this process, this presentation will also include an interactive design thinking workshop, providing actionable direction on how to kickstart comprehensive branding strategies and storytelling initiatives inspired by memorable places and innovative people.
10:15 am – 12:00 pm TEACHING AND LEARNING WITH BUSINESS ANALYST WEB [WORKSHOP] Room: Ballroom DIX Organizer: Joseph Kerski, ESRI, Inc. Chair: Joseph Kerski, ESRI, Inc. Presenter: Joseph Kerski, ESRI, Inc. HEALTH AND MEDICAL GEOGRAPHY 1 [PAPER SESSION] Room: Ballroom KENT Chair: Chetan Tiwari, University of North Texas, TX
Geodatabase Development for Health Intervention Carol Campbell, Jill McDonald, and Arthur Guerrero, New Mexico State University, NM
Spatial Variations in the Associations of Adult Obesity Rate with Altitude in the United States
Hoehun Ha, Auburn University, Alabama The Geography of Retail Clinics Post Affordable Care Act
Ethan Portillo and Chetan Tiwari, University of North Texas, TX Using GIScience to Control the Statistical Reliability and Spatial Resolution of Disease and Mortality Maps

17
AGC 2018, FRIDAY, 11/2/2018
Chetan Tiwari, University of North Texas, TX BEYOND RUST BELT PORN [PAPER SESSION] Room: Ballroom McGILVREY Organizers: Dawna Cerney, Youngstown State University, OH, Chair: Dawna Cerney, Youngstown State University, OH Session Description:
Over the last forty years a cliched image of the Rust Belt has been pervasive; which includes dilapidated communities, abject poverty, abandon skeletons of an industrial heritage and hopelessness. Artists to campaigning politicians have successfully capitalized on this common and limited theme. In doing so they have continued to perpetuate an increasingly false image of many Rust Belt communities and their people. These narratives are not the full story of this region and specifically North East Ohio. This session casts light onto the positive transformations this region has experienced; these transformations were born out of resilient grass roots movements, regional innovative planning, that has drawn global acclaim, and tapping into national movements and local innovation. Old attachments to a singular industrial past, that resulted in decades of social instability are being replaced with new directions for diverse economic, and social futures. Resistance to Environmental Activism in Youngstown, Ohio
Raymond E. Beiersdorfer and Susan L. Beiersdorfer, Youngstown State University, OH
The Impact of Rental Properties on Blighted Neighborhoods of Youngstown, Ohio
Jennifer Burrell, Kent State University, OH The City of You Raymond. J. Thompson, Youngstown State University, OH Economic Development of Youngstown – Past, Present, and Future – Through the Stories of Three Buildings
Tom Maraffa, Youngstown State University, OH Student Veteran Choices of Post-Secondary STEM Programs in Northeast Ohio
Ryan Portelo, Youngstown State University, OH GEOSPATIAL ANALYSIS 3 [PAPER SESSION] Room: 321 (3rd Floor) Chair: Jonathan C. Comer, Oklahoma State University, OK

18
AGC 2018, FRIDAY, 11/2/2018
Using Geographic Information Systems (GIS) to Estimate Economic Values of Amazonian Forests: Oligarchic Forests, Challenges and Lessons Learned Over Time and Space
Jim Penn, Grand Valley State University, MI GIS-Based Performance Assessment of the Industrial Development in Tiexi District of Shenyang, China
Shuheng Dong, Chinese Academy of Sciences, China Monitoring of Coastline Changes in Al Seefa Area, Sultanate of Oman: A Study in Applied Geomorphology
Youssef Sherief, Sultan Qaboos University, Sultanate of Oman and Zagazig University, Egypt
The Looming Pilot Shortage: Pilot Production and Flight Training Facilities in the US
Jonathan C. Comer and Thomas A. Wikle, Oklahoma State University, OK
12:10 pm – 1:50 pm
CONFERENCE LUNCHEON AND KEYNOTE ADDRESS
Room: TBA Speaker: John W. Frazier, Binghamton University, NY
Topic: Applied Geography through Story Map: A Case Study in Community Engagement, Departmental Collaboration, and Potential Outcomes
2:00 pm – 3:30 pm Business and Economic Geography 3 [PAPER SESSION] Room: Ballroom DIX Chair: Eugene Tettey-Fio, Binghamton University, NY
Housing Price Analysis Using A Multilevel Modeling Approach: The Case of Lucas County, Ohio
Yanqing Xu and Dan Hammel, University of Toledo, OH The Cost of Manufacturing Jobs: Using A Quasi-Experimental Approach to Evaluate Job and Income Creation by Southern Auto Plants, 1983-2016
William Graves, The University of North Carolina at Charlotte,NC Business Strategies, Linkages, and Cluster Development in A Small-City Context
Murray D. Rice, University of North Texas, TX The Changes in Retail Trade Patterns in Muscat, Sultanate of Oman

19
AGC 2018, FRIDAY, 11/2/2018
Montasser Ibrahim Mahmoud Abdelghani, Sultan Qaboos University, Oman
HEALTH AND MEDICAL GEOGRAPHY 2 [PAPER SESSION] Room: Ballroom KENT Chair: Debarchana Ghosh, University of Connecticut, CT
A Geospatial Analysis of the Health Impacts of Oil Spills in the Niger Delta of Nigeria
Chijioke Anyanwu, Ohio University, OH Prevalence of Obesity in Kuwait: A Case Study among Kuwait University Students
Mohammad Alnasrallah and Muhammad Almatar, Kuwait University, Kuwait:
Community Resilience to the Dengue Virus in Sri Lanka Naomi W. Lazarus, California State University Chico, CA
ARTIST INTERACTION WITH GEOGRAPHY: FROM INSPIRATION OF PLACE TO TRANSFORMATION WITH COMMUNITY SPACE [PANEL SESSION] Room: TBA/Ballroom McGILVREY and Atrium Organizers: Dawna Cerney, Youngstown State University Presenters: Dragana Crnjak, Youngstown State University Carl Leet, Professional Photographer, Hubbard, Ohio Dana Sperry, Youngstown State University Session Description:
Artist interaction with geographic space is inherit and reflective in their work and is apparent through common language shared with geographers on how they approach exploring space. Three regional artists, displaying their work under the theme “Not Your Rust Belt Porn” at the 2018 AGC discuss how: place influences their creative process; the active process of creativity is used as a mechanism to purposefully transform physical locations and the activities within those locations; the poignant resolve of public art can influence local politics and connecting globally through social media with other artists to create local art exhibits. Locational work span from local – Youngstown; to regional - Chicago, to Global – Ice Land, Amsterdam and New Zealand.
GEOGRAPHY, ENVIRONMENT, AND JUSTICE [PAPER SESSION] Room: 221 (2nd Floor) Chair: Jay L. Newberry, Binghamton University, NY
Sentencing Reform Pre- and Post-Booker: The Case for Equality Jay L. Newberry, Binghamton University, NY
20
AGC 2018, FRIDAY, 11/2/2018
The Insurgent State and the Spatialization of Political Control during the Vietnam War January 1967 - December 1968
Gordon A. Cromley, Kent State University, OH Geographic Consequences of Jordan's Refugee Policy
Kevin Romig, Northwest Missouri State University, MO Summit Registers in the Southern Appalachians
Clayton J. Whitesides, Coastal Carolina University, SC Expedient Inequity: New York State's Registered Sex Offenders
Darrell A. Norris, SUNY College of Geneseo, New York GEOSPATIAL ANALYSIS 4 [PAPER SESSION] Room: 321 (3rd Floor) Chair: Fahui Wang, Louisiana State University, LA
A Spatio-temporal Kernel Density Estimation Approach to Predicting Hotspot Mapping
Yuji Hu, University of South Florida, Fahui Wang, Cecile Guin, and Haojie Zhu, Louisiana State University, LA
The Spatio-Temporal Nature of Crime Hotspots Huiyu Lin, Kent State University, OH
GIS-Based Approaches to Measuring the Spatial Equity of Endowment Facilities and Their Location Optimization
Shuju Hu, Northeastern Normal University, China Analysis of Temporal and Spatial Distribution and Influencing Factors of Theft Cases in Chicago
Xiaobo Zhu, Shanghai Police College, Xin Li, China University of Petroleum, and Xinrong Ding, Shanghai Police College, China
Simulating Spatial Diffusion of Memes over Social Media Networks Zhua Chen and Jay Lee, Kent State University, OH
3:30 pm – 4:30 pm
Editorial Board Meeting Papers in Applied Geography
Room: 2nd Floor Board Room

ABSTRACTS
Presentation Abstracts
of the
2018 Applied Geography Conference
at
Kent State University Hotel and Conference Center Kent, Ohio 44240
- 22 -
Contents WEDNESDAY, 10/31/2018 .................................................................................. - 28 -
APPLIED COMMUNITY GEOGRAPHY: OPEN SPACE PLANNING ............................... - 28 -
EXPLORING MACHINE LEARNING STRATEGIES TO PREDICT SUSTAINABLE LAND COVER ARRANGEMENTS IN AN URBAN SETTING ............................................................... - 28 -
SPACE DIFFERENTIATION RESEARCH ON TIBET TOURISM CLIMATE RESOURCES ... - 29 -
PERCEPTION OF PUBLIC ART ................................................................................... - 29 -
LONG-TERM TRENDS IN THE FREQUENCY OF NORTH AMERICAN WEATHER TYPES - 29 -
TEMPORAL TRENDS IN ABSOLUTE AND RELATIVE EXTREME TEMPERATURE ECENTS ACROSS NORTH AMERICA....................................................................................... - 30 -
DIURNAL TEMPERATURE RANGE AND THE ASSOCIATED SYNOPTIC CHARACTERISTICS AROUND LAKE ERIE, 1986-2015.............................................................................. - 31 -
CHINA’S URBAN AND REGIONAL DEVELOPMENT AND PLANNING OVER THE COURSE OF 40 YEARS ............................................................................................................ - 31 -
URBAN PLANNING, HEALTH AND QUALITY OF LIFE: ANALYZING THE CONSISTENCY IN BARCELONA’S CERDÀ GRID-ORIENTATION USING LIDAR TECHNOLOGY ................ - 32 -
MULTI-FIELDS AND CULTURAL-CREATIVE INDUSTRIAL CLUSTER INNOVATION: A CASE STUDY OF JUN PORCELAIN INDUSTRY OF SHENHOU IN CHINA .............................. - 32 -
THE ELASTIC CHARACTERISTICS OF URBAN CONSTRUCTION LAND GROWTH IN CHINA- 33 -
COMMUNITY GEOGRAPHY IN ACTION: AN EXAMPLE PARTNERSHIP BETEWEEN TEXAS STATE UNIVERISTY AND PEOPLE UNITED FOR SUSTAINABLLE HOUSING ............... - 33 -
A LONGITUDINAL ANALYSIS OF MAPS PUBLISHED IN GEOGRAPHY JOURNALS, 1987-2017 ........................................................................................................................ - 34 -
K-12 EDUCATION: SOLVING REAL WORLD ISSUES THROUGH NASA CONTENT & GIS.... - 34 -
GEOGRAPHY IN KOREAN EARLY CHILDHOOD EDUCATION ..................................... - 35 -
GLOBAL COLD AIR OUTBREAKS ............................................................................... - 35 -
REGIONAL EVALUATION OF CLIMATE VULNERABILITY AT THE START OF THE 21ST CENTURY IN SOUTHWEST RUSSIA .......................................................................... - 35 -
SUMMER IN THE CITY: HEAT TRENDS IN URBAN ALABAMA, 1958-2017 ................ - 36 -

- 23 -
THURSDAY, 11/1/2018 ........................................................................................ - 37 -
DEER DETECTION IN A NATURE PRESERVE: APPLYING GEO-SPATIAL ANALYSIS .... - 37 -
STATE AND LOCAL ROLES IN THE EXPANSION AND REDEVELOPMENT OF A RUST BELT, JOHNSON CITY, NEW YORK ..................................................................................... - 37 -
URBAN REVITALIZATION IN SMALL DEPRESSED CITIES: CASE STUDIES ON THE SHORT-TERM IMPACTS OF NEW INVESTMENT IN SMALL-SCALE US CITIES ........................ - 37 -
APPLICATION OF GEOVISUALIZATION METHODS FOR ASSESSING THE FLOOD OF 2011 IN BINGHAMTON, NY .............................................................................................. - 38 -
THE GEOGRAPHY OF FOOD PANTRIES IN RELATION TO INCOME – THE CASE OF A RUSTBELT CITY IN UP-STATE NEW YORK ................................................................. - 38 -
ACCESS TO HIV CARE AND ADDICTION TREATMENT AMONG STIGMATIZED POPULATION OF OPIOID-DEPENDENT PEOPLE LIVING WITH HIV ........................... - 39 -
AN ANALYSIS OF THE IMPACT OF VACANT AND ABANDONED PROPERTIES ON DRUG-RELATED CRIME IN JEFFERSON COUNTY, KENTUCKY .............................................. - 39 -
IS THE MACY'S IN MY MALL GOING TO CLOSE? UNCOVERING THE FACTORS ASSOCIATED WITH THE CLOSURES OF MACY'S, SEARS, AND J.C. PENNEY STORES . - 40 -
FLOOD AWARENESS AMONG COLLEGE STUDENTS IN FLASH FLOOD ALLEY ........... - 40 -
THE ROLE OF METEOROLOGICAL HAZARDS IN URBAN TOURISM: THE CASE OF HAMPTON ROADS 2013-17 ..................................................................................... - 40 -
VULNERABILITY, PRE-DISASTER AWARENESS, AND SOCIAL MEDIA: A CASE STUDY OF HURRICANE SANDY WITH TWITTER DATA .............................................................. - 41 -
TORNADO WATCH #211: 30 YEARS LATER. A SPATIAL ANALYSIS OF THE MAY 31, 1985 TORNADOES USING PRESENT-DAY DATA FOR THE STATE OF PENNSYLVANIA ....... - 41 -
PUBLIC DEBT AND REGIONAL INEQUALITY IN INDIA: AN EXPLORATORY SPATIAL DATA ANALYSIS ................................................................................................................. - 42 -
STUDIES OF TOURISM GEOGRAPHY IN INDIA: DEFINITION, APPROACHES, AND PROSPECTS .............................................................................................................. - 42 -
LEVERAGING BREWING HISTORY: THE CASE OF CINCINNATI’S OVER-THE-RHINE NEIGHBORHOOD ..................................................................................................... - 43 -
A COMPARATIVE STUDY ON THE SOFTENING OF MANUFACTURING INDUSTRY INPUT STRUCTURE ............................................................................................................. - 44 -
A REVIEW OF PRESERVATION PRACTICES AND ATTITUDES IN HISTORIC DISTRICT ACT MUNICIPALITIES OF PENNSYLVANIA ....................................................................... - 44 -
EVALUATING THE ACCURACY OF TERRAIN DATA GENERATED USING THE UAS-SFM WORKFLOW ............................................................................................................ - 45 -

- 24 -
SPATIAL VARIATION OF TERRAIN RELIEF AND ITS IMPACTS ON POPULATION AND ECONOMY BASED ON RASTER DATA IN WEST HENAN MOUNTAIN AREA .............. - 45 -
MAPPING FUEL CONTINUITY TO PREVENT AND PLAN WILDLAND URBAN INTERFACE USING LIDAR TECHNOLOGY .................................................................................... - 46 -
UTILIZATION OF INFORMATION AND COMMUNICATION TECHNOLOGIES BY STUDENTS OF THE UNIVERSITY OF GHANA, LEGON ............................................... - 47 -
THE GEOGRAPHY OF FINANCIAL COMPLAINTS IN THE UNITED STATES ................. - 47 -
PAPER SUBMISSION (STUDENT COMPETITION ENTRY) .......................................... - 47 -
THE USE OF VIIRS DNB IMAGERY AND SOCIAL MEDIA DATA AS PROXIES FOR URBAN ELECTRIC CONSUMPTION ESTIMATIONS AT FINE SPATIAL AND TEMPORAL SCALES - 47 -
RAPID RECONSTRUCITON OF FLOOD INUDATION BY INTEGRETING SOCIAL MEDIA AND POST-EVENT SATELLITE IMGERY ..................................................................... - 48 -
CAN A CONCEPTUAL MODEL USING ENVIRONMENTAL, ECONOMIC, AND SOCIAL FACTORS BE USED TO GUIDE THE PLANNING AND VALUATION OF MULTI-USE TRAILS IN URBAN AREAS? ................................................................................................... - 48 -
SPACE DIFFERENTIATION RESEARCH ON TIBET TOURISM CLIMATE RESOURCES ... - 49 -
SPATIAL PATTERN OF ENVIRONMENTAL MIGRATION IN OYO STATE NIGERIA....... - 49 -
BIOGRAPHY, ACTIVISM, AND THE APPLIED GEOGRAPHIES OF PAUL ROBESON ..... - 50 -
PUBLIC PEDAGOGY AS APPLIED GEOGRAPHY: YOUTH FOR PEACE, ARTISTIC EXPRESSIONS, AND UNDERSTANDINGS OF THE CAMBODIAN GENOCIDE .............. - 50 -
ASSESSING THE POTENTIAL FOR URBAN AGRICULTURE AT RELIGIOUS INSTITUTIONS IN KENT, OHIO ........................................................................................................ - 51 -
‘I CAN’T WALK THESE TOMATOES 100 YARDS’: FOOD JUSTICE ON AN AMERICAN UNIVERSITY CAMPUS .............................................................................................. - 51 -
LANDSCAPE OF CLIMATE CHANGE RESILIENCE ....................................................... - 52 -
RIVERSCAPES OF LOW ORDER HEADWATER STREAMS USING TERRESTRIAL LIDAR- 52 -
Spatio-temporal evolution of water areas and farmlands in Northeast China based on remote sensing data ............................................................................................... - 52 -
GIS MODELING OF THE INVASIVE SPECIES PURPLE LOOSESTRIFE AND JAPANESE STILT GRASS IN THE SOUTHERN APPALACHIANS ............................................................. - 53 -
APPLICATION OF GROUND PENETRATING RADAR IN CLANDESTINE GRAVE SURVEYS .. - 53 -
USING EARTH OBSERVATIONAL SATELLITE DATA TO EXPLORE THE INFLUENCE OF LAND USE AND LAND COVER CHANGE ON WATER QUALITY IN CANCER VILLAGES - 54 -

- 25 -
THE ROLE OF DEMOGRAPHIC DATA BIAS IN THE UNDER-PROVISION OF RETAIL: A CASE STUDY OF GROCERY DESERT TRACTS IN 23 SOUTHERN CITIES ...................... - 54 -
THE ROLE OF RETAILING IN INNER URBAN SPACES: THE HEARTH OF SMALL CITIES IN SOUTH EUROPE ....................................................................................................... - 55 -
EXPLORING BRAND PREFERENCE AND ITS SPATIAL PATTERNS IN CHINESE AUTOMOBILE MARKET. .......................................................................................... - 55 -
THE GEOGRAPHY OF AUTOMOBILE RETAILING IN THE TOLEDO METROPOLITAN REGION OF OHIO .................................................................................................... - 55 -
FROM CONSPICUOUS CONSUMPTION TO COMPLETE COMMUNITY: SHOPPING CENTRE REDEVELOPMENT IN CANADA ................................................................... - 56 -
UTILIZING VEGETATION MANAGEMENT SOFTWARE FOR UTILITY MAPPING ......... - 56 -
A PROACTIVE APPROACH FOR ROW VEGETATION MANAGEMENT USING GIS AND REMOTELY SENSED DATA ....................................................................................... - 57 -
A YEAR IN THE LIFE OF A GIS ANALYST AT A TREE CARE COMPANY ....................... - 57 -
I-TREE: FREE TOOLS TO QUANTIFY TREE BENEFITS ................................................. - 57 -
FRIDAY,11/2/2018 ................................................................................................. - 59 -
HIGH RESOLUTION MAPPING OF THE URBAN HEAT ISLAND .................................. - 59 -
SPLINE PLOTS FOR TIME SERIES VISUALIZATION OF ANNUAL HEATING AND COOLING DEGREE DAY TOTALS IN THE CLIMATE DIVISIONS OF NORTH CAROLINA ............... - 59 -
CHANGE DETECTION IN A POST-INDUSTRIAL ENVIRONMENT ................................ - 60 -
SLUM IDENTIFICATION MAPPING: AN OBJECT-BASED IMAGE ANALYSIS OF SLUMS IN DAR ES SALAAM, TANZANIA ................................................................................... - 60 -
THE EVOLUTION AND RECONSTRUCTION OF INDUSTRIAL ECOSYSTEMS OF MINING
CITIES IN THE TRADITIONAL INDUSTRIAL AREA OF NORTHEASTERN CHINA A CASE STUDY OF DASHIQIAO IN LIAONING PROVINCE ...................................................... - 61 -
RESEARCH ON THE SHORT-TERM AND LONG-TERM EFFECTS OF ENVIRONMENTAL POLLUTION ON HEALTHY HUMAN CAPITAL. .......... - 61 -
SPATIAL INEQUALITY IN ECUADOR: A STRUCTURAL GAP APPROACH ..................... - 62 -
SPATIAL DIFFERENTIATION OF DIGITAL ECONOMY AND ITS INFLUENCING FACTORS IN CHINA ...................................................................................................................... - 62 -
ASSESSING HEALTH OF THE CELE OASIS FOR AGRICULTURAL PRODUCTION AND EXPANSION ............................................................................................................. - 63 -
RICE FARMING WATER USE IN TEXAS, 2012-2016: QUANTIFYING THE EFFECTS OF TIME AND CONSERVATION ON PURCHASED WATER .............................................. - 63 -

- 26 -
EXPEDIENT INEQUITY: NEW YORK STATE’S REGISTERED SEX OFFENDERS ............. - 64 -
ON THE MICRO-GEOGRAPHY OF AN EMERGENT ENTREPRENEURIAL SUPPORT ECOSYSTEM: COOPERATION, COMPETITION, AND COOPETITION......................... - 64 -
TREND ANALYSIS OF SPATIOTEMPORAL PATTERNS OF SHOALING IN THE FORT-MCHENRY CHANNEL CHESAPEAKE BAY, MARYLAND.............................................. - 64 -
DETERMINING HABITAT FRAGMENTATION TYPE, DENSITY, AND DISTRIBUTION IN THE CASTLE CROWN, ALBERTA TO IDENTIFY ECOSYSTEMS AND RESOURCE USE MANAGEMENT STRATEGIES FOR TWO NEW PROVINCIAL PARKS .......................... - 65 -
SPATIAL AND TEMPORAL VARIATIONS OF PARTICULATE MATTER CONCENTRATIONS IN CHINA IN 2015 .................................................................................................... - 66 -
PERCEPTUAL CHANGE OF ENVIRONMENT IN SUNDARBAN AREAS: VULNERABILITY AND RISK MEASUREMENT ...................................................................................... - 66 -
GEODATABASE DEVELOPMENT FOR HEALTH INTERVENTIONS .............................. - 67 -
SPATIAL VARIATIONS IN THE ASSOCIATIONS OF ADULT OBESITY RATE WITH ALTITUDE IN THE UNITED STATES ........................................................................................... - 67 -
THE GEOGRAPHY OF RETAIL CLINICS POST AFFORDABLE CARE ACT ...................... - 68 -
USING GISCIENCE TO CONTROL THE STATISTICAL RELIABILITY AND SPATIAL RESOLUTION OF D ISEASE AND MORTALITY MAPS................................................. - 68 -
RESISTANCE TO ENVIRONMENTAL ACTIVISM IN YOUNGSTOWN, OHIO ................ - 68 -
THE IMPACT OF RENTAL PROPERTIES ON BLIGHTED NEIGHBORHOODS OF YOUNGSTOWN, OHIO ............................................................................................. - 69 -
THE CITY OF YOU: REBRANDING YOUNGSTOWN, OHIO, A COMMUNITY-IN-REVIVAL .. - 69 -
ECONOMIC DEVELOPMENT OF YOUNGSTOWN--PAST, PRESENT AND FUTURE--THROUGH THE STORIES OF THREE BUILDINGS ....................................................... - 70 -
STUDENT VETERAN CHOICES OF POST-SECONDARY STEM PROGRAMS IN NORTHEAST OHIO ....................................................................................................................... - 70 -
USING GEOGRAPHIC INFORMATION SYSTEMS (GIS) TO ESTIMATE ECONOMIC VALUES OF AMAZONIAN FORESTS: OLIGARCHIC FORESTS, CHALLENGES AND LESSONS LEARNED OVER TIME AND SPACE ........................................................................... - 71 -
GIS-BASED PERFORMANCE ASSESSMENT OF THE INDUSTRIAL DEVELOPMENT IN TIEXI DISTRICT OF SHENYANG ......................................................................................... - 71 -
MONITORING OF COASTLINE CHANGES IN AL SEEFA AREA- SULTANATE OF OMAN, A STUDY IN APPLIED GEOMORPHOLOGY ................................................................... - 72 -

- 27 -
THE LOOMING PILOT SHORTAGE: PILOT PRODUCTION AND FLIGHT TRAINING FACILITIES IN THE US ............................................................................................... - 72 -
HOUSING PRICE ANALYSIS USING A MULTILEVEL MODELING APPROACH: THE CASE OF LUCAS COUNTY, OHIO ....................................................................................... - 73 -
THE COST OF MANUFACTURING JOBS: USING A QUASI-EXPIRIMENTAL APPROACH TO EVALUATE JOB AND INCOME CREATION BY SOUTHERN AUTO PLANTS 1983-2016- 73 -
BUSINESS STRATEGIES, LINKAGES, AND CLUSTER DEVELOPMENT IN A SMALL-CITY CONTEXT ................................................................................................................. - 74 -
THE CHANGES IN RETAIL TRADE PATTERNS IN MUSCAT, SULTANATE OF OMAN ... - 74 -
A GEOSPATIAL ANALYSIS OF THE HEALTH IMPACTS OF OIL SPILLS IN THE NIGER DELTA OF NIGERIA ............................................................................................................. - 74 -
PREVALENCE OF OBESITY IN KUWAIT: A CASE STUDY AMONG KUWAIT UNIVERSITY STUDENTS ............................................................................................................... - 75 -
COMMUNITY RESILIENCE TO THE DENGUE VIRUS IN SRI LANKA ............................ - 75 -
SENTENCING REFORM PRE- AND POST-BOOKER: THE CASE FOR EQUALITY .......... - 76 -
THE INSURGENT STATE AND THE SPATIALIZATION OF POLITICAL CONTROL DURING THE VIETNAM WAR JANUARY 1967 – DECEMBER 1968 ......................................... - 76 -
GEOGRAPHIC CONSEQUENCES OF JORDAN’S REFUGEE POLICY ............................. - 76 -
SUMMIT REGISTERS IN THE SOUTHERN APPALACHIANS ........................................ - 77 -
EXPEDIENT INEQUITY: NEW YORK STATE’S REGISTERED SEX OFFENDERS .............. - 77 -
A SPATIO-TEMPORAL KERNEL DENSITY ESTIMATION APPROACH TO PREDICTIVE HOTSPOT MAPPING ................................................................................................ - 78 -
THE SPATIO-TEMPORAL NATURE OF CRIME HOTSPOTS ......................................... - 78 -
GIS BASED APPROACHES TO MEASURING THE SPATIAL EQUITY OF ENDOWMENT FACILITIES AND THEIR LOCATION OPTIMIZATION .................................................. - 79 -
ANALYSIS OF TEMPORAL AND SPATIAL DISTRIBUTION AND INFLUENCING FACTORS OF THEFT CASES IN CHICAGO.................................................................................. - 79 -
SIMULATING SPATIAL DIFFUSION OF MEMES OVER SOCIAL MEDIA NETWORKS ... - 80 -

- 28 -
WEDNESDAY, 10/31/2018 AAPPLIED COMMUNITY GEOGRAPHY: OPEN SPACE PLANNING Christina Lopez ([email protected]), John Ponstingel ([email protected]), Milad
Korde ([email protected]) Daria Andrievskikh ([email protected]), the Geography Department, Texas State
University, San Marcos, Texas 78666. Abstract: Community geography is a recently formed subfield that typically applies public
participatory geographic information systems (PPGIS) as a means to bring about positive change to a community. This paper explores an alternative form of community geography by utilizing current and past geographically-focused literature to empower a nonprofit community partner to make appropriate landuse decisions; this diverse, historic, and low to moderate income community is experiencing rapid gentrification. Here, I detail the process of providing a nonprofit community partner, People United for Sustainable Housing (PUSH), with a comprehensive content analysis that synthesizes best practices and applied theoretical knowledge to create an open space plan.
Key Words: Community Geography, Open Space Planning, Content Analysis, Nonprofit Partnerships
========================================================= EXPLORING MACHINE LEARNING STRATEGIES TO PREDICT SUSTAINABLE LAND
COVER ARRANGEMENTS IN AN URBAN SETTING James K. Lein ([email protected]) Department of Geography. Ohio University, Athens, OH,
45701 Abstract: There have been several themes that have run constant in the practice of
environmental management and planning over the last several decades. Sustainability takes its place among these and has quickly become a decision construct that is actively re-shaping environmental policy and decision making. At present, there is a developing body of work that is attempting to define sustainability according to more precise criteria and produce methods of investigation that hope to facilitate its representation. Representation, as if sustainability is something that can be pointed to, introduces a temporal and spatial dimension that has not been well examined. When is something sustainable and where is something sustainable are two critical questions if sustainability is to become something more than an environmental “buzz-word”. Land use plans and policies designed to produce “sustainable” outcomes need to address the where and when enveloped in this concept. Neither question is easy to answer and pose frustrating challenges to those seeking a more scientific approach to the question of sustainable development. In this paper the question of sustainable development and the allocation of land uses within the urban pattern is explored through the application of artificial neural networks. By means of this approach, the research presented in this paper introduces an “intelligent” model that can prescribe sustainable land cover patterns based on a series of input landscape variables functionally connected to sustainability theory. Through this machine learning strategy, sustainability assumes a spatial expression and predicted patterns of future land use arrangements can be critically examined to better inform developmental policies and plans.

- 29 -
Key words: urban sustainability, land use development, neural networks, multi-layer perceptron
========================================================= SSPACE DIFFERENTIATION RESEARCH ON TIBET TOURISM CLIMATE RESOURCES Chunhua Li ([email protected]), College of Geography Science, Qinghai Normal
University, China 810008 Abstract: Climate factors affect tourism experience and timing directly. There is a huge
resource advantage in Tibet tourism. The study of tourism climate resources provides important reference to tourists, tour operators and managers. Using monthly average temperature, relative humidity, wind speed, sunshine time of Tibet during 1971— 2011, based on GIS and four indexes, tourism climate resources spatial differentiation of Tibet were analyzed. The results show that: cold or very cold time in Tibet during the year is very long, the body’s comfortable degree in November - the following April is uncomfortable and should not be suitable for tourist activity. Tourist comfortable period is generally in 5-9 months in southeast of Tibet such as Chayu, Linzhi, Bomi. In central Tibet such as Lhasa, Rikaze, Dingri and Nimu, tourist comfortable period is generally between 6-9 months, Shiquanhe,Pulan,Gaize lie in the southern edge of Tibet ,where the travel comfortable period is very short, mainly in July and August . There is no travel comfortable period all the year round in northern Tibet. Central a1nd southeastern Tibet possesses summer vacation function, which should be the key tourism development area of the plateau.
Key Words: Tibetan Areas, Tourism Climate Resource, GIS, Spatial Differentiation. =========================================================
PERCEPTION OF PUBLIC ART Jia Lu ([email protected]), Department of geoscience, Valdosta State University, Valdosta,
GA, 31698 Abstract: Public art is an important fabric of the culture of a community. Studies have
shown that public art, such as murals, sculptures, interactive fountains, and statues, have become places of pride and social gatherings, which build and strengthen a community. South Georgia is a community who values art and artists, and it is home for many galleries and local artists. However, no such study has been conducted for public perception of public art in South Georgia. The objective of this project is ascertain how public art shapes and influences the South Georgia community’s perception of the environment that they live in. This project examined various public art installations in South Georgia and surveyed hundreds of local residents regarding their opinions on public art installations. The survey was conducted both in person and online, and the results were analyzed in detail. The results suggested that public art caries influence over how people chose where to live and most people expressed appreciation of culture and beauty of the artwork. Thus, public art is necessary for a community to thrive. In addition, there is also a gap in their appreciation among people with different incomes, genders, and education levels. The results suggest that our government officials continue their support of public art and integrate art in their overall community planning strategies. Key Words: Community Planning, Urban Geography, Public Art, Survey
========================================================= LONG-TERM TRENDS IN THE FREQUENCY OF NORTH AMERICAN WEATHER TYPES

- 30 -
Cameron C. Lee ([email protected]) and Scott C. Sheridan ([email protected]), Department of Geography, Kent State University, Kent, OH. 44240
Abstract: The secular trends in many individual meteorological variables are well documented, however, the trends in multivariate synoptic-scale air masses – or weather types – largely remain unexplored. Utilizing a recently developed gridded weather typing classification system, this research investigates changes in the frequency of weather types (WTs) across North America, 1979-2017. On average, Humid-Warm WTs are occurring 22 more days/year, while Dry-Warm WTs have increased by 10 days/year. These increases are offset mostly by decreased frequency of Dry-Cool (-17 days/year) and Cool WTs (-21 days/year). The largest absolute changes are in the Canadian Archipelago, where the Warm WT is occurring +42 days/year and the Cool WT is occurring -48 days/year. In western Canada all humid types are occurring more frequently, including a Humid-Cool type that is occurring +16 days/year. The Desert Southwest US and northern Mexico show significant increases in Dry-Warm WTs (+33 to +40 days/year). Cold front and warm front passages show increases in most of the US and decreases in most of Canada. Considering the large magnitude of these trends, describing climate change using changed frequencies of intuitive weather types may be a more efficacious means of purveying the dramatic nature of climatic change to policymakers and the general public.
Key Words: Climate change; weather types; air masses; synoptic climatology; global warming; trends; GWTC
========================================================= TTEMPORAL TRENDS IN ABSOLUTE AND RELATIVE EXTREME TEMPERATURE ECENTS
ACROSS NORTH AMERICA Scott C. Sheridan ([email protected]) and Cameron Lee ([email protected]), Department
of Geography, Kent State University, Kent, OH 44240 Abstract: One of the most critical ways in which weather conditions influence the
environment is through extreme temperature events. While excessive heat and cold conditions have been amply studied, events that are extreme relative to the time of year have been less examined. In this research, we define extreme temperature events based on a recently defined Excess Heat Factor (EHF) to define Extreme Heat Events (EHE). Here, we extend the calculation to assess cold, and we develop ‘relative’ extreme temperature metrics to complement the absolute metrics, where extreme is based on to conditions relevant to seasonal means. We thus examine extreme cold events (ECE), relative extreme heat events (REHE), and relative extreme cold events (RECE) in addition to EHE. We present a climatology of these four variables for North America, followed by an analysis of temporal trends from 1980-2016. While EHE and ECE are found in the core of summer and winter, respectively, relative events tend to have a broader annual cycle, in particular REHE, for which the majority of events occur outside meteorological summer. Trends in REHE and EHE are upwards, and RECE and ECE are downwards; the relative events are changing slightly more rapidly than the absolute events.
Key Words: Extreme temperature events; heat wave; cold wave; acclimatization; climate change
=========================================================

- 31 -
DDIURNAL TEMPERATURE RANGE AND THE ASSOCIATED SYNOPTIC CHARACTERISTICS AROUND LAKE ERIE, 1986-2015
Ryan Adams ([email protected]), Sam Eitner, and Matthew Stiller, Department of Geography, Kent State University, Kent, OH 44242-0001
Abstract: Diurnal temperature range (DTR) is defined as the difference between the daily maximum and daily minimum temperature. DTR is a useful proxy in examining microclimates and how they help define regional weather and climate extremes as the climate system evolves. This paper addresses the micro-scale DTR variation around the Lake Erie region from 1986-2015. Eleven land-based stations were selected around Lake Erie to assess changes in DTR, including minima and maxima, and their relationship with the principle atmospheric circulation patterns that dominate this region. Trends in the maxima and minima temperature both show increases in temperature over the study period. Generally, DTR over the span of the study period does not change much due to the similar trends in minimum and maximum temperatures with a few exceptions (e.g. Wooster, Sandusky, Dearborn stations). North American Regional Reanalysis data and a self-organizing map (SOM) approach were used to assess the main atmospheric circulation patterns of the region for the entire timeframe. The SOM for the study area highlights the synoptic circulations that impact DTR. The response of maximum, minimum, and DTR across each synoptic pattern illustrate how temperature manifests along various atmospheric circulation patterns with the influence of Lake Erie. Largely, a south-southwesterly circulation pattern leads to significantly positive DTR anomalies for several stations; the geographical position of these stations relative to the lake waters exhibit varying magnitudes of minima, maxima and DTR for the timeframe.
Key Words: Climate, temperature, atmospheric circulation, self-organizing map =========================================================
CHINA’S URBAN AND REGIONAL DEVELOPMENT AND PLANNING OVER THE
COURSE OF 40 YEARS Yichun Xie ([email protected]), Department of Geography and Geology, Eastern Michigan
University, Ypsilanti MI 48197 Xueliang Zhang ([email protected]), School of Urban and Regional
Science, Shanghai University of Finance and Economics, Shanghai, China 200433 Abstract: In the recent 40 years, China has made significant achievements in economic
development and in urbanization as well. During this unprecedented transition period, the 9.6 million square kilometers of China was a giant laboratory, where various economic, social and cultural reforms and policies were tested. These experiments took place at many spatial scales (the nation, region, and city). Local governments particularly used the planning as "a competition apparatus for growth”, and adjusted the planning to target economic growth sought by local and regional governments. As the result, many cities were continuingly expanding the urban boundaries, annexing adjacent towns and villages, and even leading to vicious competitions among themselves. Consequently, this disorderly urban growth impaired urban comprehensive carrying capacity and sustainable development. In this paper, we will review the progress of regional development and urban growth, introduce the development and composition of China’s urban and regional planning, analyze the characteristics and methods of China’s urban and regional planning, and present a case study: urban development and planning in Shanghai to summarize our findings.
Key Words: Local Government, Regional Planning, Urban Expansion, Shanghai, China.

- 32 -
========================================================= UURBAN PLANNING, HEALTH AND QUALITY OF LIFE: ANALYZING THE CONSISTENCY
IN BARCELONA’S CERDÀ GRID-ORIENTATION USING LIDAR TECHNOLOGY Montserrat Pallares-Barbera ([email protected]), Anna Badia
([email protected]) and Meritxell Gisbert ([email protected]), Department of Geography, Universitat Autònoma de Barcelona, Carrer Fortuna S/N, Cerdanyola (Barcelona) Spain 08193
Abstract: Compact cities increase their temperature under the effects of heat island and global climate change. Important literature addressed passive energy cooling and solar urban planning. However, to date little is known about the relevant planning variables for getting insolation and natural ventilation. Failures in planning have caused important overuse of air conditioning and, in lower income areas, high temperatures put serious risk on their population. This paper addresses this important topic grounded on the Barcelona’s urbanization theory of Cerdà (1860); who already based his planning under both, insolation and wind flow of the urban fabric. In this research we concentrate to analyse the consistency in his pattern of orienting the urban grid for getting better insolation and wind-flow. Methodologically, to study the urban grid orientation consistency with winds and solar radiation, LiDAR (Light Detection and Ranging) technology and wind data are used to obtain digital elevation surface and to calculate insolation and wind flow in the streets in the summer solstice and the winter solstice. The results were contrasted by rotating the street grid 90 degrees north. We expect to confirm the following hypothesis. Firstly, streets are differently insolated depending on street grid orientation. Secondly, the height of the buildings project patterns of shadows in streets subject to the grid orientation. Thirdly, the direction of wind flow would enter differently to the city, depending on orientation of the urban solid. Finally, insolation and natural ventilation influence population comfort, health and decrease energy consumption creating a more sustainable urban environment, and improving quality of life.
Key Words: Insolation, natural ventilation, Cerdà, Barcelona, compact city, LiDAR. =========================================================
MULTI-FIELDS AND CULTURAL-CREATIVE INDUSTRIAL CLUSTER INNOVATION: A
CASE STUDY OF JUN PORCELAIN INDUSTRY OF SHENHOU IN CHINA Kewen LYU 1,2,3 ([email protected]) and Changhong MIAO 1,2 Lu GAO1 (1 Key Research Institute of Yellow River Civilization and Sustainable Development &
Collaborative Innovation Center on Yellow River Civilization of Henan Province, Henan University, Kaifeng 475001, China; 2. College of Environment and Planning, Henan University, Kaifeng 475004, China 3. Department of Geography,Kent State University,Kent State,44242,USA)
Abstract: Based on the characteristics of cultural-symbolic and cultural knowledge of cultural-creative industry, the paper absorbed the idea of creative field, field theory and social field, and discussed the relation between various fields and the process of knowledge flow, creation and learning about Jun Porcelain cultural-creative industrial cluster,and found that:(1) The production site was an important place where Jun Porcelain technicians could gain insights and create, accumulate Jun Porcelain skills and knowledge;(2)The occupation,slan and mentorship community played different and interrelated roles in the communication and transmission of Jun Porcelain technology

- 33 -
and design knowledge,jointly promoting the heritage of Jun Porcelain technology and knowledge; (3)Local social field provided a huge local knowledge base for local enterprise and the institutions,and contributed to technology and process knowledge flow of Jun Porcelain costless,leading to the imitation and interactive learning innovation among local Jun Porcelain enterprises; (4) Temporary field where cultural-creative agents and enterprises gathered together in short-term,was the global pipeline to local district which prevented the lock-in,and increased the updation and diversity of local knowledge,which supported the continuous innovation and development of local cluster;(5) The learning innovation of Jun Porcelain cluster was not a process occured in single field, but in multi-crossing fields,which contributed to sustainable innovation,competitiveness and energy of local cluster.
Key words: cultural-creative industry; creative field; Jun Porcelain industry; cluster innovation.
========================================================= TTHE ELASTIC CHARACTERISTICS OF URBAN CONSTRUCTION LAND GROWTH IN
CHINA Wengang Wang ([email protected]), College of Resources and Environment
Sciences, Hebei Normal University, Shijiazhuang, Hebei, 050024 CHINA Abstract: Since 1980s, cities in China have gradually entered a period of rapid
development. In this period, the urban population scale grew rapidly, and at the same time, the urban space scale was growing more rapidly. Even many scholars thought that the land urbanization of China was faster than population urbanization. The Chinese urbanization development is still in the rapid growth interval of the urbanization development curve, so the problem of urban space expansion has always been paid attention to by Chinese scholars. Compared with previous research, this paper will start from the perspective of urban construction land use, to discuss the elasticity of urban spatial growth from the overall level, analyze the population elasticity and economic elasticity of the urban space growth in China, and then analyze the relationship between the urban space growth elasticity and the urban scale in China.
Key Words: Urban, Elastic, Construction Land, China =========================================================
COMMUNITY GEOGRAPHY IN ACTION: AN EXAMPLE PARTNERSHIP BETEWEEN
TEXAS STATE UNIVERISTY AND PEOPLE UNITED FOR SUSTAINABLLE HOUSING Christina Lopez ([email protected]), John Ponstingel ([email protected]), Milad
Korde ([email protected]), Daria Andrievskikh ([email protected]), Russell Weaver ([email protected] ), the Geography Department, Texas State University, San Marcos, Texas 78666
Abstract: The potential for photovoltaic electricity generation on rooftops depends on several global, local, temporal, and spatially variable conditions. We use a technical potential approach to provide an estimation on how much of solar energy can be captured by the available technology. A GIS based approach is used to calculate the available energy within the PUSH boundary in Buffalo, NY. Calculation of potential kWh with different methods establish a range from 2.9 to 4 (kWh/m2/day) for the study area. We also use a discounted cash flow model to assess the financial output of PV implementation with 4600 kWh annual capacity. Calculated NPV does not reach a high value while the attractiveness of an investment is given by a positive NPV. There are

- 34 -
governmental, federal, and local incentives which are not included in this study. The incentives can help overcome the high cost of technology improving the environmental standards within communities and urbanized area.
Key Words: Solar Energy, Rooftop Panels, Green Energy, Solar Panel =========================================================
AA LONGITUDINAL ANALYSIS OF MAPS PUBLISHED IN GEOGRAPHY JOURNALS, 1987-
2017 Michael Larson, Thomas Wikle ([email protected]), Giovanni Penna, and Anthony
Pennington, Department of Geography, Oklahoma State University, Stillwater, OK 74074
Abstract: Tools and techniques used in the design and construction of maps continue to evolve with innovations in computer hardware and graphics software. At the same time, instruction involving cartographic design principles is increasingly found within college and university courses that emphasize maps and mapping techniques tied to geographic information system (GIS) software. In this paper we evaluate maps published in geography journals over a thirty year period (1987-2017). Our sample includes 650 maps selected from 10 research journals in geography. Each map was evaluated independently by two researchers using a rubric for scoring seven basic elements of cartographic design including the size and placement of text, success in establishing visual hierarchies involving point, area, and line symbols, and the extent to which space was used effectively. Our preliminary findings reveal trends in adherence to cartographic design principles over a period of extraordinary change in both tools and training.
Key Words: cartography, geography journals, map design principles =========================================================
K-12 EDUCATION: SOLVING REAL WORLD ISSUES THROUGH NASA CONTENT & GIS Bethany Szijarto ([email protected]), Department of Geography, Kent State University,
Kent, OH 44242-0001. Abstract: The project involves students and teachers from public and private schools,
including underrepresented students in downtown Cleveland, OH. STEM Accelerated Coding was awarded a contract from NASA, to develop curriculum and professional development that used NASA content and GIS. Teachers learned where to obtain free licenses for GIS software through the State of Ohio. They became familiar with NASA resources and geospatial technology, specifically ArcGIS and Story Maps. Geospatial NASA projects included: finding relocation areas for polar bears where the sea ice was at a higher temperature, mapping malaria to see where medical supplies could be delivered and finding the shortest route for emergency vehicles to find forest fires. NASA content involved satellite imagery with research, videos, and geospatial layers that worked well in a collaborative lesson using GIS. Measurable goals involved a pre-/post-test for teachers, to demonstrate significant understanding and implementation of the program. Teachers also learned how to provide a student assessment to measure learning and interest in NASA careers. Statistical analysis was completed to conclude learning and interest significance. The August 2017 - February 2018 timeline content consisted of: NASA collaboration, PD module 1 - module 5 development, pretests, PD deployment, posttests, student assessments, project deployment, statistical analysis results, reporting, and presentation at both the state and national level. The expected

- 35 -
outcomes engaged a fully implemented geospatial NASA program for both private and public schools, that is scalable across schools throughout Ohio.
========================================================= GGEOGRAPHY IN KOREAN EARLY CHILDHOOD EDUCATION Hyun Joong Kim ([email protected]), Department of Geography, Plymouth
State University, NH 03264-1595 Yoo Jin Shon, Dong-Eui University, Busan, 47340, South Korea and Mi Jin Kim, Pusan
National University, Busan, 46241, South Korea Abstract: Spatial thinking is one of the most important skills that young children can
improve as they learn geography. This study reports the findings from an investigation that examines the understandings of geography education held by early childhood educators. For the study, 320 kindergarten teachers in Korea were interviewed. Their understandings of geography were analyzed and visualized using analytical diagrams and significance of geography conceptions. The findings revealed that the educators understood geography as related more to physical geography rather than to human geography. They held more conceptions of physical properties, but lacked concepts of spatial thinking and the relationship between people and their environments. The findings also indicated that the educators’ understandings of cartography education and usefulness of maps differed by level of educational attainment, years of teaching experience, and ages of classes. This research is a preliminary step in examining how we can utilize geographic information systems (GIS) tools, including web GIS, in the kindergarten classroom. Based on key findings, a GIS web site was established to support teachers. This research contributes to geography education and guides us in what ways we can improve access and new learning opportunities with web GIS.
Key Words: early childhood geography education, early childhood educators, map usage, web GIS
========================================================= GLOBAL COLD AIR OUTBREAKS Erik T. Smith ([email protected]) and Scott Sheridan ([email protected]), Department
of Geography, Kent State University, Kent, OH 44242-0001. Abstract: Periods of anomalously cold temperatures impact regions of the globe every
winter. Depending on the magnitude and duration of the occurrence, extremely cold periods may be deemed cold air outbreaks (CAOs), which can be detrimental to the agricultural industry and human health. A systematic CAO classification was developed from gridded NCEP/NCAR reanalysis data, from 1948 through 2017, based on a set of criteria concerning magnitude, duration, and spatial extent. Statistical analyses of the data were used to determine the overall trends in CAOs for different regions across the globe. This research will be used to further understand the large scale atmospheric mechanisms that precede these CAOs and how the specific mechanisms impact the location of CAOs.
Key Words: Cold air outbreaks, polar, climate, global, synoptic climatology =========================================================
REGIONAL EVALUATION OF CLIMATE VULNERABILITY AT THE START OF THE 21ST
CENTURY IN SOUTHWEST RUSSIA

- 36 -
Maria G. Lebedeva ([email protected]), Department of Geography and Geoecology, Belgorod State National Research University, Belgorod, 308015, RU,
Anthony R. Lupo ([email protected]), School of Natural Resources, University of Missouri, Columbia, MO 65211,
Olga V. Krymskaya, Department of Geography and Geoecology, Yury G. Chendev ([email protected]), Department of Natural Resources Management and
Land Cadastre Alexandr B. Solovev ([email protected]), Department of Geography and
Geoecology, Belgorod State National Research University, Belgorod, 308015, RU Abstract: Climate change in Russia over the last few decades has been greater than the
global mean and has been marked by an increase in climate variability and extremes within many regions. Modern statistics demonstrate also that damage caused by dangerous weather and climate phenomena is growing worldwide. A quantitative evaluation of climate change impact on economic and living conditions for impacted populations is required. However, the concept of «climate risk» has not been defined satisfactorily, and this terminology is not generally accepted. The most common definition is the vulnerability index (VI), which includes a combination of several indicators that determine the potential damage climate change may inflict on economic sectors. The VI characterizes the potential for extreme values of meteorological parameters including daily temperature and precipitation, and wind gusts. Here, a 20-year time interval (1998-2017) was chosen since 1998 is associated with changes in large-scale circulation as published by many authors. The values for VI within the southwestern Russian Federation are 190 and 365 units for the winter and summer seasons, respectively, indicating potentially greater impacts due to extremes during the warm season. In comparison with the previous 100-year period, extreme climatic conditions have increased during the warm season.
Key words: climate changes, climate vulnerability, climate risk =========================================================
SSUMMER IN THE CITY: HEAT TRENDS IN URBAN ALABAMA, 1958-2017 Stephen G. Tsikalas ([email protected]), Department of Geography, Eastern
Washington University, Cheney, WA 99004 and Kennedy Delap, Jacksonville State University, Jacksonville, AL 36265
Abstract: In this study, we focus our attention on urban regions in the State of Alabama to create a better understanding of changing summer heat trends. Rising summer temperatures, prolonged heat waves, and high heat index values are cause for public health concerns. Additionally, an increase in summer heat poses a stress on energy demands, costs to consumers, and health risks to the most vulnerable populations. Alabama is within the “warming hole” of the 20th Century warming trend in the US; however, we hypothesize that summer urban temperatures have been on the rise over the past 60 years. To test our hypothesis, we analyze daily maximum and minimum temperatures for the months of June, July, and August between two, thirty-year time periods: 1958 to 1987 and 1988 to 2017. We also calculate cumulative summer cooling degree days (CDD) for each year, June 1st through August 31st. Statistical comparisons suggest a rising maximum and minimum temperature and CDD for 80% of the cities in this study (α = 0.05).
Key Words: climate change, climatology, cooling degree days, extreme temperature
=========================================================
- 37 -
THURSDAY, 11/1/2018
POSTER SUBMISSION (STUDENT COMPETITION ENTRY) DDEER DETECTION IN A NATURE PRESERVE: APPLYING GEO-SPATIAL ANALYSIS Alexa Sikoryak ([email protected]), Department of Geography, Binghamton
University, Binghamton, NY 13902 Abstract: The Binghamton University has become aware of an overpopulation of deer on
the campus. This project employed several geographic tools to investigate the ability to detect deer in the Binghamton University Nature Preserve. The study used fieldwork that focused on animal-track identification, ground-level identification, geo-coding of the data. It also included thermal detection of deer at ground level. In addition, the author employed overflights by unmanned aerial vehicles (UAVs/drones) to determine their specific utility in deer identification. The development of a user-friendly GIS product, Story Maps (ESRI), was used to display the results.
========================================================= STATE AND LOCAL ROLES IN THE EXPANSION AND REDEVELOPMENT OF A RUST
BELT, JOHNSON CITY, NEW YORK Frank Tolbert ([email protected]), Department of Geography, Binghamton
University, Binghamton, NY 13902 Abstract: In early 2017, Binghamton University began construction of a Health Science
Campus in a neighboring rustbelt community, the Village of Johnson City, a part of the Triple Cities of the Southern Tier of New York. This Health Science Campus will consist of the Decker School of Nursing and a new School of Pharmacy. Millions of dollars have been invested in the area where campus expansion is taking place. As a result, the neighborhoods surrounding this Campus likely will experience a number of impacts, including residential, commercial, and industrial. This study will look at land use, spatial expansion of University investments, and economic and residential developments that are part of gentrification and potential displacement. Binghamton University’s Geography Department has examined existing vacancies and the poverty level in this community that make changes likely to be positive and potentially negative. University investments are expected to remove vacancies surrounding the Health Sciences study area. However, concerns of the poor and the agencies that support them remain fearful of their displacements.
========================================================= URBAN REVITALIZATION IN SMALL DEPRESSED CITIES: CASE STUDIES ON THE
SHORT-TERM IMPACTS OF NEW INVESTMENT IN SMALL-SCALE US CITIES Joshua Gonzalez ([email protected]) and Dylan Stackpole
([email protected]), Department of Geography, Binghamton University, Binghamton, NY 13902
Abstract : This study will use the recent investment into small cities such as Binghamton and Johnson City in order to build a case study that highlights the direct effects the State of New York and private investments in urban revitalization projects. By using the downtowns of Binghamton and Johnson City, we analyze how types of investing in an area contribute to revitalization in different neighborhoods surrounding State

- 38 -
investments but may reshape the demographics and socioeconomics of these revitalized areas. The study will also be used to project how much impact these investments can have over time. We will be using census data, tax parcel data, observations of the area as well as accounts from locals to draw analysis and conclusions. This study will observe how the trend of investing into small depressed cities could result in positive and negative impacts on the areas and their people.
========================================================= AAPPLICATION OF GEOVISUALIZATION METHODS FOR ASSESSING THE FLOOD OF
2011 IN BINGHAMTON, NY Barbara Yarborough ([email protected]), Department of Geology, and
Christopher A. Badurek ([email protected]), Department of Geography, State University of New York at Cortland, Cortland NY 13045
Abstract: The Flood of 2011 was one of the most significant floods to affect the City of Binghamton, causing extensive property damage and disrupting businesses. The flood was related to Tropical Storm Lee which dumped significant rainfall over a two-day period putting properties at risk within the flood zone around the Susquehanna and Chenango Rivers. This study uses GIS and remote sensing techniques to assess the land use land cover within the flood zone as well as buildings at risk. Results indicate the City of Binghamton’s flood zone is 21% urbanized impervious surface – a known factor for flood risk. 3D visualization is also used to recreate the extent of the Flood of 2011 using its high-water mark to determine buildings at risk flooded by this event. These hindcasting graphics and animations are of use for future land planning and flood risk mitigation efforts in Binghamton and Broome County.
Key Words: GIS, Modeling, Hazards, Land Use, Mitigation =========================================================
THE GEOGRAPHY OF FOOD PANTRIES IN RELATION TO INCOME – THE CASE OF A
RUSTBELT CITY IN UP-STATE NEW YORK Mohammed Rabiu Abubakari ([email protected]), Department of Geography,
Binghamton University, Binghamton, NY 13905 Abstract: Previous studies on food accessibility have indicated a relationship between the
location of food stores and individuals’ ability to purchase healthy food. Also, individuals with inadequate financial resources rely on food pantries for daily feeding. Meanwhile, such studies that measure the ability of people to afford food have rarely researched the locations of food pantries and distances to residential neighborhoods when considering physical access. This study, therefore, uses geographic information systems and chi-square analysis to examine the relationship between the food pantries and neighborhood poverty levels in the Triple Cities of Broome County, NY. Location remains vital in food access because individuals cannot access the food provided if they cannot travel to the food pantries. The results of the study indicate that food pantries are mostly located within proximity to low-income neighborhoods and highlight the significance of further research on the adequacy of food provided by food pantries to alleviate hunger and starvation among the underprivileged in the Triple Cities Area of Broome County NY.
Key Words: Food Pantries, Food accessibility, Poverty and Food access, Food insecurity =========================================================

- 39 -
AACCESS TO HIV CARE AND ADDICTION TREATMENT AMONG STIGMATIZED POPULATION OF OPIOID-DEPENDENT PEOPLE LIVING WITH HIV
Diane BenBella ([email protected] ) Department of Geography, University of Connecticut, Storrs Mansfield, CT, 06269, USA
Debarchana Ghosh, Department of Geography, University of Connecticut, Storrs Mansfield, CT, 06269, USA
Shan-Estelle Brown, Department of Anthropology, Rollins College, Winter Park, FL, 32789,
Faye Taxman, Department of Criminology Law & Society, George Mason University, Fairfax, VA, 22030, USA
Frederick L. Altice, Department of Anthropology, Rollins College, Winter Park, FL, 32789,0Department of Internal Medicine, Section of Infectious Diseases, AIDS Program, Yale School of Medicine, New Haven, CT 06510
Abstract: The District of Columbia (DC) has the nation’s highest per capita HIV prevalence, yet it is an understudied region regarding health equity of vulnerable population living with the double stigma of addiction and HIV. The DC government have renewed efforts to address this concern leading to improvements, challenges still remain. This mixed method study adopted a two-pronged analytical approach to identify barriers for equitable access to care among opioid-dependent people living with HIV (PLH). First, we mapped the locations of treatment facilities (e.g. HIV care, mental health services, addiction centers) using GIS. We then computed the number of and the average distances to these facilities from study participants’ (n=152) neighborhoods. Second, focus groups and in-depth interviews were conducted with a subsample (n=20) to describe attitudes, socioeconomic, and personal factors that guide participant’s decisions to access a particular facility in the light of stigma, race, and poverty. Findings suggested that even when accessibility to HIV care was not a significant barrier, limited availability of facilities treating PLH with comorbidities such as opioid dependence and mental disorders was an issue. There was an overall mismatch between the availability of integrated addiction and HIV care services in neighborhoods with higher prevalence of HIV.
Key Words: HIV/AIDS, opioid dependency, access, mixed-method =========================================================
AN ANALYSIS OF THE IMPACT OF VACANT AND ABANDONED PROPERTIES ON
DRUG-RELATED CRIME IN JEFFERSON COUNTY, KENTUCKY Jesse Wisdom ([email protected]), Department of Geography and Geosciences,
University of Louisville, Louisville, Kentucky 40292 Abstract: Vacant and abandoned properties and crime are a serious problem in many
metropolitan areas, including the city of Louisville. This paper analyzed the relationship between vacant and abandoned properties and drug-related crime in Louisville, Kentucky by using geographic information systems procedures and ordinary least squares and spatial lag regression methods. Results from the spatial analysis and OLS regression support the hypothesis that vacant and abandoned properties are positively and significantly associated with increasing rates of drug-related crime at the census tract level.
Key Words: crime, GIS, statistics, mapping

- 40 -
========================================================= IIS THE MACY'S IN MY MALL GOING TO CLOSE? UNCOVERING THE FACTORS
ASSOCIATED WITH THE CLOSURES OF MACY'S, SEARS, AND J.C. PENNEY STORES Josheph Tokosh ([email protected]), Department of Geography, Kent State University,
Kent, OH 44242-0001 Abstract: This study analyzes three national department store chains in order to identify
the factors most associated with their closures. A binary logistic regression revealed some consistencies and differences in the associations. Larger stores are less likely to close for all three chains. Macy's and Sears stores are less likely to close in larger malls and if they are located in the western US. J.C. Penney stores in the west are also less likely to close to close than stores in other regions, but stores in large shopping centers are more likely to close than freestanding stores. Store age was only significant for J.C. Penney stores, and indicated that older stores are more likely to close. Implications for retail managers and city economic vitality are mentioned and future research possibilities are discussed.
Key Words: Retail, Department Stores, Macy's, Sears, J.C. Penney =========================================================
FLOOD AWARENESS AMONG COLLEGE STUDENTS IN FLASH FLOOD ALLEY Daria Andrievskikh ([email protected] ), Richard A. Earl ([email protected]) and
Christina W. Lopez ( [email protected] ), Department of Geography at Texas State University, Texas State University, San Marcos, Texas, 78666
Abstract: Texas State University in San Marcos, Texas is in one of the most flood prone regions of the U.S. This flood hazard is the result of extreme precipitation intensities, low infiltration surfaces, and hydrologically efficient drainage. Four times in the last three years the university has had to cancel classes when flooding occurred along the San Marcos River and adjacent areas. Besides restricting access to campus, many residential areas used by students were flooded. Starting in the fall of 2015, geography students in a senior level and graduate Field Methods course were given a 11-item questionnaire on their awareness of, impacts of, and response to these floods. In the summer of 2018, a modified survey version, to account for different academic backgrounds, was sent to over 3000 undergraduate and graduate students from all campus majors. Preliminary interpretation of results (n= 119) from the class exercises indicate that 12 percent had their residence or auto damaged, 24 percent had access to their residence impacted, 31 percent had their access to school impacted, 63 percent received flood warning by electronic communication, and 52 percent were aware that the region has greater flood potential than most other parts of Texas.
Key Words: Texas Floods, Flood Hazards, Hazard Perception =========================================================
THE ROLE OF METEOROLOGICAL HAZARDS IN URBAN TOURISM: THE CASE OF
HAMPTON ROADS 2013-17 Nicole Hutton ([email protected] ), Department of Political Science and Geography, Old
Dominion University, Norfolk VA 23529 Michael Allen ([email protected] ), Department of Political Science and Geography, Old
Dominion University, Norfolk VA 23529
- 41 -
Abstract: The sustainability of urban tourism in the southern United States is at risk due to climate change. As unseasonable weather, extreme temperatures, and natural disasters increase in frequency and magnitude, their role in tourist activity raises concerns. Tourists’ aversion to extreme hot and cold as well as wet conditions is shifting and limiting the peak season for attractions across North America. This case study assesses the impact of meteorological hazards upon visitor attendance in the Hampton Roads metropolitan region, which supports a multi-million-dollar annual tourism industry along the southeastern coast of Virginia. Daily records from ex-situ conservation attractions and cultural entertainment venues are compared over a five-year period to examine the interrelationship between destinations. Preliminary findings suggest that overall attendance declines during polar conditions. Outdoor attendance is more limited by polar, moist moderate, and transitional conditions than it is at comparative indoor venues. The act of closure for tropical storms and nor’easters has minimal impact on facilities once reopened. Although tourism revenue in the area has increased over the past five years, city and regional coordination within the tourism sector may reinforce sustainability as attendance patterns continue to fluctuate.
Key words: Tourism, Hazards, Climate, Sustainability =========================================================
VVULNERABILITY, PRE-DISASTER AWARENESS, AND SOCIAL MEDIA: A CASE STUDY
OF HURRICANE SANDY WITH TWITTER DATA Zheye Wang ([email protected] ), Department of Geography, Kent State University,
Kent OH 44240 Abstract: Raising public’s awareness of natural disasters is an important task in natural
disaster management. Better awareness of a natural disaster can augment pre-disaster preparation and mitigate disaster impacts. Besides an important platform for natural disaster management agencies to broadcast authoritative situational announcements, social media becomes a useful data source for researchers to gauge the public’ awareness of a specific natural disaster. In this research, we use Hurricane Sandy tweets posted before the landfall to measure the public’ pre-disaster awareness and examine its relationship with physical vulnerability and social vulnerability. More specifically, we aim to investigate if communities that are physically and/or socially vulnerable to Hurricane Sandy tend to have more (or less) awareness of it. To achieve this, we specify four explanatory variables including precipitation, population density, physical vulnerability, and social vulnerability with spatial regressions. The analytical results reveal that physically vulnerable groups are more aware of Hurricane Sandy, while socially vulnerable groups have less awareness of the disaster.
Key Words: Social media, Disaster awareness, Physical vulnerability, Social vulnerability, spatial regression
========================================================= TORNADO WATCH #211: 30 YEARS LATER. A SPATIAL ANALYSIS OF THE MAY 31,
1985 TORNADOES USING PRESENT-DAY DATA FOR THE STATE OF PENNSYLVANIA Tim Dolney ([email protected]), Department of Geography, Pennsylvania State University –
Altoona College, Altoona, PA 16601 Abstract: On the evening of May 31st, 1985, a devastating and deadly tornado outbreak
struck Ohio, Pennsylvania, New York, and Ontario. A total of 43 tornadoes occurred that day resulting in 89 deaths; the deadliest tornado outbreak of the 1980’s.

- 42 -
Pennsylvania experienced the greatest number of tornadoes with 21 affecting the state and causing 65 deaths. What if such a disaster were to happen again today in the same locations? This research uses Geographic Information System (GIS) to analyze present-day land cover, census, and building data in the locations impacted by the 1985 tornadoes for the state of Pennsylvania and parts of Ohio and New York. Present-day data is compared to historical, 1985 data to determine what changes have occurred in the impacted locations since 1985.
Key Words: GIS, Tornadoes, Pennsylvania, Land Cover, Census ========================================================= PPUBLIC DEBT AND REGIONAL INEQUALITY IN INDIA: AN EXPLORATORY SPATIAL
DATA ANALYSIS Sudhir Thakur ([email protected]), College of Business Administration, Sacramento
State University, CA 95819 Abstract: The Indian economy has shown a high rate of growth of gross domestic product
of 7.2 percent during 2017 relative to 6.69 percent during 2011-12. In the post-liberalization economic era the size of fiscal debt has been sky rocketing. The fiscal debt is defined as the difference between total government expenditure and current revenue which has been escalating to an unsustainable level in recent periods. Kaur et al. (2014) suggest that debt position of states at the aggregate level is sustainable. Gupta (2001) on the contrary opined unsustainability of debt at the state level. Given this overview this research examines space-time patterns of state debt in India during the period 2002-15. National and state level data are utilized to study the state debt in India for 30 regions comprising 28 states and 2 territories i.e. National Capital Territory of Delhi and Puducherry. The following questions are addressed in this paper: (1) what are the broad trends of public debt and regional inequality in India at the state level? And (2) what are the characteristics of space-time patterns of public debt in India during 1991-2015? Several spatial analytical methods are utilized to describe spatial patterns of state liability in India.
Key Words: Public Debt, Regional Inequality and India =========================================================
STUDIES OF TOURISM GEOGRAPHY IN INDIA: DEFINITION, APPROACHES, AND
PROSPECTS Rajrani Kalra ([email protected]), Department of Geography and Environmental Studies,
California State University, San Bernardino, CA 92407 Abstract: Tourism geography is a new area of research and broadly examines the
interaction among such themes as ‘spatial organization’, ‘land-man relations’ and ‘areal differentiation’ (Taaffe, 1974; Gibson, 2008) in the study of the distribution and spatial pattern of tourist places. Pearce (1979) examined the range and scope of tourist geography and opined the centrality of spatial interaction in the geographies of tourism. The geography of tourism entails a variety of areas like: ‘the effects of scale’, ‘spatial distribution of tourist phenomenon’, ‘tourism impacts’, ‘planning for tourism’, and ‘spatial modeling for tourist development’ (Williams 1998). The Organization for Economic Cooperation and Development (OECD 2016) reports that tourism will continue to grow in most western developed economies. It has contributed to overall economic growth. It accounts for 4.1 percent of GDP, 5.9 percent of employment, and 21.3 percent of service exports in the OECD region. In comparison, the impact of

- 43 -
tourism and travel sectors on the Indian economy was 3.3 percent of GDP, 5.8 percent of total employment, 5.4 percent of total exports, and 5.7 percent of total investment during 2016 (Turner, 2017). Recently, Indian geographers have been interested in the spatial dimension of tourism in India Mir (2016) has surveyed important themes within tourism geography in India: ‘globalization and tourism’, ‘trends of tourism’, ‘economic aspects of tourism’, ‘impact of tourism on environment and society’, ‘sustainable tourism development’, and ‘infrastructure and hospitality’. Given this overview the objective of this chapter is to address four research questions: (1) What are ways in which tourism is conceptualized and defined across selected social science disciplines? (2) What insights do Indian studies provide about regional tourism in India? (3) What are the various approaches to study tourism geography? And (4) What suggestions can be made for strengthening the bourgeoning field of tourism geography in India?
Key Words: Tourism, stakeholders,sustainable tourism, incredible India, Trends, globalization and tourism
========================================================= LLEVERAGING BREWING HISTORY: THE CASE OF CINCINNATI’S OVER-THE-RHINE
NEIGHBORHOOD Neil Reid ([email protected]), Department of Geography and Planning, University of
Toledo, Toledo, OH 43606-3390 Jay D. Gatrell ([email protected]), Office of Academic Affairs, Eastern Illinois University,
Charleston, IL 61920-3099 Matthew Lehnert ([email protected]), Department of Geography and
Planning, University of Toledo, Toledo, OH 43606-3390. Abstract: The United States is experiencing craft beer revolution. There are over 5,000
craft breweries in the United States; in 1980 there were only eight. The rise of craft breweries is a response to consumer dissatisfaction with the beer offered by mega-breweries such as Anheuser-Busch. Craft breweries offer consumers a higher quality product and a wide variety of different beer styles. The growing popularity of craft beer has also resulted in a renewed interest in the history of beer and brewing. The focus of this paper is Cincinnati, Ohio. During the 19th century Cincinnati was the destination of tens of thousands of immigrants from Germany. Most of these immigrants settled in what would become known as the Over-the-Rhine neighborhood. By the 1870 Over-the-Rhine was one of the mose densely-populated German-speaking neighborhoods in the western hemisphere – German-speaking churches, German-language schools and newspapers filled the neighborhood. Over-the-Rhine was also home to over 35 breweries, which provided the local population with German-style lager beer. During the 20th century the number of breweries in the United Sates declined as a result of a decade-long period of consolidation in the American brewing industry. In Cincinnati, as in other American cities, breweries closed one-by-one as national breweries, like Anheuser-Busch and Pabst, came to dominate the brewing landscape. Old brewery buildings either sat empty or were adaptively re-used for other purposes. Recognizing the historical value of these old brewery buildings, in 2005 local residents established the Over-the-Rhine Brewery District Community Urban Redevelopment Corporation (BDCURC), a 501(c) 3 non-profit organization. The mission of the BDCURC is to “make the Brewery District a healthy, balanced and supportive neighborhood economy by preserving, restoring and redeveloping our unique brewing history and historic urban fabric.” The purpose of this chapter is to examine how Cincinnati’s brewing history is being leveraged as a part of the city’s broader neighborhood redevelopment efforts.
- 44 -
Key Words: Cincinnati, Craft Beer, Local Economic Development =========================================================
AA COMPARATIVE STUDY ON THE SOFTENING OF MANUFACTURING INDUSTRY
INPUT STRUCTURE Ran Wang ([email protected]) School of Economics, Henan University of Economics
and Law, Zhengzhou, Henan, China Abstract: This study analyzes the development of manufacturing industry as a softening
of the industry. First, using the WIOD (2000-2014) data, we analyze the degree of softening and its impact on manufacturing industry (i.e., the ratio of non-material input to total input) and on the per capita output value. It is found that, when the softening degree is increased by 1%, the per capita output value would increase by 2.7-3.7%. Then we compare the softening degree in different countries in 2014. Among those analyzed, East Asian countries (China, Indonesia, Japan, South Korea, Taiwan) have the lowest index - only 12.0% on average. North America countries (Canada, USA) are about 18.6%. The highest in the EU have an average index value reaching 20.5%. Finally, comparing the domestic input structure of China, Japan, U.S., and Germany, we find that the number of non-material inputs in the top 5 inputs is 0 for China, 1 for Japan, 2 for U.S. and Germany, and the number in the top 10 inputs is 1 for China and Japan, 3 for U.S. and Germany. It can be seen that the model for manufacturing industry development of European and North American are relatively similar. The model for East Asian export-oriented countries have obvious differences with the former. The main conclusion of this study is that there is a significant positive correlation between the softness of manufacturing industry and its development level, and since there is a clear gap with the European and North American, East Asia can promote the development of manufacturing industry by increasing its softness.
Keywords: Manufacturing Industry; Input Structure; Softening degree =========================================================
A REVIEW OF PRESERVATION PRACTICES AND ATTITUDES IN HISTORIC DISTRICT
ACT MUNICIPALITIES OF PENNSYLVANIA Megan McNamee and George Pomeroy ([email protected]), Shippenburg University,
Shippenburg, PA 17257 Abstract: In a growing number of communities preservation planning has been recognized
and pursued for its benefits such as making history, heritage and historic character strong building blocks for revitalization, growth, tourism and job creation. Conceptually, preservation planning in the United States dates back to the decades preceding the civil war when efforts to preserve resources associated with significant figures and events in American history. Subsequent to that time, federal, state, and local legislation, including the National Historic Preservation Act of 1966, have contributed significantly to legitimizing historic preservation activities. In Pennsylvania state legislation such as the Historic District Act (HDA; Act 167 of 1961), the Municipalities Planning Code (MPC; Act 247 of 1968), and Home Rule Charters have all paved the way to provide legal authority for local communities to regulate for historic preservation. In the context of the above, this chapter presents a discussion of the significance and evolution of historic preservation in the United States, the role of federal, state and local governments in historic preservation, outlines the historic preservation in Pennsylvania with a focus on the Historic District Act and finally presents findings of a survey of stakeholders

- 45 -
conducted to understand what strategies, techniques and tools are being used under the auspices of the HDA, as well as an assessment of how effective these tools are. The survey reveals that while community attitudes are positive toward historic preservation activities, there is some unevenness in implementation and a possible lack of capacity among many municipalities. The public at large is broadly supportive of historic preservation activities, whether they be regulatory or non-regulatory approaches. The findings also suggest that, despite this overall level of public support and municipal satisfaction though, there seems to be a lack of capacity in addressing preservation.
Keywords Historic preservation, National Historic Preservation Act (NHPA) of 1966, Preservation planning, The Historic District Act
========================================================= EEVALUATING THE ACCURACY OF TERRAIN DATA GENERATED USING THE UAS--SFM
WORKFLOW Adam Mathews ([email protected] ), Department of Geography, Western
Michigan University, Kalamazoo, MI 49006 and Amy Frazier, Arizona State University, Tempe AZ 85281
Abstract: Unmanned aerial systems (UAS) have been rapidly adopted in geography and other disciplines as an inexpensive alternative to acquisition of more traditional datasets such as aerial photography or lidar. Structure from motion (SfM) algorithms have provided a relatively easy to use UAS aerial image processing methodology to generate geospatial data products including point clouds and digital terrain models (following georeferencing). Due to the excitement associated with this democratizing data collection approach, most research to date has focused on applications of the technology (e.g., precision agriculture, natural disasters) instead of more basic questions surrounding the quality of the data generated from SfM. In this study, we assess the vertical accuracy of UAS-SfM terrain data compared to an extensive ground-based survey-grade GNSS data. Data were collected at Gloss Mountain State Park near Fairview, Oklahoma. RMSE and MAE error metrics are reported and spatial patterns of error are examined.
Key Words: unmanned aerial vehicles, UAV, unmanned aerial systems, UAS, structure from motion, SfM, terrain modeling, accuracy
========================================================= SPATIAL VARIATION OF TERRAIN RELIEF AND ITS IMPACTS ON POPULATION AND
ECONOMY BASED ON RASTER DATA IN WEST HENAN MOUNTAIN AREA ZHU Lianqi ([email protected]), ZHANG Jingjing, ZHU Wenbo, CUI Yaoping, HE
Shasha and REN Han, College of Environment and Planning, Henan University, Kaifeng 475004, Henan, China
Abstract: Topographic relief can be the constraining factor for the population and economic development in an area. This is especially the case in transitional zones from mountains to plains. In this study, West Henan Mountain Area, situated in the transitional zone from the Qinling Mountains to the Huang-Huai Plain (i.e. the second step to the third step of Chinese macro-topography), was selected as a case study area. Based on the optimal statistical unit (OSU) as determined by the mean turning-point analysis method (MTPAM), a DEM of 200 m resolution was used to extract the relief degree of land surface (RDLS). Integrating the 1:100,000 land use map, statistical population data at township level and economic data of various industries at county

- 46 -
level, raster models of spatial patterns of population and economy were formulated, and then the spatial distributions of population density and economic density at a resolution of 200 m by 200 m were produced using the models. Subsequently, statistical analysis was carried out to reveal the effects that RDLS had on population and economy based on raster data (i.e. RDLS, population density, and economic density), and the differences between the effects of RDLS and those of other terrain factors on the population and economy were also analyzed. The results showed that: (1) the RDLS in the West Henan Mountain Area was prevailed by low value, with 58.6% of the area having the RDLS lower than 0.5 (relative altitude of ≤ 250 m). Spatially, RDLS was higher in the west and lower in the east, higher in the central part and lower in the south and the north. Moreover, there existed strong positive correlations between RDLS and altitude and slope, especially correlated with slope significantly. (2) The relationships between the statistical values (i.e. population density and economic density which were selected to test and verify the models) and the corresponding simulated values were fitted to linear models with 0.943 and 0.909 levels of goodness-of-fit. This fitness indicated that the spatialization results reflected well the actual spatial patterns of population and economy in the study area. (3) The effect of RDLS on population and economy is stronger than that of other terrain factors. RDLS had a good logarithmic fit with population density and economic density, with 0.911 and 0.874 goodness-of-fit, respectively. Specifically, 88.65% of the total population lived in the areas where RDLS was less than 0.5 and 88.03% of the gross regional production was distributed in the areas where RDLS was less than 0.3. It can be clearly seen that economic development was more inclined to agglomerate in areas of lower RDLS values compared with population distribution.
Key Words: relief degree of land surface (RDLS); population and economy; land use; spatialization; grid; West Henan Mountain Area
========================================================= MMAPPING FUEL CONTINUITY TO PREVENT AND PLAN WILDLAND URBAN INTERFACE
UUSING LIDAR TECHNOLOGY Anna Badia ([email protected]), Meritxell Gisbert ([email protected])
Department of Geography, Universitat Autònoma de Barcelona, Carrer Fortuna S/N, Cerdanyola (Barcelona) Spain 08193
Abstract: LiDAR technology has become a tool that obtains high resolution spatial data, which is very effective in forest planning and management studies. The objective of the current project is to apply LiDAR technology (Light Detection and Ranging or Laser Imaging Detection and Ranging) in order to map fuel continuity in wildland urban interface (WUI) and prevent forest fires. Actually, proactive actions, not reactive, help to improve the field of fire prevention. The combination of the different obtained layers, height of the forest, crown density, fuel size, continuity and vertical and horizontal layout of fuel and finally the underbrush fire load allow institutions to prioritize the areas of intervention and to establish the appropriate requirements for the owners. A municipality in the area around Barcelona was selected to explore how LiDAR technology has great possibilities regarding the planning and management of forest fires. In this municipality, both WUI and a protected natural space, which is a frequented place, can be found. Results show that sometimes the classification of LiDAR points is not exactly precise and it is therefore necessary to complement the interpretation with field work.
Key Words: forest management, forest fires, GIS, Digital Surface Model. =========================================================

- 47 -
UUTILIZATION OF INFORMATION AND COMMUNICATION TECHNOLOGIES BY STUDENTS OF THE UNIVERSITY OF GHANA, LEGON
James C. Saku ([email protected]), Department of Geography, Frostburg State University, Frostburg, MD 21532-2303
Abstract: Information and Communication Technologies (ICT) have transformed the lives of the global population over the past two decades. There are very limited places in the world today, which function without direct or indirect influence of ICT. However, there is substantial difference in the availability and utilization of ITC between first and third world countries. While cellphone, internet, email and social media are readily available in the first world, third world countries still lag behind. Similarly, there is a spatial difference in the availability of ICT within developing countries. ICT infrastructure is typically more available in urban areas of developing countries than the rural areas. Since most tertiary institutions are located in urban areas, the expectation is that students have access to ICT. This paper explores the use of ICT by University of Ghana students. Employing a structured questionnaire and random sampling technique, 200 students at the University of Ghana were interviewed. Although most were undergraduates, 20% of participants in the survey were graduate students. Data were analyzed using descriptive statistics. The results indicate that most students have access to smart phones and use them primarily for personal phone calls. About 96% of respondents indicated that they use ICT devices mostly for educational purposes.
Key Words: Information and Communication Technology, Developed and Developing Countries, Internet, Social Media
========================================================= THE GEOGRAPHY OF FINANCIAL COMPLAINTS IN THE UNITED STATES Kuo Siong (Gordon) Tan ([email protected]), Department of Geography, State
University of New York at Buffalo, Buffalo, NY 14260 Abstract: Measures to strengthen protection of American financial consumers have
increased after the most recent financial crisis. Most notable was the creation of the Consumer Financial Protection Board (CFPB) as the first government agency that is tasked with this mandate. However, many consumers remain vulnerable to unfair and unjust practices by financial institutions. A direct measure of financial vulnerability is developed using self-reported consumer complaints from the CFPB’s public database. I identify certain social groups, such as the elderly, the foreign-born and blacks, as being more susceptible to unfair financial practices. Despite the wide availability of different channels (online and by phone) for receiving consumer complaints, the effectiveness and accessibility of the CFPB’s consumer protection efforts are challenged by a highly uneven spatial distribution of complaints, which are clustered around a handful of areas across the country. This paper ends by discussing how to raise awareness of the agency’s services among the financially vulnerable.
Key Words: finance, complaints, consumer, vulnerability, protection =========================================================
PAPER SUBMISSION (STUDENT COMPETITION ENTRY) THE USE OF VIIRS DNB IMAGERY AND SOCIAL MEDIA DATA AS PROXIES FOR URBAN
ELECTRIC CONSUMPTION ESTIMATIONS AT FINE SPATIAL AND TEMPORAL SCALES

- 48 -
Weiying Lin, ([email protected]) and Chengbin Deng ([email protected]), Department of Geography, Binghamton University, State University of New York, Binghamton, NY 13902
Abstract: In order to meet the requirement of sustainable development and ensure substantial energy for city population and economic activity, it is crucial to understand conditions of electric consumption in urban areas. However, such information is always unavailable, especially at finer spatial and temporal scales. In this paper, monthly nighttime VIIRS DNB images were used to build relationships to electric consumption. The electric consumption data with a high temporal resolution of every 15 minutes was collected between 2015 and 2017 from smart meters. The meter readings cover the whole State University of New York (SUNY) at Binghamton. In addition to nighttime light (NTL) data, Twitter was used to examine comprehensively the correlation with electric power consumption. We found that electric consumption was related strongly to both NTL images and the number of unique Twitter users. Besides, a linear positive relationship was detected between NTL data and electric meter readings. Lastly, results of the relationships between NTL imagery and electric consumption presented different patterns among leaf-on seasons, leaf-off seasons without snow, and leaf-off seasons with snow. These findings show that both NTL imagery and social media data may be reliable data sources to proxy urban electric consumption at the micro level.
Key Words: electric energy consumption, nighttime light imagery, Twitter =========================================================
RRAPID RECONSTRUCITON OF FLOOD INUDATION BY INTEGRETING SOCIAL MEDIA
AND POST-EVENT SATELLITE IMGERY Cuizhen (Susan) Wang ([email protected]), Xiao Huang ([email protected]),
Department of Geography, University of South Carolina, Columbia, SC 29208 Abstract: Rapid identification of flooded and high-risk areas during a flood event is
important for first responses. Crowdsourcing is becoming a popular tool of real-time information dissemination although the uncertainties of VGI are still a big concern. Remote Sensing monitors the flood through a synoptic view, but the delayed image acquisition restricts its timely application. Integration of the two data sources may provide a novel way of rapid, spatially explicit situation awareness for emergency management. In the October 2015 South Carolina Flood, downtown Columbia, SC was severely flooded on Oct.3-4 due to intense and large amount of precipitation. The earliest cloud-free image was acquired by EO-1 ALI on Oct. 8. This study presents a flood inundation reconstruction model by enhancing the satellite-extracted Normalized Difference Water Index (NDWI) map with the real-time stream gauge readings and social media (tweets) data. Both global and local enhancements are performed and a final flood inundation probability map is developed, with which emergency responders could quickly identify the areas in need of urgent attention. The integration of social media and remote sensing helps us better assess the flood severity and assist the society resilience responding to this extreme disaster.
Key Words: the October’15 SC Flood; Satellite Imagery; Social Media, Flood Inundation =========================================================
CAN A CONCEPTUAL MODEL USING ENVIRONMENTAL, ECONOMIC, AND SOCIAL
FACTORS BE USED TO GUIDE THE PLANNING AND VALUATION OF MULTI-USE TRAILS IN URBAN AREAS?

- 49 -
Karen Gallagher ([email protected]) and Patrick Lawrence ([email protected]), Department of Geography and Planning, University of Toledo, Toledo, OH 43606
Abstract: In urban areas across the U.S. transportation infrastructure is being developed to increase support for non-motorized forms of travel such as walking and biking. Multi-use trails are one type of infrastructure that are separated from roads and provide an elongated path for non-motorized forms of travel. Multi-use trails can bring many benefits to local communities; namely social, economic, and environmental. However, they are often planned ad-hoc as part of a rails-to-trails project with little evidence- based consideration of maximizing benefits during the planning stage. This paper seeks to use secondary sources to determine if the variables of public health, land value, and decreased fragmentation can be used to create a conceptual model that can guide the planning and ex-ante valuation of multi-purpose trails in urban areas. If so, the conceptual model could be applied as a planning and justification tool for local governments hoping to add multi-use trails to their non-motorized transportation infrastructure network.
Key Words: Green Infrastructure, Pedestrian Infrastructure, Multi-use trails, Urban trails, Rails-to-trails, Non-market Valuation
========================================================= SSPACE DIFFERENTIATION RESEARCH ON TIBET TOURISM CLIMATE RESOURCES Chunhua Li ([email protected]), College of Geography Science, Qinghai Normal
University, China 810008 Abstract: Climate factors affect tourism experience and timing directly. There is a huge
resource advantage in Tibet tourism. The study of tourism climate resources provides important reference to tourists, tour operators and managers. Using monthly average temperature, relative humidity, wind speed, sunshine time of Tibet during 1971— 2011, based on GIS and four indexes, tourism climate resources spatial differentiation of Tibet were analyzed. The results show that: cold or very cold time in Tibet during the year is very long, the body’s comfortable degree in November - the following April is uncomfortable and should not be suitable for tourist activity. Tourist comfortable period is generally in 5-9 months in southeast of Tibet such as Chayu, Linzhi, Bomi. In central Tibet such as Lhasa, Rikaze, Dingri and Nimu, tourist comfortable period is generally between 6-9 months, Shiquanhe,Pulan,Gaize lie in the southern edge of Tibet ,where the travel comfortable period is very short, mainly in July and August . There is no travel comfortable period all the year round in northern Tibet. Central a1nd southeastern Tibet possesses summer vacation function, which should be the key tourism development area of the plateau.
Key Words: Tibetan Areas, Tourism Climate Resource, GIS, Spatial Differentiation. =========================================================
SPATIAL PATTERN OF ENVIRONMENTAL MIGRATION IN OYO STATE NIGERIA Funmilayo Odubiyi ( [email protected] ), Geography Department, University
of Ibadan, Oyo State, 200284 and Nigeria. Ahmed Ogunwale ( [email protected] ), Geography Department, Crescent
University, Abeokuta, Ogun State, 200284 Nigeria. Abstract: In recent times, environmental migration has been of great interest to
researchers. This is because of the increase in environmental degradation and climate change over the years. However, despite the increasing interest, only few empirical

- 50 -
studies have been carried out in the developing countries and specifically in West Africa. Also, little attention is paid to the quantitative assessment of the pattern of flow of environmental migrants. This paper examined the pattern of migration flows in terms of direction and magnitude and the factors responsible for the direction of movement of environmental migrants. Data from survey was statistically tested using analysis of variance and logistic regression. Analysis of variance was used to analyze the variations in the factors of mobility while logistic regression was used to examine the factors that significantly influence the choice of destination of the migrants apart from environmental factors. Flow map showed the direction and magnitude of movement of migrants from their places of origin to the places of destination. The result showed that nearness to their places of origin was a major factor in the choice of destination of environmental migrants as most of them have cultural ties with their places of origin.
Key Words: Environmental migration, climatic change, migration flows, environmental migrants
========================================================= BBIOGRAPHY, ACTIVISM, AND THE APPLIED GEOGRAPHIES OF PAUL ROBESON Mark Rhodes ([email protected]), Department of Geography, Kent State University,
Kent, OH 44242-0001 Abstract: As Paul Robeson’s legacy attests, the power of the individual, and knowing the
spatial understandings of that individual’s perspective, has lasting impact in the world. Robeson’s own legacy continues through cultural centers, libraries, performing arts centers, and physical and performed memorials throughout the world. Robeson’s activist geographies countered the state structures of the United States and the United Kingdom through his own performances, scholarship, and protest. This paper discusses not only the applied geographies of Robeson, and his geographic approaches to solve the issues of colonialism, capitalism, racism, and violence, but the important application of the study of the biography in geographical pursuits. Biographical work connects the applied to the archived, and spatial lives and actions of individuals with the impacts they had on the world. Paul Robeson’s own spatialities took him around the world, particularly through the United States, United Kingdom, and Russia, but more importantly disrupted the spatial orders of the Jim Crow South, Imperialist London, and even Stalinist Russia. Despite using an ‘n’ of one, this paper illustrates how approaching the geographical through the biographical allows one to understand the applied geographies of activism at the finest of scales.
Key Words: Paul Robeson, activism, Black Geographies, Critical Geographies, Applied Geographies, critical race theory, post colonialism, biography
========================================================= PUBLIC PEDAGOGY AS APPLIED GEOGRAPHY: YOUTH FOR PEACE, ARTISTIC
EXPRESSIONS, AND UNDERSTANDINGS OF THE CAMBODIAN GENOCIDE James A. Tyner ([email protected]), Department of Geography, Kent State University,
Kent, OH 44242-0001 Abstract: Geographical knowledge is not limited to the so-called rule of experts, that is,
of knowledge produced by professional geographers. By extension, the application of geographical knowledge is more pervasive than normally considered. Applied geography, for example, is commonly framed as providing solutions to problems deemed valuable or relevant as determined by the market-logics of capitalism. However, it is possible to conceive of other forms and functions of applied geographic knowledge,

- 51 -
including the application of a geographic perspective to the promotion of truth and reconciliation in the aftermath of genocide and mass violence. Drawing on the example of Youth for Peace, a non-profit organization in Cambodia, this paper explores public pedagogies as a form of applied geography.
Key Words: Genocide; Cambodia; pedagogy; geographic knowledge; applied geography =========================================================
AASSESSING THE POTENTIAL FOR URBAN AGRICULTURE AT RELIGIOUS
INSTITUTIONS IN KENT, OHIO Alex R. Colucci ([email protected]) and Amanda N. Colucci, Department of Geography,
Kent State University, Kent, Ohio 44242-0001 Abstract: This paper applies quantitative geospatial methods to the development of a
means to assess the agricultural potential at religious institutions in Kent, Ohio. Geographic Information Systems and remote sensing tools are utilized to identify religious institutions and their property in the city, and evaluate current land uses and assess the potential capacity for sustainable agriculture at each location. Religious institutions have long maintained the capacity to carry out community initiatives directed at addressing inequalities, particularly in the context of food and hunger. Therefore, this research sits at the intersection of urban political ecology and sustainable agriculture, as it’s objective is to develop frameworks for the implementation of sustainable urban agriculture projects at these institutions in Kent so that they may produce food. This objective acknowledges the potential for religious institutions to radically alter land use practices in urban settings—reasserting the notion of a Commons that functions for and with vulnerable populations—by applying geographic knowledge to address food justice.
Key Words: Political Ecology; GIS; Remote Sensing; Sustainable Agriculture; Community Geographies; food justice
========================================================= ‘I CAN’T WALK THESE TOMATOES 100 YARDS’: FOOD JUSTICE ON AN AMERICAN
UNIVERSITY CAMPUS Chris Post ([email protected]), Department of Geography, Kent State University, Kent, OH
44242-0001 Abstract: The Stark Campus of Kent State University established a campus garden in June
of 2017. Our garden provides fresh, organic, student-grown food to our campus pantry and kitchens. Along this path I teach an annual course titled, “Campus and Community Gardens” which introduces students to the modern food regime and its production of food injustice and how urban gardening exists as but one way to disrupt this system. This paper tells this story in more detail, couching our garden’s productivity and community impact within the concepts of food justice and public pedagogy. I also detail two concerns. First is our initial struggle to share this food with our campus’ two kitchens—the Emporium Grille and our Conference Center—in an effort to embody simple farm-to-table food production for our community, again as simple publicly pedagogical exercise. The second concern exposes flaws in the mapping of food deserts and the spatial impact of the garden’s productivity.
Key Words: food justice, food deserts, urban gardening =========================================================

- 52 -
LLANDSCAPE OF CLIMATE CHANGE RESILIENCE Michael J. Allen ([email protected]), Department of Political Science & Geography, Old
Dominion University, Norfolk, VA 23529 Abstract: Anthropogenic climate change presents a wide range of humanitarian,
economic, and geopolitical challenges. As communities grapple with the impacts—prolonged heat, sea level rise, changing habitats—questions remain regarding how or who will be resilient. This presentation considers cases from the Commonwealth of Virginia and the differential responses across the climate change landscape from immigrant farmers, residents of Tangier, the poor, and those who, for whatever reason, may not be able to fully cope, mitigate, or adapt to the future changes in our environment. The synthesis explores aspects of social and environmental (in)justice, equality, and responsibility while evaluating the normative discourse surrounding climate change.
Key Words: Climate; environmental justice; climate change; Virginia; applied geography =========================================================
RIVERSCAPES OF LOW ORDER HEADWATER STREAMS USING TERRESTRIAL LIDAR Ranbir Singh Kang ([email protected]), Department of Earth, Atmospheric, and
Geographic Information Sciences, Western Illinois University, Moline, IL 61265 Abstract: A variety of geo-spatial tools such as LiDAR and drone are increasingly used to
collect high resolution fluvial data. Many scholars have applied riverscaping approach i.e. using airborne LiDAR to survey full length rivers. This approach provides an exceptionally detailed data to understand the continuity of fluvial processes. However, the canopy cover along streams banks and the shape of banks make it difficult to survey the full length stream banks. Therefore, this paper extends that method to using a terrestrial LiDAR in low order streams. Using a Leica C10 scanner, three streams in different eco-regions were surveyed through a series of scans in the downstream direction. At each scan location, a full 3d point cloud along with 360 orthophotos were collected. Using common targets at individual scan sites along each stream, all scans were registered together with the help of Leica Cyclone suite. The final full length point c loud for each stream was used to extract very detailed geomorphic data. The results of this paper provide an excellent tool for various local agencies to prepare a detailed data set of local streams and plan future management as well as restoration initiatives.
Key Words: Applied Geomorphology, riverscape, terrestrial LiDAR, stream, survey =========================================================
Spatio-temporal evolution of water areas and farmlands in Northeast China based
on remote sensing data Chengpeng Lu ( [email protected] ), Institute of Applied Ecology, Chinese Academy of
Sciences, Shenyang, Liaoning, 110016, China. Abstract: The land used for water and farmland is an important resource for food production,
their temporal and spatial change processes sustain the sustainable development of regional agriculture. The Northeast China are typical areas where human activities have a significant impact on land cover changes. It is of great significance to analyze the changes of water use areas and farmlands and their driving mechanisms from the perspective of the human-environment coupling system. Through the land use classification data obtained from remote sensing interpretation in the Northeast China in 2000, 2005, 2010 and 2015, spatial and temporal evolution characteristics of water areas and farmlands land were quantitatively expressed using spatial analysis and visualization methods. The research

- 53 -
shows that the area of water areas in the 15 years have changed from “slight reduction-slight increase-sharp decrease”, with an average annual reduction area of 213.48 km2, and the farmland areas have continued to increase, with a growth rate of 707.94 km2/a, which has benefited from deforestation, land reclamation and land reclamation; The area of reduced farmlands turning into water is less than the area of water areas transferred to farmland.
Key words: Man-land relationship, Land use, Farmland, Water area, Northeast China =========================================================
GGIS MODELING OF THE INVASIVE SPECIES PURPLE LOOSESTRIFE AND JAPANESE STILT GRASS IN THE SOUTHERN APPALACHIANS
Christopher A. Badurek ([email protected]), Department of Geography, State University of New York at Cortland, Cortland, NY, 13045
Abstract: Management of invasive plant species is a significant challenge, particularly over the lengthy extent of the Appalachian Trail (AT). This application examines two species as case examples: purple loosestrife and Japanese stilt grass. A GIS model of distribution was developed using the environmental variables of elevation, slope, aspect, climate, as well as presence data from EDDmapS and GBIF. An ArcGIS layer of the predicted range for each was developed using logistic regression with the statistical package R. GIS layers of predicted range for each species was produced using cartographic modeling and logistic regression. Public access points were also examined to determine predicted likelihood of each species at each location. Results indicate specific areas of high likelihood of purple loosestrife but more distributed areas of Japanese stilt grass. Findings show promise as an approach to developing preventative methods and management of invasive species at the regional scale.
Key Words: GIS, Modeling, Biogeography, Regression. =========================================================
APPLICATION OF GROUND PENETRATING RADAR IN CLANDESTINE GRAVE SURVEYS Lee Stocks, Jr. ([email protected]), Department of Geosciences, Mansfield
University, Mansfield, PA 16933, Cecil Cooper, Mansfield University, Mansfield, PA 16933 and Jesse Olsen, Criminal Justice Administration Department, Mansfield University, Mansfield, PA 16933
Abstract: Ground penetrating radar (GPR) has gained acceptance in many fields, including geology, engineering and archaeology, as a non-invasive method for capturing high-resolution imagery of subsurface objects. High-frequency electromagnetic pulses produce a two-dimensional radargram that allows interpretation of near-surface anomalies. Because the wave velocities change dramatically when encountering void spaces and disturbed soils, GPR is particularly suited for grave detection and inventory surveys of old cemeteries. Buried objects produce a reflection hyperbola (inverted U), bedrock contacts and soil density changes show up as planar reflectors, and void spaces manifest as a ringing reflection. Since many cemetery sites have crumbling headstones or older graves with unmarked locations, these geophysical indicators offer enormous potential in locating lost and clandestine graves without digging, excavation, or drilling. This research conducts a GPR grid survey in the Brookside-Rexford Cemetery in Rexford, Pennsylvania, where a suspected mass grave of infant mortalities from the 1918 influenza outbreak were reportedly interred without coffins. The survey was conducted using both 100 and 500 megahertz Mala antennas in three 50 x 50 foot grids, to compare and interpret imagery at various scales and resolutions. Data was processed using GPR-Slice, a comprehensive GPR imaging software that produces 2D and 3D images.

- 54 -
Key Words: GPR, Geophysical, Cemetery =========================================================
PAPER SUBMISSION (STUDENT COMPETITION ENTRY)
UUSING EARTH OBSERVATIONAL SATELLITE DATA TO EXPLORE THE INFLUENCE OF
LAND USE AND LAND COVER CHANGE ON WATER QUALITY IN CANCER VILLAGES Xin Hong ([email protected] ) and Jay Lee ([email protected] ) Department of Geography,
Kent State University, Kent, OH 44240 Abstract: Cancer villages are a new post-economic reform phenomenon in China. They
have been a focal point for researchers to examine health problems due to the deteriorated environmental conditions in rural areas of China. This paper investigated the degree to which the changes in land use and land cover (LULC) degraded the water quality in a rural area, which in turn may have led to potential health problems of the residents. To address the goal of the investigation, this paper utilized satellite images snapshotted from Landsat 5 Thematic Mappper (TM) and Landsat 8 Operational Land Imager (OLI) in September of 1987 and 2017. Analysis of changes in LULC and in the vegetation concentrations in water bodies in Shenqiu County over the past 30 years were performed. The study finds that most of rural residence have been lost to the built environment and farmlands between 1987 and 2017. In the meantime, vegetative materials in the water have seen increases, especially in the water bodies which are adjacent to industrial sites and farmlands.
Key Words: Remote Sensing, Cancer Villages, Land Use and Land Cover, Geographic Information Systems, Water Pollution.
========================================================= THE ROLE OF DEMOGRAPHIC DATA BIAS IN THE UNDER-PROVISION OF RETAIL: A
CASE STUDY OF GROCERY DESERT TRACTS IN 23 SOUTHERN CITIES William Graves ([email protected]), and Zoey Zhang, Department of Geography,
University of North Carolina Charlotte, Charlotte, NC 28223 Abstract: Geographic explanations for food deserts (the absence of full service grocery
stores in low-income neighborhoods)) have long focused on environmental explanations such as poverty, race, infrastructure or a corporate location preference for greenfield sites. We posit that that flaws in the measurement of demand conditions (specifically the population and income in the areas surrounding prospective stores) are a contributing factor in the existence of food deserts. Building on Graves and Gerny’s (2018) findings of commercial data underestimation bias in urban and low-income areas we evaluate commercial demographic data from four commercial data vendors (ESRI, Popstats, ScanUS and Experian). Data are collected for a one-mile radius surrounding 68 grocery desert sites in Southern US metro areas (as identified by the USDA Food Atlas) and compare those results to 38 non-desert sites in the same metro areas. Difference in means testing revealed no significant difference between desert and non-desert sites in our sample. In addition, our findings suggest that some grocery desert sites are as much of a product of the corporate selection of a data vendor as of the actual environment surrounding the site.
Key Words: Grocery desert, Data bias, Retail Location =========================================================

- 55 -
TTHE ROLE OF RETAILING IN INNER URBAN SPACES: THE HEARTH OF SMALL CITIES IN SOUTH EUROPE
Ana Vera ([email protected]), Àngel Cebollada ([email protected]), Àngels Pèrez ([email protected]) and Marc Castelló ([email protected]), Department of Geography, Universitat Autònoma de Barcelona, Carrer Fortuna S/N, Cerdanyola (Barcelona) Spain 08193
Abstract: The relations between space and retail activity are mutually constitutive. In this way, retail capital can structure spaces -defining urban spaces with shopping streets, markets, and malls-, but retail capital is also configured by socio-spatial processes. In Southern European cities retailing in inner urban areas has been very important. Main street retailing in medium size cities, which was relevant in the last century cities, has been facing competitive disrupts from commercial centers on the edge of cities. Nowadays, local commerce associations counterattack competition by creating favorable environments in inner cities with social events and shopping to attract clients. The objective of this research is to establish a methodology to analyze the dynamics of public spaces in inner urban areas in relation to the retail activity and the pedestrian flow. This methodology is carried out combining qualitative and quantitative methodologies. The qualitative methodology is based on in-depth interviews with social agents of retailing and direct observations in the public space; and the quantitative methodology is based on pedestrian flows, in the physical characteristics of the streets, and in the census of retail shops. In the results we expect to confirm the working hypothesis of this study to analyze the importance of the importance of the retail activity as a key element in the development and transformation of the city. The case study includes the inner urban areas of eight medium size cities in Catalonia.
Key words: inner urban spaces, pedestrian flow, retail geography, transition town. =========================================================
EXPLORING BRAND PREFERENCE AND ITS SPATIAL PATTERNS IN CHINESE
AUTOMOBILE MARKET. Wei Song ([email protected] ), Department of Geography and Geosciences,
University of Louisville, Louisville, KY 40292 Abstract: China has remained the world's largest new-automobile market where personal
vehicles play an increasingly important role in people’s daily lives. Using automobile sales data for 337 prefecture-level cities from the Economic Advisory Centre of the State Information Centre, this study examined automobile brand preference and its spatial variation in China. Automobile brands’ market shares and revealed comparative advantages in city markets were analyzed, and geographical patterns were explored using spatial statistics. Analytical results revealed apparent regional heterogeneity and spatial concentration in automobile brand preference across China’s automobile market.
Key Words: automobile purchasing; brand preference; Chinese automobile market; regional heterogeneity; spatial concentration
========================================================= THE GEOGRAPHY OF AUTOMOBILE RETAILING IN THE TOLEDO METROPOLITAN
REGION OF OHIO Kefa M. Otiso ([email protected]), Department of Geography, Bowling Green State
University, Bowling Green, OH 43403
- 56 -
Abstract: US automobile retailing has generally shifted from CBD locations in the 1950s and 1960s to suburban sites along major commercial ribbons in recent decades (Lord 2006). This shift has also been accompanied by significant suburban clustering of this activity not only in response to the suburbanization of the US population, but also due to the territorial security concerns of auto dealers, availability of good locational opportunities, the advent of mega-dealers, and the regulatory locational constraints of this activity. In this paper, I use various spatial datasets to explore the geography of the Toledo auto dealerships. Besides the ongoing westward shift of this metro region’s auto dealerships, interesting patterns are emerging on the distinct geographies of ordinary versus luxury auto brands in Toledo.
Key Words: Toledo, automobile dealerships, spatial clusters, market territories, auto brands
========================================================= FFROM CONSPICUOUS CONSUMPTION TO COMPLETE COMMUNITY: SHOPPING
CENTRE REDEVELOPMENT IN CANADA Tony Hernandez ([email protected]), Department of Geography, Ryerson University,
Toronto, Ontario, M5B 2K3, Canada Abstract: Shopping centres have been a major component of the commercial landscape
across Canada for over half a century. Waves of shopping centre development can be identified from convenience-based strip centres in inner urban areas to major super-regional centres located in the downtowns and suburbs of major cities. In 2017, there were over 5,000 shopping centres across Canada, accounting for more than 600 million square feet of retail space. In recent years, with the widespread adoption of e-retail and associated omni-channel activities by retailers operating in Canada, there have been growing questions as to the requirements for retail space. Retailers have been reassessing their omni-channel space needs of their store networks and, in turn, shopping centre landlords/owners/commercial real estate developers have had to re-examine the scale, function and form of retail space within their property port folios. This research paper details the development of a comprehensive database of shopping centre redevelopment projects in Canada. Summary findings from the database are provided to quantify the scale and extent of redevelopment, while associated case-studies highlight the nature of shopping centre change.
Key Words: Shopping Centres, Retail, Canada, Redevelopment =========================================================
UTILIZING VEGETATION MANAGEMENT SOFTWARE FOR UTILITY MAPPING Justin Walters ([email protected]) and Kristin Lust ([email protected]),
Davey Resource Group, Inc., 295 S. Water Street, Suite 300, Kent, OH 44240 Abstract: GIS plays a crucial role in mobile mapping software applications, where
databases, symbologies, labeling and overall aesthetics are just as important as the work being collected. Through the development of proprietary software, Davey Resource Group has been able to develop a GPS based field application that integrates seamlessly with the use of GIS software developed for utility vegetation management and mapping. As technology and innovations evolve, we have gone from traditional paper maps to GIS map packages that provide a paperless workflow and allows arborist to make real time adjustments to planned work. Through automated processes which utilize ArcPy, Model Builder and conversion tools, we are also able to provide maps that are more efficient

- 57 -
and accurate, enabling communication and cohesion between field crews and office personnel to be more streamlined.
========================================================= AA PROACTIVE APPROACH FOR ROW VEGETATION MANAGEMENT USING GIS AND
REMOTELY SENSED DATA Deborah E. Sheeler ([email protected]) and William Ayersman
(William,[email protected]), Davey Resource Group, Inc., 295 S. Water Street, Suite 300, Kent, OH 44240.
Abstract: The spatial visualization capabilities of GIS technology provide an efficient and
cost effective method to analyze and display remotely sensed data. By identifying predetermined and/or custom land cover classes, and associated vegetation densities along ROW corridors, resource managers are able to develop strategies for prioritizing planned maintenance, calculate accessibility to determine equipment needs and relevant safety protocols, map environmentally sensitive areas, assist in identifying a wide array of encroachment issues, and target only the specific locations that require a field inspection. Attendees will learn how utilizing multispectral imagery, automated feature extraction processes, and GIS analysis techniques can lead to an advanced and proactive ROW vegetation management program.
========================================================= A YEAR IN THE LIFE OF A GIS ANALYST AT A TREE CARE COMPANY Emmanuel Ong ([email protected]) and Michael Binkley
([email protected]), The Davey Institute, The Davey Tree Expert Company, 1500 N. Mantua St, Kent, OH 44240
Abstract: The use of geographic information systems (GIS) and remote sensing varies in actual practice across different corporate environments around the world. As a “hometown tree care” business, the Davey Tree Expert Company works out of 200 local offices that provide residential and commercial tree, lawn, and landscape services. Davey also provides complete golf course grounds management, conducts nationwide utility line clearance operations and assists utilities with their post-storm recovery efforts. In Davey’s corporate environment, GIS and to a lesser degree, remote sensing, are used in a myriad of basic support roles from simple mapping to market analyses and the occasional specialty mapping project. This presentation will provide an overview of the regular, foundational applications of these tools at Davey Tree.
========================================================= I-TREE: FREE TOOLS TO QUANTIFY TREE BENEFITS Michael Binkley ([email protected]), The Davey Institute, The Davey Tree Expert
Company, 1500 N. Mantua St, Kent, OH 44240 Abstract: i-Tree (www.itreetools.org) is an ongoing public-private partnership between
the USDA Forest Service and the Davey Tree Expert Company to transform Forest Service scientific research into tools that people can use to understand the benefits that their trees provide. These benefits primarily relate to carbon dioxide and air pollution removal, energy savings, and storm water mitigation. The tools range from working with data collected in the field to simple office-based assessments, and they span a few different web-mapping toolkits from the Google Maps API to GeoServer. The

- 58 -
presentation will provide an overview of i-Tree and focus on a few of the easier to use, map-based tools which can be employed at varying levels of spatial analysis. These tools help users quickly assess land cover, impervious cover, and tree canopy anywhere in the country for mitigation projects and more.

- 59 -
FRIDAY,11/2/2018 HHIGH RESOLUTION MAPPING OF THE URBAN HEAT ISLAND Dillon Tennis ([email protected]) and Christopher Labosier
([email protected]), Department of Biological and Environmental Sciences, Longwood University, Farmville, VA 23909
Abstract: Urban heat islands (UHI) are urban or metropolitan areas that are significantly warmer than surrounding rural areas. Alterations in the local energy budget often attributable to thermal properties of the urban landscape, building geometry, and decreased evapotranspiration contribute to the formation of UHIs. Remote sensing has proven a useful and common method of examining the UHI, but the technology has limitations, including spatial and temporal resolution. In order to provide an additional useful and informative tool for municipalities to address UHIs, resolution at the sub-block and hourly spatiotemporal scale is necessary to acknowledge that UHIs vary across space and time. The purpose of this project is to employ high spatiotemporal temperature and locational data to map the UHI in Farmville, Virginia. Transect and fixed-point locations are used to collect temperature data. Preliminary results suggest more specific locations of increased (and decreased) temperatures allowing urban planners to specifically address those locations with the addition of shade vegetation, for instance. Future work will continue the data collection started in this project and continue over the winter season as some literature suggests that the magnitude of the UHI is largest during this time of year. Key Words: Urban Heat Island, Urban Climate, Urban Canopy Layer
Key words: Urban heat island, urban climate, urban canopy layer =========================================================
SPLINE PLOTS FOR TIME SERIES VISUALIZATION OF ANNUAL HEATING AND
COOLING DEGREE DAY TOTALS IN THE CLIMATE DIVISIONS OF NORTH CAROLINA Dennis J. Edgell ([email protected]), Department of Geology and Geography,
University of North Carolina at Pembroke, Pembroke, NC 28372 Abstract: Degree days are variables utilized for the planning, estimation and assessment
of heating requirement and electrical cooling demand of building interiors. Heating Degree Days (HDD) are the number of degrees that a day's average temperature is below 65o Fahrenheit (18o Celsius). Cooling Degree Days (CDD) are the number of degrees that a day's average temperature is above 65o Fahrenheit (18o Celsius). Long and short term climate changes have the potential to change expenditures on the heating and cooling of structures. This project plotted the long term trend of annual HDD and CDD totals throughout the climate divisions of North Carolina. Original data were monthly totals of HDD and CDD averaged by NOAA Climate Division. Data were downloaded from a NOAA online database. Monthly division data were summarized to annual total HDD and CDD for each division in North Carolina for the period 1895-2017. A spline routine was fit through the series in order to best visualize climate change. Results indicate that annual total HDD and CDD have changed over time, but the relationship is not linear. Annual CDD are rapidly increasing, HDD are in decline. Savings on winter heating will likely not offset increased electric demand for cooling.
Key words: Climate Change, Time Series, Degree Days, Climate Divisions, North Carolina
=========================================================

- 60 -
CCHANGE DETECTION IN A POST-INDUSTRIAL ENVIRONMENT Jacob Taylor ([email protected]), Department of Geography, Ohio University,
Athens, OH 45701 Abstract: As global populations increase, populations in urban areas are increasing and
are expected to rise moving forward. However, this has not been the case for cities concentrated in the American Rust Belt. The much-maligned city of Youngstown has seen a dramatic decrease in population since its heyday in the early 20th century. From 1950 to 2010 Youngstown’s population dropped by 60%. This decrease in population has resulted in urban decay and subsequent changes to the city’s planning strategy. Youngstown’s new plan to deliberately shrink may have altered land cover in the area. These land cover changes can be detected from a variety of different techniques with the use of remotely sensed imagery. The objective of this study is to compare methods of change detection in a postindustrial environment. Post classification techniques will be used to assess the extent of change Youngstown has experienced over the last three decades. The results of the analysis will describe the impacts that deindustrialization and population decline has had on the city of Youngstown and the surrounding area. Also, the analysis seeks to address the broader ecological implications of decline and has Youngstown’s planning strategy made a detectable difference in urban greening?
Key Words: Urban Decline, Land Use and Land Cover Change, Change Detection
========================================================= SLUM IDENTIFICATION MAPPING: AN OBJECT-BASED IMAGE ANALYSIS OF SLUMS
IN DAR ES SALAAM, TANZANIA Peyton Moran ([email protected]) and Ethan Willis, Department of Geography,
University of North Alabama, Florence, AL 35632 Abstract: Recently, slum settlements have developed, due to rapid increases in population
density and irregular patterns in land use planning. Remote sensing can provide city planners, engineers, and local officials the ability to analyze past, present, and future growth of slum settlements and inadequate access to urban services (water, garbage disposal systems, etc.). This research attempts to answer the following question: Does object-based image analysis provide and efficient method in identifying and determining slum settlements in Dar es Salaam, Tanzania? The purpose of this research was to employ remote sensing methods, to identify and map slum settlements in the observed area. High resolution imagery (0.5 meters), provided by OrbView 3 was used to assess urban structures within a portion of Manzese. Overall, this research provided evidence that OBIA is a beneficial and useful method in capturing slum settlements, considering that it had captured up to 118,500 square meters of slums. Positive results in slum identification mapping has the potential to provide the following for slum settlement citizens: access to water, improved sanitation, secure tenure, or more durable housing. It may also lead to a better understanding of future land use planning, the local economy, and housing regulations.
Key Words: Object-Based Image Analysis, Slum Settlements, Dar es Salaam, Feature Extraction, OrbView 3
=========================================================

- 61 -
TTHE EVOLUTION AND RECONSTRUCTION OF INDUSTRIAL ECOSYSTEMS OF MINING
CITIES IN THE TRADITIONAL INDUSTRIAL AREA OF NORTHEASTERN CHINA A CASE STUDY OF DASHIQIAO IN LIAONING PROVINCE
Yu-Pu Huang ([email protected]), Key Lab of Aerosol Chemistry & Physics, University of Chinese Academy of Sciences, Beijing 101408.
Abstract: Based on the theories of evolutionary economic geography and industrial ecology, in this paper, we take Dashiqiao city of Liaoning Province as a case, map the evolutionary process and characteristics of the magnesium industry, and establish the structure and function model of magnesium industry ecosystem. The main conclusions are as follows. First, the evolution of magnesium industry system in Dashiqiao city was divided into five phases: initial phase, fast phase, mature phase, transitional phase, and optimizing phase, and each phase presents different evolutionary characteristics due to diverse influencing factors. Second, from the perspective of industrial ecology, the industrial structure of magnesium in Dashiqiao city includes five subsystems: primary industrial subsystem, resource and environment subsystem, exogenous industrial subsystem, symbiosis industrial subsystem and industrial innovation subsystem. The five subsystems interact with each other and form a network structure through systematic coupling and multi-level utilization of material and energy. This structure is similar to a general ecosystem, both of them present the characteristics of isomorphism and difference. Third, by regulating the evolutionary path and process of magnesium industry ecosystem, it can maximize the ecological, economic and social benefits and further promote the construction of ecological civilization of magnesium industry of Dashiqiao.
Key words: industrial ecosystem; evolutionary process; structural model; functional reconstruction; Northeastern China
========================================================= RESEARCH ON THE SHORT-TERM AND LONG-TERM EFFECTS OF
ENVIRONMENTAL POLLUTION ON HEALTHY HUMAN CAPITAL. XIANG Huali ([email protected]), Department of Public Administration, YANG
Jun ([email protected]), Research Center for Environment and Health, and ZHANG Youye([email protected]), School of Information and Safety Engineering, Zhongnan University of Economics and Law, Wuhan, China 430073.
Abstract: This paper studies the long-term and short-term effects of environmental pollution on healthy human capital based on the macro health production function, and uses panel data from 30 provinces and cities in China (excluding Tibet) for 2002-2017. The results show that in the short term, across the country, with the industrial dust increase 1 percent, the number of residents per capita will increase by 0.24 percentage. This effect is still significant in the eastern and western regions, while the central region is affected by industrial wastewater, and with the chemical oxygen demand per unit area increases 1 percentage, the number of per capita treatment will increase by 0.12 percentage. In addition, the increase of the health expenditures and the illiteracy rate will also increase the number of visits per capita; In the long term, water pollution is the main factor affecting mortality, and there is a lagging effect. The increase in the percentage of females in the current period by one percentage will increase the current and the next-term mortality rate by 0.5 and 0.46 percentage respectively. There is an inverted “U” nonlinear relationship between per capita GDP and resident mortality.

- 62 -
Key Words: Environmental Pollution, Health Human Capital, Long-term and Short-term Effects, Macroscopic Health Production Function
========================================================= SSPATIAL INEQUALITY IN ECUADOR: A STRUCTURAL GAP APPROACH Ramiro Canelos-Salazar ([email protected]), Montserrat Pallares-Barbera
([email protected]) and Ana Vera ([email protected]), Department of Geography, Universitat Autònoma de Barcelona, Carrer Fortuna S/N, Cerdanyola (Barcelona) Spain 08193
Abstract: Classical analyses of constraints and challenges associated with development in middle-income Latin American countries have been performed based on per capita income levels. Since the first decade of the 21st century, the structural gap approach has been an alternative criterion to that of per capita income. It identifies areas where there are gaps, such as poverty, inequality, and social inclusion, that hinder social and economic development. In the present study, we used hierarchical cluster analysis to assess the socioeconomic development of cities in Ecuador. The goal was to add depth and flexibility to the study in order to assess a more complex reality regarding the development level of the country. This way, the resulting taxonomies of cities is used to address specific policies to improve quality of life and sustainability of the population.
Key Words: Structural Gap Theory, Hierarchical Cluster Analysis, Socioeconomic Development, Latino America.
========================================================= SPATIAL DIFFERENTIATION OF DIGITAL ECONOMY AND ITS INFLUENCING FACTORS
IN CHINA Junfeng Tian ([email protected]), School of Earth Sciences, JiLin University,
Changchun, China 130012, Binyan Wang, Department of Environmental Science and Shijun Wang, School of Geographical Science, Northeast Normal University, Changchun, China 130024
Abstract: Digital economy is a new form of economic and social development after agricultural economy and industrial economy, and it is becoming a new momentum of global economic development. Based on the digital economy indices of China’s provinces and cities published by the digital economy index platform of Tencent Research Institute, this article analyzes the spatial differentiation characteristics of Chinese digital economy and its different dimensions in 2016 by using the methods of interpolation simulation and rank-size rule, and then use geographical detector model to detect and compare the influencing factors of digital economic development in China and its inner regions. Results showed that: The spatial differentiation of Chinese digital economic development is obvious. At the urban scale, national urban agglomeration area is the absolute height of the development of digital economy. The dominant factors influencing the development of digital economy at different spatial scales are different. At the national level, the government’s commitment to science and technology plays an important role. For the eastern region, the influence are quited; In Central China, the informatization foundation and potential factors plays a leading role in the development of digital economy; There is no decisive factor in the western region, which is affected by many factors; The factors influencing the development of digital economy in Northeast China are relatively single.
Key Words: Digital economy, Spatial differentiation, Geographical detector, Influencing factors, China

- 63 -
========================================================= AASSESSING HEALTH OF THE CELE OASIS FOR AGRICULTURAL PRODUCTION AND
EXPANSION Brian Waldron ([email protected]), Department of Civil Engineering, University
of Memphis, Memphis, TN 38152, USA, Dongwei Gui ([email protected]), Yi Liu ([email protected]), Xinjiang Institute of Ecology and Geography, Urumqi Xinjiang, China 830011, and Heng Dai ([email protected]), Institution of Groundwater and Earth Sciences, Jinan University, Guangzhou Guangdong, China 510632
Abstract: In the Xinjiang Province of China, oases support 90% of the province’s inhabitants and produces more than 95% of the social wealth. Oases’ dependency on water availability from mountainous regions plays a critical factor in the sustainability of agricultural practices and oasis expansion. In this study, we have chosen the Cele Oasis located in the south rim of the Taklimakan Desert, typical of oases in the region. With over 97% of Cele’s economy tied to agriculture, unfettered expansion of the oasis into the desert has raised concern on water availability. A spatial and temporal analysis of water availability is performed to derive a health rating linked to food security of the Cele Oasis for current agricultural production and plausible expansion beyond its current boundary. The health rating indicates that oasis expansion to accommodate greater agriculture activity will require greater dependency on groundwater as surface water distribution becomes strained to reach the oasis outskirts with dependable availability. Transferability of the methodology for developing health ratings will be beneficial to other oases in the arid region who face similar concerns.
Keywords: Oasis, food security, agriculture, water availability, scarcity =========================================================
RICE FARMING WATER USE IN TEXAS, 2012-2016: QUANTIFYING THE EFFECTS OF
TIME AND CONSERVATION ON PURCHASED WATER Timothy T. Loftus ([email protected]), Department of Geography, Texas State
University, San Marcos TX 78666 Russell C. Weaver, ([email protected]), Department of Geography, Texas State
University, San Marcos TX 78666 John Q. Barnard IV, ([email protected] ), Department of Geography, Texas State
University, San Marcos TX 78666 Abstract: Following the implementation of volumetric measurement and pricing of water,
the Lower Colorado River Authority (LCRA) wished to understand the effect of this management practice and others on water use in the Garwood Irrigation Division, one of three rice-growing areas where farmers purchase water from the LCRA. Farmers were interviewed in 2017 and survey data were analyzed with a longitudinal, hierarchical linear model. A log-level model was ultimately set-up to evaluate 15 explanatory variables plus two interaction terms. The resulting full-model output featured eight significant explanatory variables, a marginal R2 (fixed effects) value of 0.77, and a conditional R2 (full model) value of 0.88. Time as a predictor is the only temporal variable in the model and output indicates there was a 7.6 percent decline in water use each year from 2012 to 2016. Additionally, the model indicates that for every dollar increase in the price of water sold, 1.4 percent less water is used by farmers in response. The policy relevance of this finding, along with the other six variables, is considered in the context of implementing conservation to reduce water use in Garwood and elsewhere

- 64 -
to enable an outof-basin water transfer to satisfy a community’s drought-management strategy.
Key words: ice farming, water use, agricultural conservation, hierarchical linear modeling =========================================================
EEXPEDIENT INEQUITY: NEW YORK STATE’S REGISTERED SEX OFFENDERS Darrell A. Norris ([email protected]), Department of Geography, SUNY College at
Geneseo, Geneseo, NY 14454 Abstract: Uniquely in American criminal justice, the released sex offender’s identity and
location become a matter of readily accessible and near-permanent public record. Given the abhorrent nature of his crime, the sex offender is as much a pariah outside prison walls as he is within them. The released offender is generally subject to strict parole requirements and these, as well as mandatory counseling, influence his residential placement. So does residential cost, as well as the geography of New York’s penitentiaries. Thus expediency colors placement. The latter is reinforced by a spectrum of public resistance from outrage to tacit acceptance at the community level. The overall outcome is sticking offender concentration, demonstrable at a county level, across metropolitan areas, and even at a micro-geographical scale. Any possibility of equity in post-incarceration placement is thwarted by systemic constraints and the strength of NIMBY resistance arising from the public nature of parolee geography. I demonstrate the resultant patterns for New York State in 2012 and 2017-18. Restoring some degree of placement equity to this geography places the applied geographer squarely in the sights of hostile public reaction wedded to the status quo.
========================================================= ON THE MICRO-GEOGRAPHY OF AN EMERGENT ENTREPRENEURIAL SUPPORT
ECOSYSTEM: COOPERATION, COMPETITION, AND COOPETITION John R. Lombard ([email protected]), School of Public Service, Strome College of
Business, 2092 Constant Hall, Old Dominion University, Norfolk, VA 23529 Abstract: Economic development policy and programs such as business recruitment,
science parks, industry clusters, and the creative class, were and are embraced and supported by local and regional economic development agencies. More recently, the entrepreneurial ecosystem has become a mantra for many economic development practitioners. The literature on entrepreneurial ecosystems is vast and includes a number of recent critical reviews, that while sympathetic in many regards; present a number of shortcomings that need attention. This paper examines the micro-geography of the entrepreneurial support ecosystem in the Virginia Beach-Norfolk-Newport News metropolitan area of Virginia, a region that is lagging in entrepreneurial activity. We explore the evolution of the emergent structure and performance at the micro-geographic scale by identifying the spatial linkages that constitute the entrepreneurial support ecosystem within the political, financial, and institutional sub-systems. The paper concludes with suggestions for continued research and calls for comparisons of the entrepreneurial ecosystem in competitive regions for policymakers to better understand nature and scope of this economic development mantra.
========================================================= TREND ANALYSIS OF SPATIOTEMPORAL PATTERNS OF SHOALING IN THE FORT-
MCHENRY CHANNEL CHESAPEAKE BAY, MARYLAND

- 65 -
Abiye Williams ([email protected]), Department of Physics, Astronomy & Geosciences
Kang Shou Lu ([email protected] ), Department of Geography & Environmental Planning, Towson University, MD 21252
Abstract: The Fort McHenry Channel provides vital access to the Port of Baltimore, one of only four ports with deep shipping channels and supersized container berth on the Atlantic coast of United States. Recent increases in shipping business and potential expansion in future have imposed high demand for channel maintenance and even channel widening. In either case, there is a need to understand the current condition and dynamic processes of the channel. The research used the annual hydrographic survey data collected between 2012-2017 by US Army Corps of Engineers to examine the spatiotemporal patterns and effect of shoaling and dredging of the Channel. It was found that the annual change in mean channel depth falls within 0.77 ft. While shoaling resulted in a drop of 0.34 ft. in water depth annually, dredging deepened the channel by 0.39 ft. per year on average, which are equivalent to 198,785 cubic yards of sediments added and a net 224,463 cubic yards removed per year respectively in addition to that added by shoaling. Three types of channel cross section were identified and places with shoaling problems mapped. It is hoped that these findings can be used for dredging planning for channel expansion.
Key Words: Shoaling, Channel, Dredging, GIS, Chesapeake Bay. =========================================================
DDETERMINING HABITAT FRAGMENTATION TYPE, DENSITY, AND DISTRIBUTION IN
THE CASTLE CROWN, ALBERTA TO IDENTIFY ECOSYSTEMS AND RESOURCE USE MANAGEMENT STRATEGIES FOR TWO NEW PROVINCIAL PARKS
Dawna Cerney ([email protected]) and Peter Kimosop ([email protected]), Department of Geography, Youngstown State University, Youngstown OH 44555 Clayton Whitesides ([email protected]), Department of Anthropology and Geography, Coastal Carolina University, Conway, SC 29528
Abstract: In 2015, the newly elected New Democratic Party for the Province of Alberta signed into law the protection of land located on the eastern slopes of the Rocky Mountains between Waterton Lakes National Park and the Municipality of Crowsnest Pass. For over a century, various land use activities ranging from passive recreation, such as hiking and fishing to active logging and mining occurred in the area. Multiple generations have appealed to the provincial government to protect the sensitive habitat corridor from cumulative land use pressures, to no avail, resulting in an ever-increasing use of the region causing landscape changes that disrupt ecological functioning, as reported by many ecologists. This study examines the density and distribution of habitat fragmentation as delineated within two provincial parks created to protect that ecological functioning, yet still allow various resource use activities. Findings indicate the delineation for each park is well defined by intensive and extensive land use evidence. However, satellite data and GIS analysis indicate that Keystone and Umbrella species, as well as landscape processes such as fire renewal, require additional consideration in the protection of this area.
Key Words: Habitat Fragmentation, Remote Sensing, GIS, Protected Parks, Sensitive Species
=========================================================

- 66 -
SSPATIAL AND TEMPORAL VARIATIONS OF PARTICULATE MATTER CONCENTRATIONS IN CHINA IN 2015
Pengfei Liu ([email protected]) and Ziyun Jing, Henan University, Kaifeng, Henan, China 475004.
Abstract: Atmospheric particulate matters (PM) have important impacts on human health, climate change, and vegetation growth. Studying the temporal and spatial variation of the concentrations of atmospheric particulate matter in China and their causes could provide basic data for decision-making on air pollution control and prevention. Spatial and temporal variations of PM concentrations and their mechanism were explored using the monitoring data of PM10 and PM2.5 in 311 Chinese cities in 2015. We found that: (1) The trends of PM10 concentration in China from January to December show an U-shaped curve by their changes, which is similar to the trend of PM2.5 concentration. (2) Cities with serious pollution of PM2.5 present a contiguous distribution pattern than anchor in the Beijing-Tianjin-Hebei region and its surrounding areas. In regions of southeast, southwest, and northwest, however, the PM2.5 concentrations are low. (3) The Yangtze River is the north-south dividing line between high and low PM2.5 and PM10 concentrations in China. The southeastern coastal area around the Pearl River Delta is a stable region with low PM values. (4) The PM2.5/PM10 ratio presents a spatial pattern of low in northwest and high in southeast with a peak level mainly concentrated in winter. The high level of concentration may have resulted from the winter coal heating and seasonal weather conditions. (5) Hotspot analysis shows that PM2.5 concentration, PM10 concentration, and PM2.5/PM10 ratio all have significant aggregative characteristics in Chinese cities, forming stable pollution regions of PM2.5 and PM10 in Beijing-Tianjin-Hebei and central provinces of China.
Key Words: Air pollution; particulate matters; PM2.5; PM10; Spatial and temporal patterns =========================================================
PERCEPTUAL CHANGE OF ENVIRONMENT IN SUNDARBAN AREAS: VULNERABILITY
AND RISK MEASUREMENT Ayan Rudra ([email protected]) and Aparajita Chattopadhyay Department of
Development Studies, International Institute for Population Sciences, Mumbai, India, 400088
Abstract: Vulnerability commonly defined as the propensity to be adversely affected. It has been studied as a hazard’s composition of adaptive capacity, sensitivity, and exposure. This study uses statistical and econometric tool for measuring household’s vulnerability to environmental change in both Sundarban areas. And also item response theory has been constructed to validate Likert scale (about the environment). Total 368 households are surveyed, among them 192 in West Bengal part and 176 in Bangladesh. Above 91% WB people believe that energy consumption is the major reason for climate change and it should be reduced, in Bangladesh it is 76%. Here education plays a role to determine this factor because West Bengal people are more literate than Sundarbans of Bangladesh. Principle Component Analysis and Multinomial logistic regression result show that highly vulnerable populations are found in Bangladesh (36.93%) than Sundarban of West Bengal (25.52%). Both areas heavily dependent on primary activities, so this create economic risks. In the effect of vulnerability level socio-economic as well as environmental variables are more impactful in Bangladesh. Awareness about environment found much in the West Bengal Sundarban, but

- 67 -
Government or NGOs are more active according to their perception in Sundarbans of Bangladesh.
Key Words: Vulnerability, risk, environmental perception, adaptaiion, hazard. =========================================================
GGEODATABASE DEVELOPMENT FOR HEALTH INTERVENTIONS Carol Campbell ([email protected]), Jill McDonald, and Arthur Guerrero, Department of
Geography, New Mexico State University, 88003 Abstract: Low levels of physical activity, food insecurity, and potential for chronic
diseases affect marginalized populations, such as Mexican-heritage families along the US-Mexico Border. We designed a geodatabase from neighborhood street survey data to support development of interventions that empower Mexican-heritage youth to make healthy decisions about physical activity levels. We added data related to the built environment in Chaparral, Columbus, and Deming, three low-income communities in southern New Mexico, where efforts to prevent child obesity are underway. The result is a database that includes 58 selected characteristics of 949 street segments, and GPS coordinates of community resources, such as parks, schools and food venues. Next, we added census block group (CBG) data to include socio-economic variables. The database facilitates visualization of characteristics and statistical descriptions to compare the communities specifically at the neighborhood or community scale, and design interventions that may increase physical activity levels. Preliminary results indicate that income and education levels are similar among the three communities; distance to parks, community centers, food venues and recreational sites differs. The database facilitates intervention design by linking spatially accurate information about the built environment with neighborhood characteristics.
Key Words: geodatabase, obesity risk factors, community intervention, Physical activity =========================================================
SPATIAL VARIATIONS IN THE ASSOCIATIONS OF ADULT OBESITY RATE WITH
ALTITUDE IN THE UNITED STATES Hoehun Ha ([email protected]), Department of Sociology, Anthropology, and Geography,
Auburn University at Montgomery, Montgomery, AL 36124-4023. Abstract: There has been a lack of study investigating the relationship between altitude
and a national obesity rate. By expanding hypoxia mechanism, the present study test the hypothesis that elevation is largely responsible for obesity prevalence on the basis of cross-county studies. Thus, counties with higher altitudes are less likely to have a higher rate of obesity. To test the hypothesis, information on adult obesity and physical inactivity are obtained from CDC diabetes interactive atlas, while urbanization data is collected from census population estimate. Other potential covariates including health behavior, clinical care, socioeconomic, and demographic statistics are collected from various data sources (e.g. Behavioral Risk Factor Surveillance System). We conduct machine learning and local spatial regression analyses to expand knowledge on factors contributing to adult obesity rates, particularly from a geographic perspective. The analyses are likely to demonstrate how obesity is associated with altitude in the United States. The findings propose a need for further investigation into the extent that altitude may serve as a protective factor for obesity prevalence and have major implications in our understanding of the etiology of obesity by medical professionals.
Key words: altitude, obesity, machine learning, local spatial regression, hypoxia, BRFSS
- 68 -
========================================================= TTHE GEOGRAPHY OF RETAIL CLINICS POST AFFORDABLE CARE ACT Ethan Porillo ([email protected]) and Chetan Tiwari ([email protected]), Ph.D.,
Department of Geography, University of North Texas, Denton, TX 76203 Abstract: Retail clinics are low-cost, walk-in clinics designed for convenience and for
servicing minor health issues and certain acute conditions. The model began as a way of bringing both convenience and care to areas that traditionally have lower levels of access to healthcare resources. However, research has shown that these clinics tend to be located in areas with higher incomes and, generally, greater access to primary care. With the implementation of Affordable Care Act (ACA) in March 2010, populations that were previously uninsured were now required to have access to some level of health insurance. The se populations present a new potential new market for retail clinics. This study accounts for differences in state and local policies by evaluating retail clinic locations within the states of Texas, Massachusetts, and Florida. Using GIS and spatial analysis techniques, we observe a greater dispersion within retail clinic locations in a strict regulatory state such as Massachusetts when compared to Texas, which tends to have more leniency in policies overseeing retail clinics.
Key Words: Retail Clinics, Affordable Care Act, Healthcare, Policy =========================================================
USING GISCIENCE TO CONTROL THE STATISTICAL RELIABILITY AND SPATIAL
RESOLUTION OF D ISEASE AND MORTALITY MAPS Chetan Tiwari ([email protected] ), Department of Geography & the Environment,
University of North Texas, Denton, TX 76203 Abstract: Under current practice, disease and mortality outcomes are generally
represented as crude or directly age-adjusted rates that produced using data from a collection of basic spatial units (BSUs), each of which, contains a subset of the case and population data. The selection of BSUs influences an important tradeoff between the degree of spatial resolution portrayed on the map and the statistical reliability of computed rates. Maps produced using fine-scaled BSUs have the advantage of producing representations with high degrees of spatial resolution but often have poor statistical reliability because the population support -- numbers of persons at risk -- used in calculating each rate is often small. GIS software can be used to manipulate BSUs by choosing the level of spatial aggregation of these units that result s in adequate population support across the map. Strategies for reconciling the tradeoff between resolution and reliability have used functions from geographic information science to control spatial resolution and statistical theory. Since both characteristics contribute to the usefulness of any map, this paper is about how the map maker may choose the levels of spatial resolution and statistical reliability for the map they make. To this end, we demonstrate how the two characteristics can be controlled using lung cancer data as it is commonly made available in the United States.
Key Words: Disease Mapping, Kernel Density Estimation, GIS ========================================================= RESISTANCE TO ENVIRONMENTAL ACTIVISM IN YOUNGSTOWN, OHIO Raymond E Beiersdorfer ([email protected]) Distinguished Professor of Geology

- 69 -
Susan L Beiersdorfer ([email protected]), Department of Geological & Environmental Sciences, Youngstown State University, Youngstown, OH 44555
Abstract: The pre-Rust Belt mentality that “Pollution = Money“ still operates in the fracking debate in Youngstown, OH. Facts, such as the lack of jobs due to fracking, the well-documented cases of pollution and seismicity tied to the industry, and the dangers associated with the highly hazardous, radioactive fracking waste, fall on deaf ears. Since 2011, the region has suffered over 750 recorded earthquakes, illegal dumping of fracking waste and numerous spills. Claims of “there’s nothing I can do” by elected local officials spurred concerned citizens to enact a Community Right’s approach to protect public health and safety. This resulted in opposition by industry, the Regional Chamber of Commerce, many labor and trade unions, the local newspaper, elected officials from both major political parties, the Youngstown Warren Black Caucus, and Youngstown State University’s current President. The county Board of Elections has refused to certify the issue to the ballot three times and succeeded keeping it off in 2017, due to a state preemptive law aimed at stopping Youngstown’s environmentalists. One local trade union has spent about a half-million dollars in opposition to the Youngstown Community Bill of Rights and the Youngstown Drinking Water Protection Bill of Rights.
Key Words: fracking, environment, jobs, Community Rights =========================================================
TTHE IMPACT OF RENTAL PROPERTIES ON BLIGHTED NEIGHBORHOODS OF
YOUNGSTOWN, OHIO Jennifer Burrell ([email protected]), Department of Geography, Kent State
University, Kent, OH 44242-0001 Abstract: Rental properties are generally thought of as a destabilizing factor for
neighborhoods; while homeownership is mostly viewed as a stabilizing factor. Although homeownership has been shown to have negative effects on particular types of neighborhoods, homeownership is the preferred choice in housing status for neighborhoods due to the positivity it can typically bring about. What appears to be lacking within the literature is the impact of rental properties on blighted neighborhoods. Renters can provide occupancy in these neighborhoods where vacant properties out number occupied properties. This has the potential to improve the neighborhood through the similar mechanisms that homeownership provides – maintained properties. This paper examines the impact of rental properties in helping to stabilize blighted neighborhoods in Youngstown, Ohio. This is done by using rental property registration records and crime data combined with spatial video of the built environment. The analysis conducted here is to determine if aesthetic improvements to neighborhoods correlate with assumed rental properties and if this improved or stymied further blight.
Key Words: Rentals, Blight, Neighborhood Decline, Youngstown =========================================================
THE CITY OF YOU: REBRANDING YOUNGSTOWN, OHIO, A COMMUNITY-IN-REVIVAL Robert J. Thompson ([email protected]), Department of Art, Youngstown
State University, Youngstown, Ohio 44555 Abstract: In 2015, Youngstown State University in partnership with the City of
Youngstown was approved for a $250,000 grant from the Economic Development Administration. The purpose was to develop an economic development strategy by identifying it’s influential people and places, amongst other interests. Most of

- 70 -
Youngstown’s competitive advantages occur in its nationally-recognized centers of industry, educational institutions, and its people – the influential innovators in business, industry, education, and entrepreneurship. This economic development strategy offers a new narrative focus for Youngstown and is visually portrayed through a multi-point advertising campaign (titled “The City of You”) that offers meaningful expressions across all communication channels by specifically focusing on the people and places in Youngstown that are instigating change in the community, the economy, and in some cases – the world. The unique racial composition and segmented locations of certain racial groups within the City posed significant challenges and mandated that the City of You strategy undergo an extensive stakeholder critique, public presentation, critical observation and in-depth analysis through the use of target-specific focus groups, user testing scenarios, and experimental, in-person data collection techniques. Examples of design deliverables, creative placemaking, and people and place-driven multimedia storytelling will be shared.
Key Words: youngstown, ohio, creative placemaking, branding, design, marketing, economic development, community development, revitalization, revival
========================================================= EECONOMIC DEVELOPMENT OF YOUNGSTOWN--PAST, PRESENT AND FUTURE--
THROUGH THE STORIES OF THREE BUILDINGS Tom Maraffa ([email protected]), Department of Geography, Youngstown State
University, Youngstown, OH 44555 Abstract: Youngstown has become a metaphor for a Rust Belt city through its prosperity
during the industrial era, the collapse of the steel industry and its subsequent decline, and attempts at economic revival through embracing new technology and advanced manufacturing. Three buildings in the landscape of central Youngstown are representative of these transitions. The Strauss-Kaufmann Building was once the landmark central business district department store that became the headquarters of the ill fated PharMor Corporation. Meshel Hall on the YSU campus was built as a "high tech center" to stimulate the regions economy through emerging computer technologies during the last quarter of the 20th century. Finally, a county jail on the margins of the CBD and the YSU campus is being positioned as an innovation center for advanced manufacturing and future economic development. The stories behind these three buildings provide lessons from the past that can hopefully guide the future.
Key Words: economic development, central city landscapes, campus community connections.
========================================================= STUDENT VETERAN CHOICES OF POST-SECONDARY STEM PROGRAMS IN
NORTHEAST OHIO Ryan Portela ([email protected]), Department of Geography, Youngstown State
University, Youngstown, OH 44555 Abstract: Northeast Ohio has a long manufacturing tradition. Although it has been nearly
forty years since the collapse of the steel industry, which was the region’s main economy, many residents believe that industrial manufacturing will return and bring with it many lucrative jobs. Along with the economic cultural history of the region, the recent national push for STEM disciplines may be a contributing factor to the people of
- 71 -
the region having strong hopes in the industry returning. This ongoing research investigates whether post 9/11 veterans using educational benefits over the last three to five years are enrolling in and graduating from trade schools, technical colleges, and engineering programs at different rates than their civilian counterparts. Veteran choices of STEM programs and majors, along with completion rates over the last three to five years will also be investigated. Manufacturing and industrial job trends in the region will also be examined. Post-secondary and graduated veterans will be interviewed in Columbiana, Mahoning, and Trumbull counties of Northeast Ohio to establish the driving forces behind the educational choices they are making in these subject areas.
Key Words: Student Veterans; Post-Secondary Education; STEM; Northeast Ohio =========================================================
UUSING GEOGRAPHIC INFORMATION SYSTEMS (GIS) TO ESTIMATE ECONOMIC
VALUES OF AMAZONIAN FORESTS: OLIGARCHIC FORESTS, CHALLENGES AND LESSONS LEARNED OVER TIME AND SPACE
Jim Penn ([email protected]), Department of Geography and Sustainable Planning, Grand Valley State University, Allendale, MI 49401
Abstract: Oligarchic forests rich in economically important tree species are found in different Amazonian landscapes that support local, regional and international economies. The patchy distribution of non-timber forest species allows researchers to accurately map their extent and distribution, which in turn provides an important way to estimate the standing economic value of the fruits, fibers and other products harvested from these forests. In this long-term study, the annual productivity and economic value of different palm and fruit tree forest environments in western Amazonia was estimated using GPS and GIS. This method can also be applied to study the productivity and economic value of other forest species and help planners to establish new protected areas and promote forest conservation and sustainable use. However, this study also illustrates that care must be taken when estimating the economic value and productivity of different forest types, and that long-term monitoring of forest productivity and economic returns from forest products is necessary to determine the economic value of Amazonian forests.
Key Words: Non-timber forest resources, GIS, oligarchic forests, Amazon =========================================================
GIS-BASED PERFORMANCE ASSESSMENT OF THE INDUSTRIAL DEVELOPMENT IN
TIEXI DISTRICT OF SHENYANG Shuheng Dong ( [email protected] ), Institute of Applied Ecology, Chinese Academy
of Sciences, Shenyang Liaoning, 110016 China. Abstract: Tiexi District of Shenyang, as a typical old industrial city in China, has
made a great contribution to the early development of Chinese industry. In this research, we take Tiexi District as the object to study its process of industrial development from the spatial perspective during fifteen years from 2003 to 2017. We select 20 indicators from its society, economy and environment to build an index system, then entropy method will be used to determine the weight of each index, quantitatively calculate the performance of industrial development from 2003 to 2017. Finally, we come to some conclusions as follows: By using GIS method, we can see a significant change of industrial layout in Tiexi has taken place. The leading position of the second industry has been superseded by the tertiary industry from 2003 to 2017. The performance of industrial development
- 72 -
shows a growing trend year by year. At last, some experiences and suggestions we can get from the process of industrial development in Tiexi District are summarized.
Key Words: Old Industrial City, Industrial Layout, Industrial Development, Tiexi District of Shenyang
========================================================= MMONITORING OF COASTLINE CHANGES IN AL SEEFA AREA- SULTANATE OF OMAN,
A STUDY IN APPLIED GEOMORPHOLOGY Youssef Sherief* ([email protected]) Assistant Prof. Sultan Qaboos University,
Sultanate of Oman and Zagazig University, Egypt Abstract: Al Seefa is a coastal area, eastern Muscat - Sultanate of Oman. The area is
characterized by narrow sandy beaches formed over thousand years due to the deposits of short valleys flowing into Oman Sea. The study area is considered a tourist area, but its coast is currently being relegated to erosion. Remote sensing and Fieldwork investigations revealed severe erosion taking place shoreline and the side parallel to the tarred road northern the study area. This study aimed to identify the coastline change during the last 20 years using ETM, IKONOS, QuickBird and DEM images. The results showed 14 meters of shoreline retreat and recorded 50-meter retreat in another area northern in the study area. It could be said that coastal erosion in the Al Seefa area related to the action and direction of waves, kind, and thick of deposits, surface slopes, and human activities furthermore sea level rise. However, the study recommends to make protection for the northern sector of shoreline and protect all shorelines of the Al Seefa area from an expected sea level rise in the future.
Key Words: RS, Coastline, SLR, Shore Perception. =========================================================
THE LOOMING PILOT SHORTAGE: PILOT PRODUCTION AND FLIGHT TRAINING
FACILITIES IN THE US Jonathan C. Comer ([email protected]) and Thomas A. Wikle, Department of
Geography, Oklahoma State University, Stillwater, OK 74078 Abstract: In 2010, the U.S. Federal Aviation Administration (FAA) significantly
increased requirements for new airline first officers, from 300 flight hours to over 1000 flight hours. At the same time, fewer US military pilots are moving into civilian aviation, and a large percentage of commercial pilot trainees in the US are foreign nationals contracted to fly for non-US airlines, especially in China. As a result, with a rising average age of current pilots and increasing costs of flight training, the US airline industry faces a severe pilot shortage. To better understand this shortage, this research compares resources necessary for flight training with the production of student pilots. Training resources used in our analysis included the number of certified flight instructors, the location of public use airports and FAA-designated (Part 141) flight schools, and the availability of single-engine aircraft used in flight training. Along with training resources, we consider other influences on pilot production such as weather and population characteristics. Our analysis shows higher per capita concentrations of student pilots, single engine aircraft, and certified flight instructors in less-populated, western states, and that lack of access to training resources is not necessarily a contributing factor to this shortage.

- 73 -
Key Words: pilot shortage, airlines, aviation =========================================================
HHOUSING PRICE ANALYSIS USING A MULTILEVEL MODELING APPROACH: THE CASE
OF LUCAS COUNTY, OHIO Yanqing Xu ([email protected]) and Dan Hammel ([email protected]),
Department of Geography and Planning, University of Toledo, Toledo, Ohio 43606-3390
Abstract: For decades researchers have been interested in house price modeling, and there is a growing recognition of the necessity to consider environmental and contextual variables in the process. In this research we examine the association between neighborhood characteristics and all individual house sales prices in the Lucas County, Ohio, from year 1987-2016 through a multilevel modeling approach. Despite various neighborhood definitions, census tracts are empirically used in this study. Neighborhood characteristics include a foreclosure score, and urbanicity and built environment variables such as street connectivity and walkability indexes. The major advantage of the multilevel model is that it allows us to derive reliable estimates of place differences which represent a considerable improvement over single-level model. Significant correlations were identified between house prices and foreclosure score, street connectivity and walkability. The MLM results indicate that house prices lay in not only house characteristics themselves, but also neighborhood features, thereby offer good prediction accuracy and high explanatory power.
Key Words: house price, multilevel modeling, foreclosure, neighborhood =========================================================
THE COST OF MANUFACTURING JOBS: USING A QUASI-EXPIRIMENTAL APPROACH
TO EVALUATE JOB AND INCOME CREATION BY SOUTHERN AUTO PLANTS 1983-2016
William Graves ([email protected]), Department of Geography, The University of North Carolina at Charlotte, Charlotte NC 28223
Abstract: Economic development policy in the Southern US has been built around the region’s lost-costs and the expectation that industrial succession will propel the region to prosperity. This expectation has allowed local and state governments to assume that using incentives payments ($44.7 billion in total payments) to attract auto assembly facilities as an effective means of attracting new industrial facilities. We evaluate this assumption using a quasi-experimental analysis of three decades of county-level data for on employment and income change around the 12 Southern auto plants plus 15 control sites (sites which competed unsuccessfully for one of the 12 plants). We found that the control counties (the counties not receiving auto plants) outperformed the areas with plants in 6 of 8 scenarios of employment and income change. In addition, we find little evidence of agglomeration advantages created by the auto plants as manufacturing employment change was greater in control counties 10 years after plant opening. It appears that the visibility of the auto plants combined with their reputation for paying relatively high wages crowds out other potential employers. Our conclusions suggest that large-scale incentives payments for industrial facilities are ineffective means of creating employment in the US South.
Key Words: Employment change, economic development, incentives evaluation. =========================================================

- 74 -
BBUSINESS STRATEGIES, LINKAGES, AND CLUSTER DEVELOPMENT IN A SMALL-CITY
CONTEXT Murray D. Rice ([email protected]), Department of Geography, University of North Texas,
Denton, TX 76203-5017 Abstract: The emergence of successful business clusters is a topic of broad interest, as
there are many public policy implications and applications for an improved understanding of the dynamics of business development. Many previous studies in this field have focused on large, well-known, successful business clusters in sizable metropolitan areas. However, for an improved understanding of business cluster evolution it is necessary to address business development in smaller cities as well. Winkler and Steinbach, in the Canadian province of Manitoba, are two cities each with populations of less than 20,000 people. Despite their small size and lack of proximity to major continental markets, since the year 2000 Winkler and Steinbach have both seen substantial business expansion and consistently placed in the top tier of Canadian city population growth rankings. This research investigates the reasons for this expansion via a series of interviews with key decision-makers in both cities.
Key Words: Business Clusters, Business Development, Entrepreneurial Ecosystems. =========================================================
THE CHANGES IN RETAIL TRADE PATTERNS IN MUSCAT, SULTANATE OF OMAN Abdelghani, Montasser Ibrahim Mahmoud ([email protected]), Sultan Qaboos
University, Oman Abstract: Muscat as a capital of Sultanate of Oman witnessed since 1970th a major
change, because of the urban development process derived by the government. As a result of the urban development are crucial changes in retail trade sector in the city. One can summarize it in 3 major changes: 1) establishment of big number of new retail trade streets and areas (Souqs) as well as shopping malls. 2) continually changes in land use patterns of these streets and malls for adapting with the market economy and new capitalism as well as to meet the changing demands of customers. 3) changes in behavior of customers as a result of appearance of the new retail trade areas and centers. This paper aims to investigate the changes and development of retail trade sector in Muscat based on four approaches: 1) determine and detection of retail trade streets, areas and shopping malls in the city, 2) survey of land use of some selected retail trade streets and malls, 3) Counting of visitors and pedestrians of markets and shopping malls, and 4) Using a questionnaire to investigate the attitude of customers regarding the shopping behavior.
Key Words: Retail Trade, Urban Development, Shopping Behaviour. =========================================================
A GEOSPATIAL ANALYSIS OF THE HEALTH IMPACTS OF OIL SPILLS IN THE NIGER
DELTA OF NIGERIA Chijioke Anyanwu ([email protected]), Department of Geography, Ohio University,
Athens, Ohio, 45701 Abstract: Advancements in Geographic Information Systems (GIS) technology has
become an innovative and essential tool for public health research. The spatial modeling capability of the GIS has proved essential to understanding spatial relationships between environmental hazards and human health. Previous research has linked oil spills to

- 75 -
human health hazards such as dermatoxic diseases, cancer, neonatal and child mortality. This study presents an application of Geographic Information systems (GIS) to examine the spatial relationship between oil spills and child health in the Niger Delta region of Nigeria. I use spatial oil spill data from Nigeria oil spill monitor and health data from the Nigeria Demographic Health Survey (DHS, 2013) to perform a spatial autocorrelation in a GIS. I aim to determine spatial variations of diarrhea diseases among children in the study area and determine if there exists a spatial correlation between the distribution of infant diarrhea and oil spill locations.
Key Words: GIS, Oil Spill, Infant Diarrhea, Niger Delta, Nigeria =========================================================
PPREVALENCE OF OBESITY IN KUWAIT: A CASE STUDY AMONG KUWAIT UNIVERSITY
STUDENTS Mohammad Alnasrallah ([email protected]) and Muhammad Almatar
([email protected]), Department of Geography, Kuwait University, PO Box 68168, Safat 71962, Kuwait
Abstract: This study seeks to understand the relationship between the effect of geography and obesity prevalence among Kuwait University students. The sample involved 735 participants, 231 male and 504 females, where there are high percentage of them are overweight and obese. The percentage of overweight is 21% (BMI >25 - 30) while the percentage of obesity is 13.7% (BMI > 30). Both overweight and obese people accounts for 34.7%. In the study area, there are 327 fast food restaurants located in different places of in the urban area. This study use the Geographic Information System to analyse the distribution of obesity and fast food restaurants. The study found that within half kilometres of fast food outlets, there are 33% of normal weight (BMI < 25), 30% of overweight while for the obese people there are 43%, which shows that obesity is linked to the location of fast food restaurants. One the significant tools that were used in this study hot and cold spots. The study found that areas of hot spots of fast food restaurants tend to be located in areas of hot spots of obese people. In conclusion, studying the prevalence of obesity from geographical perspective help to understand this public health issue and its relation to effect of geography.
Key Words: Obesity Prevalence, GIS, Fast Food, Kuwait =========================================================
COMMUNITY RESILIENCE TO THE DENGUE VIRUS IN SRI LANKA Naomi W. Lazarus ([email protected]), Department of Geography and Planning,
California State University Chico, Chico, CA, 95929 Abstract: Recent outbreaks of the dengue virus have reached epidemic proportions in Sri
Lanka. Several studies on vector-borne diseases in the Tropics have focused on the epidemiology of the vector, the Aedes aegypti mosquito, responsible for the spread of dengue. The tropical climate and urbanization are found to be key factors that contribute to the diffusion of the virus. This paper examines the social dimension of dengue as an environmental hazard by focusing on the demographic and socioeconomic characteristics of the population exposed to the virus. A quantitative analysis at the district level is carried out to evaluate the similarities and differences in the factors that contribute to the dengue virus in urban, peri-urban, and rural areas. The results reveal that age, population density, income levels, and poverty have varied effects in determining the number of dengue cases across the districts in Sri Lanka. The findings are supported by current observations conducted in the field that show the spatial

- 76 -
variation in physical and cultural landscapes that contributes to vector-borne diseases in tropical regions.
Key Words: Community Resilience, Dengue Virus, Hazard, Tropics =========================================================
SSENTENCING REFORM PRE- AND POST-BOOKER: THE CASE FOR EQUALITY Jay L. Newberry ([email protected]), Department of Geography, Binghamton
University, Binghamton, NY 13902 Abstract: In 1984 Congress passed the Sentencing Reform Act out of concern for the
apparent inter-judge sentencing disparities found amongst criminal defendants – similarly situated defendants receiving divergent sentence lengths. Specifically, non-White defendants receiving longer sentences than their White cohorts – a racial sentencing gap. The Act, and ensuing guidelines, was a way to deal with this gap by mandating sentence ranges and removing the discretion of the individual judges. This would amount to a justice system whereby defendants are treated equally without bias. In 2005, the U.S. v. Booker case upended the sentencing guidelines thus reverting sentence length back to the discretion of the judges. With that said, this research looks at federal sentencing trends at the district court level both before and after the Booker decision to gauge the impact it had (positive or negative) on the racial sentencing gap. This research also examines the role place and politics plays in sustaining the gap. Preliminary results indicate the political affiliation of the judge has a strong impact on the sentencing disparities.
Key Words: Prison, Justice, Sentencing, Inequality, Jail. =========================================================
THE INSURGENT STATE AND THE SPATIALIZATION OF POLITICAL CONTROL DURING
THE VIETNAM WAR JANUARY 1967 – DECEMBER 1968 Gordon A. Cromley ([email protected]), Department of Geography, Kent State
University, Kent, OH 44242-0001 Abstract: Concerns regarding the Global War on Terror has prompted an increase in
research on the causes, strategies and outcomes of insurgency and counterinsurgency warfare. While this research has focused on current cases and their environmental and political ramifications, historical case studies also can still provide important insights. This study utilizes historical data from the Vietnam War to analyze the spatialization of the political control of hamlet population between 1967 and 1968 in South Vietnam using the Insurgent State model as a lens through which to understand this dataset. Results show that there was a distinct spatial manifestation of the spectrum of political control, and that the North Vietnamese and their Viet Cong allies began to shift slightly the focus of their control from their jungle origins to nearby urban centers.
Key Words: Insurgency Warfare, Vietnam War, Spatialization, Spatial Analysis =========================================================
GEOGRAPHIC CONSEQUENCES OF JORDAN’S REFUGEE POLICY Kevin Romig ([email protected]), Department of Humanities and Social Sciences,
Northwest Missouri State University, Maryville, MO 64468-6001 Abstract: The Hashemite Kingdom of Jordan takes in asylum seekers from areas affected
by war and conflict. Jordan rarely expels a person who makes it within their boundaries seeking political asylum. Whereas some traditional global refugee destinations are

- 77 -
dealing with political realities of nationalist movements, Jordan continues to receive refugees from Syria, Yemen, and Egypt as well as housing millions of dislocated persons from Palestine, Iraq, and Lebanon. Jordan’s population has soared from 449,000 people in 1950 to a recent count of more than ten million in a land with few natural resources and limited infrastructure. This paper explores the geographic consequences of such a massive population increase on a smaller country by examining three key measures: demographic change, urbanization, and water availability. Results from such a massive demographic transition include higher urbanization and unemployment rates, lower degrees of educational and healthcare quality and access, and significant water rationing and conservation. These indicators suggesting lower quality of life across Jordan have important implications for national political stability.
Key Words: Jordan, Refugees, Water Scarcity, Political Instability =========================================================
SSUMMIT REGISTERS IN THE SOUTHERN APPALACHIANS Clayton J. Whitesides ([email protected]), Department of Anthropology and
Geography, Coastal Carolina University, Conway, SC 29528 Abstract: A common tourist activity in mountain landscapes is summiting the local
highpoint of a region. Increased tourism and population growth, however, has increased demand on mountains and may have long-term consequences on visitor experience and environmental conditions. Most research on these topics has occurred in the American West and little is known about summit registers in the American Southeast. The highest summits in AL, GA, KY, NC, SC, TN, and VA, as well as local visitor centers and land managers, were visited between 2014-2016 to search for past and present summit registers. Results indicated that only Alabama and Georgia maintained formal summit registers. An informal register was found on Sassafras Mountain, SC, but the remainder of the peaks contained no record of past or present registers. Increased vandalism and ecological damage was documented on summits without registers. On peaks with logbooks, the location of the register appeared to affect vandalism. Besides the presence or absence of logbooks, land ownership and local fees also influenced vandalism and ecological degradation. Free, public summits contained more vandalism than free, private summits. Better understanding of summit registers and fee systems on mountains in the American Southeast is necessary for appropriate management of regional summits.
Key Words: summit register, Southern Appalachians, tourism, mountain environments, highpoint
========================================================= EXPEDIENT INEQUITY: NEW YORK STATE’S REGISTERED SEX OFFENDERS Darrell A. Norris ([email protected]), Department of Geography, SUNY College at
Geneseo, Geneseo, NY 14454 Abstract: Uniquely in American criminal justice, the released sex offender’s identity and
location become a matter of readily accessible and near-permanent public record. Given the abhorrent nature of his crime, the sex offender is as much a pariah outside prison walls as he is within them. The released offender is generally subject to strict parole requirements and these, as well as mandatory counseling, influence his residential placement. So does residential cost, as well as the geography of New York’s penitentiaries. Thus expediency colors placement. The latter is reinforced by a spectrum of public resistance from outrage to tacit acceptance at the community level. The overall

- 78 -
outcome is sticking offender concentration, demonstrable at a county level, across metropolitan areas, and even at a micro-geographical scale. Any possibility of equity in post-incarceration placement is thwarted by systemic constraints and the strength of NIMBY resistance arising from the public nature of parolee geography. I demonstrate the resultant patterns for New York State in 2012 and 2017-18. Restoring some degree of placement equity to this geography places the applied geographer squarely in the sights of hostile public reaction wedded to the status quo.
========================================================= AA SPATIO-TEMPORAL KERNEL DENSITY ESTIMATION APPROACH TO PREDICTIVE
HOTSPOT MAPPING Yujie Hu1, Fahui Wang2*, Cecile Guin3 and Haojie Zhu2 1 School of Geosciences, University of South Florida, Tampa, FL 33620-5550, USA 2 Department of Geography & Anthropology, Louisiana State University, Baton Rouge,
LA 70803, USA. 3 Office of Social Service Research and Development (OSSRD), School of Social Work,
Louisiana State University, Baton Rouge, LA 70803, USA. Abstract: Predictive hotspot mapping plays a critical role in hotspot policing. Existing
methods such as the popular kernel density estimation (KDE) do not consider the temporal dimension of crime. This article proposes a spatio-temporal kernel density estimation (STKDE) approach and applies it in predictive hotspot mapping. Comparing to related existing work, the method has three major features: (1) a data-driven optimization technique, the likelihood cross-validation, is used to select appropriate bandwidths, (2) a statistical significance test is designed to filter out false positives in the density estimates, and (3) a new metric, the predictive accuracy index (PAI) curve, is proposed to evaluate predictive hotspots at multiple areal scales. The method is illustrated in a case study of residential burglaries in Baton Rouge, Louisiana in 2011. The study demonstrates great promises of the STKDE in visualizing and predicting crime hotspots.
Key Words: spatio-temporal kernel density estimation (STKDE); optimal bandwidth; significance test; predictive accuracy index (PAI) curve; crime hotspot prediction; residential burglary
========================================================= THE SPATIO-TEMPORAL NATURE OF CRIME HOTSPOTS Huiyu Lin ([email protected]), Department of Geography, Kent State University, Kent, OH
44242-0001 Abstract: Crime activities typically distributed unevenly in space and over time. The local
indicator of spatial association (LISA) is one of the most used method in identifying crime hotspots. However, not all hotspots are the same when its temporal characteristics is considered. This research uses burglary data in Portland, Oregon from 2013 to 2015, and conducts hot spot analysis using different temporal units at the census block group level. Based on the temporal pattern of when a location becomes or ceases to be a hot spot, a classification scheme is proposed and applied to establish five types of hot spots, including emerging, disappearing, sporadic or oscillating, intensifying, and persistent hotspots. When different temporal units were considered, variances appeared in the results of identified hotspots, and the locations and characteristics of hotspots do change spatially and temporarily. The socioeconomic status and physical environmental
- 79 -
conditions of the top-five hotspots indicate that hot spots are indeed very different among different categories of hotspots. Nevertheless, locations that are socio-economically deprived, especially those low-income areas, are still closely related to higher crime rates.
Key Words: crime hot spots, LISA, spatiotemporal hot spots. =========================================================
GGIS BASED APPROACHES TO MEASURING THE SPATIAL EQUITY OF ENDOWMENT
FACILITIES AND THEIR LOCATION OPTIMIZATION Shuju Hu ([email protected] ) School of Geographical Sciences, Northeast Normal
University, Changchun, 130024, China. Abstract: Based on network analysis and potential model, the index of spatial equity
consisting of the facility’s accessibility and the consumers’ movement costs was designed to measure the spatial equity of endowment facilities in Changchun. Results showed that: the spatial equity of endowment facilities in Changchun was relatively low, the scale of facility and the consumers’ trip distance were the main influencing factors; From the urban core to the fringes, the distribution of spatial equity showed a “low-high-low” layer structure, namely, the spatial equity in the urban core and fringes were lower than that in the suburbs; There were significant regional differences in the spatial equity. On the regional scale, the spatial equity in the southwest fringes was higher than that in the northeast, east and south, on the subdistrict scale, the spatial variable coefficient of spatial equity was relative high; Based on the value of spatial equity in each subdistrict and whether it was within reasonable service radius, the whole region’s endowment resources was divided into abundant areas, semi-abundant area, semi-deficient areas and deficient areas, and the facility’s distributions were optimized by using the minimize impedance model, the minimize facilities model and the maximize coverage mode, respectively.
Key words: Network Analysis, Endowment Facilities, Accessibility, Spatial Equity, Location Optimization.
========================================================= ANALYSIS OF TEMPORAL AND SPATIAL DISTRIBUTION AND INFLUENCING FACTORS
OF THEFT CASES IN CHICAGO ([email protected]), Department of Public Security, Shanghai
Police college, Shanghai 200137 School of Computer and Communication Engineering, China University of
Petroleum (East China), Qingdao 257061 Department of Public Security, Shanghai Police college, Shanghai 200137 Abstract: Using Java Script's Cross filter and the dc.js chart to analyze and demonstrate
the crime time, space, case value, specific crime location, police beat and district involved in theft case in Chicago at the level of the Census tract , this paper aims to display the spatial-temporal characteristics of theft. Finally, the use of Paython3.6 software to build a random forest algorithm analysis shows that two variables the city's new (reconstruction) permit licensing number and house price have a greater impact on the theft, while ethnic, percentage of poverty, single parent families has little effect on it.
Key Words: Chicago; Theft; Data visualization; Spatial-temporal distribution; Random forest
- 80 -
========================================================= SSIMULATING SPATIAL DIFFUSION OF MEMES OVER SOCIAL MEDIA NETWORKS
Zhuo Chen ([email protected]) and Jay Lee ([email protected]), Department of Geography, Kent State University, Kent, OHIO 44240
Abstract: The task of exploring human dynamics became more vital because of the growing popularity of online social network services such as Facebook, Twitter, Instagram etc. Although the online social networks require loose physical constraints, and for services like Twitter, networks can be formed without having acquaintance with each other, apprehending information diffusion on such networks without considering physical constraints such as physical distance between two actors is short of practical perception. We first introduced our SocialNetworkSimulator program which is an open-source program that allow users to analyze and simulating spatial social networks. By using Twitter’s API, we collected and the “Charlotesville” data which was a hot social movement topic related to the event “Unite the Right rally” happened at Charlottesville, Virginia from August 11 to August 12. Focusing on the effect of spatial parameters, we studied the effect of distance decay in the diffusion process by using SocialNetworkSimulator. Our experiment showed that while distance may hinter the diffusion from a city to distant cities, it actually helped the overall influence of diffusion if the source cities (e.g. LA and NY) are separated in a great distance. Also, the decaying radius that makes a difference is from 100 to 200 miles and around 375 miles.
Key Words: spatial social networks, meme diffusion, agent-based modeling

81
PRESENTER INDEX
PRESENTER INDEX
Abdelghani, Montasser Ibrahim Mahmoud, 19
Abubakari, Mohammed Rabiu, 6
Adams, Ryan, 2 Almatar, Muhammad, 19 Alnasrallah, Mohammad, 19 Allen, Michael, 11 Altice, Frederick, 6 Andrievskikh, Daria, 1, 3, 7 Anyanwu, Chijioke, 19 Ayersman, William, 13 Badia, Anna, 3, 8 Badurek, Christopher, 5, 11 Barnard, John, IV, 15 Beiersdorfer, Raymond, 17 Beiersdorfer, Susan, 17 BenBella, Diane, 6 Binkley, Michael, 12, 13 Bova, Joshua, 6 Brown, Shan-Estelle, 6 Burrell, Jennifer, 17 Campbell, Carol, 16 Campbell, Harrison, Jr. I Canelos-Salazar, Ramiro, 14 Carlson, Larry, 6 Castelló, Marc, 11 Cerney, Dawna, I, 1, 15, 17, 19 Chattopadhyay, Aparajita, 15 Chen, Zhuo, 20 Chendev, Yury, 4 Colucci, Alex, 10 Colucci, Amanda, 10
Comer, Jonathan, I, 17, 18 Commons, Michael, 12 Crnjak, Dragana, 19 Cromley, Gordon, 20 Curl, Lisa, 1 Dai, Heng, 15 Delap, Kennedy, 4 Deng, Chengbin, 9 Dolney, Tim, 7 Dong, Shuheng, 18 Dwyer, Tom, I Earl, Richard, I, 7 Edgell, Dennis, 14 Eitner, Sam, 2 Frazier, Amy, 8 Gallagher, Karen, 10 Gatrell, Jay, 8 Ghosh, Debarchana, 6 Gisbert, Meritxell, 3, 8 Gonzalez, Joshua, 5 Graves, William, 6, 11, 18 Gruccio, Gary, 8 Guerrero, Arthur, 16 Gui, Dongwei, 15 Ha, Hoehun, 16 Hammel, Dan, 18 He, Shasha, 8 Hernandez, Tony, I, 6, 11, 12 Hong, Xin, 11 Hu, Shuju, 20 Hu, Yuji, 20 Huang, Yu-Pu, 14 Hutton, Nicole, 7

82
PRESENTER INDEX
Jing, Ziyu, 15 Kalra, RajRani, 2, 7, 8 Kang, Ranbir Singh, 11 Kerski, Joseph, 16 Khan, Junaid, 5 Kim, Hyun Joong, 3 Kim, Mi Jin, 3 Kimosop, Peter, 15 Korde, Milad, 1, 3 Krymskaya, Olga, 4 Labosier, Christopher, 14 Larson, Michael, 3 Lawrence, Patrick, 10 Lazarus, Naomi, 19 Lebedeva, Maria, 3 Lee, Cameron, 1, 2 Lee, Jay, I, 20 Leet, Carl, 19 Lein, James, I, 1 Lehnert, Matthew, 8 Li, Chunhua, 1, 10 Lin, Huiyu, 20 Lin, Weiying, 9 Liu, Pengfei, 15 Loftus, Timothy, 15 Lombard, John, 15 Lopez, Christina, 3, 7 Lu, Chengpeng, 11 Lu, Jia, 1 Lu, Kang Shou, 15 Lupo, Anthony, 3 Lust, Kristin, 13 Lyu, Kewen, 3 Mapes, Jennifer, 12 Maraffa, Tom, 17 Mathews, Adam, 8 McDonald, Jill, 16 Moran, Peyton, 14
Newberry, Jay, I, 19 Norris, Darrell, 15, 20 Odubiyi, Funmilayo, 10 Ogunwale, Ahmed, 10 Ong, Emmanuel, 13 Pallares-Barbera, Montserrat, 3,
14 Penn, Jim, 18 Penna, Giovanni, 3 Pennington, Anthony, 3 Pèrez, Àngels, 11 Persons, Greg, 9 Pomeroy, George, 7 Ponstingel, John, 1, 3 Post, Chris, 11 Portela, Ryan, 17 Portillo, Ethan, 16 Ratcliffe, Michael, I, 6, 12, 14 Reed, Ian, 9 Reid, Neil, 8 Ren, Han, 8 Rhode, Mark, 10 Rice, Murray, I, 1, 6 Rice, William, 18 Romig, Kevin, 20 Rudra, Ayan, 15 Saku, James, 8 Sheeler, Deborah, 12, 13 Sheridan, Scott, 2, 3 Sherief, Youssef, 18 Shon, Yoo Jin, 3 Sikoryak, Alexa, 5 Siong, Kuo, 9 Sitler, Lynn, 5 Smith, Erik, 3 Snyder, Emily, 9 Solvev, Alexandr, 4 Song, Wei, I, 6, 11

83
PRESENTER INDEX
Sperry, Dana, 19 Stackpole, Dylan, 5 Stiller, Matthew, 2 Stocks, Lee, Jr., 11 Strrickland, Brian, 9 Szijarto, Bethany, 3 Taxman, Faye, 6 Taylor, Jacob, 14 Tennis, Dillon, 14 Tettey-Fio, Eugene, 18 Thakur, Rajiv, 2, 7 Thakur, Sudhir, 2, 7 Thompson, Raymond, 16, 17 Tian, Junfeng, 14 Tiwari, Chetan, 16, 17 Tokosh, Joseph, 6 Tolbert, Frank, 5 Tsikalas, Stephen, 4 Tyner, James, 10 Vera, Ana, 11, 14 Vogt, Brandon, I, 9 Waldron, Brian, 15 Walters, Justin, 13 Wang, Binyan, 14
Wang, Cuizhen (Susan), 9 Wang, Fahui, 20 Wang, Ran, 8 Wang, Shijun, 14 Wang, Wengang, 3 Wang, Zheye, 7 Weaver, Russell, 15 Whitesides, Clayton, I, 15, 16 Wikle, Thomas, 3, 18 Williams, Abiye, 15 Willis, Ethan, 14 Wisdom, Jesse, 6 Xian, Huali, 14 Xie, Yichun, 2 Xu, Yanqing, 18 Yarborough, Barbara, 5 Zanoni, Jennifer, 12 Zhang, Jingjing, 8 Zhang, Xueliang, 2 Zhang, Zoey, 11 Zhu, Haojie, 20 Zhu, Lianqi, 8 Zhu, Wenbo, 8

84
PRESENTER INDEX


![Program · Mecklenburg County Park and Recreation . iv 42ND ANNUAL APPLIED GEOGRAPHY CONFERENCE ... GROUND TRUTH MULTI-SCALAR GENTRIFICATION [WORKSHOP] Spirit ... Tennessee Drinking](https://img.dokumen.tips/doc/110x75/5f7529513d7d4e545f433f29/mecklenburg-county-park-and-recreation-iv-42nd-annual-applied-geography-conference.jpg)