Embed Size (px)
Citation preview
1© Andy Grieve
Applied Bayesian Approaches in
Safety and Pharmacovigilance
Professor Andy Grieve
Department of Public Health Sciences
King‟s College, London
delete these guides from slide master before printing or giving to the client
delete these guides from slide master before printing or giving to the client
2© Andy Grieve
Outline
Safety is an issue in all phases
We (statisticians) have concentrated on efficacy
There are numerous applications of statistical
thinking to safety
Safety in a single clinical trial
Pharmacovigilance
delete these guides from slide master before printing or giving to the client
delete these guides from slide master before printing or giving to the client
3© Andy Grieve
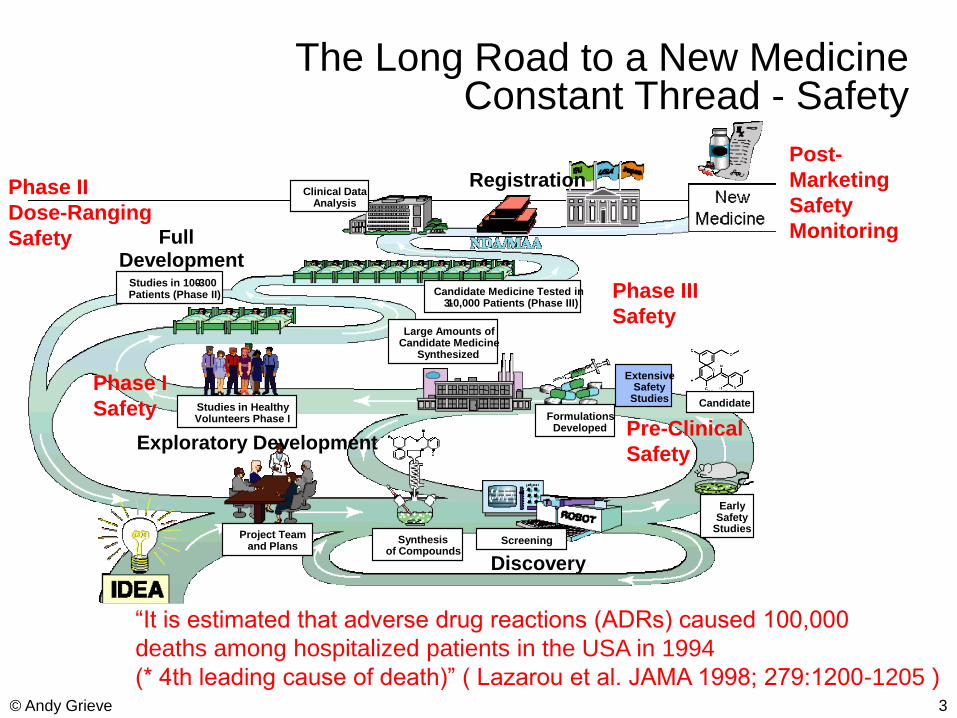
The Long Road to a New MedicineConstant Thread - Safety
Discovery
Exploratory Development
Full Development
Registration
Large Amounts ofCandidate Medicine
Synthesized
Project Teamand Plans
Synthesisof Compounds
EarlySafety
Studies
Candidate
FormulationsDeveloped
ExtensiveSafety
Studies
Screening
Studies in HealthyVolunteers Phase I
Candidate Medicine Tested in3-10,000 Patients (Phase III)
Studies in 100-300Patients (Phase II)
Clinical DataAnalysis
Pre-Clinical
Safety
Phase I
Safety
Phase II
Dose-Ranging
Safety
Phase III
Safety
Post-
Marketing
Safety
Monitoring
“It is estimated that adverse drug reactions (ADRs) caused 100,000
deaths among hospitalized patients in the USA in 1994
(* 4th leading cause of death)” ( Lazarou et al. JAMA 1998; 279:1200-1205 )
delete these guides from slide master before printing or giving to the client
delete these guides from slide master before printing or giving to the client
4© Andy Grieve
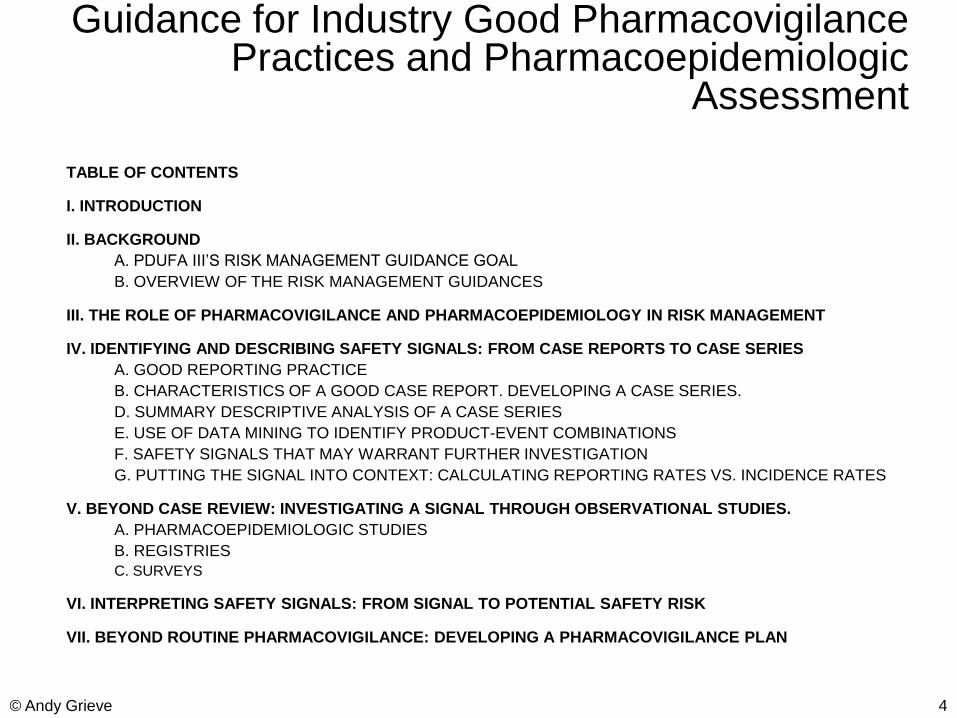
Guidance for Industry Good PharmacovigilancePractices and Pharmacoepidemiologic
Assessment
TABLE OF CONTENTS
I. INTRODUCTION
II. BACKGROUND
A. PDUFA III‟S RISK MANAGEMENT GUIDANCE GOAL
B. OVERVIEW OF THE RISK MANAGEMENT GUIDANCES
III. THE ROLE OF PHARMACOVIGILANCE AND PHARMACOEPIDEMIOLOGY IN RISK MANAGEMENT
IV. IDENTIFYING AND DESCRIBING SAFETY SIGNALS: FROM CASE REPORTS TO CASE SERIES
A. GOOD REPORTING PRACTICE
B. CHARACTERISTICS OF A GOOD CASE REPORT. DEVELOPING A CASE SERIES.
D. SUMMARY DESCRIPTIVE ANALYSIS OF A CASE SERIES
E. USE OF DATA MINING TO IDENTIFY PRODUCT-EVENT COMBINATIONS
F. SAFETY SIGNALS THAT MAY WARRANT FURTHER INVESTIGATION
G. PUTTING THE SIGNAL INTO CONTEXT: CALCULATING REPORTING RATES VS. INCIDENCE RATES
V. BEYOND CASE REVIEW: INVESTIGATING A SIGNAL THROUGH OBSERVATIONAL STUDIES.
A. PHARMACOEPIDEMIOLOGIC STUDIES
B. REGISTRIES
C. SURVEYS
VI. INTERPRETING SAFETY SIGNALS: FROM SIGNAL TO POTENTIAL SAFETY RISK
VII. BEYOND ROUTINE PHARMACOVIGILANCE: DEVELOPING A PHARMACOVIGILANCE PLAN
delete these guides from slide master before printing or giving to the client
delete these guides from slide master before printing or giving to the client
5© Andy Grieve
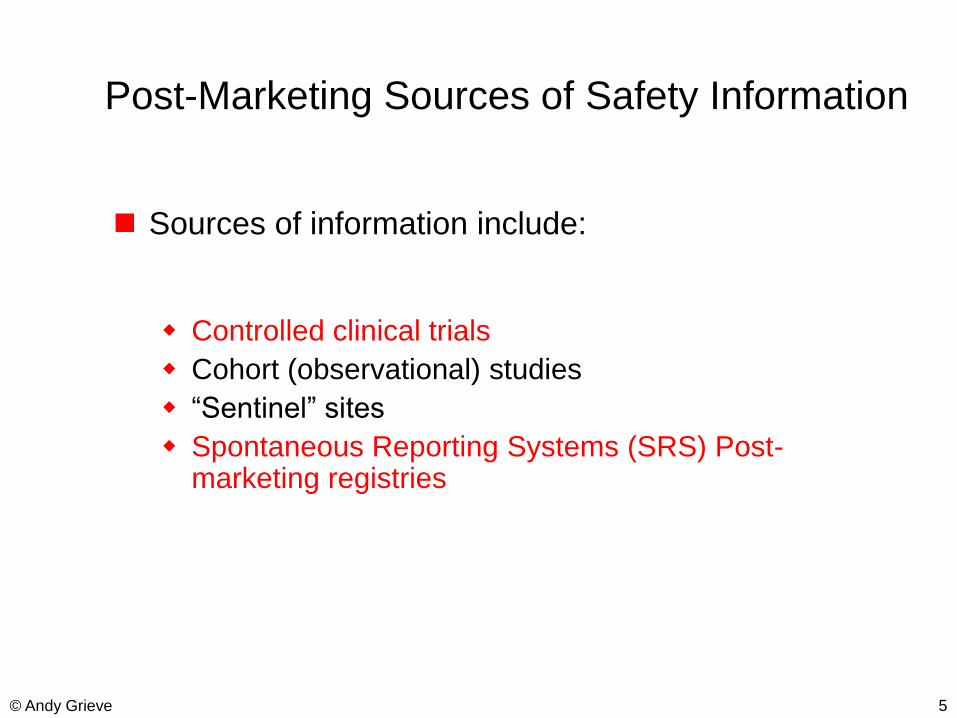
Post-Marketing Sources of Safety Information
Sources of information include:
Controlled clinical trials
Cohort (observational) studies
“Sentinel” sites
Spontaneous Reporting Systems (SRS) Post-marketing registries
delete these guides from slide master before printing or giving to the client
delete these guides from slide master before printing or giving to the client
6© Andy Grieve
Safety Analysis of Data from Controlled Clinical Trials
delete these guides from slide master before printing or giving to the client
delete these guides from slide master before printing or giving to the client
7© Andy Grieve
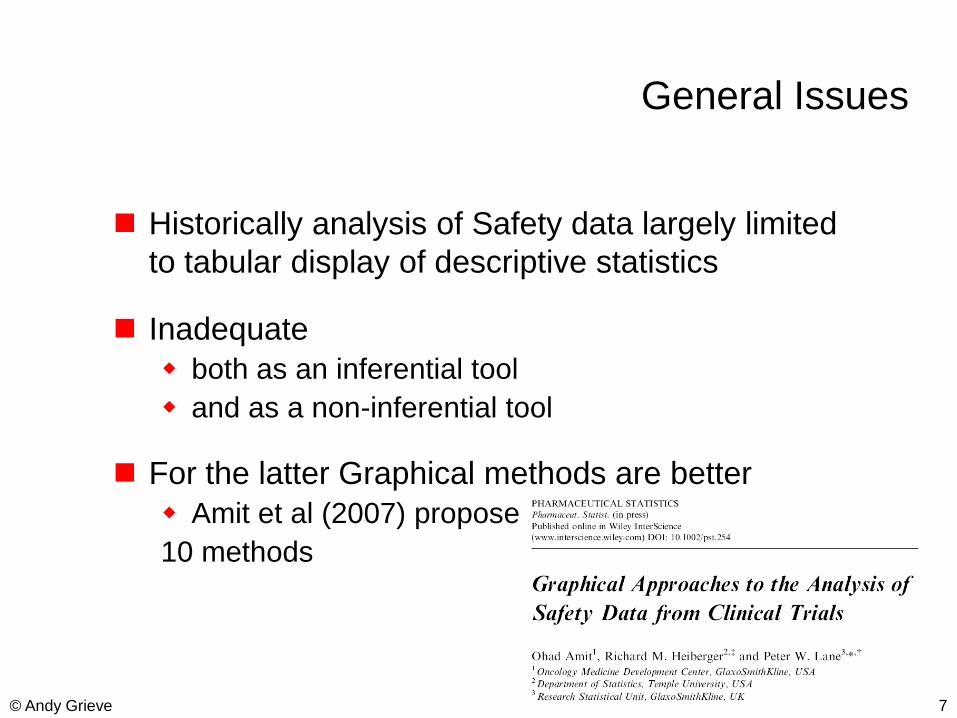
General Issues
Historically analysis of Safety data largely limited
to tabular display of descriptive statistics
Inadequate
both as an inferential tool
and as a non-inferential tool
For the latter Graphical methods are better
Amit et al (2007) propose
10 methods
delete these guides from slide master before printing or giving to the client
delete these guides from slide master before printing or giving to the client
8© Andy Grieve
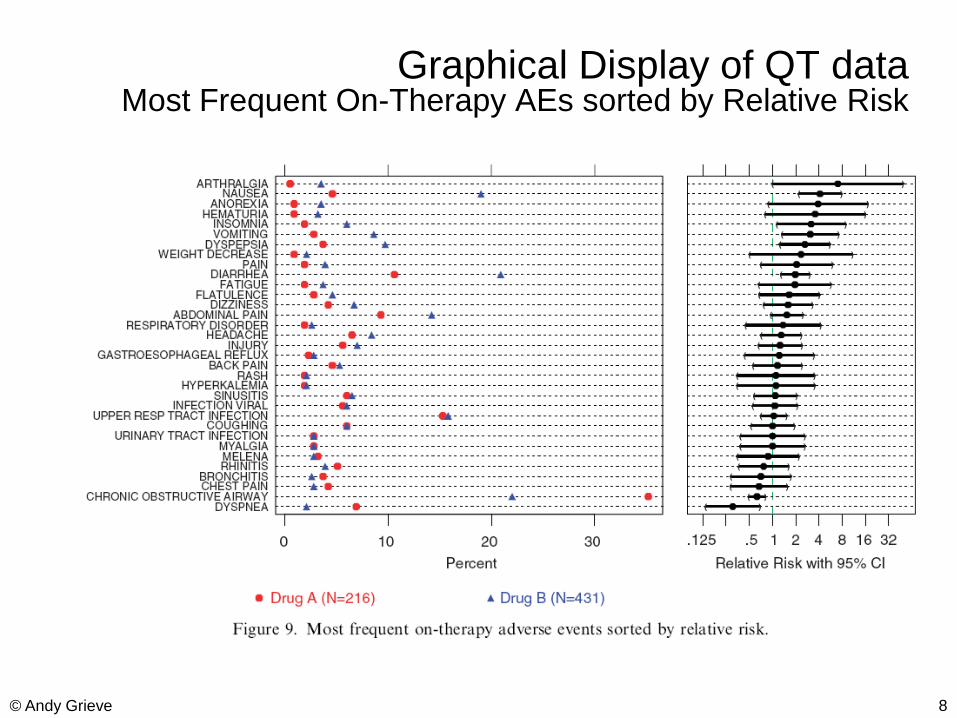
Graphical Display of QT dataMost Frequent On-Therapy AEs sorted by Relative Risk
delete these guides from slide master before printing or giving to the client
delete these guides from slide master before printing or giving to the client
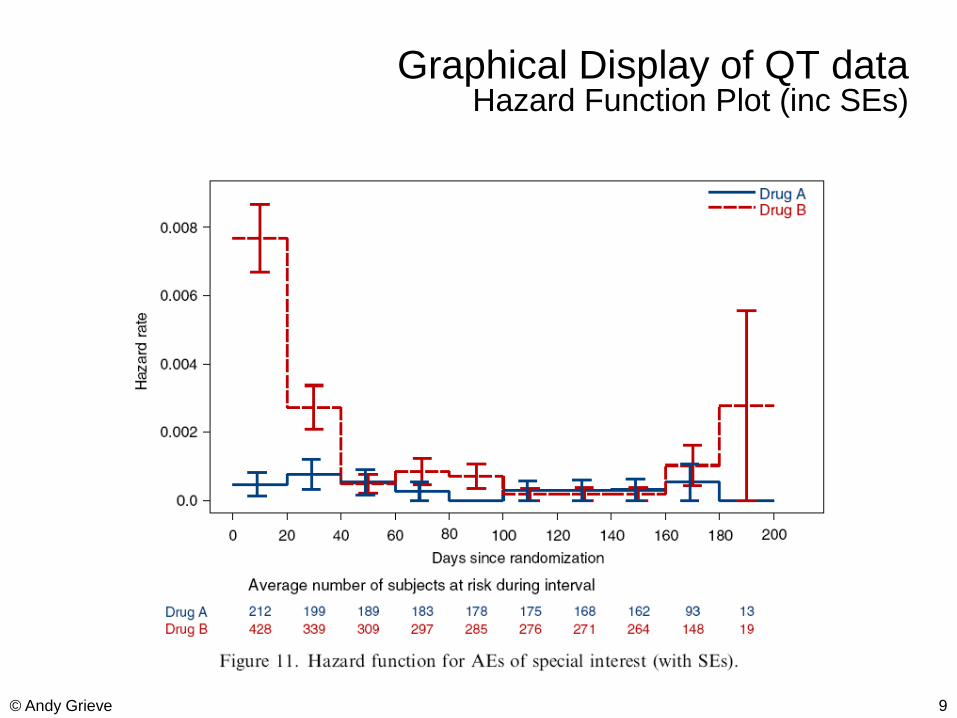
9© Andy Grieve
Graphical Display of QT dataHazard Function Plot (inc SEs)
delete these guides from slide master before printing or giving to the client
delete these guides from slide master before printing or giving to the client
10© Andy Grieve
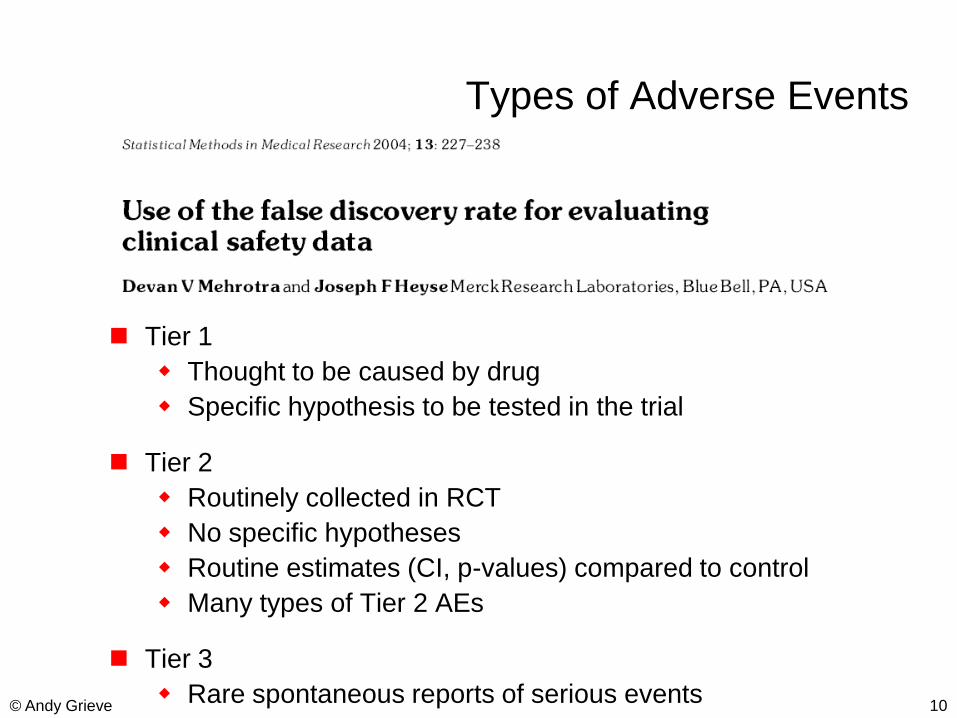
Types of Adverse Events
Tier 1
Thought to be caused by drug
Specific hypothesis to be tested in the trial
Tier 2
Routinely collected in RCT
No specific hypotheses
Routine estimates (CI, p-values) compared to control
Many types of Tier 2 AEs
Tier 3
Rare spontaneous reports of serious events
delete these guides from slide master before printing or giving to the client
delete these guides from slide master before printing or giving to the client
11© Andy Grieve
George Chi, H.M. James Hung,Bob O‟Neill (FDA CDER)
“Safety assessment is one area where
frequentist strategies have been less applicable.
Perhaps Bayesian approaches in this area have
more promise.” (Pharmaceutical Report, 2002)
delete these guides from slide master before printing or giving to the client
delete these guides from slide master before printing or giving to the client
12© Andy Grieve
Bayesian Analysis of Safety Data from Clinical Studies
Scott Berry and Don Berry (2004)Accounting for Uncertainties in Assessing Drug Safety:
A Three-Level Hierarchical ModelBiometrics, 60, 418-426.
delete these guides from slide master before printing or giving to the client
delete these guides from slide master before printing or giving to the client
13© Andy Grieve
“Tier 2” safety dataExample (Mehrotra & Heyse)
Vaccine trial
Quadrivalent vaccine containing measles, mumps, rubellA and varicella (MMRV)
296 healthy young children (12-18 months)
Treatment : MMRV Day 0
Control : MMR Day 0 , V Day 42
Comparison : between AE‟s Days 0-42 Control
AE‟s Days 42-84 Treatment
40 AEs within 8 body systems
Which to flag?
delete these guides from slide master before printing or giving to the client
delete these guides from slide master before printing or giving to the client
14© Andy Grieve
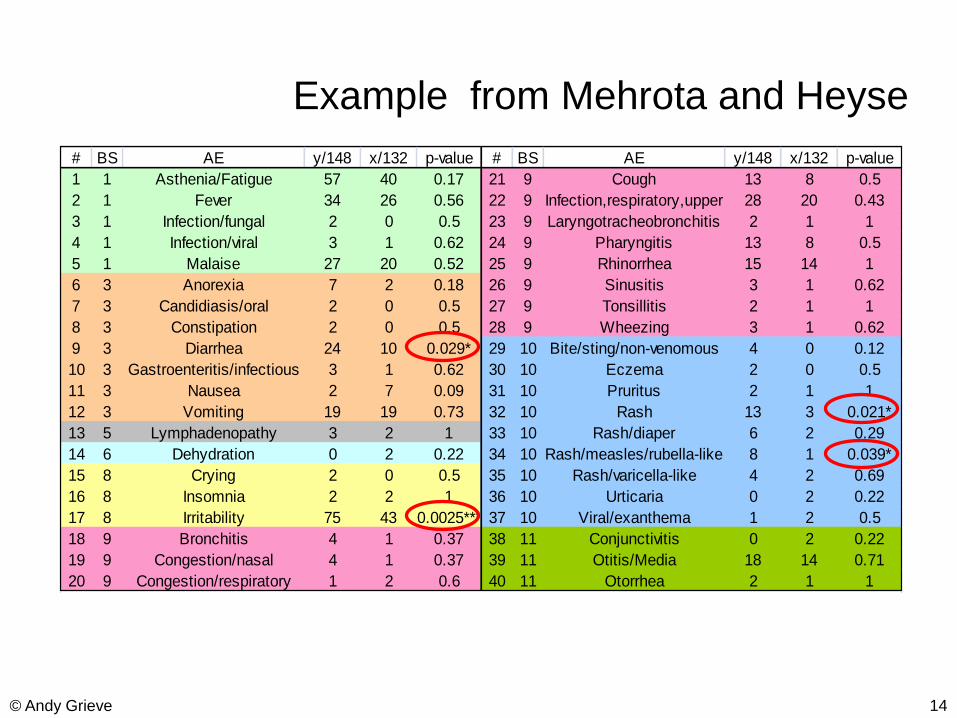
# BS AE y/148 x/132 p-value # BS AE y/148 x/132 p-value
1 1 Asthenia/Fatigue 57 40 0.17 21 9 Cough 13 8 0.5
2 1 Fever 34 26 0.56 22 9 Infection,respiratory,upper 28 20 0.43
3 1 Infection/fungal 2 0 0.5 23 9 Laryngotracheobronchitis 2 1 1
4 1 Infection/viral 3 1 0.62 24 9 Pharyngitis 13 8 0.5
5 1 Malaise 27 20 0.52 25 9 Rhinorrhea 15 14 1
6 3 Anorexia 7 2 0.18 26 9 Sinusitis 3 1 0.62
7 3 Candidiasis/oral 2 0 0.5 27 9 Tonsillitis 2 1 1
8 3 Constipation 2 0 0.5 28 9 Wheezing 3 1 0.62
9 3 Diarrhea 24 10 0.029* 29 10 Bite/sting/non-venomous 4 0 0.12
10 3 Gastroenteritis/infectious 3 1 0.62 30 10 Eczema 2 0 0.5
11 3 Nausea 2 7 0.09 31 10 Pruritus 2 1 1
12 3 Vomiting 19 19 0.73 32 10 Rash 13 3 0.021*
13 5 Lymphadenopathy 3 2 1 33 10 Rash/diaper 6 2 0.29
14 6 Dehydration 0 2 0.22 34 10 Rash/measles/rubella-like 8 1 0.039*
15 8 Crying 2 0 0.5 35 10 Rash/varicella-like 4 2 0.69
16 8 Insomnia 2 2 1 36 10 Urticaria 0 2 0.22
17 8 Irritability 75 43 0.0025*** 37 10 Viral/exanthema 1 2 0.5
18 9 Bronchitis 4 1 0.37 38 11 Conjunctivitis 0 2 0.22
19 9 Congestion/nasal 4 1 0.37 39 11 Otitis/Media 18 14 0.71
20 9 Congestion/respiratory 1 2 0.6 40 11 Otorrhea 2 1 1
Example from Mehrota and Heyse
delete these guides from slide master before printing or giving to the client
delete these guides from slide master before printing or giving to the client
15© Andy Grieve
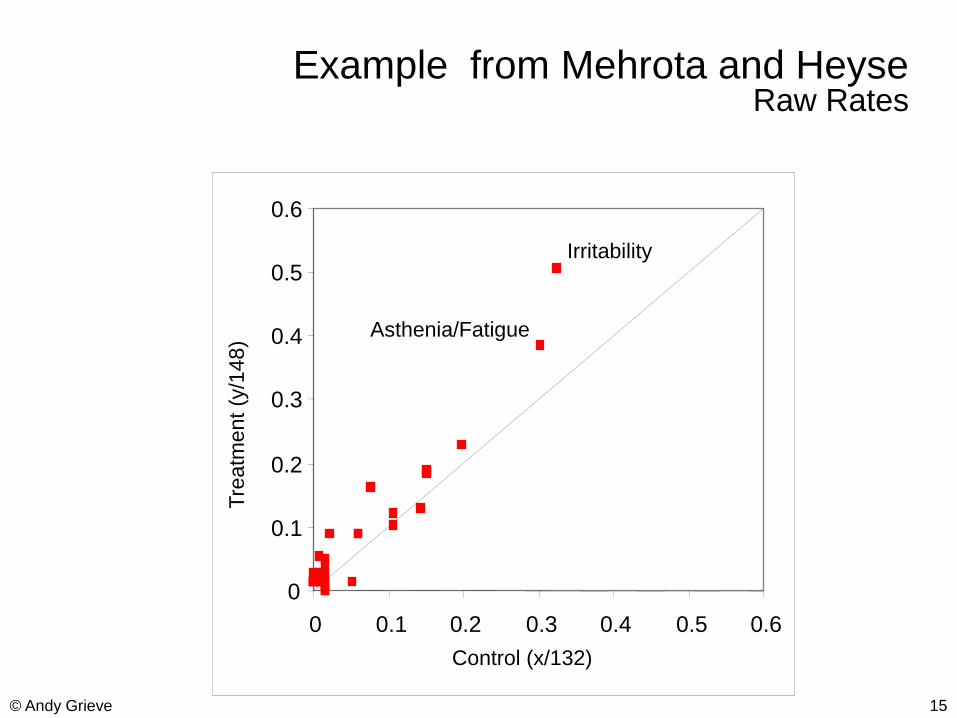
Example from Mehrota and HeyseRaw Rates
Irritability
0
0.1
0.2
0.3
0.4
0.5
0.6
0 0.1 0.2 0.3 0.4 0.5 0.6
Tre
atm
ent
(y/1
48)
Control (x/132)
Asthenia/Fatigue
delete these guides from slide master before printing or giving to the client
delete these guides from slide master before printing or giving to the client
16© Andy Grieve
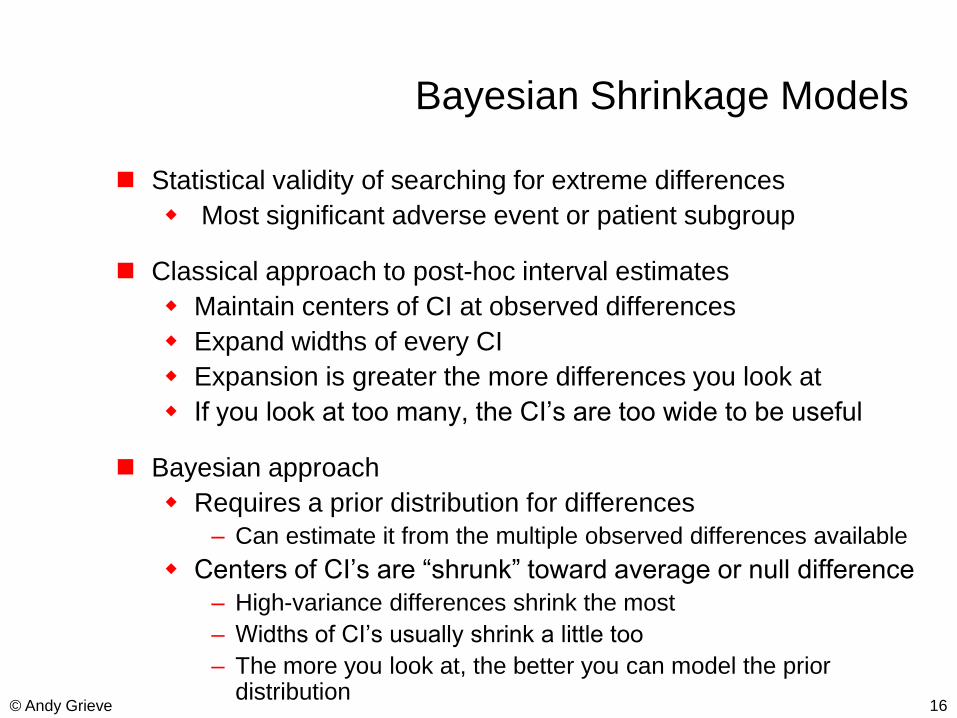
Bayesian Shrinkage Models
Statistical validity of searching for extreme differences
Most significant adverse event or patient subgroup
Classical approach to post-hoc interval estimates
Maintain centers of CI at observed differences
Expand widths of every CI
Expansion is greater the more differences you look at
If you look at too many, the CI‟s are too wide to be useful
Bayesian approach
Requires a prior distribution for differences
– Can estimate it from the multiple observed differences available
Centers of CI‟s are “shrunk” toward average or null difference
– High-variance differences shrink the most
– Widths of CI‟s usually shrink a little too
– The more you look at, the better you can model the prior distribution
delete these guides from slide master before printing or giving to the client
delete these guides from slide master before printing or giving to the client
17© Andy Grieve
Levels of Experimental Units
Body systems
Adverse effects within body system
Patient (depending on treatment)
3-way hierarchical model
delete these guides from slide master before printing or giving to the client
delete these guides from slide master before printing or giving to the client
18© Andy Grieve
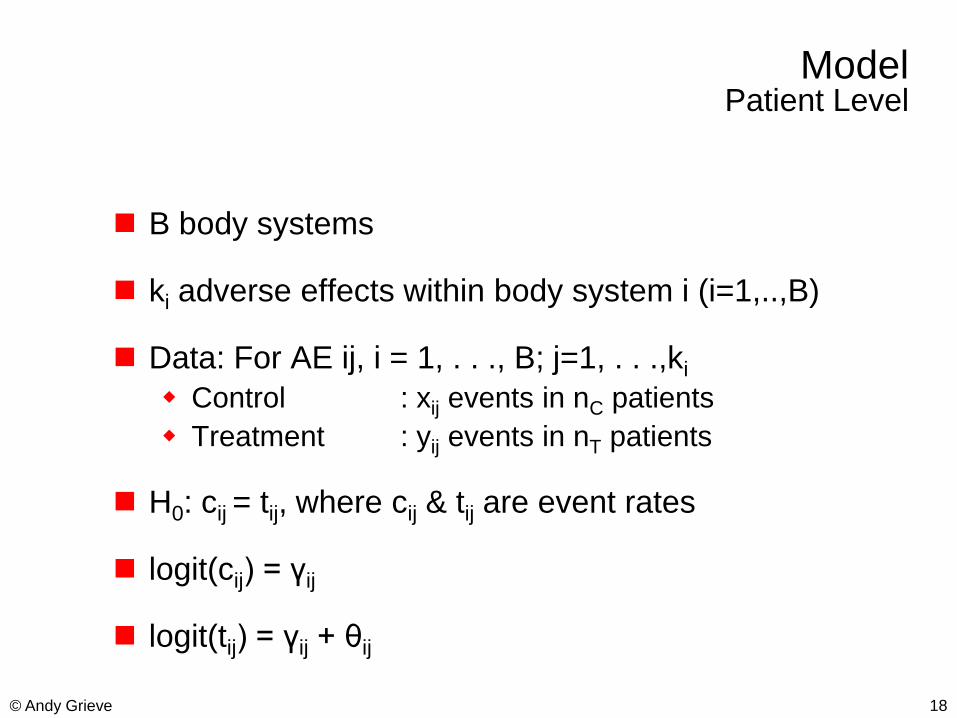
ModelPatient Level
B body systems
ki adverse effects within body system i (i=1,..,B)
Data: For AE ij, i = 1, . . ., B; j=1, . . .,ki
Control : xij events in nC patients
Treatment : yij events in nT patients
H0: cij = tij, where cij & tij are event rates
logit(cij) = γij
logit(tij) = γij + θij
delete these guides from slide master before printing or giving to the client
delete these guides from slide master before printing or giving to the client
19© Andy Grieve
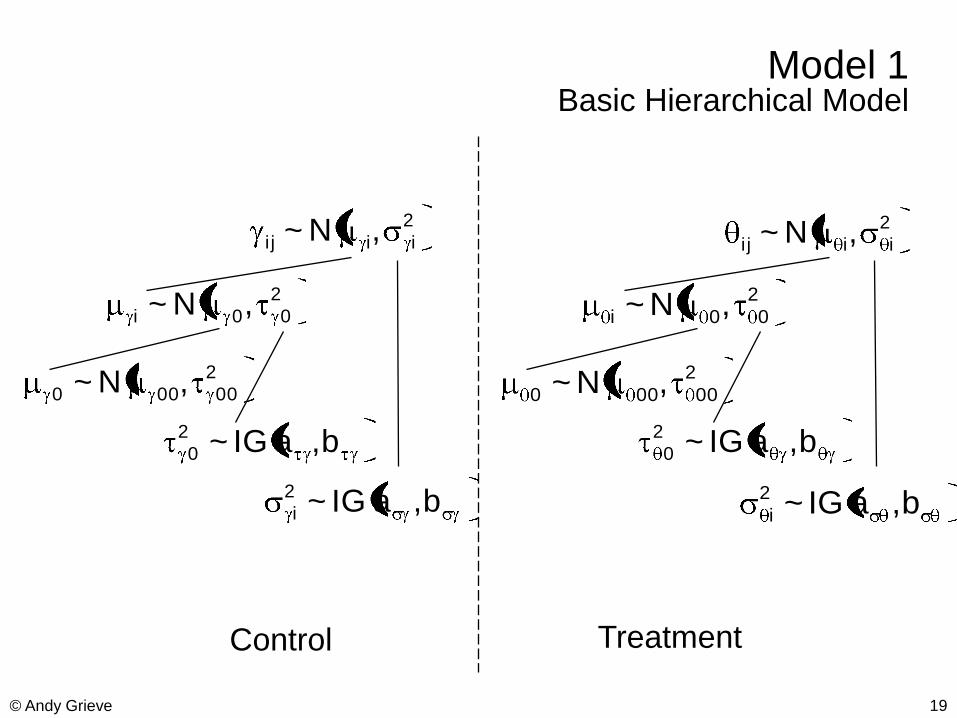
Model 1Basic Hierarchical Model
2
iii j ,N~ 2
iii j ,N~
2
00i ,N~ 2
00i ,N~
2
00000 ,N~ 2
00000 ,N~
b,aIG~2
0 b,aIG~2
0
b,aIG~2
i b,aIG~2
i
Control Treatment
delete these guides from slide master before printing or giving to the client
delete these guides from slide master before printing or giving to the client
20© Andy Grieve
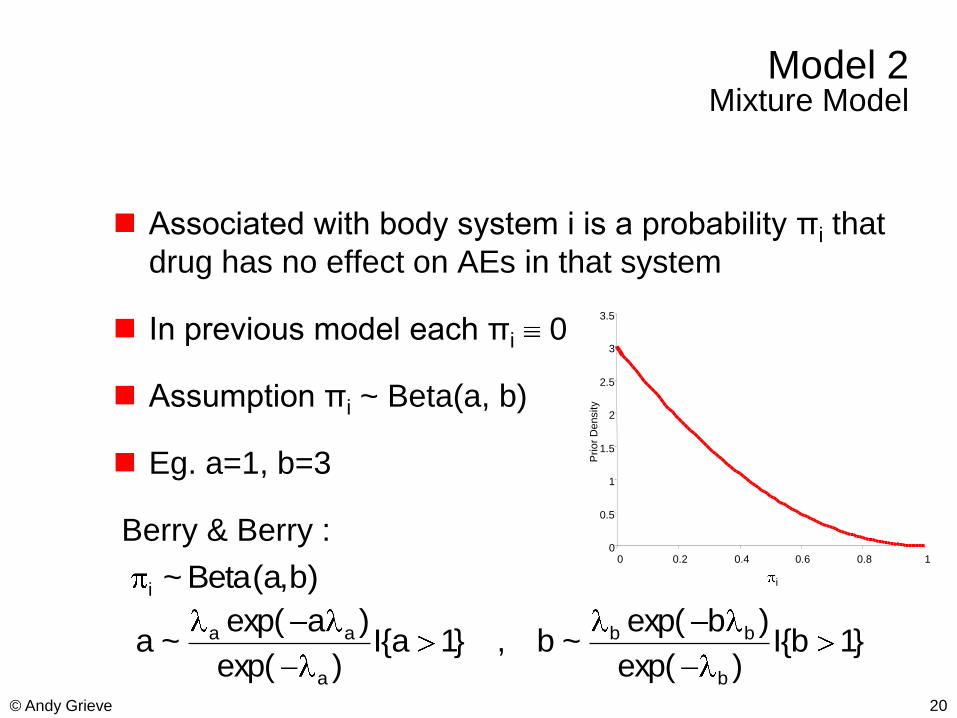
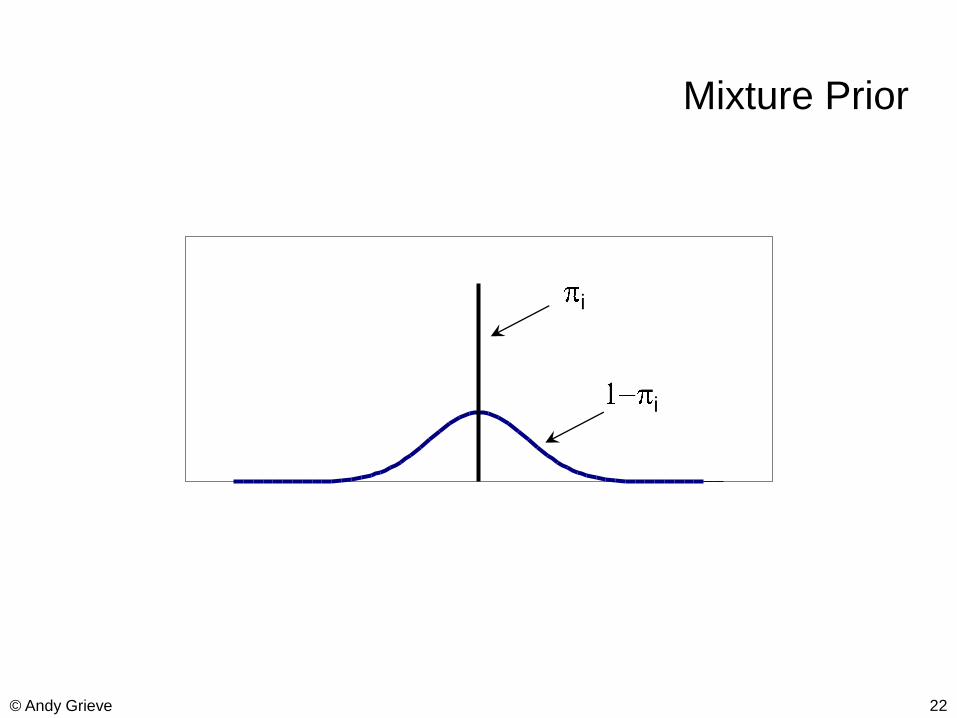
Model 2 Mixture Model
Associated with body system i is a probability πi that
drug has no effect on AEs in that system
In previous model each πi 0
Assumption πi ~ Beta(a, b)
Eg. a=1, b=3
Berry & Berry :0
0.5
1
1.5
2
2.5
3
3.5
0 0.2 0.4 0.6 0.8 1
iP
rio
r D
ensity)b,a(Beta~i
}1b{I)exp(
)bexp(~b,}1a{I
)exp(
)aexp(~a
b
bb
a
aa
delete these guides from slide master before printing or giving to the client
delete these guides from slide master before printing or giving to the client
21© Andy Grieve
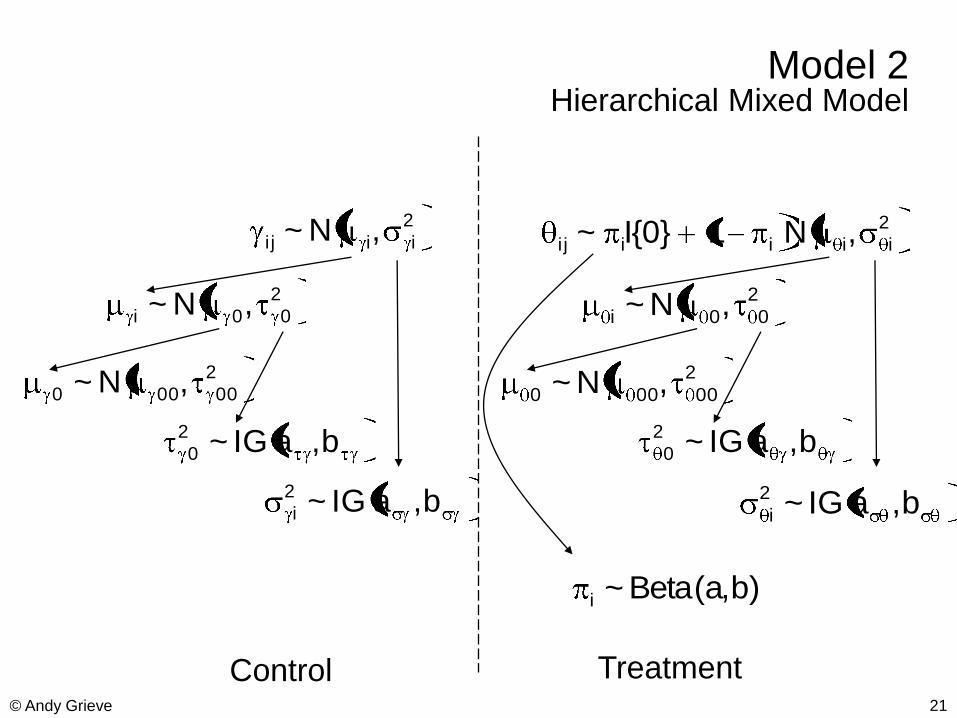
Model 2Hierarchical Mixed Model
2
iii j ,N~ 2
iiiii j ,N1}0{I~
2
00i ,N~ 2
00i ,N~
2
00000 ,N~ 2
00000 ,N~
b,aIG~2
0 b,aIG~2
0
b,aIG~2
i b,aIG~2
i
)b,a(Beta~i
Control Treatment
delete these guides from slide master before printing or giving to the client
delete these guides from slide master before printing or giving to the client
22© Andy Grieve
Mixture Prior
i
i
delete these guides from slide master before printing or giving to the client
delete these guides from slide master before printing or giving to the client
23© Andy Grieve
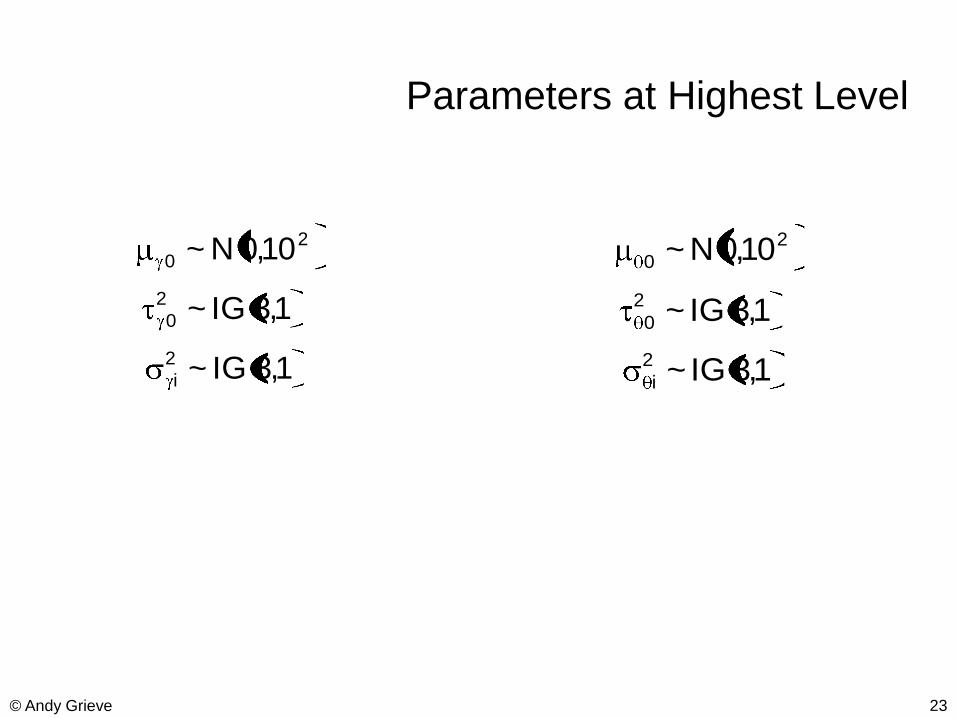
Parameters at Highest Level
2
0 10,0N~ 2
0 10,0N~
1,3IG~2
0 1,3IG~2
0
1,3IG~2
i 1,3IG~2
i
delete these guides from slide master before printing or giving to the client
delete these guides from slide master before printing or giving to the client
24© Andy Grieve
# BS AE y/148 x/132 P1(θ>0)P2(θ=0)P2(θ>0) # BS AE y/148 x/132 P1(θ>0)P2(θ=0)P2(θ>0)
1 1 Asthenia/Fatigue 57 40 0.956 0.56 0.44 21 9 Cough 13 8 0.92 0.97 0.03
2 1 Fever 34 26 0.89 0.77 0.21 22 9 Infection,respiratory,upper 28 20 0.943 0.97 0.03
3 1 Infection/fungal 2 0 0.83 0.84 0.14 23 9 Laryngotracheobronchitis 2 1 0.8 0.99 0
4 1 Infection/viral 3 1 0.84 0.83 0.15 24 9 Pharyngitis 13 8 0.91 0.98 0.02
5 1 Malaise 27 20 0.89 0.75 0.23 25 9 Rhinorrhea 15 14 0.83 0.99 0.01
6 3 Anorexia 7 2 0.9 0.88 0.11 26 9 Sinusitis 3 1 0.84 0.99 0
7 3 Candidiasis/oral 2 0 0.79 0.95 0.04 27 9 Tonsillitis 2 1 0.81 0.99 0
8 3 Constipation 2 0 0.78 0.96 0.03 28 9 Wheezing 3 1 0.84 0.99 0
9 3 Diarrhea 24 10 0.987 0.48 0.52 29 10 Bite/sting/non-venomous 4 0 0.93 0.9 0.1
10 3Gastroenteritis/infectious 3 1 0.79 0.94 0.04 30 10 Eczema 2 0 0.84 0.96 0.04
11 3 Nausea 2 7 0.46 0.94 0.01 31 10 Pruritus 2 1 0.82 0.97 0.03
12 3 Vomiting 19 19 0.7 0.94 0.04 32 10 Rash 13 3 0.997 0.42 0.58
13 5 Lymphadenopathy 3 2 0.77 0.59 0.24 33 10 Rash/diaper 6 2 0.946 0.88 0.12
14 6 Dehydration 0 2 0.51 0.56 0.11 34 10 Rash/measles/rubella-like 8 1 0.976 0.67 0.33
15 8 Crying 2 0 0.86 0.58 0.34 35 10 Rash/varicella-like 4 2 0.87 0.93 0.07
16 8 Insomnia 2 2 0.8 0.63 0.24 36 10 Urticaria 0 2 0.62 0.97 0.01
17 8 Irritability 75 43 0.999 0.02 0.981 37 10 Viral/exanthema 1 2 0.71 0.97 0.02
18 9 Bronchitis 4 1 0.86 0.99 0.01 38 11 Conjunctivitis 0 2 0.5 0.78 0.05
19 9 Congestion/nasal 4 2 0.86 0.99 0 39 11 Otitis/Media 18 14 0.82 0.73 0.23
20 9 Congestion/respiratory 1 2 0.73 0.99 0 40 11 Otorrhea 2 1 0.71 0.8 0.1
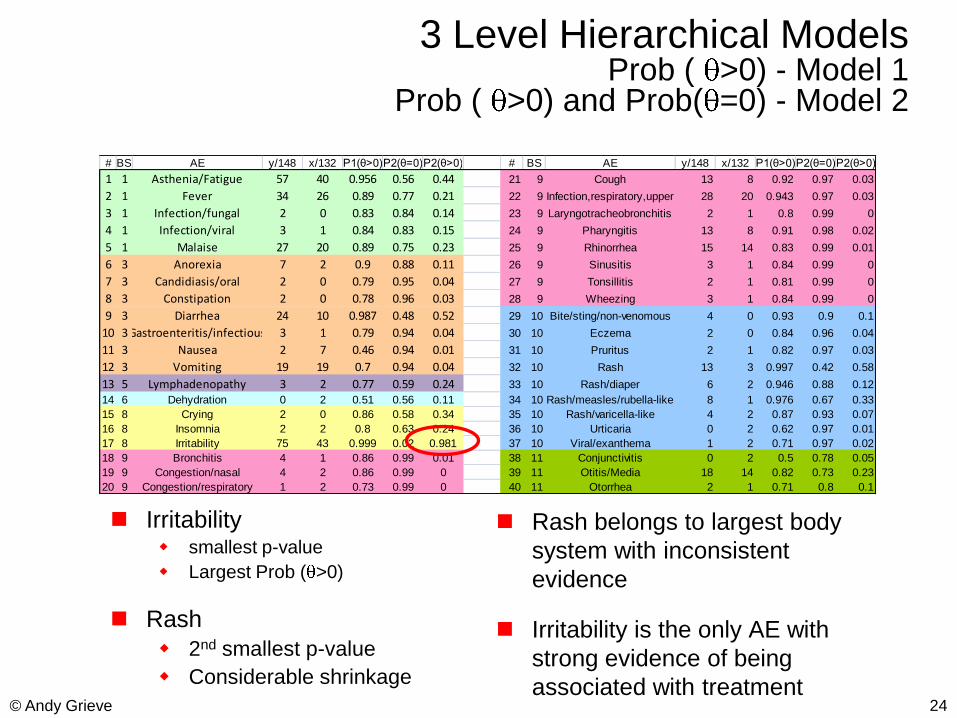
3 Level Hierarchical ModelsProb ( >0) - Model 1
Prob ( >0) and Prob( =0) - Model 2
Rash belongs to largest body
system with inconsistent
evidence
Irritability is the only AE with
strong evidence of being
associated with treatment
Irritability smallest p-value
Largest Prob ( >0)
Rash
2nd smallest p-value
Considerable shrinkage
delete these guides from slide master before printing or giving to the client
delete these guides from slide master before printing or giving to the client
25© Andy Grieve
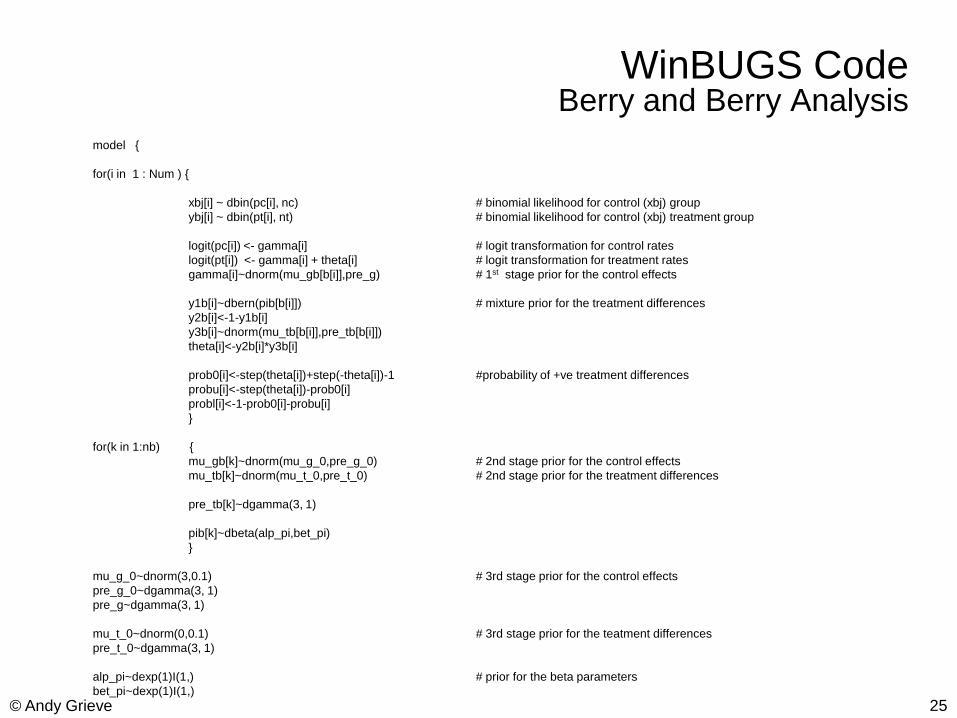
WinBUGS Code Berry and Berry Analysis
model {
for(i in 1 : Num ) {
xbj[i] ~ dbin(pc[i], nc) # binomial likelihood for control (xbj) group
ybj[i] ~ dbin(pt[i], nt) # binomial likelihood for control (xbj) treatment group
logit(pc[i]) <- gamma[i] # logit transformation for control rates
logit(pt[i]) <- gamma[i] + theta[i] # logit transformation for treatment rates
gamma[i]~dnorm(mu_gb[b[i]],pre_g) # 1st stage prior for the control effects
y1b[i]~dbern(pib[b[i]]) # mixture prior for the treatment differences
y2b[i]<-1-y1b[i]
y3b[i]~dnorm(mu_tb[b[i]],pre_tb[b[i]])
theta[i]<-y2b[i]*y3b[i]
prob0[i]<-step(theta[i])+step(-theta[i])-1 #probability of +ve treatment differences
probu[i]<-step(theta[i])-prob0[i]
probl[i]<-1-prob0[i]-probu[i]
}
for(k in 1:nb) {
mu_gb[k]~dnorm(mu_g_0,pre_g_0) # 2nd stage prior for the control effects
mu_tb[k]~dnorm(mu_t_0,pre_t_0) # 2nd stage prior for the treatment differences
pre_tb[k]~dgamma(3, 1)
pib[k]~dbeta(alp_pi,bet_pi)
}
mu_g_0~dnorm(3,0.1) # 3rd stage prior for the control effects
pre_g_0~dgamma(3, 1)
pre_g~dgamma(3, 1)
mu_t_0~dnorm(0,0.1) # 3rd stage prior for the teatment differences
pre_t_0~dgamma(3, 1)
alp_pi~dexp(1)I(1,) # prior for the beta parameters
bet_pi~dexp(1)I(1,)
delete these guides from slide master before printing or giving to the client
delete these guides from slide master before printing or giving to the client
26© Andy Grieve
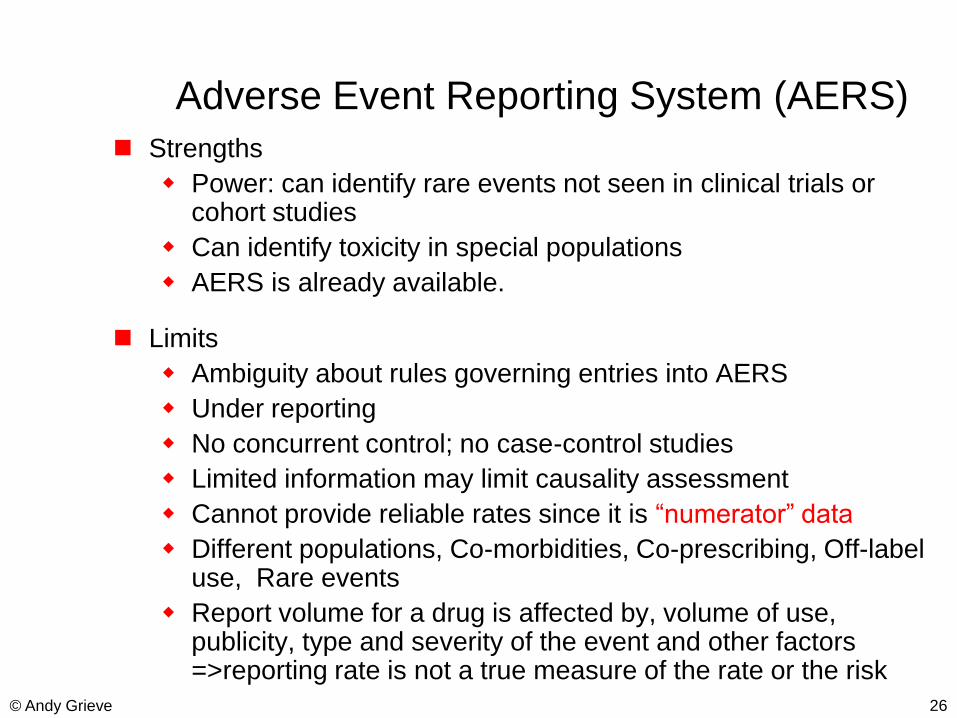
Adverse Event Reporting System (AERS)
Strengths
Power: can identify rare events not seen in clinical trials or cohort studies
Can identify toxicity in special populations
AERS is already available.
Limits
Ambiguity about rules governing entries into AERS
Under reporting
No concurrent control; no case-control studies
Limited information may limit causality assessment
Cannot provide reliable rates since it is “numerator” data
Different populations, Co-morbidities, Co-prescribing, Off-label use, Rare events
Report volume for a drug is affected by, volume of use, publicity, type and severity of the event and other factors =>reporting rate is not a true measure of the rate or the risk
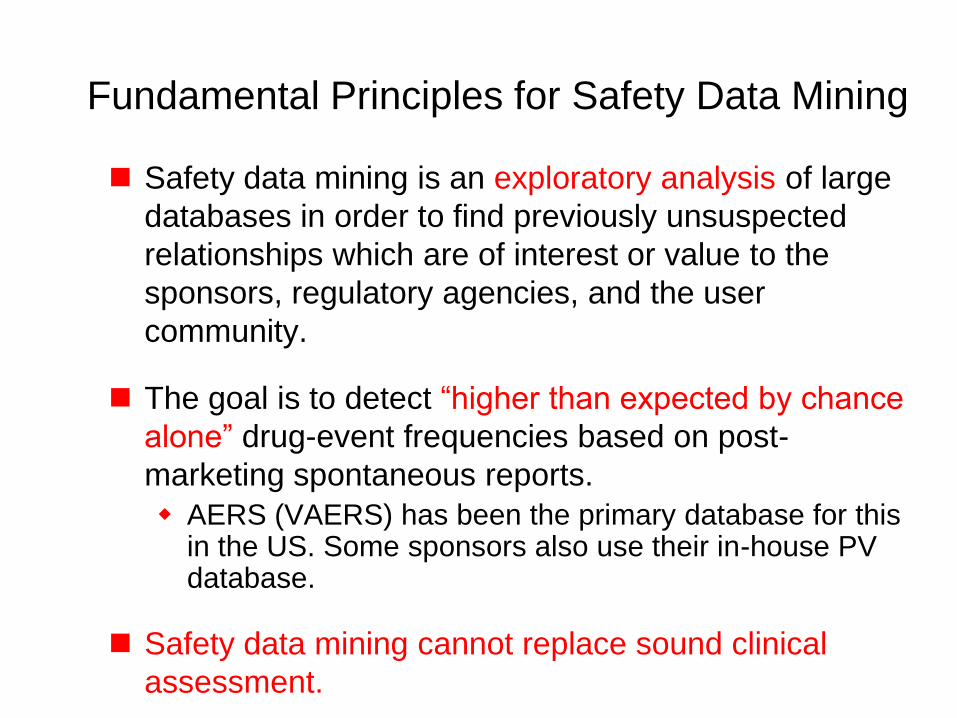
Fundamental Principles for Safety Data Mining
Safety data mining is an exploratory analysis of large
databases in order to find previously unsuspected
relationships which are of interest or value to the
sponsors, regulatory agencies, and the user
community.
The goal is to detect “higher than expected by chance
alone” drug-event frequencies based on post-
marketing spontaneous reports.
AERS (VAERS) has been the primary database for this in the US. Some sponsors also use their in-house PV database.
Safety data mining cannot replace sound clinical
assessment.
delete these guides from slide master before printing or giving to the client
delete these guides from slide master before printing or giving to the client
28© Andy Grieve
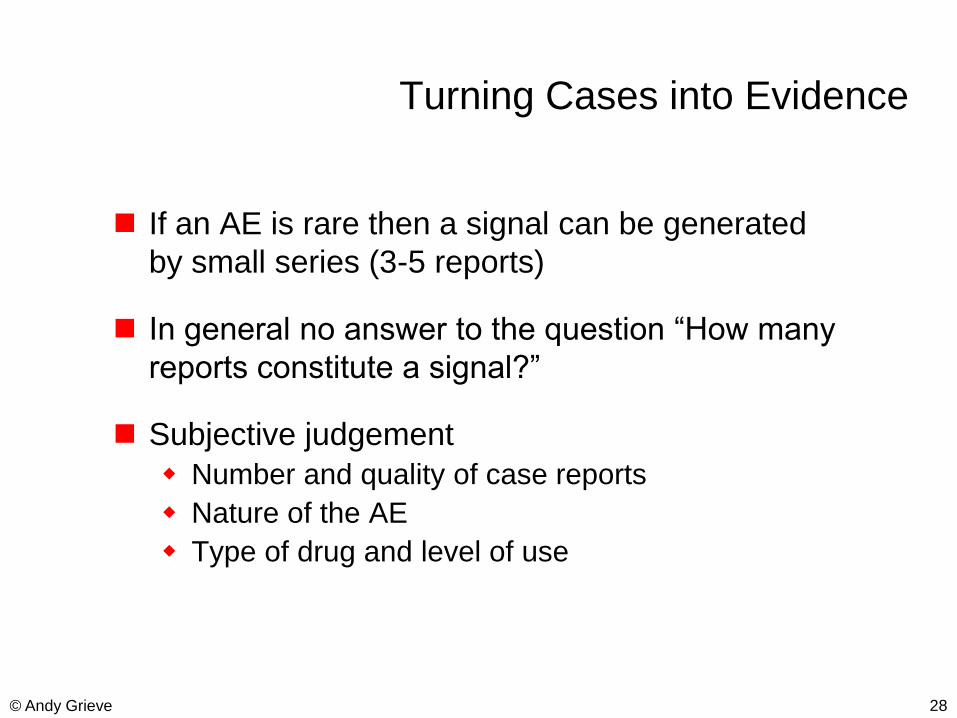
Turning Cases into Evidence
If an AE is rare then a signal can be generated
by small series (3-5 reports)
In general no answer to the question “How many
reports constitute a signal?”
Subjective judgement
Number and quality of case reports
Nature of the AE
Type of drug and level of use
delete these guides from slide master before printing or giving to the client
delete these guides from slide master before printing or giving to the client
29© Andy Grieve
Turning Cases into Evidence
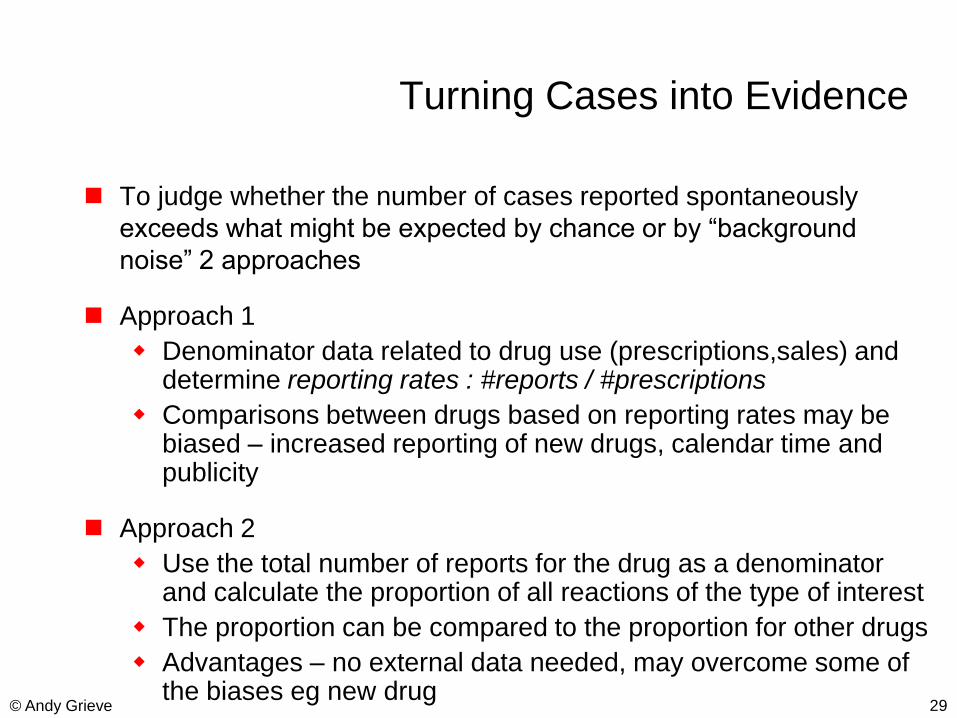
To judge whether the number of cases reported spontaneously
exceeds what might be expected by chance or by “background
noise” 2 approaches
Approach 1
Denominator data related to drug use (prescriptions,sales) and determine reporting rates : #reports / #prescriptions
Comparisons between drugs based on reporting rates may be biased – increased reporting of new drugs, calendar time and publicity
Approach 2
Use the total number of reports for the drug as a denominator and calculate the proportion of all reactions of the type of interest
The proportion can be compared to the proportion for other drugs
Advantages – no external data needed, may overcome some of the biases eg new drug
delete these guides from slide master before printing or giving to the client
delete these guides from slide master before printing or giving to the client
30© Andy Grieve
Disproportionality MeasuresAn Example
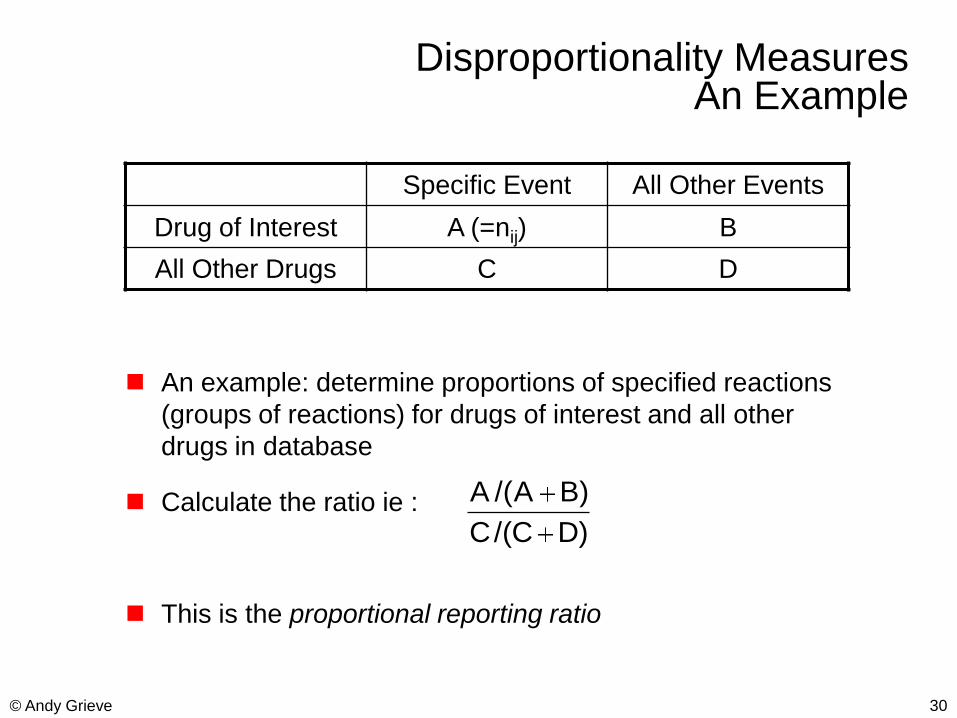
An example: determine proportions of specified reactions
(groups of reactions) for drugs of interest and all other
drugs in database
Calculate the ratio ie :
This is the proportional reporting ratio
Specific Event All Other Events
Drug of Interest A (=nij) B
All Other Drugs C D
)DC/(C
)BA/(A
delete these guides from slide master before printing or giving to the client
delete these guides from slide master before printing or giving to the client
31© Andy Grieve
Disproportionality MeasuresAn Example
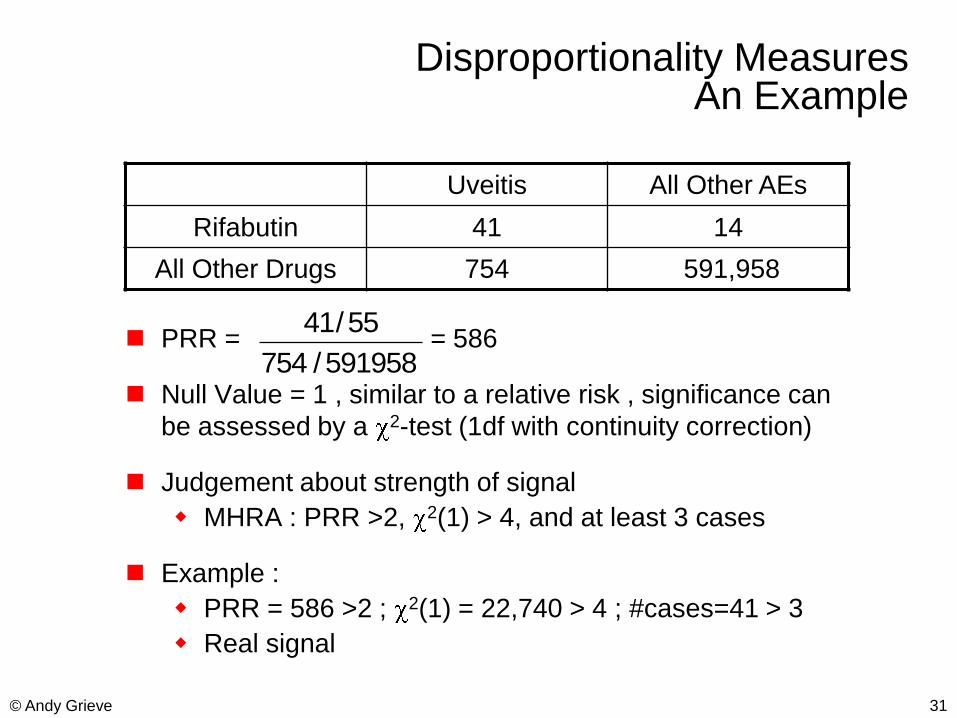
PRR = = 586
Null Value = 1 , similar to a relative risk , significance can
be assessed by a 2-test (1df with continuity correction)
Judgement about strength of signal
MHRA : PRR >2, 2(1) > 4, and at least 3 cases
Example :
PRR = 586 >2 ; 2(1) = 22,740 > 4 ; #cases=41 > 3
Real signal
Uveitis All Other AEs
Rifabutin 41 14
All Other Drugs 754 591,958
591958/754
55/41
delete these guides from slide master before printing or giving to the client
delete these guides from slide master before printing or giving to the client
32© Andy Grieve
Disproportionality Analysis
Although the idea of computing disproportionality measures
(DM) for all or some drug-event combinations is simple, its
widespread use is relatively recent
Computer and database advances enabled ease of use and evaluation
Biostatisticians were uncomfortable with performing formal
analyses on tabulations of spontaneous reports
Unknown reporting mechanism can lead to reporting biases
Frequent noncausal associations with indications and comorbidities
All large values of DM require follow-up for medical validity
Bayesian statistical methods produce “shrinkage” values of DM
Help avoid the “multiple comparisons” fallacy
US FDA, UK MHRA and WHO UMC have each adopted Bayesian disproportionality methods
delete these guides from slide master before printing or giving to the client
delete these guides from slide master before printing or giving to the client
33© Andy Grieve
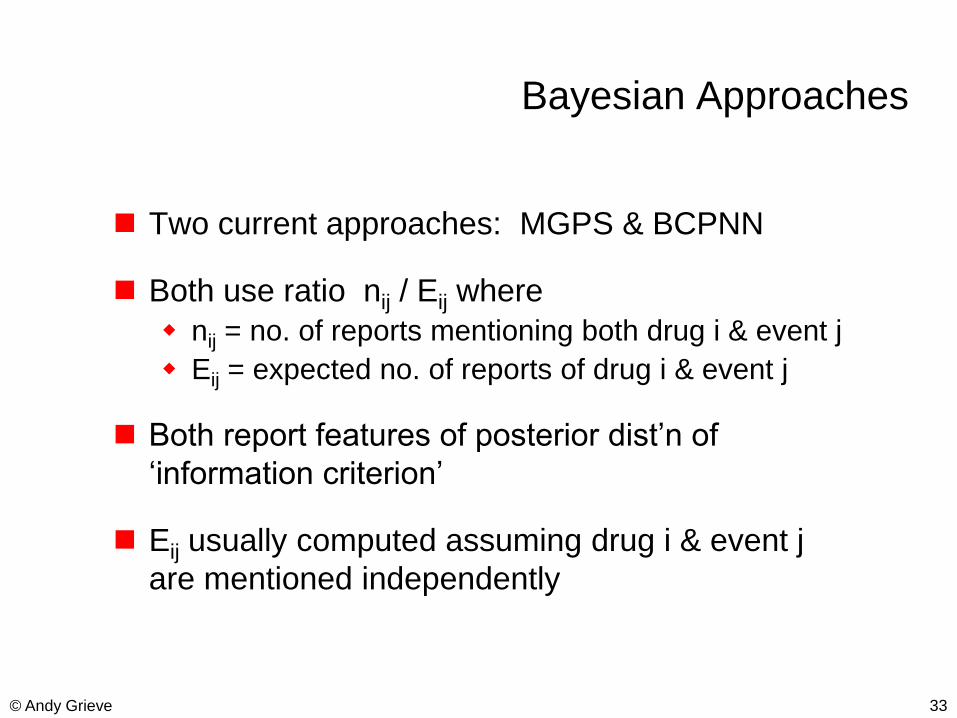
Bayesian Approaches
Two current approaches: MGPS & BCPNN
Both use ratio nij / Eij where
nij = no. of reports mentioning both drug i & event j
Eij = expected no. of reports of drug i & event j
Both report features of posterior dist‟n of
„information criterion‟
Eij usually computed assuming drug i & event j
are mentioned independently
delete these guides from slide master before printing or giving to the client
delete these guides from slide master before printing or giving to the client
34© Andy Grieve
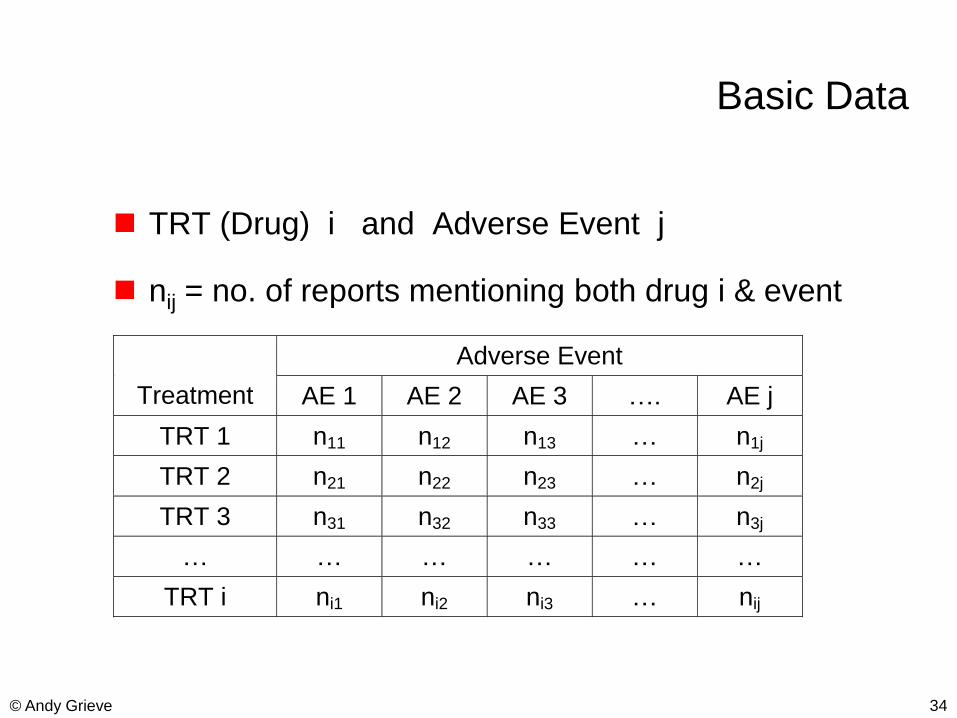
Basic Data
TRT (Drug) i and Adverse Event j
nij = no. of reports mentioning both drug i & event
Adverse Event
Treatment AE 1 AE 2 AE 3 …. AE j
TRT 1 n11 n12 n13 … n1j
TRT 2 n21 n22 n23 … n2j
TRT 3 n31 n32 n33 … n3j
… … … … … …
TRT i ni1 ni2 ni3 … nij
delete these guides from slide master before printing or giving to the client
delete these guides from slide master before printing or giving to the client
35© Andy Grieve
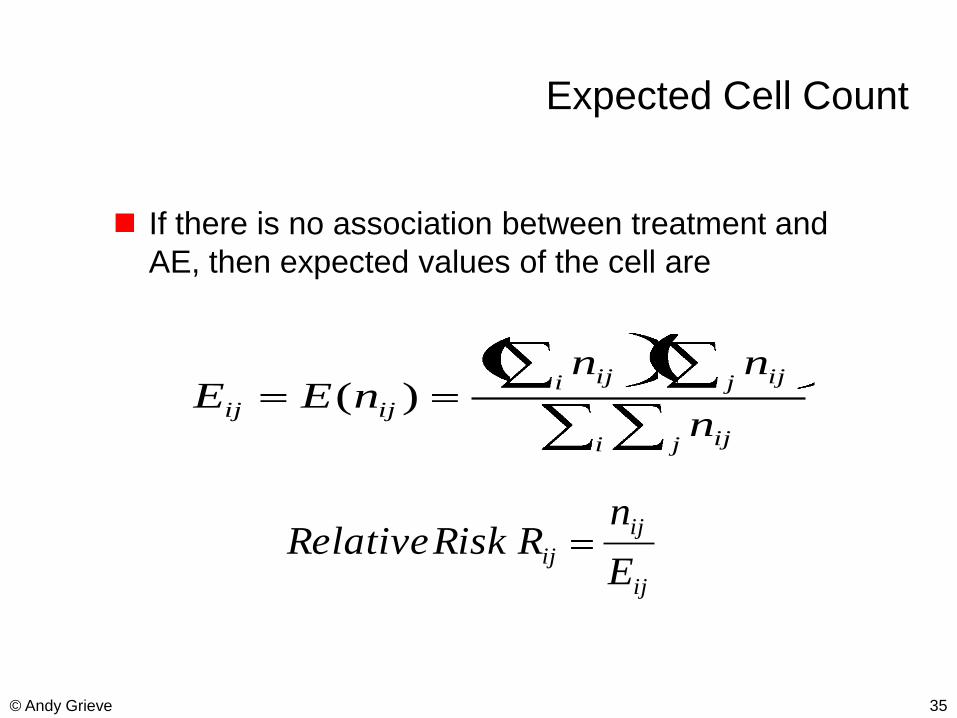
Expected Cell Count
If there is no association between treatment and
AE, then expected values of the cell are
i j ij
j iji ij
ijijn
nnnEE
)(
ij
ij
ijE
nR Risk Relative
delete these guides from slide master before printing or giving to the client
delete these guides from slide master before printing or giving to the client
36© Andy Grieve
Finding “Interestingly Large” Counts
Relative Risk
Is appealing and easy to interpret.
Requires no probabilistic calculation.
But,
Has extreme sampling variability when expected frequencies are small.
n=1, E=0.01 is different from n=100, E=1.0, even though both lead to RR=100.
delete these guides from slide master before printing or giving to the client
delete these guides from slide master before printing or giving to the client
37© Andy Grieve
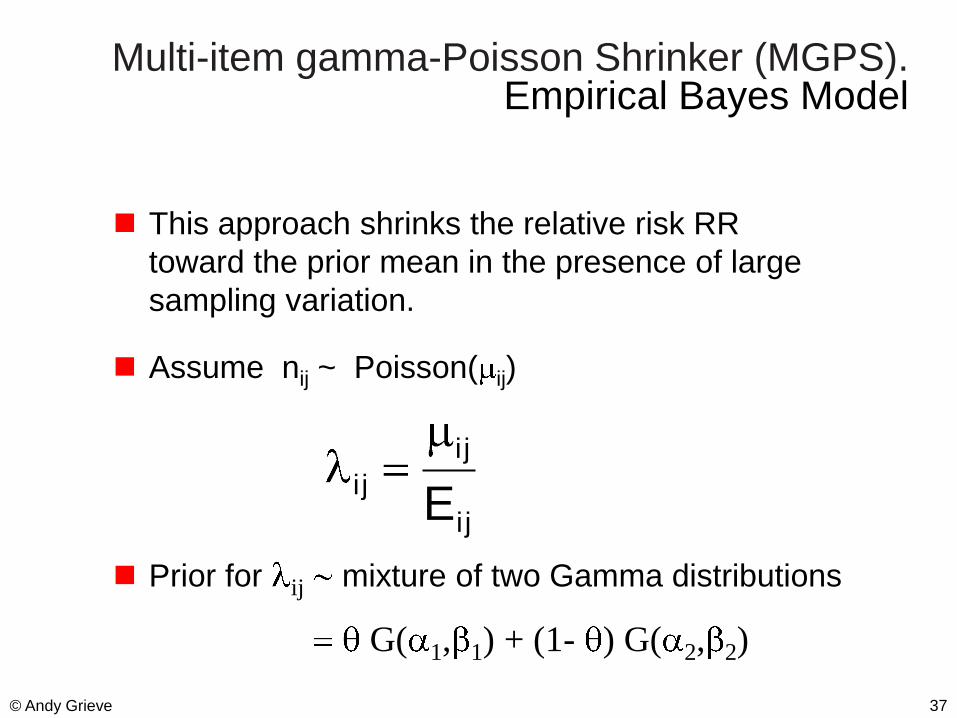
Multi-item gamma-Poisson Shrinker (MGPS).Empirical Bayes Model
This approach shrinks the relative risk RR
toward the prior mean in the presence of large
sampling variation.
Assume nij ~ Poisson( ij)
Prior for ij mixture of two Gamma distributions
G( 1, 1) + (1- ) G( 2, 2)
i j
i j
i jE
delete these guides from slide master before printing or giving to the client
delete these guides from slide master before printing or giving to the client
38© Andy Grieve
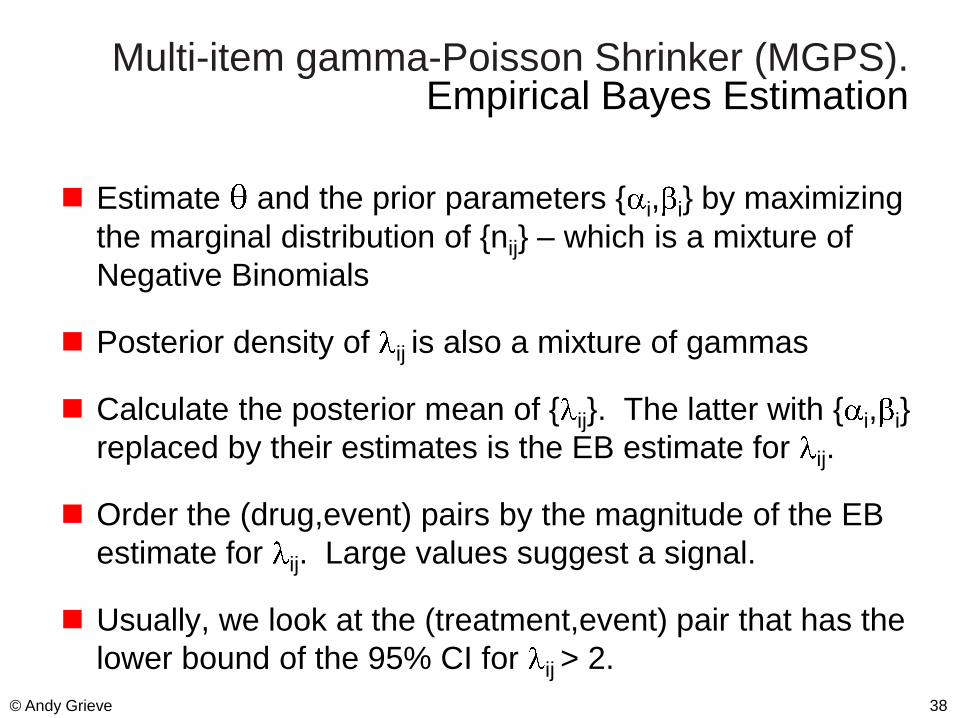
Multi-item gamma-Poisson Shrinker (MGPS).Empirical Bayes Estimation
Estimate and the prior parameters { i, i} by maximizing
the marginal distribution of {nij} – which is a mixture of
Negative Binomials
Posterior density of ij is also a mixture of gammas
Calculate the posterior mean of { ij}. The latter with { i, i}
replaced by their estimates is the EB estimate for ij.
Order the (drug,event) pairs by the magnitude of the EB
estimate for ij. Large values suggest a signal.
Usually, we look at the (treatment,event) pair that has the
lower bound of the 95% CI for ij > 2.
delete these guides from slide master before printing or giving to the client
delete these guides from slide master before printing or giving to the client
39© Andy Grieve
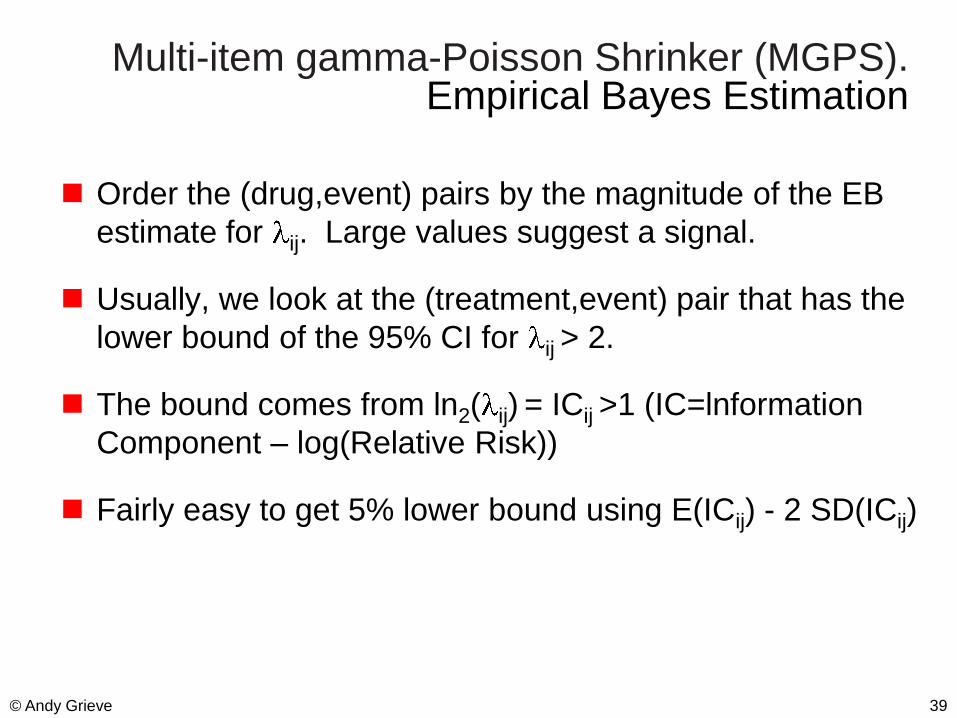
Multi-item gamma-Poisson Shrinker (MGPS).Empirical Bayes Estimation
Order the (drug,event) pairs by the magnitude of the EB
estimate for ij. Large values suggest a signal.
Usually, we look at the (treatment,event) pair that has the
lower bound of the 95% CI for ij > 2.
The bound comes from ln2( ij) = ICij >1 (IC=lnformation
Component – log(Relative Risk))
Fairly easy to get 5% lower bound using E(ICij) - 2 SD(ICij)
delete these guides from slide master before printing or giving to the client
delete these guides from slide master before printing or giving to the client
40© Andy Grieve
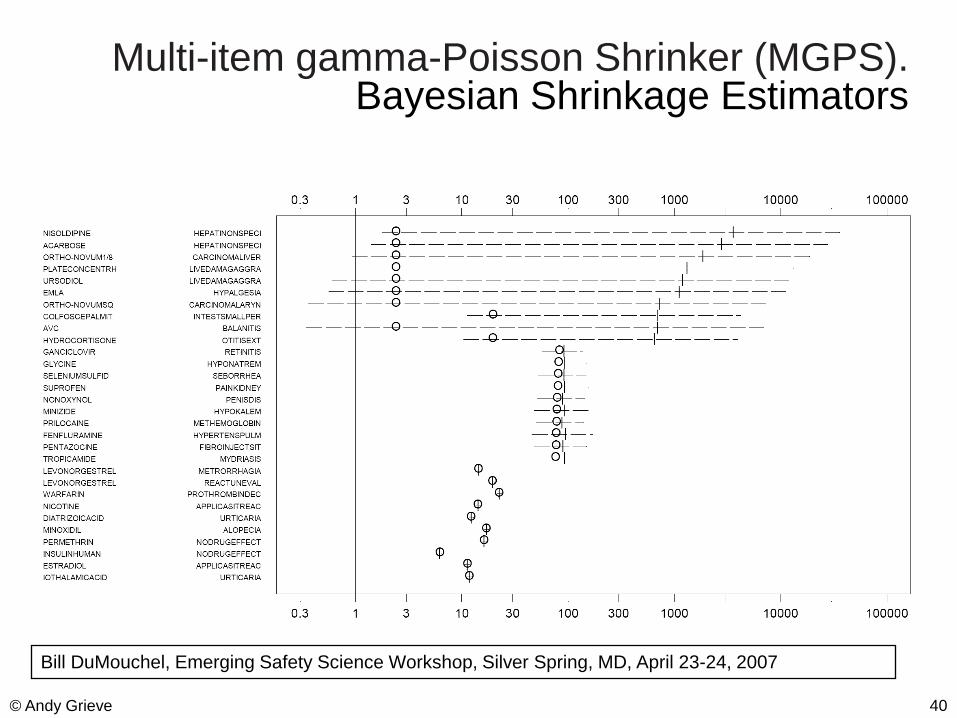
Multi-item gamma-Poisson Shrinker (MGPS).Bayesian Shrinkage Estimators
Bill DuMouchel, Emerging Safety Science Workshop, Silver Spring, MD, April 23-24, 2007
delete these guides from slide master before printing or giving to the client
delete these guides from slide master before printing or giving to the client
41© Andy Grieve
MGPS Used by Both Regulators and Companies
The MGPS methodology has been commercialized by
Lincoln Technologies.
FDA is using MGPS to explore the AERS data.
Several major PhRMA companies such as GSK,
Merck, BMS, and Pfizer have either used this
approach routinely or are experimenting with it.
The operating characteristics of MGPS is not fully
known. The agreement between MGPS and PRR is
not always high. The effect of lumping or splitting of
events under this approach needs to be further
investigated.
delete these guides from slide master before printing or giving to the client
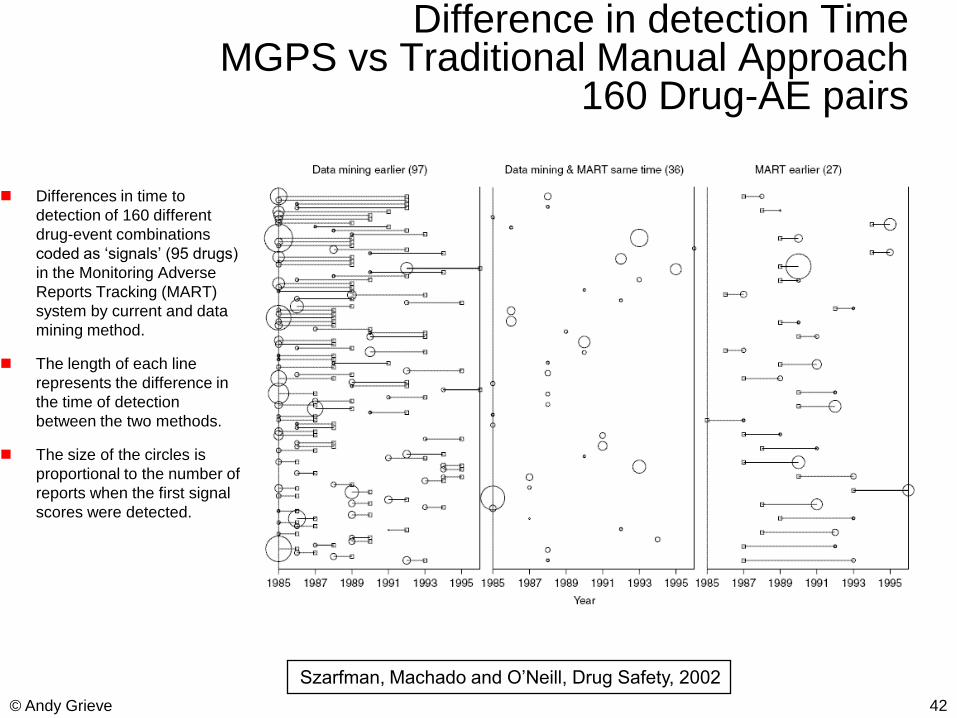
delete these guides from slide master before printing or giving to the clientDifference in detection TimeMGPS vs Traditional Manual Approach
160 Drug-AE pairs
Differences in time to
detection of 160 different
drug-event combinations
coded as „signals‟ (95 drugs)
in the Monitoring Adverse
Reports Tracking (MART)
system by current and data
mining method.
The length of each line
represents the difference in
the time of detection
between the two methods.
The size of the circles is
proportional to the number of
reports when the first signal
scores were detected.
42© Andy Grieve
Szarfman, Machado and O‟Neill, Drug Safety, 2002
delete these guides from slide master before printing or giving to the client
delete these guides from slide master before printing or giving to the client
43© Andy Grieve
Bayesian Confidence Propagation Neural Network (BCPNN)
(Bate et al, EurJClPhrm1998)
„Bayesian Confidence Neural Network‟ (BCNN)
Model:
nij = no. reports mentioning both drug i & event j
ni+ = no. reports mentioning drug i
n+j = no. reports mentioning event j
Usual Bayesian inferential setup:
Binomial likelihoods for nij, ni+ , n+j
Beta priors for the rate parameters (rij, pi, qj)
delete these guides from slide master before printing or giving to the client
delete these guides from slide master before printing or giving to the client
44© Andy Grieve
Bayesian Confidence Propagation Neural Network (BCPNN)
(Bate et al, EurJClPhrm1998)
Uses „delta method‟ to approximate variance of
Qij = ln(rij / piqj) = ln 2 ICij
However, can calculate exact mean and variance of Qij (Noren et al (2006). Extending the methods used to screen the WHO
drug safety database towards analysis of complex associations and
improved accuracy for rare events. Stats in Medicine, 25:3740–3757)
WHO measure of importance = E(ICij) - 2 SD(ICij)
Test of signal detection predictive value by analysis of
signals 1993-2000: Drug Safety 2000; 23:533-542
84% Negative Pred Val, 44% Positive Pred Val
Good filtering strategy for clinical assessment
delete these guides from slide master before printing or giving to the client
delete these guides from slide master before printing or giving to the client
45© Andy Grieve
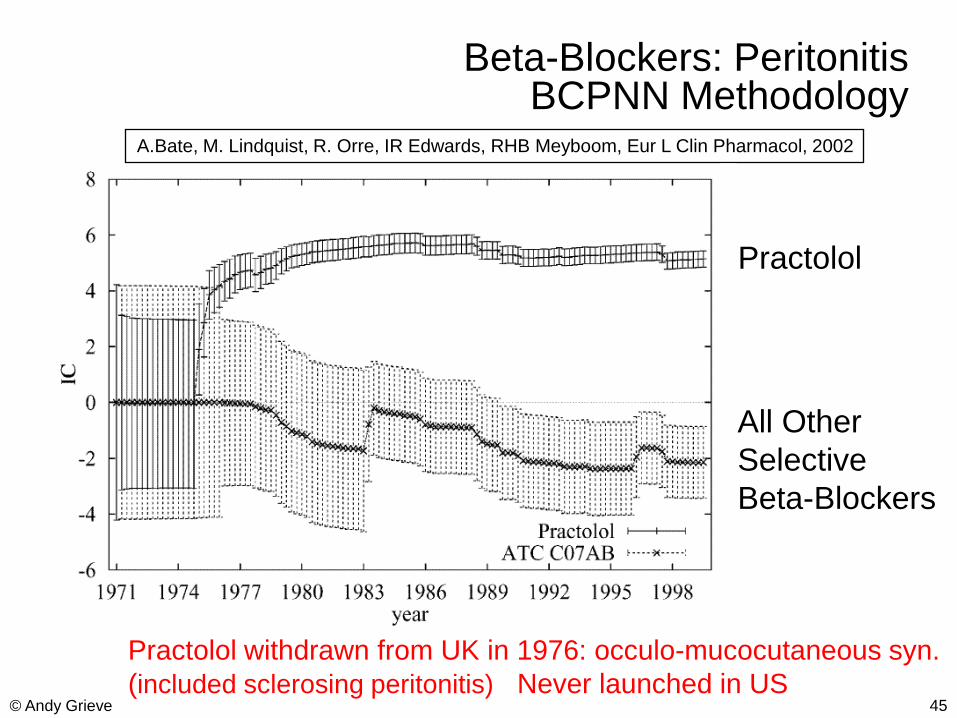
Beta-Blockers: PeritonitisBCPNN Methodology
Practolol
All Other
Selective
Beta-Blockers
A.Bate, M. Lindquist, R. Orre, IR Edwards, RHB Meyboom, Eur L Clin Pharmacol, 2002
Practolol withdrawn from UK in 1976: occulo-mucocutaneous syn.
(included sclerosing peritonitis) Never launched in US
delete these guides from slide master before printing or giving to the client
delete these guides from slide master before printing or giving to the client
46© Andy Grieve
Interpreting the Signal Throughthe Role of Visual Graphics
Four examples of spatial maps that reduce the
scores to patterns and user friendly graphs and
help to interpret many signals collectively (O'Neill
& Szarfman, The American Statistician, Vol. 53,
1999, pp. 190-196.)
Graphical displays developed using the software
CrossGraphs
delete these guides from slide master before printing or giving to the client
delete these guides from slide master before printing or giving to the client
47© Andy Grieve
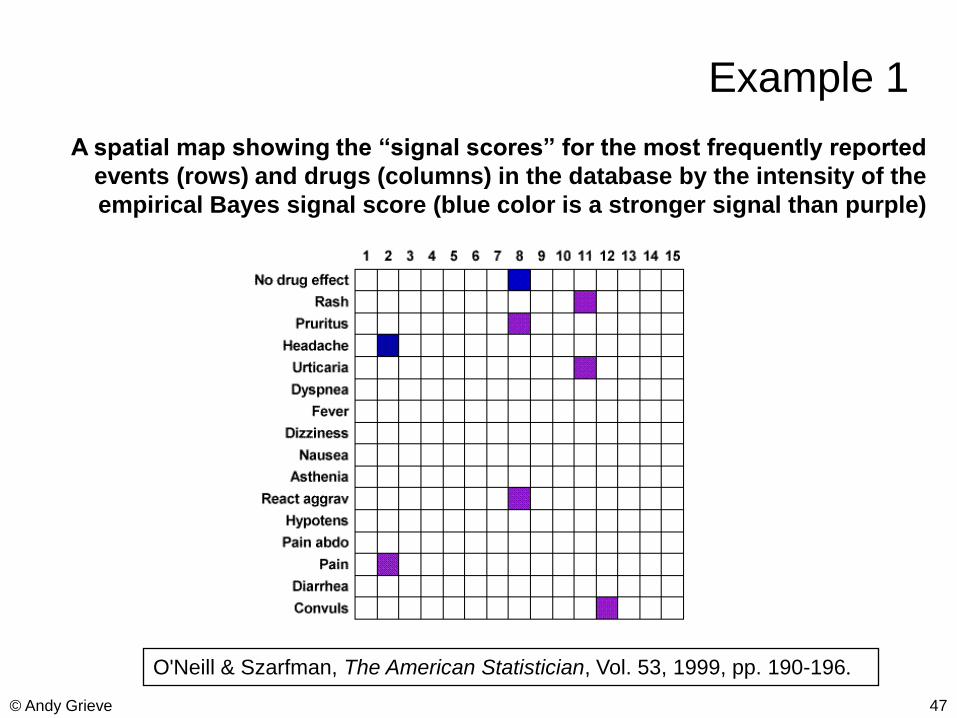
Example 1
A spatial map showing the “signal scores” for the most frequently reported
events (rows) and drugs (columns) in the database by the intensity of the
empirical Bayes signal score (blue color is a stronger signal than purple)
O'Neill & Szarfman, The American Statistician, Vol. 53, 1999, pp. 190-196.
delete these guides from slide master before printing or giving to the client
delete these guides from slide master before printing or giving to the client
48© Andy Grieve
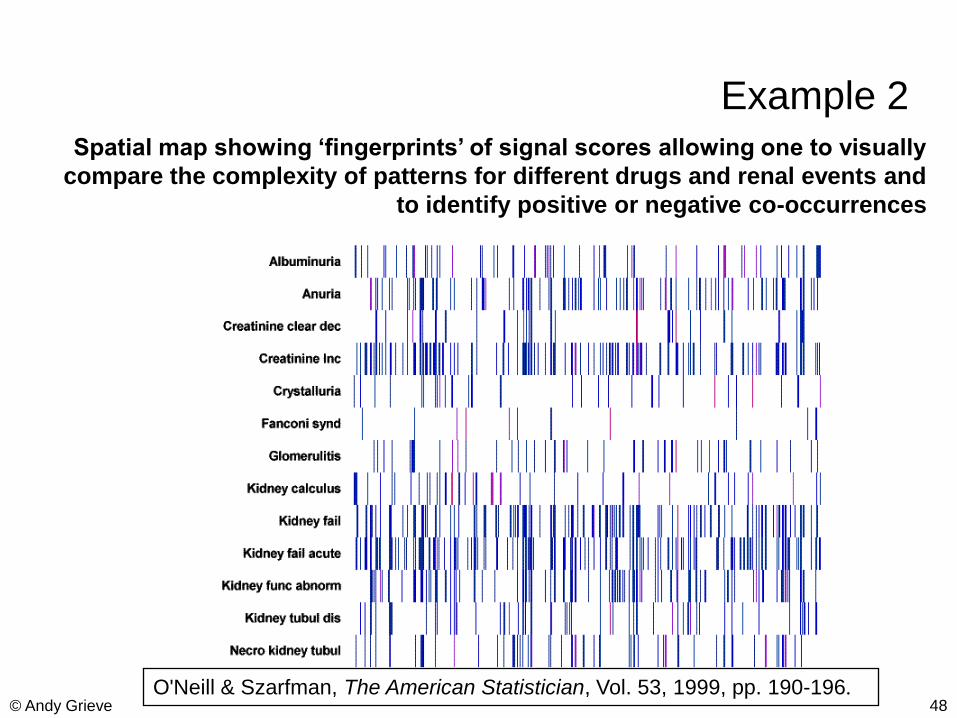
Example 2Spatial map showing „fingerprints‟ of signal scores allowing one to visually
compare the complexity of patterns for different drugs and renal events and
to identify positive or negative co-occurrences
O'Neill & Szarfman, The American Statistician, Vol. 53, 1999, pp. 190-196.
delete these guides from slide master before printing or giving to the client
delete these guides from slide master before printing or giving to the client
49© Andy Grieve
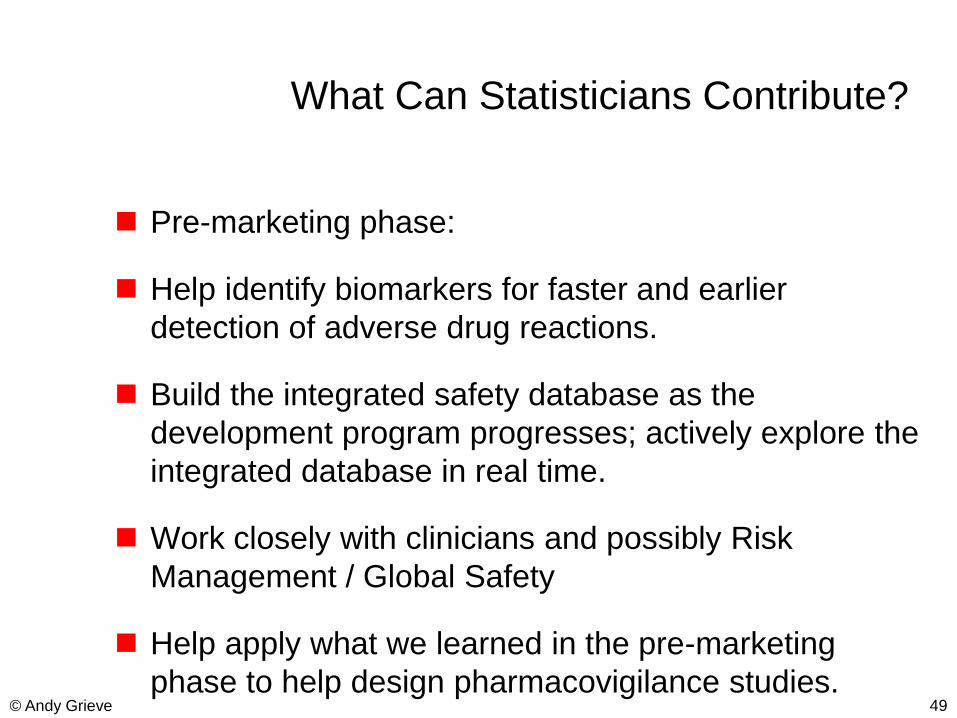
What Can Statisticians Contribute?
Pre-marketing phase:
Help identify biomarkers for faster and earlier
detection of adverse drug reactions.
Build the integrated safety database as the
development program progresses; actively explore the
integrated database in real time.
Work closely with clinicians and possibly Risk
Management / Global Safety
Help apply what we learned in the pre-marketing
phase to help design pharmacovigilance studies.
delete these guides from slide master before printing or giving to the client
delete these guides from slide master before printing or giving to the client
50© Andy Grieve
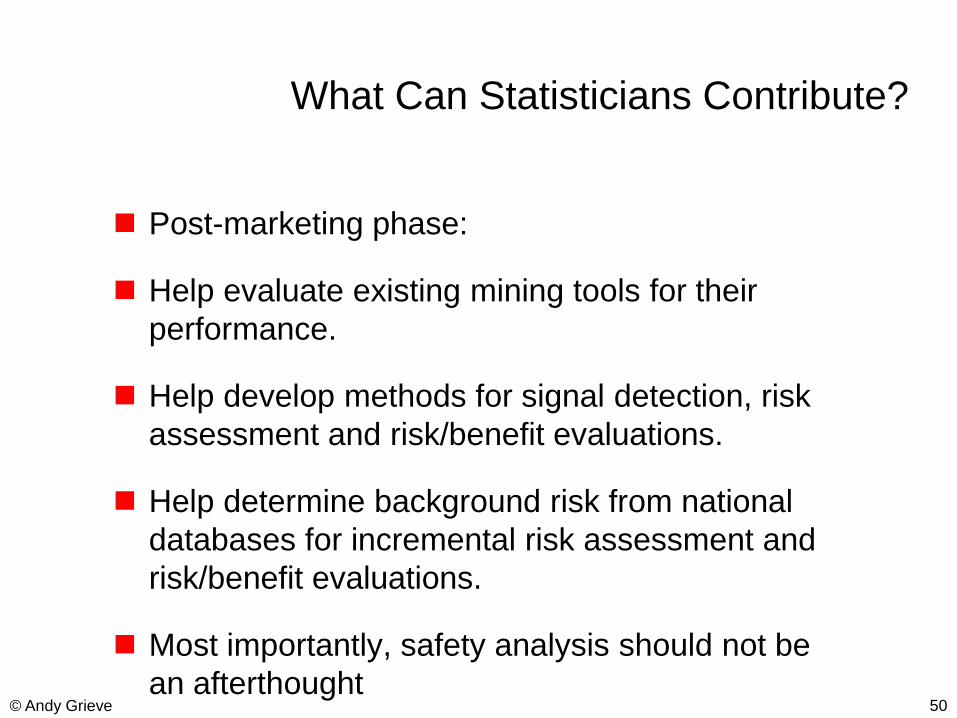
What Can Statisticians Contribute?
Post-marketing phase:
Help evaluate existing mining tools for their
performance.
Help develop methods for signal detection, risk
assessment and risk/benefit evaluations.
Help determine background risk from national
databases for incremental risk assessment and
risk/benefit evaluations.
Most importantly, safety analysis should not be
an afterthought

delete these guides from slide master before printing or giving to the client
delete these guides from slide master before printing or giving to the client
51© Andy Grieve
Back-up Slides.
delete these guides from slide master before printing or giving to the client
delete these guides from slide master before printing or giving to the client
52© Andy Grieve
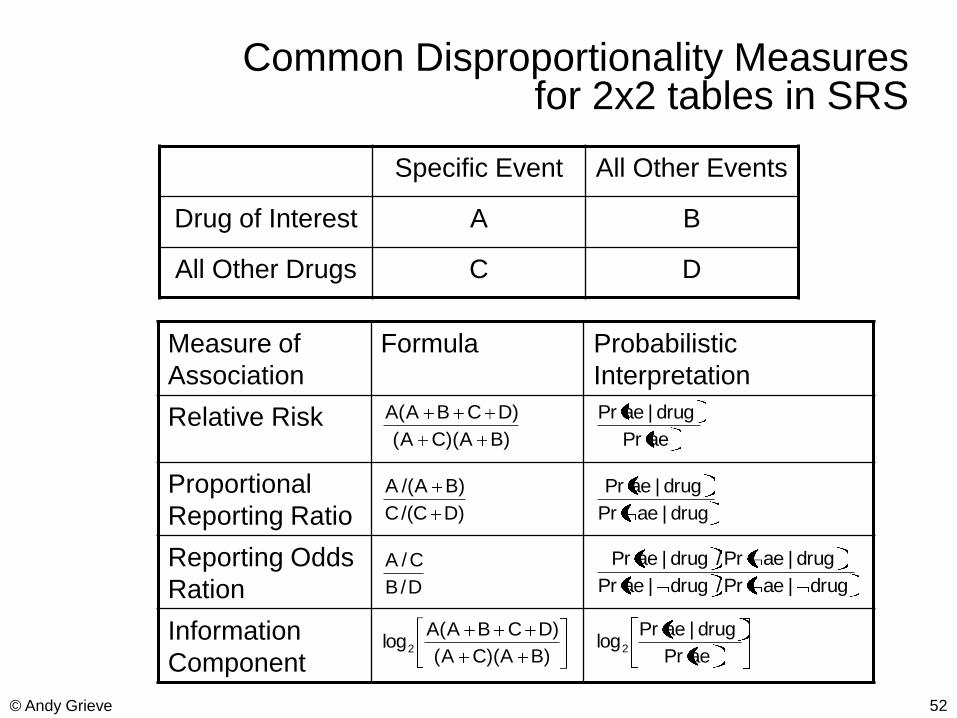
Common Disproportionality Measuresfor 2x2 tables in SRS
Specific Event All Other Events
Drug of Interest A B
All Other Drugs C D
Measure of
Association
Formula Probabilistic
Interpretation
Relative Risk
Proportional
Reporting Ratio
Reporting Odds
Ration
Information
Component
)BA)(CA(
)DCBA(A
)DC/(C
)BA/(A
D/B
C/A
)BA)(CA(
)DCBA(Alog2
aePr
drug|aePr
drug|aePr
drug|aePr
drug|aePr/drug|aePr
drug|aePr/drug|aePr
aePr
drug|aePrlog2
delete these guides from slide master before printing or giving to the client
delete these guides from slide master before printing or giving to the client
53© Andy Grieve
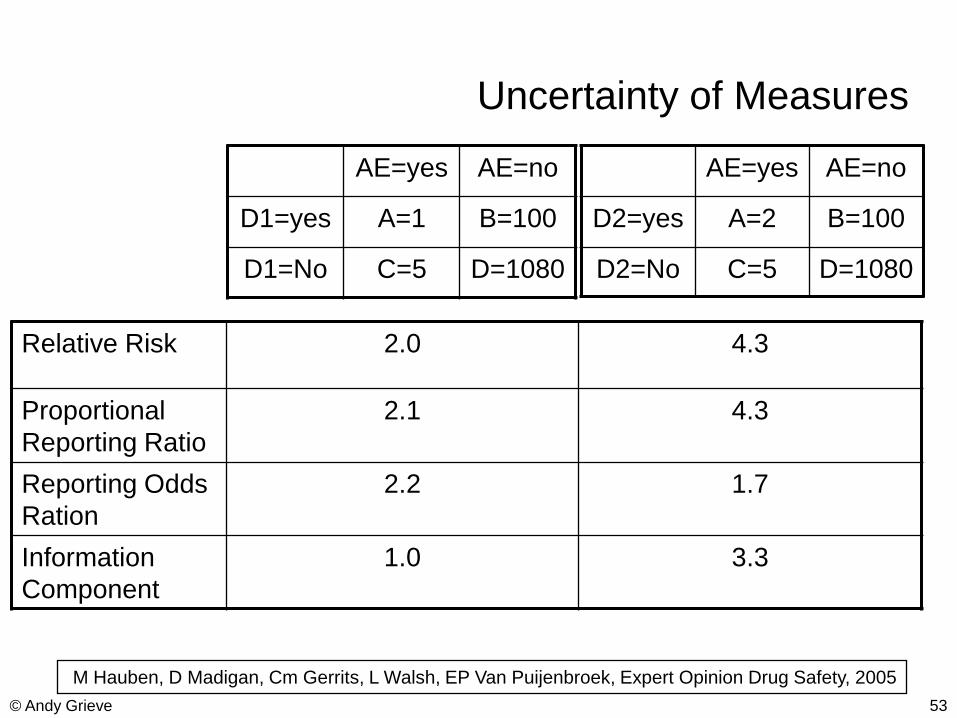
Uncertainty of Measures
AE=yes AE=no
D1=yes A=1 B=100
D1=No C=5 D=1080
AE=yes AE=no
D2=yes A=2 B=100
D2=No C=5 D=1080
Relative Risk 2.0 4.3
Proportional
Reporting Ratio
2.1 4.3
Reporting Odds
Ration
2.2 1.7
Information
Component
1.0 3.3
M Hauben, D Madigan, Cm Gerrits, L Walsh, EP Van Puijenbroek, Expert Opinion Drug Safety, 2005