Embed Size (px)
Citation preview

NREL is a national laboratory of the U.S. Department of Energy, Office of Energy Efficiency and Renewable Energy, operated by the Alliance for Sustainable Energy, LLC.
Applications of the Biomass
Scenario Model
Brian W Bush
Presentation at EIA’s “Biofuels in
AEO2013 ” Workshop
20 March 2013

4
Focus of Biomass Supply-Chain Analysis
Deployment Analysis: exploring how rapidly biofuel technologies might
be deployed to make a significant contribution to the country’s
transportation energy
– Generate plausible scenarios
– Understand the transition dynamics
– Investigate potential market
penetration scenarios
– Analyze prospective
policies and incentives
– Identify high-impact
drivers and bottlenecks
– Study competition for biomass resources
– Assess R&D and deployment strategies
– Enable and facilitate focused
discussion among stakeholders
Government PoliciesAnalysis
Implications
Inclusion decisions /scope
Marketplace StructureProducer/Consumer exchanges
Investment
Financial decisions
Input ScenariosFeedstock demand
Oil prices
Learning curves
Evolution of
Supply Chain
for Biofuels

5
Example of Influences/Feedbacks
Financial incentives for
growing cellulosics
Financial incentives for
ethanol conversion plants
Financial incentives for stations owners to supply
ethanol
Gas tax
Financial attractiveness of growing cellulosics
Land allocated to cellulosics
Cellulosic crop
production
Feedstock
price
Feedstock
demand
Biofuel conversion
capacity
Financial attractiveness of biofuel conversion plants
Biofuel conversion
costs
Technology maturity
Biofuel price relative
to petroleum fuels
Biofuel demand Biofuel consumers
(for ethanol) station
availability
Biofuel
supply
+
+
-
-
-
-
KEY
“ - “ = negative ( balancing / counteracting ) loop
“ + ” = positive
( reinforcing ) loop

6
Key Characteristics of BSM Modules
SUPPLY CHAIN
Feedstock
Production
Feedstock
Logistics
Biofuels
Production
Biofuels
Distribution
Biofuels End
Use
DYNAMIC MODELS OF SUPPLY INFRASTRUCTURE,
PHYSICAL CONSTRAINTS, MARKETS, AND DECISION MAKING
POLICIES INCENTIVES EXTERNALITIES
Feedstock Supply Module
q 6 Feedstock typesq 10 geographic regionsq 10+ land usesq Farmer decision logicq Land allocation dynamicsq New agriculture practicesq Markets and prices
Feedstock Logistics Module
q Multiple logistics stagesq Cost breakdownsq Transportation distanceq Land eligibility
Conversion Module
q 15 conversion platformsq 4 development stagesq 6 learning attributesq Cascading learning curvesq Project economicsq Industry growth and investment
dynamics
Distribution Logistics Module
q Distribution terminal focusq Differential cost structure, based on
infrastructure (storage and intra/inter-region transport costs)
Dispensing Station Module
q Fueling-station economicsq Tankage and equipment investment
decisionq Distribution-coverage effects
Vehicle Scenario Module
q Cars and Light Trucksq Multiple (9 +scenario) vehicle
technologiesq Fleet vintagingq Vehicle choice scenariosq E10/E20/E85 potential
Fuel Use Module
q Non-, occasional, and frequent users
q Relative price/fuel choice dynamics

7
BSM Regionalization

8
Categorization of Cropland
All C
ro
pla
nd A
cti
ve C
ro
pla
nd
Pastu
re
CR
PExclu
ded
fr
om
FS
M
Harvested for Cellulose
Unharvested
Growing as PastureUsed as Forage
Harvested for Cellulose
Planted with Energy CropsMature
Immature
Hay
Available for Traditional and Celluosic Crops
Annuals
Perennial Energy Crops
Herbaceous
Woody
Soy
Wheat
Other Grains
Cotton
Mature
Immature
Mature
Immature
CornWith residue collection
With secondary crop
With residue collection
With secondary crop
With residue collection
With secondary crop
With residue collection
With secondary crop
High value cash crops, etc.

9
Biofuel Pathways in the BSM
Gasoline
Diesel
Jet
Lignocellulosic
Biomass
Energy crops (herbaceous and
woody)
Residues (herbaceous,
woody, urban)
Catalytic synthesis (TC)
Fischer -Tropsch synthesis
Hydro-processing
AqueousPhase Reforming
Fermentation (BC)
Bio-Oils
Syn Gas
Sugars
Fermentation
Fermentation
HydrodeoxygenationOils
Natural Oils
(Oilseeds and Algae)
Corn
Butanol
Ethanol
Ethanol and
Mixed Alcohols
Diesel and Jet
Methanol Synthesis,Methanol-to-Gasoline
Gasoline
Gasification
Extraction
Pyrolysis
Pretreatment
& Hydrolysis
Hydrolysis
Processing at biorefinery
Optional processing
Biorefinery
Processing
Biomass
FeedstocksPetrochemical
Refining
Blending at
Refinery
Finished
Fuels
“Drop In” points for infrastructure- compatible fuels:
Sugars
Ethanol

10
Appropriate Uses of the BSM
• The BSM is an excellent tool for generating and evaluating
scenarios and relative impacts of cost targets, policy drivers, tipping
points, etc. High-level system models such as the BSM cannot
provide absolutes to a high degree of precision.
Designed to . . . Not Designed to . . .
Generate scenarios to explore future biofuel landscapes.
Generate x gallons in y years with z
dollars investment.
Identify areas of potential high leverage.
Identify specific numerical values of particular investments.
Assess relative merits of technologies and logistics in a gross sense, given solid technological assumptions.
Make fine distinctions between potential of technologies.
Explore the potential for tipping-point and lock-in/lock-out dynamics.
Predict tipping points precisely and pin them to specific times.
Build intuition, insight, and knowledge around the supply chain.
Represent a definitive embodiment of knowledge.
Think through the relative efficacy of different policy prescriptions.
Determine recommended policies in isolation.

11
Scenario Analyses Completed
Effect of Biomass Crop
Assistance Program
Sensitivity of feedstock
and ethanol production
to plant-gate feedstock
prices
Price-stabilizing
influence of forest
and crop residues
Effects of industrial
learning rates
Differential
investment in
competing conversion
technologies
Conditions under which
conversion technologies compete
Tradeoffs between grants
and loan guarantees
Likelihood of boom/bust
cycles
Extent to which policy
exacerbates instabilities
Nature of price
fluctuations in various
elements of the supply
chain
Effects of reverse-auctions for
volumetric creditsMethods for reducing bottlenecks
from lack of distribution or dispensing
infrastructure
Policy mixes with high benefits for
low cost
Coupling of
petroleum and
biofuels prices
Impacts of petroleum
price scenarios and
price shocks
Influence of
ethanol tariffs
Conditions for achieving RFS
or other targets
Most effective points for
volumetric subsidies
Effects of phasing out supportive
policies
Synergies between volumetric
and capital-oriented policies
Individual
policies Pricing
Coordinating policies
System
characteristicsCompeting technologies

12
Insights along the Cellulosic Ethanol* Supply Chain
* Most of these insights hold for other biofuels in addition to cellulosic ethanol.

13
Policies Implemented in Isolation Are Not as Effective as Certain
Policies Implemented in Coordination
Dynamic Interaction: the point-of-use subsidy decreases financial risk for gas station owners, causing more E85
tankage to be installed. The resulting increase in ethanol demand, in conjunction with the point-of-production subsidy,
decreases the risk for those wanting to invest in biorefineries. This increased confidence results in more biorefineries
being built and increased cellulosic ethanol production.
} 15% increase due
to policy synergy

14
Key Insights from Biofuels Supply-Chain Analyses
Four keys to industry development:
1. Profitability at point of production
2. High rates of industry learning
3. An aggressive start in building pilot, demo, and
pioneer-scale plants
4. For ethanol, a high level of infrastructure
investment to sustain low enough point-of-use
prices
The “take off” is likely to be wild and wooly:
1. Unstable, higher than anticipated, feedstock
prices
2. Boom/bust development of production capacity
3. Potential for biofuel price instability
Significant production volumes are feasible.
1. RFS2 volumes are achievable in 2030 with
heavy startup subsidies.
2. When subsidies are limited to promoting the
most economically attractive pathway,
production levels can be greater than RFS2
levels.
3. Technologies with favorable long-term
economic cost structures can succeed if
subsidies are deliberately designed to
overcome initial maturity deficiencies.
Caveat: The results depend on details of the policy, incentive, and subsidy parameters for the scenarios and on a variety of
state-of-technology assumptions; this chart just presents a few
of the many potential scenarios.

15
Scenario Library Examples
Scenario Subsidize … Strategy 1: Minimal Policy Starch until 2012 Apply only existing subsidies and
policies
2: Ethanol Only Ethanol pathways only Provide support for ethanol only
3: Equal Access All pathways in order to produce
36 billion gallons/year by 2031
Allow all fuel types equal access to
generous scenario subsidies
4: Output-Focused,
Constrained
To maximize growth restricted to
$10 billion per year
Target most promising technology
and withhold most subsidy access
from other pathways
5: Pathway Diversity To maximize pathways restricted
to $10 billion per year
Design subsidy timeline to enable
take-off of multiple fuel pathways by
staggering start and end dates based
on pathway progress and potential
6: Output-Focused,
Unconstrained
To maximize growth with no
spending limit
Design a subsidy scheme to most
rapidly produce the maximum volume
of biofuels that the system can
produce

16
Different subsidy levels shape scenarios
Point of production [$/gallon]
Fixed Capital Investment (FCI) for Pioneer [%]
2015
2020
2025
2030
2015
2020
2025
2030
2015
2020
2025
2030
2015
2020
2025
2030
Starch Ethanol 0.45 0.450.450.45
Pathway
Sta
rtup
Backgro
und
Cellulosic
Ethanol
All Ethanol
Fast
Pyro
lysis
Fis
cher-
Tro
psch
Meth
anol to
Gasolin
eFerm
enta
tion
Sta
rtup
Backgro
und
Scenario 1Minimal Policy
Scenario 2Ethanol Only
Scenario 3RFS2
Scenario 4Output-focused
Scenario 5Diverse pathways
Sta
rtup
Backgro
und
Sta
rtup
Backgro
und
Sta
rtup
Backgro
und
.15
0.6
0
1.0
1.0
3.75
1.0
0
1.0
1.0
2.00
0.6
0
0.9
0.9
2.25
0.7
0.7
0.7
0.7
0
0
0
0
0
1.0
0.6
0
0.7
0.7
0
0
0
0
0
0
1.25
0
0.5
0.45
2.00
0.6
0
0.9
0.9
2.00
0.6
0
0.9
0.9
2.00
0.6
0
0.9
0.9
.15
0.5
2.65
0.6
0
0.7
0
.15
0.6
0
0.7
0
2.65
0.7
0.7
0.7
0.7
1.00
0.6
0.6
0.6
0.6
2.65
0.7
0.7
0.7
0.7
1.00
0.6
0.6
0.6
0.6
2.65
0.7
0.7
0.7
0.7
1.00
0.6
0.6
0.6
0.6
2.65
0.7
0.7
0.7
0.7
1.00
0.6
0.6
0.6
0.6
2.65
0.6
0
0.7
0.7
.15
0.6
0
0.7
0.7
0
0.5
2.65
1.0
0.3
1.0
1.0
.15
0
0
0
0
2.65
0
0
0
0
.15
0
0
0
0
2.65
0
0
0
0
.15
0
0
0
0
2.65
0
0
0
0
2015
2020
2025
2030
1 billion cellulosic
gallon startup limit
1 billion cellulosic
gallon startup limit
1 billion cellulosic
gallon startup limit
1 billion cellulosic
gallon startup limit
1 billion fungible fuel gallon
startup limit for all other
subsidies
3 billion fungible fuel
gallon startup limit
0.3 billion fungible fuel gallon startup
limit for FCI Commercial
1 billion fungible fuel gallon
startup limit
FCI for Commercial [%]
Loan for Commercial [%]
Downstream Distribution and storage [$/gallon]
Downstream Point of use [$/gallon]
Fungib
le F
uels
3.75
1.0
0
1.0
1.0
3.75
1.0
0
1.0
1.0
3.75
1.0
0
1.0
1.0
Loan for Pioneer [%]
1 Existing starch ethanol subsidy
2 Ethanol subsidies sufficient for modest growth to blend wall
3 Generous subsides for all pathways, give windfalls
Equal Access
4 Focused subsidy investment on top pathway
5 S
tagi
ng
and
wei
ghti
ng
to r
etai
n d
iver
sity
Some values may vary slightly from current runs

17
2. EtOH only: Intra-EtOH competition for market share
Diverse
pathways
EtOH
only
Output
focused
Equal
Access Vol for pop subs met, reduced to background level
Dist & storage subs turned off
Cellulosic EtOH has adequate bidding power and can meet demand. When cellulosic subsidies are reduced , starch-based EtOH is advantaged and regains some market share.
FCI and pioneer loan subsidies are turned off

18
4. Output focused: competition for market and feedstock
Diverse
pathways
EtOH
only
Output
focused
Equal
Access
FP FCI for pioneer stops
FP FCI for commercial stops
Downstream EtOH subsidies end
Cellulosic is advantaged over Starch because of subsidies
FP has better economics than cellulosic EtOH and can afford to pay higher prices for feedstocks
Starch EtOH is more mature than cellulosic and hence can regain market share.

19
5. Diverse pathways: competition for market and feedstock
Diverse
pathways
EtOH
only
Output
focused
Equal
Access
Annual expenditures are < $10B/yr-
peak ≈ $9B
17.8 B gal/yr- drop-in production
5.7 B gal
5.5 B gal
5.3 B gal
1.8 B gal
F-T Loan guarantees for
pioneer and commercial and
FCI is turned off
FP-PoP subsidy is turned off.
MTG-PoP subsidy is turned off.
F-T-PoP subsidy
is turned off.
Cellulosic is advantaged over Starch because of subsidies
Infrastructure-compatible fuels have better economics than cellulosic EtOH and can afford to pay higher prices for feedstocks
Starch EtOH is more mature than cellulosic and hence can regain market share.

20
Insights Related to a Transition from E10 to E15
• Widespread E15 adoption moves the “blend wall” and can greatly
alter the proportion of cellulosic ethanol in the mix of biofuels.

21
Library of Biomass Supply Curves
Users can create scenarios of how biomass price evolves with time.
The BSM estimates production quantities and supply curves.
22
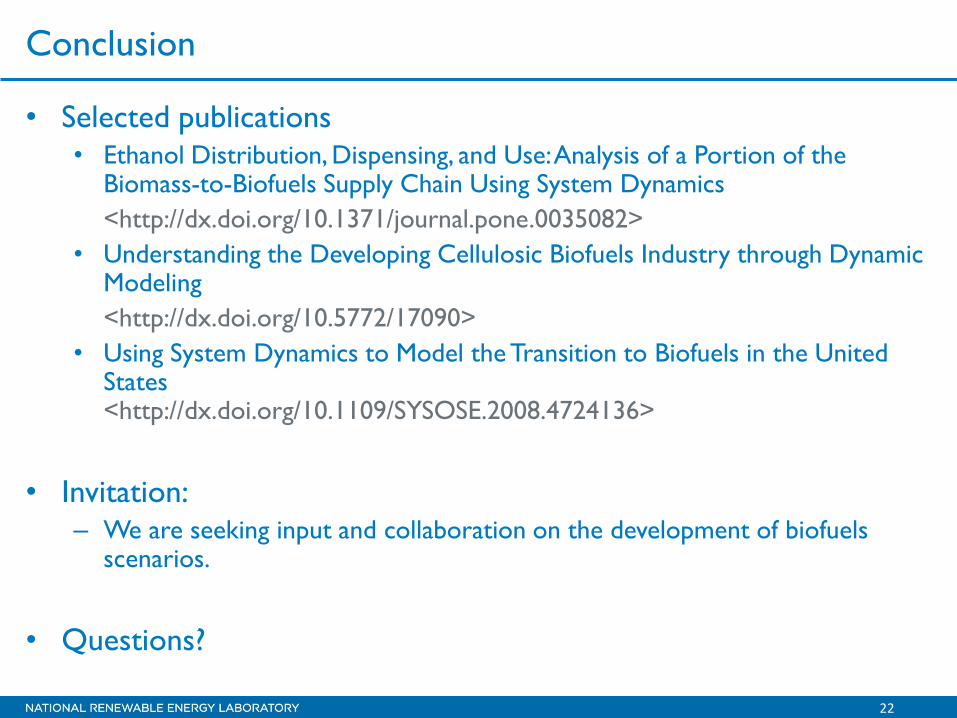
Conclusion
• Selected publications • Ethanol Distribution, Dispensing, and Use: Analysis of a Portion of the
Biomass-to-Biofuels Supply Chain Using System Dynamics
<http://dx.doi.org/10.1371/journal.pone.0035082>
• Understanding the Developing Cellulosic Biofuels Industry through Dynamic Modeling
<http://dx.doi.org/10.5772/17090>
• Using System Dynamics to Model the Transition to Biofuels in the United States <http://dx.doi.org/10.1109/SYSOSE.2008.4724136>
• Invitation: – We are seeking input and collaboration on the development of biofuels
scenarios.
• Questions?