Embed Size (px)
Citation preview

Journal of Applied Horticulture, 11(1):3-9, January-June, 2009
Applications of GIS to Citriculture in South Texas
Reginald S. Fletcher
United States Department of Agriculture, Agricultural Research Service, Kika de la Garza Subtropical Agricultural Research Center, 2413 E. Hwy. 83, Weslaco, Texas 78596, E-mail: [email protected]
AbstractThe South Texas citrus industry needs an inventory of soil properties within existing citrus (Citrus spp.) orchards, wants data at the county level showing soils that are suitable for citrus production, and would value any information related to the establishment of citrus orchards. This study discusses integration of citrus, soil survey geographic data (SSURGO), and U.S. Census spatial and tabular data with geographical information system (GIS) technology for citriculture. For this study, Hidalgo County Texas was evaluated because it is the major citrus producing county in South Texas. The spatial and tabular data and commercial GIS software were used to inventory selected soil chemical and physical properties within citrus groves, to identify orchards that may be affected by urban expansion, and to select potential sites for establishing new citrus orchards. Results indicated that citrus, SSURGO, and U.S. census spatial and tabular data integrated with GIS technology can be a powerful tool for citriculture. The information provided in this study should appeal to producers, extension agents, scientists, and government agencies within the U.S. and abroad.
Key words: Citriculture, citrus, Citrus spp., Geographic Information System (GIS), soil survey geographic data (SSURGO), Topologically Integrated Geographic Encoding and Referencing (TIGER) data, grapefruit, Citrus paradisi, oranges, Citrus sinensis
IntroductionIn the Lower Rio Grande Valley of Texas, the citrus industry needs inventories on chemical and physical properties of soils within citrus groves to assist them in making management decisions. The life expectancy of citrus trees ranges from 30 to 50 years. Establishment of new groves on soils having a high potential for citrus production and a low potential for commercial buildings and homes would be ideal because these locations can remain in citrus for extended periods, reducing the loss of established orchards to urban expansion.
Spatial and tabular soil data are available in digital formats, allowing analysts to incorporate it into a geographic information system (GIS), a computer system designed to store, retrieve, and manipulate geographic data in various formats. The soil survey geographic data (SSURGO) created by the Natural Resource Conservation Service (NRCS) provides the most comprehensive soil information for the United States (U.S.). It is designed for multiple purposes (National Soil Survey Center, 1995). The U.S. Census Bureau has also created spatial and tabular data in digital format to support its mapping needs for the decennial census and other bureau programs. This data contains line features (e.g., roads, railroad, transportation, etc.,); boundary features (e.g., statistical-census tracts and blocks, government-places and counties, administrative-congressional districts, school districts, etc.,); and landmark features (e.g., point-schools and churches, area-park and cemeteries, and key geographic locations-apartment building and factories).
Researchers have used GIS technology and spatial and tabular data provided by government agencies to assist them in assessing and in solving problems affecting agricultural and natural resources. Mandal and Sharma (2006) demonstrated the application of GIS to develop maps of salt-affected soils in India at the regional, state, and local level. Maps were useful for planning and for making
decisions in reclamation and in management of salt affected soils in the Indo-Ganetic Plain. Boonyanuphap et al. (2004) employed GIS-based analysis to identify suitable land for establishing banana plantations in Thailand. Wu et al. (2001) showed that the use of SSURGO data, integrated with remotely-sensed and other GIS layers were beneficial for planning and for managing natural resources in Finney County Kansas. Wu et al. (1997) also found SSURGO data to be an excellent source for determining erodible areas and for developing conservation practices. For subtropical South Texas, Richardson et al. (1996) utilized GIS technology to estimate sugarcane production, to map soil type, to manage farms, to classify vegetation communities, to enforce the cotton stalk destruction program, and to monitor the migration of Africanized honey bees into the southern U.S.
The development of SSURGO, along with other digital GIS layers, has been an important advancement. Little information is available on integrating SSURGO and U.S. Census data with GIS technology for citriculture. The objectives of this study were to use citrus, SSURGO, and U.S. Census data with GIS technology (i) to inventory selected chemical and physical soil properties within active citrus groves; (ii) to assess potential of soils for establishing citrus orchards; and (iii) to address alternatives for citrus grove establishment. For this study, Hidalgo County Texas was evaluated because it is the major citrus producing county in South Texas.
Materials and methodsCounty description: Hidalgo County is located at the southern tip of Texas (Fig. 1). The climate is subtropical. Annual rainfall average is 58.42 cm. The elevation ranges from 12.2 to 114 m with the greatest elevation occurring in the western half of the county. The most valuable resources are soil, water, natural gas, and the mild climate.
Journal
Appl

Agriculture is a major source of income for the county. For the state of Texas, the highest vegetable production occurs in Hidalgo County. Irrigated land is primarily used for agricultural production. Producers intensely farm the irrigated land, and their methods are highly specialized. Irrigated crop production includes cotton (Gossypium hirsutum L.), citrus, vegetables, grain sorghum
(Sorghum bicolor L.), and sugarcane. Grapefruit (Citrus paradisi L.) and oranges [C. sinensis (L.) Osbeck] are the primary citrus grown in the county. Drainage and salinity are the major soil problems affecting agriculture.
Development of GIS database: Illustrated in Fig. 2 is a flowchart showing the development of the spatial and tabular citrus-soil database. Spatial and tabular soil data of Hidalgo County, Texas, and a spatial database template were downloaded from the Soil Data Mart website (http://soildatamart.nrcs.usda.gov/), the official NRCS website for SSURGO data. SSURGO is the most comprehensive soil data in digital format provided by NRCS. The spatial component contained information needed to display and to analyze the data with GIS software. The tabular component included a set of American Standard for Information Interchange fields and text delimited files. The text delimited files matched a table within the SSURGO database template, which is a Microsoft Access database file containing empty tables. For this study, the soildb_US_2002.mb template (Microsoft Access 2002 format) was downloaded for further analysis. The spatial SSURGO data were transferred to the Manifold GIS (version 7.0) software.
The template table and the text delimited data were merged using Micrsoft Access 2002. The SSURGO database template has a macro (a rule specifying how a certain input sequence should be mapped to an output sequence according to a defined procedure) that allows the user to import the text delimited data into the SSURGO database. To use the macro and to complete the importing procedure, the analyst has to use Microsoft Access. Detailed instructions for this procedure were provided in the SSURGO manual.
The majority of the feeder roots for mature citrus trees occur within 61 cm of the soil surface (Ray and Walheim, 1980). For the soil inventory, chemical and physical properties based on this depth were determined with Soil Data Viewer (version 5.1,
Fig. 1. (a) Map of the continental United States showing the location of Texas and the study area (Enclosed in black square). (b) Close-up showing the Lower Rio Grande Valley and the study area-Hidalgo County.
Fig. 2. Flowchart showing steps used to create citrus soil database.
4 Applications of GIS to Citriculture in South Texas

http://nrcs.usda.gov), a freeware designed to create soil-based thematic maps when linked with ArcMap (GIS software) and tabular output for systems not equipped with ArcMap. The tabular data was used in this study. Soil Data Viewer only works with Microsoft Access databases, hence, the need to merge the text with the tabular template using Microsoft Access.
To calculate the information needed for the 0 to 61 cm depth, the soils data had to be aggregated. The following rules were used to estimate the values: (1) the dominant component, (2) the high tie break rule, and (3) converting null values to zeroes. The dominant component aggregation method returns the attribute value associated with the component occupying the highest percent composition in the map unit. The tie-break rule indicates which value should be selected from a set of multiple candidate values, or which value should be selected in the event of a percent composition tie. For this study, the component having the greatest value was used in tie break situations. Interpret nulls as zeroes is used to determine if a null value for a component should be converted to zero before aggregation occurs. This conversion happens only if a soil map unit has at least one component where this value is not null. For this study, null values were not interpreted as zeroes. Aggregated data were transferred to the GIS software and incorporated into the soil spatial data file table.
Soil parameters estimated with the Soil Data Viewer were clay content, pH, organic matter, and electrical conductivity. These properties were selected because they are important to citrus production. Brief definitions of the selected categories are as follows. Clay is mineral material composed of particles that are less than 0.002 mm in diameter. pH is a measure of the degree of acidity or alkalinity of a soil. Soils with pH values below 6.6 are considered acidic; soils with pH values above 7.3 are characterized as alkaline; and soils with pH values equal to or within the extremes are characterized as neutral (USDA, 1981). Electrical conductivity (EC) is a measure of the concentration of water-soluble salts in soils. Organic matter is the plant and animal residue in the soil at various stages of decomposition. Output for soil properties were manually entered into the soil database residing in the GIS.
Other soil parameters calculated with the Soil Data Viewer included the soil map unit potential for building small commercial buildings and for building dwellings without basements. The dominant component and high tie break rule were used to assign the map units to a class: not limited, somewhat limited, and very limited.
Brief definitions for small commercial buildings and dwellings without basements categories are as follows. Small commercial buildings and dwellings without basements are structures less than three stories high and do not have basements. Ratings are based on soil properties that affect the capacity of the soil to support a load without movement and on the properties that affect excavation and construction costs. Properties influencing load-supporting capacity include depth to a water table, ponding, flooding, subsidence, linear extensibility (shrink-swell potential), and compressibility (which is inferred from the Unified classification of the soil).
Ratings are both verbal and numerical. Rating class terms indicate the extent to which the soils are limited by all of the
soil features that affect the specified use. Verbal ratings include the following classes, not limited, somewhat limited, and very limited. Not limited encompasses soils having very favourable characteristics for the specified use. Good performance and very low maintenance can be expected. Somewhat limited includes soils having features that are moderately favourable for the specified use. The limitations can be overcome or minimized by special planning, design, or installation. Fair performance and moderate maintenance can be expected. Very limited indicates that the soil has one or more features that are unfavourable for the specified use. The limitations generally cannot be overcome without major soil reclamation, special design, or expensive installation procedures. Poor performance and high maintenance can be expected.
No information related to the potential of soils for citrus grove establishment appeared in the SSURGO tables. This information was available in the hard copy version of the soil survey (USDA, 1981). Soils were grouped into the following classes for citrus grove establishment, high, medium, low, questionable, or not suitable. High potential indicated that the performance is at or above the level of locally established standards, the cost of measures for overcoming soil limitations are judged locally to be favourable in relation to the expected performance or yields, and soil limitations that continue after corrective measures are installed do not detract appreciably from environmental quality or economic returns. Medium potential signifies that production or performance is somewhat below locally established standards, the costs of measures for overcoming soil limitations are high, or soil limitations that continue after corrective measures are installed detract from environmental quality or economic returns. Low potential indicates that production or performance is significantly below local standards, measures that are required to overcome soil limitations are very costly, or soil limitations that continue after corrective measures are installed detract appreciably from environmental quality or economic returns. Questionable indicates that not enough evidence existed to determine if the land could or could not be used for citrus grove establishment. Unsuitable means that these soils are not adequate for citrus grove establishment.
The soil survey did not group five soil map units into a potential class. Several steps were taken to try to group the map units into a class; the steps are as follows. The descriptions of the map units were evaluated thoroughly and compared with map units having the same surname. For example, the soil survey did not rate the Harlingen clay-urban complex into a potential class for citrus grove establishment. However, it did provide information on Harlingen clay, which received a rating of not suitable for citrus grove establishment. The Harlingen clay-urban complex consisted of urban areas developed on Harlingen clay soil; therefore, the Harlingen clay-urban complex was categorized as unsuitable for citrus production.
If the nonrated soil could not be placed into a category using the surname procedure, then it was assigned to one of two additional classes, not rated-yield reported and not rated-yield not reported. To create these classes, the Soil Data Viewer was used to determine if citrus yields had been reported for the soil map unit in question. If yield information was reported, then the soil was categorized as not rated for citrus grove establishment-citrus yield reported
Applications of GIS to Citriculture in South Texas 5
(NRYR). If yield information was not provided, then the soil map unit was rated as not rated for citrus grove establishment-no citrus yield reported (NRNYR). The suitability data were transferred to the soil spatial table residing in the Manifold software package.
The citrus database was created in a joint venture between U.S. Department of Agriculture-Animal Plant Inspection Service and U.S. Department of Agriculture- Agricultural Research Service. The 2006 updated version of the database was employed in this study. It consists of spatial and tabular data. The former has polygons representing areas planted to citrus trees and the latter contains attributes for the citrus polygons. Spatial and tabular data were imported directly into the GIS software (Fig. 2). Attributes used in this study were citrus type and active orchards.
To extract the urban area information of Hidalgo County, the TIGER (Topologically Integrated Geographic Encoding and Referencing)/Line 108th CD Census 2000 data were downloaded from the U.S. Census Bureau website (www.census.gov). The TIGER/Line files were created from the Census Bureau’s TIGER database of selected geographic and cartographic information. TIGER was developed by the U.S. Census Bureau to support the mapping and related geographic activities required by the decennial and economic censuses and sample survey programs. The TIGER data were imported into the GIS software for further analysis (Fig. 2).
For this study, information related to Urban Areas was employed to assist in answering management questions. The Census Bureau uses the term Urban Area (UA) to refer collectively to Urbanized Areas (UZA) and Urban Clusters (UC). Urbanized Areas (UZA) is a statistical geographic entity consisting of a central core and adjacent densely settled territory that together contain at least 50,000 people, generally with an overall population density of at least 386 people per square km. Urban Clusters (UC) is a new statistical geographic entity designated by the Census Bureau for the 2000 Census, consisting of a central core and adjacent densely settled territory that together contains between 2,500 and 49,999 people. Typically, the overall population density is at least 386 people per square km. Urban Clusters are based on Census block and block group density and do not coincide with official municipal boundaries.
The soil data was merged with the citrus data by employing the topology overlay function of the GIS software. This function created new polygons containing soil and citrus attributes. Using the newly created data layer and structure query language, the inventory of the selected chemical and physical properties of soils within citrus groves were completed. Structure query language and visual basic script were used throughout the study to select appropriate information from tables, estimate area, or perform mathematical calculations.
At the county level, a thematic map showing the potential of the soil map units for citrus grove establishment was developed to assist in selecting new areas for establishing citrus groves. A thematic map showing the census urban area data, citrus location data, and high potential soil citrus grove establishment data versus the building site development data was evaluated to determine alternative sites for establishing citrus groves.
Note: The spatial data utilized for the study were projected to a coordinate system and datum by the various entities that created the data. For this study, the final coordinate system and datum used for the maps were Universal Transmercator (Zone 14 N) and North American Datum 1983, respectively.
It was difficult to display the citrus polygons onto thematic maps. For illustrative purposes, centroids (points) extracted from the polygons of the citrus-soil spatial layer was used to represent the locations of citrus groves.
Results and discussionCitrus inventory by type: Summarized in Table 1 is the overall statistics created with the combined citrus-soil database. The total area encompassed by active orchards was 9214.7 ha. Grapefruit and oranges were the dominant citrus types, covering 66% and 33% of the total area, respectively. Tangelos (C. x tangelo Ingram and Moore), tangerines (C. reticula Blanco), and lemons [C. x limon (L.) Burm.f.] were included in the citrus survey; their total area of coverage was less than 1%.
Figs. 3-5 show how the GIS can be used to display the spatial distribution of the orchards at the county level based on citrus type. Grapefruit and orange groves were scattered throughout the south central region of the county (Figs. 3 and 4). Lemons, tangelos, and tangerines were established in isolated areas within the county (Fig. 5).
Soil physical data of citrus groves: The soil physical data indicated that producers established their groves on soils with high potential for citrus grove establishment (Table 1). Thirty-four percent of citrus production occurred on soils with lower ratings. The dominant soil mapping units for citrus grove establishment was Brennan fine sandy loam, 0 to 1% slopes; followed by Hidalgo sandy clay loam, 0 to 1% slopes; Hidalgo fine sandy
Fig. 3. Spatial distribution of active grapefruit orchards within Hidalgo County.
6 Applications of GIS to Citriculture in South Texas
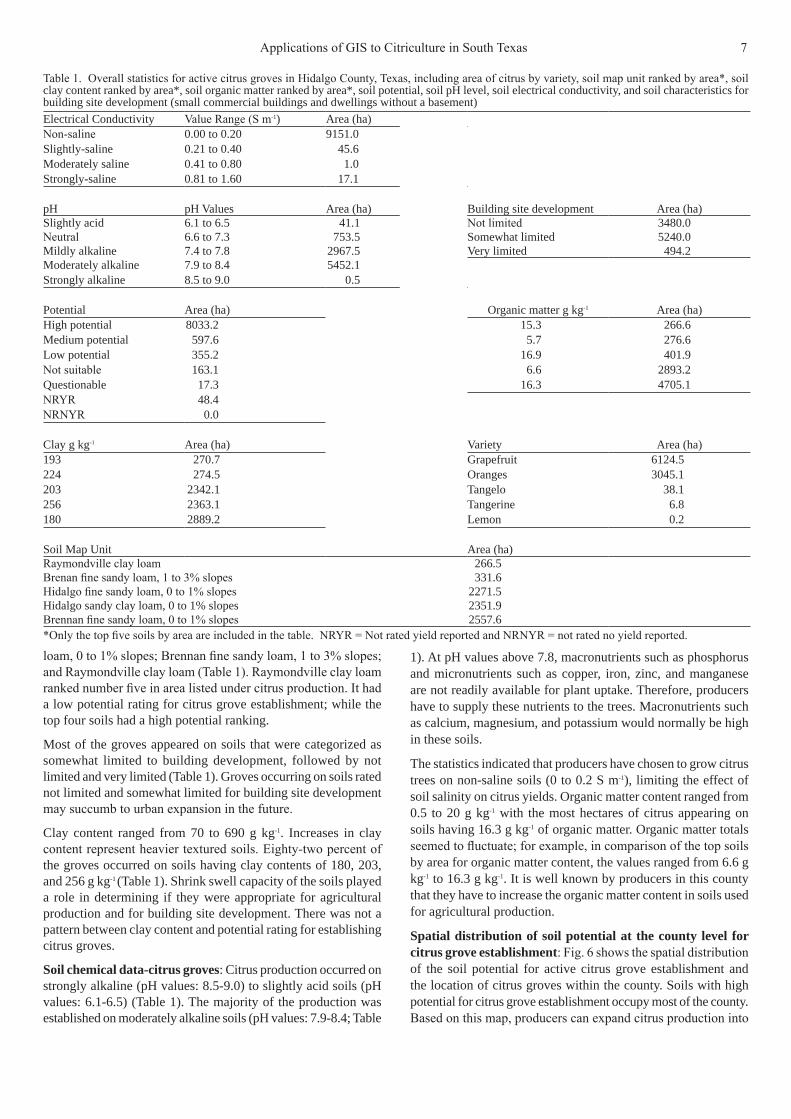
loam, 0 to 1% slopes; Brennan fine sandy loam, 1 to 3% slopes; and Raymondville clay loam (Table 1). Raymondville clay loam ranked number five in area listed under citrus production. It had a low potential rating for citrus grove establishment; while the top four soils had a high potential ranking.
Most of the groves appeared on soils that were categorized as somewhat limited to building development, followed by not limited and very limited (Table 1). Groves occurring on soils rated not limited and somewhat limited for building site development may succumb to urban expansion in the future.
Clay content ranged from 70 to 690 g kg-1. Increases in clay content represent heavier textured soils. Eighty-two percent of the groves occurred on soils having clay contents of 180, 203, and 256 g kg-1 (Table 1). Shrink swell capacity of the soils played a role in determining if they were appropriate for agricultural production and for building site development. There was not a pattern between clay content and potential rating for establishing citrus groves.
Soil chemical data-citrus groves: Citrus production occurred on strongly alkaline (pH values: 8.5-9.0) to slightly acid soils (pH values: 6.1-6.5) (Table 1). The majority of the production was established on moderately alkaline soils (pH values: 7.9-8.4; Table
1). At pH values above 7.8, macronutrients such as phosphorus and micronutrients such as copper, iron, zinc, and manganese are not readily available for plant uptake. Therefore, producers have to supply these nutrients to the trees. Macronutrients such as calcium, magnesium, and potassium would normally be high in these soils.
The statistics indicated that producers have chosen to grow citrus trees on non-saline soils (0 to 0.2 S m-1), limiting the effect of soil salinity on citrus yields. Organic matter content ranged from 0.5 to 20 g kg-1 with the most hectares of citrus appearing on soils having 16.3 g kg-1 of organic matter. Organic matter totals seemed to fluctuate; for example, in comparison of the top soils by area for organic matter content, the values ranged from 6.6 g kg-1 to 16.3 g kg-1. It is well known by producers in this county that they have to increase the organic matter content in soils used for agricultural production.
Spatial distribution of soil potential at the county level for citrus grove establishment: Fig. 6 shows the spatial distribution of the soil potential for active citrus grove establishment and the location of citrus groves within the county. Soils with high potential for citrus grove establishment occupy most of the county. Based on this map, producers can expand citrus production into
Table 1. Overall statistics for active citrus groves in Hidalgo County, Texas, including area of citrus by variety, soil map unit ranked by area*, soil clay content ranked by area*, soil organic matter ranked by area*, soil potential, soil pH level, soil electrical conductivity, and soil characteristics for building site development (small commercial buildings and dwellings without a basement)Electrical Conductivity Value Range (S m-1) Area (ha)Non-saline 0.00 to 0.20 9151.0 Slightly-saline 0.21 to 0.40 45.6Moderately saline 0.41 to 0.80 1.0Strongly-saline 0.81 to 1.60 17.1
pH pH Values Area (ha) Building site development Area (ha)Slightly acid 6.1 to 6.5 41.1 Not limited 3480.0Neutral 6.6 to 7.3 753.5 Somewhat limited 5240.0Mildly alkaline 7.4 to 7.8 2967.5 Very limited 494.2Moderately alkaline 7.9 to 8.4 5452.1 Strongly alkaline 8.5 to 9.0 0.5
Potential Area (ha) Organic matter g kg-1 Area (ha)High potential 8033.2 15.3 266.6Medium potential 597.6 5.7 276.6Low potential 355.2 16.9 401.9Not suitable 163.1 6.6 2893.2Questionable 17.3 16.3 4705.1NRYR 48.4NRNYR 0.0
Clay g kg-1 Area (ha) Variety Area (ha)193 270.7 Grapefruit 6124.5224 274.5 Oranges 3045.1203 2342.1 Tangelo 38.1256 2363.1 Tangerine 6.8180 2889.2 Lemon 0.2
Soil Map Unit Area (ha)Raymondville clay loam 266.5Brenan fine sandy loam, 1 to 3% slopes 331.6Hidalgo fine sandy loam, 0 to 1% slopes 2271.5Hidalgo sandy clay loam, 0 to 1% slopes 2351.9Brennan fine sandy loam, 0 to 1% slopes 2557.6*Only the top five soils by area are included in the table. NRYR = Not rated yield reported and NRNYR = not rated no yield reported.
Applications of GIS to Citriculture in South Texas 7

the north central section of the county. If they have to settle for using soils with medium potential for citrus grove establishment, then areas in the extreme western and the central north east section of the county are adequate. Soils having low potential would be their last alternative. These areas are scattered throughout the county.
Spatial distribution of high soil potential for citrus vs building site development, urban area, and citrus grove location: A thematic map showing high potential soils for citrus grove
establishment versus the building development categories are shown in Fig. 7. High potential soils were chosen for map development because they were the soils of choice for growers to establish citrus groves (Table 1). Combinations mapped were
Fig. 7. Thematic map showing the high soil potential for citrus grove establishment vs soil potential for building site development, urban area identified by the 2000 census, and the location of citrus groves based on citrus polygons and soil interactions in Hidalgo County. HPC = high potential for citrus grove establishment, NLB = not limited for building site development, and SWLB = somewhat limited for building site development.
Fig. 4. Spatial distribution of active orange orchards within Hidalgo County.
Fig. 6. Thematic map showing the soil potential for citrus grove establishment and the location of active citrus groves based on citrus polygons and soil interactions in Hidalgo County.
Fig. 5. Spatial distribution of active lemon, tangelo, and tangerine orchards in Hidalgo County.
8 Applications of GIS to Citriculture in South Texas

high potential for citrus grove development and some what limited potential for building site development (92300 ha) and high potential for citrus grove establishment and the some what limited for building development combination (71300 ha). None of the soils were classified into the high potential for citrus grove establishment and very limited potential for building site development class. Soils ranked into this category would have been an ideal choice for establishing citrus groves. Results specify that prime land for citrus grove establishment can have a rank of not limited or somewhat limited for building site development.
The urban area 2000 census map overlaid onto the citrus and soil layers was helpful in indentifying citrus groves appearing in urban areas (Fig. 7). Thirty-four percent of the citrus production occurred in urban areas. In these areas, buildings are continuously being built because of the increase of population. Therefore, some of these groves may be lost to commercial building over time. In the future, citrus producers may have to get accustomed to the concept of urban farming, the growing, processing, and distribution of food through intensive plant cultivation in and around cities (Bailkey and Nasr, 1999). This practice could limit treatments commonly used to control pests in citrus orchards. To reduce potential losses to urban expansion, it is believed that new groves should be established as far as possible from the urban area boundaries. It appears that the northwest central and the northeast central regions of the county would be ideal choices for establishing new groves. The overall results of this study concurred with others in that GIS technology is valuable for assessing and for managing agricultural resources (Richardson et al., 1996; Boonyanuphap et al., 2004; Mandal and Sharma, 2006).
Results of this study showed that citrus, SSURGO, and U.S. census spatial and tabular data integrated with GIS technology can be a powerful tool for citriculture. This information was
employed to inventory soil chemical and physical properties within citrus groves of Hidalgo County, Texas, to estimate and to identify orchards that may be affected by urban expansion, and to select potential sites for establishing new citrus orchards. The techniques used in this study and findings of the study should appeal to the citrus industry in the U.S. and abroad.
Acknowledgments: I thank Dr. David Bartells and Mr. Russel Sheets for supplying the citrus database.
ReferencesBailkey, M. and J. Nasr, 1999. From brown fields to green fields:
Producing food in North American cities. Community Fd. Security News, Fall 1999/Winter 2000: 7.
Boonyanuphap, J., D. Wattanachaiyingcharoen and K. Sakurai, 2004. GIS-based land suitability assessment for Musa (ABB group) plantation. J. Appl. Hort., 6(1): 3-10.
Mandal, A.K. and R.C. Sharma, 2006. Computerized database of salt-affected soils for agro-climatic regions in the Indo-Gangetic Plain of India using GIS. Geocarto Intl., 21(2): 47-57.
National Soil Survey Center, 1995. Soil Survey Geographic (SSURGO) Data Base: Data Use Information. USDA NRCS Misc. Publ. no. 1527. Natural Resources Conservation Serv., Fort Worth, TX.
Ray, R. and L. Walheim, 1980. Citrus, How to Select, Grow, and Enjoy. Hort. Publishing Co., Inc. Tucson, AZ.
Richardson, A.J., C.L. Wiegand, G.L. Anderson and A.H. Gerbermann, 1996. Six exemplary applications of GIS technology to subtropical Texas agriculture and natural resources. Gecarto Intl., 11(1): 49-60.
USDA. 1981. Soil Survey of Hidalgo County, Texas. U.S. Govt. Printing Office, Washington, D.C.
Wu, J., M.D. Nellis, M.D. Ransom, K.P. Price and S.L. Egbert, 1997. Evaluating soil properties of CRP land using remote sensing and GIS in Finney County, Kansas. J. Soil Water Conserv., 52: 352-358.
Wu, J., M.D. Ransom, G.J. Kluitenberg, M.D. Nellis and H.L. Seyler, 2001. Land-use management using a soil survey geographic database for Finney County, Kansas. Soil Sci. Soc. Amer. J., 65: 169-177.
Applications of GIS to Citriculture in South Texas 9