Embed Size (px)
Citation preview

13
Applications of FTIR on Epoxy Resins – Identification, Monitoring the Curing
Process, Phase Separation and Water Uptake
María González González, Juan Carlos Cabanelas and Juan Baselga University Carlos III of Madrid
Spain
1. Introduction
Epoxy resins are a family of thermosetting materials widely used as adhesives, coatings and matrices in polymer composites because of the low viscosity of the formulations, good insulating properties of the final material even at high temperatures and good chemical and thermal resistance (May, 1988). Epoxy thermosets can be described as 3D polymer networks formed by the chemical reaction between monomers (“curing”). This 3D covalent network structure determines the properties of thermosetting polymers: unlike thermoplastics, this kind of polymers does not melt, and once the network has been formed the material cannot be reprocessed. Maybe one of the main advantages of epoxy thermosets is that the starting monomers have low viscosity so that complex geometries can be easily shaped and fixed after curing the monomers. Thus the formation of the network via chemical reaction is a key aspect in this kind of materials.
Epoxy formulations usually include more than one component, although there are different crosslinking mechanisms involving either chemical reaction between one single type of monomer (homopolymerization) or two kinds of monomers with different functional groups. In both cases, a common constituent is always found: the epoxy monomer. The main feature of the epoxy monomer is the oxirane functional group, which is a three member ring formed between two carbon atoms and an oxygen, as shown in Figure 1. This atomic arrangement shows enhanced reactivity when compared with common ethers because of its high strain. Due to the different electronegativity of carbon and oxygen, the carbon atoms of the ring are electrophilic. Thus epoxies can undergo ring opening reactions towards nucleophiles. The polarity of the oxirane ring makes possible detection by IR spectroscopy.
There are mainly two families of epoxies: the glycidyl epoxies and non-glycidyl epoxies (also called aliphatic or cycloaliphatic epoxy resins). The absence of aromatic rings in aliphatic epoxies makes them UV resistant and suitable for outdoor applications and also reduces viscosity. The most common epoxy monomers of each family are diglycidylether of bisphenol A (known as DGEBA) and 3,4-Epoxycyclohexyl-3’4’-epoxycyclohexane carboxylate (ECC) respectively and their structures are given in Figure 2 (a, b). Cycloaliphatic resins are usually found in the form of pure chemicals with a definite
www.intechopen.com

Infrared Spectroscopy – Materials Science, Engineering and Technology
262
Fig. 1. Oxirane ring
Fig. 2. Chemical structures of common epoxy resins: a) 2,2-Bis[4-(glycidyloxy)phenyl] propane (DGEBA); b) 3,4-Epoxycyclohexylmethyl-3,4-epoxycyclohexane carboxylate (ECC); c) DGEBA oligomer, n = 0.2 typically.
molecular mass. But DGEBA-based resins are synthesized via the addition of
epichlorohydrine and bisphenol A so oligomers with a relatively narrow distribution of
polymerization degrees are obtained instead; their chemical structure is presented in Figure
2 (c) where n is typically 0.2. DGEBA oligomers typically contain a certain amount of
hydroxyl groups, that play an important catalytic role in the kinetics of the curing process,
providing a higher viscosity which is dependent on n. In addition, all of them have at least
two oxirane functional groups, so they can finally lead to the 3D network. The nature and
functionality of the epoxy monomer will determine its reactivity as well as the properties
and performance of the final material.
Despite of having the same main functional group, the reactivity of both families of epoxies
is completely different as a consequence of the structure of the molecules. It is worthy to
note that the linkage between the aromatic ring and the oxygen (ether) in DGEBA has a
strong electron-withdrawing effect that makes the oxirane group highly reactive towards
nucleophilic compounds (like amines), unlike the cyclohexyl group in aliphatic epoxies
which is reactive towards Lewis acids like anhydrides (Mark, 2004). Additionally, a
protecting effect of axial and equatorial protons of the cyclohexyl ring against nucleophilic
attack has been proposed as an explanation of the characteristic low reactivity of the oxirane
ring in these aliphatic epoxies (Soucek et al., 1998). This way, the best performance and the
highest crosslinking degree for DGEBA-based resins is achieved when cured via an addition
mechanism with diamines (either aliphatic or aromatic), whilst cycloaliphatic epoxies are
commonly cured with anhydrides (Barabanova et al., 2008; Chen et al., 2002; Tao et al., 2007;
www.intechopen.com
Applications of FTIR on Epoxy Resins – Identification, Monitoring the Curing Process, Phase Separation and Water Uptake
263
Wang et al., 2003) or homopolymerized via a cationic mechanism induced by UV radiation
(Crivello, 1995; Crivello & Fan,1991; Crivello & Liu, 2000; Hartwig et al., 2003; Wang &
Neckers. 2001; Yagci & Reetz, 1998).
The chemical reactivity of the epoxies enables using a wide variety of molecules as curing
agents depending on the process and required properties. The commonly used curing
agents for epoxies include amines, polyamines, polyamides, phenolic resins, anhydrides,
isocyanates and polymercaptans. The choice of both the resin and the hardener depends on
the application, the process selected, and the properties desired. It is worthy to note that the
reaction mechanism, the curing kinetics and the glass transition temperature (Tg) of the final
material are also dependent on the molecular structure of the hardener. As it has been
previously mentioned, amines are the best performance curing agents for diglycidylether-
type epoxies. Aliphatic diamines like m-xylylenediamine or 1,2-trans-cyclohexyldiamine can
be used for curing from room to moderate temperatures (Paz-Abuin, 1997a, 1997b, 1998),
although the glass transition temperature of the material is also moderate. For high Tg
materials aromatic amines, like 4,4´- methylen- bis (3- chloro- 2,6- diethylaniline) or 4,4´-
diaminodiphenyl sulphone (Blanco et al., 2004; Girard-Reydet et al., 1999; Marieta et al.,
2003; Siddhamalli, 2000a) are used, although high curing temperatures are needed.
1.1 Curing process. Gelation and vitrification. Conversion degree
The curing process is the set of chemical reactions that leads to the formation of a highly
crosslinked 3D network. For epoxy/amine the chemical process that leads to network
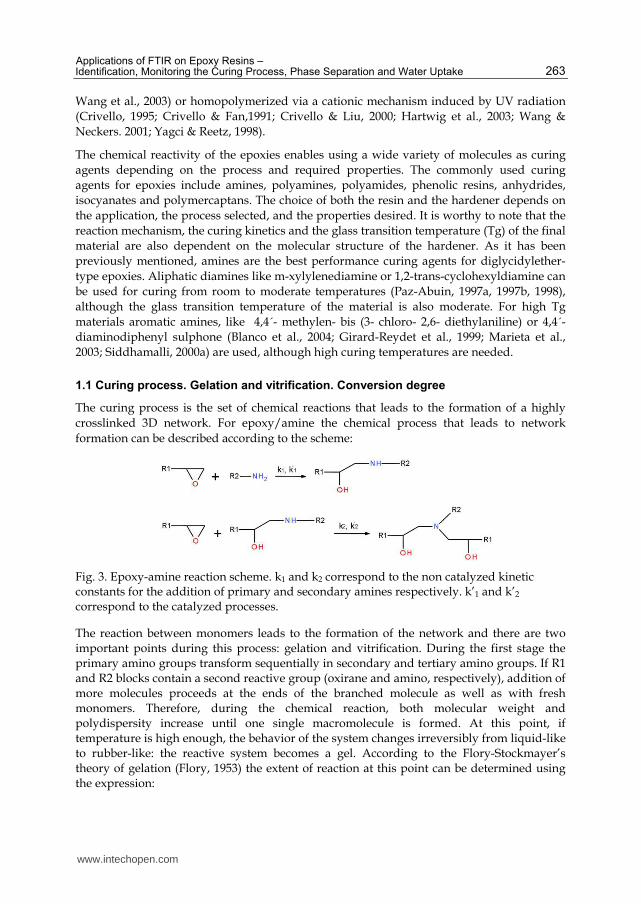
formation can be described according to the scheme:
Fig. 3. Epoxy-amine reaction scheme. k1 and k2 correspond to the non catalyzed kinetic constants for the addition of primary and secondary amines respectively. k’1 and k’2 correspond to the catalyzed processes.
The reaction between monomers leads to the formation of the network and there are two important points during this process: gelation and vitrification. During the first stage the primary amino groups transform sequentially in secondary and tertiary amino groups. If R1 and R2 blocks contain a second reactive group (oxirane and amino, respectively), addition of more molecules proceeds at the ends of the branched molecule as well as with fresh monomers. Therefore, during the chemical reaction, both molecular weight and polydispersity increase until one single macromolecule is formed. At this point, if temperature is high enough, the behavior of the system changes irreversibly from liquid-like to rubber-like: the reactive system becomes a gel. According to the Flory-Stockmayer’s theory of gelation (Flory, 1953) the extent of reaction at this point can be determined using the expression:
www.intechopen.com
Infrared Spectroscopy – Materials Science, Engineering and Technology
264
1
1 1( )( )gel gel
e af f
Where gel and gel are epoxy and amine conversions at the gel point and fe and fa are the functionality of the epoxy and amine components respectively (fe = 2 and fa = 4 typically, so
under stoichiometric conditions, gel point appears at ge l = gel = 0.57) . Gelation usually has no effect on the curing kinetics.
Common diamines with relatively small molecular volume act as crosslinking points of the 3D network (since each diamine has four active hydrogen atoms, they can be visualized as points in space from which four chains emerge, each of them connecting other points of the network). As the reaction proceeds, along with molecular weight, the crosslinking degree of the system increases, and so the viscosity and the glass transition temperature (Tg). In those processes in which curing temperature is not very high, Tg of the reacting mixture may reach the curing temperature value; then, molecular mobility becomes severely restricted so diffusion of reactants controls the kinetics and the reaction rate decreases dramatically. At this point, the reaction becomes almost stopped and the properties of the material (at room temperature) depend on the extent of the reaction achieved. Unlike gelation, vitrification is a reversible process, so when heating above Tg the reaction is reactivated and higher conversions are attained. Postcuring processes, which are designed to allow volume and internal stresses relaxation, make use also of this chemical reactivation and have deep effects on the mechanical performance of these systems.
The extent of reaction is very commonly determined by differential scanning calorimetry (DSC) as the ratio between the heat released by the reaction at each moment and the total heat released. Although this procedure is useful, accuracy at high conversions is low and problems arise when monitoring fast reactions. Additionally, DSC only provides an overall conversion degree being impossible to independently determine epoxy and amine conversions. On the contrary, infrared spectroscopy allows a very accurate determination of both conversions by band integration of the corresponding IR signals (epoxy and amino) being low the integration error and allowing more accurate values at high conversions. Considering the reaction
mechanism, we can define the extent of reaction in terms of epoxy groups () and in terms of N-H bonds (β) from the areas of the oxirane ring and the N-H absorptions respectively:
0 0
0 0
( ) ( ) ( ) ( )
( ) ( )e e N H N H
e N He N H
A A t A A t
A A
(1)
In equation (1) subscript “e” indicates epoxy, “N-H” amine, “0” initial and “t” indicates a certain reaction time. Although epoxy and amino groups have absorptions in the mid-range, more accurate results are obtained working in the near range
1.2 Epoxy blends. Reaction induced phase separation
The main drawback of epoxy thermosets is its brittleness. To solve this problem, they are
commonly modified with reinforcements of different nature (elastomers, thermoplastics,
inorganic particles), geometry (particles, fibers, platelets) and size (micro and nano) which
provide additional mechanical energy absorption mechanisms. The dispersion of a second
phase can be obtained using mainly two strategies (Pascault et al., 2002):
www.intechopen.com

Applications of FTIR on Epoxy Resins – Identification, Monitoring the Curing Process, Phase Separation and Water Uptake
265
- Directly mixing preformed particles in the starting monomers. The initial system is therefore heterogeneous.
- Reaction induced phase separation (RIPS) from a homogeneous initial mixture. A third component which is initially soluble in the epoxy precursors but segregates during the chemical reaction (usually a thermoplastic or an elastomer) is incorporated in the system. Segregation generates the final two-phase morphology.
Morphology development in modified thermosets takes place essentially between the
“cloud point” conversion (beginning of the phase separation) and the gel point conversion
(Bucknall & Partridge, 1986; Inoue, 1995; Mezzenga et al., 2000a), although it keeps evolving
up to the vitrification of the system. Thermodynamics is the driving force for RIPS, but
diffusion kinetics between phases is the controlling factor from the gel point on (Kiefer et al.,
1996; Rajagopalan et al., 2000).
As a consequence of phase separation particles or domains of very small size and different
refraction index appear. When they are big enough they become light scatterers and the
mixture becomes cloudy in the visible range. But the size of domains plays with the
wavelenght, so IR radiation can also be used to determine the onset of phase separation and
characterize the growth of the nascent structures.
2. Epoxy resins and FTIR
For in-situ monitoring processes such as curing, phase separation or even ageing, the
interpretation of the spectra and the assignment of the bands are critical.
Mid infrared spectroscopy has been widely used for characterization of organic compounds and plenty of reliable information and spectra libraries can easily be found. Both qualitative and quantitative information can be obtained by this technique, although its use in epoxy systems is quite restricted because of the location and intensity of the oxirane ring absorptions. Two characteristic absorptions of the oxirane ring are observed in the range between 4000 cm-1 and 400 cm-1. The first one, at 915 cm-1, is attributed to the C-O deformation of the oxirane group, although some works done by Dannenberg (Dannenberg & Harp, 1956) showed that this band does not correspond exclusively to this deformation but also to some other unknown process. The second band is located at 3050 cm-1 approximately and is attributed to the C-H tension of the methylene group of the epoxy ring. This band is not very useful since its intensity is low and it is also very close to the strong O-H absorptions; but in low polymerization degree epoxy monomers it can be used as a qualitative indicative of the presence of epoxy groups.
Near IR is far more useful for epoxies. nIR spectrum covers the overtones of the strong vibrations in mIR and combination bands. In this range, fewer and less overlapped bands are observed so it has been used by several authors (Mijovic & Andjelic, 1995; Poisson et al., 1996; Xu & Schlup, 1998) for monitoring the curing reaction. The intensity of the bands in this region is much lower than in the mid range, allowing the use of thicker and undiluted samples to get good quality data. There are two absorptions related with the oxirane group in this region:
a. 4530 cm-1: It corresponds to a combination band of the second overtone of the epoxy ring stretching with the fundamental C-H stretching at 2725 cm-1 (Chicke et al., 1993).
www.intechopen.com

Infrared Spectroscopy – Materials Science, Engineering and Technology
266
Anyway, this band is sufficiently separated from others and is suitable for quantitative analysis (Mijovic et al., 1995; Paz-Abuín et al., 1997a; Poisson et al., 1996; Xu & Schlup, 1998).
b. 6070 cm-1: First overtone of terminal CH2 stretching mode (Musto et al., 2000). This band interferes with the aromatic C-H stretching overtone at 5969 cm-1 (Xu et al., 1996), so in case there are aromatic rings in the structure (i.e. DGEBA) is not suitable for quantification.
2.1 Characterizing epoxy resins by IR
Characterization of epoxies involves much more than the location of the oxirane ring bands. There are many epoxy resins with different structures, different polimerization degrees...etc. IR spectroscopy can be used to characterize the nature of the epoxy. Figure 4 shows the mIR and nIR spectra of two similar epoxy resins: Diglycidylether of bisphenol A (DGEBA) and its hydrogenated derivative (HDGEBA).
Fig. 4. FTIR spectra of DGEBA and HDGEBA in the medium and near ranges
The difference between both resins is the absence of aromatic rings in HDGEBA, which conditions both the properties (Tg, viscosity...etc) and reaction rate towards amines. Table 1 shows the assignation of bands for both resins in the mid range. The C-O deformation band is centered at 915 cm-1 in DGEBA and at 909 cm-1 in HDGEBA. C-H stretching of terminal oxirane group is observed in both cases at 3050 cm-1. The broad band at 3500 cm-1 is assigned to O-H stretching of hydroxyl groups, revealing the presence of dimers or high molecular weight species. There are also bands corresponding to the ether linkage located at 1000-1100 cm-1 in both cases. In HDGEBA no signals corresponding to neither aromatic rings nor double bonds are observed, so these two epoxies can be easily distinguished through these bands.
Spectra in the near range are shown in Figure 4 also and assignments in Table 2. The combination band of the second overtone of the epoxy ring stretching with the fundamental C-H stretching is centered at 4531 cm-1 in DGEBA and at 4526 cm-1 in HDGEBA. The region from 4000 to 4500 cm-1 contains the overtones from the fingerprint of the molecule.
The hydroxyl bands are sometimes useful for characterization although its quantitative use is very limited. Their presence is associated to the use of oligomers of low polymerization
www.intechopen.com

Applications of FTIR on Epoxy Resins – Identification, Monitoring the Curing Process, Phase Separation and Water Uptake
267
Resin Band (cm-1) Assignment
DGEBA
3500 O-H stretching
3057 Stretching of C-H of the oxirane ring
2965- 2873 StretchingC-H of CH2 and CH aromatic and aliphatic
1608 Stretching C=C of aromatic rings
1509 Stretching C-C of aromatic
1036 Stretching C-O-C of ethers
915 Stretching C-O of oxirane group
831 Stretching C-O-C of oxirane group
772 Rocking CH2
HDGEBA
3500 O-H stretching
3052 Stretching of C-H of the oxirane ring
2937- 2862 StretchingC-H of CH2 and CH
1448 Deformation C-H of CH2 and CH3
1368 Deformation CH3 of C-(CH3)2
1098 Stretching C-O-C of ethers
909 Stretching C-O of oxirane group
846 Stretching C-O-C of oxirane group
759 Rocking CH2
Table 1. Characteristic bands of DGEBA and HDGEBA in the mid IR.
Resin Band (cm-1) Assignment
DGEBA
7099 O-H overtone
6072 First overtone of terminal CH2 stretching mode
5988- 5889 Overtones of -CH and -CH2 stretching
5244 Combination asymmetric stretching and bending of O-H
4623 Overtone of C-H stretching of the aromatic ring
4531 Combination band of the second overtone of the epoxy ring stretching with the fundamental C-H stretching
4066 Stretching C-H of aromatic ring
HDGEBA
7028 O-H overtone
6060 First overtone of terminal CH2 stretching mode
5840- 5734 Overtones of -CH and -CH2 stretching
5239 Combination assymetric stretching and bending of O-H
4526 Combination band of the second overtone of the epoxy ring stretching with the fundamental C-H stretching
Table 2. Characteristic bands of DGEBA and HDGEBA in the near IR. (George et al., 1991; Mijovic et al., 1995).
www.intechopen.com
Infrared Spectroscopy – Materials Science, Engineering and Technology
268
degree, as shown in Figure 2. In the mid range, quantification of OH is quite difficult
because of the shape and overlapping of the band at around 3500 cm-1. In the near range, the
absorption of the first O-H overtone is located at around 7000 cm-1, and although it has been
used for quantification, no good results were obtained because of its weakness.
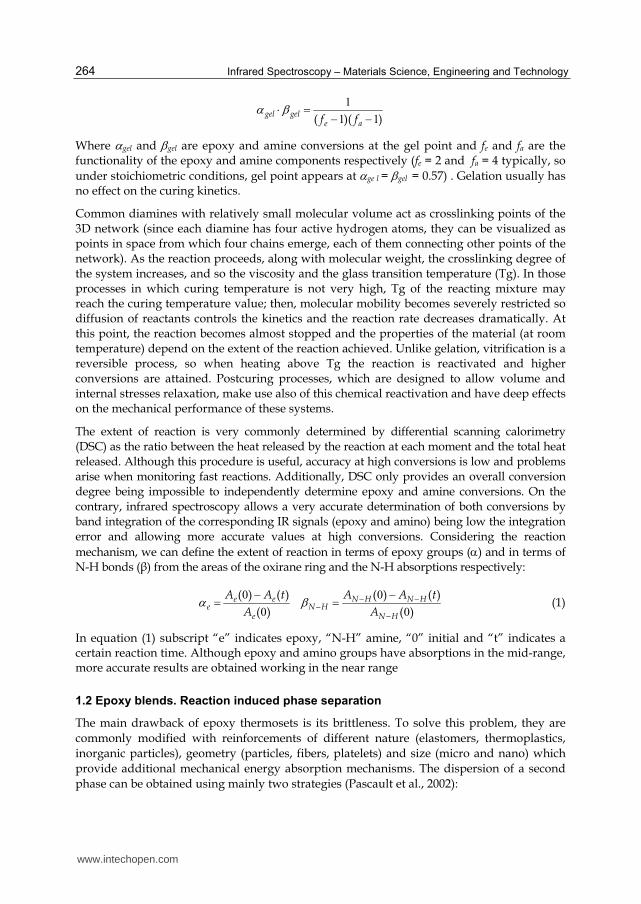
3,4-Epoxycyclohexyl-3’4’-epoxycyclohexane carboxylate (ECC) is probably the most
common cycloaliphatic epoxy. The oxirane ring is in this case located in a six-member
aliphatic cycle (Figure 2), shifting its absorptions in the mid range towards lower wave
numbers, so the main absorption band is located at 790 cm-1 (Figure 5). This band has been
used for quantitative analysis of photochemical reactions (Hartwig et al., 2002; Kim et al.,
2003). Apart from the oxirane absorptions this resin shows the bands corresponding to the
stretching C-O-C of ethers (1100 cm-1) and the C=O stretching (1730 cm-1) of esters, which
can be useful for identification.
Fig. 5. FTIR spectra of ECC in the mid and near ranges
In the near range (Figure 5), it is worthy to note that the oxirane combination band
(bending+ stretching) usually located at around 4530 cm-1 for common epoxies cannot be
observed in the nIR spectrum of ECC probably because it may be overlapped with C-H
combination bands. Neither the C=O second overtone (usually located at around 5100-5200
cm-1) is clearly observed. The main features observed in the spectrum are only the overtones
of C-H and CH2 stretching bands. Although near infrared spectroscopy does not provide
much useful information for this resin, it can still be used for monitoring the curing process
through the evolution of the bands assigned to the curing agent (M. Gonzalez et al., 2011).
2.2 Characterizing diamine hardeners by IR
Among all the curing agents used to obtain epoxy thermosets, this chapter will be focused
on one specific type: diamines. Their high reactivity is attributed to the high nucleophilicity
of the nitrogen atom of the amino group although it is conditioned by its chemical structure.
For instance, aliphatic diamines such as ethylene diamine, show a very high reactivity, while
substituted aromatic amines like 4,4´-methylene-bis(3-chloro-2,6-diethylaniline) show lower
reactivity because of the electronic effects of the aromatic ring and the susbstituents.
The amino group shows well defined absorptions both in the mid and in the near infrared
ranges. The main absorptions in the mid range are stretching and deformation of N-H
bonds. These bands also reflect some differences between primary and secondary amines:
www.intechopen.com
Applications of FTIR on Epoxy Resins – Identification, Monitoring the Curing Process, Phase Separation and Water Uptake
269
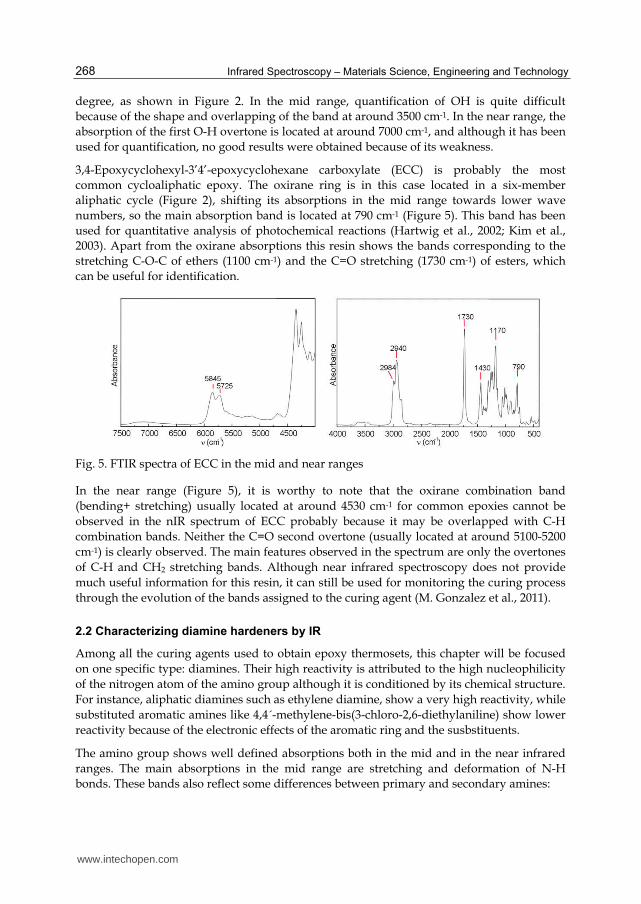
- Although the N-H stretching is located between 3500 and 3300 cm-1, primary amines show a doublet (reflecting the symmetric and antisymmetric stretching modes) while the secondary amines show one single band.
- The N-H deformation is located at 1650- 1500 cm-1 in primary amines, while in secondary amines it is shifted towards lower wavenumbers (1580- 1490 cm-1) and is usually weak.
The quantitative use of these bands is limited because of its position in the spectra: the N-H stretching is very close to the strong O-H absorption band (minimal amount of water perturbs its area), while the deformation band is located in the region where many signals corresponding to organic bonds appear.
Fig. 6. mIR and nIR spectra of metaxylylenediamine
In the near range, the bands of amines are well defined and intense. There are also differences between the absorptions of primary and secondary amines. Primary amines N-H stretching first overtone is composed of two bands (symmetric and antisymmetric) located between 6897 cm-1 and 6452 cm-1, being the symmetric more intense. For secondary amines there is a single band. When both species coexist, this band cannot be used because the two bands overlap. Combination of N-H stretching and bending is observed at around 4900-5000 cm-1, and it can be used for quantitative purposes. (Weyer & Lo, 2002). Example spectra of diamines in both ranges are shown in Figure 6.
3. Curing process
3.1 Monitoring the curing process
As shown in Figure 3, curing of epoxy resins with diamines can be described as a two step reaction: Firstly an epoxy group reacts with a primary amine yielding a secondary amine, which in the second step reacts with another epoxy group yielding a tertiary amine
Considering these chemical reactions, the process can be monitored through the evolution of concentration of epoxy groups, primary amines or in some extent, secondary amines. The concentration of species is quantitatively related to the area of the absorption band only in the linear region, where Lambert Beer’s law is satisfied. Taking this into account, changes in concentration of epoxy groups may be determined by mIR measuring the area of the absorption bands at ≈ 3050 cm-1 or at 900 cm-1.
www.intechopen.com

Infrared Spectroscopy – Materials Science, Engineering and Technology
270
Nevertheless, following curing by IR is not always easy, because the epoxy band at higher wavenumbers shows low sensitivity to changes in concentration as a consequence of its intrinsic low intensity and the 900 cm-1 band may be affected by the uncleanliness of the region where it is located. This may induce some uncertainty at the final stages of reaction when the concentration of epoxy groups is small. On the other hand, the quantification of primary and secondary amines in epoxy/amine reactive systems is not possible since the band corresponding to primary amines overlaps both with the band corresponding to secondary amines and the one corresponding to hydroxyl groups, which are species appearing as a consequence of the advance of the chemical reaction. Despite all these facts, mIR has been successfully used for monitoring the epoxy amine chemical reaction in several cases (Nikolic et al., 2010).
Fortunately nIR can be safely used for quantitatively monitor the chemical reaction (Paz- Abuin et al., 1997a, 1997b; Mijovic & Andjelic 1995a; Mijovic et al. 1995). In this region we can find well defined bands free of overlapping related with the epoxy and primary amine: the combination band of the second overtone of the epoxy ring stretching with the fundamental C-H stretching (≈ 4530 cm-1) and the combination band of NH stretching and bending (≈ 4900-5000 cm-1). In Figure 7, a typical spectral evolution on cure can be observed.
Fig. 7. Time evolution of FTnIR spectra during the isothermal curing at 70 ºC of the stoichiometric HDGEBA/poly(3-aminopropylmethyl)siloxane system.
The reaction mechanism indicates that the epoxy concentration decreases, and this is observed in the spectra as the decrease of the band centered at ≈ 4530 cm-1 and also of the weak overtone of terminal CH2 at ≈ 6060 cm-1. The primary amine combination band decreases too (≈ 4900 cm-1), and once it is exhausted it can be observed that there are still epoxy groups in the reaction media, which will react with the previously formed secondary amines up to vitrification or until the reaction is completed. The band correponding to O-H overtones (≈ 7000 cm-1) also increases during curing as a consequence of the oxirane ring-opening, although this band is not suitable for quantification because of the low signal/noise ratio. The behavior of the band located at ≈ 6500 cm-1 is more complex: in this
www.intechopen.com
Applications of FTIR on Epoxy Resins – Identification, Monitoring the Curing Process, Phase Separation and Water Uptake
271
region the overtones of both primary and secondary amines overlap, so an initial decrease is observed, followed by an increase and a shift towards lower wavenumbers (because of the generation of secondary amines) and a final decrease consequence of the transformation of secondary amines into tertiary amines.
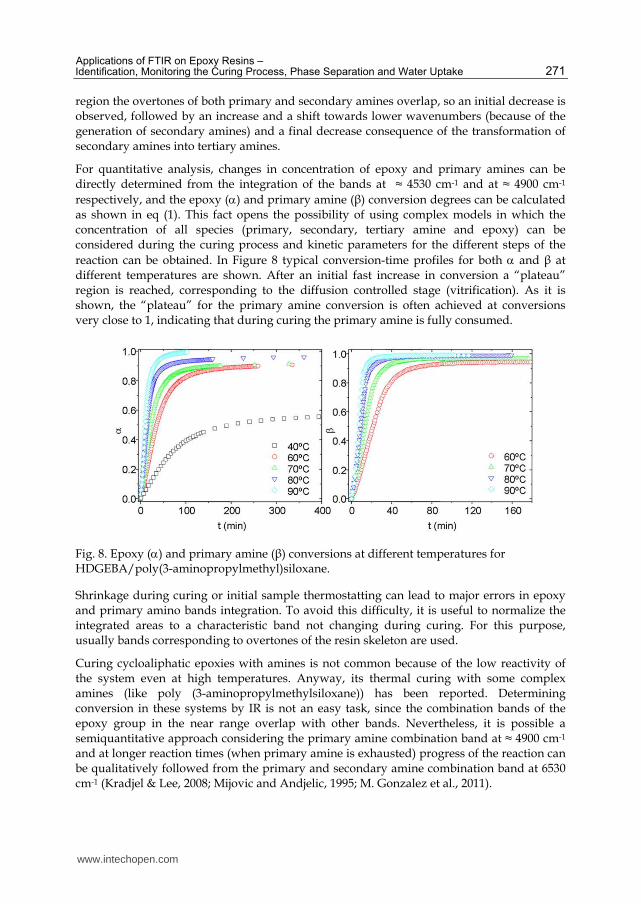
For quantitative analysis, changes in concentration of epoxy and primary amines can be directly determined from the integration of the bands at ≈ 4530 cm-1 and at ≈ 4900 cm-1
respectively, and the epoxy () and primary amine (β) conversion degrees can be calculated as shown in eq (1). This fact opens the possibility of using complex models in which the concentration of all species (primary, secondary, tertiary amine and epoxy) can be considered during the curing process and kinetic parameters for the different steps of the
reaction can be obtained. In Figure 8 typical conversion-time profiles for both and β at different temperatures are shown. After an initial fast increase in conversion a “plateau” region is reached, corresponding to the diffusion controlled stage (vitrification). As it is shown, the “plateau” for the primary amine conversion is often achieved at conversions very close to 1, indicating that during curing the primary amine is fully consumed.
Fig. 8. Epoxy () and primary amine (β) conversions at different temperatures for HDGEBA/poly(3-aminopropylmethyl)siloxane.
Shrinkage during curing or initial sample thermostatting can lead to major errors in epoxy and primary amino bands integration. To avoid this difficulty, it is useful to normalize the integrated areas to a characteristic band not changing during curing. For this purpose, usually bands corresponding to overtones of the resin skeleton are used.
Curing cycloaliphatic epoxies with amines is not common because of the low reactivity of the system even at high temperatures. Anyway, its thermal curing with some complex amines (like poly (3-aminopropylmethylsiloxane)) has been reported. Determining conversion in these systems by IR is not an easy task, since the combination bands of the epoxy group in the near range overlap with other bands. Nevertheless, it is possible a semiquantitative approach considering the primary amine combination band at ≈ 4900 cm-1 and at longer reaction times (when primary amine is exhausted) progress of the reaction can be qualitatively followed from the primary and secondary amine combination band at 6530 cm-1 (Kradjel & Lee, 2008; Mijovic and Andjelic, 1995; M. Gonzalez et al., 2011).
www.intechopen.com
Infrared Spectroscopy – Materials Science, Engineering and Technology
272
3.2 Modeling kinetics
Curing kinetics is a key aspect in epoxy systems, since it determines the time spam available
for shaping, storing... As in most chemically reactive systems, reaction rate is temperature
dependent.
Several models have been developed for epoxy/amine kinetics through the study of model
compounds (Schechter et al., 1956). An acceleration of reaction in the presence of OH groups
was observed and explained considering a third order reaction mechanism (Smith, 1961).
Horie and coworkers proposed a model in 1970 (Horie et al., 1970) considering the catalysis
of both initial OH (due to DGEBA oligomers and impurities) and OH generated during
chemical reaction (autocatalysis) which has been used and validated in many epoxy/amine
systems at different temperatures (Simon et al., 2000; Vyazovkin & Sbirrazouli, 1996; Cole et
al., 1991; Riccardi et al., 1984). Later on, modifications to the model have been introduced,
for example considering the different reactivity of hydrogens belonging to primary and
secondary amines and the possible homopolymerization reactions between epoxy groups
under certain conditions (Cole et al., 1991; Riccardi & Williams, 1986). Thus, following the
evolution of concentration of the different species during curing is useful for modeling
epoxy/amine systems.
The commonly accepted kinetic scheme for epoxy-amine reactions considers two reaction
paths: a non-catalyzed and an autocatalyzed path. The autocatalysis is attributed to the
formation of complex between generated or initially present hydroxyl groups, amino groups
and epoxy groups. A simple reaction mechanism is presented in Figure 3 although it can be
improved considering some equilibrium reactions for the complexes formation (Ehlers et al.,
2007). With appropriate mass balances it is possible to set out rate equations that can be
fitted to experimental data to extract the relevant kinetic parameters
3.2.1 Determining concentrations during curing
Considering the reaction scheme, the concentration of epoxy groups, primary, secondary
and tertiary amine, as well as hydroxyl groups can be determined through the following
mass balances:
1 1 0 2 3 0 2 3 0 02[ ] [ ] [ ] [ ] ; [ ] [ ] [ ] [ ] ; [ ] [ ] [ ] [ ]A A A A E E A A OH OH E E
If initial concentrations of epoxy and primary amine are known, the concentration of all
species at each instant can be determined from the conversion data obtained by nIR:
0 1 1 0 2 0 3 01 1
2[ ] [ ] ; [ ] [ ] ; [ ] [ ] ; [ ] [ ]
BE E A A A E B A E
Where B=2[A1]0/[E]0 is the ratio between the initial concentration of primary amine and
epoxy. A typical variation of all these species with time is presented in Figure 9.
Assuming that the reactivity ratio between primary and secondary amines (R) is
independent of the reaction path, the kinetic equations for the epoxy and primary amine
conversion are:
www.intechopen.com

Applications of FTIR on Epoxy Resins – Identification, Monitoring the Curing Process, Phase Separation and Water Uptake
273
Fig. 9. Typical evolution of concentration of primary (A1), secondary (A2) and tertiary amine (A3) groups during curing. Reactive system: DGEBA/m-Xylylenediamine at 80ºC. (Used with permission from (González, M.; Kindelán, M.; Cabanelas, J.C.; Baselga,J. Macromolecular Symposia, Vol.200. Copyright (2003)).
0
1 1
0
12
[ ]R ´
[ ]
OHd B dB K K
dt dt E
(2)
0
1 1
0
1 1[ ]
´[ ]
OHdK K
dt E
(3)
where:
1 1 0
2
1 1 0
[ ]
´ ´ [ ]
K k E
K k E
2 2
1 1
´R
´
k k
k k
3.2.2 Reactivity ratio between primary and secondary amines
Some kinetic models assume that the reactivity of primary and secondary amines is the same. Considering that primary amines have two reactive hydrogen atoms, equal reactivity yields R = 0.5. Nevertheless, in most of epoxy amine systems higher reactivity of primary amines (R<0.5) has been experimentally observed (Matejka, 2000; Paz-Abuin et al.,1997a, 1997b, 1998; Liu et al., 2004; Varley et al., 2006). This behavior is not surprising since the addition of the epoxy molecule to a primary amine causes an steric hindrance. On the other hand, the chemical nature of the new substituent usually decreases the nucleophilic character (and thus the reactivity) of the nitrogen atom in the amine group due to a negative inductive effect.
Paz-Abuín et al. developed a method for quantifying the reactivity ratio from the concentration-time plots of amines (Paz-Abuin et al., 1997a). Considering the classical reaction mechanism, applying the condition for maximum to [A2], it is obtained that
www.intechopen.com
Infrared Spectroscopy – Materials Science, Engineering and Technology
274
R=[A1]/[A2]. Thus, R value can determined from the concentration curves as the ratio of the concentration of primary amine and secondary amine at the maximum of secondary amine concentration. Usually the R value is below 0.5, i.e. it shows the higher reactivity of primary amines. If R is not very low, the uncertainty in the determination of the maximum is small and the R value can be precisely determined.
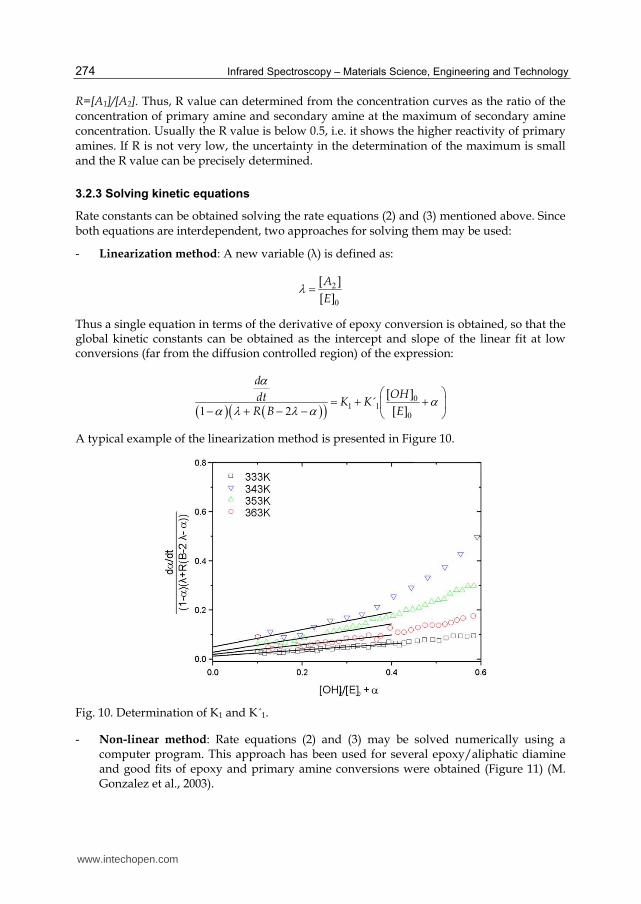
3.2.3 Solving kinetic equations
Rate constants can be obtained solving the rate equations (2) and (3) mentioned above. Since both equations are interdependent, two approaches for solving them may be used:
- Linearization method: A new variable (┣) is defined as:
2
0
[ ]
[ ]
A
E
Thus a single equation in terms of the derivative of epoxy conversion is obtained, so that the global kinetic constants can be obtained as the intercept and slope of the linear fit at low conversions (far from the diffusion controlled region) of the expression:
0
1 1
01 2
[ ]´
[ ]
dOHdt K K
R B E
A typical example of the linearization method is presented in Figure 10.
Fig. 10. Determination of K1 and K´1.
- Non-linear method: Rate equations (2) and (3) may be solved numerically using a computer program. This approach has been used for several epoxy/aliphatic diamine and good fits of epoxy and primary amine conversions were obtained (Figure 11) (M. Gonzalez et al., 2003).
www.intechopen.com

Applications of FTIR on Epoxy Resins – Identification, Monitoring the Curing Process, Phase Separation and Water Uptake
275
Fig. 11. and as a function of curing time for DGEBA / m-XDA at 60 ºC. Lines: fitting to eqs (1) and (2). Below: weighted residuals calculated as:
( ) ( )( )
( )i i
ii
O t C tr t
O t
were O(ti) and C(ti) are the observed and calculated values of (or ) respectively. (Used with permission from (González, M.; Kindelán, M.; Cabanelas, J.C.; Baselga,J. Macromolecular Symposia, Vol.200. Copyright (2003)).
4. Phase separation influence on IR spectra
Phase separation in blends involves the development of a second phase which usually has a different refractive index, and can be detected by the appearance of turbidity. Most studies analyze the so-called "cloud point" (instant when the sample is no longer transparent) measuring visible transmittance. Particles scatter light when its size is similar to the wavelength of the incident radiation; since infrared radiation ranges from 780 nm to 15 ┤m (from 780 nm to 1.1 ┤m for the near range and from 1.1 ┤m to 15 ┤m for the mid range), the onset of phase separation can be detected using nIR or mIR although with less accuracy (Bhargava et al, 1999) than using visible light. Therefore, IR measurements give delayed values of the cloud point. This fact is clear, and even more sophisticated techniques like SAXS may give information of the incipient phase separation process, but there is an advantage for IR: it provides additional chemical information during phase separation. Because of its longer wavelength, mIR is rarely used for characterizing phase separation phenomena, although it is used for characterizing other systems containing particles of bigger size or to avoid interferences due to the color of the systems.
www.intechopen.com

Infrared Spectroscopy – Materials Science, Engineering and Technology
276
Turbidity is observed in IR spectra as an increase of baseline. This parameter can be used to follow the phase separation process in a region where no bands exist, i.e 6300 cm-1.
Alternatively, this method has also been used to follow compatibilization of initially immiscible systems. As an example Cabanelas et al. (Cabanelas et al., 2005) studied the
compatibilization process and phase separation of a third component in reactive blends based on DGEBA and poly(3-aminopropylmethylsiloxane) modified with PMMA. As
shown in Figure 12, the initial decrease of the baseline was related with the compatibilization between DGEBA and the silicone hardener and the subsequent increase
was related with the onset of phase separation of the thermoplastic modifier. IR can also provide information about the interactions between the modifier and the thermosetting
matrix. Typical cured epoxy thermosets present a variety of OH···N, OH···NH and OH···OH hydrogen bonds. In the presence of PMMA intramolecular interactions become
redistributed since the carbonyl groups of PMMA interact with the initially present and newly formed OH groups as it is shown by the presence of a carbonyl-OH hydrogen
bonding band centered at 3500 cm-1 (Blanco et al., 2009). These changes in IR spectra may be related with the miscibility in complex systems.
Fig. 12. Baseline from FTIR spectra at 6300 cm-1 as a function of epoxy conversion of DGEBA/PAMS for different weight concentrations of PMMA as modifier (Adapted with permission from (Cabanelas, J.C.; Serrano, B.; Baselga, J. Macromolecules, Vol.38, No.3, (2005),). Copyright (2005) American Chemical Society).
5. Water uptake
One of the main drawbacks of epoxy resins is its high water uptake. Water deteriorates thermomechanical properties (Tg, modulus, yield strength, toughness...), and adhesion, it induces chemical degradation of the network and also generates stresses because of swelling (Nogueira et al., 2001; Cotugno et al., 2001; Blanco et al., 2006; Ji et al., 2006; Xiao & Shanahan, 2008). Significant efforts have been done to elucidate the interactions of water with epoxy/amine networks and the diffusion mechanisms operating during water uptake,
www.intechopen.com
Applications of FTIR on Epoxy Resins – Identification, Monitoring the Curing Process, Phase Separation and Water Uptake
277
and many different techniques have been used: from the fast and easy gravimetry to more complex techniques such as NMR spectroscopy (Zhou & Lucas 1999) or fluorescence (Mikes et al., 2003). Also infrared spectroscopy has been widely used. IR shows an advantage when compared with gravimetry: it is not only an accurate technique for determining water concentration, but also provides information at the molecular level about the interactions between water molecules and the thermoset structure and can be used to provide information on dimensional changes of the specimens.
Water has three active vibration modes in infrared corresponding to the stretching of O-H
bond (≈ 3800- 3600 cm-1 in liquid state) and bending (≈ 1650-1590 cm-1 in liquid state). The
position of the bands of this molecule is particularly sensitive towards interactions like
hydrogen bonding, which originates displacements towards lower wavenumbers (< 3600
cm-1), enabling the distinction between free water, hydrogen bonded and intramolecular
hydrogen bonding (Socrates, 1994). When absorbed in epoxy resins, two types of water are
found: highly mobile free water molecules (≈ 3600 cm-1) and water bounded to specific sites
through hydrogen bonding (≈ 3300 cm-1) (Blanco et al., 2006; Cotugno et al., 2005; Grave et
al, 1998). Signals can also be observed in the near infrared range: at 5215 cm-1 resulting from
the combination of asymmetric stretching and bending and in the range 7800 - 6000 cm-1
hydroxyl vibrations are also found. The latter band can be deconvoluted into three peaks
centered at 7075, 6820 and 3535 cm-1 attributed to free water, self-associated and hydrogen
bonded respectively (Musto et al., 2002).
Infrared spectroscopy in both ranges has been used to monitor water uptake and diffusion
coefficients have been determined using Fick’s law. The band located at 5215 cm-1 can be
used to quantify water, although it must be normalized for sample thickness. The band at
higher wavenumbers is used to determine the kind of interactions between water and
network (Mijovic & Zhang, 2003; Cabanelas et al., 2003), but not with quantitative purposes
since it is superimposed on the O-H overtone of the resin (Musto et al., 2000). To overcome
the thickness variation it is possible to normalize water signal with a reference band
invariant against the presence of water (for example, the band at 4623 cm-1, corresponding to
aromatic rings of DGEBA). This peak, in principle should not change by the water ingress,
only by the volume change due to swelling. In this way, the fractional absorbed water can
be calculated as:
5215 0 5215
4623 0 4623
0 0 5215
0 4623
, ,
, ,
,
,
t
tt
A A
A AW
W A
A
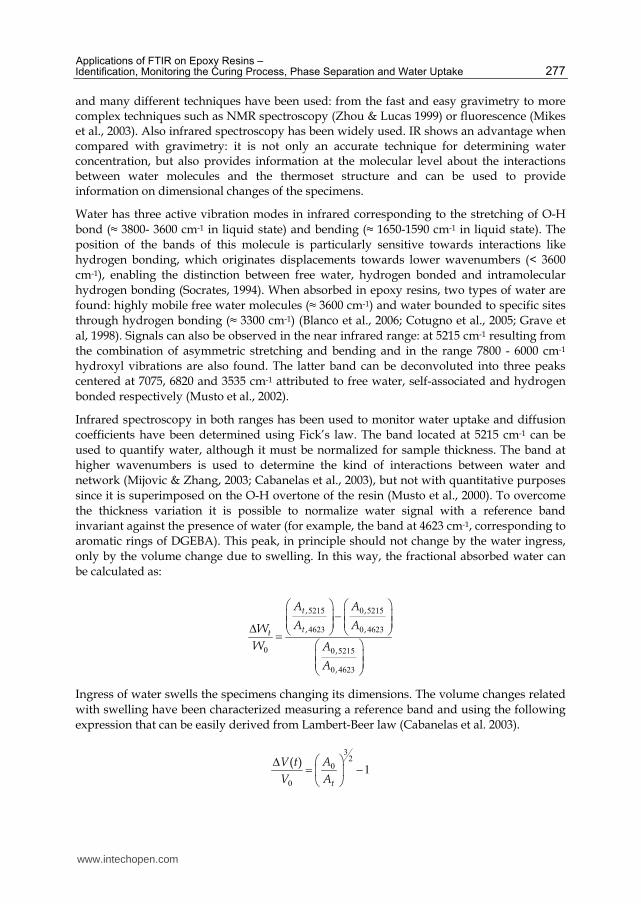
Ingress of water swells the specimens changing its dimensions. The volume changes related
with swelling have been characterized measuring a reference band and using the following
expression that can be easily derived from Lambert-Beer law (Cabanelas et al. 2003).
32
0
0
1( )
t
AV t
V A
www.intechopen.com

Infrared Spectroscopy – Materials Science, Engineering and Technology
278
The small volume changes due to swelling are prone to large errors if determined by usual means (for example, with a caliper). Figure 13 shows good correlations between the fractional volume change during water uptake in an epoxy resin as measured gravimetrically, by FTIR or measuring the change on dimensions of the specimens.
Fig. 13. Comparison of volume change determined by n-FTIR, (V/V0)IR, and measured with a micrometer, (left) or by gravimetry (right), for fully cured DGEBA/ Poly(aminopropylsiloxane) with 0.381 mm thickness.
6. Conclusion
The curing and ageing of epoxy resins are complex phenomena of the prime importance in industry. FTIR appears to be a valuable tool for both qualitative analysis and quantification of these processes. It has been shown how to extract relevant information from spectra to identify typical components of resins and hardeners. Following time variations of specific bands allows extracting relevant kinetic parameters to get more insight about the specific reaction mechanism of curing process. Inspection of subtle changes in baseline can be correlated with both, miscibilization or phase separation processes. Detailed analysis of OH bands allows extracting information about intermolecular interactions within the components of the resin. And, finally, water uptake can be easily quantified and both diffusion coefficients and dimensional changes can be measured with less error than other common methods.
7. Acknowledgment
Authors wish to thank Ministerio de Ciencia e Innovación (Spain) for partial funding under project MAT2010-17091.
8. References
Bhargava, R.; Wang, S.Q.; Koenig, J.L. (1999). Studying polymer-dispersed liquid-crystal formation by FTIR spectroscopy. 2. Phase separation and ordering. Macromolecules, Vol.32, No.26, (December 1999), pp.8989-8995, ISSN 0024-9297.
www.intechopen.com

Applications of FTIR on Epoxy Resins – Identification, Monitoring the Curing Process, Phase Separation and Water Uptake
279
Barabanova, A.I.; Shevnin, P.L.; Pryakhina, T.A.; Bychko, K.A.; Kazantseva, V.V.; Zavin,
B.G.; Vygodskii, Y.S.; Askadskii, A.A.; Philippova, O.E.; Khokhlov, A.R. (2008).
Nanocomposites Based on Epoxy Resin and Silicon Dioxide Particles.
Nanocomposites Based on Epoxy Resin and Silicon Dioxide Particles, Vol. 50, No. 7,
(November 2007), pp. 808-819, ISSN 0965-545X.
Blanco, I.; Cicala, G.; Motta, O.; Recca, A. (2004). Influence of a selected hardener on the
phase separation in epoxy/thermoplastic polymer blends. Journal of Applied Polymer
Science, Vol.94, No. 1, (September 2004), pp. 361-371, ISSN 1097-4628.
Blanco, I.; Cicala, G.; Costa, M.; Recca, A. (2006). Development of an epoxy system
characterized by low water absorption and high thermomechanical performances.
Journal of Applied Polymer Science, Vol.100, No.6, (June 2006), pp. 4880–4887, ISSN
0021-8995.
Blanco, M.; Lopez, M.; Fernandez, R.; Martin, L.; Riccardi, C.C.; Mondragon, I. (2009).
Thermoplastic-modified epoxy resins cured with different functionalities amine
mixtures. Kinetics and miscibility study. Journal of Thermal Analysis and Calorimetry,
Vol.97, No.3, (June 2009), pp. 969-978, ISSN 1388-6150.
Bucknall, C.B.; Partridge, I.K. (1986). Phase separation in crosslinked resins containing
polymeric modifiers. Polymer Engineering Science, Vol.26, No.1, (January 1986), pp.
54-62, ISSN 0032-3888.
Cabanelas, J.C.; Prolongo, S.G.; Serrano, B.; Bravo, J.; Baselga, J. (2003). Water absorption in
polyaminosiloxane-epoxy thermosetting polymers. Journal of Materials Processing
Technology, Vol.143, No.SI, (2003), pp. 311-315, ISSN 0924-0136.
Cabanelas, J.C.; Serrano, B.; Baselga, J. (2005). Development of cocontinuous morphologies
in initially heterogeneous thermosets blended with poly(methyl methacrylate).
Macromolecules, Vol.38, No.3, (February 2005), pp. 961-970, ISSN 0024-9297.
Chen, J.S.; Ober, C.K.; Poliks, M.D. (2002). Characterization of Thermally Reworkable
Thermosets: Materials for Environmentally Friendly Processing and Reuse.
Polymer, Vol.43, No.1, (January 2002), pp. 131-139, ISSN 0032-3861.
Chike, K.E.; Myrick M.L.; Lyon, R.E.; Angel S.M. (1993). Raman ans near infrared studies of
an epoxy resin. Applied Spectroscopy, Vol.47, No.10, (October 1993), pp. 1631-1635,
ISSN 0003-7028.
Cole, K.C. ; Hecher, J.J.; Noel, D. (1991). A new approach to modeling the cure kinetics of
epoxy amine thermosetting resins 2. Application to a typical system based on bis[4-
(diglycidylamino)phenyl]methane and bis(2-aminophenyl) sulphone.
Macromolecules, Vol.24, No.11, (May 1991), pp. 3098-3110, ISSN 0024-9297.
Cotugno, S.; Mensitieri, G.; Musto,P.; Sanguigno, L. (2005). Molecular interactions in and
transport properties of densely cross-linked networks: A time-resolved FT-IR
spectroscopy investigation of the epoxy/H2O system. Macromolecules, Vol.38, No.3,
(February 2003), pp. 801-811, ISSN 0024-9297.
Cotugno, S.; Larobina, D.; Mensitieri, G.; Musto, J.; Ragosta, G. (2001). A novel spectroscopic
approach to investigate transport processes in polymers: the case of water-epoxy
system. Polymer, Vol.42, No.15, (July 2001), pp. 6431-6438, ISSN 0032-3861.
www.intechopen.com

Infrared Spectroscopy – Materials Science, Engineering and Technology
280
Crivello, J.V.; Fan, M. (1991). Novel platinum-containing initiators for ring-opening
polymerizations. Journal of Polymer Science A: Polyme Chemistry, Vol.29, No.13,
(December 1991), pp. 1853-1863, ISSN 0887-624X.
Crivello, J.V.; Liu, S. (2000). Photoinitiated cationic polymerization of epoxy alcohol
monomers. Journal of Polymer Science A: Polymer Chemistry, Vol.38, No.3, (February
2000), pp. 389-401, ISSN 0887-624X.
Crivello, J.V. (1993). In: Ring-Opening Polymerization, DJ Brunelle, pp. 157-159, Ed., Hanser,
ISBN 3446162933, Munich.
Ehlers J.E.; Rondan, N.G.; Huynh, L.K.; Pham, H.; Marks, M.; Truong, T.N. (2007).
Theoretical study on mechanisms of the epoxy-amine curing reaction.
Macromolecules, Vol.40, No.12, (2007), pp.4370-4377, ISSN 0024-9297.
Dannenberg, H.; Harp, W.R. (1956). Determination of cure and analysis of cured epoxy
resins. Analytical Chemistry, Vol.28, No.1, (1956), pp.81-90, ISSN 0003-2700.
Flory, P.J. (1953). Principles of Polymer Chemistry, Cornell University Press, ISBN 0801401348,
Ithaca.
George, G.A.; Clarke, P.C.; Jhon, N.S.; Friend, G. (1991). Real time monitoring of the cure
reaction of a TGDDM/DDS epoxy resin using fiber optic FT-IR. Journal of Applied
Polymer Science, Vol.42, No.3, (February 1991), pp. 643-657, ISSN 0021-8995.
Girard-Reydet, E.; Sautereau, H.; Pascault, J.P. (1999). Use of block copolymers to control the
morphologies and properties of thermoplastic/thermoset blends. Polymer, Vol.40,
No.7, (March 1999), pp.1677-1687, ISSN 0032-3861.
Gonzalez-Benito, J.; Bravo, J.; Mikes, J.; Baselga, J. (2003). Fluorescence labels to monitor
water absorption in epoxy resins. Polymer, Vol.44, No.3, (February 2003), pp. 653–
659, ISSN 0032-3861.
Grave, C.; McEwan, I.; Pethrick, R.A. (1998). Influence of stoichiometric ratio on water
absorption in epoxy resins. Journal of Applied Polymer Science, Vol.69, No.12,
(September 1998), pp. 2369-2376, ISSN 0021-8995.
Hartwig, A.; Schenider, B.; Lühring, A. (2002). Influence of moisture on the photochemically
induced polymerisation of epoxy groups in different chemical environment.
Polymer, Vol.43, No.15, (July 2003), pp. 4243-4250, ISSN 0032-3861 .
Hartwig, A.; Koschek, K.; Luhring, A.; Schorsch, O. (2003). Cationic polymerization of a
cycloaliphatic diepoxide with latent initiators in the presence of structurally
different diols. Polymer, Vol.44, No.10, (May 2003), pp. 2853-2858, ISSN 0032-3861.
Horie, K.; Hiura, H.; Sawada, M.; Mitta, I.; Kambe, H. (1970). Calorimetic investigation of
polymerization reactions 3: Curing reaction of epoxides with amines. Journal of
Polymer Science Part A-1- Polymer Chemistry, Vol.8, No.6, (1970), pp. 1357-&, ISSN
0449-296X.
Inoue, T. (1995). Reaction-induced phase decomposition in polymer blends. Progress in
Polymer Science, Vol.20, No.1, (1995), pp.119-153, ISSN 0079-6700.
Ji, W.; Hu, J.; Zhang, J.; Cao, C. (2006). Reducing the water absorption in epoxy coatings by
silane monomer incorporation. Corrosion Science, Vol.48, No.11, (November 2006),
pp. 3731–3739, ISSN 0010-938X.
www.intechopen.com
Applications of FTIR on Epoxy Resins – Identification, Monitoring the Curing Process, Phase Separation and Water Uptake
281
Kiefer, J.; Hilborn, J.G.; Hedrick, J.L. (1996). Chemically induced phase separation: A new
technique for the synthesis of macroporous epoxy networks. Polymer, Vol.37,
No.25, (1996), pp. 5715-5725, ISSN 0032-3861.
Kim, Y.M.; Kostanski, L.K.; Mac Gregor, J.F. (2003). Photopolymerization of 3,4-
epoxycyclohexylmethyl-3',4'-epoxycyclohexane carboxylate and tri (ethylene
glycol) methyl vinyl ether. Polymer, Vol. 44, No.18, (August 2003), pp.5103-5109,
ISSN 0032-3861.
Kradjel, C.; Lee, K.A. (2008). NIR analysis of polymers, in Handbook of near infrared analysis,
CRC Press, ISBN, Boca Ratón.
Liu, H.; Uhlherr, A.; Varley, R.J.; Bannister, M.K. (2004). Influence of substituents on the
kinetics of epoxy/aromatic diamine resin systems. Journal of Polymer Science Part A:
Polymer Chemistry, Vol.42, No.13, (July 2004), pp. 3143–3156, ISSN 1099-0518.
González, M.; Kindelán, M.; Cabanelas, J.C.; Baselga,J. (2003). Modelling auto-acceleration in
DGEBA/diamine systems. Macromolecular Symposia, Vol.200, (September 2003), pp.
111-119, ISSN 1022-1360.
Gonzalez, M.; Cabanelas, J.C.; Pozuelo, J.; Baselga, J.(2011). Preparation of cycloaliphatic
epoxy hybrids with non-conventional amine-curing agents. Journal of Thermal
Analysis and Calorimetry, Vol.103, No.2, (February 2011), pp. 717-723, ISSN 1388-
6150.
Marieta, C.; Remiro, G.; Garmendia, G.; Harismendy, I.; Mondragón, I. (2003). AFM
approach toward understanding morphologies in toughened thermosetting
matrices. European Polymer Journal, Vol.39, No.10, (October 2003), pp. 1965-1973,
ISSN 0014-3057.
Mark, H.F. (2004). Encyclopaedia of polymer science and technology, Vol. 9, Wiley and Sons,
ISBN, New Jersey.
Matejka, L. (2000). Amine cured epoxide networks: Formation, structure, and properties.
Macromolecules, Vol.33, No. 10, (May 2000), pp. 3611-3619, ISSN 0024-9297.
May, C.A. (1988). Epoxi resins, Chemistry and Technology (2nd), Marcel Dekker, ISBN
0824776909, New York.
Mezzenga, R.; Boogh, L.; Manson, J.A.E. (2000). A thermodynamic model for thermoset
polymer blends with reactive modifiers. Journal of Polymer Science Part B: Polymer
Physics, Vol.38, No.14, (July 2000), pp.1893-1902, ISSN 1099-0488.
Mijovic, J.; Zhang, H. (2003). Local dynamics and molecular origin of polymer network-
water interactions as studied by broadband dielectric relaxation spectroscopy,
FTIR, and molecular simulations. Macromolecules, Vol.36, No.4, (February 2003), pp.
1279-1288, ISSN 0024-9297.
Mijovic, J.; Andjelic, S. (1995). A study of reaction kinetics by near infrared spectroscopy 1.
Comprehensive analysis of a model epoxy/amine. Macromolecules, Vol.28, No.8,
(April 1995), pp.2787-2796, ISSN 0024-9297.
Mijovic, J.; Andjelic, S.; Yee, C.F.W.; Bellucci, F.; Nicolais, L. (1995). A study of reaction
kinetics by near infrared spectroscopy 2. Comparison with dielectric spectroscopy
of model and multifunctional epoxy/amine. Macromolecules, Vol.28, No.8, (April
1995), pp. 2797-2806, ISSN 0024-9297.
www.intechopen.com

Infrared Spectroscopy – Materials Science, Engineering and Technology
282
Mikes, F.; Baselga, J.; Paz-Abuin, S. (2002). Fluorescence probe-label methodology for in situ
monitoring network forming reactions. European Polymer Journal, Vol.38, No.12,
(December 2002), pp. 2393–2404, ISSN 0014-3057.
Musto, P.; Mascia, L.; Ragosta, G.; Scarinzi, G.; Villano, P. (2000). The transport of water in a
tetrafunctional epoxy resin by near-infrared Fourier transform spectroscopy.
Polymer, Vol. 41, No.2, (January 2000), pp.565-574, ISSN 0032-3057.
Musto, P.; Ragosta, G.; Mensitier, G. (2002). Time-resolved FTIR/FTNIR spectroscopy:
powerful tools to investigate diffusion processes in polymeric films and
membranes. E-Polymers, Article Nº 017 (April 2002), ISSN 1618-7229.
Nikolic, G.; Zlatkovic, S.; Cakic, M.; Cakic, S.; Lacnjevac, C; Rajic, Z. (2010). Fast Fourier
Transform IR Characterization of Epoxy GY Systems Crosslinked with Aliphatic
and Cycloaliphatic EH Polyamine Adducts. Sensors, Vol.10, No.1, (January 2010),
pp. 684-696, ISSN 1424-8220.
Nogueira, P.; Ramirez, C.; Torres, A.; Abad, M.J.; Cano, J.; Lopez-bueno, I.; Barral,L. (2001).
Effect of water sorption on the structure and mechanical properties of an epoxy
resin system. Journal of Applied Polymer Science, Vol.80, No.1, (April 2001), pp. 71-80,
ISSN 0021-8995.
Pascault, J.P., Sautereau, H.; Verdu, J.; Williams, R.J.J. (2002). Thermosetting Polymer, Marcel
Dekker Inc, ISBN 0824706706, New York.
Paz-Abuin, S.; Lopez-Quintela, A.; Varela, M.; Pellin, M.P.; Prendes, P. (1997). Method for
determination of the ratio of rate constants, secondary to primary amine, in epoxy-
amine systems. Polymer, Vol.38, No.12, (June 1997), pp. 3117-3120, ISSN 0032-3861.
Paz-Abuin, S.; Pellin, M.P.; Paz-Pazos, M.; Lopez-Quintela, A. (1997). Influence of the
reactivity of amine hydrogens and the evaporation of monomers on the cure
kinetics of epoxy-amine: kinetic questions. Polymer, Vol.38, No.15, (July 1997), pp.
3795-3804, ISSN 0032-3861.
Paz-Abuín, S.; Lopez-Quintela, A.; Varela, M.; Pellín, M.P.; Prendes, P. (1998).
Autoacceleration and inhibition: Free volume. Epoxy-amine kinetics. Journal of
Polymer Science A: Polymer Chemistry, Vol.36, No.6, (April 1998), pp. 1001–1016,
ISSN 0887-624X.
Poisson, N.; Lachenal, G.; Sautereau, H. (1996). Near- and mid-infrared spectroscopy studies
of an epoxy reactive system. Vibrational Spectroscopy, Vol.12, No.2, (October 1996),
pp.237-247, ISSN 0924-2031.
Rajagopalan, G.; Gillespie, J.W.; McKnight, S.H. (2000). Diffusion of reacting epoxy and
amine monomers in polysulfone: a diffusivity model. Polymer, Vol.41, No.21,
(October 2000), pp. 7723-7733, ISSN 0032-3861.
Riccardi, C.C.; Williams, R.J.J. (1986). A kinetic scheme for an amine-epoxy reaction with
simultaneous. Journal of Applied Polymer Science, Vol.32, No.2, (August 1986), pp.
3445-3456, ISSN 0024-9297.
Riccardi, C.C.; Addabo, H.E.; Williams, R.J.J. (1984). Curing reaction of epoxy resins with
diamines. Journal of Applied Polymer Science, Vol.32, No.8, (1984), pp. 2841-2492,
ISSN 0021-8995.
www.intechopen.com

Applications of FTIR on Epoxy Resins – Identification, Monitoring the Curing Process, Phase Separation and Water Uptake
283
Schechter, L.; Wynstra, J.; Kurkjy, R. (1956). Glycidyl Ether Reactions with Alcohols,
Phenols, Carboxylic Acids, and Acid Anhydrides. Journal of Industrial and
Engineering Chemistry, Vol.48, No.1, (January 1956), pp. 86-93, ISSN 1226-086X.
Siddhamalli, S.K. (2000). Toughening of epoxy/polycaprolactone composites via reaction
induced phase separation. Polymer Composites, Vol.21, No.5, (October 2000), pp.846-
855, ISSN 0272-8397.
Simon, S.L.; McKenna, G.B.; Sindt, O. (2000). Modelling the evolution of the dynamic
mechanical properties of a commercial epoxy during cure after gelation. Journal of
Applied Polymer Science, Vol.76, No.4, (April 200), pp. 495-508, ISSN 0021-8995.
Smith, I.T. (1961). The mechanism of the crosslinking of epoxide resins by amines. Polymer,
Vol.2, No.1, (1961), pp. 95-108, ISSN 0032-3861.
Socrates, G. (1994). Infrared Characteristic Group Frequencies, Wiley & Sons, ISBN 0471942308,
Chischester, England
Soucek, M.D.; Abu-Shanab, O.L.; Anderson, C.D.; Wu, S. (1998). Kinetic Modeling of the
Crosslinking Reaction of Cycloaliphatic Epoxides with Carboxyl Functionalized
Acrylic Resins: Hammett Treatment of Cycloaliphatic Epoxides. Macromolecular
Chemistry and Physics, Vol.199, No.6, (December 1998), pp. 1035-1042, ISSN 1022-
1352.
Tao Z, Yang S, Chen J, Fan L. (2007). Synthesis and characterization of imide ring and
siloxane-containing cycloaliphatic epoxy resins. European Polymer Journal, Vol.43,
No.4, (January 2007), pp. 1470-1479, ISSN 0014-3057.
Varley, R.J.; Liu, W.; Simon, G.P. (2006). Investigation of the reaction mechanism of different
epoxy resins using a phosphorus-based hardener. Journal of Applied Polymer Science,
Vol.99, No.6 (March 2006), pp. 3288-3299, ISSN 0021-8995.
Vyazovkin, S.; Sbirrazuoli, N. (1996). Mechanism and kinetics of epoxy-amine cure studied
by differential scanning calorimetry. Macromolecules, Vol.29, No.6, (March 1996),
pp. 1867-1873, ISSN 0024-9297.
Wang, F.; Neckers, D.C. (2001). Photopolymerization of Epoxides with Platinum(II)
Bis(acetylacetonato)/Silane Catalysts. Macromolecules, Vol.34, No.18, (August 2001),
pp. 6202-6205, ISSN 0024-9297.
Wang, Z.; Xie, M.; Zhao, Y.; Yu, Y.; Fang, S. (2003). Synthesis and properties of novel liquid
ester-free reworkable cycloaliphatic diepoxides for electronic packaging
application. Polymer, Vol.44, No.4, (January 2003), pp.923-929, ISSN 0032-3861.
Weyer, L. and Lo, S.-C. (2002). Spectra-Structure Correlations in the Near-infrared, In Handbook
of Vibrational Spectroscopy, Vol. 3, Wiley and Sons, ISBN 0471988472, UK, pp. 1817-
1837.
Xiao, G.Z.; Shanahan, M.E.R. (1998). Swelling of DGEBA/DDA epoxy resin during
hygrothermal ageing. Polymer, Vol.39, No.14, (June 1998), pp. 3253-3260, ISSN 0032-
3861.
Xu, L.S.; Schlup, J.R. (1998). Etherification versus amine addition during epoxy resin amine
cure: An in situ study using near-infrared spectroscopy. Journal of Applied Polymer
Science, Vol.67, No.5, (January 1998), pp. 895-90, ISSN 0021-8995.
Xu, L.; Fu, J.H.; Schlup, J.R. (1996). In situ near-infrared spectroscopic investigation of the
kinetics and mechanisms of reactions between phenyl glycidyl ether (PGE) and
www.intechopen.com

Infrared Spectroscopy – Materials Science, Engineering and Technology
284
multifunctional aromatic amines. Industrial and Engineering Chemistry Research,
Vol.35, No. 3, (March 1996), pp. 963-972, ISSN 0888-5885.
Yagci, Y.; Reetz, I. (1998). Externally stimulated initiator systems for cationic polymerization.
Progress in Polymer Science, Vol.23, No.8, (December 1998), pp. 1485-1538, ISSN
0079-6700.
Zhou, J.; Lucas, J.P. (1999). Hygrothermal effects of epoxy resin. Part I: the nature of water in
epoxy. Polymer, Vol.40, No.20, (June 1999), pp. 5505–5512, ISSN 0032-3861.
www.intechopen.com
Infrared Spectroscopy - Materials Science, Engineering andTechnologyEdited by Prof. Theophanides Theophile
ISBN 978-953-51-0537-4Hard cover, 510 pagesPublisher InTechPublished online 25, April, 2012Published in print edition April, 2012
InTech EuropeUniversity Campus STeP Ri Slavka Krautzeka 83/A 51000 Rijeka, Croatia Phone: +385 (51) 770 447 Fax: +385 (51) 686 166www.intechopen.com
InTech ChinaUnit 405, Office Block, Hotel Equatorial Shanghai No.65, Yan An Road (West), Shanghai, 200040, China
Phone: +86-21-62489820 Fax: +86-21-62489821
The present book is a definitive review in the field of Infrared (IR) and Near Infrared (NIR) Spectroscopies,which are powerful, non invasive imaging techniques. This book brings together multidisciplinary chapterswritten by leading authorities in the area. The book provides a thorough overview of progress in the field ofapplications of IR and NIR spectroscopy in Materials Science, Engineering and Technology. Through apresentation of diverse applications, this book aims at bridging various disciplines and provides a platform forcollaborations among scientists.
How to referenceIn order to correctly reference this scholarly work, feel free to copy and paste the following:
María González González, Juan Carlos Cabanelas and Juan Baselga (2012). Applications of FTIR on EpoxyResins - Identification, Monitoring the Curing Process, Phase Separation and Water Uptake, InfraredSpectroscopy - Materials Science, Engineering and Technology, Prof. Theophanides Theophile (Ed.), ISBN:978-953-51-0537-4, InTech, Available from: http://www.intechopen.com/books/infrared-spectroscopy-materials-science-engineering-and-technology/applications-of-ftir-on-epoxy-resins-identification-monitoring-the-curing-process-phase-separatio

© 2012 The Author(s). Licensee IntechOpen. This is an open access articledistributed under the terms of the Creative Commons Attribution 3.0License, which permits unrestricted use, distribution, and reproduction inany medium, provided the original work is properly cited.