Embed Size (px)
Citation preview
Application Server Cost of Ownership Oracle WebLogic Suite versus JBoss Enterprise Application Platform
795 Folsom Street, 1st
Floor | San Francisco, CA 94107 | Tel.: 415.685.3392 | Fax: 415.373.3892
November 2013
THE DEVELOPMENT OF THIS WHITE PAPER WAS SPONSORED BY ORACLE, BUT THE UNDERLYING
RESEARCH AND ANALYSIS WERE EXECUTED INDEPENDENTLY BY PIQUE SOLUTIONS.
795 Folsom Street, 1st
Floor | San Francisco, CA 94107 | Tel.: 415.685.3392 | Fax: 415.373.3892
© 2013 Pique Solutions. All rights reserved. 2
Contents
Executive Summary ...................................................................................................................... 3
Introduction: Complexity and the Application Server Life Cycle ................................................... 4
A Five-Year Cost of Ownership Comparison ............................................................................... 6
Research Methodology ........................................................................................................................... 6
Comparing the Cost of the “Core” Application Server Deployment ....................................................... 7
Initial Cost: The Tip of the Iceberg .......................................................................................................... 9
Hardware and Software .................................................................................................................... 9
Installation and Configuration ........................................................................................................ 10
Initial Application Deployment ....................................................................................................... 10
Ongoing Costs: The Real Driver of Cost of Ownership ......................................................................... 11
Vendor Support ............................................................................................................................... 12
Ongoing Application Deployment .................................................................................................. 12
Administration and Management .................................................................................................. 12
Monitoring, Diagnostics and Tuning ............................................................................................... 13
Responding to Downtime ............................................................................................................... 13
The Major Upgrade ......................................................................................................................... 14
Increasing Complexity: The Cost Impact of Data-Intensive and Cloud Scenarios ................................ 15
Database Scenario ........................................................................................................................... 15
Virtualization and Cloud.................................................................................................................. 16
Conclusion and Key Takeaways ................................................................................................ 17
Appendix A: Estimating “People Cost”—a Skill-Adjusted Effort ................................................. 18
Oracle, Java, WebLogic, WebLogic Server and Oracle WebLogic Server are registered trademarks of Oracle
and/or its affiliates.
JBoss is a registered trademark of Red Hat.
Other names may be trademarks of their respective owners.
© 2013 Pique Solutions. All rights reserved. 3
“Up-front costs are one
thing, but the bulk of costs
are management labor,
administration and
downtime. People think open
source is free, but you need
to look at total cost of
ownership.”
Principal, Operations and Resource Management
Technology Provider
Executive Summary
Open source application server and middleware vendors perceive software licensing and acquisition
cost as the “root of all evil” in the ownership experience. While their cost of ownership calculators
accurately account for software and subscription cost, these partial
analyses address only roughly 20% of the long-term cost of ownership.
Labor, or “people cost,” comprises the largest portion of cost of ownership
through the application server life cycle. This cost is highly dependent on
the quality of the engineering of the hardware and software solution, the
depth of integration of the components and the maturity of the tools to
manage ongoing operations. Cost of ownership has never been more
important as application server deployments become more complex,
requiring in-memory data grids, database-intensive scenarios,
virtualization and elastic cloud deployments.
Pique Solutions studied both the Oracle WebLogic Suite and JBoss
Enterprise Application Platform (EAP) to identify the differences in long-
term cost of ownership, with particular focus on the long-term application
server life cycle. The study involved detailed, activity-based data collection
and in-depth interviews with IT managers, directors and VPs experienced
in buying, implementing, managing and upgrading application server
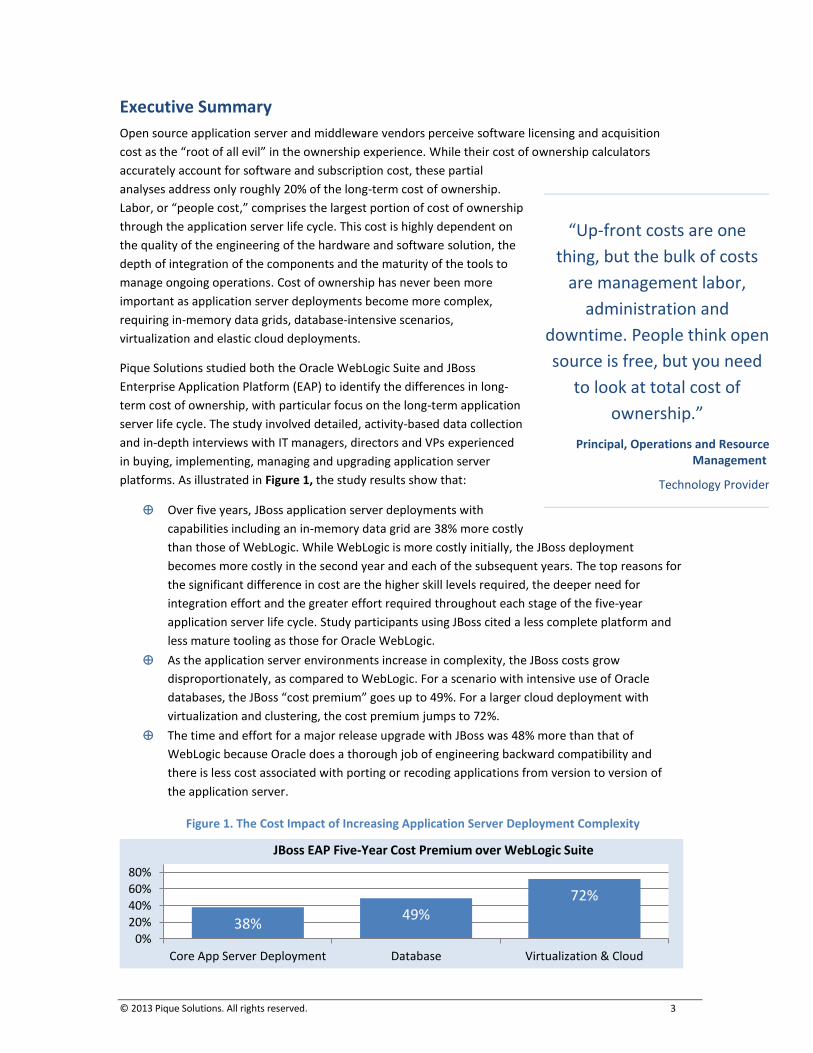
platforms. As illustrated in Figure 1, the study results show that:
Over five years, JBoss application server deployments with
capabilities including an in-memory data grid are 38% more costly
than those of WebLogic. While WebLogic is more costly initially, the JBoss deployment
becomes more costly in the second year and each of the subsequent years. The top reasons for
the significant difference in cost are the higher skill levels required, the deeper need for
integration effort and the greater effort required throughout each stage of the five-year
application server life cycle. Study participants using JBoss cited a less complete platform and
less mature tooling as those for Oracle WebLogic.
As the application server environments increase in complexity, the JBoss costs grow
disproportionately, as compared to WebLogic. For a scenario with intensive use of Oracle
databases, the JBoss “cost premium” goes up to 49%. For a larger cloud deployment with
virtualization and clustering, the cost premium jumps to 72%.
The time and effort for a major release upgrade with JBoss was 48% more than that of
WebLogic because Oracle does a thorough job of engineering backward compatibility and
there is less cost associated with porting or recoding applications from version to version of
the application server.
Figure 1. The Cost Impact of Increasing Application Server Deployment Complexity
38% 49%
72%
0%
20%
40%
60%
80%
Core App Server Deployment Database Virtualization & Cloud
JBoss EAP Five-Year Cost Premium over WebLogic Suite
© 2013 Pique Solutions. All rights reserved. 4
Introduction: Complexity and the Application Server Life Cycle
A significant portion of cost of ownership is driven by labor costs experienced and accrued through the
application server life cycle after the initial acquisition of the software. Therefore, it is important to
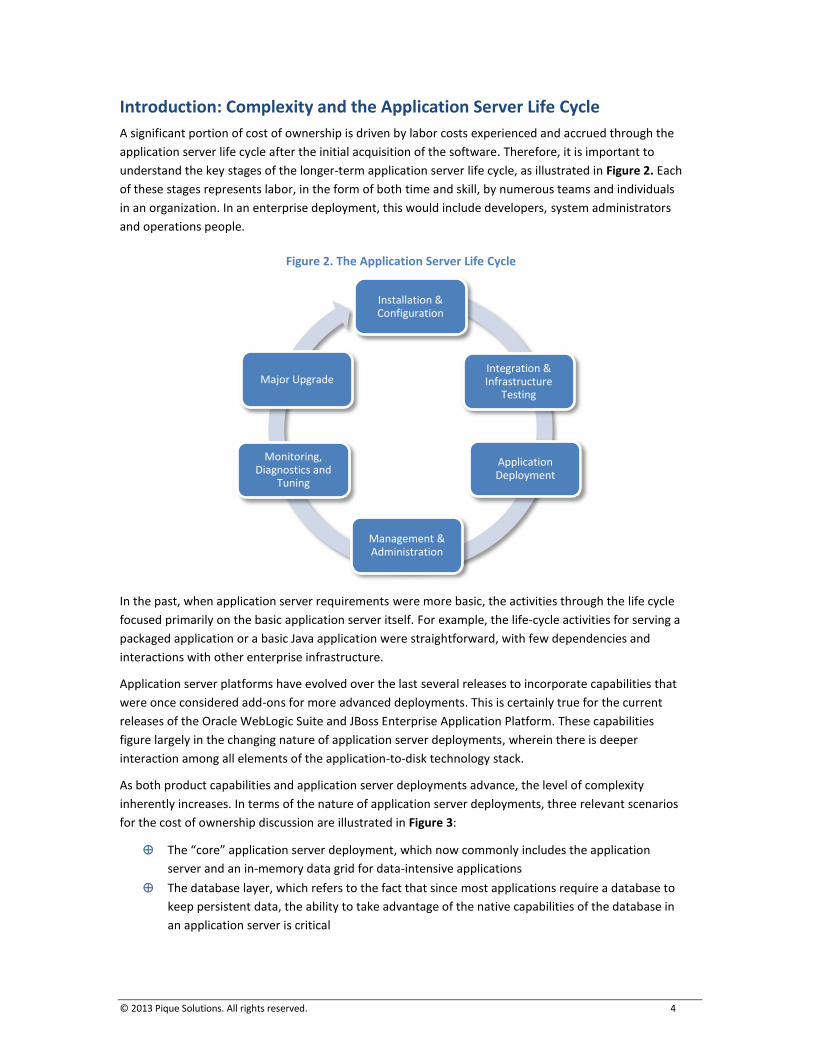
understand the key stages of the longer-term application server life cycle, as illustrated in Figure 2. Each
of these stages represents labor, in the form of both time and skill, by numerous teams and individuals
in an organization. In an enterprise deployment, this would include developers, system administrators
and operations people.
Figure 2. The Application Server Life Cycle
In the past, when application server requirements were more basic, the activities through the life cycle
focused primarily on the basic application server itself. For example, the life-cycle activities for serving a
packaged application or a basic Java application were straightforward, with few dependencies and
interactions with other enterprise infrastructure.
Application server platforms have evolved over the last several releases to incorporate capabilities that
were once considered add-ons for more advanced deployments. This is certainly true for the current
releases of the Oracle WebLogic Suite and JBoss Enterprise Application Platform. These capabilities
figure largely in the changing nature of application server deployments, wherein there is deeper
interaction among all elements of the application-to-disk technology stack.
As both product capabilities and application server deployments advance, the level of complexity
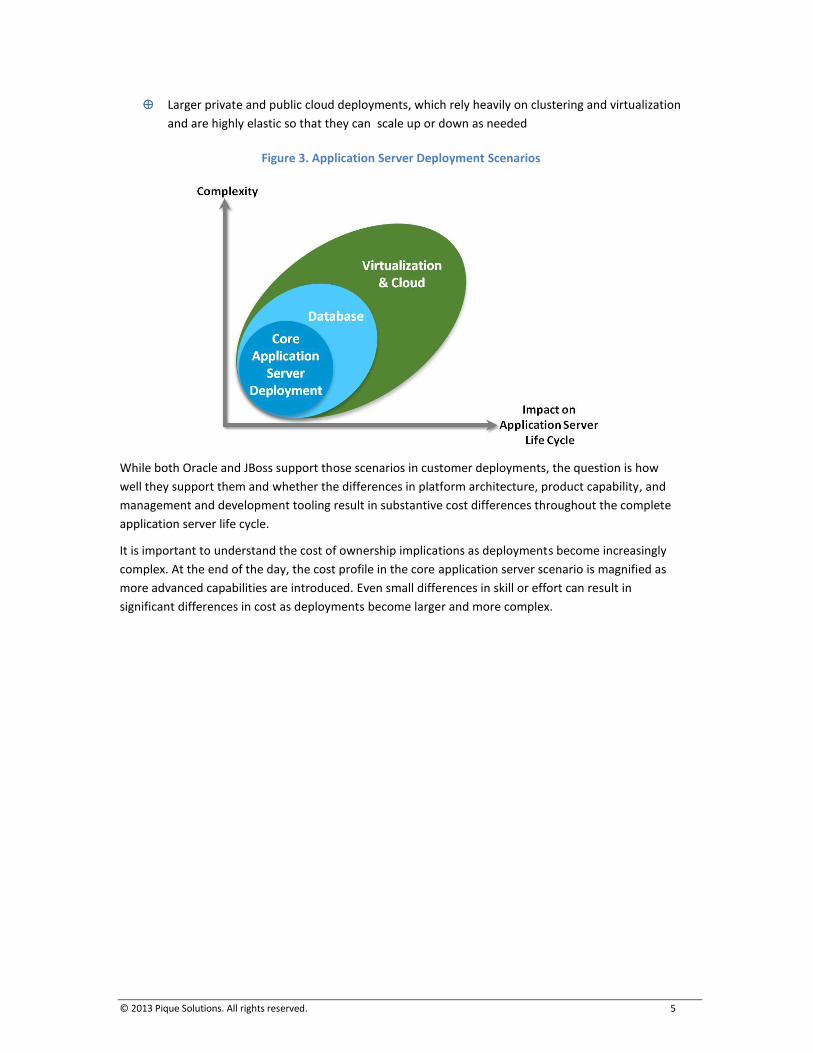
inherently increases. In terms of the nature of application server deployments, three relevant scenarios
for the cost of ownership discussion are illustrated in Figure 3:
The “core” application server deployment, which now commonly includes the application
server and an in-memory data grid for data-intensive applications
The database layer, which refers to the fact that since most applications require a database to
keep persistent data, the ability to take advantage of the native capabilities of the database in
an application server is critical
Installation & Configuration
Integration & Infrastructure
Testing
Application Deployment
Management & Administration
Monitoring, Diagnostics and
Tuning
Major Upgrade
© 2013 Pique Solutions. All rights reserved. 5
Larger private and public cloud deployments, which rely heavily on clustering and virtualization
and are highly elastic so that they can scale up or down as needed
Figure 3. Application Server Deployment Scenarios
While both Oracle and JBoss support those scenarios in customer deployments, the question is how
well they support them and whether the differences in platform architecture, product capability, and
management and development tooling result in substantive cost differences throughout the complete
application server life cycle.
It is important to understand the cost of ownership implications as deployments become increasingly
complex. At the end of the day, the cost profile in the core application server scenario is magnified as
more advanced capabilities are introduced. Even small differences in skill or effort can result in
significant differences in cost as deployments become larger and more complex.
© 2013 Pique Solutions. All rights reserved. 6
A Five-Year Cost of Ownership Comparison
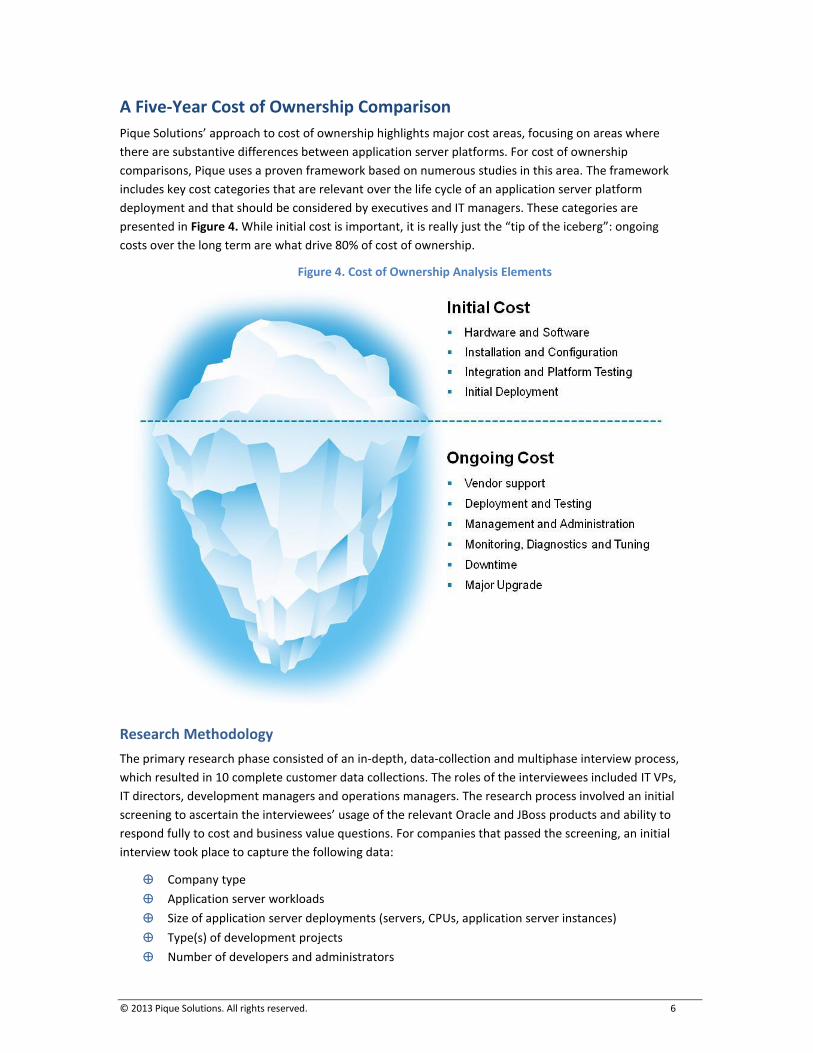
Pique Solutions’ approach to cost of ownership highlights major cost areas, focusing on areas where
there are substantive differences between application server platforms. For cost of ownership
comparisons, Pique uses a proven framework based on numerous studies in this area. The framework
includes key cost categories that are relevant over the life cycle of an application server platform
deployment and that should be considered by executives and IT managers. These categories are
presented in Figure 4. While initial cost is important, it is really just the “tip of the iceberg”: ongoing
costs over the long term are what drive 80% of cost of ownership.
Figure 4. Cost of Ownership Analysis Elements
Research Methodology
The primary research phase consisted of an in-depth, data-collection and multiphase interview process,
which resulted in 10 complete customer data collections. The roles of the interviewees included IT VPs,
IT directors, development managers and operations managers. The research process involved an initial
screening to ascertain the interviewees’ usage of the relevant Oracle and JBoss products and ability to
respond fully to cost and business value questions. For companies that passed the screening, an initial
interview took place to capture the following data:
Company type
Application server workloads
Size of application server deployments (servers, CPUs, application server instances)
Type(s) of development projects
Number of developers and administrators
© 2013 Pique Solutions. All rights reserved. 7
Following the interview, each company was given a detailed data-collection instrument, which
contained 70 unique, quantitative data elements along with a provision for qualitative descriptions of
the responses. The questions and entries spanned the life cycle of the deployment from purchase to
major upgrade cycle.
The companies that were interviewed represented a range of industries, including health care, business
services, financial services, technology providers, education services, media and telecommunications.
The composite profile used for the cost of ownership analysis, based on all of the companies
interviewed in the study, is provided in Table 1.
Table 1. Composite Profile for Cost of Ownership Analysis (average of all study participants)
240 physical application servers (hosts)
4 CPUs/servers
3 application server instances per host
20 unique application(s) modules served (custom, packaged, etc.)
6,086 total end users of applications
9 full-time developers/architects (72% employee vs. contractor)
6 full-time administrators (81% employee vs. contractor)
Comparing the Cost of the “Core” Application Server Deployment
This section defines the baseline comparison of cost for the core deployment, including:
Application servers
Java SE support
Management tools
In-memory data grid
Real-time environment
This section analyzes the cost of ownership over five years of two modest-size deployments of five
physical application servers, with apples-to-apples hardware and software configuration. The servers
have two multicore processors and host an average of four virtual application server instances. Table 2
outlines the pro forma costs for the deployment scenario for the core application server configurations.
The acquisition and ongoing support costs reflect current list prices, less an average discount of 25%,
while the people costs for implementation, deployment, testing, administration and management are
based on the primary research data collected. All costs are listed in US dollars.
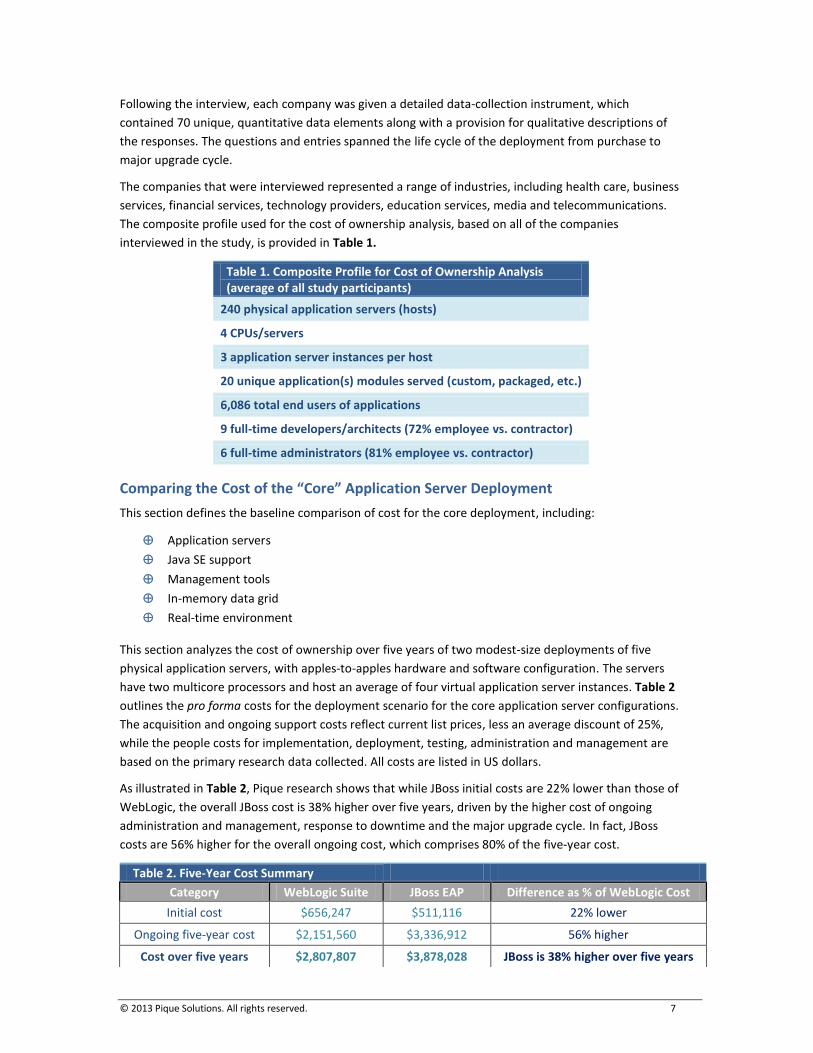
As illustrated in Table 2, Pique research shows that while JBoss initial costs are 22% lower than those of
WebLogic, the overall JBoss cost is 38% higher over five years, driven by the higher cost of ongoing
administration and management, response to downtime and the major upgrade cycle. In fact, JBoss
costs are 56% higher for the overall ongoing cost, which comprises 80% of the five-year cost.
Table 2. Five-Year Cost Summary
Category WebLogic Suite JBoss EAP Difference as % of WebLogic Cost
Initial cost $656,247 $511,116 22% lower
Ongoing five-year cost $2,151,560 $3,336,912 56% higher
Cost over five years $2,807,807 $3,878,028 JBoss is 38% higher over five years
© 2013 Pique Solutions. All rights reserved. 8
While WebLogic is more
costly initially, in the
second year the JBoss
cumulative cost curve
intersects the WebLogic
cost curve, and JBoss
becomes more costly in
each of the subsequent
years.
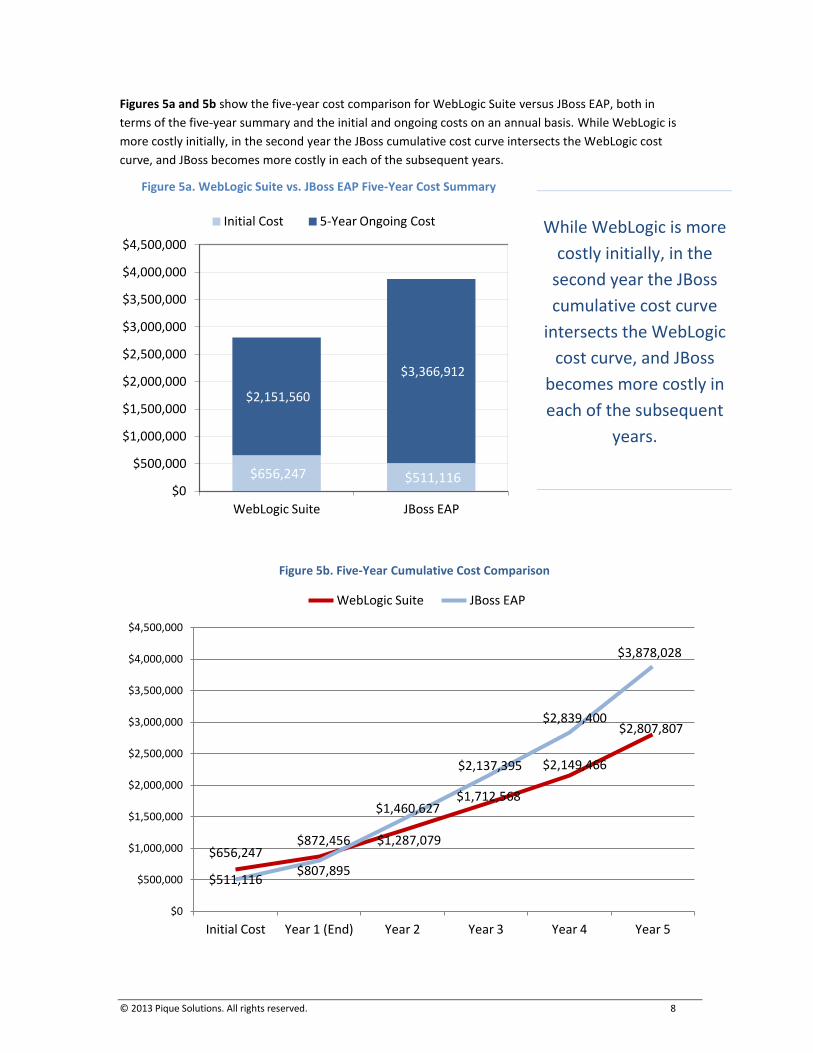
Figures 5a and 5b show the five-year cost comparison for WebLogic Suite versus JBoss EAP, both in
terms of the five-year summary and the initial and ongoing costs on an annual basis. While WebLogic is
more costly initially, in the second year the JBoss cumulative cost curve intersects the WebLogic cost
curve, and JBoss becomes more costly in each of the subsequent years.
Figure 5a. WebLogic Suite vs. JBoss EAP Five-Year Cost Summary
$656,247 $872,456 $1,287,079
$1,712,568
$2,149,466
$2,807,807
$511,116 $807,895
$1,460,627
$2,137,395
$2,839,400
$3,878,028
$0
$500,000
$1,000,000
$1,500,000
$2,000,000
$2,500,000
$3,000,000
$3,500,000
$4,000,000
$4,500,000
Initial Cost Year 1 (End) Year 2 Year 3 Year 4 Year 5
Figure 5b. Five-Year Cumulative Cost Comparison
WebLogic Suite JBoss EAP
$656,247 $511,116
$2,151,560
$3,366,912
$0
$500,000
$1,000,000
$1,500,000
$2,000,000
$2,500,000
$3,000,000
$3,500,000
$4,000,000
$4,500,000
WebLogic Suite JBoss EAP
Initial Cost 5-Year Ongoing Cost
© 2013 Pique Solutions. All rights reserved. 9
Initial Cost: The Tip of the Iceberg
Performing an accurate comparison of the initial costs of an application server platform can be a
challenging task, but it is crucial to understanding the foundation of total cost. IT professionals choosing
an application server platform must do their due diligence, gaining a thorough understanding of what is
included in each offering and what needs to be added or developed separately to provide similar
performance and functionality. In turn, they also must understand the cost associated with making the
purchased components work together in the initial implementation.
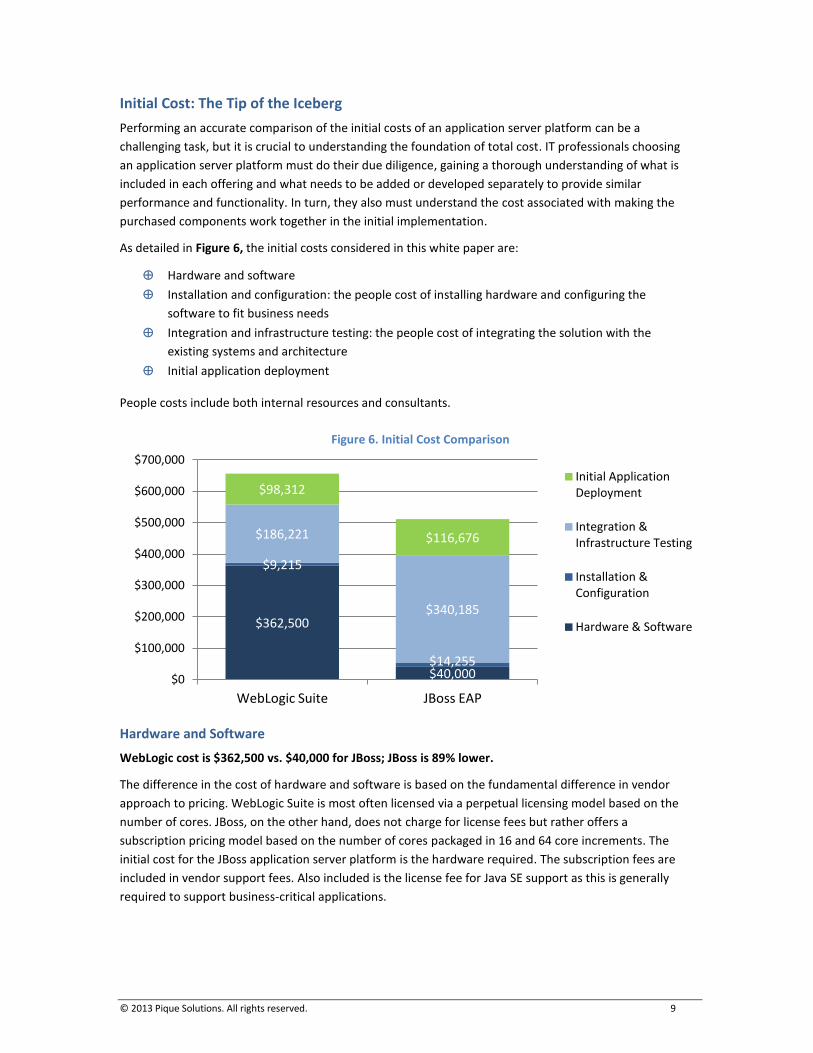
As detailed in Figure 6, the initial costs considered in this white paper are:
Hardware and software
Installation and configuration: the people cost of installing hardware and configuring the
software to fit business needs
Integration and infrastructure testing: the people cost of integrating the solution with the
existing systems and architecture
Initial application deployment
People costs include both internal resources and consultants.
Hardware and Software
WebLogic cost is $362,500 vs. $40,000 for JBoss; JBoss is 89% lower.
The difference in the cost of hardware and software is based on the fundamental difference in vendor
approach to pricing. WebLogic Suite is most often licensed via a perpetual licensing model based on the
number of cores. JBoss, on the other hand, does not charge for license fees but rather offers a
subscription pricing model based on the number of cores packaged in 16 and 64 core increments. The
initial cost for the JBoss application server platform is the hardware required. The subscription fees are
included in vendor support fees. Also included is the license fee for Java SE support as this is generally
required to support business-critical applications.
$362,500
$40,000
$9,215
$14,255
$186,221
$340,185
$98,312
$116,676
$0
$100,000
$200,000
$300,000
$400,000
$500,000
$600,000
$700,000
WebLogic Suite JBoss EAP
Figure 6. Initial Cost Comparison
Initial Application Deployment
Integration & Infrastructure Testing
Installation & Configuration
Hardware & Software
© 2013 Pique Solutions. All rights reserved. 10
“We find JBoss very
challenging to integrate with
our core infrastructure and
applications, most of which
are not open source.”
Manager, IT
Telecommunications Firm
Installation and Configuration
WebLogic cost is $9,215 vs. $14,255 for JBoss; JBoss is 55% higher.
For basic installation of the application server, management tools and back-end database connection,
study participants found that the cost of JBoss was 26% lower than WebLogic in terms of skill-adjusted
effort. That said, study participants cited a significant difference in the installation of the in-memory
data grid software, with Oracle Coherence taking 51% less time than JBoss Data Grid. In terms of
configuration activities, WebLogic required on average 54% to 68% less effort for cluster configuration,
cluster domain configuration, policy conformance and virtual instance creation. Scripting/automation
tool development was another area that resulted in additional cost for JBoss; administrators spent
triple the time as their WebLogic counterparts on this activity. Lastly, configuration of the in-memory
data grid was also a significant factor in the cost difference, with 55% less effort required for Oracle
Coherence than for JBoss Data Grid. When an organization runs a data grid on several hundred servers,
management is no longer a “nice to have” feature; it becomes critical. Participants cited the Coherence
GUI for significant ease of configuring the clusters and the distributed data grid.
Integration and Infrastructure Testing
WebLogic cost is $186,221 vs. $340,185 for JBoss; JBoss is 83% higher.
Integration and infrastructure testing were areas that study
participants cited as a significant difference in terms of effort and
cost when comparing WebLogic to JBoss. While the effort required
for infrastructure testing was pretty even, there was a very large
difference in the level of effort and skill required for integration
activities. WebLogic participants required 28% less time on average
for integration with other middleware components and 58% less
time for integration with existing infrastructure and applications.
They pointed out that because Oracle provides an already
integrated platform and management, less time is required for
provisioning and integration, whereas JBoss relies on many open
source and other third-party components. The average skill level
for these activities was 0.9 for WebLogic and 1.17 for JBoss.
Overall, the result was over 49% less cost for WebLogic. An IT
manager for a telecommunications company related, “Unless we
are talking about light workloads where there is integration to other open source tools, we find JBoss
very challenging to integrate with our core infrastructure and applications, most of which are not open
source.”
Initial Application Deployment
WebLogic cost is $98,312 vs. $116,676 for JBoss; JBoss is 19% higher.
The cost of application deployment includes both developer and administrator time for deploying
applications to production environments. While deployment is a straightforward activity with just
development and production environments, the activity becomes more complex as environments for
testing and staging are added. Also, the tiers of the deployment, including the applications, databases,
data grids and web servers, also add complexity. A lot of automation is possible in Oracle deployment
because of tools and prebuilt virtual machine templates, which contain certified installations for the
automatic building of application assemblies. Study participants indicated fairly similar effort and cost
© 2013 Pique Solutions. All rights reserved. 11
“WebLogic allows us to
simplify and automate
pretty much everything we
need to do, specifically
application deployment.”
Director, IT
Health Care Company
for developers deploying applications on the two platforms but
identified significant time savings for administrators in deploying
applications. On average, study participants cited a savings of over
30% because of the WebLogic tools, which they found easy to use
and which offer a high degree of automation. According to a director
of IT for a health care company, “WebLogic allows us to simplify and
automate pretty much everything we need to do, specifically
application deployment.”
Ongoing Costs: The Real Driver of Cost of Ownership
Ongoing costs are the recurring costs associated with the application
server platform, including the annual support fees paid to the
vendor and the people cost over each of the five years considered in
the cost of ownership analysis. In other words, ongoing costs include
all of the costs after the initial purchase and implementation through the fifth year. Ongoing costs are
less obvious because they are not explicit cost items in the capital expense (CAPEX) statement.
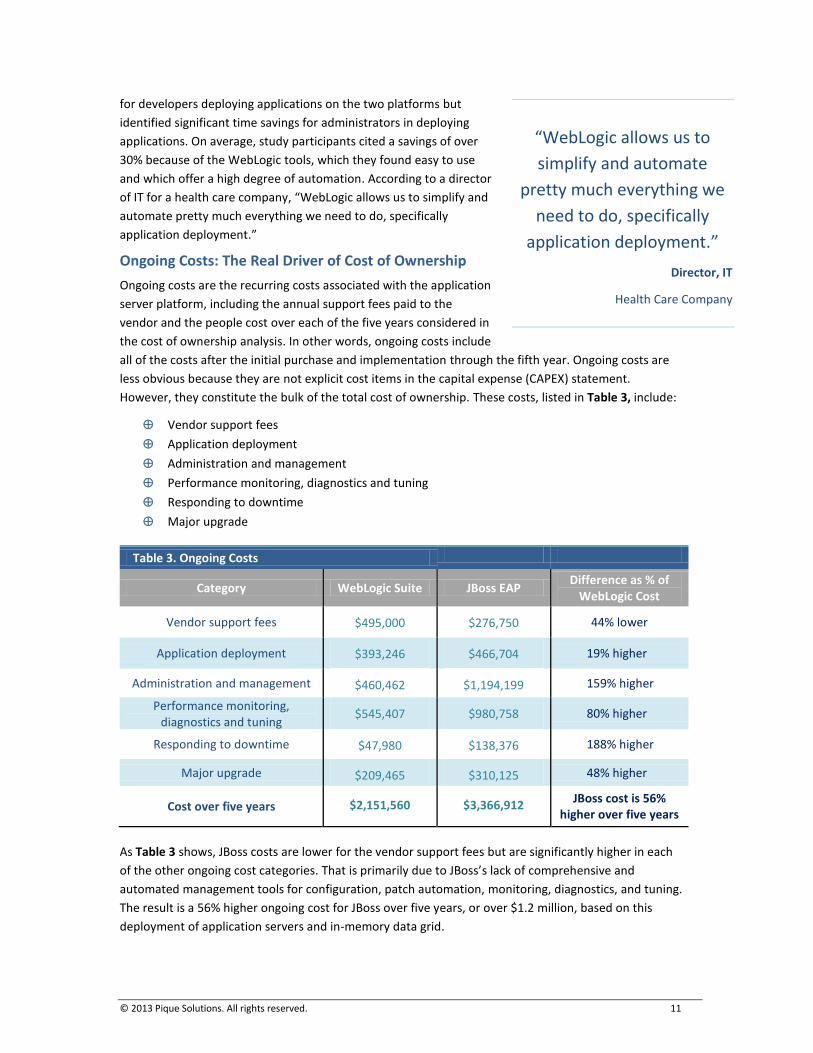
However, they constitute the bulk of the total cost of ownership. These costs, listed in Table 3, include:
Vendor support fees
Application deployment
Administration and management
Performance monitoring, diagnostics and tuning
Responding to downtime
Major upgrade
Table 3. Ongoing Costs
Category WebLogic Suite JBoss EAP Difference as % of
WebLogic Cost
Vendor support fees $495,000
$276,750 44% lower
Application deployment $393,246 $466,704 19% higher
Administration and management $460,462
$1,194,199 159% higher
Performance monitoring, diagnostics and tuning
$545,407 $980,758 80% higher
Responding to downtime $47,980 $138,376 188% higher
Major upgrade $209,465 $310,125 48% higher
Cost over five years $2,151,560 $3,366,912 JBoss cost is 56%
higher over five years
As Table 3 shows, JBoss costs are lower for the vendor support fees but are significantly higher in each
of the other ongoing cost categories. That is primarily due to JBoss’s lack of comprehensive and
automated management tools for configuration, patch automation, monitoring, diagnostics, and tuning.
The result is a 56% higher ongoing cost for JBoss over five years, or over $1.2 million, based on this
deployment of application servers and in-memory data grid.
© 2013 Pique Solutions. All rights reserved. 12
“The management and
administration are
significantly higher for JBoss
due to less maturity of the
platform and the tooling.”
Manager, IT
Telecommunications Firm
Vendor Support
WebLogic cost is $495,000 vs. $276,750 for JBoss; JBoss is 44% lower over five years.
These costs for Oracle WebLogic are calculated based on the software license, with Oracle charging an
annual support fee of 22% of software list price to provide product updates/upgrades, vendor support
and premium access to support content. JBoss vendor support fees are the annual subscription fees for
the right to use the software and support from Red Hat. These fees are based on the number of cores in
the deployment and include both the JBoss Enterprise Application Platform and JBoss Data Grid. In
addition, the cost of support for JBoss also included the ongoing support cost for Java SE. Based on the
size of the deployment, JBoss vendor support fees are 44% lower than WebLogic over five years.
Ongoing Application Deployment
WebLogic cost is $393,246 vs. $466,704 for JBoss; JBoss is 19% higher over five years.
Similar to the initial cost analysis, there is an ongoing cost component for deploying applications
including both developers and administrators. The cost savings delta is the same with JBoss 19% higher
in years 2 through 5 due primarily to the difference in effort and cost for administrator involvement in
application deployment. JBoss study participants cited the need to develop and manage scripts over
time versus the more automated nature of activities for their WebLogic counterparts. Further, the
average skill factor for administrators’ role in application deployment was 0.9 for WebLogic vs. 1.1 for
JBoss.
Administration and Management
WebLogic cost is $460,462 vs. $1,194,199 for JBoss; JBoss is 159% higher over five years.
This was an area of significant depth in the study and also an area where there was a considerable
difference between WebLogic and JBoss. Study participants provided time
and effort data for 20 activities related to the application servers and in-
memory data grid servers. There was a considerable advantage for
WebLogic, with a 44% lower cost for the application server and a 63%
lower cost for in-memory data grid management. The common factor was
a fundamental difference in the tooling between environments: Oracle
provides a much more complete management capability, including cross-
tier management, through Oracle Enterprise Manager. In contrast, JBoss
management requires more extensive manual work, resulting in
significant human capital and time costs.
An IT manager for a telecommunications firm said, “The management and
administration are significantly higher for JBoss due to less maturity of the
platform and the tooling.” Finally, study participants cited a big difference
in the skill level required in the JBoss environment. They found it much
easier overall to do activities in WebLogic, without having to develop scripts to perform administration.
In rating the overall skill factor required for application server activities, participants gave WebLogic an
average of 0.71 on a scale of 0.5 to 1.5, compared to a rating of 1.23 for JBoss. Minor upgrades and
patching were two activities noted as being very easy to do in WebLogic, each with a skill index rating of
0.6. An IT director for a health care provider said, “Enterprise Manager is a single product that manages
the database, middleware and apps all in one place. Each of our administrators is able to manage all
aspects of the deployment versus having specialized skills for different pieces of our infrastructure.”
© 2013 Pique Solutions. All rights reserved. 13
Monitoring, Diagnostics and Tuning
WebLogic cost is $545,407 vs. $980,758 for JBoss; JBoss is 80% higher over five years.
This was another area of extensive data collection; between the application server and the in-memory
data grid, 12 activities were evaluated. Again, the data from the respondents suggested a significant
advantage for WebLogic versus JBoss, particularly when it comes to the in-memory data grid. While
WebLogic required on average 20% less effort for the application server, that difference grows to 61%
for monitoring, diagnostics and tuning for the in-memory data grid. The single largest area of difference
was in the area of diagnosing performance problems and determining where the performance
bottleneck lies. JBoss respondents indicated they spent on average 18 hours per month on this activity
while their WebLogic counterparts spent only 4.4 hours. For the WebLogic participants, this savings was
attributed largely to advanced tooling such as Oracle JRockit Mission Control system, Java Virtual
Machine Diagnostics (JVM Diagnostics), WebLogic Operations Control, and the Oracle Process Manager
and Notification server (OPMN), which enabled them to automate diagnostics, memory leak detection
and notification. They liked that Oracle JVM Diagnostics can detect and diagnose Java-related problems
and bottlenecks without any instrumentation, while JBoss’s Java Diagnostics requires elaborate byte
code instrumentation (BCI), resulting in significant effort to resolve problems and adding the risk of
additional downtime due to inserting diagnostics code into user applications in production.
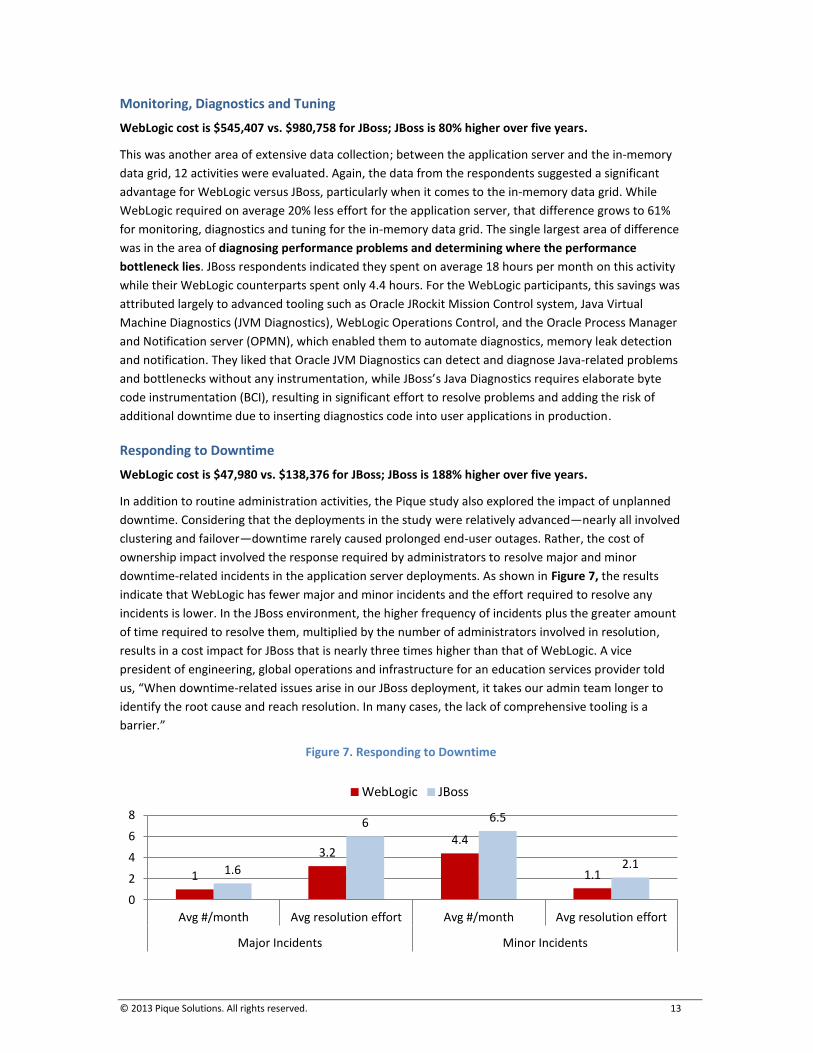
Responding to Downtime
WebLogic cost is $47,980 vs. $138,376 for JBoss; JBoss is 188% higher over five years.
In addition to routine administration activities, the Pique study also explored the impact of unplanned
downtime. Considering that the deployments in the study were relatively advanced—nearly all involved
clustering and failover—downtime rarely caused prolonged end-user outages. Rather, the cost of
ownership impact involved the response required by administrators to resolve major and minor
downtime-related incidents in the application server deployments. As shown in Figure 7, the results
indicate that WebLogic has fewer major and minor incidents and the effort required to resolve any
incidents is lower. In the JBoss environment, the higher frequency of incidents plus the greater amount
of time required to resolve them, multiplied by the number of administrators involved in resolution,
results in a cost impact for JBoss that is nearly three times higher than that of WebLogic. A vice
president of engineering, global operations and infrastructure for an education services provider told
us, “When downtime-related issues arise in our JBoss deployment, it takes our admin team longer to
identify the root cause and reach resolution. In many cases, the lack of comprehensive tooling is a
barrier.”
Figure 7. Responding to Downtime
1
3.2 4.4
1.1 1.6
6 6.5
2.1
0
2
4
6
8
Avg #/month Avg resolution effort Avg #/month Avg resolution effort
Major Incidents Minor Incidents
WebLogic JBoss
© 2013 Pique Solutions. All rights reserved. 14
“Oracle does a very good job
of versioning its products.
We can still run efficiently
with different versions
working together and we
aren’t necessarily forced to
upgrade. But when we
choose to, it is very
straightforward.”
VP of Operations
Business Services
The Major Upgrade
Pique Solutions also investigated as part of this study the cost and time associated with a major
platform upgrade. This event typically takes place sometime between the third and fifth year of the
application server deployment. While a major platform upgrade is a costly proposition in any
environment, JBoss study participants found it took longer and resulted in a considerable amount of
labor cost in comparison to the same event on WebLogic. In
particular, data was collected on two particular activities in the major
upgrade cycle: (1) the porting and recoding of existing applications,
and (2) integrating new or additional components during the
upgrade cycle. For both activities, participants found there was
greater effort involved for JBoss environments, with 56% and 33%
more time and effort, respectively, than for WebLogic. Overall, this
equates to a 48% time and cost differential. With JBoss, participants
cited several challenges in the EAP 5.x to EAP 6 upgrade, including
resolving application version conflicts, required changes in
configuration files, and assimilating significant changes to key
components such as JMS, Data Grid and the Management Console.
With Oracle, study participants found greater consistency between
major releases, easing the burden of cost and time. Study participants
also noted that Oracle does a good job maintaining interoperability
among different versions of application server platform components
in a given environment. In fact, running multiple versions of the
platform or individual components was a very common practice
among study participants. A vice president of operations for a
business services company told Pique, “Oracle does a very good job
of versioning its products. We can still run efficiently with different versions working together and we
aren’t necessarily forced to upgrade. But when we choose to, it is very straightforward.”
© 2013 Pique Solutions. All rights reserved. 15
“Our business runs on Oracle
ERP and we use Oracle
databases. Choosing
WebLogic as our application
server was a huge advantage
in terms of integration and
manageability with a single
tool.”
Director, IT
Health Care Company
Increasing Complexity: The Cost Impact of Data-Intensive and Cloud Scenarios
The study participants cited significant cost savings for a deployment
of a core application server platform based on WebLogic, including an
in-memory data grid. However, the research indicates that greater
savings exist in other deployment scenarios, including database-
intensive deployments and larger, cloud-based deployments. In fact,
for those more complex deployments, the analysis found that the
difference in cost increased in a nonlinear fashion.
Database Scenario
Not surprisingly, all of the study participants using WebLogic in
conjunction with a database were using Oracle as the back end. In
fact, Oracle databases were commonly being used in the JBoss
participants’ environments. Clearly, there is an advantage in
deploying a unified application server and database environment,
particularly so on the Oracle side. It proved easier for study
participants to install, configure, administer and manage both the
application server and database from a centralized administration
console. Survey participants stated that Oracle Enterprise Manager enabled them to simplify cross-tier
diagnostics and business transactions management and significantly lower the cost of life cycle
management for both the application server and database. Oracle WebLogic Active GridLink for Oracle
Real Application Clusters (RAC) also enabled them to maximize database connection performance,
availability and scalability. With JBoss, customers have to depend on numerous vendors and their point
solutions to manage their environments. An IT director for a health care firm confirmed this, saying,
“Our business runs on Oracle ERP and we use Oracle databases. Choosing WebLogic as our application
server was a huge advantage in terms of integration and manageability with a single tool.”
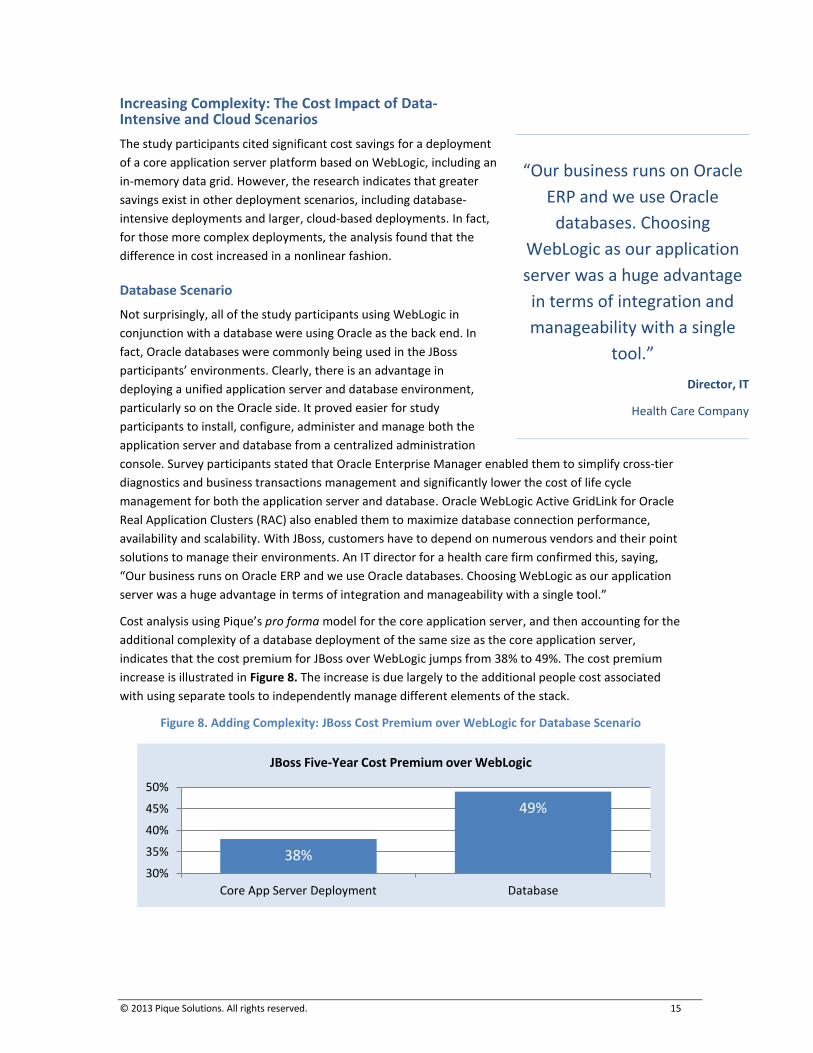
Cost analysis using Pique’s pro forma model for the core application server, and then accounting for the
additional complexity of a database deployment of the same size as the core application server,
indicates that the cost premium for JBoss over WebLogic jumps from 38% to 49%. The cost premium
increase is illustrated in Figure 8. The increase is due largely to the additional people cost associated
with using separate tools to independently manage different elements of the stack.
Figure 8. Adding Complexity: JBoss Cost Premium over WebLogic for Database Scenario
38%
49%
30%
35%
40%
45%
50%
Core App Server Deployment Database
JBoss Five-Year Cost Premium over WebLogic
© 2013 Pique Solutions. All rights reserved. 16
Virtualization and Cloud
The third deployment scenario common in Pique Solutions’ research was a cloud deployment. When
compared to the previous two, these deployments were larger and more complex in nature and had
more physical servers and a much greater density of virtual application servers. In addition, the
clustering deployments were more advanced, with a higher degree of clustering and the addition of
“geo-,” or multisite, clustering to provide support for disaster recovery. These deployments exacted a
premium for manageability and scalability.
In addition, participants cited Oracle VM Templates for Oracle OS, Middleware, Database and
Applications, with software components already preinstalled and patched, to be highly valuable in
reducing the time and cost required to deploy applications. Customers of Oracle WebLogic highlighted
how Oracle Enterprise Manager and Oracle Virtual Assembly Builder (OVAB) enabled their
administrators to use these virtual machine templates to quickly configure and provision entire
multitier applications onto virtualized and cloud environments. With JBoss, such applications have to be
provisioned manually, requiring significant effort and resulting in delays and errors. Survey participants
said they also had to deal with management tools from multiple vendors, resulting in added costs of
integration and testing. The lack of these native features in JBoss, combined with a less than complete
management capability, magnified the costs associated with the core deployment and database
scenarios.
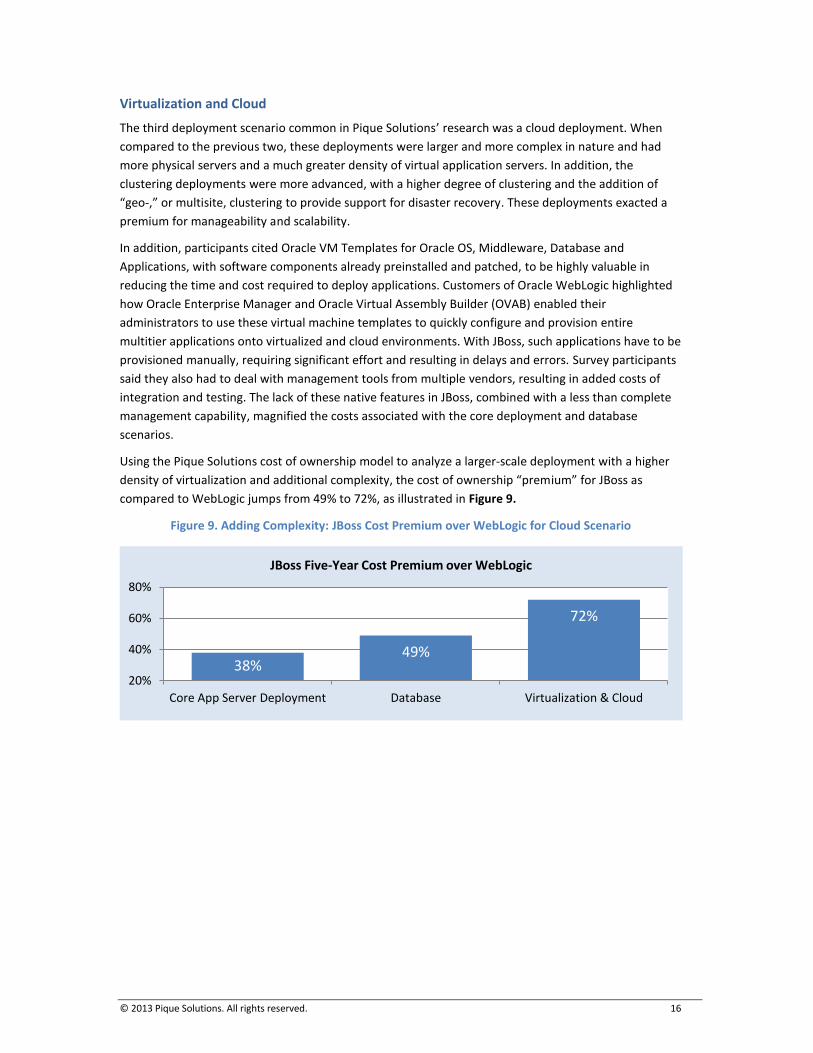
Using the Pique Solutions cost of ownership model to analyze a larger-scale deployment with a higher
density of virtualization and additional complexity, the cost of ownership “premium” for JBoss as
compared to WebLogic jumps from 49% to 72%, as illustrated in Figure 9.
Figure 9. Adding Complexity: JBoss Cost Premium over WebLogic for Cloud Scenario
38% 49%
72%
20%
40%
60%
80%
Core App Server Deployment Database Virtualization & Cloud
JBoss Five-Year Cost Premium over WebLogic
© 2013 Pique Solutions. All rights reserved. 17
“Management and
virtualization of the JBoss
environment have proven
more difficult and very costly.
Open source is trickier
because even though it may
be easier to implement,
versioning becomes difficult
to always stay on top of, and
the admin learning curve gets
steeper.”
VP Engineering, Global Operations &
Infrastructure
Education Services
Conclusion and Key Takeaways
It is not at all surprising that open source vendors like Red Hat continue to pitch the notion that their
solutions have a lower initial cost. It is an area where JBoss has a cost advantage, as further evidenced
by this study. The limitation of that positioning lies in the fact that software licensing and support
subscription, the areas Red Hat promotes as providing cost savings, account for only 20% of long-term
cost of ownership.
Fundamental differences in product philosophy, overall architecture and tooling create serious cost
implications for enterprise customers. Realistic cost of ownership assessments consider what it takes,
from a people-cost perspective, to “get to production,” manage and maintain a healthy application
server deployment and ultimately upgrade to the next major release of the platform. Summarized best
by a vice president of engineering, global operations and infrastructure, “Management and
virtualization of the JBoss environment have proven more difficult
and very costly. Open source is trickier because even though it may
be easier to implement, versioning becomes difficult to always stay
on top of, and the admin learning curve gets steeper.”
The following points summarize the key findings from the study.
Despite a higher initial cost, WebLogic requires far less effort and
skill to fully implement, manage, maintain and upgrade throughout
the life cycle of the application server. According to a full, five-year
analysis, a core application server deployment of JBoss is 38% more
costly than a similar deployment on WebLogic. Because of the
significant difference in operations cost between WebLogic and
JBoss, JBoss becomes more costly in the second year of the
application server life cycle.
JBoss customers suffer from challenges in a major platform
upgrade. Study participants cited a longer and more expensive
process for conducting a platform upgrade on JBoss, particularly from
earlier versions. Supporting different versions of platform
components and applications also presents management issues.
The WebLogic cost of ownership advantage increases with
increasing complexity. The JBoss cost premium of 38% for the core
application server deployment grows significantly as additional
complexity is added in terms of capability and scale. For a database
scenario, the cost premium increases to 49%, and for a larger-scale cloud deployment, it jumps to 72%.
© 2013 Pique Solutions. All rights reserved. 18
Appendix A: Estimating “People Cost”—a Skill-Adjusted Effort
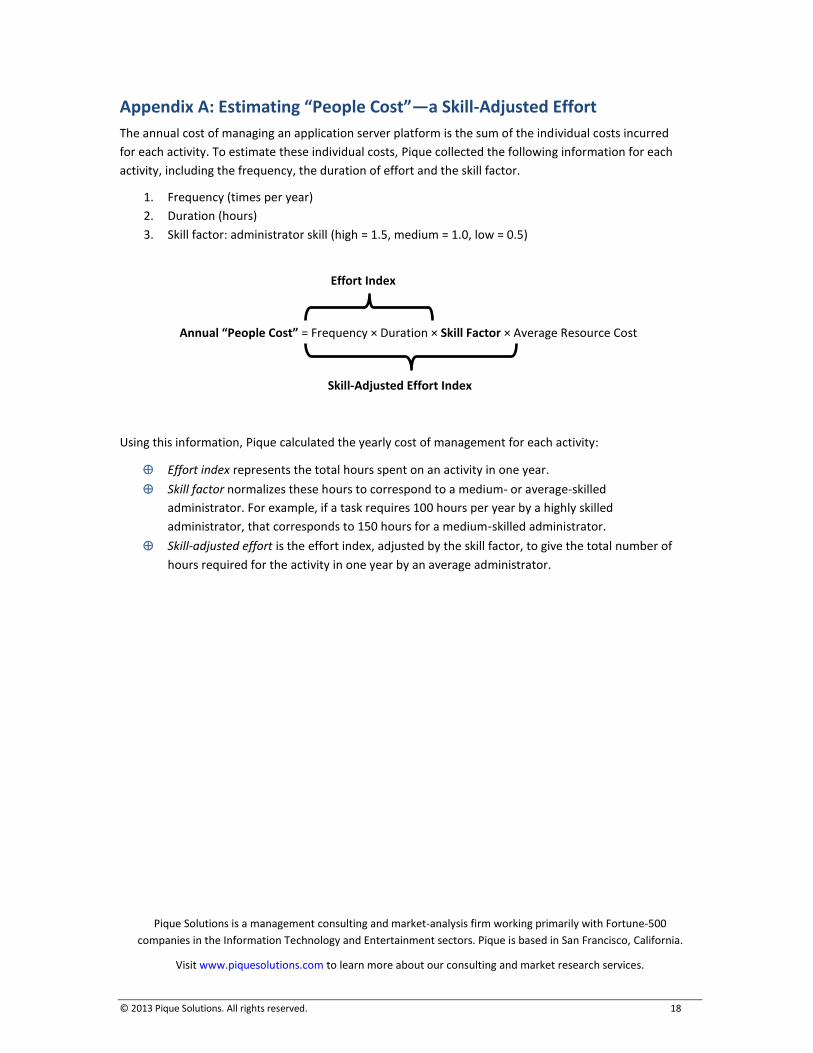
The annual cost of managing an application server platform is the sum of the individual costs incurred
for each activity. To estimate these individual costs, Pique collected the following information for each
activity, including the frequency, the duration of effort and the skill factor.
1. Frequency (times per year)
2. Duration (hours)
3. Skill factor: administrator skill (high = 1.5, medium = 1.0, low = 0.5)
Using this information, Pique calculated the yearly cost of management for each activity:
Effort index represents the total hours spent on an activity in one year.
Skill factor normalizes these hours to correspond to a medium- or average-skilled
administrator. For example, if a task requires 100 hours per year by a highly skilled
administrator, that corresponds to 150 hours for a medium-skilled administrator.
Skill-adjusted effort is the effort index, adjusted by the skill factor, to give the total number of
hours required for the activity in one year by an average administrator.
Annual “People Cost” = Frequency × Duration × Skill Factor × Average Resource Cost
Effort Index
Skill-Adjusted Effort Index
Pique Solutions is a management consulting and market-analysis firm working primarily with Fortune-500
companies in the Information Technology and Entertainment sectors. Pique is based in San Francisco, California.
Visit www.piquesolutions.com to learn more about our consulting and market research services.