Embed Size (px)
Citation preview
REVIEW PAPER
Application of vibration monitoring to the detection of earlymisalignment and rub failures in a tidal turbine
Beatriz Fraga De Cal1
Received: 25 April 2018 /Accepted: 24 April 201# Springer Nature Singapore Pte Ltd. 2019
AbstractResearch on tidal turbines has been mainly focused on the design for greater energy efficiency for the last ten years. However,achieving a reliable operation is becoming more and more crucial in current studies. This work presents a continuous monitoringof those turbines based on vibrations controls the control, this technique allows implementing predictive maintenance strategies.The vibration response is analysed in a laboratory test rig. That vibration can be produced by a phenomenon as frequent as amisalignment of the shaft as well as their consequences in the early production of partial rub of the rotor/stator. The responseobtained shows that one can easily detect a vibration signal with a misalignment in the shaft of 50 μm. Also, the rub of the shaft/seal is detected with the increase of the dynamic stiffness of the system from 12,87 to 14,30 KN/m. Additionally, the resonancefrequency also increases its value from 2400 to 2500 rpm. The application of this early detection on the watertight seal of a tidalturbine, would potentially avoid severe hazards in these equipment.
Keywords Tidal Turbine . Vibration response .Misalignment . Rubs . Dynamic stiffness
Introduction
Idea of the importance currently being taken by the research oftidal energy, as renewable energy sources, is the creation of theUnited Kingdom in the year 2015 [1] the ORJIP-OCEANENERGY, in which important state subsidies are provided,and where it performs projects and designs of tidal turbinesto achieve a higher technical efficiency and efficient opera-tion, that was created in 2003, with more than 30million (£) ofpublic funds, which were added companies such as ScottishEnterprise, which operates non-profit and is currentlycompletely independent and self-financed.
In 2008, the EMEC, together with the company OpenHydro, installed as a research test the first tidal turbine(0,3 MW) to generate electricity to the network in the UK,in addition to helping to better understand the behaviour ofmarine life around the machine and research on the potentialeffects at the population level of marine fauna, review anddissemination of environmental results.
The research on the optimization in the production of elec-trical energy, by means of turbines of tidal current or marine,and its design, is at the moment at the center of its develop-ment and tests [2, 3].
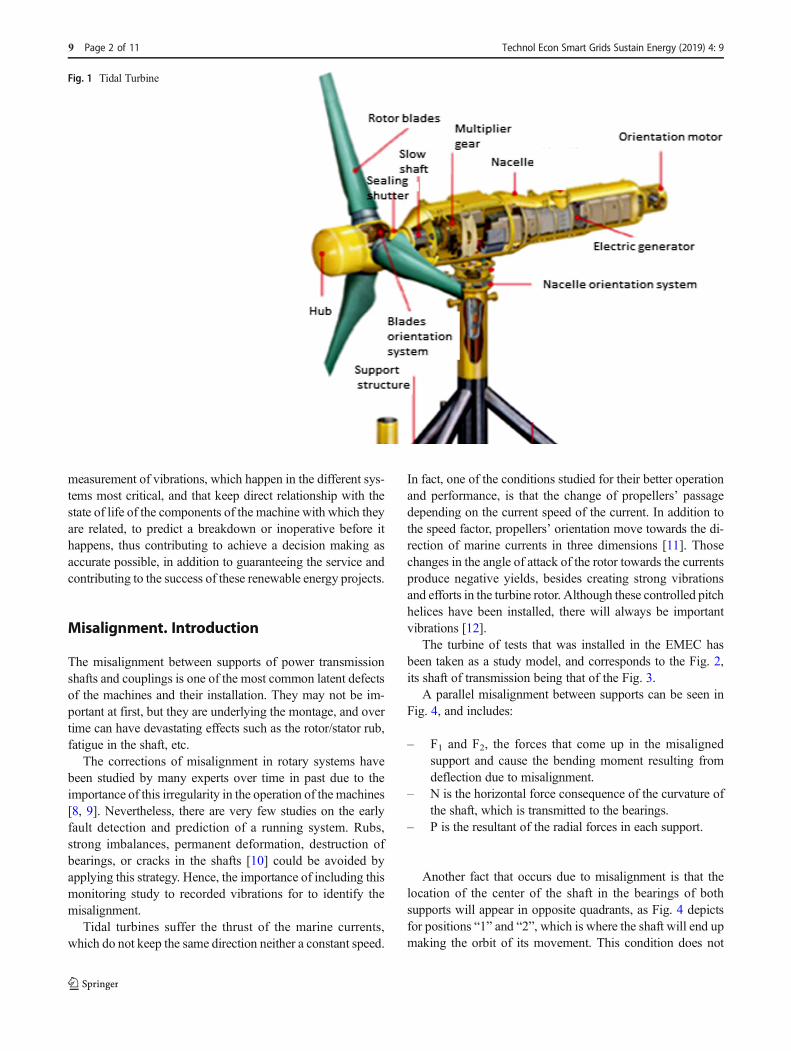
It is important to point out other institutions such as theEMEC [4] that was created in 2003, with more than 30million(£) of public funds, which were added companies such asScottish Enterprise, which operates non-profit and is currentlycompletely independent and self-financed. In 2008, theEMEC, together with the company Open Hydro, installed asa research test the first tidal turbine (0,3 MW) to generateelectricity to the network in the UK, Fig. 1.
The investigation of the efficiency and energetic perfor-mance of tidal turbines is being carried out in numerous orga-nizations and research centers, which will be essential for theirfuture and resulted; However, it will not be less important ifwe do not achieve equipment whose maintenance and opera-tion reaches high technical safety [5, 6]. Remember unsuc-cessful projects such as the Concorde plane, which was a hightechnological revolution, but which in 2003 made its lastflight, among other reasons for the high maintenance cost.Airbus refused to take charge of its maintenance.
It is necessary, therefore, to apply a great deal of attentionto provide the programming of the maintenance of tidal tur-bines [7] like can be an analysis system based on continuous
* Beatriz Fraga De [email protected]
1 University of A Coruña, Spain, Inverness, UK
https://doi.org/10.1007/s40866-019-0065-1
/Published online: 8 May 20199
Technology and Economics of Smart Grids and Sustainable Energy (2019) 4: 9
measurement of vibrations, which happen in the different sys-tems most critical, and that keep direct relationship with thestate of life of the components of the machine with which theyare related, to predict a breakdown or inoperative before ithappens, thus contributing to achieve a decision making asaccurate possible, in addition to guaranteeing the service andcontributing to the success of these renewable energy projects.
Misalignment. Introduction
The misalignment between supports of power transmissionshafts and couplings is one of the most common latent defectsof the machines and their installation. They may not be im-portant at first, but they are underlying the montage, and overtime can have devastating effects such as the rotor/stator rub,fatigue in the shaft, etc.
The corrections of misalignment in rotary systems havebeen studied by many experts over time in past due to theimportance of this irregularity in the operation of the machines[8, 9]. Nevertheless, there are very few studies on the earlyfault detection and prediction of a running system. Rubs,strong imbalances, permanent deformation, destruction ofbearings, or cracks in the shafts [10] could be avoided byapplying this strategy. Hence, the importance of including thismonitoring study to recorded vibrations for to identify themisalignment.
Tidal turbines suffer the thrust of the marine currents,which do not keep the same direction neither a constant speed.
In fact, one of the conditions studied for their better operationand performance, is that the change of propellers’ passagedepending on the current speed of the current. In addition tothe speed factor, propellers’ orientation move towards the di-rection of marine currents in three dimensions [11]. Thosechanges in the angle of attack of the rotor towards the currentsproduce negative yields, besides creating strong vibrationsand efforts in the turbine rotor. Although these controlled pitchhelices have been installed, there will always be importantvibrations [12].
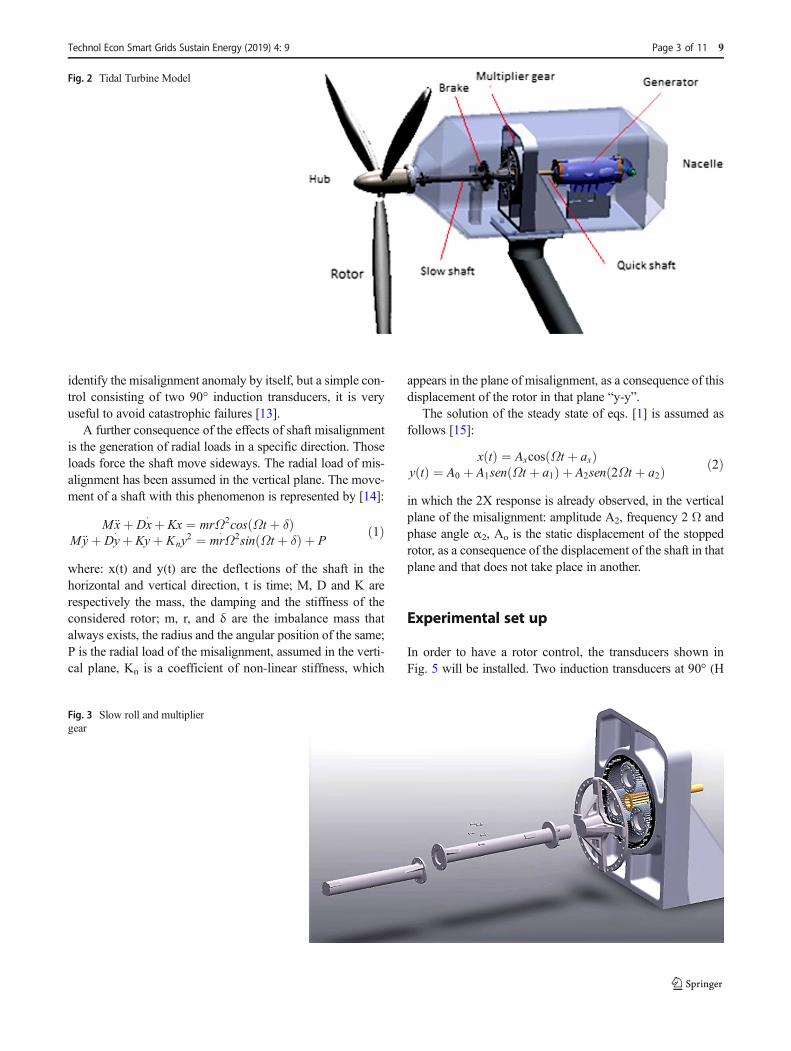
The turbine of tests that was installed in the EMEC hasbeen taken as a study model, and corresponds to the Fig. 2,its shaft of transmission being that of the Fig. 3.
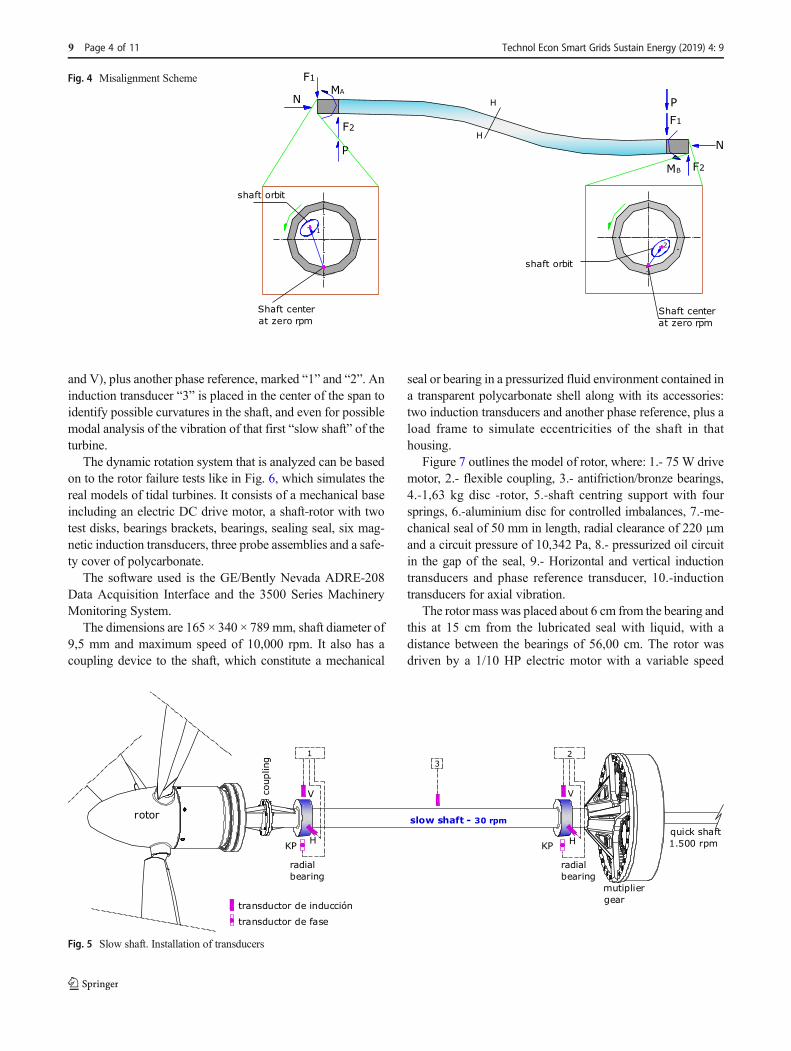
A parallel misalignment between supports can be seen inFig. 4, and includes:
– F1 and F2, the forces that come up in the misalignedsupport and cause the bending moment resulting fromdeflection due to misalignment.
– N is the horizontal force consequence of the curvature ofthe shaft, which is transmitted to the bearings.
– P is the resultant of the radial forces in each support.
Another fact that occurs due to misalignment is that thelocation of the center of the shaft in the bearings of bothsupports will appear in opposite quadrants, as Fig. 4 depictsfor positions “1” and “2”, which is where the shaft will end upmaking the orbit of its movement. This condition does not
Fig. 1 Tidal Turbine
Technol Econ Smart Grids Sustain Energy (2019) 4: 99 Page 2 of 11
identify the misalignment anomaly by itself, but a simple con-trol consisting of two 90° induction transducers, it is veryuseful to avoid catastrophic failures [13].
A further consequence of the effects of shaft misalignmentis the generation of radial loads in a specific direction. Thoseloads force the shaft move sideways. The radial load of mis-alignment has been assumed in the vertical plane. The move-ment of a shaft with this phenomenon is represented by [14]:
M€xþ Dx˙ þ Kx ¼ mrΩ2cos Ωt þ δð ÞM€yþ Dy˙ þ Kyþ Kny2 ¼ mr˙ Ω2sin Ωt þ δð Þ þ P
ð1Þ
where: x(t) and y(t) are the deflections of the shaft in thehorizontal and vertical direction, t is time; M, D and K arerespectively the mass, the damping and the stiffness of theconsidered rotor; m, r, and δ are the imbalance mass thatalways exists, the radius and the angular position of the same;P is the radial load of the misalignment, assumed in the verti-cal plane, Kn is a coefficient of non-linear stiffness, which
appears in the plane of misalignment, as a consequence of thisdisplacement of the rotor in that plane “y-y”.
The solution of the steady state of eqs. [1] is assumed asfollows [15]:
x tð Þ ¼ Axcos Ωt þ axð Þy tð Þ ¼ A0 þ A1sen Ωt þ a1ð Þ þ A2sen 2Ωt þ a2ð Þ ð2Þ
in which the 2X response is already observed, in the verticalplane of the misalignment: amplitude A2, frequency 2 Ω andphase angle α2, Ao is the static displacement of the stoppedrotor, as a consequence of the displacement of the shaft in thatplane and that does not take place in another.
Experimental set up
In order to have a rotor control, the transducers shown inFig. 5 will be installed. Two induction transducers at 90° (H
Fig. 2 Tidal Turbine Model
Fig. 3 Slow roll and multipliergear
Technol Econ Smart Grids Sustain Energy (2019) 4: 9 Page 3 of 11 9
and V), plus another phase reference, marked “1” and “2”. Aninduction transducer “3” is placed in the center of the span toidentify possible curvatures in the shaft, and even for possiblemodal analysis of the vibration of that first “slow shaft” of theturbine.
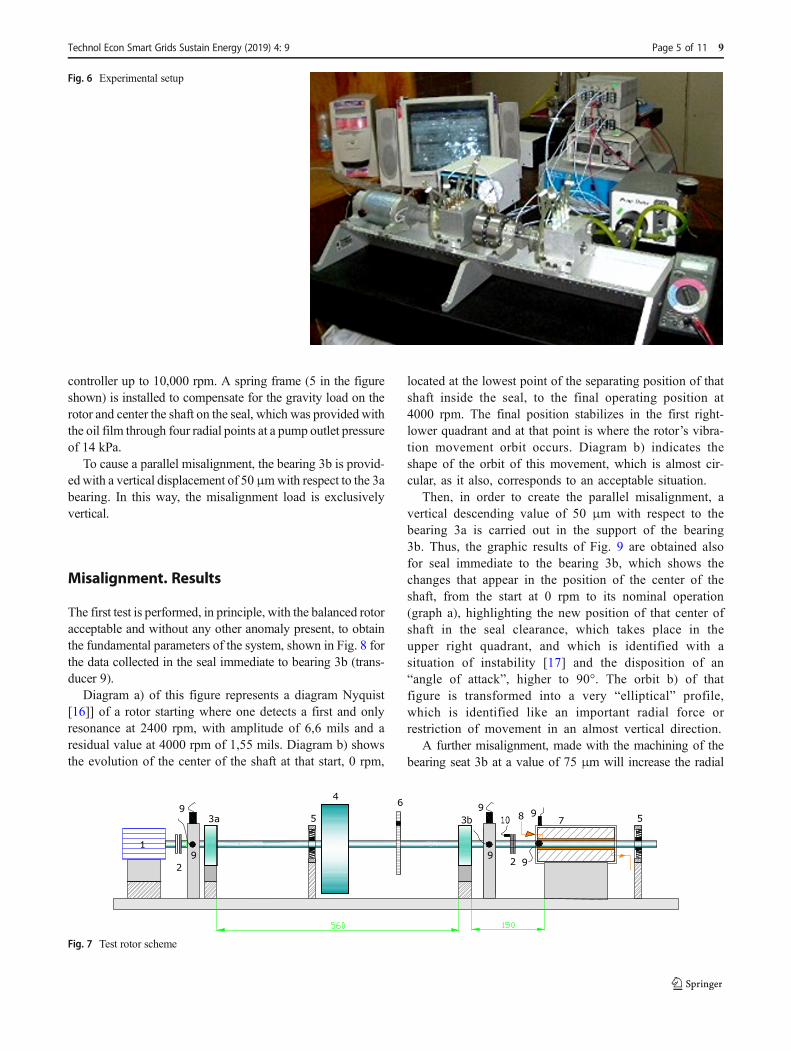
The dynamic rotation system that is analyzed can be basedon to the rotor failure tests like in Fig. 6, which simulates thereal models of tidal turbines. It consists of a mechanical baseincluding an electric DC drive motor, a shaft-rotor with twotest disks, bearings brackets, bearings, sealing seal, six mag-netic induction transducers, three probe assemblies and a safe-ty cover of polycarbonate.
The software used is the GE/Bently Nevada ADRE-208Data Acquisition Interface and the 3500 Series MachineryMonitoring System.
The dimensions are 165 × 340 × 789 mm, shaft diameter of9,5 mm and maximum speed of 10,000 rpm. It also has acoupling device to the shaft, which constitute a mechanical
seal or bearing in a pressurized fluid environment contained ina transparent polycarbonate shell along with its accessories:two induction transducers and another phase reference, plus aload frame to simulate eccentricities of the shaft in thathousing.
Figure 7 outlines the model of rotor, where: 1.- 75 W drivemotor, 2.- flexible coupling, 3.- antifriction/bronze bearings,4.-1,63 kg disc -rotor, 5.-shaft centring support with foursprings, 6.-aluminium disc for controlled imbalances, 7.-me-chanical seal of 50 mm in length, radial clearance of 220 μmand a circuit pressure of 10,342 Pa, 8.- pressurized oil circuitin the gap of the seal, 9.- Horizontal and vertical inductiontransducers and phase reference transducer, 10.-inductiontransducers for axial vibration.
The rotor mass was placed about 6 cm from the bearing andthis at 15 cm from the lubricated seal with liquid, with adistance between the bearings of 56,00 cm. The rotor wasdriven by a 1/10 HP electric motor with a variable speed
P
N
F1
NF2
F1
F2
Shaft centerat zero rpm
1
PMA
MB
H
H
shaft orbit
2
Shaft centerat zero rpm
shaft orbit
Fig. 4 Misalignment Scheme
V
HKP
transductor de inducción
transductor de fase
coup
ling 2
rotor
V
HKP
1
radialbearing
3
mutipliergear
quick shaft1.500 rpm
slow shaft - 30 rpm
radialbearing
Fig. 5 Slow shaft. Installation of transducers
Technol Econ Smart Grids Sustain Energy (2019) 4: 99 Page 4 of 11
controller up to 10,000 rpm. A spring frame (5 in the figureshown) is installed to compensate for the gravity load on therotor and center the shaft on the seal, which was provided withthe oil film through four radial points at a pump outlet pressureof 14 kPa.
To cause a parallel misalignment, the bearing 3b is provid-ed with a vertical displacement of 50μmwith respect to the 3abearing. In this way, the misalignment load is exclusivelyvertical.
Misalignment. Results
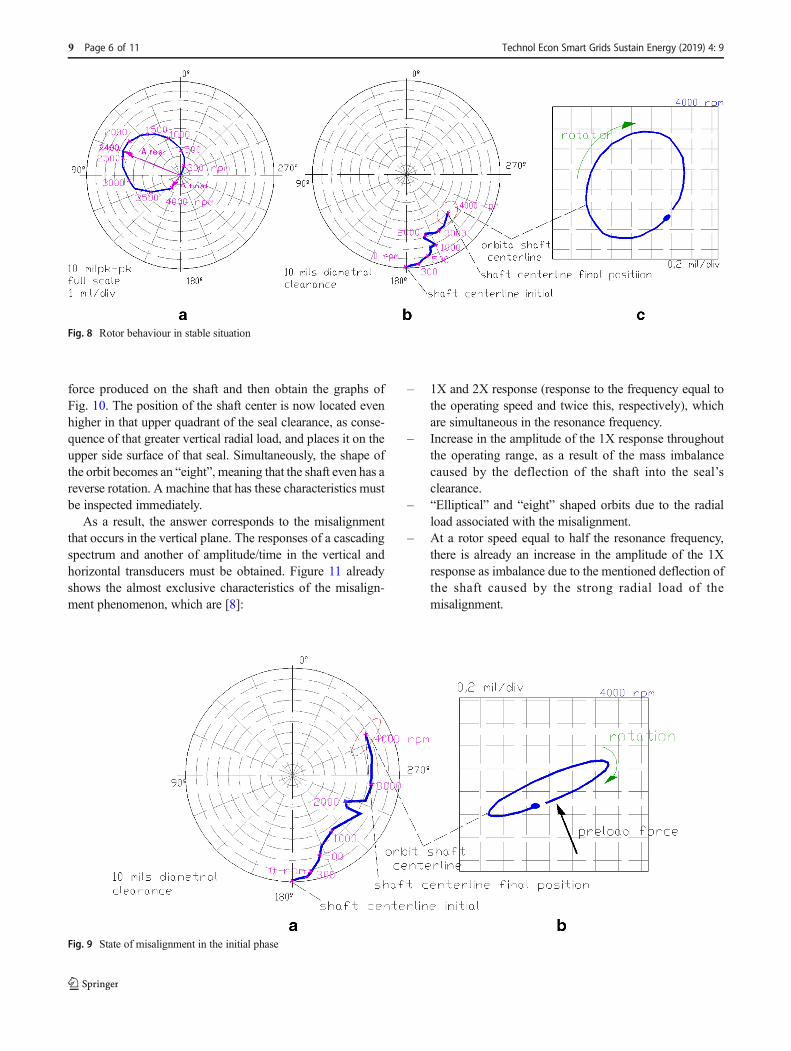
The first test is performed, in principle, with the balanced rotoracceptable and without any other anomaly present, to obtainthe fundamental parameters of the system, shown in Fig. 8 forthe data collected in the seal immediate to bearing 3b (trans-ducer 9).
Diagram a) of this figure represents a diagram Nyquist[16]] of a rotor starting where one detects a first and onlyresonance at 2400 rpm, with amplitude of 6,6 mils and aresidual value at 4000 rpm of 1,55 mils. Diagram b) showsthe evolution of the center of the shaft at that start, 0 rpm,
located at the lowest point of the separating position of thatshaft inside the seal, to the final operating position at4000 rpm. The final position stabilizes in the first right-lower quadrant and at that point is where the rotor’s vibra-tion movement orbit occurs. Diagram b) indicates theshape of the orbit of this movement, which is almost cir-cular, as it also, corresponds to an acceptable situation.
Then, in order to create the parallel misalignment, avertical descending value of 50 μm with respect to thebearing 3a is carried out in the support of the bearing3b. Thus, the graphic results of Fig. 9 are obtained alsofor seal immediate to the bearing 3b, which shows thechanges that appear in the position of the center of theshaft, from the start at 0 rpm to its nominal operation(graph a), highlighting the new position of that center ofshaft in the seal clearance, which takes place in theupper right quadrant, and which is identified with asituation of instability [17] and the disposition of an“angle of attack”, higher to 90°. The orbit b) of thatfigure is transformed into a very “elliptical” profile,which is identified like an important radial force orrestriction of movement in an almost vertical direction.
A further misalignment, made with the machining of thebearing seat 3b at a value of 75 μm will increase the radial
Fig. 6 Experimental setup
1
2
3a
4
5
6
78 99
9
3b9
92
9
5
Fig. 7 Test rotor scheme
Technol Econ Smart Grids Sustain Energy (2019) 4: 9 Page 5 of 11 9
force produced on the shaft and then obtain the graphs ofFig. 10. The position of the shaft center is now located evenhigher in that upper quadrant of the seal clearance, as conse-quence of that greater vertical radial load, and places it on theupper side surface of that seal. Simultaneously, the shape ofthe orbit becomes an “eight”, meaning that the shaft even has areverse rotation. A machine that has these characteristics mustbe inspected immediately.
As a result, the answer corresponds to the misalignmentthat occurs in the vertical plane. The responses of a cascadingspectrum and another of amplitude/time in the vertical andhorizontal transducers must be obtained. Figure 11 alreadyshows the almost exclusive characteristics of the misalign-ment phenomenon, which are [8]:
– 1X and 2X response (response to the frequency equal tothe operating speed and twice this, respectively), whichare simultaneous in the resonance frequency.
– Increase in the amplitude of the 1X response throughoutthe operating range, as a result of the mass imbalancecaused by the deflection of the shaft into the seal’sclearance.
– “Elliptical” and “eight” shaped orbits due to the radialload associated with the misalignment.
– At a rotor speed equal to half the resonance frequency,there is already an increase in the amplitude of the 1Xresponse as imbalance due to the mentioned deflection ofthe shaft caused by the strong radial load of themisalignment.
Fig. 9 State of misalignment in the initial phase
Fig. 8 Rotor behaviour in stable situation
Technol Econ Smart Grids Sustain Energy (2019) 4: 99 Page 6 of 11
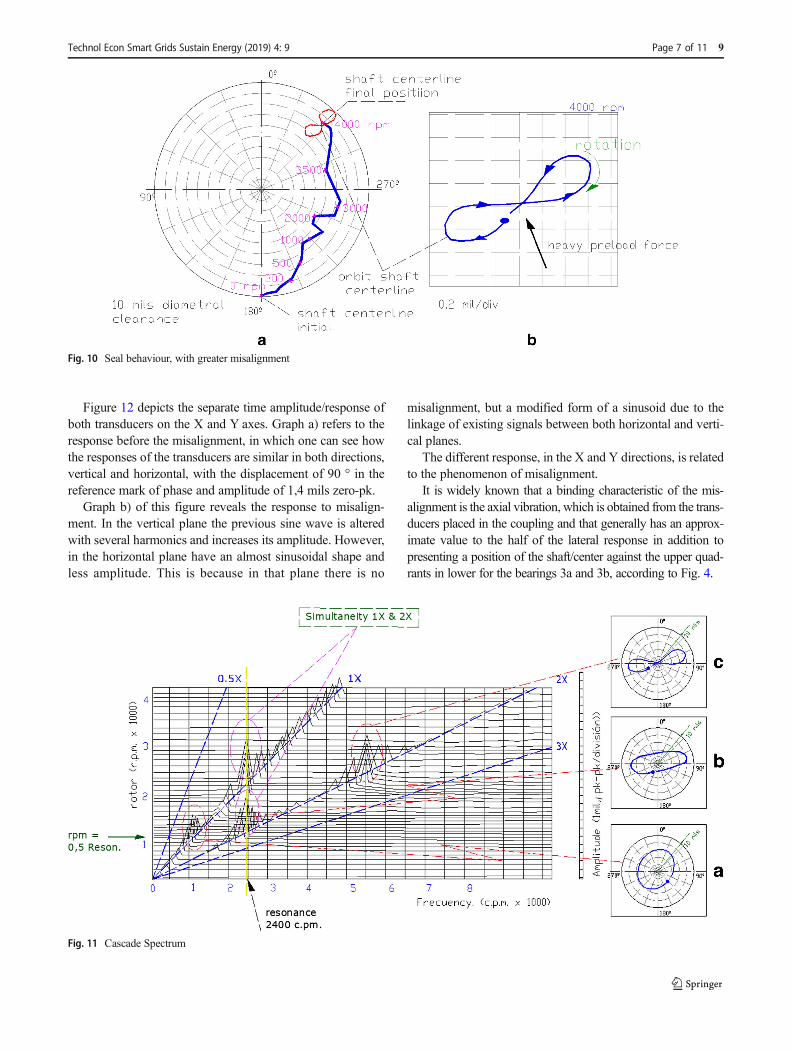
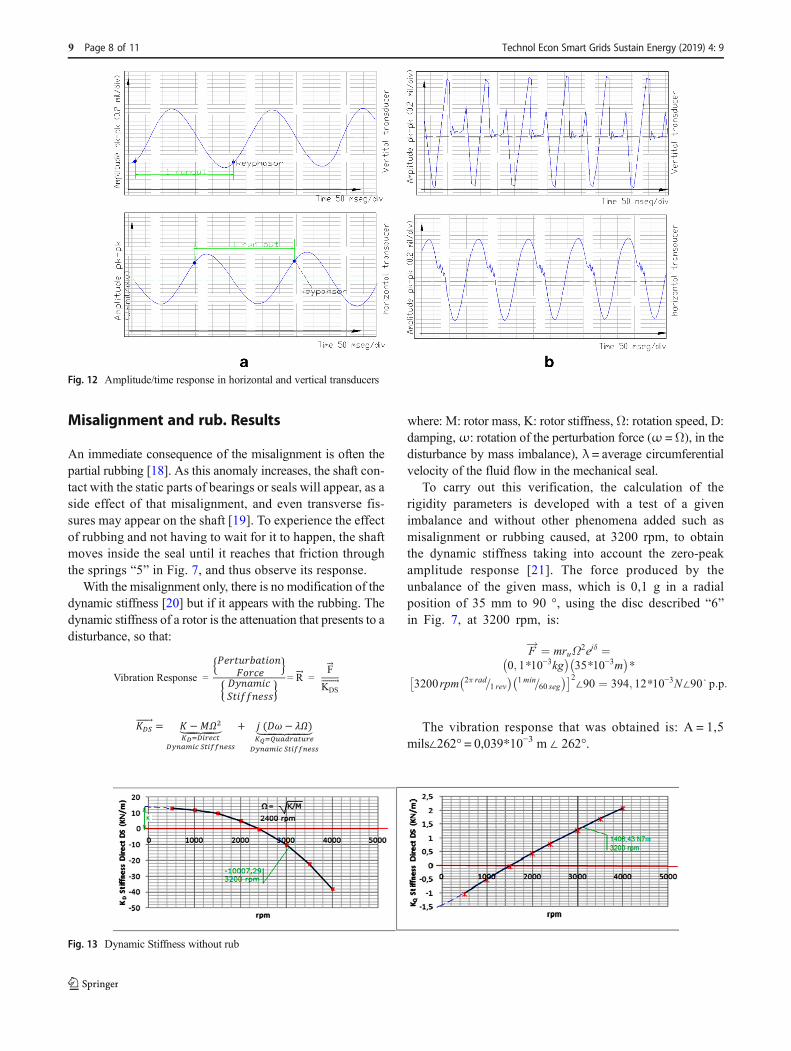
Figure 12 depicts the separate time amplitude/response ofboth transducers on the X and Y axes. Graph a) refers to theresponse before the misalignment, in which one can see howthe responses of the transducers are similar in both directions,vertical and horizontal, with the displacement of 90 ° in thereference mark of phase and amplitude of 1,4 mils zero-pk.
Graph b) of this figure reveals the response to misalign-ment. In the vertical plane the previous sine wave is alteredwith several harmonics and increases its amplitude. However,in the horizontal plane have an almost sinusoidal shape andless amplitude. This is because in that plane there is no
misalignment, but a modified form of a sinusoid due to thelinkage of existing signals between both horizontal and verti-cal planes.
The different response, in the X and Y directions, is relatedto the phenomenon of misalignment.
It is widely known that a binding characteristic of the mis-alignment is the axial vibration, which is obtained from the trans-ducers placed in the coupling and that generally has an approx-imate value to the half of the lateral response in addition topresenting a position of the shaft/center against the upper quad-rants in lower for the bearings 3a and 3b, according to Fig. 4.
Fig. 11 Cascade Spectrum
Fig. 10 Seal behaviour, with greater misalignment
Technol Econ Smart Grids Sustain Energy (2019) 4: 9 Page 7 of 11 9
Misalignment and rub. Results
An immediate consequence of the misalignment is often thepartial rubbing [18]. As this anomaly increases, the shaft con-tact with the static parts of bearings or seals will appear, as aside effect of that misalignment, and even transverse fis-sures may appear on the shaft [19]. To experience the effectof rubbing and not having to wait for it to happen, the shaftmoves inside the seal until it reaches that friction throughthe springs “5” in Fig. 7, and thus observe its response.
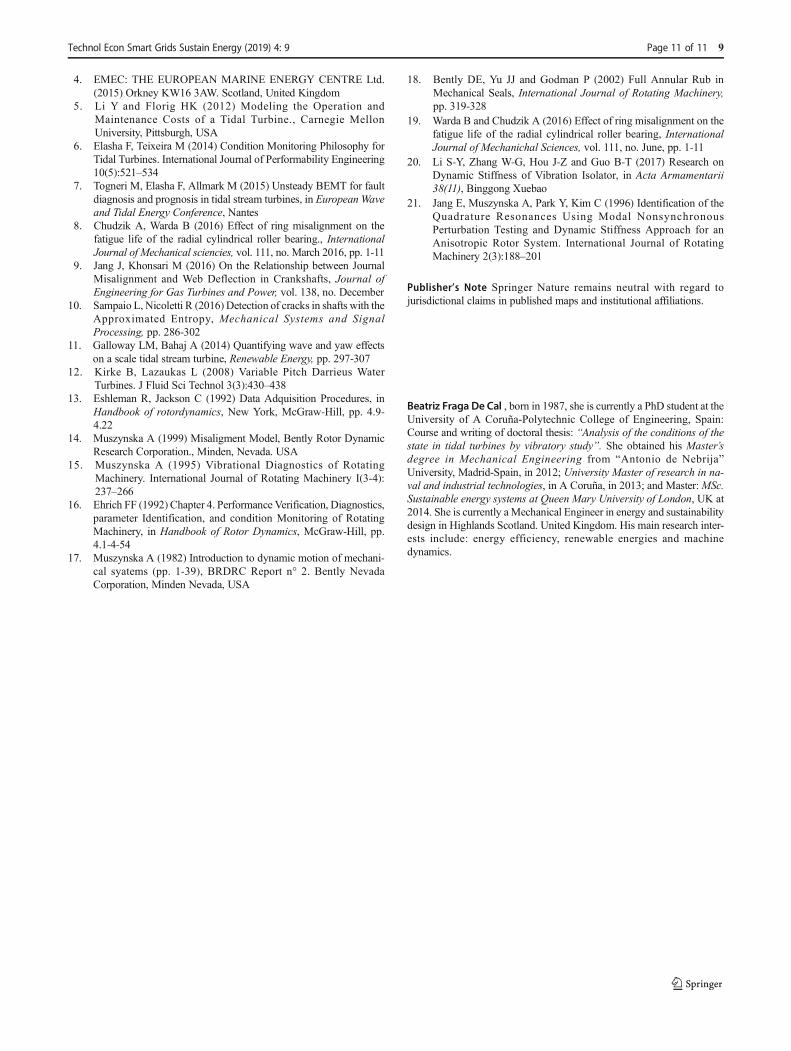
With the misalignment only, there is no modification of thedynamic stiffness [20] but if it appears with the rubbing. Thedynamic stiffness of a rotor is the attenuation that presents to adisturbance, so that:
where: M: rotor mass, K: rotor stiffness, Ω: rotation speed, D:damping,ω: rotation of the perturbation force (ω =Ω), in thedisturbance by mass imbalance), λ = average circumferentialvelocity of the fluid flow in the mechanical seal.
To carry out this verification, the calculation of therigidity parameters is developed with a test of a givenimbalance and without other phenomena added such asmisalignment or rubbing caused, at 3200 rpm, to obtainthe dynamic stiffness taking into account the zero-peakamplitude response [21]. The force produced by theunbalance of the given mass, which is 0,1 g in a radialposition of 35 mm to 90 °, using the disc described “6”in Fig. 7, at 3200 rpm, is:
F!¼ mruΩ2ejδ ¼
0; 1*10−3kg� �
35*10−3m� �
*
3200 rpm 2π rad=1 rev� �
1min=60 seg� �� �2∠90 ¼ 394; 12*10−3N∠90∘ p:p:
The vibration response that was obtained is: A = 1,5mils∠262° = 0,039*10−3 m ∠ 262°.
Fig. 12 Amplitude/time response in horizontal and vertical transducers
Fig. 13 Dynamic Stiffness without rub
Technol Econ Smart Grids Sustain Energy (2019) 4: 99 Page 8 of 11

Dynamic Stiffness ¼ K!
DS ¼ F!
R! ¼
F ejδ
Aeja¼ mruΩ2
Aej δ−αð Þ ¼ mruΩ2
A∠ δ−αð Þ∘ ¼
KDS ¼ 394; 12*10−3
0; 039*10−3Nm∠ 262−90ð Þ ¼ 10105; 64N
�m∠172
∘
– Direct Dynamic Stiffness: KD =KDS*cosθ = 10,105,64 N/m) *cos172° = − 10,007,29 N/m.
– Quadrature Dynamic Stiffness: KQ = KDS*sinθ =10,105,64 (N/m)*sin 172° = 1406,43 N/m
This first test is performed with the same determinedweight of imbalance 0,1 g ∠ 90°, at different speeds, to obtainthe components of the dynamic stiffness depending on therotation speed, which are represented in Fig. 13.
The graphs of Fig. 13 are thus obtained. The values ofcalculation example for 3200 rpm are marked, the value ofthe resonance is also indicated when in the real componentZD = 0, which is produced when Ω = √(K/M) = 2400 cpm. Inthat same figure, with the prolongation of the parabola of ZD,for ω = 0, we obtain K ≈ 12,8 KN/m.
The same test is now carried out, but with the rub alreadyinduced by the mentioned springs, with the same unbalance
weight 0,1 g∠90°, at different speeds to obtain the componentsof the dynamic stiffness as a function of the speed of rotation.
The results are shown in Fig. 14 in which their graphs arecompared: no rubbing (blue lines); and with the rubbing(green lines).
From above graphs of Fig. 14, the following characteristicsare observed:
– The direct component ZD = 0, which occurs at the valueΩ = √(K/M) = 2400 rpm in the situation without rub, nowappears at 2500 rpm, as a consequence of the increase inmodal “K” stiffness with the rub, which goes from 12,8 to14,3 KN/m, which is also obtained in the prolongation ofthe parabola of KQ =K-MΩ2 when Ω = 0.
– The imaginary component ZQ = jD(ω-λΩ), that in thiscase, as a result of being a disturbance caused by an im-balance of mass, as mentioned, this frequency of distur-bance ω is equal to the speed of rotation Ω, so ZQ = jD(Ω-λΩ) = jDΩ (1-λ), and besides being a solid bronzebearing λ = 0, therefore: ZQ = DΩ, ZQ = 0 for zero speed.
In this graph, the damping is determined by the slope of thestraight line, which is made greater in the case of rubbing,from 4,19 to 5,20 N.s/m.
In the horizontal plane, the graphs obtained with the rub-bing caused in the vertical plane have almost no modification
Fig. 14 Dynamic stiffness of the rotor model without rubbing and with rubbing, in the vertical plane of rub and misalignment
Fig. 15 Components of the dynamic stiffness in the horizontal plane, with rub and misalignment, and without rub
Technol Econ Smart Grids Sustain Energy (2019) 4: 9 Page 9 of 11 9

in the rigidity, because in this plane there is no restriction. Itssmall difference is due to couplings and inertia of the phenom-enon that of misalignment that was forced in the vertical plane,according to Fig. 14, in which the trace of blue colour corre-sponds to the non-rubbing situation, and that of green colour,to rubbing and misalignment in the horizontal plane.
Figure 14 and Fig. 15 describe the signal difference and thedifferent stiffness in the plane that contains the misalignmentand the one that doesn’t.
Conclusions
(1) It is shown that vibration monitoring in two planes isessential to identify the causes of this failure. The symp-toms of shaft misalignment are produced clearly in theplane that is produced, and not in the other. Symptomsidentified are listed below.
– Different vibration response in both planes.– Shaft orbits in an “elliptical” or “eight” shape, the approx-
imate circular shape (polar diagram).– Increment of 1X and 2X response, and simultaneity of
both responses (cascade spectrum).– Important 1X response in frequency equal to half of its
resonance frequency.
In the case of rubbing shaft/seal, the modification of thedynamic stiffness also occurs in the misaligned plane, but justin another plane.
In the case of rubbing shaft/sealing seal, the modification ofthe dynamic stiffness also occurs in the misaligned plane, buthardly in another plane.
(2) All these data related to the vibration of the equipment,cannot be obtained exclusively with contact transducerssuch accelerometers placed superficially on supports andbenches.
The common practice of installing an accelerometer in thesystem may reflect a situation of amplitude of high vibration,which would indicate an anomaly but not its cause. In addi-tion, in the case of the tidal turbines the shaft coupled to thepropellers rotates at approximately 30 rpm, and at these lowrevolutions these transducers have no utility and/or precision.
(3) It has been demonstrated how by monitoring andinterpreting the response of the vibration of a rotor candetect anomalies as frequent as misalignment in a rotat-ing system and its immediate consequences, such as rub-bing the rotor/stator. This situation predicts serious fail-ures in the machines.
(4) In the case of tidal turbines, which are in full develop-ment of research and application as important sources ofsustainable energy, a technical-economic failure of itsfacilities can risk the future of this project, and thereforethe great importance of having already, from the origin ofits operation, with a system of prediction of serious fail-ures as the proposed one, which avoids this failure
(5) To have good control of the machine, it is necessary thatthe implantation of the transducers be carried out in theperiod of manufacture of the machine, and therefore betaken into account by the designers, in order to incorpo-rate the necessary elements of its installed duringmanufacturing.
Acknowledgements The authors sincerely thanks to Professor Dr.Alfonso Loureiro Montero, A Coruña University, Spain for his criticaldiscussion and reading during manuscript preparation and Dr. Kim Lastof University of the Highlands an Islands, Scotland, for his invaluablesupport in the research. To Eddie Boyd, Senior Engineer of the Depart. ofEnergy and Sustainability of Highlands Council of Scottish Government,for their invaluable support.
Authors’ contributions The author’ contributions are as follows: was incharge of the whole trial and wrote the manuscript.
Funding Supported by the Department of Naval and IndustrialEngineering of the University of A Coruña, the Foundation of theUniversity of A Coruña (Grant), the “University of the Highlands” andIslands of Scotland-Inverness College: Marine, Environmental Scienceand Engineering, the Department of Energy and Sustainability ofHighlands Council of Scottish Government and European Union FP7Project.
Data availability The datasets supporting the conclusions of this articleare included within the article.
Compliance with ethical standards
Conflict of interest The authors declare no competing financialinterests.
Consent for publication Not applicable.
Ethics approval and consent to participate Not applicable.
References
1. “ORJIP (Offshore Renewables Joint Industry Programme,” 2015.[Online]. Available: www.orjip.org.uk. [Accessed September 2017]
2. OCEANERA-NET (2014) 15 national and regional funders andmanagers of research and innovation programmes, EuropeanUnion's Seventh Programme for research technological develop-ment and demonstration under grant agreement No. 618099.,Bruselas
3. Zheng J, Dai P, Zhang J (2015) Tidal stream energy in China, in 8thInternational Conference on Asian and Pacific Coasts (APAC2015)
Technol Econ Smart Grids Sustain Energy (2019) 4: 99 Page 10 of 11
4. EMEC: THE EUROPEAN MARINE ENERGY CENTRE Ltd.(2015) Orkney KW16 3AW. Scotland, United Kingdom
5. Li Y and Florig HK (2012) Modeling the Operation andMaintenance Costs of a Tidal Turbine., Carnegie MellonUniversity, Pittsburgh, USA
6. Elasha F, Teixeira M (2014) Condition Monitoring Philosophy forTidal Turbines. International Journal of Performability Engineering10(5):521–534
7. Togneri M, Elasha F, Allmark M (2015) Unsteady BEMT for faultdiagnosis and prognosis in tidal stream turbines, in European Waveand Tidal Energy Conference, Nantes
8. Chudzik A, Warda B (2016) Effect of ring misalignment on thefatigue life of the radial cylindrical roller bearing., InternationalJournal of Mechanical sciencies, vol. 111, no. March 2016, pp. 1-11
9. Jang J, Khonsari M (2016) On the Relationship between JournalMisalignment and Web Deflection in Crankshafts, Journal ofEngineering for Gas Turbines and Power, vol. 138, no. December
10. Sampaio L, Nicoletti R (2016) Detection of cracks in shafts with theApproximated Entropy, Mechanical Systems and SignalProcessing, pp. 286-302
11. Galloway LM, Bahaj A (2014) Quantifying wave and yaw effectson a scale tidal stream turbine, Renewable Energy, pp. 297-307
12. Kirke B, Lazaukas L (2008) Variable Pitch Darrieus WaterTurbines. J Fluid Sci Technol 3(3):430–438
13. Eshleman R, Jackson C (1992) Data Adquisition Procedures, inHandbook of rotordynamics, New York, McGraw-Hill, pp. 4.9-4.22
14. Muszynska A (1999) Misaligment Model, Bently Rotor DynamicResearch Corporation., Minden, Nevada. USA
15. Muszynska A (1995) Vibrational Diagnostics of RotatingMachinery. International Journal of Rotating Machinery I(3-4):237–266
16. Ehrich FF (1992) Chapter 4. Performance Verification, Diagnostics,parameter Identification, and condition Monitoring of RotatingMachinery, in Handbook of Rotor Dynamics, McGraw-Hill, pp.4.1-4-54
17. Muszynska A (1982) Introduction to dynamic motion of mechani-cal syatems (pp. 1-39), BRDRC Report n° 2. Bently NevadaCorporation, Minden Nevada, USA
18. Bently DE, Yu JJ and Godman P (2002) Full Annular Rub inMechanical Seals, International Journal of Rotating Machinery,pp. 319-328
19. Warda B and Chudzik A (2016) Effect of ring misalignment on thefatigue life of the radial cylindrical roller bearing, InternationalJournal of Mechanichal Sciences, vol. 111, no. June, pp. 1-11
20. Li S-Y, Zhang W-G, Hou J-Z and Guo B-T (2017) Research onDynamic Stiffness of Vibration Isolator, in Acta Armamentarii38(11), Binggong Xuebao
21. Jang E, Muszynska A, Park Y, Kim C (1996) Identification of theQuadrature Resonances Using Modal NonsynchronousPerturbation Testing and Dynamic Stiffness Approach for anAnisotropic Rotor System. International Journal of RotatingMachinery 2(3):188–201
Publisher’s Note Springer Nature remains neutral with regard tojurisdictional claims in published maps and institutional affiliations.
Beatriz Fraga De Cal , born in 1987, she is currently a PhD student at theUniversity of A Coruña-Polytechnic College of Engineering, Spain:Course and writing of doctoral thesis: “Analysis of the conditions of thestate in tidal turbines by vibratory study”. She obtained his Master’sdegree in Mechanical Engineering from “Antonio de Nebrija”University, Madrid-Spain, in 2012; University Master of research in na-val and industrial technologies, in A Coruña, in 2013; and Master:MSc.Sustainable energy systems at Queen Mary University of London, UK at2014. She is currently aMechanical Engineer in energy and sustainabilitydesign in Highlands Scotland. United Kingdom. His main research inter-ests include: energy efficiency, renewable energies and machinedynamics.
Technol Econ Smart Grids Sustain Energy (2019) 4: 9 Page 11 of 11 9