Embed Size (px)
Citation preview

MURDOCH UNIVERSITY
SCHOOL OF INFORMATION TECHNOLOGY
Application of the Recommendation
Architecture Model for Text Mining
Uditha Ratnayake B.Sc. (Eng.) (Hons)
This thesis is presented for the degree of Doctor of Philosophy of Murdoch University
October 2003

i
Declaration
I declare that this thesis is my own account of my research and contains as its main content work which has not previously been submitted for a degree at any tertiary education institution. Uditha Ratnayake October 2003

ii
Acknowledgement I am very grateful to Prof. Tamás (Tom) Gedeon and Dr. Graham Mann, my principal supervisors, for their constant support and inspiring guidance. Tom’s expertise and encouragement throughout the research process and the development of the thesis were invaluable. Graham’s constructive feedback, enthusiasm and insight made a huge difference to the progress of the thesis. I also thank Dr. Nalin Wickramarachchi, my supervisor in Sri Lanka, for his advice while I worked in Sri Lanka. My heartfelt gratitude extends to Andrew Coward for his constructive comments on my work in various phases and for many stimulating discussions. His patience in explaining various concepts of the Recommendation Architecture and the help given for programming the prototype are truly appreciated. My thanks also extend to my colleagues Alex and Kevin for providing useful advice and moral support during my stay at Murdoch. I am indebted to Madu, my husband, for his continuous support, encouragement and patience. Finally, I would like to thank my mother, father and family members for their encouragement and assistance.

iii
List of Publications The following publications were derived from this research in applying the
Recommendation Architecture for the domain of text mining.
Refereed Journal papers
1. U. Ratnayake, T. D. Gedeon, "Extending The Recommendation Architecture
Model for Text Mining", International Journal of Knowledge-Based
Intelligent Engineering Systems, Vol 7, 3, pp. 139-148, July 2003.
2. U. Ratnayake, T. D. Gedeon, N. Wickramarachchi, "Application of the
Recommendation Architecture Model for Text Mining", Australian Journal of
Intelligent Processing Systems, (under review).
Refereed Conference Papers
1. U. Ratnayake, T. D. Gedeon, "Application of the Recommendation
Architecture Model for Document Classification", Proceedings of the 2nd
WSEAS International Conference on Scientific Computation and Soft
Computing, pp. 326-331, Crete, 2002.
2. U. Ratnayake, T. D. Gedeon, "Application of the Recommendation
Architecture Model for Discovering Associative Similarities in Text",
Proceedings of the 9th International Conference on Neural Information
Processing (ICONIP 2002), pp. 2059-2063, Singapore, 2002.

iv
3. U. Ratnayake, T. D. Gedeon, "Extending The Recommendation Architecture
Model For Effective Text Classification", Proceedings of The Sixth Australia-
Japan Joint Workshop on Intelligent and Evolutionary Systems, pp. 185-191,
Canberra, Australia, 2002
4. U. Ratnayake, T. D. Gedeon, N. Wickramarachchi, "Document Classification
with the Recommendation Architecture: Extensions for Feature Intensity
Recognition and Column Labelling", Proceedings of the 7th Australasian
Document Computing Symposium, pp. 31-37, Sydney, Australia, 2002.

v
Abstract
The Recommendation Architecture (RA) model is a new connectionist approach
simulating some aspects of the human brain. Application of the RA to a real world
problem is a novel research problem and has not been previously addressed in
literature. Research conducted with simulated data has shown much promise for the
Recommendation Architecture model’s ability in pattern discovery and pattern
recognition. This thesis investigates the application of the RA model for text mining
where pattern discovery and recognition play an important role.
The clustering system of the RA model is examined in detail and a formal
notation for representing the fundamental components and algorithms is proposed for
clarity of understanding. A software simulation of the clustering system of the RA
model is built for empirical studies. In the argument that the RA model is applicable
for text mining the following aspects of the model are examined. With its pattern
recognition ability the clustering system of the RA is adapted for text classification
and text organization. As the core of the RA model is concerned with pattern
discovery or identification of associative similarities in input, it is also used to
discover unsuspected relationships within the content of documents. How the RA
model can be applied to the problems of pattern discovery in text and classification of
text is addressed demonstrating results from a series of experiments. The difficulties
in applying the RA model to real life data are described and several extensions to the
RA model for optimal performance are proposed from the insights obtained from
experiments. Furthermore, the RA model can be extended to provide user-friendly
interpretation of results. This research shows that with the proposed extensions the

vi
RA model can be successfully applied to the problem of text mining to a large extent.
Some limitations exist when the RA model is applied to very noisy data, which are
also demonstrated here.

vii
Table of Contents
Chapter 1 Introduction............................................................................................1
1.1 A Brief Overview of Four AI Models which Simulate the Localized Learning of the
Human Brain .................................................................................................................2
1.1.1 The Evolutionary Selection Circuits Model and the Theory of Neural Group
Selection .............................................................................................................2
1.1.2 Evolving Connectionist Systems (ECOS) ..........................................................3
1.1.3 CAM Brain (CAM – Cellular Automata Machine) ...........................................4
1.2 The Recommendation Architecture............................................................................4
1.3 Application to Text Mining ........................................................................................8
1.4 Motivation for Research .............................................................................................9
1.5 Contributions of this Thesis......................................................................................10
1.6 Overview of the Thesis.............................................................................................12
Chapter 2 The Recommendation Architecture Model .......................................14
2.1 Introduction ..............................................................................................................14
2.2 Major Characteristics of the Recommendation Architecture ...................................16
2.3 Functional Overview of the Recommendation Architecture ....................................17
2.3.1 A Formal Notation for the Functional Components .........................................20
2.4 The Clustering System .............................................................................................22
2.4.1 A Formal Notation for the Basic Operations....................................................23
2.4.2 Factors which Determine Changes in a Specific Device..................................26
2.4.3 Growth of the Clustering System .....................................................................27
2.4.4 Overview of the Column Output and the Competitive Function......................29
2.5 Summary...................................................................................................................31
Chapter 3 Information Access and Text Mining.................................................32
3.1 Introduction to Information Access Systems............................................................32

viii
3.2 Advances in Information Retrieval and Filtering .....................................................35
3.2.1 Advances in Retrieval and Filtering Systems Based on Classical Models.......36
3.2.2 Latent Semantic Indexing.................................................................................38
3.2.3 Neural Network Models ...................................................................................39
3.2.4 Retrieval and Filtering for User Requirements.................................................39
3.3 Text Categorization, Clustering and Classification ..................................................40
3.3.1 Text Categorization ..........................................................................................41
3.3.2 Clustering Algorithms ......................................................................................44
3.3.3 Classification Techniques.................................................................................46
3.4 Text Mining ..............................................................................................................47
3.4.1 Neural Network Models ...................................................................................47
3.4.2 Recommendation Architecture for Text Mining ..............................................51
3.5 Conclusion................................................................................................................53
Chapter 4 Software Simulation of the Recommendation Architecture ............55
4.1 Introduction ..............................................................................................................55
4.2 Overview of the Prototype........................................................................................56
4.3 Model Experiment ....................................................................................................60
4.3.1 Formation of the Input Space ...........................................................................60
4.3.2 Clustering Run..................................................................................................62
4.3.3 Results and Discussion .....................................................................................63
4.4 Conclusion................................................................................................................65
Chapter 5 Modelling the Input Space of the RA for Pattern Discovery and
Classification of Text .................................................................................................66
5.1 Introduction ..............................................................................................................66
5.2 Why is Feature Selection Necessary?.......................................................................67
5.3 Feature Selection Methods .......................................................................................68

ix
5.3.1 Types of Feature Selection Methods ................................................................69
5.3.2 The Feature Selection Methods Used for the Experiments ..............................70
5.4 Unguided Pattern Discovery.....................................................................................74
5.4.1 Experiment 1 - TREC data with feature selection using the Document
Frequency Thresholding method ......................................................................75
5.4.2 Experiment 2 - News Group data with feature selection using the Document
Frequency Thresholding method ......................................................................79
5.4.3 Summary...........................................................................................................84
5.5 Guided Pattern Discovery.........................................................................................85
5.5.1 Experiment 1 - TREC data with feature selection using the modified Two-step
algorithm...........................................................................................................86
5.5.2 Experiment 2 - Newsgroup data with feature selection using the modified
Two-step algorithm ..........................................................................................89
5.5.3 Summary...........................................................................................................94
5.6 Conclusion................................................................................................................94
Chapter 6 Extending the Clustering System of the RA......................................96
6.1 Introduction ..............................................................................................................96
6.2 Parameter Selection ..................................................................................................98
6.3 Increasing Recognition Accuracy...........................................................................100
6.3.1 Problem of Very Specific Columns................................................................101
6.3.2 Problem of Very Generic Columns ................................................................104
6.3.3 Demonstration of the Solutions for Very Specific Columns and Very Generic
Columns (Extensions -I and II) - Experiment 3a............................................................108
6.4 Increasing Column Sensitivity – Extension-III ......................................................109
6.4.1 Extension for Feature Intensity Recognition ..................................................109
6.4.2 Experiments 3a and 3b – Applying the Extended RA to TREC Data ............111
6.4.3 Experiments 4a and 4b - Applying the Extended RA to Newsgroup Data.....113

x
6.5 Extending the RA for Text Mining.........................................................................116
6.5.1 Automatic Column Labelling – Extension-IV................................................118
6.5.2 Column Labelling for Experiments 3b and 4b ...............................................118
6.5.3 Post–Processing the Output ............................................................................123
6.5.4 Searching for Similar Documents...................................................................125
6.5.5 Performance Evaluation .................................................................................127
6.6 Summary.................................................................................................................129
Chapter 7 Conclusion ..........................................................................................131
7.1 Principal Lessons....................................................................................................131
7.2 Future Directions ....................................................................................................138
Appendix A Additional Experimental Results - Newsgroup Data ....................140
Appendix B Affect of Word Stemming on Document Classification ................147
REFERENCES.........................................................................................................155
BIBLIOGRAPHY....................................................................................................164

xi
List of Figures
Figure 2-1 Overview of the 4 layers of the Recommendation Architecture.............................19
Figure 2-2 A Device .................................................................................................................19
Figure 2-3 Layers in one column..............................................................................................20
Figure 4-1 Object model of the prototype ................................................................................57
Figure 4-2 Frequency of occurrence of the features in each category......................................61
Figure 4-3 Feature distribution in four input vectors from three different categories ..............61
Figure 4-4 Column creation and stabilization performance .....................................................65
Figure 5-1 Feature density of input vectors in relation to frequency of occurrence (TREC data
with Frequency Thresholding method)............................................................................76
Figure 5-2 Feature density of input vectors in relation to frequency of occurrence (Newsgroup
data with Frequency Thresholding method) ....................................................................82
Figure 5-3 Feature density of input vectors in relation to frequency of occurrence (TREC data
with modified Two-step algorithm).................................................................................86
Figure 5-4 Features that were selected for each topic and their frequency of occurrence
(TREC data).....................................................................................................................87
Figure 5-5 Feature density of input vectors in relation to frequency of occurrence (Newsgroup
data with modified Two-step algorithm) .........................................................................90
Figure 5-6 Features that were selected for each group and their frequency of occurrence
(Newsgroup data).............................................................................................................91
Figure 6-1 Number of columns created for a given number of inputs ...................................102
Figure 6-2 Number of columns created for a given number of inputs with Extension-I........104
Figure 6-3 Part of the output for column 3 showing the relationships between document
vectors and gamma layer device numbers .....................................................................125
Figure A-1 Document vector sizes in terms of feature density (Experiment NG-1) ..............141
Figure A-2 Document vector sizes in terms of feature density (Experiment NG-2) ..............143
Figure A-3 Document vector sizes in terms of feature density (Experiment NG-3) ..............145

xii
Figure B-1 Frequency of document vectors sizes in terms of feature density........................148
Figure B-2 Features that were selected for each group and their frequency of occurrence for
the training set................................................................................................................149
Figure B-3 Features that were selected for each group and their frequency of occurrence for
the test set ......................................................................................................................150

xiii
List of Tables
Table 4-1 Precision and Recall for each column by the major category identified..................64
Table 4-2 Column sizes in regular section devices ..................................................................64
Table 5-1 Total number of documents acknowledged from each column ...............................77
Table 5-2 Some frequent words in the documents accepted by each column and the TREC
topics that can correspond to the columns .......................................................................78
Table 5-3 Columns that respond to a set of document vectors from different categories ........83
Table 5-4 Precision and Recall for each column by the major document category identified
(Experiment 1-TREC data)..............................................................................................89
Table 5-5 Precision and Recall for each column by the major document category identified
(Experiment 2-Newsgroup data)......................................................................................93
Table 6-1 Topic and the percentage of documents in each topic that responded to column 3
.......................................................................................................................................106
Table 6-2 Precision and Recall for each column by the major document category identified
(Experiments 1 and 2)....................................................................................................106
Table 6-3 Precision and Recall for each column by the major document category identified
(Experiment 3a) .............................................................................................................109
Table 6-4 Precision and Recall for each column by the major document category identified
(Experiment 3a) .............................................................................................................112
Table 6-5 Precision and Recall of each column by the major document category identified
(Experiment 3b) .............................................................................................................112
Table 6-6 Precision and Recall of each column by the major document category identified
(Experiment 4a) .............................................................................................................115
Table 6-7 Precision and Recall of each column by the major document category identified
(Experiment 4b) .............................................................................................................115
Table 6-8 TREC topic labels for the major group discovered by each column and the labels
assigned to the columns by the extended RA system. ...................................................119

xiv
Table 6-9 Frequently occurring word pairs ............................................................................121
Table 6-10 Newsgroup names assigned for the major group discovered by each column by the
labels assigned to the columns by the extended RA system. .........................................122
Table 6-11 Column-wise breakdown of document groups for columns 3 and 7....................124
Table 6-12 A set of the document vectors by the columns they respond to. ..........................126
Table A-1 Some frequent words in the documents accepted by each column .......................142
Table A-2 Precision and Recall by the major category/categories acknowledged by each
column ...........................................................................................................................144
Table B-1 Precision and Recall for each column by the major document category identified
(Experiment Stem1).......................................................................................................151
Table B-2 Precision and Recall for each column by the major document category identified
(Experiment Stem2).......................................................................................................152
Table B-3 Precision and Recall for each column by the major document category identified
(Experiment Stem3).......................................................................................................152
Table B-4 Average precision and average recall for six columns ..........................................153

1
Chapter 1 Introduction
Despite decades of debate there are good reasons to believe that the different areas of
the human brain are specialized to perform different tasks. For example, detection of
sound quality is done by auditory cortex and recognizing faces is done by the
association area of the visual cortex (Chudler, 2003). Advances in brain scanning
technology, such as MRI (Magnetic Resonance Imaging) and CAT (Computed Axial
Tomography) have demonstrated these functional specializations vividly. Since the
discovery of Brodman’s areas in 1947, research on functional specialization of the
human brain has progressed so significantly that it has been fundamental in the
formation of new theories of cognition (Edelman and Mountcastle, 1978; Weiss,
1994). Simulation of the localized learning of the brain, and the insights given by
cognitive models on the way that neural structures self-organize during the
development of the organism in order to be adaptive, and be increasingly skilful, have
paved the way for many theories and models in AI.
Following the advances in understanding the brain, there have been many
attempts in building AI systems simulating the functioning of the human brain. For
example, Edelman created the Darwin models based on the theory of the adaptive
functioning of the human brain (Reeke, 1997). The CAM-Brain (CAM - Cellular
Automata Machine) (Garis, 1994; Garis, 1995) projects try to evolve a complex
system. De Garis proposes neural networks based on cellular automata to be grown
and evolved to contain millions of neurons. Kasabov introduces Evolving
Deleted: ,

2
Connectionist Systems (ECOS) (Kasabov, 2001a) that evolve in time, in regard to
both their structure and functionality. ECOSs are expected to learn and adapt as they
operate through interaction with the environment. These systems are discussed in
detail for the interested reader in the next section (Section 1.1).
The Recommendation Architecture theory of human cognition proposed by
Coward is a computational approach based on the concept of the cortex as a pattern
extraction hierarchy with functional specialization (Coward, 1990; Coward, 1997;
Coward, 2000). The Section 1.2 introduces the Recommendation Architecture.
1.1 A Brief Overview of Four AI Models which Simulate the Localized Learning of the Human Brain
1.1.1 The Evolutionary Selection Circuits Model and the Theory of Neural Group Selection
‘The Evolutionary Selection Circuits Model’ and ‘the Theory of Neural Group
Selection’ theories are based on the fundamental concept that the neural connections
in the human brain are made in real time through evolutionary or selectionist
processes. According to these theories somatic selection is the mechanism that
establishes the connection between the structure and function of the human brain.
The Evolutionary Selection Circuits Model (Conrad 1974, 1976 quoted in
Weiss, 1994) is a part of the extensive work focussing on the differences between the
information processing capabilities of biological systems and conventional computers.
A few computational specifications based on the ESCM have been presented and have
been successfully applied for robot-control (Pattee, 2002). The Hypernetwork,
presented as a model for physical realization of evolvable hardware, is an example of
Field Code Changed

3
an interaction based model that has learning capabilities which is based Conrad’s
theory on evolutionary adaptability (Segovia-Juarez and Colombano, 2001).
According to the Theory of Neural Group Selection or Neural Darwinism
(Edelman, 1992; Edelman and Mountcastle, 1978) consciousness can be explained by
Darwinian selection and evolution of neural states. A series of computational models,
have been constructed to test the theory’s main ideas. Darwin I, II, and III are
simulations for robot control while Darwin IV is a working robot. Moreover, a few
other models have been proposed based on this theory for real world applications.
One successful application is for pattern classification for face recognition (Huang et
al., 1998) and another is for adaptive lexicon formation (Vogt, 1997).
1.1.2 Evolving Connectionist Systems (ECOS)
The evolving connectionist systems (ECOS) (Kasabov, 2001a) are modular
connectionist architectures that facilitate modelling of evolving process and
knowledge discovery. The key characteristics of this system are that, it evolves its
structure and functionality from a continuous input data stream in an adaptive,
modular way over its lifetime. The Evolving Fuzzy Neural Network (EfuNN) model
is presented as one possible way of implementing connectionist modules for the
ECOS architecture (Kasabov, 2001a; Kasabov et al., 2001). DENFIS is another
implementation which focuses more on developing the dynamic features making it
suitable for online-adaptive systems (Kasabov, 2002). Two successful real world
applications of EFuNNs are spoken word classification and time series prediction for
Mackey-Glass data (Kasabov, 2001a). These implementations face two major
problems due to the localized learning paradigm (Kasabov, 2002). One is that local
generalization requires more training data than the models which use global

4
generalization. The other is that some positive examples may never be used for
training. Since the learning process creates partitioned regions these regions may not
cover the whole input space.
1.1.3 CAM Brain (CAM – Cellular Automata Machine)
CAM brain (Garis, 1994; Garis, 1995) is based on the use of evolvable/programmable
hardware. The key idea has been to use cellular automata based neural networks
which grow under evolutionary control at nano-second speeds. It is based on
evolutionary engineering which makes it possible to evolve systems that function as
desired when they are too complex to be manually designed. CAM brain machines
(1st generation) have had the capability of evolving 1000 neuron neural circuit a few
seconds and then updating the neural signalling of 64000 of these modules
interconnected in a 1 GB of RAM (Garis, 2003). These systems also face the two
problems of requiring a large number of examples for training and not using some
important training data due to localized learning. Another weakness in this technique
is the generation of more modules than are necessary to solve a problem (Dinerstein et
al., 2003).
1.2 The Recommendation Architecture
According to Coward, the human brain can be regarded as a combination of special
purpose networks which primarily functions by detection of repetitions of information
(Coward, 1990).
The Recommendation Architecture model has been proposed for solving
operationally complex problems. A system that can solve a operationally complex
problem is defined as one that has a large number of potentially conflicting objectives,

5
a large number of possible behaviours, many different conditions to determine
appropriate behaviour at any time and a fast response time (Coward, 2001a).
Automatic information systems such as telecommunication networks and aircraft
simulators where no human intervention occurs are examples of functionally complex
systems. The most complex current computer systems are built with thousands of
millions of transistors and execute programs with tens of millions of lines of source
code producing millions of state changes per second. For practical reasons the
functionality of such large, complex systems must be divided into thousands of
software modules. When such systems are designed to execute on von Neumann
Architecture based machines, several hard issues must be thoroughly addressed.
These include getting a precise requirement definition, handling the requirement
change throughout the life cycle, coping with the adverse affects of these changes,
dividing the system functionality into modules to be designed by several people,
tracing functionality errors from a system problem, handling the problems that often
occur in synchronizing tasks, and generating results quick enough to respond in real
time.
A primary requirement of the systems designed for solving complex problems
is the ability to learn. Neural learning and evolutionary learning have been the two
popular learning paradigms (Weiss, 1994). In conventional neural learning, the
connection weights of the basic devices of à priori designed neural-type network
structure are modified. It is known that there is a strong connection between the
structure (size and connectivity) and function of a neural network. The affect of the
network design to learning is considered to be the major weakness in neural-learning.
In evolutionary learning, evolutionary operators (mutation, recombination, and

6
selection) are applied to elements that represent specific points in a search space.
Evolutionary Selection Circuits Model (Pattee, 2002; Conrad 1974, 1976 quoted in
Weiss, 1994) and the Theory of Neuronal Group Selection (neural Darwinism)
(Edelman and Mountcastle, 1978; Edelman, 1992) are selective theories in
neuroscience which are claimed to be more efficient than natural evolution. Both have
been used in separate computational approaches for robot control. These two learning
concepts, i.e. neural learning and evolutionary learning, have also been combined into
hybrid approaches for evolutionary design and training of neural networks, which are
said to overcome the weaknesses in conventional neural network design and training.
The CAM-Brain projects (Garis, 1995), for example, are based on such automated
evolutionary neural network design and training.
In contrast with these learning paradigms, Coward (Coward, 1997) proposes a
new mechanism of learning for the Recommendation Architecture. He argues that a
key requisite for learning in intelligent systems is the ability to cater for ambiguity in
information exchanged while maintaining an adequate context for the information
exchanged. For example, in conventional software systems the division of memory
and processing have a specific context for information exchange between modules. It
would be either instructions or data, which are unambiguously defined. (e.g. if x = a
do : { } where x is information received from another module). The ubiquitous
division between memory and processing is necessary to maintain such specific
contexts for information exchange between modules. This limitation of using total
unambiguous meaning leaves no room to modify functionality. Conversely,
components in the Recommendation Architecture exchange partially ambiguous
information which enables modification of the functionality of its components. To

7
clarify, the components in the RA select, record and subsequently detect any
repetition of patterns. These patterns are selected by a process which finds for patterns
which are as operationally useful as possible but in the absence of a priori guidance
which always include some random element. Once a pattern is recorded it is not
subsequently changed in order to preserve adequate meaning.
It is strongly argued that learning in the human brain is carried out by
associating new patterns with previous experiences and also that the later learning
does not cause extensive loss of earlier learning (Squire, 2003) (Butters 1984, Butters
and Stuss, 1989 as quoted in Hodges, 2003). Once a pattern is learnt, it leaves a large
area sensitized for recognizing familiarity and associating similarities of input
patterns. Learning occurs by finding previous experiences in new experiences, adding
a (generally small) set of additional conditions found within the new experience. The
Recommendation Architecture model is designed to mimic such learning (which will
be addressed in Chapter 2).
The functional architecture of the Recommendation Architecture can be
visualized as a modular, hierarchical, connectionist model in which the outputs of one
layer become inputs of the next layer. The Recommendation Architecture has several
unique characteristics that differentiate it from a conventional feed forward neural
network. In the Recommendation Architecture model, learning is carried out by
associating new patterns with old patterns gathered during previous experiences of the
system. Learned patterns are not overwritten later preventing extensive loss of
previous memory (Coward et al., 2003). A constructive network is built upon the
reception of inputs so there is no limit to the growth of memory. The model consists

8
of two functionally separated sub-systems called the clustering system and the
competitive system. The clustering system divides its input experience into a limited
number of clusters (or columns as these are called in the Recommendation
Architecture), each indicating different (sometimes partially overlapping) repetitions
of input.
The Recommendation Architecture offers a sound underlying theory and a
simple functional architecture. The unique learning paradigm in the RA must be able
to solve complex real word problems though it needs extensive experimentation to
prove. The capabilities of the Recommendation Architecture model have been
explored for a number of problems with statistically generated data (Coward, 2000;
Coward, 2001a). Coward also reports on successful application of the RA to
simulated telecommunication traffic for network management (Coward et al., 2001b).
These experimental results have shown much promise for the Recommendation
Architecture model’s ability in pattern discovery and pattern recognition. However the
application of the Recommendation Architecture to real world data has not been
addressed in the literature so far. In this thesis it is proposed to investigate the
applicability of the Recommendation Architecture for a real world problem with real
data, namely text mining.
1.3 Application to Text Mining
Being able to detect unknown patterns in text data sets is becoming an increasingly
important concern due to the wide availability of large text collections and the need to
extract hidden knowledge in them. Data mining is the process of knowledge discovery
in databases. Text mining is a specific sub-field of data mining. Text mining
9
encompasses the broad field of organizing, retrieving, filtering and visual exploration
of textual documents. This thesis examines the aspects of text organization with
classification and pattern discovery and visual representations of text patterns.
Classification is an important aspect in text mining, which aids in organizing large
amounts of text. Text classification aims at uncovering the semantic similarities
between various documents (Iwayama and Tokunaga, 1995). Organizing collections
of text also adds a new dimension to retrieval by making it possible to locate pieces of
relevant or similar information that the user was not explicitly looking for. Especially
with the vast popularity of the World Wide Web, information searching techniques
have become more and more user centred and more personalized. When considering
how far the current information access systems cater for current user interests and
what capabilities these methods should have to cater for evolving user interests, they
seem to have almost reached their limit. A comprehensive literature survey in Chapter
3 reviews the problem of text mining and discusses why the Recommendation
Architecture offers yet a better solution.
1.4 Motivation for Research
Despite the great potential that Recommendation Architecture shows, is has never
before been tested for applicability to different real-life problems. All of the
experimental applications of the Recommendation Architecture model so far have
been with artificially generated statistical data. The major purpose of this research is
to test the viability of this novel intelligent system being applied to a real world
problem.

10
Text mining is a challenging task due to its large-scale nature and the inherent
uncertainty even for human beings. Especially in large free-form text collections that
contain no associated intelligent indexing information, it is difficult to base text
retrieval or analysis on search-oriented mainstream methods. Many approaches from
the fields of information retrieval and machine learning have been proposed for
various tasks in text mining such as pattern discovery and classification (Mitchell,
1997; Yang and Liu, 1999). Research conducted with simulated data has shown much
promise for the Recommendation Architecture model’s ability in pattern discovery
and pattern recognition, which makes the Recommendation Architecture a natural
candidate for modelling such a system.
1.5 Contributions of this Thesis
The following are the major contributions of this thesis.
• By experimenting with different document corpora, the capabilities and
limitations of the Recommendation Architecture model as applied to text
mining with real world data are explored in Chapters 5 and 6. One such
capability is pattern discovery within text collections. Another is its potential
in document classification. How the Recommendation Architecture model can
be adapted for pattern discovery and classification of text is demonstrated
experimentally in Chapter 5.
To carry out empirical studies,
o A reference implementation of the clustering system of the
Recommendation Architecture model is implemented using the C++
language. The aim is to provide for efficient execution of simulations
on a standard desktop computer (Chapter 4).
Deleted: {Mitchell, 1997 #120; Yang, 1999 #119}

11
o An existing feature selection method that gives à priori guidance to the
input space about the major document categories (topics) is modified
to suit classification. In Chapter 5, the Recommendation Architecture
model is successfully applied for document classification using this
method for feature selection.
• Three major limitations of applying the Recommendation Architecture
algorithm for text mining have been identified in Chapter 6. To overcome
these limitations, three extensions to the Recommendation Architecture model
are proposed (Extensions I, II and III). There are two scenarios of column
imprinting which result in excessively generic columns (acknowledging
documents from too many topics) and too specific columns (acknowledging
too few documents). To overcome these problems two algorithms are
introduced to increase the recognition accuracy of the columns through a
mechanism of self-correction. The third extension, a modification to an
existing algorithm, is introduced to increase the sensitivity of the clustering
system to overcome the low acknowledgement of documents by created
columns. This to be achieved by way of recognizing the frequency of
occurrence of features in the input vectors (Chapter 6).
• A method is introduced to automatically label the discovered patterns
represented by the columns of the system. The descriptive label consists of
words (features) in the input document vectors. This facilitates the human
identification of patterns in text discovered by the system (Chapter 6).

12
• A post-processing system is introduced for analysis and provision of user-
friendly interpretation of the clustering system output (Chapter 6).
• A formal notation is developed to describe the functional architecture of the
Recommendation Architecture model (Chapter 2).
1.6 Overview of the Thesis
In Chapter 2, the Recommendation Architecture model is introduced. A functional
description of the architecture is given with a discussion of its characteristics. A
formal notation is developed to clearly describe the components and the algorithms.
Text mining is a growing area of research. Chapter 3 describes how text
mining relates to information retrieval, filtering and classification techniques. It is
argued that existing text mining approaches are an improvement over traditional
information access methods. How the Recommendation Architecture model can be
applied for further improvements is explained.
Chapter 4 presents the development of a C++ reference implementation for the
Recommendation Architecture model and demonstrates its capabilities with
artificially generated data.
Approaches to modelling the input space of the Recommendation Architecture
model is investigated in Chapter 5. The problem of feature selection is discussed and
two feature selection methods are examined. Experiments are used to demonstrate
unguided pattern discovery and document classification with the use of these feature

13
selection methods.
In Chapter 6 the adoption of the Recommendation Architecture model to
pattern discovery in text is examined. Some heuristics that depend on the input space
for parameter selection for the Recommendation Architecture model are presented
first. Then three extensions are proposed for improving clustering performance.
Performance is evaluated for using the standard criteria of average precision and
recall, and issues regarding existing performance evaluation measures are discussed.
A further extension and a separate post-processing system to present the output in a
way to make human interpretation easier are then introduced.
Finally, Chapter 7 draws some conclusions on the research and outlines the
directions that can be considered for future experimentation.

14
Chapter 2 The Recommendation Architecture Model
The Recommendation Architecture (Coward, 1990; Coward, 1997) is the principal
model under study in this work. In this chapter, the major characteristics of the
Recommendation Architecture (RA) are examined (Section 2.1). So far there has been
no formal notation to describe the RA model in literature. In Section 2.2, a formal
notation is proposed to clarify the description of the functional components and the
functional architecture of the RA (Ratnayake and Gedeon, 2003a). The RA model
consists of two functionally separate subsystems, namely the clustering system and
the competitive system. Of these two subsystems, the clustering system is investigated
in detail as the current work is mainly focused on application of the clustering system.
2.1 Introduction
The Recommendation Architecture model simulates the functional specialization and
the learning aspects of the human brain. Prior research has shown that the human
brain is subject to architectural constraints as are electronic systems due to natural
pressures (Coward, 2000). Some of the requirements of the human brain are to:
• be able to self construct from blueprint information (of DNA);
• be able to recover quickly from construction errors, failures and
damage; and
• be able to modify its own functionality, or learn.
According to Coward, these requirements force certain architectural constraints
on the neural circuitry of the brain. The RA model is bounded by similar architectural

15
constraints in its design. For example, only certain types of modular separations and
certain types of relationships between modules are allowed in order to limit the
excessive use of resources in terms of memory and processing. Coward points out a
number of architectural constraints on electronic systems and how the RA model
addresses them. These constraints and proposed solutions give an understanding of
the principles underlying the model.
One constraint is that the system should be constructable from design
information using a given construction process. This gives rise to the requirement that
the system be made up from a large number of devices with slight variations, taken
from a relatively small pool of different basic devices.
Another constraint is that to diagnose and repair system level failures, there
must be a simple logical path to follow to the component level, at which repair can be
accomplished. Moreover, the changes in the component level should not create
undesirable changes in the system level. This condition requires system functionality
to be organized into a simple functional architecture where functionality is separated
into modules. These modules should be subdivided into components and sub
components and so on until the basic functional device is reached. It is also likely that
the component complexity can be minimized if information1 exchange between
components is minimized. Simple functional separation is achieved by making sure
that the repetitions recorded on a single device will have similar functional
interpretations recommending similar responses for similar objects or conditions seen.
1 Information exchanged are neural network type activations

16
2.2 Major Characteristics of the Recommendation Architecture
Two key features of the RA model are that the functionality is not defined by design,
and the system components exchange partially ambiguous information.
The system defines its own functionality depending on the given inputs, a set
of basic actions and a few internal operational measures for success and failure
conditions. Were the functionality to be defined by design, if the system needs
changes without changing the inputs, some pre-defined conditions for system
operation must be modified. Modifications of this nature may introduce undesirable
side effects to those functions which rely on the original conditions (Coward, 2001a).
Coward argues that in such a situation, for a system to be flexible for change, the
system functionality should not be defined by design. To make functional changes
practical, the RA is built with a set of hierarchical modules, and information exchange
between the modules is kept to a minimum.
If the system defines its functionality heuristically it is necessary to define
component functionality heuristically. Therefore the components cannot use direct
consequence information such as an output from one component as an input to
another. If a component changes the inputs it receives, it may change a part of its
output behaviour without knowing the components that use its output. In such a
situation it is difficult to maintain an unambiguous context or 100% confidence that
the expected output is within a specified subset of possible outcomes for the
information exchanged. To overcome this problem, modules in the RA exchange
partially ambiguous information. ‘Partially ambiguous’ means that the currently
appropriate outcome has only a certain probability of lying within the specified

17
subset. Thus the output from a module is a recommendation rather than an instruction.
Since any input may generate many recommendations these must be resolved into a
single recommendation.
The ability to modify its functionality heuristically and the exchange of
partially ambiguous information enable learning in the RA. Retaining earlier learning
when exposed to new learning environments is a special feature in the RA. More work
is being done to prove that catastrophic forgetting does not happen in the RA (Coward
et al., 2003) as in the neural networks based on multi-layer perceptron (MLP)
memories. Among many other research that investigate overcoming the problem of
catastrophic forgetting in MLP memories (Kasabov et al., 2001), the Adaptive
Resonance Theory (ART) extensively addresses this issue. Distributed ARTMAP
(dARTMAP) (Carpenter et al., 1998) based and on Adaptive Resonance Theory
(ART) claim to have been successful in application of ART for the purpose of
retaining earlier memory.
2.3 Functional Overview of the Recommendation Architecture
In simple terms, the functional components of the RA detect ambiguous repetitions
and generate corresponding recommendations. Since information exchanged between
modules is ambiguous, the module output cannot be interpreted as instructions but as
recommendations for system actions1. In this scenario several recommendations may
compete for acceptance which suggests the need for a selection scheme. Therefore the
model is primarily separated into two subsystems: the clustering system, which
generates recommendations and the competitive system which selects the appropriate
action. The clustering system is a modular hierarchy, which functions by detecting 1 Pre-defined behaviours

18
functionally ambiguous repetition of input patterns. Detection of information
combinations activate recording of information. There is a change management
activity in the clustering system which ensures that changes to such recorded
information combinations are gradual and minimal. The competitive system uses
consequence feedback to associate the outputs with a set of predefined actions. The
detection of outputs from the clustering system trigger selection of the module or
modules giving output, and device weights are changed accordingly reflecting to what
extent the outputs correspond to expected actions. Coward draws a resemblance
between the clustering system and the cortex of the human brain (Coward, 1990).
Studies on cortical areas clearly show the structuring of the cortex into layers and
columns (Heeger et al., 2003). The function of the competitive system is compared to
the functions of thalamus, basal ganglia, and cerebellum. The thalamus functions as a
relay station for information from diverse brain regions on its way to cortex. The
function of the Basal ganglia are not completely understood but there is evidence
suggesting that the competing action recommendations are resolved into a ‘single
action concept’ at the Basal ganglia. Coordination of the movement sequence
according to the ‘single action concept’ is done in the cerebellum (Molavi, 2003).
An implementation of the Recommendation Architecture model can be
visualized as a set of layered columns which constitute the clustering system and a
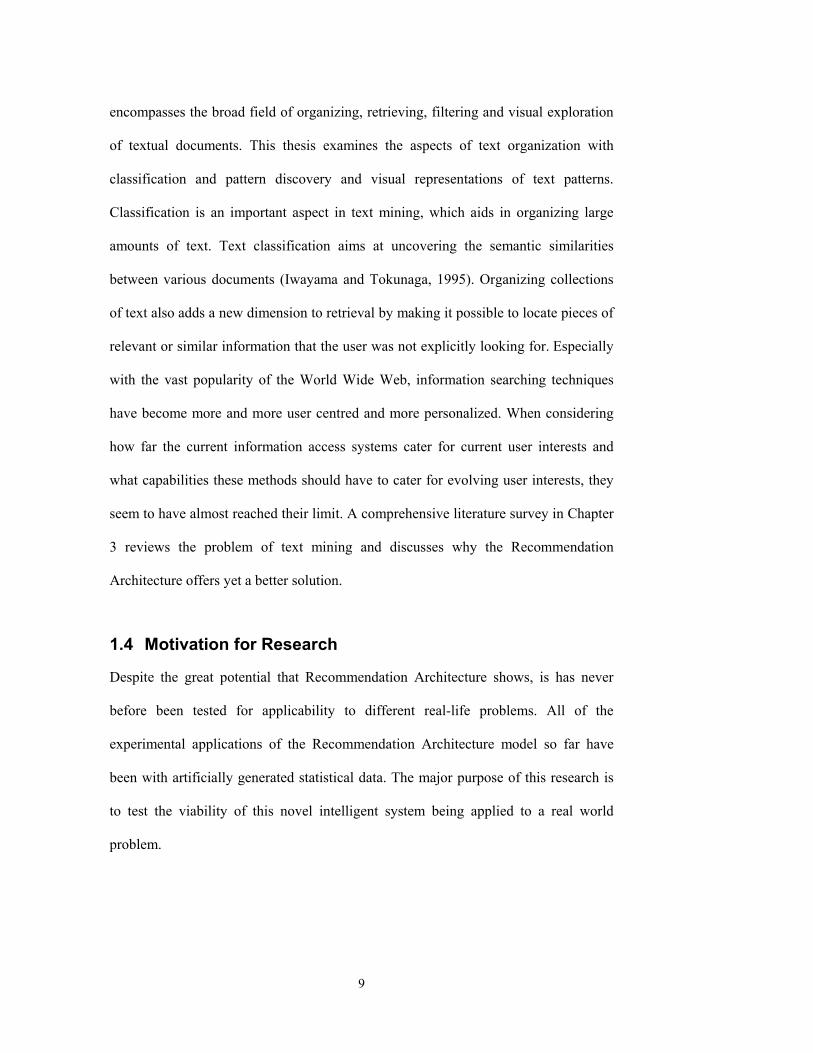
common layer which functions as the competitive system (Figure 2-1). The layers are:
1. Alpha layer selects the inputs which will be allowed to influence (accepted
into) the column.
2. Beta layer recommends imprinting of additional repetitions in all layers if it
19
has a sufficient level of activity
3. Gamma layer is the output identification layer and any output from gamma
layer inhibits imprinting in all layers.
4. Fourth layer is the competitive system or behavioural layer
Figure 2-1 Overview of the 4 layers of the Recommendation Architecture
A column extends across the first 3 layers. Columns taken together form the
clustering system and the competitive system is embedded in the fourth layer. All
layers are similar in construction, but functionally different.
Figure 2-2 A Device
Each layer as shown in Figure 2-3 consists of a collection of interconnected
devices. A device (Figure 2-2) is the basic unit that records information. In a device,
information is recoded in the input connections and in its threshold. All the inputs
Output
Input connections Regular Connections Virgin Connections

20
contribute the same weight. Learning is carried out by imprinting devices, which
includes addition of new connections and gradual adjustment of thresholds. How
imprinting is done exactly is explained in Section 2.3.1.2 after introducing all the
components (Figure 2-2 and Figure 2-3).
α
βγ
functional outputsfrom γ layer tovirgin devices in alllayers (connectionsnot drawn)
functional outputsfrom β layer tovirgin devices in alllayers
regulardevicesvirgindevices
primaryoperatonalconnections
functionalconnections
Figure 2-3 Layers in one column
2.3.1 A Formal Notation for the Functional Components
Consider a set of documents mapped to binary vectors according to a set of selected
features. A document corpus, DocCorp is represented by a set of appropriately
selected words called the feature set F with cardinality n. A document d in DocCorp is
represented by a binary input vector dv, with each bit denoting presence or absence of
a particular feature f in d, where f∈F. Thus,
dv = {fi}, i=1,…, n where fi is 1 when fi is in d, and 0 otherwise

A device has a set of input connections called the response space R, a threshold t
and a binary output o. Response space comprises of two types of connections: regular
connections and virgin connections. Regular connections Rr detect the presence of known
conditions in the input. These are the inputs that the device has responded to before and
they function as permanently imprinted connections. Virgin connections Rv enhance the
detection of new conditions or function to sensitize the device to respond to inputs similar
to those which the device already responds to. A device fires (produces an output) if the
number of input signals to regular connections is significant, and with or without virgin
connections, exceeds the threshold of the device. A device xd is denoted as:
xd ⟨R, t, o⟩ where R = {Rr , Rv}
There are two types of devices: regular devices rd and virgin devices vd. Regular
devices have patterns already imprinted and virgin devices have provisional connectivity
for new patterns to be imprinted.

21
Dr = {rdi} Dv = {vdi}
Thus, the set of all devices in layer l is lDr ∪ lDv and for simplicity this is
denoted as lD with an index set I. The accessor function " → " is defined in lD to
access the input connections (R), output connection (o) and threshold (t) of each of the
devices in lD. Thus, the input connections (R), output connection (o) and threshold (t)
of the ith device in lD are expressed as lD→Ri, lD→oi and lD→ti respectively.
A layer responds to a set of inputs activations xR, where xR is lD→Ri and the
response spaces of layers α, β and γ are defined as αR, βR and γR respectively.
A layer produces a set of outputs xO and the outputs of layers α, β and γ are
defined as αO, βO and γO respectively.
xO = {i∈I | lD→oi = 1}
The three layers α, β and γ in column c are denoted as c
vr O,R,D,D ααααα
cvr O,R,D,D βββββ
cvr O,R,D,D γγγγγ
The three layers of a column are configured as follows:
• αR responds to the set of binary vectors in the document corpus DocCorp and
a set of management signals Mβexcit and Mγinhib
• βR responds to the set αO and a set of management signals Mβexcit, Mβinhib and
Mγinhib
• γR responds to the set βO and a set of management signals Mβexcit and Mγinhib

22
The management signals M, include both inhibitory and excitatory signals.
How these are generated is explained in Section 2.4.2. Excitatory signals decrease the
thresholds of devices thereby increasing the likelihood of firing, whereas inhibitory
signals inhibit device firing. By changing device thresholds they perform global
management functions such as selecting the repeating inputs, intra-column activity
management like modulating thresholds, and inter-column activity management like
increasing thresholds for all other columns if a gamma device fires in a particular
column.
A column consisting of the three layers described above is the functional
module in the system and is denoted as: c⟨α, β, γ ⟩
A set of columns is called a Region RG.
RG = { ci}
With the column input dv, if the column output is γO, and γO≠∅, then dv is
said to be acknowledged by the column.
2.4 The Clustering System
The clustering system has two main functional objectives. One is to generate output
based on the detection of repeating input patterns. The other is to manage the
evolution of clustering in a way that simple functional construction is maintained.
Since local modules take decisions locally on what inputs to accept, a management
process is necessary to minimize global information exchange.
The system operates in two phases: the wake period and the sleep period. In

23
the 'wake’ period detection of incoming inputs and recording of repetitions of inputs
take place. In the 'sleep' period the system synthesizes for the future including setting
of the provisional connectivity to virgin devices. These two phases alternate till the
end of inputs presentations. Length of the wake period depends on the number of
input presentations to be given within one wake period.
2.4.1 A Formal Notation for the Basic Operations
This formal notation is developed to clarify the explanation of the basic operations of
the current implementation of the Recommendation Architecture model (Ratnayake
and Gedeon, 2003a).
2.4.1.1 Detection of Familiarity
A regular device rd, acknowledges input set P corresponding to dv, if P is adequately
similar to the pattern already imprinted in the device. Similarity is assessed by
matching the input set P with the response space R of the device. When the number of
matching input connections in R exceeds the threshold t of the device, the device is
said to be firing.
>∩∧>∩=
otherwiserd
t/rrd
t
Prd
,0
2 PR PR if ,1
),( fire device
The guard condition, rd
tr 2/ PR >∩ ensures that an imprinted device fires
only if the new pattern has adequate similarity to the original pattern imprinted, i.e.
regular connections exceed half of the threshold.

24
2.4.1.2 Possible Changes to the System Based on Detection a) Creation of a Regular Device A suitable input P is received by a virgin device and converts it into a regular device.
In this conversion process called imprinting, all the inactive inputs are deleted and a
permanent threshold t, is set slightly below the current active input count.
imprint virgin device (vd, P)
if t < P R ∩ then vd ⟨R,o,t⟩ ⇒ rd ⟨{R ∩ P},o, P R ∩ - 1⟩
Here, the operator ‘⇒’ denotes conversion. vd ⟨R,o,t⟩ becomes a regular device with a
response space ‘{R ∩ P}’, output ‘o’ and a threshold ‘ P R ∩ - 1’.
b) Adding Inputs to an Existing Device
In response to an input set P, A regular device rd progressively adjusts itself to
recognize inputs similar to P. This is achieved by converting its virgin connections,
which match the input P, to regular connections.
imprint regular device (rd, P)
if (( t < P R ∩ ) and ( P) (R R vr ∩∪ < “max. regular connection limit” )) rd ⟨R,o,t⟩ ⇒ rd ⟨{ Rr ∪ ( Rv ∩ P)},o,t⟩
After a device is initially imprinted it does not accept additional connections unless it
is in the alpha layer.
c) Decreasing the Threshold of a Device
If a column has sufficient β layer activity but fails to produce γ layer output, the
thresholds of the devices in each layer l are reduced in anticipation of γ output. The
thresholds of virgin devices are initially set at notional infinity T, so only a

25
combination of inputs having a high proportion similar to the regular connections in
the device causes it to fire. If excitatory signals on regular connections are present and
out weigh inhibitory signals, the threshold of the device is made to gradually decrease.
The minimum threshold for devices is tmin, generally set to 5.
decrease threshold(xd, l) if (( Oβ > “min. β layer activity limit”) and ( Oγ < “min. γ layer activity limit”))
for each vdi ∈ lDV vdi ⟨R,o,t⟩ ⇒ vdi ⟨R,o,t’⟩, where (tmin ≤ t’< t ) d) Addition of a New Column A new column Cnew is created only when a sufficient level of response is produced
from the last created column. Its purpose is to ensure a new column is created to
identify a sufficiently significant pattern in the input space. Inputs received while a
column is being created are recorded to ensure their contribution in creating the next
column. FI is the collection set which holds the frequently appearing input vectors
that do not contribute to output from any existing column.
create column() if ( column-Olastβ > “min. responses to create a new column”) and
( FI > “min. inputs required to create a column”) then initialize column
initialize column() create cnew⟨α, β, γ⟩ such that,
αR ⊆ FI (αR selected with a statistical bias to the most frequently occurring inputs in FI) βR ⊆ αO (βR is a randomly selected subset)
γR ⊆ βO (γR is randomly selected subset) add cnew to RG

26
If there are many columns and more than one column has enough beta subset
activity to trigger imprinting, the inhibitory signals between subsets will limit
imprinting to the columns with the strongest activity. No guidance is required for
creation of the column structure as the clustering system can simply find portfolios of
patterns which frequently occur in input states. New columns can be added without
limit to the system.
2.4.2 Factors which Determine Changes in a Specific Device
There are three factors that contribute to state changes in devices. These factors
depend on the overall activity in beta layers and gamma layers.
a) Overall activity in the beta layer of the same column Devices in every layer receive excitatory signals Mβexcit from a subset of the beta layer
of the same column. This specific beta layer subset has inputs only from the regular
devices in the beta layer of the same column. Therefore firing of this subset is taken as
reflecting the overall firing of the layer.
For column cj,
Mβexcit ⊆ βO Where jcvr O,R,D,D βββββ
b) Whether overall activity in the beta layer of a column is greater than that in other columns Devices in the beta layer receive inhibitory signals from the equivalent beta layers in
other columns. This type of inhibitory connectivity and excitatory connectivity (from
the above condition) to a beta layer subset promotes competition, as imprinting is only
done in the column where the beta layer activity is strongest.

27
For column cj, Mβinhib = β1O ∪ β2O ∪ … β j-1 O ∪ βj+1O … ∪ βnO
Where kCvrk O,R,D,D βββββ , k = 1, 2, … j-1, j+1, … n
c) Overall activity in the gamma level Devices in every layer receive inhibitory signals from all the devices in the gamma
layer of the same column. These signals indicate the overall activity in the gamma
layer. Any firing in the gamma layer will stop imprinting in the devices of all layers.
For column cj,
Mγinhib = γO Where jcvr O,R,D,D γγγγγ
2.4.3 Growth of the Clustering System
As the patterns in the input are acknowledged, the clustering system grows in number
of columns. The growth of the clustering system may be considered as follows. In the
first wake period there are no columns to respond to any input. During the first sleep
period an initial column is built with the connections in all three layers set up
randomly. After creation of the first column, combinations of input that occur
frequently when no other column produce output are stored for future use. Inputs to
the virgin devices of the first layer (of the later created columns) have a small
statistical bias in favour of these input combinations. (In a column that is already
operating, inputs to virgin devices are randomly assigned with a 66% statistical bias in
favour of inputs that have recently fired.) The system activates at most one new
column per wake period if that column has been pre-configured in a previous sleep
phase. Whenever a new column is created its layers are configured with random
connections. Devices in the initially configured layers are virgin devices, and when a
virgin device fires it is converted to a regular device. This regular device will fire in
the future if a high proportion of the inputs active at the time of conversion are met

28
again. It is now programmed to detect a specific sub-set of information conditions
from the input. This conversion process is called imprinting with a combination or
information recoding.
Once a column is built, the incoming inputs are compared with the alpha layer
to see whether there is any similarity to the connections in the devices. The alpha and
beta layers receive only excitatory input signals. These excitatory input signals will
cause the virgin devices in all layers to reduce their thresholds enabling them to fire.
When gamma layer devices begin to fire, inhibitory signals from that layer will cut off
further imprinting. At this point, devices in the alpha layer record some combinations
of input characteristics which actually occur in the input space. Beta layer devices
record a combination of alpha layer outputs, and gamma layer devices record a
combination of beta layer outputs. The complexity of combinations in terms of the
number of characteristics contributing for the combination increases from alpha to
gamma. The probability of any combination occurring in any future state therefore
decreases from alpha through gamma.
When an input vector is presented there are four possible effects on a column:
1. The column can produce a gamma output without imprinting any new devices.
2. If there is no significant firing in the alpha layer but if there is another column
available, then the input is presented to that column.
3. If there is significant firing in the beta layer though not in the gamma layer, it
means there is some similarity in the input space for the past state of that
column which produced output. Therefore, virgin device thresholds are
decreased first in the gamma layer, then in both gamma and beta layers and

29
finally in all three layers to achieve a gamma output. This addition of new
devices will expand the range of the states to which the column will respond in
the future. Devices can be added without limit to the layers of a column.
4. If there were significant firing in the alpha layer but not in the beta layer it
would not allow imprinting in that column. This condition means that the input
state is uncertain as to the similarity of the inputs state to the past states.
If a significantly different new pattern arrives where no existing column
produce significant output from the alpha layers it would be stored and would
contribute for a new column to be created in the next sleep period.
2.4.4 Overview of the Column Output and the Competitive Function
The number of columns created after a few wake and sleep periods does not have a
direct relation to the number of cognitive categories of objects. The system
heuristically divides the repeating inputs to a set of columns. Because of the use of
ambiguous information, strictly separated learning and operational phases are not
necessary. After a few wake-sleep periods the system continues to learn while outputs
are being generated in response to early experiences. The system becomes stable as
the variation in input diminishes.
A column output indicates the degree of similarity between the current input
vector and the past input vectors for which the column produced output. If a similar
state occurs the column will always reflect the output generated by the past
occurrence. The degree of difference between the current and past states is reflected in
the identities of the specific gamma layer devices. If column outputs should be
different for similar input patterns then more repetition information should be

30
provided through additional inputs. The additional inputs will aid the system to better
identify the differences in input patterns.
The competitive function, which is the fourth layer in the hierarchy, has a set
of predefined behavioural outputs or actions depending on the input domain used.
Each such action has a corresponding device in the fourth layer. Each fourth layer
device receives initial inputs from the columns. Such a device is assigned a small
weight which will be changed in response to the resulting feedback from its output
which is also called the ‘consequence feedback’. If the consequence is positive the
weights of all active inputs are increased, and if the consequence is negative the
weights of all active inputs are decreased. After a few cycles of feedback, behaviour
converges to the most appropriate one for different combinations of column outputs.
At this point, inputs from columns with relatively small weights are deleted. When a
new column output is generated only those from columns already providing inputs
will be added. Such new inputs will be assigned the average weight for inputs from
the same column.
Columns are not directly changed by consequence feedback, as changes in
response to the consequence of one type of behaviour could degrade another type of
behaviour using the same column output. However if there are often negative
consequences following output from a specific column, that column's outputs do not
adequately discriminate between small but functionally significant differences. Then
the column can be triggered to imprint more gamma devices which may enable
discrimination between small but important differences in the input conditions.

31
2.5 Summary
The Recommendation Architecture consists of two functionally separated subsystems
called the clustering system and the competitive system. The clustering system is a set
of columns consisting of three layers of basic devices. It is a modular hierarchy,
which functions by detection of repeating patterns in the input space. The input to the
clustering system is a binary vector denoting the presence and absence of
characteristics in the input space. The competitive system is a common layer of
devices receiving inputs from all the columns. The RA is made to operate in two
alternate phases: wake and sleep. During the wake period inputs are accepted and the
devices are imprinted across the layers as a path is discovered to the output. The
clustering system primes for acceptance of additional similarities in existing and new
patterns during the 'sleep' mode. In time, a long sequence of input vectors is organized
to a limited set of condition portfolios corresponding to the columns. In summary, the
clustering system recognizes objects with some familiarity, and also sensitises the
devices to accommodate partially ambiguous patterns.
The formal notation presented here is developed to aid understanding of the
RA model. The next chapter (chapter 3) argues the applicability of the RA system for
the problem of text mining. Then the fourth chapter describes the reference
implementation of the clustering system addressing the issues regarding its
implementation and performance.

32
Chapter 3 Information Access and Text Mining
The tremendous growth in the volume of textual information available on the Internet,
digital libraries, and news sources give rise to the problem of how a user can access
required information effectively and efficiently. This problem has led to extraordinary
advances in retrieving, organizing, navigating and summarizing information. These
advanced techniques help users to discover meaningful information going far beyond
simple document retrieval and classification. Especially with the vast popularity of the
World Wide Web, information searching techniques have become more and more
user-centred and ever more personalized. This chapter first briefly examines the
existing techniques of information access and the emergence of the field of text
mining (in Section 3.1). How far the current information access systems cater for user
interests and what capabilities these systems need to cater for evolving user interests
are investigated in Sections 3.2, 3.3 and 3.4.1. Finally in Section 3.4.2, the question of
why the Recommendation Architecture model can be applied to provide a better
solution to this problem is discussed.
3.1 Introduction to Information Access Systems
There are many established methods that provide different kinds of information
access. These methods, ‘information retrieval’, ‘information filtering’, ‘text
categorization’, ‘text classification’, ‘text clustering’, ‘data mining’ and ‘text mining’
have different goals. This section briefly discusses what their primary tasks are and
the fundamental differences between these methods.

33
Widely used Information Retrieval (IR) systems relies on the technology that
retrieve documents based on the similarity between keyword based documents and
query representations. A retrieval process generally produces a large number of
matches, which result in tedious and expensive post retrieval sifting of documents by
the user (e.g. popular Internet search engines such as yahoo and google).
Information Filtering (IF) is the process of selecting and distributing relevant
documents to relevant people or places. According to Belkin and Croft there are few
basic differences between IF and IR : Filtering is concerned with the distribution of
texts to groups or individuals whereas IR is concerned with the collection and
organization of texts. Filtering is mainly concerned with the selection or elimination
of texts from a dynamic data stream whereas IR is concerned with the selection of
texts from a relatively static database. Filtering is concerned with long-term changes
over a series of information-seeking episodes whereas IR is primarily concerned with
responding to the user's queries in texts within a single information-seeking episode
(Belkin and Croft, 1992) (e.g. SIFTER is a filtering system proposed for filtering
medical documents (SIFTER, 2002; Mukhopadhyay et al., 1996). The systems
proposed for ordering Usenet newsgroup postings according to relevance to the user
(Yan and Garcia-Molina, 1994; Maltz, 1994)).
Text categorization is the assignment of pre-specified categories to a
document. Categories are obtained from a classification scheme where they are
expressed numerically or as individual words or as phrases. Organizing large amounts
of information into a small number of meaningful clusters is called text classification
34
or clustering. Based on the idea that similar documents are relevant for the same
query, text classification and categorization are investigated for the effective text
retrieval and filtering.
Data mining is primarily regarded as knowledge discovery in databases. The
discovered knowledge can be frequently repeating patterns, rules describing
properties of the data, classification of the objects in the database etc., where useful
information is extracted from a large data collection (Mannila, 1996). Text mining is a
specific field of data mining, which encompasses the broad area of providing effective
and efficient methods for representing, managing, organizing, searching, and
retrieving text. Thus text classification is an important aspect in text mining.
According to Kohonen (Kohonen et al., 2000) organizing collections of data also
facilitate a new dimension in retrieval, by making it possible to locate pieces of
relevant or similar information that the user was not explicitly looking for. Since
recently, great attention has been given to research on text mining primarily based on
Self-Organizing Maps (SOM) (Kohonen et al., 1996), WebSOM (Lagus, 2000),
hierarchical feature maps (Merkl, 1999), and Growing Hierarchical SOM (GHSOM)
(Dittenbach et al., 2000a). All these approaches provide exploratory data analysis
illustrating properties and relationships among data. The process of finding
unsuspected relationships among data is termed as pattern discovery. Pattern
discovery within large text collections also aids many text mining aspects such as
classification, organizing and visual interpretation of relationships.

35
3.2 Advances in Information Retrieval and Filtering
Information retrieval is the most established sub-field of text mining where the user
can express the information need explicitly and adequately (Lagus, 2000). The core
tasks performed by any retrieval system are (i) indexing of terms and (ii) providing
the means to search for relevant documents in a text collection. Extensive research has
been carried out on information retrieval for more than forty years, and much is
known about document and term weighting strategies and how Boolean and ranked
queries are evaluated optimizing resources (Salton, 1989; TREC1, 2003). In contrast
to retrieval systems, text filtering systems sift through incoming information to find
relevant documents where user needs are represented by user profiles. According to
user feedback most filtering systems try to improve user profiles over time. Vector
Space model, Probabilistic model and Boolean model are the major classical models
(Fuhr, 2000) that have provided the basis for modern retrieval and filtering systems.
The vectors-space model is the simplest to use. The assumption that ‘terms’ are
orthogonal and hence they are independent, and the lack of theoretical justification for
some of the vector manipulation operations controlled by arbitrary chosen parameters,
are the major disadvantages of the vector-space based models. The probabilistic
model can include ‘term’ dependencies and the model itself determines the major
parameters. However, it has the difficulty in finding representative values for the
required term occurrence parameters which hinders improvements in retrieval
effectiveness. In the conventional Boolean environment, a ranked output of the
documents according to query-document similarity cannot be generated. It is often
used with many other systems such as vector-space model and fuzzy-sets because of
the practical importance of the Boolean query system.
1 TREC (Text REtrieval Conference) is a series of annual competitions and conferences aimed at encouraging research in information retrieval and filtering.

36
3.2.1 Advances in Retrieval and Filtering Systems Based on Classical Models
Outputs from most retrieval systems are lists of documents with an estimated
relevance to a query. Kretser and Moffat describe a system where locality-based
similarity retrieval is performed and the documents are opened at the exact point of
maximum similarity (Kretser and Moffat, 1999). This method almost eliminates the
task of user having to manually peruse whole documents to find the passages his/her
query was matched. Locality based retrieval engine determine the precise location/s
where the similarity heuristic has triggered. However query evaluation is very
complex since a single term may cause ten to thousand accumulators to be updated.
Processing time for short queries in long document have shown to be acceptable
though long queries, containing about 43 words in average, has been very high.
Information retrieval and filtering techniques are usually formulated as
operations on an n dimensional vector space where n is the number of distinct terms in
the collection. Each term is given a weight signifying its statistical importance. Yan
and Garcia-Molina argue that the most of the work on filtering has focused on the
effectiveness and has not addressed the efficiency aspect (Yan and Garcia-Molina,
1994). They propose a new method to improve efficiency of filtering systems based
on the vector space model. It uses selective profile indexing to select the significant
terms of a profile to make the indexing terms. In the widely used profile indexing
method, a profile is indexed by all its terms. In the proposed method they define a
threshold for the term weights so that the terms above the threshold are considered
significant and the rest are considered as insignificant. Selective Profile Indexing has
proved much better in terms of CPU utilization though it requires same amount of
disk space as (some times more than) the Profile Indexing method.

37
According to Bell and Moffat a high performance information filtering system
has three main requirements: (i) it must produce meaningful information to the user
effectively, (ii) it must handle a large volume of information efficiently, and (iii) it
must work sufficiently fast (Bell and Moffat, 1996). They note that none of the
existing systems are capable in facilitating all of the three requirements. Therefore
they propose a filtering system combining a number of other techniques which is
capable of high performance on a typical workstation platform. This system operates
on three main phases: indexing, processing significant terms and processing
insignificant terms. Selective profile indexing proposed by Yan and Garcia-Molina
(Yan and Garcia-Molina, 1994) is used for the latter two phases. All the three phases
are estimated to take an average of 7 minutes for 1,000 documents. It is pointed out to
be a very good speed for distributing Usenet news groups as it is estimated that
Usenet provides 1,000 news articles every 15 minutes. However, still it is necessary to
efficiently support updates to profile matrices and support the addition of new
profiles. Still this system needs to be implemented for experimental verification.
Though much research has been done to advance retrieval and filtering
methods based on the classical models with indexing, studies have shown that
document indexing is often inconsistent and incomplete (Belkin and Croft, 1987;
Sebastiani, 1999). Human indexers may disagree on terms to use to index documents
and may index the same document with different terms at different times. It requires
retrieval and filtering algorithms to go beyond simple key word matching and use
intelligent methods, which focus on associative similarities instead of exact matching.

38
3.2.2 Latent Semantic Indexing
Latent Semantic Indexing (LSI) (Dumais et al., 1996; LSI, 2003), is a concept based
automatic indexing method. LSI represents terms and documents in high-dimensional
space allowing the underlying (“latent”) semantic relationships between terms and
documents to be exploited in improving retrieval. This model does not rely on literal
matching and consider a term in a document is somewhat an unreliable indicator of
the concepts contained in the document. It can retrieve documents that do not contain
query words, e.g. it learns that words like ‘laptop’ and ‘portable’ occur in almost
similar contexts and queries about one probably retrieve documents about the other as
well. LSI is an extension of the vector-space model for information retrieval and is
developed using a statistical algorithm called ‘singular value decomposition’ (SVD).
Since it is a concept based retrieval method it shows promise in overcoming problems
like synonymy1 and polysemy2 in keyword based retrieval systems (Zha, 1998; Letsche
and Berry, 1997). Dumais argues that LSI improves information access when high
recall is necessary, text descriptions are short, user inputs or texts are noisy, or cross-
language retrieval is necessary. However some case studies have shown that there are
a few disadvantages in LSI. One disadvantage in LSI is the high computational cost in
making the document matrix and its SVD for large databases. If the database is
modified, the document matrix and all subsequent calculations have to be redone
which makes it applicable only to information retrieval in static databases (Berry et
al., 1995). Another disadvantage is that the number of factors used must be set
according to some heuristic method. If the number of factors is too high no
generalization (clustering) may take place, and if the number of factors is too low the
model may over-generalize (Carroll et al., 1995).
1 Failure to retrieve documents discussing the desired concept using synonym terms. 2 Retrieval of documents that contain query terms but in a different context.

39
3.2.3 Neural Network Models
Neural networks have been shown to be well suited for pattern recognition where
inexact matching is required (Calvo, 2001; Tronia and Walker, 1996; Wood and
Gedeon, 2001). Pattern recognition aids the classification of an unknown input to one
of the known patterns. Though training phases can be computationally intensive and
time-consuming, once trained, neural networks can be both fast and efficient offering
a good response time. Training for a collection can be performed off-line.
Tronia and Walker propose a neural network solution using Hebbian learning
where implicit query expansion is done and the documents are coded as their semantic
patterns (Tronia and Walker, 1996). In this method, a user query will not match only
those documents which contain the query words but also with documents with similar
words. When accessing information through queries it helps users to go beyond the
literal terms of their original query. It is done by analyzing the document collection
and using the patterns of word occurrence to generalize the initial user query via an
implicit thesaurus coded within the neural network.
3.2.4 Retrieval and Filtering for User Requirements
Though many techniques and algorithms are on offer for the advancement of retrieval
and filtering systems, whether they completely answer the user’s information need is a
question to be answered.
In the search paradigm it is assumed that the users know exactly what they are
looking for and are capable of expressing their information need very well. A major
problem arises when the domain is unknown and the appropriate and specialized
vocabulary is difficult to find, so that the query cannot be specified properly which

40
can cause the user to be overloaded with irrelevant documents. When the information
need is vaguely understood and difficult to articulate, it is more appropriate to
summarize the available information and display unsuspected relationships among
documents (Lagus, 2000). Conventional information retrieval and information
filtering systems do not attempt to perform these two tasks.
3.3 Text Categorization, Clustering and Classification
Categorization methods, clustering algorithms and classification techniques provide
the means to group documents according to similarities in content. Other than
organization itself, grouping of documents prior to retrieval has been investigated for
improving performance in retrieval systems. Grouping of documents after retrieval
has been shown to aid in better representation of similarities. Sections 3.3.1, 3.3.2 and
3.3.3 discuss the context these grouping terms are used and investigate the type of
research being carried out in these areas. By examining these systems I intend to point
out the features which will be useful for the reader when differentiating the RA model
from them.
Commonly used performance evaluation measures for categorization and
classification systems are called recall, precision, F1 measure and their micro and
macro averages. These measures are used in many instances in the next sections for
performance comparison of different systems. Recall (r) is the percentage of the
correctly classified documents for a given category. Precision (p) is the percentage of
the predicted documents for a given category that are classified correctly. The F1
scores are calculated for a series of binary classification experiments, one for each
category, and then averaged across the experiments. It is defined as:
41
F1 (r, p) = 2rp / (r+p)
There two types of averaging methods for presenting average recall, precision and F1
score. Micro-averaging technique gives equal weight for each document. Therefore
these values tend to be dominated by the classifier’s performance on large categories.
Macro-averaging technique gives equal weight for each category thus tends to be
influenced by the classifier’s performance on small categories.
3.3.1 Text Categorization
Text categorization i.e. assigning an unseen document to a pre-defined category based
on its content, involves a large amount of manual work if not done automatically. For
example, categorization of medical journal articles according to Medical Subject
Headings (MeSH) to form the Medline corpus requires a considerable amount of
human resources (Mehnert, 1997). Automatic text categorization relieves the manual
effort in categorization and also supports effective retrieval. Therefore a growing
number of statistical classification methods and machine learning techniques
including neural network models has been applied for text categorization, with a view
to automating this process.
To enhance retrieval performance, recently, Lam et al proposed an automatic
text categorization method based on the vector space model as the text representation
framework (Lam et al., 1999). Here a learning paradigm known as instance-based
learning and a document retrieval technique known as retrieval feedback are
combined for the experiments on retrieval after categorization. Statistical analysis of
the retrieval results shows that retrieval performance improves in terms of
effectiveness (using query by query analysis for the test cases) when compared to 17

42
other strategies. Retrieval results are measured by the 11-point average precision1
score. Use of the automatic categorization method also achieves a retrieval
performance equivalent to the results using manual categorization. However, they
admit a limitation in this categorization method which is the inability to add new
categories after training. It is limited in design to categories only in the training data
set.
Research on statistical methods like decision trees (Apte et al., 1998), Linear
Least Square Fit (Yang, 1994), and Naïve Bayes (Fang et al., 2001) has been carried
out for text categorization for about a decade in search of accurate, fast and efficient
categorization methods. Almost all new methods are compared with these for
performance evaluation in classification accuracy.
Dumais et al argue that Support Vector Machines (SVM) are the most accurate
method (averaging 92%) when compared to Naïve Bayes, Bays Nets, Decision Trees,
and ‘Find Similar’ classifiers in classification accuracy (Dumais et al., 1998). The
data set used is the Reuters-21578 collection. This experiment has been done to
compare the effectiveness of different inductive learning algorithms in terms of
classification accuracy learning speed, and real-time classification speed. When
comparing learning speed ‘Find Similar’ is shown to be the fastest (<1 CPU
secs/category) and SVM is the next being (<2 CPU secs/category). Though all other
models require a large number of labelled training data, SVM is shown to provide
stable generalization in performance with fewer positive examples. However, SVMs
are not capable of online-incremental training so that addition of new examples
1 11-point average precision- precision is calculated for different values (0.0 – 1.0) of recall and averaged over 11 resulting values.

43
requires re-learning including previously learned examples (Tan, 2001).
In his recent work Calvo compares a backpropagation (BP) algorithm that
minimizes the quadratic error with SVM, K-Nearest Neighbour (KNN) and Naïve
Bayes (NB) classifiers (Calvo, 2001). Calvo has chosen Reuter Newswire financial
news articles (Reuters 21450) as the data set and compares Micro and Macro averages
of the BP network with the performance of SVM, KNN and NB classifiers. For
precision and recall, Micro-averages are computed document wise and Macro-
averages are computed category wise. Calvo’s results are as good as SVM or KNN
with Micro averages but performance is poor when compared with Macro averages. It
seems that classifier’s performance on larger categories (having a large number of
documents) are good whereas performance on smaller categories are poor.
A neural network model called the Adaptive Resonance Associative Map
(ARAM) (Tan, 2001) is an extension of Adaptive Resonance Theory (ART)
(Carpenter and Grossberg, 1987) which has been investigated for text categorization.
It performs incremental supervised learning of recognition categories (pattern classes)
and makes multidimensional maps of binary and analogue patterns. ARTMAP
(Carpenter et al., 1991b; Carpenter et al., 1998) and ARAMap both have evolved from
Supervised Adaptive Resonance Theory. A distinct feature in ARAM is that earlier
learning does not get erased and the meaning of the units does not shift as subsequent
learning take place. This feature enables preservation of symbolic rules during
training. The Adaptive Resonance Associative Map is designed to utilize user
feedback as it can integrate user-defined classification knowledge. Tan claims that the
results of his experiment are comparable to SVM, KNN and LLSF when a few

44
training documents available. When micro-averaging F1 scores are considered it is as
good as other methods whereas comparison of Macro-average scores shows
significantly better results than all other methods. Good Macro-average scores show
that the performance of the system with the categories containing a smaller number of
documents is very good.
3.3.2 Clustering Algorithms
Clustering algorithms which are used to group objects have been developed for
various problems in different areas including text clustering. These algorithms can be
categorized according to their underlying methodology of the algorithm or the
structure of the final solution. Agglomerative and partitional approaches are
categorized based on the underlying methodology of the algorithm whereas
hierarchical and non-hierarchical solutions are categorized based on the final solution.
From these methods, partitional method has been proven to perform well in
large text clustering requiring low computational power. Almost all partitional
algorithms use a global criterion function to optimize. Zhao and Karypis evaluate the
performance of different criterion functions for the partitional method (Zhao and
Karypis, 2002). Theoretical analysis of criterion functions shows that their overall
performance depend on the degree that the data set contain clusters of different
densities and on the degree that it provides reasonably balanced clusters.
3.3.2.1 Using Clustering to Enhance Retrieval Performance
Many research initiatives have emerged where clustering has been proposed to use
prior to searching to enhance retrieval effectiveness. In cluster based search, training
documents are partitioned into several clusters before searching (static clustering) and
a test document, or a query is compared with each cluster centroid. Since

45
effectiveness of searching largely depend on the performance of the constructed
clusters, selection of the classification method is crucial. Iwayama and Tokunaga
propose a probabilistic algorithm called Hierarchical Bayesian Clustering to construct
clusters for cluster-based search which he demonstrates to outperform full search,
category-based search and non-probabilistic clustering (Iwayama and Tokunaga,
1995). It is shown to have better performance in effectiveness with noisy data when
used with cluster based search though not necessarily better than full search.
Effectiveness is measured calculating the precision and recall per document, and then
summarizing them to a breakeven point at which they become the same value.
Though clustering should improve retrieval results as cluster hypothesis hold
(as discussed in (Salton, 1989)), many experiments are reported that retrieval after
prior clustering did not perform as well as retrieving the top ranked documents from
the collection as a whole (Hearst and Pedersen, 1996). The main problem is that if a
query was not a good representative of one of the pre-defined categories, it fails to
match any of the existing clusters strongly. To overcome this problem, some
experiments are done by grouping previously encountered queries according to their
similarity. If the new query does not match a cluster centroid it may in turn be
compared with a query group so that a corresponding cluster also can be found.
However, Hearst and Pedersen demonstrate with many examples that this approach
also fails to make a significant improvement.
Iwayama confirms the effectiveness of the Cluster Hypotheses when used for
clustering after retrieval (Iwayama, 2000). Hearst and Pederson also have used
clustering to classify retrieved results over a large text collection with performance

46
improvement (Hearst and Pedersen, 1996). The Scatter/Gather browsing system,
proposed by Hearst and Pedersen, clusters retrieved documents into topically coherent
groups and present a description of the cluster to the user. This description contains
topical terms that characterize each cluster generally and a set of titles that samples a
cluster. Scatter/Gather is an interactive system where a non-hierarchical partitioning
algorithm called Factionation is optimized for speed. However the ‘Scatter/Gather’
clustering algorithm is independent of the query which makes it doubtful whether
users can find the best clusters easily. Iwayama proposes a method of Query-biased
clustering where clustering algorithm is modified to incorporate the query directly
(Iwayama, 2000).
3.3.3 Classification Techniques
Numerous algorithms and methods have been proposed for unsupervised text
classification emerging from number of areas such as statistics, fuzzy logics, neural
networks and other AI related models. Statistical methods running on linear time
have received much attention and praise due to their high speed of processing. Some
statistical classification algorithms have been instantiated by different unsupervised
Artificial Neural Networks. Tufis et al demonstrate a novel method in processing
documents instead of considering the entire documents for the classification (Tufis et
al., 2000). They show that by random sampling of documents, good classification
accuracy can be obtained as well as being faster. In this method, for a new text, a
characteristics vector is constructed using a randomly extracted set of keywords. The
difference between this vector and the vectors in the classifier is computed and the
classification of this text is done based on the closeness of its vector to a family of
related vectors. This method is sensitive to underlying thesaurus content and
structuring. However, given the same training and test data, reference vectors and the

47
results may change if different thesauri are used. It is suggested that if the concepts
are differentiated by the ontology in a computationally meaningful way the
classification results could be better.
3.4 Text Mining
Text Mining is a recent advancement in the broad field of information access. The
concepts of making information access personalized and catering for evolving user
interests make this an important research area. This section examines the prominent
text mining techniques and also investigates why the Recommendation Architecture is
suitable for applying for text mining.
Grouping of documents according to similarities within them (by way of
categorization, clustering or classification) aids organization of large text collections
which is one aspect of text mining. Some other aspects such as finding unsuspected
relationships among data (pattern discovery) and representing data in novel ways
which are both understandable and useful to the user, makes it necessary to go beyond
simple classification. Representation of documents depicting relationships among
them becomes very useful when the users have no clear idea about how to specify or
describe the information that they are looking for. Some neural network approaches
based on Self-Organizing Maps as well as the Recommendation Architecture model
provide these extra capabilities required for text mining.
3.4.1 Neural Network Models
The Self-Organizing Map (SOM) (Kohonen et al., 1996; Kohonen et al., 2000) is the
most prominent neural network model applied for text organization using an
unsupervised learning paradigm. SOM provides a mapping of a high dimensional

48
input space to a 2-D array of nodes with an overall representation of input data
similarities. Thus documents on similar topics are located close to each other on the
map. SOM facilitates interactive exploration of a document collection where the user
looks at individual documents one at a time, but it is organized according to the
content in a graphical map display. Hierarchical Feature Maps (Rauber et al., 2000a)
and Growing Hierarchical SOM (GHSOM) (Dittenbach et al., 2000a) are attempts to
overcome some of the limitations of basic SOMs (Merkl, 1999). The next section
examines these models, their benefits and shortcomings.
3.4.1.1 Self-Organizing Map (SOM)
In the SOM model the document space is presented at three basic levels of the system
hierarchy: the map, the nodes and the individual documents. The learning process is
unsupervised and competitive, and it can be described in terms of input pattern
presentation and weight vector adaptation. Each node is assigned an n-dimensional
weight vector and the weight vectors have the same dimensionality as the input
patterns. As a training iteration starts, an input pattern is presented to the SOM where
each node determines its activation usually calculating the Euclidean distance
between the weight vector and the input vector. The node with the lowest activation is
referred as the winner. Subsequently weight vectors of the winner and the nearby
nodes are moved towards the input pattern. This adaptation of the weight vectors is
implemented as a gradual reduction of the differences between corresponding items in
the input vector and the weight vector. The number of affected nodes is determined by
a neighbourhood function. This strategy allows large clusters at the beginning and fine
grained input discrimination towards the end of the training process.
WebSOM is an implementation of the SOM model. It provides an overview of

49
the relationships between data items in the text collection and facilitates interactive
browsing. This system has been implemented as a set of WWW pages which can be
explored using a browsing tool. WebSOM has been successfully applied for
organizing and browsing patent abstracts consisting of US, European and Japanese
patents and Internet newsgroups (Kohonen et al., 1996; Lagus, 1998).
A major disadvantage in SOM is that the cluster boundaries are not explicit as
separation into clusters is not done automatically. The map shows a single picture of
the underlying data and becomes large depending on the number of topics present. It
can end up a huge map limiting its usability for display and navigation. Another main
deficiency is the use of static network architecture both in terms of number and
arrangement of processing units which have to be defined in advance.
3.4.1.2 Hierarchical Feature Maps
In Hierarchical Feature Maps (Merkl and Rauber, 2000), one SOM is used as the first
layer and for every unit in this map an independent SOM is added to the next layer.
When the first layer is stable, training proceeds to the maps of the second layer. Each
map is trained with only that portion of data which is mapped on the respective unit in
the higher layer map. They produce a separate cluster of the input data where clusters
are gradually refined when moving down along the hierarchy. This system has been
demonstrated with full text indexed documents with 1990 CIA World Factbook
(Merkl and Rauber, 2000). In this experiment, the hierarchical set up has been
determined empirically after a series of runs. The main shortcoming of this model is
that the architecture has to be define a priori, i.e. the number of layers as well as the
size of the map on each layer has to be specified. It also requires a profound insight
into underlying document collection before training. This system becomes ineffective

50
when the precise nature and the topic distribution of a collection are unknown and if
some topics are present more prominently than the others (Rauber et al., 2000a).
3.4.1.3 Growing Hierarchical SOMs
To overcome the problem of having to define a fixed architecture in Hierarchical
Feature Maps, Growing Hierarchical SOM (GHSOM) has been proposed (Dittenbach
et al., 2000b; Dittenbach et al., 2000a). It is an incrementally growing version of
Hierarchical feature Maps. In GHSOM each layer in the hierarchy consists of a
number of independent SOMs and it is defined as the result of an unsupervised
learning process where no prior information is necessary.
In GHSOM, the layer 0 consists of only a single unit with the weight vector
initialized to the average of the input data. The training process starts with a map of
2*2 units in layer 1 which is a SOM. After a certain number of training iterations,
which is determined by the number of input data to be trained, the unit with the largest
deviation between its weight and its input vectors is selected as the error unit.
Between this error unit and its most dissimilar neighbour in terms of input space
either a new row or a new column of units is inserted. The weight vectors of the new
units are initialized as the average of their neighbours. Training process is guided by
the quantization error of the units calculated as the sum of distances between the
weight vector of a unit and the input vectors mapped onto this unit. Mapping quality
of a SOM is based on the mean quantization error (MQE) of all units in the map. The
growth of the hierarchy terminates when no further units are available for expansion.
This model allows a separation of clusters mapped onto different branches of
the hierarchy. Here the depth of the hierarchy and the size of the various layers are

51
determined during training. Aimed at exploratory data mining applications, GHSOM
has been applied to classify the articles of an Austrian newspaper which shows its
ability in graphically representing hierarchical relations in data (Dittenbach et al.,
2002).
3.4.2 Recommendation Architecture for Text Mining
When examining the problem of how well the existing information access systems
cater for evolving user needs, it can be argued that the capabilities of the RA model
offer a better solution in many ways. The capabilities of the Recommendation
Architecture in classification, pattern discovery, learning (with functional meaning
unchanged) and evolving clusters on user feedback could be used in many areas of
text mining to serve the users needs. The RA model cannot be directly compared with
clustering algorithms, categorization and classification techniques as the core of the
RA model is concerned with pattern discovery or identification of associative
similarities in input.
The Recommendation Architecture is capable of finding associative
similarities among repeating patterns. If a long series of documents is presented to the
clustering system, it can organize its experiences into a hierarchy of repetitions with
simple repetitions giving rise to more and more complex repetitions. Repetitions
could be of similar complexity for patterns like words, sentences, paragraphs, and
documents. These repeating patterns will not correlate exactly with cognitive patterns
because the system finds the similarities heuristically. At the end of this process of
getting experience, the repetition hierarchy would have found a set of heuristically
defined repetitions in the document corpus. As demonstrated in this thesis, the
Recommendation Architecture can be adapted to classify documents with a high

52
precision when a priori guidance is given to the input space about the categories
expected. It is also capable of unguided automatic pattern discovery in unknown text
corpora.
While classifying a document corpus the columns of the Recommendation
Architecture continue to grow, since there is no specific training period necessary
(unlike most neural network models). Therefore it overcomes the limitations posed by
a fixed architecture as in SOM and Hierarchical Feature Maps. After a series of
operation (wake/sleep) cycles the system continues to learn while outputs are being
generated in response to early experiences. Thus anytime after the training of the
system for a particular document corpus any new document belonging to a previously
learned category can be correctly positioned. If a set of new documents belonging to
one of the already learned categories, but having some slight changes, is given to a
particular column, the portfolio of the column is expanded to include the changes.
Dynamic adoption is a necessary feature for useful real world clustering of
documents. A clustering system is not very useful if it cannot accommodate new
items after clustering or the training period ends (Kasabov, 2002).
Most often a text-mining query cannot be effectively articulated, in which case
the user can provide some indicator or an example to an RA based system to stimulate
it to discover the users information need. For example, another related document can
be given to the system as the indicator and the system can be asked to fetch a similar
one from the already classified set. As the RA provides indicators of the content
which were not specified in advance, but based on finding similarities heuristically,
users can ask for another set of documents from the cluster which gives output for a

53
particular document.
The information gathered during the system execution can be used to describe
the columns with labels as well as to find the context for words in the column label,
giving a meaning to the created columns. The output of the system also provides a fair
amount of information which can be further processed to create a representation to
analyse and access the contributing documents for building a column.
When the document collection is organized by the Recommendation
Architecture, one document can be in more than one column depending on the
similarity of its content to particular columns. This makes clustering in the
Recommendation Architecture multi-dimensional, unlike in the SOM based methods
where a document has only one fixed position in 2-D space. Thus, the pattern
discovery in the RA is more extensive.
3.5 Conclusion
With the nearly exponential growth of available information user needs have also
become very complicated and evolving, which forces many information access
systems to reach their limits.
It is clear that the usefulness of information retrieval and information filtering
systems are limited when the information need is vaguely understood and difficult to
articulate and also when it is necessary to discover unsuspected relationships among
documents. SOM based methods provide a picture of relationships among document
but have their limitations in mostly fixed architectures and large maps.

54
The Recommendation Architecture can perform significant additional text
mining tasks when compared to SOM based methods. Not only does it provide a
visual representation of discovered patterns, but also it is capable of classification to
classes. Since the output of the system contains a fair amount of information, the
system can be further extended to provide user-friendly interpretation of results.

55
Chapter 4 Software Simulation of the Recommendation Architecture
4.1 Introduction
A reference implementation of the clustering system of the Recommendation
Architecture model was built for software simulation. The prototype was designed
using object oriented concepts and built using the C++ language for cross platform
execution on Apple Macintosh and Microsoft Windows. A prototype system had been
implemented previously by Coward using SmallTalk (Coward, 2000; Coward,
2001a). A key motivator for the C++ implementation was to achieve processing
speeds necessary for the application of the system to large real world problems. The
new reference implementation provides considerable speed advantage for carrying out
rapid experiments and to apply the model for large input spaces. C++ implementation
also makes the system universally available. This chapter describes a number of
aspects of the prototype and issues considered in developing and using it (Ratnayake
and Gedeon, 2002a).
The system is implemented as three key subsystems. The first key subsystem
implements the pre-processing component. The pre-processing component prepares
and maps a document corpus to a suitable input space representation that can be used
by the clustering system. Various pre-processing and input space modelling methods
that were experimented are described in Chapter 5. The second key subsystem
implements the clustering system of the RA model (the subject of this chapter). The
56
third key subsystem post-processes the gamma layer output from the clustering
system to visualize the recognized document clusters. It also implements a labelling
scheme for cluster labelling and word context identification. The contributions of this
thesis on cluster labelling and other enhancements to presentation of output are
discussed in Chapter 6. Pre-processing and post-processing components are
implemented as separate modules to allow for flexibility in using the clustering
system.
To test the prototype, experiments were carried out with a set of artificially
generated data. The experiment presented in this chapter demonstrates the capabilities
of the clustering system. By discovering the existing patterns in the input data, the
system creates a set of columns and stabilizes. The column output is evaluated
calculating the precision and recall measures for each and then averaging them across
all columns.
4.2 Overview of the Prototype
The main elements of the RA model were mapped to objects in a C++ program. The
basic unit of the RA model, a device, is mapped to a device object and the rest of the
higher order constructs such as layer, column and region are implemented as
collections of their constituent lower order objects. Figure 4-1 shows the object model
of the prototype as a UML diagram. The collections are implemented as multi-
dimensional dynamic linked lists providing unlimited dynamic growth of clusters. The
prototype for the clustering system of the RA contains approximately 5000 C++
source lines.

57
Figure 4-1 Object model of the prototype
Dynamic memory allocation was used to optimize the usage of available
RAM. One major characteristic of the RA is that earlier learning is not erased or
overwritten as the system gains new experience. Thus the system continues to
consume memory as long as it takes to come to a stable state for a particular data set.
The implementation makes no limitation on the number of connections added to a
device, number of devices to be added to a layer, or the number of columns that can
be added to the system. The limitations are imposed solely by the memory availability
of the host system.
A document corpus or a document stream is first pre-processed to map each
Region
Layer
Column
1
0..*
1
-alpha, beta, gamma3
-virginConnections-regularConnections-threshold
Device
1
*
1
*-regularDevices-virginDevices

58
document to a suitable input vector in a defined input space. Output from the pre-
processing stage is a text file, containing integer vectors which indicate the presence
or absence of a feature for a particular input file. Input vectors of different document
categories are randomly mixed to increase the representational variety of the input
space. This aids the learning process in terms of identification of number of patterns
early in presentations.
As a collection of documents gets mapped to a set of input vectors they are
presented to the clustering system for cluster synthesis and identification. The
prototype is implemented in such a way that these input vectors (documents) can be
continuously presented to the system as a stream. Unlike traditional artificial neural
network models, the RA model does not require a separate learning cycle and the
system is capable of taking new inputs indefinitely. The system state can be saved at
any time and can be reloaded on subsequent execution.
The clustering subsystem executes in two primary execution cycles – wake and
sleep cycles. In the ‘wake’ cycle the system reads in the inputs. When input is being
presented, the system starts imprinting columns for repeating input patterns. As the
system gains sufficient experience (number of presentations), gamma layer outputs
from particular columns appear. Gamma level outputs represent an identified pattern
in the input. Columns are developed when similar inputs are exposed to the system
and become imprinted, creating a path to the output.
In each ‘sleep’ cycle the system reconfigures the existing columns to be
sensitised to inputs similar to already imprinted patterns and creates new initial

59
columns to be able to recognize new patterns. When new columns are created during
the sleep cycle, the initial connectivity defines the order of complexity of repetitions
at different levels of the RA model. The number of inputs given to a virgin device in
the alpha layer depends on the number of input characteristics present. Typically it is
set at 30% of possible inputs. This system also maintains the memory of the inputs not
responded to by the clustering system during the wake period to be used in statistical
biasing of the virgin device connections during the sleep period. This facilitates
creation of virgin devices that are sensitive to similar future inputs.
There are a number of adjustable configuration settings in this implementation
of the clustering system which defines the initial configuration of the system. These
settings, initial number of devices in each layer, initial number of devices that can be
imprinted, regular imprinting limit in each layer and alpha device threshold reduction
rate, can be specified by design prior to the learning process. These are system level
configuration settings; the nature and the characteristics of the input data set have
little influence on them.
There are also four learning parameters such as ‘the minimum number of alpha
layer devices that must fire before an existing column starts accepting an input vector
(αThreshold)’, ‘minimum device threshold (tmin)’, ‘minimum responses required to
create a new column (βThreshold)’, and ‘minimum number of inputs required to
create a column or the minimum number of vectors that could remain
unacknowledged without making a new column (Inputsmin)’. These need to be fine-
tuned based on the nature and characteristics of the input data set. Especially when
applying the model to input vectors that are sparse and have vague category

60
definitions, these parameter values must be determined through experimentation.
From the experimentations of this research a number of heuristics for setting these key
learning parameters were identified and these are described in Chapter 6.
4.3 Model Experiment
A model experiment was set up with statistically generated input data for testing and
behaviour analysis of the model.
4.3.1 Formation of the Input Space
For ease of visualization and understanding the experiment, the input space was
modelled to represent a set of codified colours. Each data point in the input space can
be regarded as a shade of a colour from red (RD), green (GR), brown (BR), black
(BL), white (WH) and clear (CL). These six colours represent six categories present in
the input. Each input vector was a binary vector indicating the presence or absence of
a feature in the population. These vectors were statistically generated using 600
possible features. Each category (colour) was defined by a different statistical bias
placed on the selection process for characteristics of each category. Thus, each 100
features in an input vector can be thought of as one of the colours and the number of
items set to 1 as the level of presence of that colour.

61
0102030405060708090
100
1 51 101
151
201
251
301
351
401
451
501
551
601
Features
% F
requ
ency
of o
ccur
ance
RDGRBRBLWHCL
Figure 4-2 Frequency of occurrence of the features in each category
0
100
200
300
400
500
600
RDGRBR
Figure 4-3 Feature distribution in four input vectors from three different categories

62
A few hundred vectors were created by randomly selecting 100 features with a
statistical bias for a particular colour. All duplicate inputs were removed from the
input and randomly selected vectors had an average size of 72 features. The frequency
of occurrence of the characteristics for each category is illustrated in Figure 4-2. As
shown in Figure 4-3, a feature may be shared across multiple categories and this data
set was constructed in such a way that a category cannot be determined on the basis of
the presence or absence of a few individual characteristics.
Figure 4-3 illustrates a sample of 15 input vectors and how the features 1 – 600
are distributed across the three categories RD, GR and BR. It can be seen that there is
a significant overlap of the features constituent of the document vectors in the three
categories. Thus it is clear that the relevant features for determining a category of an
input vector are a complex combination of inputs.
4.3.2 Clustering Run
The clustering run consists of the system being executed in a sequence of ‘wake’ and
‘sleep’ cycles. In the run, the clustering system was presented with the prepared input
vectors from the six colour categories. During a wake cycle, 96 input vectors were
presented, representing 16 objects from each colour. The input vectors were not
repeated and a total of 3600 unique input vectors were presented to the system during
the experiment. To facilitate a comparison analysis using standard ‘precision’ and
‘recall’ measures (definitions are given in Section 4.3.3.1), the input set was presented
to the system in two batches. The first 2400 input vectors were regarded as the
training set and the remaining 1200 input vectors were regarded as the testing set.
This is a useful separation especially when the system is compared to other systems.
63
The system ran for a total of 24 wake periods and 24 sleep periods with the training
set.
4.3.3 Results and Discussion
The clustering system organized the input space into a hierarchy of repetitions
including devices, layers of devices and columns of layers. The system became stable
after creating 7 columns (Table 4-1). One corresponding column has been created for
each of the colours except for BR. Two columns were created for BR. This situation
occurs due to the variations identified within the same group initially. As the system
proceeds with learning, if there is no considerable variation within the group, those
different columns may grow to be similar.
4.3.3.1 Clustering Effectiveness
Effectiveness of the system for classification can be determined with the standard
recall and precision measures for each column.
Precision for each column is calculated as:
n the columged by acknowledectors ber of vTotal num
mn the coludged by acknowletlyors correcolour vectber of cTotal num
=Precision
Recall for each column is calculated as:
columnup of the major groing to the as belongclassifiedors preer of vectTotal numb
lumned by a coacknowledg correctlyur vectorser of coloTotal numb
−
= Recall
Table 4-1 shows the categories discovered and the precision and recall for each
column. The system is able to recognize the input from different colour categories
with an overall 100% precision. A small number of inputs was unacknowledged by

64
the system as the recall is less than 100%.
Precision as a % Recall as a % Column No.
Major categories discovered Training
set Test set Training
set Test set
1 BL 100 100 97.5 95.5 2 CL 100 100 99.0 99.0 3 GR 100 100 99.7 100 4 RD 100 100 98.7 97.0 5 WH 100 100 97.7 95.0 6 BR 100 100 96.7 97.0 7 BR 100 100 94.7 86.0 Average 100 100 97.7 95.6
Table 4-1 Precision and Recall for each column by the major category identified
4.3.3.2 Clustering Efficiency
Table 4-2 shows the final size of the layers of the columns i.e. the number of regular
section devices created for each layer. The devices in alpha, beta and gamma layers
represent the imprinted patterns in each column. The system started with 40 random
devices in the virgin section of each layer. Virgin devices are converted to regular
devices as and when they are imprinted. Note that each layer comprises of relatively
small numbers of devices compressing the input space into a set of efficient
representative patterns.
Column No
Alpha Layer
Beta Layer
Gamma Layer
1 34 32 17 2 32 31 18 3 26 27 12 4 25 26 10 5 24 25 11 6 23 23 7 7 21 22 3
Table 4-2 Column sizes in regular section devices
As the columns are created in a sequential fashion, in initial runs several inputs
may pass the system unacknowledged as the columns to identify those inputs have not

65
been created at that time. The system ran for approximately 6 minutes prior to
stabilising by creating seven columns and the final set of columns acknowledged 97%
of the inputs. Figure 4-4 illustrates the time taken in seconds to create each column
and the system to be stable.
Figure 4-4 Column creation and stabilization performance
4.4 Conclusion
The prototype constructed for the simulation of the Recommendation Architecture
Model was introduced in this chapter. A model experiment was carried out with
statistically generated input data to evaluate the effectiveness and the efficiency of the
clustering system.
This simulation demonstrates that the clustering system can discriminate
effectively among complex differences in the input space. Since the system has no à
priori guidance as to the nature of the relevant combinations it discovers heuristic
patterns among the repeating data vectors. As discussed these patterns cannot be
determined on the basis of the presence or absence of a few individual characteristics.
As the input vectors were never repeated it could be seen that the system can
successfully determine associative similarities among input vectors.
012345678
0 100 200 300 400 500 600 700 800 900Time (seconds)
No.
of c
olum
ns

66
Chapter 5 Modelling the Input Space of the RA for Pattern Discovery and Classification of Text
5.1 Introduction
A major issue in the automated pattern classifiers is the problem of selecting a useful
subset of features from a large population to represent the existing patterns
adequately. This chapter is focused on selecting a suitable feature selection method
for applying the Recommendation Architecture for text mining and the effect that
various feature selection methods have on effectiveness of pattern classification and
discovery (Ratnayake and Gedeon, 2002a; Ratnayake and Gedeon, 2002b). With a
known classification of sample documents, a priori guidance can be given to the
feature selection process to use the system for pattern classification. If the
classifications of the input space are not known, the system can be used for pattern
discovery within data. When the system is used for classification (i.e. with prior
knowledge of existing the categories), the system performance can be evaluated with
standard criteria. Measurements like precision and recall cannot be used without
knowing the existing number of documents belonging to a specific category. For
unguided pattern discovery of a document corpus (i.e. without prior knowledge of
existing the categories) performance evaluation with such criteria is not possible.
Essentially, if a discovered pattern is new and does not correspond to an existing
category it is difficult to find the actual number of documents that should belong to
that group.
67
This chapter discusses why feature selection is necessary and describes two
methods that have been used with the Recommendation Architecture. Experimental
results are then presented to demonstrate the application of the Recommendation
Architecture for pattern classification and pattern discovery.
5.2 Why is Feature Selection Necessary?
High dimensionality of feature spaces is a key issue in text classification, especially
for machine learning approaches. A large number of features in the population may be
irrelevant or mutually redundant and can be discarded with minimal loss of
discriminatory power.
The choice of features to represent an input space also affects aspects of
pattern classification such as accuracy, required learning time, necessary number of
examples and cost (Yang and Honavar, 1998).
Accuracy - The characteristics or the features of the input space that describe patterns
implicitly define a pattern language. If the language is not expressive enough it may
fail to capture the essence of an existing pattern in the information, which is necessary
for effective classification or discovery. Consequently the amount of information
carried by the features limit the accuracy of the classification function learned
regardless of the learning algorithm.
Required learning time – The features of the input space which describe patterns
implicitly, define the size of the input space. For pattern classification or discovery, a
learning algorithm should explore the entire input space. A large number of irrelevant
features can unnecessarily increase the size of the input space thus increasing required
learning time.

68
Necessary number of examples – A large number of features demands a large number
of examples to train a classification system to function to a desired accuracy.
Cost – Some applications may have costs and risks associated for each of the features
selected. For example in medical diagnosis, a feature set can consists of observable
symptoms along with the results of diagnostic tests. Diagnostic tests will inevitably
incur a cost which will vary depending on the nature of the test. Thus including more
features obtainable from diagnostic test results will make the construction of the data
set more expensive.
Feature selection includes several sub-areas which are open research problems
(Ye and Liu, 2002; Koller and Sahami, 1996). One is the problem of identifying
features related to a class depending on how relevant they are to the class and how
related they are to one another. Determining the optimum number of features that is
large enough to capture target concepts, but also small enough to efficiently
manipulate is another problem. The scope of this thesis with regards to feature
selection is limited to examining available methods in order to choose two that
sufficiently show the difference in behaviour of the RA when those methods are
applied.
5.3 Feature Selection Methods
This section first examines some existing feature selection methods briefly. Then the
two methods that have been used for the demonstrated experiments are investigated in
detail.

69
5.3.1 Types of Feature Selection Methods
The majority of the automatic feature selection methods are based on the construction
of new features (concepts) by combining lower level features or the removal of non-
informative terms according to corpus statistics. These two major types of feature
selection methods are further discussed below.
5.3.1.1 Use of Phrases and Concepts in Feature Selection
Many attempts were made to use phrases for text representation or indexing language,
as correct phrases improve the specificity of the indexing language and consequently
the quality of the text representation. Investigation of phrases in text representation
has been an on going research area for a long time (Salton and Lesk, 1968; Fagan,
1987; Fagan, 1989). Though many experiments have been carried out on using
phrases to improve retrieval effectiveness, the majority of the research has been able
to demonstrate very little improvement (Croft et al., 1991; Lewis, 1992).
In ontology-based text clustering, features are mapped to concepts before
clustering and each document is represented by a vector of concepts. Since all
document sets have more terms than concepts, the sizes of the concept vectors are
smaller. Two different methods to construct domain ontology hierarchical structures
are proposed by Hotho et al. and Wang et al. (Hotho et al., 2001; Wang et al., 2002).
Both teams show that their schemes produce results that are favourably comparable
with many other methods. However, ontology based feature mapping requires a
significant amount of domain knowledge of the underlying data.
5.3.1.2 Removing Non-informative Terms
Removing non-informative terms relies on the basic assumption that they are not
informative for classification and are not influential in overall performance.

70
Document Frequency Thresholding, Information Gain, Mutual Information, Chi-
square and Term Strength are some of the most frequently used statistical methods for
removing non-informative terms. These methods use a term-goodness criterion in
thresholding to discard terms to reduce the term population of the input space. Yang
and Pedersen have assessed the effectiveness of these selection methods with two m-
ary classifiers called k-Nearest Neighbour (kNN) and Linear Least Squares Fit
(LLSF) (Yang and Pedersen, 1997). The use of Document Frequency Thresholding,
Information Gain and Chi-square methods for feature selection has shown similar
effect on the performance of classifiers. Yang and Pedersen have shown the ability to
discard 90% or more of the rare words with either improvement or no loss in
classification accuracy. The Term Strength method has shown comparable
performance with up to 50% term removal in kNN and about 60% term removal in
LLSF. The mutual Information method has not shown comparable performance to any
of the other methods. By analysing 12 publications that report on use of different
methods for term reduction, Sebastiani shows that the comparative evaluations
reported by Yang and Pedersen are conclusive in this respect (Sebastiani, 1999).
5.3.2 The Feature Selection Methods Used for the Experiments
This chapter examines two feature selection algorithms to define a suitable input
feature space for Recommendation Architecture model for text mining experiments.
The first method, Document Frequency Thresholding is the simplest technique for
input vector dimensionality reduction. Despite being a simple algorithm, the
Document Frequency Thresholding method gives comparable performance to more
statistically complicated methods. This method has been successfully used in many
Self-Organizing Maps based experiments for text mining (Kohonen et al., 1996;
Dittenbach et al., 2002). The aim of the first experiment set reported here is to use an

71
input feature space with minimum a priori guidance. The Document Frequency
Thresholding method does not rely on information of the existing categories as the
features are selected based only on their frequency of occurrence in a sample of the
document corpus. When the input space has no information on the existing cognitive
categories, the clustering system of the RA produces heuristic categories.
As the second feature selection method an existing algorithm called the Two-
step Feature selection method (Stricker et al., 1999) is extended in order to select a set
of terms that represent each category in the input space. The Two-step Feature
selection method uses the information of the existing categories in selecting the
features. In this method the most discriminating terms for each category are selected
using the corpus frequency to discard the common words without using stop-words.
The two-step feature selection algorithm has been applied to TREC (TREC, 2003)
data collections with a neural network based classifier (Stricker et al., 1999).
Stemming algorithms remove any attached suffixes or prefixes from words
reducing them to their word roots. They are widely used for improving recall by
generalizing over morphological variants. However research carried out to determine
the effectiveness of stemming algorithms have shown mixed results (Harman, 1991).
It is shown that word forms merged by stemming are useful in certain domain
discriminations (Riloff, 1995). Word stemming is not used in the experiments
demonstrated here. From the empirical studies carried out with stemming, the
experiment described in Appendix B shows only a minor favourable affect of word
stemming upon the system performance.
72
Two real-world data sets were used for the experiments; one was a set of
Internet newsgroup postings and the other a TREC1 collection (TREC CD 4 and 5) of
news articles.
5.3.2.1 Document Frequency Thresholding
The document Frequency Thresholding method is based on two assumptions. Firstly,
from a sample word frequency profile of a document corpus, the words with high
frequencies are too common across all the categories. Secondly, the words with low
frequencies are too rare to represent any category. Using this method, a feature set is
selected by removing the highest and lowest frequency words from a word frequency
profile at defined threshold values. The threshold is defined by analyzing the
distribution of the word frequency and sometimes the number of unique documents
that contain the words. In addition a defined list of common stop words that does not
carry contextual information (e.g. pronouns, conjunctions, etc.) is typically removed
from the word list. The applicability of the Recommendation Architecture for pattern
discovery with this method is demonstrated in section 5.4 after discussing the Two-
step feature selection method.
5.3.2.2 Modified Two-step Feature Selection Algorithm
The Two-step feature selection method by Stricker et al. uses information about the
document categories to select features that represent each group (Stricker et al., 1999).
A sample training set of documents with known categories is used to provide a priori
information to the selection process. This method has been designed for feature
selection to be applied in a filtering task where filtering is done one category at a time.
Several modifications are proposed in this thesis to the Two-step feature selection
method for classification tasks with the Recommendation Architecture model. The
1 TREC (Text REtrieval Conference) is a series of annual competitions and conferences aimed at encouraging research in information retrieval and filtering.

73
following is the modified algorithm to select a 1000 term feature set with 100
representative features from each category in the corpus.
Modified Two-Step Feature Selection Algorithm
Step 1.1 Calculate the corpus frequency for all the words in the training set.
Step 1.2 Calculate the term frequency in all the documents for each category.
Step 1.3 Calculate the ratio of term frequency by the corpus frequency for each word in each document in a category.
Step 1.4 For each document select the words with a frequency ratio that was above the given threshold and make a word list. Merge all the
selected word lists from the documents for each category.
Step 1.5 Calculate the frequency for the words in the merged lists for each category.
Step 1.6 From the most frequently occurring words for each category select the top 300.
(A limited number of words (300) were selected from each category to
avoid discrimination against categories with relatively smaller number
of words.)
This process 1.2 – 1.6 was repeated for all the categories.
Step 2.1 From the selected words from each category remove the duplicates across the categories.
Step 2.2 From the remaining set, the top 100 words from each category were selected to make the feature set. These 100 words frequently
occur in one category and rarely occur in others.
As Salton argues, when the feature set is narrow and specific, precision is
favoured at the expense of recall whereas when the feature set is broad and non-
specific, recall is favoured at the expense of precision (Salton, 1989). Thus it is
difficult to select a balanced set of features.
Up to Step 1.3 the original two-step feature selection method was followed. It

74
was noted that if word-frequencies for each document are organized in the descending
order of the ratio and only the words in the top half of each set of words were selected
as in the original algorithm, a few categories were left with very few remaining
words. In the modified threshold based selection scheme (Step 1.4), words are
selected if their frequency ratio was above the given threshold even if they are not in
the top half of frequencies for each document. From Step 1.4 most words common to
the whole corpus get automatically discarded. With the modified Step 1.6 the rare
words also get discarded. As the original Two-step algorithm was used for feature
selection for filtering tasks, the number of features selected to represent a category
can vary significantly without impacting the filtering tasks of other categories. The
original algorithm uses the Gram-Schmidt orthogonalization method to select sets of
orthogonal features for each category as the second step. However, when a feature
scheme is used to select feature for a classification task, an unequal distribution of the
number of representative features for each category has a significant impact on the
classification. Therefore the proposed modifications (Steps 2.1 and 2.2) also allocates
the feature space equally among the set of categories. The application of this method
to the Recommendation Architecture is demonstrated in Section 5.5.
5.4 Unguided Pattern Discovery
This section demonstrates the experiments carried out with the TREC data set and the
newsgroup postings. The feature selection for the input space is done with the
Document Frequency Thresholding method and the input space has no awareness
about the existing categories.

75
5.4.1 Experiment 1 - TREC data with feature selection using the Document Frequency Thresholding method
The data set consists of a set of 20,000 randomly selected news articles from the
Foreign Broadcasting Services (FBIS), Financial Times and the LA Times, from the
TREC CD-4 and CD-5 corpora. Though the articles are judged for relevance to 50
topics in the TREC relevance judgements, only 10 topics have a significant number of
documents with more than 100 articles each. Therefore these 10 categories with 2500
documents in total were selected for the experiments. The documents were selected
from ten topic categories of: 401, 412, 415, 422, 424, 425, 426, 434, 436 and 450,
which are nominal codes representing the different topics. These topics as given in the
TREC relevance judgment information are: 401 – foreign minorities in Germany, 412
– airport security, 415 – drugs and the golden triangle, 422 – art, stolen, forged, 424 –
suicides, 425 – counterfeiting money, 426 – dogs, law enforcement, 434 – economy in
Estonia, 436 – railway accidents, 450 – King Hussein and peace.
5.4.1.1 Formation of the Input Space
A set of 50 documents from each category was kept aside as the test set and the rest of
the documents were used as the sample set for the feature selection process. No
stemming was done and a stop list was used to remove the document tags in the
TREC collection. Then a word-frequency profile was generated by counting all the
instances of all the words in the corpus and the number of documents in which each
word appears. The most common words defined here as the words which appear in
more than 230 documents (the average number of documents in each category), the
most rare words defined here as the words which appear in less than 20 documents,
and the least common words with frequency less than 20, were discarded. From the
remaining set, common words remaining were manually removed to get a resulting set
of 2600 terms.

76
The relationship between the size of input vectors in terms of features and the
frequency of occurrence of such vectors (in the training set) is summarised in Figure
5-1. As it can be seen from the feature density, most of the input vectors are sparse
and have less than 100 features. As 2600 features were selected from 10 topics the
average feature density for documents vectors should be closer to 200. There are also
a very few that have more than 500 features.
Figure 5-1 Feature density of input vectors in relation to frequency of occurrence (TREC data with Frequency Thresholding method)
The training set comprises of a set of 2000 document vectors, which have more
than 5 entries and consists of 200 vectors from each topic. Vectors from topics that
have less than 200 vectors were duplicated once to get the minimum of 200 vectors
for each topic. The test set comprises 456 documents, which have more than 5 entries,
set aside from the 500 documents without being used for feature selection or for
training. Since the minimum threshold of an alpha node is set to five (5), document
vectors having less than five entries make no contribution to firing a single device
even if they are presented as inputs.
0
5
10
15
20
0 100 200 300 400 500 600Vector sizes in terms of feature density
Freq
uenc
y of
occ
urre
nce

77
5.4.1.2 Results and Discussion
The input vectors were presented to the system in a series of runs with alternating
‘wake’ and ‘sleep’ periods. Within each ‘wake’ period 50 vectors were presented,
representing 5 documents from each topic. The system ran for a total of 100 ‘wake’
periods and ‘sleep’ periods before stabilizing on the training data set. The number of
documents acknowledged for 1000 documents from the training set and 456
documents from the test set are shown in Table 5-1.
Number of Documents acknowledged
Column No.
Training Set Test Set 1 144 54 2 128 67 3 144 65 4 122 68 5 131 62 6 101 52 7 101 47 8 92 55
Table 5-1 Total number of documents acknowledged from each column
With the column-labelling feature (which will be introduced in chapter 6),
Table 5-2 was generated using the most frequently accepted features for each column
during the training period, to label the columns. These descriptive words display the
properties of each column and also clarify why certain documents belonging to
different pre-defined categories are grouped together. The corresponding TREC topics
shown are the topics with a high percentage of documents acknowledged by the
particular column, and this can be validated by examining the words describing the
columns.
The column labels of columns 2, 3, 4, 5, 6, and 7 show a clear relationship with

78
the TREC topics that give a high percentage of the acknowledged documents for the
particular columns. Though words describing columns 1 and 8 have some
commonality, words describing column 1 mainly give the idea of accidents and
economic situations whereas words describing column 8 give the idea of court cases
and criminal investigations.
Column no.
Corresponding TREC topics and the % of documents acknowledged
Automatically extracted words for column labelling
1 No significant major categories
companies, business, investigation, cause, death, legal, market, kingdom, company, price, failed, court, parties, accident, died, military
2 401 – 43.8% (foreign minorities in Germany) 424 – 11.7% (suicides) 425 – 13.3% (counterfeiting money)
attacks, rightwing, increasing, foreigners, compared, asylum-seekers, eastern, killed, interior, living, estimated, rise, danger, investigation, Bonn, cause
3 415 – 56.3% (drugs and the golden triangle) 425 – 18.8% (counterfeiting money)
narcotics, heroin, Burma, drugs, Thailand, opium, areas, cases, trafficking, control, criminal, seized, province, Asia, organizations, china
4 450 – 59.8% (King Hussein and peace) 425 – 11.5% (counterfeiting money)
Israel, Washington, Jordan’s, Amman, negotiations, Palestinian, Jordanian, Husayn, participation, deal, terms, Palestinians, Israeli, Arab, agenda, signing
5 434 – 33.6% economy in Estonia 425 – 17.6% (counterfeiting money)
development, Eurasia, rate, Estonian, Estonia’s, Russian, rapid, supply, market, issued, effect, finance, deal, planning, power, raised
6 450 – 86.1% (King Hussein and peace)
Amman, Husayn, majesty, Jordan’s, Arabic, Israel, Palestinian, network, developments, negotiations, bilateral, PLO, Washington, role, Al'aqabah, territories
7 422 – 54.5% (art, stolen, forged) 425 – 15.8% (counterfeiting money)
art, stolen, dollars, paintings, apartment, investigation, theft, dead, calendar, bodies, museum, recovered, road, arrest, control, family
8 426 – 33.7% (dogs, law enforcement) 425 – 19.6% (counterfeiting money) 424 – 18.5% (suicides)
medical, car, suspect, arrested, allegedly, evidence, knew, declined, investigation, men, court, shot, scene, suspicion, broken
Table 5-2 Some frequent words in the documents accepted by each column and the TREC topics that can correspond to the columns
Column 1 has emerged from articles relating to all topics. As topics 424 -

79
suicides and 425 – counterfeiting money respond to most of the columns they seem to
share a considerable number of features with most of the other topics.
As shown from the experimental results, the clustering system was able to
discover some patterns directly matching to the previous TREC patterns without any
guidance or a priori information about the categories. It is also known that a few
documents in the data set were categorized as relevant to more than one topic by the
TREC classification, which means some documents in different topics do have
similarities. It may be due to this reason that some topics like 424 and 425 tend to
appear together most of the time. Only topic 412 – airport security failed to make an
impression, probably because the frequency of occurrence of words describing 412
were too low to be selected considering that 412 has only 100 documents to be used
for the training set - one of the lowest numbers.
5.4.2 Experiment 2 - News Group data with feature selection using the Document Frequency Thresholding method
This set of experiments was carried out to see how the Recommendation Architecture
model can be used with no a priori guidance for pattern discovery in a very noisy data
set (Ratnayake and Gedeon, 2002a). The variation and the poor quality of the
newsgroup postings set pose an interesting challenge to any intelligent classification
system. Newsgroups also provide a large collection of pre-classified documents. A
number of other experiments also have been carried out with similar sets of data with
self-organizing maps (Kohonen et al., 2000; Lagus, 1998; Wood and Gedeon, 2001).
5.4.2.1 Formation of the Input space
A set of 40,000 documents were selected from ten newsgroups: Babylon5 (BL5),
books (BKS), computer (COM), movies (MOV), Linux (LNX), Windows2000

80
(WIN), Farscape (FSP), Star Trek (TRK), humour (HMR) and amateur astronomy
(AST). These newsgroups were selected so that there was a probability of having
some similarity in the words likely to be used. For example, ‘stars’ will be mentioned
in both astronomy and science fiction newsgroups. The news group postings contain
varied content from short remarks, jokes, questions, elaborate discussions, program
code, and ASCII images to longwinded flame wars between individuals. The actual
text is often carelessly written, contains spelling errors and of poor style.
The documents were pre-processed to remove advertising documents [spam],
multiple inclusions and NTTP header information. A stop list of words such as
prepositions, conjunctions, pronouns etc. was removed from the documents. A word-
frequency profile was generated by counting all the instances of all the words in the
corpus with regard to the number of documents in which each word appears. Due to
the noisy nature of the data set and poor results, several sets of features were chosen
for experiments, which give different views of the same data.
The first three feature sets were generated with 10,000 documents in the
training set by counting the frequency of occurrence of words, pairs of words and a
combination of both. Other than depending on the frequency of occurrence, the words
were not picked manually allowing any mutually redundant words. For the first
feature set (set 1), the set of the most frequent 1,000 words were selected as the
representative features. In fact the frequency of occurrence of the 1,000th word was
157 which showed that taking more words below 1,000th position was not likely to
contribute much in representing the data set. Another feature set (set 2) was created by
taking the most frequently occurring word pairs in sentences. The word pair list was

81
produced by taking the Cartesian product of the most frequently occurring 500 words.
Then a word pair frequency profile was generated by counting all the instances of
word pairs within sentences in each document. Again, the most frequent 1,000 word
pairs were selected as the representative feature set. The frequency of occurrence of
the 1,000th pair was 38. The last feature set (set 3) was generated by combining the
sets 1 and 2 to give a feature set comprising of 2,000 features.
For the next two feature sets a word-frequency profile was generated by
counting all the instances of all the words in the corpus with regard to the number of
documents in which each word appears. Characteristics sets were selected in such a
way that from the sorted word-frequency profile the top 1% of the words, and from
the bottom the words which have a document count of less than 50 were discarded.
From the remaining set, two characteristic sets of 1,000 (set 4) and 1,600 (set 5) were
chosen after manually removing common words which were not likely to contribute
much in representing the data set. The input data vectors were created by parsing each
document to produce a corresponding binary vector denoting the presence or absence
of a characteristic from the feature sets.
5.4.2.2 Results and Discussion – for feature set 5
All feature sets obtained using the frequency thresholding method display a similarity
in the frequency of input vectors when considered in terms of feature density. As the
discussion example, the following analysis describes the results of experiment using
the feature set 5 (with 1,600 features). Feature densities of input vectors vs. frequency
of occurrence for the set 5 are illustrated in Figure 5-2. As shown in the figure, the
majority of the input vectors have less than 50 features.

82
0100200300400500600700800900
1000
0 100 200 300 400
No of features present in an input vector
Freq
uenc
y of
occ
urre
nce
Figure 5-2 Feature density of input vectors in relation to frequency of occurrence (Newsgroup data with Frequency Thresholding method)
During the clustering run each ‘wake’ period was presented with 100 vectors
representing 10 documents from each topic. The analysis of the resulting columns in
several runs show that though the system becomes stable after creating 9-10 columns,
there is very little distinction between most of the columns.
Initially columns get created with substantial differences but as the time goes
by, the uniqueness of most of the columns are lost as the columns begin to
acknowledge document vectors from various categories. For example, Table 5-3
(generated from the post-processing system which is described in chapter 6) illustrates
a part of the results for a run after 260 ‘wake’ periods and ‘sleep’ periods. Here a file
name with the category it belongs is shown with the number of columns it is
acknowledged by. For example, document vector 2404_Com is acknowledged by
column 2. As seen from Table 5-3 there are no specific columns that acknowledge
document vector from only one or two specific categories.
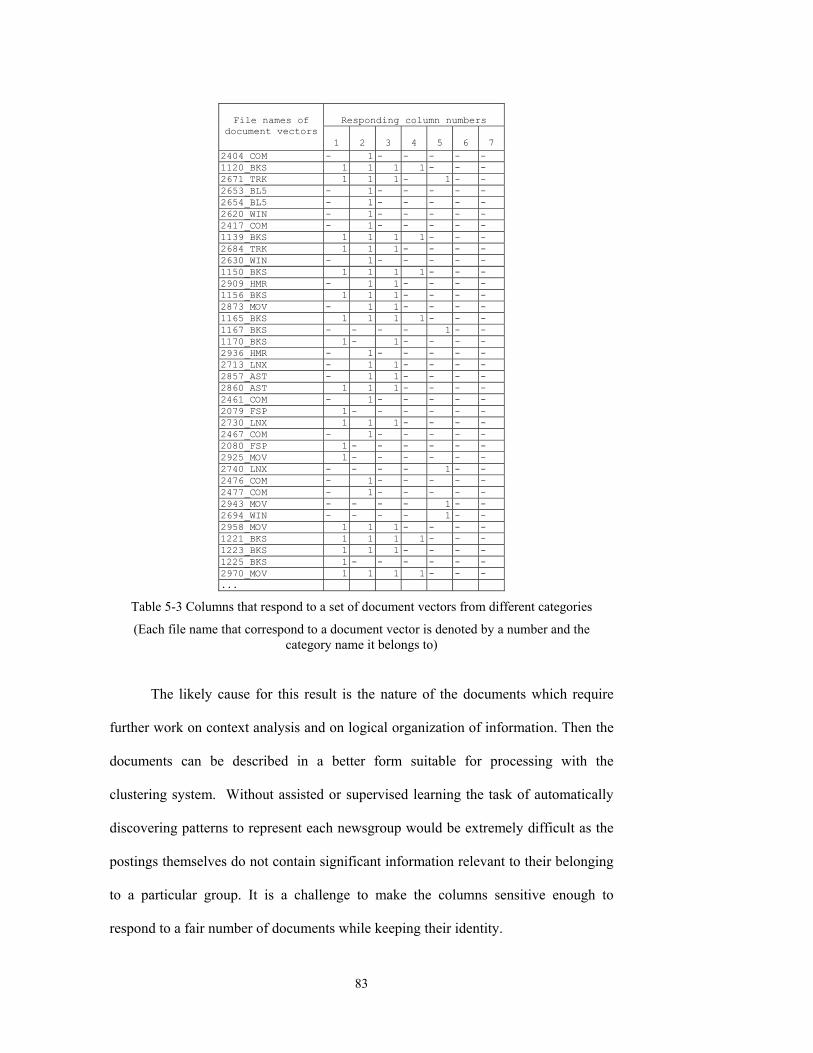
83
Responding column numbers
File names of
document vectors
1
2
3
4
5
6
7
2404_COM - 1 - - - - - 1120_BKS 1 1 1 1 - - - 2671_TRK 1 1 1 - 1 - - 2653_BL5 - 1 - - - - - 2654_BL5 - 1 - - - - - 2620_WIN - 1 - - - - - 2417_COM - 1 - - - - - 1139_BKS 1 1 1 1 - - - 2684_TRK 1 1 1 - - - - 2630_WIN - 1 - - - - - 1150_BKS 1 1 1 1 - - - 2909_HMR - 1 1 - - - - 1156_BKS 1 1 1 - - - - 2873_MOV - 1 1 - - - - 1165_BKS 1 1 1 1 - - - 1167_BKS - - - - 1 - - 1170_BKS 1 - 1 - - - - 2936_HMR - 1 - - - - - 2713_LNX - 1 1 - - - - 2857_AST - 1 1 - - - - 2860_AST 1 1 1 - - - - 2461_COM - 1 - - - - - 2079_FSP 1 - - - - - - 2730_LNX 1 1 1 - - - - 2467_COM - 1 - - - - - 2080_FSP 1 - - - - - - 2925_MOV 1 - - - - - - 2740_LNX - - - - 1 - - 2476_COM - 1 - - - - - 2477_COM - 1 - - - - - 2943_MOV - - - - 1 - - 2694_WIN - - - - 1 - - 2958_MOV 1 1 1 - - - - 1221_BKS 1 1 1 1 - - - 1223_BKS 1 1 1 - - - - 1225_BKS 1 - - - - - - 2970_MOV 1 1 1 1 - - - ...
Table 5-3 Columns that respond to a set of document vectors from different categories
(Each file name that correspond to a document vector is denoted by a number and the category name it belongs to)
The likely cause for this result is the nature of the documents which require
further work on context analysis and on logical organization of information. Then the
documents can be described in a better form suitable for processing with the
clustering system. Without assisted or supervised learning the task of automatically
discovering patterns to represent each newsgroup would be extremely difficult as the
postings themselves do not contain significant information relevant to their belonging
to a particular group. It is a challenge to make the columns sensitive enough to
respond to a fair number of documents while keeping their identity.

84
The experimental results from none of the chosen characteristic sets give
significant improvement over the others. Experimental results and discussions for the
application of other characteristics sets for the Recommendation Architecture are
given in Appendix A.
5.4.3 Summary
The expectation of these two experiments was not a high degree of accuracy in
automatic identification of documents into its original categories. Rather, the
objective of the experiments was to demonstrate the synthesis of patterns representing
some commonality among documents with minimum or no guidance to the input
space about existing categories. To this end, analysis of documents in the TREC data
set that were recognized by each column reveals interesting patterns whereas the
results of the newsgroup data set is difficult to interpret in a meaningful way.
It can be seen that with a data set like TREC, which has less noise, more
structure, and the average document is of substantial length (i.e. a document is at least
a paragraph of 10 sentences) a simple technique like document frequency thresholding
can be used to obtain favourable results. Conversely with a data set like newsgroups
which is very noisy and the length of an average document varies between two
sentences to a few pages, a better technique is necessary to give some guidance to the
input space about the existing patterns.
In the next section, guided pattern discovery with the Two-step Feature
Selection method is investigated.

85
5.5 Guided Pattern Discovery
To select discriminatory features of the available categories, a priori guidance on the
available categories can be given to the feature selection process. To demonstrate the
effect of guided feature selection, the same two data sets used for the unguided feature
selection are used here. The same ten topics of the news group data set and the TREC
collections are used with the extended Two-Step feature selection method. As the
document sets carry information about the membership of documents in all categories
and the selection process is biased to identifying these categories, standard measures
of precision and recall can be used to evaluate the performance of the clustering.
Following are the formulae used for precision and recall calculation.
Precision for each column is calculated as:
n the columged by acknowledocuments ber of dTotal num
mn the coludged by acknowlecorrectlyocuments ber of dTotal num
=Precision Equation 1
Recall for each column is calculated as:
he columntopic of tthe major ing to as belongclassifiedments preer of docuTotal numb
lumned by a coacknowledgectlyments correr of docuTotal numb
Recall−
= Equation 2
Calculation of recall for a column is meaningful only when a significant
percentage of documents belonging to one topic produce output from one column.
Where more than one topic produce output from one column it is not possible to
calculate how many documents contain the particular pattern which causes the column
to be created.

86
5.5.1 Experiment 1 - TREC data with feature selection using the modified Two-step algorithm
This experiment was carried out with a training set comprising 1,500 document
vectors consisting of 150 vectors from each topic. Vectors from topics that had less
than 150 vectors were duplicated once to get the minimum of 150 vectors for each
topic. The test set comprises of a new set of 1,000 (500 unique vectors duplicated
once to make 1,000) document vectors, which are not used for training or feature
selection. Features representing the topics in the document corpus were chosen
applying the two-step feature selection described in section 5.3.1. A feature set of
1,250 words was selected using 125 words from each topic to represent the 10 topics.
Figure 5-3 Feature density of input vectors in relation to frequency of occurrence (TREC data with modified Two-step algorithm)
Figure 5-3 illustrate the feature density of the input data vectors after selected
features were mapped to the training set. Majority of input vectors have less than 50
features which makes the input set very sparse. Distributions of the features in the
input for each topic are illustrated in Figure 5-4. It is noticeable from the Figure 5-4
that some features having high frequency of occurrence in one category have a lower
frequency in other categories with the full feature set having significant overlap.
0
20
40
60
80
100
120
0 50 100 150 200 250 300 350 400
No of features present in an input vector
Freq
uenc
y of
occ
urre
nce

87
Figure 5-4 Features that were selected for each topic and their frequency of occurrence (TREC data)
There are a few features that have a high frequency of occurrence in several
categories. It means that a category cannot be determined on the basis of presence or
401
020406080
100120140
1 101 201 301 401 501 601 701 801 901 1001 1101 1201
Features
Freq
uenc
y of
occ
uren
ce
450
020406080
100120140
1 101 201 301 401 501 601 701 801 901 1001 1101 1201
Features
Freq
uenc
y of
occ
uren
ce
436
020406080
100120140
1 101 201 301 401 501 601 701 801 901 1001 1101 1201
Features
Freq
uenc
y of
occ
uren
ce434
020406080
100120140
1 101 201 301 401 501 601 701 801 901 1001 1101 1201
Features
Freq
uenc
y of
occ
uren
ce424
020406080
100120140
1 101 201 301 401 501 601 701 801 901 1001 1101 1201
Features
Freq
uenc
y of
occ
uren
ce
426
020406080
100120140
1 101 201 301 401 501 601 701 801 901 1001 1101 1201
Features
Freq
uenc
y of
occ
uren
ce
422
020406080
100120140
1 101 201 301 401 501 601 701 801 901 1001 1101 1201
Features
Freq
uenc
y of
occ
uren
ce
425
020406080
100120140
1 101 201 301 401 501 601 701 801 901 1001 1101 1201
Features
Freq
uenc
y of
occ
uren
ce
415
020406080
100120140
1 101 201 301 401 501 601 701 801 901 1001 1101 1201
Features
Freq
uenc
y of
occ
uren
ce
412
020406080
100120140
1 101 201 301 401 501 601 701 801 901 1001 1101 1201
Features
Freq
uenc
y of
occ
uren
ce

88
absence of a few individual characteristics.
5.5.1.1 Results and Discussion
The document vectors were presented to the system in a series of runs with alternating
‘wake’ and ‘sleep’ periods. Within each ‘wake’ period 50 vectors were presented
being 5 documents from each topic. The system ran for a total of 100 ‘wake’ periods
and ‘sleep’ periods before stabilizing on the training data set.
The system created eight stable columns. From the eight columns, six
(columns 1, 2, 3, 5, 6, 7) produced output mainly from one topic and two columns
(columns 4 and 8) produced output from multiple topics (Table 5-4). The documents
used are news articles reporting various incidents which are judged as relevant to a
given topic. It can be seen that several different topics contain articles that are related,
and those articles from different topics get grouped together. For example, topics 424
(suicides), 425 (counterfeiting money) and 426 (dogs, law enforcement) produce the
majority of the output from column 4. It can be noted from Figure 5-4 that the number
of documents that contain features for topic 426 is very low compared to others and
quite a number of features are common for topics 424 and 425. This may be the cause
for appearance of 426 as a part of a group with 424 and 425. In the test run, topic 425
(counterfeiting money) also gave considerable output from column 1 which makes the
percentage output from topic 412 fairly low. From Figure 5-4 it can be seen that topic
426 also has a fair number of documents which contain features selected from 412
which cause some documents from topic 426 to be acknowledged by column 1.

89
Table 5-4 Precision and Recall for each column by the major document category identified (Experiment 1-TREC data)
Topic 434 (economy in Estonia) failed to form a stable column. Column 9,
which was created several times with topic 434, was automatically discarded as only a
very small number of documents were acknowledged by it. From the precision for
columns it can be seen that 6 topics and 2 patterns were identified with considerable
accuracy. Precision and recall can be further increased with the extensions to the
clustering system proposed in the next chapter.
5.5.2 Experiment 2 - Newsgroup data with feature selection using the modified Two-step algorithm
This experiment was carried out to classify newsgroup postings belonging to the 10
different categories described in Section 5.4.2.1. A feature set of 1,000 words was
selected using 100 words from each topic to represent the 10 topics applying the
modified Two-step feature selection method described in Section 5.3.2.2.
The training data set of 30,000 newsgroup postings was then mapped to 1000-
word document vectors. Similarly, the test set of 10,000 newsgroup postings were
also mapped to the 1000-word document vectors. These document vectors use the
Column No.
Major document
topics discovered
Precision as a % Recall as a %
Training set
Test set Training set
Test set
1 412 67.0 42.3 64.2 22.0 2 401 71.1 65.9 72.3 54.0 3 415 84.7 73.0 87.4 70.0 4 424, 425, 426 84.4 80.1 - - 5 422 75.0 46.2 64.8 24.0 6 450 75.8 70.0 89.0 70.0 7 436 72.6 53.6 58.0 32.6 8 424, 425 75.6 64.0 - -
Average
75.8
61.9
72.6
45.4

90
frequency information of the features (which are normalized to make the maximum
frequency 5). (Use of frequency information of the features and normalization are
addressed in detail in the next chapter)
0500
1000150020002500300035004000
0 10 20 30 40 50 60 70 80 90 100
No. of features present in an input vector
Freq
uenc
y of
occ
urre
nce
Figure 5-5 Feature density of input vectors in relation to frequency of occurrence (Newsgroup data with modified Two-step algorithm)
Figure 5-5 shows the feature density of the input vectors and frequency of
occurrence of those input vectors. High frequency of some vector sizes as apparent
from the figure has come due to normalizing. (Most vector sizes end up in multiples
of 5.) It can be seen from the Figure 5-5 that the majority of the vectors have less than
30 features though 100 are selected from each group. An equal number of documents
were selected from each group making the total training set 23,140 documents.
The relationships between the ‘features that were selected for each topic’ and
their ‘frequency of occurrence in the input vectors after they were mapped to the
training data set’ are illustrated in Figure 5-6.
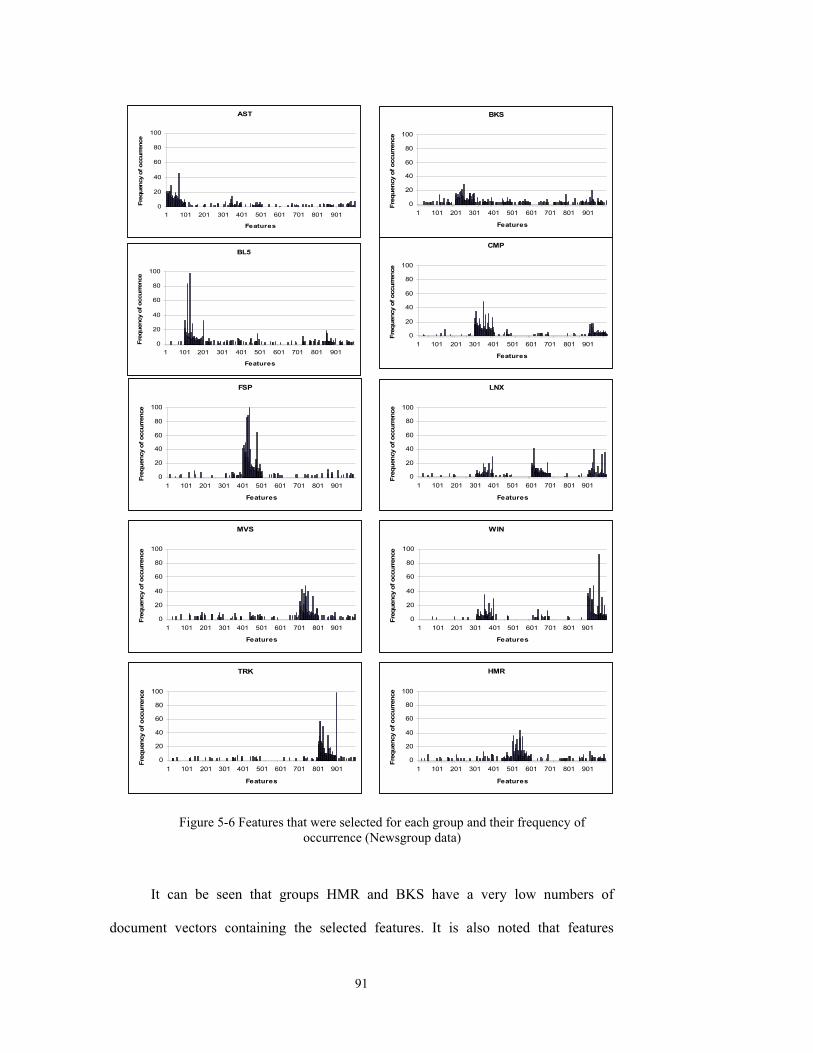
91
Figure 5-6 Features that were selected for each group and their frequency of occurrence (Newsgroup data)
It can be seen that groups HMR and BKS have a very low numbers of
document vectors containing the selected features. It is also noted that features
AST
0
20
40
60
80
100
1 101 201 301 401 501 601 701 801 901
Features
Freq
uenc
y of
occ
urre
nce
BL5
0
20
40
60
80
100
1 101 201 301 401 501 601 701 801 901
Features
Freq
uenc
y of
occ
urre
nce
FSP
0
20
40
60
80
100
1 101 201 301 401 501 601 701 801 901
Features
Freq
uenc
y of
occ
urre
nce
MVS
0
20
40
60
80
100
1 101 201 301 401 501 601 701 801 901
Features
Freq
uenc
y of
occ
urre
nce
TRK
0
20
40
60
80
100
1 101 201 301 401 501 601 701 801 901
Features
Freq
uenc
y of
occ
urre
nce
BKS
0
20
40
60
80
100
1 101 201 301 401 501 601 701 801 901
Features
Freq
uenc
y of
occ
urre
nce
CMP
0
20
40
60
80
100
1 101 201 301 401 501 601 701 801 901
Features
Freq
uenc
y of
occ
urre
nce
LNX
0
20
40
60
80
100
1 101 201 301 401 501 601 701 801 901
Features
Freq
uenc
y of
occ
urre
nce
WIN
0
20
40
60
80
100
1 101 201 301 401 501 601 701 801 901
Features
Freq
uenc
y of
occ
urre
nce
HMR
0
20
40
60
80
100
1 101 201 301 401 501 601 701 801 901
Features
Freq
uenc
y of
occ
urre
nce

92
selected for LNX appear very often in CMP and WIN groups. Generally all groups
contain features that appear in other groups to different extents.
5.5.2.1 Results and Discussion
The following results were obtained after repeated experiments with various
parameter adjustments for this data set. The input vectors were presented to the
system in a series of runs with alternating ‘wake’ and ‘sleep’ periods. Within each
‘wake’ period 100 vectors were presented representing 10 documents from each topic.
The system ran for a total of 639 ‘wake’ periods and ‘sleep’ periods before stabilizing
with the training data set. The results from a randomly selected 3,000 input vectors
consisting of all groups (300 from each) are used in the calculation of precision and
recall for the training set in Table 5-5. The test set comprised of 5,000 document
vectors.
Ten columns were created during this run. Seven major groups and three
patterns were discovered. Columns 1, 2, 4, 8 and 10 produced output mainly from the
newsgroups FSP (Farscape), TRK (Star Trek), BL5 (Babylon 5), BKS (books) and
AST (astronomy). MOV (movies) group was acknowledged by columns 3 and 7
probably due to the variations within the category. Documents acknowledged by more
than one column with some other group indicate the presence of multiple patterns in
documents. Especially the presence of TRK (Start Trek) can be seen in column 9 with
MOV (movies) and a very strong presence is indicated in column 4 with BL5
(Babylon 5). In the test set TRK gives 31.4% precision from Column 4 causing the
precision of BL5 to fall. Column 3 produced output from the postings of CMP
(computer), WIN (Windows 2000) and LNX (Linux) identifying some computer
related similarities in the postings. As can be seen from Figure 5-6 it is clear that the

93
terms selected for group LNX show strong presence in CMP and WIN.
Column No.
Major document grouping discovered
Precision as a % Recall as a %
Training set
Test set
Training set
Test set
1 FSP 93.4 92.5 95.0 66.8 2 TRK 88.0 84.4 58.7 55.2 3 MOV 93.0 37.5 35.7 03.0 4 BL5 68.8 62.0 54.3 43.4 5 BL5, TRK 94.7 95.2 - - 6 Cmp, Win, Lnx 94.0 95.9 - - 7 MOV 75.8 20.9 08.3 02.0 8 BKS 100 0 05.7 0 9 MOV, TRK 86.3 36.2 - - 10 AST 100 96.6 23.3 22.4
Average 89.4
62.1
40.1
27.5
Table 5-5 Precision and Recall for each column by the major document category identified (Experiment 2-Newsgroup data)
Though precision for the training set is quite good, recall for most groups are
very low, which emphasises the fact that those columns are responding to different
variations within a group. Average precision for columns in the test set is reduced by
BKS (books) group failing to appear from column 8 and the low precision in columns
where MOV (movies) appears. It can be concluded that the large variations in the data
categories tend to make several fine grain columns for different variations in the
categories. Therefore, with this data it is hard to expect a high recall from a few large
columns. HMR group was created several times with column 11 but was
automatically discarded due to very low response probably caused by the very low
number of distinct features and the low frequency of occurrence of these features (as
shown by Figure 5-6).

94
5.5.3 Summary
Experimental results suggest that a priori guidance on the available categories results
in a feature set which discriminates effectively between categories. This in turn results
in identification of categories, which are similar to known categories. The system can
also discover additional patterns among the categories, which represent some
commonality among the documents, which may be pre-classified to different
categories.
As the modified two-step feature selection algorithm tries to select a unique set
of terms for a topic, the frequency of the terms selected are generally low if a topic
has some commonality with one or more other topic/topics. If the general frequency
of occurrence of the selected terms is low for a topic, it adversely affects the number
of documents that are represented by those terms. This is the probable reason for low
recall for some categories in both experiments. Performance evaluation of these
experiments with precision and recall are further addressed in the next chapter.
5.6 Conclusion
This chapter presented the effectiveness and applicability of feature selection methods
in application of the Recommendation Architecture model for text classification and
pattern discovery. Firstly the need for feature selection was argued and several feature
selection methods were examined. Two different feature selection methods: the
Document Frequency Thresholding method and the Two-step feature selection
method were chosen to be used with the RA. Modifications were also proposed for the
two-step feature selection method to make it suitable for variable length document
groups.

95
It can be concluded that, a priori guidance can be given to select features from
the input space in favour of the inputs more likely to provide useful discrimination
among the categories. It is demonstrated that, if the cognitive categories of the input
space are known, the guided method can be used with the RA where classification to
existing classes occurs. Conversely RA can be applied to unguided input space with
minimum guidance to the existing categories and let it discover categories among
data. Unguided input space presentation may result in previously not defined
categories which makes it difficult to evaluate performance with standard criteria.
Both experiments carried out with TREC data collection demonstrated
successful results though they were limited by the relatively small qualifying
document set in the corpus. Overall newsgroup postings were too noisy for the
clustering system of the RA to classify to original newsgroups with a good recall
when the uniqueness of the columns is maintained.
Detailed analysis of the selected feature sets for the experiments (with real
world data) depicts the sparseness of the most input vectors. Sometimes there can be a
few vectors with a large number of terms but not necessarily containing the terms
belonging to the topic. These large size vectors strongly influence processing, by
making columns too generic to identify a significant pattern. Both these conditions
require extensions to the existing implementation of the Recommendation
Architecture model for acceptable performance. The next chapter proposes such
extensions as well as some further enhancements. Issues in performance evaluation of
this kind of systems are also addressed in the next chapter.

96
Chapter 6 Extending the Clustering System of the RA
This chapter presents several extensions to the existing implementation of RA model
to overcome the limitations of its application for document classification. Further
enhancements are also presented to aid text mining. Two aspects of text mining are
considered here: the organization of documents into clusters, and the presentation of
the output revealing relationships within a cluster. The performance of the extended
RA system is evaluated and finally the performance evaluation of this type of systems
is discussed.
6.1 Introduction
The Recommendation Architecture model includes a number of controllable
parameters. The optimal values for four of these parameters depend on the
characteristics of the input space. Selection of the values for these parameters is an
important issue as the performance and clustering effectiveness of the system largely
depend on a good selection. Section 6.2 of this chapter examines the process of
selecting optimal values for these parameters.
Real world data sets contain a significant amount of noise or misclassified
patterns and usually result in sparse document vectors. If a very sparse vector is the
starting point of a column, it will make the system stagnate as there are too few
outputs to meet the minimum responses required. Especially if the number of data
vectors is limited there will not be many similar vectors to help the column to build-
up. Conversely, if a column is created with a very dense input vector containing a

97
large number of features common to other categories, it will make discrimination of
the column very difficult. In Section 6.3, two extensions (Extension-I and Extension-
II) are proposed for the Recommendation Architecture for increasing the column
effectiveness by overcoming these limitations (Ratnayake and Gedeon, 2002c).
Another major problem when applying the RA to sparse input vectors is the very low
recall. To increase the number of documents acknowledged by a column without
sacrificing the specificity of a column, an extension (Extension-III) for feature
intensity recognition (Ratnayake et al., 2002d; Ratnayake and Gedeon, 2003a) is
proposed in Section 6.4.
Another extension (Extension-IV) presents a new scheme to label the columns
with contributing features (words) by way of a word map in Section 6.5.1. The word
maps represent the new patterns that the system has identified and aid a human user to
assign meaning to discovered patterns (Ratnayake et al., 2002d).
The proposed post-processing system in Section 6.5.3 uses the output of the
clustering system and represents it as traversable clusters. This representation depicts
the relationships of documents within a column enhancing the ability for the user to
access and read the results (Ratnayake and Gedeon, 2003a). Furthermore, information
about the columns that respond to each document is also generated, which makes
possible a searching facility. A document is presented to the system to search for a
column or columns which acknowledge similar documents.

98
6.2 Parameter Selection
The columns of the RA are constructed by acknowledging various repetitions that
occur within the input data. There are four adjustable parameters that largely influence
the column construction process which are investigated in detail below. Two common
situations may occur when these parameters are not properly set. Either the system
may not create more than a very general single column which acknowledges almost
all the documents, or many documents may pass without being acknowledged by a
single column. In general, there is no method for selecting good parameter values
other than by trial and error because they depend on the input data set. Trial and error
involves repeated experimentation using different parameter values, a less than ideal
state of affairs.
The parameter ‘αThreshold’ is the minimum number of alpha layer devices
that must fire before an existing column starts accepting an input vector. It has a
considerable influence in deciding the uniqueness of the patterns identified by a
column. This parameter determines whether or not to accept an incoming vector to an
already existing column. An incoming vector which has enough similarity to activate
some devices in the alpha layer (i.e. accepted into a column) but does not have enough
similarity to produce an output at the gamma layer is given many opportunities to
imprint new devices and produce output. By controlling ‘αThreshold’, the tendency
of a highly dense vector (with features common to many other categories) being
accepted into a column can be discouraged. A guard condition was introduced to
dynamically adjust the value of this parameter by setting it to a percentage of the
regular section size of the alpha layer with a minimum value. Generally this value is
set to 3 or 5. When the data set is very sparse the optimal percentage is chosen to be

99
approximately 15% of the regular section size of the alpha layer, for a data set that has
average feature density the percentage can be increased to an optimal value of 25%
without affecting other algorithms. Especially when the alpha layer size is large, i.e.
more than 50 devices, this parameter ensures that only the vectors that can fire more
than 25% of the devices in the layer are accepted.
If an imprinted device keeps on failing to fire, its threshold is progressively
reduced. The parameter tmin or minimum threshold is the lowest value to which a
device can reduce its threshold. The default is set to 5, but devices rarely reach this
value unless input vectors are very sparse. However, with the newsgroup data, the
lowest a device can reduce its threshold had to be set to 4 to allow most of the vectors
to contribute to fire a device. The value of this parameter should be used in selecting a
document set for training. A training set should always have document vectors which
have a minimum of features which is higher than the value of this parameter to ensure
contribution to the training process.
The parameter ‘βThreshold’ is the minimum responses required to create a
new column’. It defines the amount of beta layer activity expected from the last
column during the specified response period to initiate the creation of a new column.
If this target is not exceeded the creation of a new column is inhibited. A default of
20% of the number of input vectors presented from one category during a wake
period, was chosen for this parameter. By controlling the value of this parameter the
rate at which the system stabilizes can be adjusted. The advantage in allowing the
system to stabilize slowly is that columns become sensitive to most of the variations
in the same category and respond to at least of 20% (default value) from the vectors

100
targeted at it. When the content of one category has considerable variation and similar
vectors are spread out over the data set (for example Movies category in newsgroups
can span over other specific movie related categories such as Star Trek) this value can
be set low to allow creation of new columns for the variations and accelerate the
system stabilization.
The parameter ‘Inputsmin’ is the minimum number of vectors that could remain
unacknowledged without making a new column’. If the last created column produce
more than expected minimum responses, a new column can be created if there are
input vectors more than Inputsmin value. In the experiments with document vectors, a
larger number (about 35%) remain unacknowledged due to the large variations in
terms of vector size and vector content among the documents in the same category.
Setting this parameter to a higher value will stop creation of new columns for slight
variations of the same category with very low recall. Moreover it helps to lower the
user’s expectation of a very high response from the data set. The value of this
parameter does not directly affect the performance as the system will stabilize without
reaching the expected response if it is too high, but the problem will be adjusting
other parameters forcing the system to reach this value at the cost of overall precision.
This parameter value can range from 2% to about 15% of the number of vectors
presented for a wake period.
6.3 Increasing Recognition Accuracy
Two scenarios of column imprinting were discovered when applying the RA model to
real-world text data. These are due to the vast differences in the feature density of
input vectors. Very dense input vectors result in excessively generic columns

101
(acknowledging documents from too many topics) whereas sparse input vectors result
in too specific columns (acknowledging too few documents). As there is no provision
in the originally proposed system to discard a column once it is created, the system is
unable to overcome these two problematic situations. To overcome the limitations
imposed by such columns in building the clustering system, Extension-I and
Extension-II are proposed to discard sparsely built columns and spurious columns
respectively by using a mechanism of self-correction. The following sections discuss
these extensions in detail after demonstrating the two problem conditions.
6.3.1 Problem of Very Specific Columns
When a column is initially created with a very sparse vector the RA algorithm
automatically discards it if there is no significant beta level activity. However, with
real world data a situation can occur where there is a very small set of vectors, which
produce enough beta level activity to create a column but not enough to sustain
development of that column. That is, when a column is initially created for sparse
input vectors with a rare combination of features where there are not enough similar
vectors to help the column to build up. The original algorithm will not allow the
creation of a new column until the last created column starts giving an output. This
situation hinders other columns being created if the last column does not improve,
especially if the qualifying data set has a limited number of samples and the same data
is presented repeatedly so that there will not be new input vectors to overcome this
stagnation.
6.3.1.1 Demonstration of the Problem Condition
This problem condition is demonstrated with an experiment using the newsgroup data
set. The modified two-step feature selection method is applied for selecting 1,000
features as described in Section 5.5.2. One hundred input vectors were presented in a

102
wake period and the system stabilized after 213 wake/sleep periods at the time the
results were recorded. Figure 6-1 shows that, due to lack of output produced by
column 5, the system has entered to a state of stagnation. Note that no new column
has been created for a significant number of inputs after column 5. Only 50-60% of
input vectors have been acknowledged by to the five columns and therefore enough
inputs that had not been acknowledged by any column were available. Unless there
are new input vectors, repeating the same inputs does not move the system out of
stagnation.
Figure 6-1 Number of columns created for a given number of inputs
As shown in Figure 6-1 there have been few attempts instantiating the column
6 but it has not been created. Instantiating a column means that the random
connections for the three layers of a new column have been made at a sleep period
ready for it to be used in creating a column. For a column to be successfully created
three conditions must be met. The main condition is that the previously built column
must produce at least the defined minimum responses (more than γThreshold) per
wake period. When the previously built column gives more than the γThreshold, a
column is instantiated. The second condition is that, by the time a column is
0
1
2
3
4
5
6
0 2000 4000 6000 8000 10000 12000 14000
Number of inputs
Num
ber o
f cre
ated
col
ums

103
instantiated an input vector that has not responded to any other column, which also
has some heuristically defined similarity to the alpha layer device connections of the
instantiated column, must be available. Thirdly this vector, that satisfied the second
condition, should produce enough beta layer activity in the new column.
6.3.1.2 Extension for Discarding Very Specific Columns - Extension-I
A new algorithm (Extension-I) is added to discard very specific columns. This
algorithm uses firing history information of a column and a defined cut-off limit to
determine whether a column should be discarded. The cut-off limit
(minOutputTolerance) is defined based on the minimum responses required
(γThreshold) per wake period from a column. The extended algorithm for create
column() with Extension-I is given below.
create column-withExtension-I() For all c ∈ RG If c has received sufficient inputs for each input in one wake period
If γO in cvr O,R,D,D γγγγγ , Oγ > 0
Increment γActivityCount If γActivityCount < minOutputTolerance If there are no initialised columns that are un-imprinted initialize column if ( column-Olastβ > βThreshold and FI > Inputsmin) If there are no initialised columns that are un-imprinted initialize column
The output of the column is observed for a specific period. The observation
period for adequate output starts after few wake experiences allowing enough time for
the column to be built, i.e. after the column received ‘sufficient inputs’ which is

104
usually first five wake periods. The column output considered here is the average
output produced from that column within a wake period. If the output produced is less
than minOutputTolerance, that particular column is initialized. Then that column is
free to accept a new starting vector (a new pattern). To specify the tolerance limit, the
system parameters γThreshold (minimum column responses per wake period) and the
number of inputs given within a wake period are used.
When Extension-I is applied to the RA in experiment 3a (as demonstrated in
Section 6.3.3.), eight stable columns are created by discarding very specific columns
as shown in Figure 6-2, compared to five for the same number of inputs which is
shown in Figure 6-1.
0123456789
10
0 2000 4000 6000 8000 10000 12000 14000
Number of inputs
Num
ber o
f cre
ated
col
umns
Figure 6-2 Number of columns created for a given number of inputs with Extension-I
6.3.2 Problem of Very Generic Columns
In a typical data set there are some vectors that are very dense but do not necessarily
contain features of the specific category they belong to. As shown in Figure 5-3 and
Figure 5-5 (Chapter 5) there are a few vectors having more than twice the number of
features they are generally supposed to contain (i.e. when only 100 features are

105
selected from a particular category some vectors contain more than 200 features). This
means there is very strong presence of features selected for other categories. If such a
“too general” vector started the creation of the column, it becomes sensitive to many
different types of inputs, which makes it difficult to find corresponding topics for such
a column. Moreover, when the input vectors do give output from such a column they
will not be regarded as vectors that were left behind. The vectors that are left behind
contribute to the creation of new columns because they are used as the starting vectors
for newly instantiated columns. There are two ways this situation can affect the
growth of the clustering system. The column creation may stop if no input vectors are
left behind because they are all acknowledged by one generic column. Otherwise,
columns corresponding to some categories may not be created because the generic
column is broad enough to acknowledge the vectors belonging to those categories.
6.3.2.1 Demonstration of the Problem Condition
This problem condition is demonstrated with the results of two experiments
(Experiments 1 and 2) which are given below. For these experiments the TREC data
was used and the modified two-step feature selection method was applied for feature
selection. The 1250 features selected as described in Section 5.5.1 are used for
preparing the document vectors. Experiment 1 created 9 columns whereas Experiment
2 created 11 columns. From these columns, column 3 in both experiments responded
mainly to 6 topics (marked in bold face) making it too generic to identify any known
pattern. Table 6-1 summarises the detailed analysis of column 3.
Precisions for the rest of the columns with regard to the major topics to which
they belong are summarized in Table 6-2. Except for column 3, for all other columns
a major corresponding topic or topics could be found. As shown in Table 6-2, some

106
topics like 425, 426 and 434 do not contribute to create columns in Experiment 1
neither does topic 426 to create columns in Experiment 2. Since a generic column
acknowledges too many documents from different topics, it adversely effects the
creation of new columns as described before, which could be the probable case for
this output.
Experiment 1 Experiment 2 Topic % of documents responding to Column 3
% of documents responding to Column 3
401 8.8 6.9 412 2.0 2.0 415 18.9 19.3 422 2.0 2.1 424 8.1 8.3 425 37.2 37.9 426 11.5 11.7 434 8.1 8.3 436 1.4 1.4 450 2.0 2.1
Table 6-1 Topic and the percentage of documents in each topic that responded to column 3
Experiment 1 Experiment 2
Column No
Major corresponding topic/topics
Precision for the column
Major corresponding topic/topics
Precision for the column
1 422 69.2 422 69.2 2 401 83.6 401 83.6 3 - - - -
4 450 56.2 450 56.2 5 415 100 415 100 6 436 51.9 436 53.3 7 412 86.2 412 86.3 8 422 59.3 422 79.7
9 424 100 412 89.2
10 N/a 401, 425, 434 82.5
11 N/a 424 100
Table 6-2 Precision and Recall for each column by the major document category identified (Experiments 1 and 2)

107
6.3.2.2 Extension for Discarding Very Generic Columns – Extension-II
An extension (Extension-II) is proposed to automatically detect columns that produce
more output than the specified cut off tolerance (maxOutputTolerance) within a wake
period. To specify the cut-off tolerance the knowledge or the prediction of the
distribution of the data are used (such as that 100 input vectors from 10 different
topics are presented per ‘wake’ period and how many categories are acceptable for a
pattern). For example, if 10 vectors are presented from each category during a wake
period, the maximum number of vectors which can respond to a column with a pattern
consisting of three categories is 30. If the column output is going over the cut-off limit
and if there are no other initiated columns waiting to build up, the column will be
initialized. Thus the too imprecise columns are discarded as well as column sizes are
controlled without allowing them to grow excessively. The extended algorithm for
create column() with Extension-II is given below.
create column-withExtension-II() if c last ∈ RG and c last has received sufficient inputs
for each input in one wake period
if γO in lastvr cO,R,D,D γγγγγ , Oγ > 0
Increment γActivityCount If γActivityCount > maxOutputTolerance if there are no initialised columns that are un-imprinted
initialize column
if ( column-Olastβ > βThreshold) and ( FI > Inputsmin)
if there are no initialised columns that are un-imprinted initialize column

108
The effect of using this algorithm is demonstrated with experiment 3a in Section
6.3.3.
6.3.3 Demonstration of the Solutions for Very Specific Columns and Very Generic Columns (Extensions -I and II) - Experiment 3a
Several experiments were carried out to evaluate the performance of the system with
the Extension-I and extension-II for discarding sparsely built and spurious columns.
For these experiments TREC data was used and the modified Two-step feature
selection method (described in Section 5.3.2.2) was applied for feature selection. As
described in Section 5.5.1, 1250 features were selected. Then the documents were
mapped to binary vectors denoting the presence or absence of the selected features.
The training set comprised of a set of 1500 document vectors, which had more
than 5 entries and consists of 150 vectors from each topic. A few vectors from a few
topics were duplicated once to get the minimum of 150 documents from each topic.
The test set comprised of a new set of 1000 (500 unique vectors duplicated once to
make 1000) document vectors, which have not been used for training or feature
selection.
The system created eight stable columns. Column 9 was automatically
discarded due to lack of outputs it produced over the observed ‘wake’ periods. From
the other eight columns, six columns produced output mainly from one topic and two
columns produced output from multiple topics as summarised in Table 6-3. Unlike for
Experiment 1 and Experiment 2, corresponding topics could be found for all the
columns with the lowest precision for a column being 67% in the training set. All the
topics except 434 contribute to creation of columns.

109
Table 6-3 Precision and Recall for each column by the major document category identified (Experiment 3a)
6.4 Increasing Column Sensitivity – Extension-III
The frequency of occurrence of a term in a document, as a feature attribute, carries
important information in describing or identifying that document. It is proposed to use
this information to enable alpha layer devices to capture additional information about
the input documents. Use of this scheme proves to be valuable in increasing column
sensitivity when the RA model is applied to text data.
6.4.1 Extension for Feature Intensity Recognition
The basic device of the RA model is sensitive to the absence or presence of a
particular feature. It is proposed to extend the basic device to be sensitive to the
intensity of the input. To support intensity as a feature attribute, the system must be
able to discriminate between the function of information recognition and information
recording. Inputs are pre-processed to include multiple occurrences of a feature to
indicate the intensity of its occurrence. In the RA model, information is recorded or
Column No.
Major document topics discovered
Precision as a %
Recall as a %
Training set
Test set Training set
Test set
1 412 67.0 42.3 64.2 22.0 2 401 71.1 65.9 72.3 54.0 3 415 84.7 73.0 87.4 70.0 4 424, 425, 426 84.4 80.1 - - 5 422 75.0 46.2 64.8 24.0 6 450 75.8 70.0 89.0 70.0 7 436 72.6 53.6 58.0 32.6 8 424, 425 75.6 64.0 - -
Average
75.8
61.9
72.6
45.4

110
imprinted by means of converting a virgin device to a regular device. The original
algorithm was modified in a way to count multiple occurrences of a feature for device
threshold calculation but the imprinting of a feature in a device was limited to once.
This allows the system to recognize the intensity of a feature as an attribute as
opposed to treating the multiple occurrences as distinctly different features.
The clustering system was modified to directly accept integer vectors
indicating the word occurrence frequency. The processing time is significantly
reduced when this is done in the pre-processing stage and only the index numbers
indicating the existence and the frequency of words are given.
Several experiments were carried out to evaluate the performance of the
system with feature intensity recognition enabled on both Newsgroup and TREC data
sets. Four experiments are presented here, which use the Extension-I and Extension-II
for discarding sparsely-built and spurious columns. From the four experiments, in
Experiments 3a with TREC data (discussed already in Section 6.3.3) and 4a with
Newsgroup data, the documents were mapped to binary vectors denoting the presence
or absence of the selected features i.e. without Extension- III. Experiments 3b (TREC
data) and 4b (Newsgroup data) were done with feature intensity recognition enabled
i.e. with Extension-III. (The three extensions, Extension-I, Extension-II, and
Extension-III are independent of each other and can be used separately or combined).
To accommodate information on the frequency, integer vectors were formed
by counting the frequency of occurrence of each feature (word) in a document to
represent it. In the document vector, the index denotes the feature and the content

111
indicates the frequency of occurrence of that feature. To reduce the discrepancies in
the sizes of the documents, vectors were normalized so that the maximum feature
frequency was 5. Finally, the input vectors were prepared by listing non-zero index
values. If the content of a particular index in the normalized vector was greater than 1,
then multiple copies of that index was written for the input vector. These input vectors
were then presented to the clustering subsystem of the Recommendation Architecture.
6.4.2 Experiments 3a and 3b – Applying the Extended RA to TREC Data
Same TREC data set was used for both experiments. A set of 125 words from each
topic was selected using the extended Two-Step feature selection method to arrive at a
1250 feature set as described in Section 5.5.1. All the documents that were used for
feature selection were mapped to 1250-word document vectors. As described above,
Experiment 3a was given binary vectors whereas Experiment 3b was given integer
vectors with frequency information. The training set comprised of a set of 1500
document vectors, which had more than 5 entries and consists of 150 vectors from
each topic. A few vectors from few topics were duplicated once to get the minimum
of 150 documents from each topic. The test set comprises of a new set of 500
document vectors, which have not been used for training or feature selection.
6.4.2.1 Results and Discussion
This section presents a comparison between the results of Experiment 3a and
Experiment 3b. In Experiment 3a, eight columns were created by the system. From
the eight columns, six columns produced output mainly from one topic and two
columns produced output from multiple topics. Results for the experiment 1 are
summarised by Table 6-3 (which is also presented in Section 6.3.3).

112
Table 6-4 Precision and Recall for each column by the major document category identified (Experiment 3a)
Column No.
Major document topics discovered
Precision as a % Recall as a %
Training set
Test set Training set
Test set
1 450 83.7 81.5 92.7 88.0 2 436 63.8 52.5 54.0 42.0 3 401 80.7 71.4 89.3 90.0 4 415 96.9 89.5 84.0 68.0 5 422 83.3 81.4 70.0 70.0 6 412 80.4 57.6 74.0 38.0 7 425 66.3 45.7 43.3 32.0 8 401, 425, 434 81.0 56.7 - - 9 424 78.6 60.0 22.0 12.0 10 401, 425, 426 82.3 53.3 - - Average Precision (%)
79.7
65.0
66.2
55.0
Table 6-5 Precision and Recall of each column by the major document category identified (Experiment 3b)
In the experiment 3b, the system created ten stable columns. From the ten columns,
eight columns produced output mainly from one topic and two columns produced
output from multiple topics as shown in Table 6-5.
Column No.
Major document topics discovered
Precision as a %
Recall as a %
Training set
Test set Training set
Test set
1 412 67.0 42.3 64.2 22.0 2 401 71.1 65.9 72.3 54.0 3 415 84.7 73.0 87.4 70.0 4 424, 425, 426 84.4 80.1 - - 5 422 75.0 46.2 64.8 24.0 6 450 75.8 70.0 89.0 70.0 7 436 72.6 53.6 58.0 32.6 8 424, 425 75.6 64.0 - -
Average
75.8
61.9
72.6
45.4
113
In comparison, Experiment 3b with Extension-III, produced ten columns with
eight columns uniquely identifying one TREC topic whereas Experiment 3a produced
eight columns with only six uniquely identifying TREC topics. The feature intensity
recognition extension results in improvement in average systems precision from
61.9% (Experiment 3a) to 65.0% (Experiment 3b) for the test set. It is also interesting
to note the improvement in worst-case precision in Experiment 3a topic 412 from
42.3% to 57.6% in Experiment 3b. The recall for the test set in all stand-alone topics
show a considerable increase except the very slight decrease for topic 415 from 70%
to 68%. In addition to the topics discovered in Experiment 3a, Experiment 3b enables
topics 424 and 425 to make individual appearances and for topic 434 also to appear as
a part of a pattern (which did not appear in Experiment 3a at all).
In both cases it can be seen that the system was able to cluster most of the
documents closely mapping to groupings of the TREC relevance judgment scores. As
shown by these experimental results, the use of feature intensity recognition increases
the average precision and recall significantly for the test set and also enhances
creation of columns for less frequent patterns in the data set.
6.4.3 Experiments 4a and 4b - Applying the Extended RA to Newsgroup Data
Same newsgroup data set was used for both experiments. A set of 100 words from
each topic was selected using the extended two-Step feature selection (described in
Section 5.3.2.2) arriving at a feature set of 1,000 features as described in Section
5.5.2. The training data set of 30,000 newsgroup postings was then mapped to 1000-
word document vectors. Similarly, the test set of 10,000 newsgroup postings were
also mapped to the 1000-word document vectors. The document vectors for

114
Experiment 4a were binary vectors whereas the vectors for Experiment 4b (with
Extension-III) were integer vectors with frequency information.
As Experiment 4a uses binary vectors denoting only the presence or absence of
a feature, documents having more than ten entries were selected as the training set.
Selecting vectors which have a higher number of entries increases the quality of input.
An equal number of documents were selected from each group and the resulting set
numbered 2000 documents. This set of 2,000 documents was repeatedly presented
several times for the training phase as discussed in the next Section (6.4.3.1). In the
test set 3,981 documents (i.e. 80% of the total set) had more than five features. As
feature intensity is taken into consideration in Experiment 4b, the training set
consisted of 23,140 integer vectors, which had more than five features. A few vectors
from three groups had to be duplicated to get an equal number of documents in each
group. The test set comprised of 5,000 vectors which had more than five features.
6.4.3.1 Results and Discussions
This section compares the results of Experiments 4a and 4b. In Experiment 4a, 100
input vectors were presented in each wake period being 10 documents from each
newsgroup. The system ran for a total of 120 wake periods and 120 sleep periods
before stabilizing with eight columns. The resulting groups and patterns that were
acknowledged by these columns are illustrated in Table 6-6.

115
Precision as a % Recall as a % Column No.
Major document grouping discovered Training
set Test set Training
set Test set
1 Cmp, Win, Lnx 90.4 95.6 - - 2 MVS 83.4 04.2 60.5 00.4 3 FSP 89.9 90.3 93.5 24.8 4 HMR 81.7 71.4 33.5 03.5 5 AST 97.0 92.8 65.0 22.9 6 BL5 90.3 82.8 65.0 23.6 7 MVS, FSP 85.3 0 - - 8 TRK 95.5 97.7 01.0 09.3
Average 89.2
66.9
53.1
14.1
Table 6-6 Precision and Recall of each column by the major document category identified (Experiment 4a)
Experiment 4b was carried out by presenting 100 vectors in each ‘wake’
period, being ten documents from each topic. The system ran for a total of 639 ‘wake’
periods and ‘sleep’ periods before stabilizing with the training data set. The results of
this experiment are summarized in Table 6-7.
Precision as a % Recall as a % Column No.
Major document grouping discovered Training
set Test set Training
set Test set
1 FSP 93.4 92.5 95.0 66.8 2 TRK 88.0 84.4 58.7 55.2 3 MOV 93.0 37.5 35.7 03.0 4 BL5 68.8 62.0 54.3 43.4 5 BL5, TRK 94.7 95.2 - - 6 Cmp, Win, Lnx 94.0 95.9 - - 7 MOV 75.8 20.9 08.3 02.0 8 BKS 100 0 05.7 0 9 MOV, TRK 86.3 36.2 - - 10 AST 100 96.6 23.3 22.4
Average 89.4
62.1
40.1
27.5
Table 6-7 Precision and Recall of each column by the major document category identified (Experiment 4b)
116
Compared to the eight columns created in Experiment 4a, Experiment 4b
produced ten columns. Having feature intensity recognition does not seem to improve
the average system precision of the test set, but it does improve recall for all the
categories in the test set. The most probable reason for the poor response in recall of
the test set in Experiment 4a is the small number of training documents which failed
to create columns with enough variety of connections. As the input vectors were
normalized to the frequency of occurrence of features, a larger training set was
available for Experiment 4b ensuring a wider distribution of features for device
connections.
From these experimental results it can be concluded that feature intensity
recognition considerably increase the sensitivity of the columns thereby increasing the
number of documents acknowledged by columns. Though overall response of the
newsgroup data is low, detailed analysis of the discovered groups reveals some
interesting patterns, which are further discussed in Section 6.6.3 using the extension
for column labelling that Section 6.5 describes. For example, by looking at the
column label it can be seen that column 7 (on books) acknowledges postings mostly
about just one particular book series. Therefore it is possible that the test set has no
postings on this particular subject which is the cause for no turn up.
6.5 Extending the RA for Text Mining
In situations where a document corpus is unclassified, being able to automatically
discover document classes and to be able to label them meaningfully for human
identification have wide applications. This section examines the enhancements
proposed (Extension-IV) to automatically label the columns and to display the co-

117
occurrence of frequent words in the column label. This information is used to make a
map display which shows the relationships among the features that contribute most in
creating and maintaining a column.
Lately, there have been several cluster labelling schemes proposed for Self-
Organizing Map (SOM) based research. So far the majority of SOMs have been
labelled manually after inspecting the trained Map, which is not feasible when the
map size is large (Rauber, 1999). WebSOM, which represents Usenet Newsgroup
articles uses the Newsgroup name or the Newsgroup hierarchy name that the majority
of the included articles come from. This allows automatic assignment of labels using
the pre-classification knowledge of the Newsgroups. Labels are given for regions
where words defining a region are computed by a measure of goodness. Goodness is
defined by comparing a word’s frequency to other word frequencies in the region and
its own relative frequency generally in the collection (Honkela et al., 1997; Lagus,
2000). The disadvantage in this scheme is that it requires the system to have the pre-
classification knowledge of Newsgroup names. In the LabelSOM approach no a
priori knowledge on the pre-classification is used in labelling. To generate the labels
the system considers the vector elements most relevant to the mapping of an input
onto a specific unit (Rauber and Merkel, 1999; Rauber et al., 2000a; Rauber et al.,
2000b). The main disadvantage in this approach is that clear cluster boundaries are
not apparent which requires human inspection to mark the separate groups. Though
Rauber claims to define cluster boundaries by combing units sharing a set of labels, it
is not clearly stated or shown whether it is done automatically. The labelSOM method
has been applied to ‘Growing Hierarchical Self-Organizing Map’ (GHSOM) also but
the labels are given for individual map units not for large areas (Dittenbach et al.,
118
2002). In contrast, the labelling done with the RA model is generated automatically
for each cluster and it does not require any prior knowledge of the existing categories
of the documents. The next section examines the column labelling scheme in detail.
6.5.1 Automatic Column Labelling – Extension-IV
As the system is presented with input experiences, the clustering system organizes
itself into sets of columns identifying similarities among input data. Each column
identifies a particular pattern prevalent in the inputs, which is independent of pre-
existing classifications. The system keeps a memory of the normalized frequency of
each feature, which contributed to firing devices in all columns. The most frequently
firing connections in alpha layer devices of a specific column are extracted to use in
the column label. The algorithm is also extended to keep a record of the feature pairs
that occur together when a device is fired. To find the word pairs that frequently occur
together, a method is devised to calculate the frequency at which the two words are
presented together as inputs, when a device fires. These feature and feature pair lists
are then used as the word map that describes each of the columns.
After word extraction, each column can be labelled by assigning it a word map
consisting of single words and word pairs. The collection of single words helps to
understand the grouping of the documents and word-pairs help to understand the
context of each word. For example, if the three words, car, traffic, stolen are present
in a label, knowing that the car-stolen pair occurs more frequently than car-traffic
suggests that the topic may be more relevant to car theft than normal car use.
6.5.2 Column Labelling for Experiments 3b and 4b
Table 6-8 shows the labels assigned by the system to each column created in
Experiment 3b. It can be seen that some topics contain articles which are common

119
across multiple TREC topics. The system identifies these documents together as a
single group.
Column No
TREC topics Automatically extracted words for column label
1 450 - King Hussein and peace Jordan, Israel, Amman, Arab, Washington, Palestinian, order, military, secretary, role, administration, American
2 436 - railway accidents train, cars, freight, crossing, travelling, federal, transportation, hit, tons, front, stop, hospital
3 401 – foreign minorities in Germany
German, federal, Bonn, violence, party, future, democratic, Europe, military, extremist, social, border, Klaus
4 415 – drugs and golden triangle Khun, Burma, Sa, opium, Asia, Thailand, Bangkok, Shan, army, narcotics, order, Rangoon
5 422 – art, stolen, forged art, stolen, artist, gallery, painting, dealer, museum, arrested, Dutch, German, French, collection
6 412 – airport security airlines, federal, airport, aviation, flight, air, American, administration, Washington, bomb, screening, Scotland
7 425 – counterfeiting money counterfeit, order, social, party, crime, arrested, legal, Russia, economy, printing, notes, German
8 401 – foreign minorities in Germany, 425 – counterfeiting money, 434 - economy in Estonia
goods, future, efforts, social, federal, Estonian, cooperation, Germany, products, order, party, financial, equipment, industrial, population
9 424 – suicides judge, Kevorkian, prosecutor, Michigan, ruled, Jack, jail, deputies, motel, doctor arrested, medical
10 401 – foreign minorities in Germany, 425 – counterfeiting money, 426 – dogs, law enforcement
car, officers, German , arrested, federal, dog, search, military, American, incident, party, stolen, suspects, crime, robbery
Table 6-8 TREC topic labels for the major group discovered by each column and the labels assigned to the columns by the extended RA system.
For example, topics 401 (foreign minorities in Germany), 425 (counterfeiting
money) and 434 (economy in Estonia) produce the majority of the output from

120
column 8. The words describing column 8 mainly gives the idea of social and
economic situations whereas column 10 producing output from 401 (foreign
minorities in Germany), 425 (counterfeiting money) and 426 (dogs, law enforcement)
gives the idea of crime, robbery and arrests. Though topics 401 and 425 are combined
with another topic in both cases, the words describing the columns clearly show the
difference between the two columns.
Two parts of the list of word pairs for Column 1 (which corresponds to TREC
topic 450 - King Hussein and peace) and Column 2 (which corresponds to topic 436 –
railway accidents) are shown in Table 6-9 with their (normalized) frequencies of
occurrence.
For all the columns a similar list is automatically generated which shows the
context for words. For example, it can be seen that the word role occurs in the context
of a country/region as opposed to military, administrative or secretarial which
correspond to the other frequent words in the label map. The normalized frequency of
occurrence can be used to select pairs with higher frequencies from the rest.

121
Column 1 Word 1 Word 2 Frequency
role jordan 125 role israel 110 role amman 109 role region 104 role washington 103 role future 90 role efforts 88 role israeli 84 role arab 81 role negotiations 75 role palestinian 62 palestinian jordan 156 palestinian israel 131 palestinian arab 130 palestinian amman 127 palestinian washington 110 palestinian israeli 102 palestinian negotiations 78 palestinian region 71 palestinian efforts 65 palestinian future 65 rabin jordan 51 al'aqabah israel 52 al'aqabah jordan 70 al'aqabah amman 62 … … …
Column 2 Word 1 Word 2 Frequency
social europe 58 social legal 50 social legal 50 social future 63 social region 61 federal transportation 92 federal equipment 52 federal evidence 62 federal executive 60 federal weeks 51 federal investigation 82 federal operation 60 federal administration 95 federal customs 58 federal legal 55 federal cars 52 federal traffic 53 federal future 57 transportation administration 62 transportation freight 76 transportation train 78 transportation cars 65 transportation traffic 55 transportation trains 55 equipment administration 53 … … …
Table 6-9 Frequently occurring word pairs
(A section for Column 1 and a section for Column 2)
Labels assigned for the columns created for Newsgroup data in Experiment 4b
are shown in Table 6-10. The reasons for outcome of the patterns and for multiple
occurrences of the same group can be deduced from the words describing the
columns. Sometimes columns evolve to be very similar though they were created for a
different group of input vectors. As can be seen from the Table 6-10 the group MOV
(movies) has created multiple columns for different variations within the same
category. For instance, Column 3 represents Japanese and Chinese movies with words
like samurai, Chinese, swordfights and fencing whereas column 7 is focused on

122
America and Hollywood. Column 9 which is a mixed pattern of MOV (movies) and
TRK (Star Trek) seems to have evolved on discussions based on movies about wars,
which is also a common theme with Star Trek.
Column No
Newsgroup name Automatically extracted words for column label
1 FSP - Farscape Francis, wars, test, Erik, personality, Thinkum, Viki, wire, Iwaniszek, darth, discovered, lies
2 TRK – Star Trek trek, ds9, tng, Borg, federation, episode, Spock, enterprise, holomatrix, geschreven, ship, voyager, survive, crew
3 MOV – movies swordfight, rob, sword, Peckinpah, samurai, Hollywood, liberals, Chinese, christian, fencing conservative, beauty's
4 BL5 – Babylon 5 jms, b5, crusade, trek, wars, published, Babylon, episode, rangers, officer, legend, production
5 BL5 – Babylon 5, TRK – Star Trek
nordal, donate, b5, crusade, trek, episode, ds9, Babylon, test , wars, voyager, rangers
6 CMP – computer, LNX – Linux, WIN– Windows2000
boot, drive, win2k, data, swap, files, win98, ram, cpu, card, error, Internet
7 MOV – movies beauty's, copout, conservative, America, Gary, christian, speaking, Hollywood, peace, improper, director, security
8 BKS – books incarnations, immortality, paperback, Bruening, Anthony, kid
9 MOV – movies, TRK - Star Trek
Chinese, beauty's, wars, Greek, francis, copout, European, views, crouching, tiger, empire, killed
10 AST – astronomy scope, refractor, celestron, eyepiece, bright, viewing, meade, observing, axis, focus, orion, astro
Table 6-10 Newsgroup names assigned for the major group discovered by each column by the labels assigned to the columns by the extended RA system.
Inspection of the word map shows that column 8 is mostly acknowledging
postings on books of one particular author called Piers Anthony, who wrote a series of
123
novels which are collectively called “Incarnations of immortality”. This explains why
no documents for BKS group was acknowledged in the test set in Table 6-7. There
may not have been any postings on this particular subject in the books (BKS) group of
the test set. Column 9 seems to be partially about the Chinese movie ‘Crouching
Tiger, Hidden Dragon’ where as postings on the movie ‘American Beauty’ seem to be
acknowledged by many columns.
6.5.3 Post–Processing the Output
The proposed post-processing system automatically generates a detailed analysis of
the results from the clustering system. The input to this system is a text file that
contains data on the gamma layer firing of the clustering system. The output is
presented in several ways. One is the column-wise breakdown of the number of
documents from each topic that are acknowledged by a particular column. Another is
the facility for the users to access and read the actual documents that contributed to
building a column.
For example, consider columns 3 and 7 in Experiment 4b, which have been
created for group MOV (movies). Column-wise breakdown of the test results in Table
6-11 shows how the appearance of documents from other topics lower the column
precision for MOV (movies). It can be seen from Table 6-11 that a considerable
percentage of LNX (Linux) documents have responded to these columns. It is hard to
accept that there could be any similarity between Linux and movies related
documents. However, when the actual Linux documents are examined (using the web
page generated) that responded to columns 3 and 7, it can be seen that those
documents categorized as Linux have no content related to Linux or computer. They
carry a discussion about various countries though posted to the Linux newsgroup.

124
Column 3
Column 7 Group % of documents
Acknowledged AST 6.9 BL5 2.3 BKS 9.3 CMP 0 FSP 0 HMR 11.6 LNX 32.6 MOV 20.9 TRK 16.3 WIN 0
Table 6-11 Column-wise breakdown of document groups for columns 3 and 7
The web pages generated by the post-processing system give links to the actual
documents that contributed to building columns (in a format similar to Figure 6-3).
There under each column number, the left hand side gives the input vector name
corresponding to a document with its category. The numbers on right denote the
gamma devices that fired when that document is given as input. Figure 6-3 clarifies
the differences between the gamma layer device combinations for a part of column 3
created by experiment 4b. The differences between gamma layer device combinations
can be used to distinguish similarities and differences between different documents.
These numbers do not correspond to words in the document. It is a heuristic
combination of words that creates a path to the gamma layer from the alpha layer.
Group % of documents Acknowledged
AST 2.5 BL5 5.0 BKS 15.0 CMP 0 FSP 0 HMR 10.0 LNX 27.5 MOV 37.5 TRK 2.5 WIN 0

125
Column Number 3
tMOV-12.txt 3 4 5 7 8 9 10 11 12 13 14 15 16 17 18 19 20 21 22 23 tTRK-14.txt 12 13 16 18 tMOV-45.txt 3 6 7 8 9 10 11 12 13 14 15 16 17 18 19 20 21 22 23 tMOV-144.txt 6 7 8 10 12 13 14 16 18 19 21 22 23 tBKS-158.txt 19 20 tBKS-163.txt 3 4 5 6 7 8 9 10 11 12 13 14 15 16 17 18 19 20 21 22 23 tMOV-206.txt 0 1 2 3 4 5 6 7 8 9 10 11 12 13 14 15 16 17 18 19 20 21 22 23 tMOV-208.txt 3 6 7 8 9 10 12 13 14 15 16 17 18 19 21 22 23 tMOV-259.txt 8 9 13 19 tMOV-262.txt 19 tMOV-312.txt 3 4 5 6 7 8 9 10 11 12 13 14 15 16 17 18 19 20 21 22 23 tBKS-325.txt 3 4 5 6 7 8 9 10 11 12 13 14 15 16 17 18 19 20 21 22 23 tBL5-278.txt 3 7 10 12 13 14 16 18 21 22 tBKS-403.txt 4 5 6 tMOV-527.txt 9 tBKS-507.txt 0 1 2 3 4 5 6 7 8 9 10 11 12 13 14 15 16 17 18 19 20 21 22 23 24 tMOV-584.txt 6 7 8 10 12 13 14 16 18 19 21 22 23 tMOV-602.txt 6 7 8 10 12 13 14 16 18 19 21 22 23 tBKS-543.txt 3 4 5 6 7 8 10 12 13 14 16 17 18 19 21 22 23 24 tMOV-623.txt 6 7 8 10 12 13 14 16 18 19 21 22 23 tMOV-640.txt 6 7 8 10 12 13 14 16 18 19 21 22 23 tLNX-591.txt 0 1 2 3 4 5 6 7 8 9 10 11 12 13 14 15 16 17 18 19 20 21 22 23 24 tLNX-592.txt 0 1 2 3 4 5 6 7 8 9 10 11 12 13 14 15 16 17 18 19 20 21 22 23 24 tLNX-600.txt 0 1 2 3 4 5 6 7 8 9 10 11 12 13 14 15 16 17 18 19 20 21 22 23 24 tLNX-605.txt 0 1 2 3 4 5 6 7 8 9 10 11 12 13 14 15 16 17 18 19 20 21 22 23 24 tLNX-606.txt 0 1 2 3 4 5 6 7 8 9 10 11 12 13 14 15 16 17 18 19 20 21 22 23 24 tHMR-1619.txt 6 13 14 21 22 tHMR-1636.txt 0 1 2 3 4 5 6 7 8 9 10 11 12 13 14 15 16 17 18 19 20 21 22 23 24 tHMR-1642.txt 12 13 14 tMOV-826.txt 3 6 7 8 10 12 13 14 15 16 17 18 19 21 22 23 24 …… ………………………………………………………………..
Figure 6-3 Part of the output for column 3 showing the relationships between document vectors and gamma layer device numbers
6.5.4 Searching for Similar Documents
When it is not possible to articulate the information need clearly, the user can provide
an indicator or an example to the RA to discover similar information. For example, a
new document can be provided to the system as the indicator and the system will
show which columns acknowledge similar documents. Table 6-12 generated from the
post-processing system (for experiment 4b) shows 22 document vectors and which
columns a particular document is acknowledged by. Each line corresponds to a
document vector and ‘1’ under a column number indicates that particular column
acknowledges that document. If the new document does not posses any relation to an
existing column, it will not be acknowledged by any column.

126
Responding column numbers File names of document vectors 1 2 3 4 5 6 7 8 9 10tAST-12 1tBKS-14 1 tBL5-16 1 tBL5-23 1 1 tCOM-12 1 tCOM-14 1 tCOM-17 1 tFSP-24 1 tFSP-25 1 tMOV-12 1 1 tMOV-25 1 1 1 tTRK-11 1 1 1 tTRK-14 1 1 1 tTRK-18 1 1 tTRK-24 1 tTRK-25 1 1 1 tTRK-28 1 1 1 tWIN-0 1 tWIN-11 1 tWIN-17 1 tWIN-21 1 tWIN-23 1
Table 6-12 A set of the document vectors by the columns they respond to.
When an unknown document is given as input to the clustering system,
responding column numbers and the firing gamma device numbers will be given as
output. Using this information the post-processing system generates a table similar to
Table 6-12 with only one line. The differences between the documents responding to
the same column can be seen by the firing numbers of gamma layer devices. More
work can be done to enhance the usability of the discrimination provided by the firing
gamma device numbers. For example, using a scheme for calculating vector
similarity, documents with the most similar gamma device numbers could be
identified as documents with similar content.

127
6.5.5 Performance Evaluation
Evaluation of systems that provide users with effective access to information and
interaction with information has to be done at different levels. As argued in
(Saracevic, 1995) there can be three levels such as processing level and output, users
and use level, and social level. Evaluation at processing level includes assessment of
performance of algorithms and techniques whereas evaluation at output level includes
assessment of searching, interaction, feedback, etc. Evaluating ‘end-user
performance’ and ‘use of information retrieval (IR) systems’ are done at users and use
level. Currently users and use level evaluations are mostly done using actual products
and services on the market. Effect of information access on research, productivity, and
decision-making is addressed at social level. However, most of the research and
literature in IR evaluation are on the processing level.
Most of the existing evaluation methods are aimed at information retrieval (IR)
since IR is the oldest branch of research in information access. Precision and recall
have been the preferred measures of IR evaluation at the processing level. Precision is
the ratio of relevant items retrieved to all retrieved items and recall is the ratio of
relevant items retrieved to all relevant items in the data set. If the relevance of
assessed output is given precision is directly calculated. However, recall depends not
only on what was retrieved but also on what was not retrieved, which raises the
question “how does one know what was missed if one does not know that it was
missed?” Furthermore, all use of recall has the underlying assumption that an existing
item is only relevant to one category in the data set, which is not warranted
particularly in large databases like TREC. According to Järvelin and Kekäläinen, if
the assumption that there is only a single relevant set per request is abandoned, use of
128
the measure recall must be re-evaluated (Järvelin and Kekäläinen, 2000). In order to
solve problems linked to the assessment of relevance, Järvelin and Kekäläinen
propose ‘bases’ (or degrees of relevance) for recall such as, highly relevant, fairly
relevant, marginally relevant and irrelevant rather than using a single value. Taking
these facts into consideration, Lagus’s arguement (Lagus, 2000) ‘that due to
fundamental problems such as existing categorization being inaccurate, categories
overlapping and the same articles belonging to several categories, automatic methods
may provide better categorization than the original one’ seems correct.
For the evaluation of the clustering system of the Recommendation
Architecture, precision and recall is defined (Equation 1 and Equation 2) considering
the category a document belongs to as the category of most documents acknowledged
by that column. As a measure of local coherence the average precision of over 60%
for the test sets in all four demonstrated experiments is quite good considering the
values are from eight (in Experiments 3a and 3b) or ten (in Experiment 4a and 4b)
groups. The random value for eight groups is about 12% whereas the random value
for ten groups is 10%. As the articles are manually classified the human value could
be as high as 100%. Since all 8 clusters in Experiments 4a and 4b do not match the
original topics and the RA has discovered a few new topics, the human value must be
to a large extent lower than 100%. The overall recall for the test set, especially for the
experiments with the newsgroups, are rather low which needs further work in
increasing the sensitivity of columns. Precision and recall both vary from 0% to
100%. As Salton argues optimising both recall and precision simultaneously is not
normally achievable (Salton, 1989). Therefore a compromise must be reached.
According to Salton, an intermediate performance level, at which both the recall and

129
precision vary between 50%-60% is more satisfactory than either of the limiting
performance levels that favour high recall or high precision exclusively.
Modern information access systems have much more value added to the results
which differentiate them considerably from the retrieval systems. As argued by
webSOM based projects (Lagus, 2000), it is difficult to define evaluation methods for
quality of visualization, exploration and navigation in these methods. It is a challenge
to integrate IR evaluations from different levels and to define evaluation methods for
new applications.
6.6 Summary
The first section (Section 6.2) of this chapter presented several heuristics for setting
four important parameters. Fine-tuning the controllable parameters of the system
enable consistent categorisation while acknowledging a large number of documents.
As often the case had been, any empirical study with the RA requires the knowledge
of the influence these parameter values have on the system.
The major part of this chapter examined the extensions that were proposed for
increasing the effectiveness of the clustering system and for creating a word map for
visualization of the results. Discarding poorly built columns and spurious columns
reduces the effect of too specific and too general input vectors being the starting point
of a column. The advantage in discarding poorly built columns is that the system can
overcome stagnation when experimenting with limited number of documents. The
benefit of discarding largely imprecise columns is twofold as it enhances local
coherence within columns and allows discrimination among different patterns. By

130
enabling the system to use frequency of occurrence of features, significant
improvement is achieved for recall and precision. Though major topics that respond to
a particular column can be identified by the post-processing system, column labelling
describes the characteristics of the columns themselves. Especially, where few topics
respond to the same column, the commonality they share among themselves can be
clearly seen. As demonstrated by experiments, these extensions significantly
contribute to text organization with classification and representation.
The last parts of this chapter (Sections 6.5.3 and 6.5.4) demonstrate the use of
the post-processing system to enhance the applicability of the RA for more tasks in
text mining. Primarily, the post-processing system enables analysis and exploration of
the data organized by the clustering system. It also gives many paths to discover the
reasons why particular documents form a pattern together and why some documents
respond to a particular column. Finally it provides a search facility that guides the user
to a cluster of similar documents when a new document is provided. This facility is
especially useful when the needs of a user are difficult to articulate.
It is noted that existing standard criteria for evaluation of information access
methods are primarily concerned with information retrieval and filtering. More
qualitative measurements are necessary which consider the value added to
information access by text mining systems such as visualization, cluster labelling and
navigation.

131
Chapter 7 Conclusion
7.1 Principal Lessons
This thesis examined the viability of applying the Recommendation Architecture
model for text mining. The Recommendation Architecture model has shown promise
as a new connectionist approach for pattern discovery and recognition on simulated
problems. However it had never before been tested for a real problem with real data.
This thesis, for the first time, provides insights into the behaviour of the
Recommendation Architecture when applied to a real world problem, specifically text
mining. The Recommendation Architecture turned out to be a viable model for text
mining to a large extent. Guidelines were given how and in what situations it can be
applied and the existing limitations were explored. New extensions to the model were
proposed to overcome these limitations and to enhance the application to text mining.
As reported in chapter 4, the new RA implementation developed in C++
enables fast execution of experiments on a normal desktop computer. This makes the
Recommendation Architecture model available in an executable form that can be
applied to any domain effectively. The concepts, functionality and the algorithm of
the Recommendation Architecture model were comprehensively examined in chapter
2. This analysis, together with the proposed formal notation, brought forth a clear
understanding of the Recommendation Architecture, which may help popularise its
use in other applications. The prototype will be made available on the web with the
Comment: Imprinted?

132
necessary guidance for set-up and use at http://wwwit.murdoch.edu.au/~ratnayak.
Four decades of research on information access systems have seen many
advances in the fields of retrieval, filtering, and classification. A review of the
literature on information access systems (in chapter 3) suggested that the usefulness of
information retrieval, filtering and classification systems is limited in the context of
evolving user interests. When the information need is vaguely understood and
difficult to verbalize, and when it is necessary to discover unsuspected relationships
among documents, a different approach is needed. Text mining aims to fill the gap
between traditional information access systems and evolving user needs. The added
dimensions that text mining offers are the pattern discovery and organization of text
displaying various relationships among documents. The Recommendation
Architecture’s ability to discover and recognize patterns makes it a natural candidate
for application in this type of text mining.
Chapter 5 demonstrated how the RA model can be applied to the problems of
pattern discovery in text and classification of text. The difficulty of the task depends
notably on the nature of the data set. For empirical studies in this thesis two kinds of
data sets were selected. One had a fair amount of structure in its content and the other
had very little structure. The first set of documents were selected from the TREC
corpus. The TREC documents are written in a structured manner and with proper
English sentences. However, they contain some noise in the sense that some very long
documents have only few sentences that are relevant to the subject, making the pattern
discovery and classification non-trivial. Furthermore, this set contained documents
that were pre-classified as belonging to more than one group, creating a significant
133
overlap. The second set of documents was selected from Internet Newsgroup postings.
They contain wide variations in writing style and of very poor quality. There is also a
fair degree of cross posting in the Newsgroups. From both sets, each document was
presented to the system as a set of features appropriately selected to represent the
document.
When the system is used for pattern discovery, the feature selection process
takes no a priori guidance on the information of existing categories in a data set. The
system classifies documents in to various categories as they are being discovered. The
discovered categories are the patterns representing some commonality among
documents. However, the categories that were discovered during the experimentation
with Newsgroup data were difficult to interpret even with the labels assigned. For
Newsgroup data where the content within one category has vast differences, this
similarity could be, for example, jokes in all 10 groups, a discussion style, etc. The
experimental results in discovering patterns with TREC data were shown to be very
encouraging and the interpretation of the discovered patterns proved to be reasonably
straightforward with the labels assigned.
When the system is used for classification, the input space needs guidance as
to what categories are expected, i.e., a feature selection is needed in favour of the
features more likely to provide useful discrimination among the known categories. In
chapter 5, the Two-step feature selection method that was used for information
filtering by Stricker et al. (Stricker et al., 1999) is modified by the author to use for
classification. The experimental results showed that the classification accuracy of the
Recommendation Architecture was quite good (precision over 61% for test sets) with

134
both data sets when the input space is modelled with the proposed modified feature
selection algorithm (chapters 5 and 6).
Experiments carried out in Chapter 5 showed that several enhancements are
needed to the Recommendation Architecture model for effective pattern discovery
and classification in text. Chapter 6 introduced the extensions proposed for increasing
the effectiveness of document classification. One is the reduction of the effect of a
‘poor’ document vector contributing in the creation of a column. With real-world data
there is a high probability that a starting vector will be a fairly sparse and rare or a
noisy one which makes it contribute poorly. When the starting vector is sparse and
rare, the created column tends to develop in to a very specific column that only
acknowledges a few input vectors. When the starting vector is noisy, the created
column tends to be very general and acknowledges a large number of input vectors.
Both these conditions result in poor performance of columns and the proposed
extensions, Extension-I and Extension-II (of Sections 6.3.1.2, 6.3.2.2), addressed
these conditions by way of automatically discarding poor columns. The advantage of
Extension-I is that the system can overcome stagnation when working on a limited
number of documents. The benefit of discarding too imprecise columns is twofold: it
enhances local coherence within columns and it allows more discrimination among
different patterns. Thus discarding poorly built columns and spurious columns reduces
the effect of too specific and too general input vectors being the starting point of a
column.
Extension-III proposed in Section 6.4 enables the system to use the frequency
of occurrence of features (feature intensity) of document vectors to enhance pattern
135
recognition. The original algorithm was designed to use binary vectors which denote
only the presence or absence of a feature in the vector. The information regarding the
frequency of occurrence of that feature was not used. Feature intensity recognition is
achieved by differentiating the tasks of recording information and recognizing
information at the system component level. The experimental results proved that this
extension contributes significantly to improve both recall and precision.
Pattern discovery is not very effective unless it is combined with an
explanation of why particular texts are categorized into a particular group. Using the
automatic column labelling scheme introduced in Section 6.5.1, the columns could be
described using a word map that consisted of features that contributed to create them.
The word map was automatically extracted from the features contributing to the
creation and maintenance of a column. It also describes the co-occurrence of frequent
features that contribute to maintaining a column. This allows the context for the words
in the label to be further understood by examining the frequently occurring word-
pairs. The word maps significantly improve the effectiveness of RA in text mining by
way of presenting the columns in a human readable form.
The proposed post-processing system (in Section 6.5.3) is evidently capable of
using gamma level output for more tasks in text mining. Primarily, this allows
analysis and exploration of the data organized by the clustering system. It also offers
many paths to find out why particular documents form a pattern together and why
some documents respond to a particular column. Finally, it provides a ‘search by
example’ facility that guides the user to a cluster of similar documents when a new
document is given. This facility is especially useful when the user’s search need is

136
difficult to articulate.
The effectiveness of the clustering system depends on the suitable selection of
parameter values from a number of adjustable parameters in the RA system. In
general, there is no method for selecting good parameter values other than by trial and
error because they depend on the input data set. When the vectors of the data set have
average feature density (for example, statistical data used in the model experiment in
chapter 4 and stemmed data in Appendix B), the parameter selection takes a minimum
effort. However, when the number of training samples is limited and the document
vectors are sparse, parameter tuning could consume a considerable amount of time.
Furthermore, when the data is very noisy and of poor quality, it is more difficult to
identify suitable parameters to optimise the categorization process. This makes the
application of RA model to particular domains a challenging task. Section 6.2
suggests several heuristics for selecting parameter values for key parameters based on
the characteristics of the data set.
Note that existing standard criteria such as recall and precision for evaluation
of information access methods are primarily concerned with information retrieval and
filtering and are not sufficient to evaluate text mining systems. What is needed are
qualitative measures which take into account the added value to information access of
a given text mining system. The ultimate measure of evaluation would be user
satisfaction, though it is difficult to measure properly because the software is at an
early stage. Looking through the experiments the low recall values in some cases can
be explained. The key reason is the existence of sets of very specific documents
resulting in considerable variations within the same category (e.g. set of documents in

137
‘movies’ Newsgroup discussing a specific movie). Another reason is the level of
sensitivity of columns and how well it matches with the nature of the patterns being
identified. A low level of sensitivity creates columns that identify narrow patterns
(e.g. set of documents in ‘movies’ Newsgroup discussing a specific movie) and a high
level of sensitivity creates columns that identify broad patterns (e.g. a whole
Newsgroup). Furthermore the measurement of recall itself is also subject to a
considerable amount of criticism for not being a realistic and acceptable in all
situations (Järvelin and Kekäläinen, 2000).
Currently, Self-Organizing Maps (SOM) provide the basis for most prominent
text mining methods. SOMs provide a visualization of relationships among document
but have their limitations due to mostly fixed architectures and vast maps. In a SOM,
a document is given a coordinate location in a two dimensional grid based on the
content. The Recommendation Architecture can perform significant further text
mining tasks when compared to SOM based methods. Not only does it provide for
visual representation of results in many ways after discovering patterns, but is also
capable of document classification. The RA also has the ability to have one document
in several columns depending on its associative similarities in content which makes
clustering in the RA multi-dimensional. Internet Newsgroups are widely used as data
sets with WebSOM (Lagus, 1998). Since SOM gives a fixed position to each
document and not a classification into a group, the problem of low acknowledgement
does not arise in a SOM based system. Conversely, the RA model separates the
documents into a few large groups (in separate columns) which causes some
documents to be left behind if there is no similarity in content to fall into one of the
columns. Thus the RA faces the problem of not acknowledging enough documents in

138
some cases when standard recall measure is used to evaluate its performance.
In conclusion, the Recommendation Architecture model can be successfully
applied for several tasks in text mining. The RA model with the proposed extensions
produces highly encouraging results for somewhat structured corpora and produces
moderately successful results even for very noisy data. The strength of the
Recommendation Architecture model lies in its ability for pattern discovery in text,
classification with high accuracy and providing the rationale for a particular
categorization. One notable shortcoming of the RA system as applied to real world
problems is the necessity to manually optimise system parameters to suit the input
space.
7.2 Future Directions
Several directions could be further pursued to investigate the RA model as well as its
applications. There is a wide scope for possible investigation of the consequence
feedback of the competitive system. Consequence feedback in the competitive system
can be used for evolving columns based on the acceptability of the output.
Further investigation into column sensitivity and the nature of patterns being
recognized may improve the performance of the model. When the patterns are broad
(based on a large feature set) higher level of column sensitivity would result in
building columns which can recognize broad patterns. When experimenting with
Newsgroup data it was challenging to make the columns sensitive enough to respond
to a fair number of documents while preserving their identity.

139
Given the number of experiments which needed to conduct, there was time for
only two different types of data sets to be used for the experiments in this work. More
empirical studies with diverse text collections may verify the generalizability of the
system for text mining at large.
The output of the clustering system is based on the firing status of a set of
devices in the gamma layer. Due to information compression from alpha layer to
gamma layer, the resulting vectors containing gamma device numbers are very small
in size. For example, a document may be represented by 1,000 features but the
number of gamma layer devices are usually less than 20. This non-binary, compressed
gamma device-discriminative information carries additional information of the nature
of the similarity of the patterns being identified. In Section 6.5.4, a search scheme was
presented to use this data to identify the degree of similarity between documents in a
given column. Further work could be carried out to exploit the information in gamma
layer devices to provide additional explorative abilities by using the similarities of
documents within columns.
A text mining tool based on the Recommendation Architecture could be easily
implemented by adding a user interface. Even when the existing categories are
unknown a set of document vectors obtained by using a simple feature selection
scheme can be given as the input. It is easy to use as the input is a text file of
document vectors and the system can be saved and loaded at any point. Depending on
the data set some parameter tuning may be necessary which requires the system to run
several times in order to select the best output.

140
Appendix A Additional Experimental Results - Newsgroup Data (Feature Selection with the Document Frequency Thresholding Method) This appendix describes three experiments carried out with the Newsgroup data, as
noted in Section 5.4.1.2. Several variations of feature structures and feature selection
methods were carried out to identify appropriate and effective feature structures and
feature selection methods for pattern discovery with the RA. To investigate the impact
of the ‘structure of features’ on clustering, words, word-pairs and a combination of
the two were used as the features. The feature selection for the input space was done
with the Document Frequency Thresholding method. This section examines the
experimental results in detail.
A.1 Formation of the Input Space The experiments were carried out using data from ten newsgroups postings. The
groups selected for the experiments were, Babylon5 (BL5), books (BKS), computer
(COM), movies (MOV), Linux (LNX), Windows2000 (WIN), Farscape (FSP), Star
Trek (TRK), humour (HMR) and amateur astronomy (AST). The newsgroup postings
can be said to be very ‘noisy’ in terms of varied content including very short remarks
as the whole document, jokes, questions, elaborate discussions, program code, and
ASCII images and longwinded flame wars between individuals. The actual text is
often carelessly written, contains spelling errors and is of poor style.
As described in Section 5.4.2.1 the experiments were carried out with 1000
words, 1000 pairs and 2000 single words and pairs as features for the document
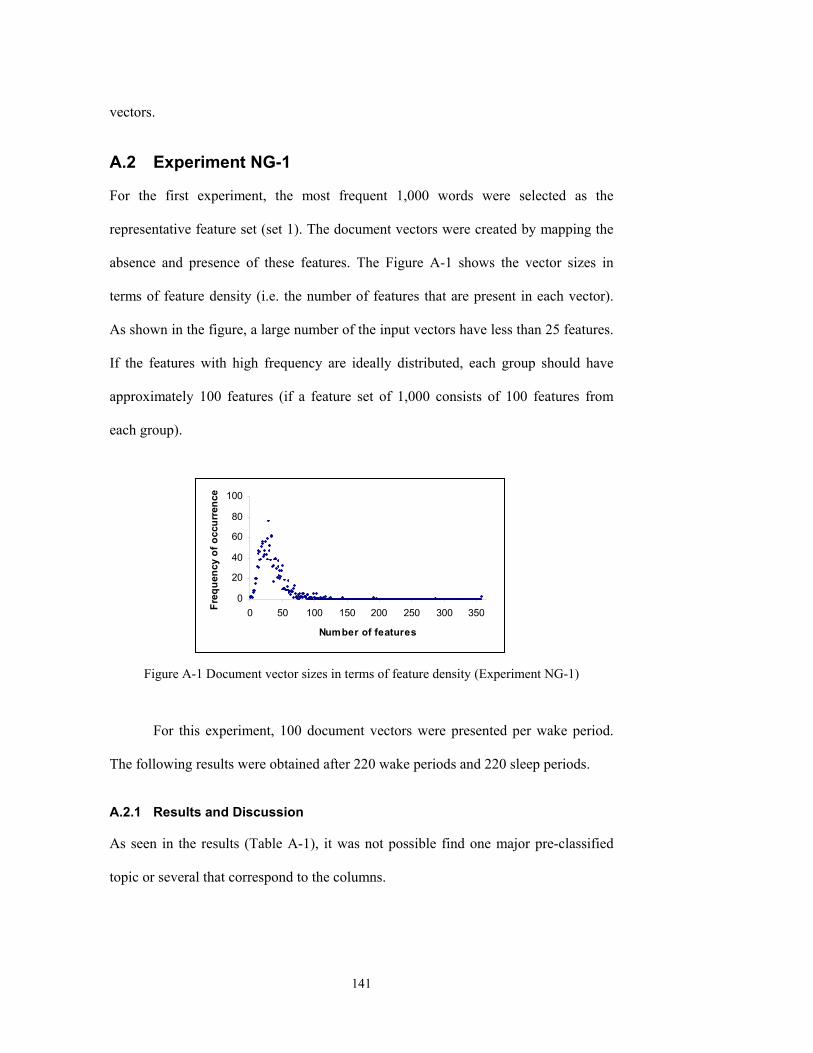
141
vectors.
A.2 Experiment NG-1 For the first experiment, the most frequent 1,000 words were selected as the
representative feature set (set 1). The document vectors were created by mapping the
absence and presence of these features. The Figure A-1 shows the vector sizes in
terms of feature density (i.e. the number of features that are present in each vector).
As shown in the figure, a large number of the input vectors have less than 25 features.
If the features with high frequency are ideally distributed, each group should have
approximately 100 features (if a feature set of 1,000 consists of 100 features from
each group).
Figure A-1 Document vector sizes in terms of feature density (Experiment NG-1)
For this experiment, 100 document vectors were presented per wake period.
The following results were obtained after 220 wake periods and 220 sleep periods.
A.2.1 Results and Discussion As seen in the results (Table A-1), it was not possible find one major pre-classified
topic or several that correspond to the columns.
0
20
40
60
80
100
0 50 100 150 200 250 300 350
Number of features
Freq
uenc
y of
occ
urre
nce

142
Column No Words describing the column 1 world, run, free, bit, love, simply, second, number,
bring, internet, show, including, american, point, happened, far, times, based, buy, day
2 world, show, part, simply, american, number, bit, far, including, guess, point, free, movies, second, history, day, life, certainly, read, film,
3 world, run, guess, simply, point, based, number, show, part, times, free, including, second, course, life, bit, love, working, internet, american
4 including, world, service, second, online, copy, postings, original, information, run, simply, order, part, containing, free, number, book, times, body, material
5 copy, process, headers, world, complaint, properly, free, love, run, second, simply, part, dark, close, show, business, file, certainly, bit, information
6 simply, world, times, part, show, information, free, second, life, number, turned, point, love, sign, man, american, run, guess, easy, day
7 number, world, simply, times, part, free, bit, far, point, run, show, second, knew, easy, love, life, american, based, reason, money,
8 knew, afraid, completely, course, turned, leave, absolutely, inside, worth, show, box, point, night, fun, move, body, man, power, head, easy
Table A-1 Some frequent words in the documents accepted by each column
(words in bold face appear in three or more columns)
Though columns are created with substantial differences initially, as the time
goes by the uniqueness of most of the columns is lost as the columns begin to
acknowledge document vectors from various categories. Inspection of the word map
shows similar words in the labels for most of the columns and it is hard to distinguish
them from each other. Note that the words in bold face in the column label are
common across more than three columns. This suggests that single features selected
using the Frequency Thresholding method for a sparse data set like Newsgroup data,
is not discriminatory enough for automatic discovery of pre-classified patterns.

143
A.3 Experiment NG-2 For this experiment, the feature set (set 2) was created by taking the most frequently
occurring word pairs in sentences. The word pair list was produced by taking the
Cartesian product of the most frequently occurring 500 words. Then a word pair
frequency profile was generated by counting all the instances of word pairs within
sentences in each document. From the pair list, the most frequent 1,000 word pairs
were selected as the representative feature set. Then the document vectors were
created by mapping the presence or absence of the selected features. The resulting
document vectors were very sparse - only 2,690 out of 30,000 had more than five
features.
0
100
200
300
400
500
0 30 60 90 120 150
Number of features
Freq
uenc
y of
occ
uren
ce
Figure A-2 Document vector sizes in terms of feature density (Experiment NG-2)
Figure A-2 shows the document vector sizes in terms of number of features they
contain. From the selected 2690 the majority of the input vectors have less than 30
features.

144
A.3.1 Results and Discussion During the experiment, 100 vectors were presented each wake period and the same
data was repeatedly presented for 100 wake/sleep cycles. Due to sparseness of the
vectors and the limited number of vectors available the system stagnates without
acknowledging many vectors.
It can be seen from Table A-2 that the columns have high precision values.
Recall is quite low due to the small number of documents acknowledged by columns.
More than half of the document set was unacknowledged. After a few columns were
created the system stagnated and the creation of columns stopped. This suggests that
the word-pair features selected using the Frequency Thresholding is an effective
feature structure for discovering patterns in text, but not suitable for sparse data sets
like Newsgroup data.
Column No Major Groups Precision as a %
Recall as a %
1 FSP 100 16.4 2 AST, HMR 65.7 - 3 MOV 100 02.2 4 COM 100 17.1 5 TRK 100 07.4 6 AST, HMR, LNX 65.1 - …..
Table A-2 Precision and Recall by the major category/categories acknowledged by each column
A.4 Experiment NG3 The last feature set (set 3) was generated by combining the sets 1 and 2 which gives a
feature set comprising of 2,000 features. Then document vectors were created by
mapping the absence and presence of these features. Figure A-3 shows the vector

145
sizes in terms of number of features they contain. As shown in the figure, the majority
of the input vectors have less than 30 features though it should be closer to 200 as the
documents were from 10 groups.
Figure A-3 Document vector sizes in terms of feature density (Experiment NG-3)
A.4.1 Results and Discussion The two feature sets were combined to ascertain the effectiveness of nullifying the
shortcomings of one set with another. For example, the set 1 produced too generic
columns and set 2 produced too specific columns. However, the results of the
experiments carried out with this combined feature set showed similar results as with
set 1 (single words). This suggests that this combination of feature sets does not
combine the effects of the two feature sets to cancel out the shortcomings of each
scheme.
A.5 Conclusion Meaningful pattern discovery with newsgroup data when the term selection was done
using Frequency Thresholding proved to be rather difficult. The choice of single
words as terms turned out to be not discriminatory enough in respect to the identity of
different groups or sets of groups. Conversely, the majority of word pairs appearing in
the same sentence proved to be of highly discriminative of what group a particular
0
200
400
600
800
1000
0 30 60 90 120 150 180 210
Number of features
Freq
uenc
y of
occ
urre
nce

146
document belongs to. The problem with word pairs was that they were too rare which
made the document vectors very sparse. Thus it was not possible to obtain a set of
columns with acceptable performance. On the contrary, the document vectors which
have single terms or the combination of single terms and pairs proved to be
acknowledged in large numbers by created columns.

147
Appendix B Affect of Word Stemming on Document Classification This set of experiments was carried out to examine the effect on classification and
pattern discovery when stemming was used in selecting features (words). Here the RA
model is used with all the extensions proposed in chapter 6 including the extensions
for feature intensity recognition and for discarding too specific and spurious columns.
The selected data set consists of a set of randomly selected news articles from the
Foreign Broadcasting Services (FBIS), Financial Times and the LA Times, from the
TREC CD-4 and CD-5 corpora. As reported in Section 5.4.1, the documents were
selected from ten categories that contained a larger number of samples. The nominal
codes representing the ten selected topics were: 401, 412, 415, 422, 424, 425, 426,
434, 436 and 450. These topics as given in the TREC relevance judgment information
are: 401 – foreign minorities in Germany, 412 – airport security, 415 – drugs and the
golden triangle, 422 – art, stolen, forged, 424 – suicides, 425 – counterfeiting money,
426 – dogs, law enforcement, 434 – economy in Estonia, 436 – railway accidents, 450
– King Hussein and peace.
B.1 Formation of the Input Space Features representing the topics in the document corpus were chosen applying the
two-step feature selection described in Section 5.3.1. Porter’s stemming algorithm
(Porter, 1980) was used to stem the words when they were being selected for the
frequency calculation. A feature set of 1,000 words was selected using 100 words
from each topic to represent the 10 topics. To accommodate information on the

148
frequency, integer vectors were formed by counting the frequency of occurrence of
each feature (stemmed word) in each document. In the document vector, the index
denotes the feature and the content indicates the frequency of occurrence of the
feature. The vectors were normalized to have a maximum feature frequency of 5.
Figure B-1 illustrates the feature density of the input data vectors after selected
features were mapped to the training set. The figure shows that the majority of input
vectors have less than 50 features though 100 features were selected from each topic.
Figure B-1 Frequency of document vectors sizes in terms of feature density
Distributions of the features in the input for each topic are illustrated in Figure
B-2. For each topic 200 files were used. It may noticeable that some features which
have high frequency of occurrence in one topic have a lower frequency in another.
However there are some features that had a high frequency of occurrence in several
categories creating some overlap. Inspection of the test data set shows that feature
distribution has considerable differences from the training set. There are some
prominent features common to many categories that were not seen in the training set.
Thus, documents in the test set have considerable noise or unexpected prominent
features.
0
20
40
60
80
100
0 50 100 150 200 250 300 350
Number of features
Freq
uenc
y of
occ
urre
nce

149
Figure B-2 Features that were selected for each group and their frequency of occurrence for the training set
412
0
100
200
300
400
1 101 201 301 401 501 601 701 801 901 1001
Features
415
0
100
200
300
400
1 101 201 301 401 501 601 701 801 901 1001
Features
422
0
100
200
300
400
1 101 201 301 401 501 601 701 801 901 1001
Features
450
0
100
200
300
400
1 101 201 301 401 501 601 701 801 901 1001
Features
425
0
100
200
300
400
1 101 201 301 401 501 601 701 801 901 1001
Features
426
0
100
200
300
400
1 101 201 301 401 501 601 701 801 901 1001
Features
434
0100200300400500600
1 101 201 301 401 501 601 701 801 901 1001
Features
436
0100200300400500600
1 101 201 301 401 501 601 701 801 901 1001
Features
401
0
100
200
300
400
1 101 201 301 401 501 601 701 801 901 1001
Features
424
0
100
200
300
400
1 101 201 301 401 501 601 701 801 901 1001
Features
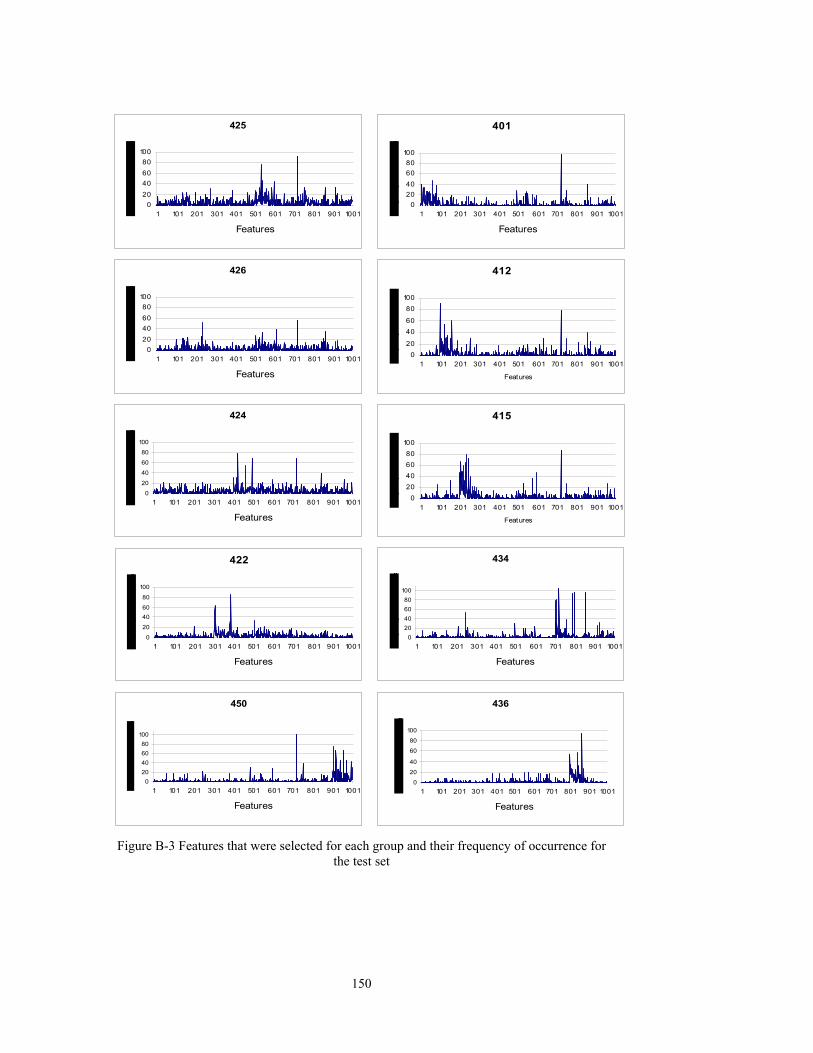
150
401
020406080
100
1 101 201 301 401 501 601 701 801 901 1001
Features
412
020
4060
80100
1 101 201 301 401 501 601 701 801 901 1001
Features
415
020406080
100
1 101 201 301 401 501 601 701 801 901 1001
Features
422
0
20
4060
80
100
1 101 201 301 401 501 601 701 801 901 1001
Features
424
0
20
40
60
80
100
1 101 201 301 401 501 601 701 801 901 1001
Features
425
020406080
100
1 101 201 301 401 501 601 701 801 901 1001
Features
426
020406080
100
1 101 201 301 401 501 601 701 801 901 1001
Features
434
020406080
100
1 101 201 301 401 501 601 701 801 901 1001
Features
436
0
20
40
60
80
100
1 101 201 301 401 501 601 701 801 901 1001
Features
450
020406080
100
1 101 201 301 401 501 601 701 801 901 1001
Features
Figure B-3 Features that were selected for each group and their frequency of occurrence for
the test set

151
B.2 Experiments Experiments were carried out with a training set comprising 2,000 document vectors
consisting of 200 vectors from each topic. Document vectors from topics that had less
than 200 vectors were duplicated once to get the minimum of 200 vectors for each
topic. The test set comprised of a new set of 500 unique document vectors, which
were not used for training or feature selection. During each wake period 100
document vectors were presented which comprised of 10 documents from each topic.
Results of three experiments (Stem1, Stem2, and Stem3) are tabulated below. As
random values are used in initialising the columns, the types of the columns and the
number of columns vary though run under same conditions.
B.3 Results
Precision as % Recall as a % Column No
Major corresponding topic/topics
Training set
Test set
Training set
Test set
1 436 88.9 90.0 72.0 72.0 2 422 91.3 91.2 73.0 62.0 3 434 100 90.2 73.0 92.0 4 450 98.2 76.8 80.0 86.0 5 401 64.1 37.7 67.0 46.0 6 415 100 84.2 70.5 64.0 7 412 90.6 100 77.5 62.0 8 422, 424 51.7 56.3 - - 9 412, 424, 425 74.6 80.4 - - Average 84.4 78.5 73.3 69.1
Table B-1 Precision and Recall for each column by the major document category identified (Experiment Stem1)
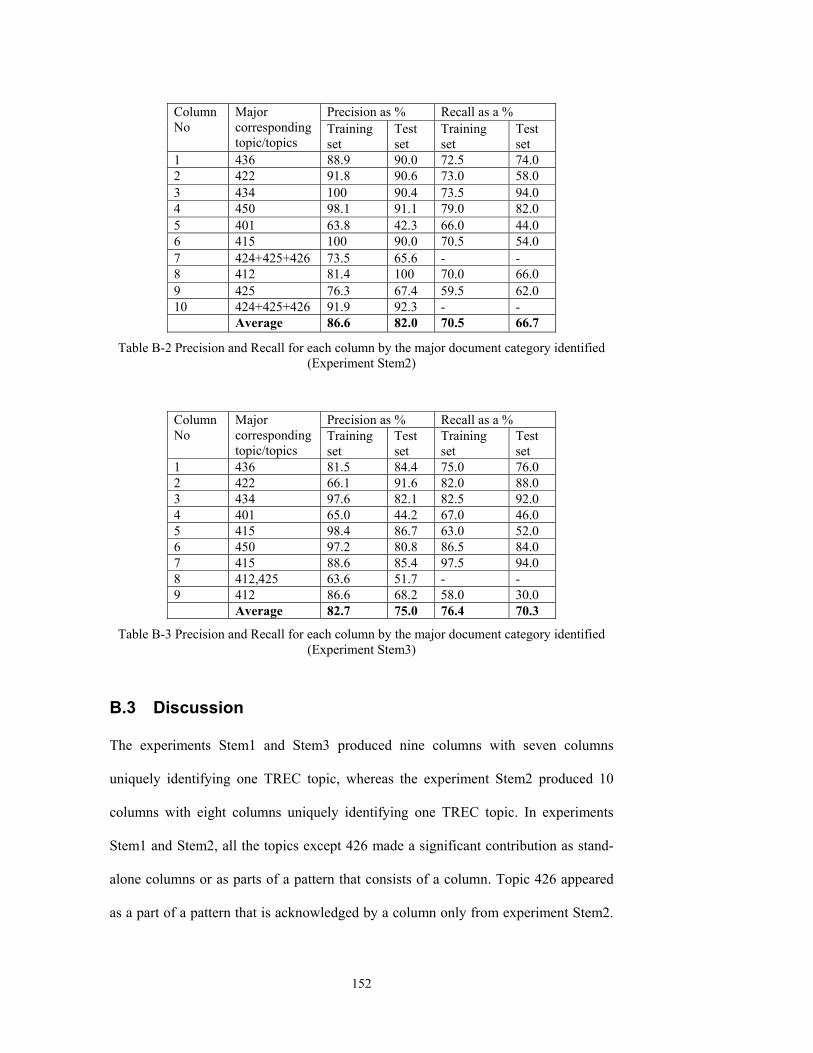
152
Precision as % Recall as a % Column No
Major corresponding topic/topics
Training set
Test set
Training set
Test set
1 436 88.9 90.0 72.5 74.0 2 422 91.8 90.6 73.0 58.0 3 434 100 90.4 73.5 94.0 4 450 98.1 91.1 79.0 82.0 5 401 63.8 42.3 66.0 44.0 6 415 100 90.0 70.5 54.0 7 424+425+426 73.5 65.6 - - 8 412 81.4 100 70.0 66.0 9 425 76.3 67.4 59.5 62.0 10 424+425+426 91.9 92.3 - - Average 86.6 82.0 70.5 66.7
Table B-2 Precision and Recall for each column by the major document category identified (Experiment Stem2)
Precision as % Recall as a % Column No
Major corresponding topic/topics
Training set
Test set
Training set
Test set
1 436 81.5 84.4 75.0 76.0 2 422 66.1 91.6 82.0 88.0 3 434 97.6 82.1 82.5 92.0 4 401 65.0 44.2 67.0 46.0 5 415 98.4 86.7 63.0 52.0 6 450 97.2 80.8 86.5 84.0 7 415 88.6 85.4 97.5 94.0 8 412,425 63.6 51.7 - - 9 412 86.6 68.2 58.0 30.0 Average 82.7 75.0 76.4 70.3
Table B-3 Precision and Recall for each column by the major document category identified (Experiment Stem3)
B.3 Discussion The experiments Stem1 and Stem3 produced nine columns with seven columns
uniquely identifying one TREC topic, whereas the experiment Stem2 produced 10
columns with eight columns uniquely identifying one TREC topic. In experiments
Stem1 and Stem2, all the topics except 426 made a significant contribution as stand-
alone columns or as parts of a pattern that consists of a column. Topic 426 appeared
as a part of a pattern that is acknowledged by a column only from experiment Stem2.
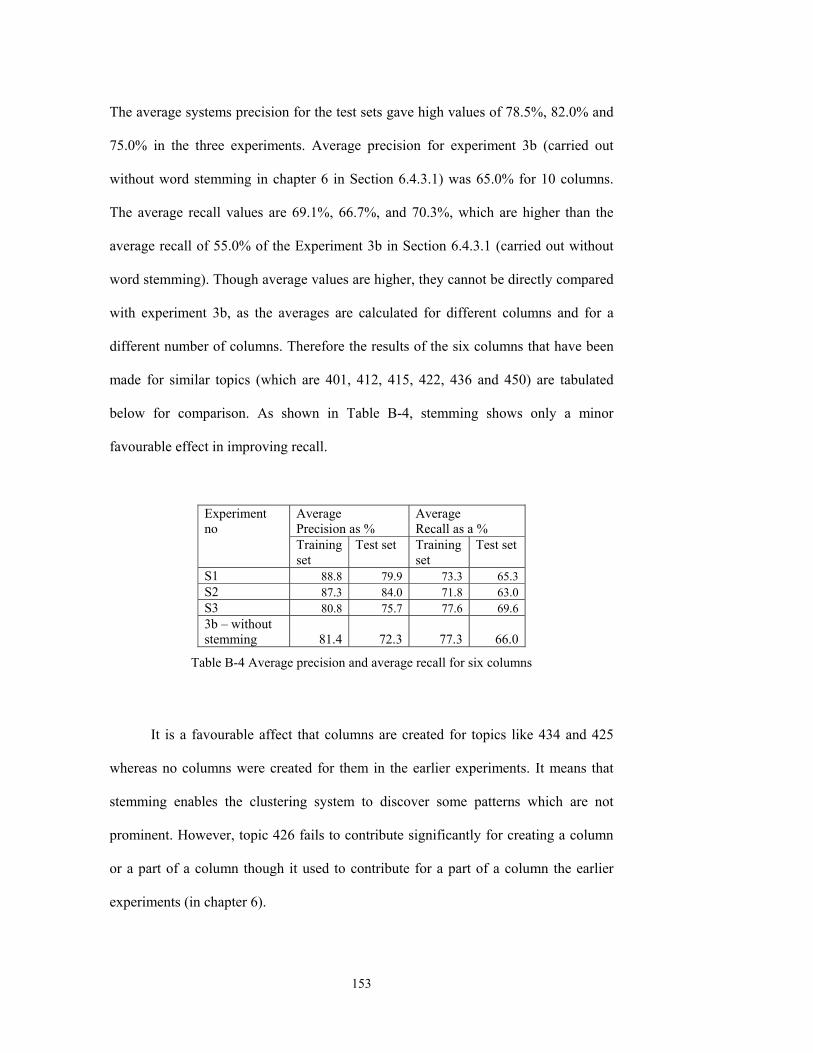
153
The average systems precision for the test sets gave high values of 78.5%, 82.0% and
75.0% in the three experiments. Average precision for experiment 3b (carried out
without word stemming in chapter 6 in Section 6.4.3.1) was 65.0% for 10 columns.
The average recall values are 69.1%, 66.7%, and 70.3%, which are higher than the
average recall of 55.0% of the Experiment 3b in Section 6.4.3.1 (carried out without
word stemming). Though average values are higher, they cannot be directly compared
with experiment 3b, as the averages are calculated for different columns and for a
different number of columns. Therefore the results of the six columns that have been
made for similar topics (which are 401, 412, 415, 422, 436 and 450) are tabulated
below for comparison. As shown in Table B-4, stemming shows only a minor
favourable effect in improving recall.
Average Precision as %
Average Recall as a %
Experiment no
Training set
Test set Training set
Test set
S1 88.8 79.9 73.3 65.3 S2 87.3 84.0 71.8 63.0 S3 80.8 75.7 77.6 69.6 3b – without stemming
81.4
72.3
77.3
66.0
Table B-4 Average precision and average recall for six columns
It is a favourable affect that columns are created for topics like 434 and 425
whereas no columns were created for them in the earlier experiments. It means that
stemming enables the clustering system to discover some patterns which are not
prominent. However, topic 426 fails to contribute significantly for creating a column
or a part of a column though it used to contribute for a part of a column the earlier
experiments (in chapter 6).

154
B.5 Conclusion Use of word stemming when pre-processing the feature set gives higher values for
precision and recall of some individual columns. As it lowers the recall of some
topics, the affect of word stemming on the overall performance is not very significant.
Therefore stemming is not essential for working with Recommendation Architecture.

155
REFERENCES Apte, C., Damerau, F. and Weiss, S. M. (1998) Text Mining with Decision Rules and
Decision Trees, Proceedings of the Conference on Automated Learning and Discovery, Workshop 6: Learning from Text and the Web.
Belkin, N. J. and Croft, W. B. (1987) In Annual Review of Information Science and
Technology, Vol. 22 (Ed, Williams, M. E.) Elsevier, New York, pp. 109-145. Belkin, N. J. and Croft, W. B. (1992) Information Filtering and Information
Retrieval: Two Sides of the Same Coin?, Communications of the ACM, Vol.35, 12, pp 29-38.
Bell, T. A. H. and Moffat, A. (1996) The Design of a High Performance Information
Filtering System, Proceedings of the 19th ACM-SIGIR Conference on Research and Development in Information Retrieval, Zurich, pp 12-20.
Berry, M. W., Dumais, S. T. and Shippy, A. T. (1995) A Case Study of Latent
Semantic Indexing, Computer Science Department, University of Tennessee, Knoxville, USA.
Calvo, R. A. (2001) Classifying Financial News with Neural Networks, Proceedings
of the 6th Australasian Document Computing Symposium, Coffs Harbour, Australia.
Carpenter, G. and Grossberg, S. (1987) Invariant Pattern Recognition and Recall by
an Attentive Self-organizing ART Architecture in a Nonstationary World, Neural Networks, Vol.2, pp 737-745.
Carpenter, G. A., Grossberg, S. and Reynolds, J. (1991b) ARTMAP: A Self-
Organizing Neural Network Architecture for Fast Supervised Learning and Pattern Recognition, Proceedings of the International Joint Conference on Neural Networks, Seattle, pp 863-868.
Carpenter, G. A., Milenova, B. L. and Noeske, B. W. (1998) Distributed ARTMAP: a
Neural Network for Fast Distributed Supervised Learning, Neural Networks, Vol.11, pp 793-813.
Carroll, R., Dupont, L. J. and Peters, M. S. (1995) Much Ado About Nothing -
Information Retrieval, http://www.cs.utk.edu/~cs494/labs/hall_of_fame/lab6/group5.html.
Chudler, E. H. (2003) Explore the Brain and Spinal Cord,
http://faculty.washington.edu/chudler/introb.html. Coward, L. A. (1990) Pattern Thinking, Praeger, New York.

156
Coward, L. A. (1997) In Biological and Artificial Computation: from Neuroscience to Technology (Eds, Mira, J., Morenzo-Diaz, R. and Cabestanz, J.) Springer, Berlin, pp 634-43.
Coward, L. A. (2000) A Functional Architecture Approach to Neural System,
International Journal of Systems Research and Information System, pp 69-120.
Coward, L. A. (2001a) The Recommendation Architecture: Lessons from Large-Scale
Electronic Systems Applied to Cognition, Cognitive Systems Research, Vol.2, 2 pp 115-156.
Coward, L. A., Gedeon, T. D. and Kenworthy, W. (2001b) Application of the
Recommendation Architecture for Telecommunications Network Management, International Journal of Neural Systems, Vol.11, 4 pp 323-327.
Coward, L. A., Gedeon, T. D. and Ratnayake, U. (2003) Approaches to Learning
Complex Combinations of Functions, IEEE Transactions on Neural Networks, (under review).
Croft, W. B., Turtle, H. R. and Lewis, D. D. (1991) The Use of Phrases and
Structured Queries in Information Retrieval, Proceedings of the Fourteenth Annual International ACM/SIGIR Conference on Research and Development in Information Retrieval, Chicago, Illinois, United States, pp 32-45.
Dinerstein, J., Dinerstein, N. and Garis, H. d. (2003) Automatic Multi-Module Neural
Network Evolution in an Artificial Brain, NASA/DoD Conf. on Evolvable Hardware, Chicago, Illinois, USA.
Dittenbach, M., Merkel, D. and Rauber, A. (2000b) Using Growing Hierarchical Self-
Organizing Maps for Document Classification, Proceedings of the European Symposium on Artificial Neural Networks (ESANN '2000), Belgium, pp 7-12.
Dittenbach, M., Merkel, D. and Rauber, A. (2002) Organizing and Exploring High-
Dimensional data with the Growing Hierarchical Self-Organizing Map, Proceedings of the 9th International Conference on Neural Information Processing (ICONIP 2002), Singapore.
Dittenbach, M., Merkl, D. and Rauber, A. (2000a) The Growing Hierarchical Self-
Organizing Map, Int'l Joint Conference on Neural Networks (IJCNN'2000), Como, Italy, pp 24-27.
Dumais, S., Landauer, T. K. and Littman, M. L. (1996) Automatic Cross-Linguistic
Information Retrieval Using Latent Semantic Indexing, Proceedings of the ACM SIGIR '96 Workshop on Cross-Linguistic Information Retrieval, Zurich, Switzerland.
Dumais, S., Platt, J., Heckerman, D. and Sahami, M. (1998) Inductive Learning
Algorithms and Representations for Text Categorization, Proceedings of the

157
ACM 7th International Conference on Information and Knowledge Management, pp 148-155, Bethesda, Maryland, USA.
Edelman, G. (1992) Bright Air, Brilliant Fire: On the Matter of the Mind, Basic
Books, New York. Edelman, G. M. and Mountcastle, V. B. (1978) In The Mindful Brain, The MIT Press,
Cambridge, MA, pp. 51-100. Fagan, J. (1989) The Effectiveness of a Nonsyntatctic Approach to Automatic Phrase
Indexing for Document Retrieval, Journal of the American Society for Information Science, Vol.40, 2 pp 115-132.
Fagan, J. L. (1987) Automatic Phrase Indexing for Document Retrieval: An
Examination of Syntactic and Non-Syntactic Methods, Proceedings of the Tenth Annual International ACM SIGIR Conference on Research and Development in Information Retrieval, New Orleans, USA, pp 91-101.
Fang, Y. C., Parthasarathy, S. and Schwartz, F. (2001) Using Clustering to Boost Text
Classification, ICDM Workshop on Text Mining (Text DM'01), San Jose, CA, USA.
Fuhr, N. (2000) Models in Information Retrieval, Dortmund, Germany. Garis, H. d. (1994) The CAM-BRAIN Project : The Evolutionary Engineering of a
Billion Neuron Artificial Brain which Grows/Evolves at Electronic Speeds in a Cellular Automata Machine, International Conference on Neural Information Processing (ICONIP 1994), Seoul, Korea.
Garis, H. d. (1995) CAM-BRAIN : The Evolutionary Engineering of a Billion Neuron
Artificial Brain by 2001 which Grows/Evolves at Electronic Speeds inside a Cellular Automata Machine (CAM), International Conference on Artificial Neural Networks and Genetic Algorithms (ICANNGA95), Ales, France.
Garis, H. d. (2003) Home page of Prof. De Garis, http://www.cs.usu.edu/~degaris. Harman, D. (1991) How Effective is Suffixing?, Journal of the American Society for
Information Science, Vol.42, 1 pp 7-15. Hearst, M. A. and Pedersen, J. O. (1996) Re-examining the Cluster Hypothesis:
Scatter/Gather on Retrieval Results, Proceedings of the 19th Annual International ACM SIGIR Conference on Research and Development in Information Retrieval, Zurich, Switzerland, pp 76 - 84.
Heeger, D., Gabrieli, J. and Wandell, B. (2003) Psych 202: Neuroscience,
http://white.stanford.edu/~heeger/psych202/lecture-notes/visual-cortex/visual-cortex.html.

158
Honkela, T., Kaski, S., Lagus, K. and Kohonen, T. (1997) WEBSOM - Self-Organizing Maps of Document Collections, Proceedings of the Workshop on Self-Organizing Maps (WSOM'97), Finland.
Hotho, A., Staab, S. and Maedche, A. (2001) Ontology-based Text Clustering, IJCAI-
01 Workshop on Text Learning: Beyond Supervision, Seattle, Washington. Huang, J., Liu, C. and Wechsler, H. (1998) Eye Detection and Face Recognition
Using Evolutionary Computation, Proceedings of NATO-ASI on Face Recognition: From Theory to Applications, pp 348-377.
Iwayama, M. (2000) Relevance Feedback with a Small Number of Relevance
Judgements: Incremental Relevance Feedback vs. Document Clustering, Proceedings of the 23rd Annual International ACM SIGIR Conference on Research and Development in Information Retrieval 2000, Athens, Greece, pp 10-16.
Iwayama, M. and Tokunaga, T. (1995) Cluster-Based Text Categorization: A
Comparison of Category Search Strategies, Proceedings of the 18th Annual International ACM SIGIR Conference on Research and Development in Information Retrieval, Seattle, Washington, United States, pp 273 - 280.
Järvelin, K. and Kekäläinen, J. (2000) IR Evaluation Methods for Retrieving Highly
Relevant Documents, Proceedings of the 23rd Annual International ACM SIGIR Conference on Research and Development in Information Retrieval, Athens, Greece, pp 41 - 48.
Kasabov, N. (2001a) Evolving Fuzzy Neural Networks for Supervised/Unsupervised
Online Knowledge-Based Learning, IEEE Transactions on Systems, Man, and Cybernetics - Part B, Vol.31, 6 pp 902-918.
Kasabov, N., Kim, J., Kozma, R. and Cohen, T. (2001) Rule Extraction from Fuzzy
Neural Networks FuNN: A Method and Real-World Application, Journal of Advanced Computational Intelligence, Vol.5, 4 pp 193-200.
Kasabov, N. K. (2002) DENFIS: Dynamic Evolving Neural-Fuzzy Inference System
and Its Application for Time-Series Prediction, IEEE Transactions on Fuzzy Systems, Vol.10, 2 pp 144-154.
Kohonen, T., Kaski, S., Lagus, K. and Honkela, T. (1996) Very Large Two-Level
SOM for the Browsing of Newsgroups, Proceedings of the International Conference on Artificial Neutral Networks (ICANN '96), Germany.
Kohonen, T., Kaski, S., Lagus, K., Salojärvi, J., Paatero, V. and Saarela, A. (2000)
Self Organization of a Massive Document Collection, IEEE Transactions on Neural Networks, Special Issue on Neural Networks for Data Mining and Knowledge Discovery, pp 574-585.

159
Koller, D. and Sahami, M. (1996) Toward Optimal Feature Selection, The proceedings of the International Conference on Machine Learning, pp 284-292.
Kretser, O. d. and Moffat, A. (1999) Effective Document Presentation with a Locality-
Based Similarity Heuristic, Proceedings of the 22nd Annual International ACM SIGIR Conference on Research and Development in Information Retrieval, San Fransisco, pp 113-120.
Lagus, K. (1998) Generalizability of the WEBSOM Method to Document Collections
of Various Types, Proceedings of 6th European Congress on Intelligent techniques and Soft Computing (EUFIT’98), Aachen, Germany, pp 210-214.
Lagus, K. (2000) Text Mining with the WebSOM, Dept. of Computer Science and
Technology Helsinki, (Ph.D. Thesis). Lam, W., Ruiz, M. and Srinivasan, P. (1999) Automatic Text Categorization and Its
Application to Text Retrieval, IEEE Transactions on Knowledge and Data Engineering, Vol.11, 6 pp 865-879.
Letsche, T. A. and Berry, M. W. (1997) Large-Scale Information Retrieval with
Latent Semantic Indexing, Information Sciences - Applications, Vol.100, pp 105-137.
Lewis, D. D. (1992) An Evaluation of Phrasal and Clustered Representations on a
Text Categorization Task, Proceedings of SIGIR-92, 15th ACM International Conference on Research and Development in Information Retreival, Kobenhavn, DK, pp 37-50.
LSI (2003) Telcordia Latent Semantic Indexing Software (LSI): Beyond keyword
Retrieval, http://lsi.research.telcordia.com/lsi/papers/execsum.html. Maltz, D. A. (1994) Distributing Information for Collaborative Filtering on Usenet
Net News, Massachusetts Institute of Technology, Cambridge, MA, USA, (Technical Report).
Mannila, H. (1996) Data Mining: Machine Learning, Statistics, and Databases, 8th
International Conference on Scientific and Statistcal Database Management, Sweden, pp 1-8.
Mehnert, R. (1997) In Browker Ann: Library and Book Trade Almanac, pp. 110-115. Merkl, D. (1999) In Kohonen Maps (Eds, Oja, E. and Kaski, S.) Elsevier, Amsterdam,
The Netherlands. Merkl, D. and Rauber, A. (2000) In Soft Computing in Information Retrieval:
Techniques and Applications (Eds, Crestani, F. and Pasi, G.) Physica Verlag, Heidelberg, Germany, pp. 102-121.
Mitchell, T. M. (1997) Machine Learning, Mc Graw-Hill, New York.

160
Molavi, D. W. (2003) Basal Ganglia and Cerebellum, Neuroscience,
http://thalamus.wustl.edu/course/cerebell.html. Mukhopadhyay, S., Mostafa, J., Palakal, M., Lam, W., Xue, L. and Hudli, A. (1996)
An Adaptive Multi-level Information Filtering System, Proceedings of the 5th International Conference on User Modeling, Kona, HI, USA, pp 21-28.
Pattee, H. H. (2002) The Origins of Michael Conrads Research Programs (1964-
1979), BioSystems, Vol.64, pp 5-11. Porter (1980) An Algorithm for Suffix Stripping, Program, Vol.14, 3 pp 130-137. Ratnayake, U. and Gedeon, T. D. (2002a) Application of the Recommendation
Architecture Model for Document Classification, Proceedings of the 2nd WSEAS International Conference on Scientific Computation and Soft Computing, Crete, pp 326-331.
Ratnayake, U. and Gedeon, T. D. (2002b) Application of the Recommendation
Architecture Model for Discovering Associative Similarities in Text, Proceedings of the 9th International Conference on Neural Information Processing (ICONIP 2002), Singapore, pp 2059-2063.
Ratnayake, U. and Gedeon, T. D. (2002c) Extending The Recommendation
Architecture Model For Effective Text Classification, Proceedings of The Sixth Australia-Japan Joint Workshop on Intelligent and Evolutionary Systems, Canberra, Australia, pp 185-191.
Ratnayake, U. and Gedeon, T. D. (2003a) Extending the Recommendation
Architecture for Text Mining, International Journal of Knowledge-Based Intelligent Engineering Systems, Vol.7, 3 pp 139-148.
Ratnayake, U., Gedeon, T. D. and Wickramarachchi, N. (2002d) Document
Classification with the Recommendation Architecture: Extensions for Feature Intensity Recognition and Column Labelling, Proceedings of the 7th Australasian Document Computing Symposium, Sydney, Australia, pp 31-37.
Rauber, A. (1999) LabelSOM: On the Labeling of Self-Organizing Maps, Proceedings
of the International Joint Conference on Neural Networks (IJCNN'99), Washington, DC.
Rauber, A., Dittenbach, M. and Merkel, D. (2000a) Automatically Detecting and
Organizing Documents into Topic Hierarchies: A Neural-Network Based Approach to Bookshelf Creation and Arrangements, European Conference on Research and Development for Digital Libraries (ECDL'00), Lisboa, Portugal.
Rauber, A. and Merkel, D. (1999) Mining Text Archives: Creating Readable Maps to
Structure and Describe Document Collections, Proceedings of the Principles of Data Mining and Knowledge Discovery, Third European Conference (PKDD '99), Prague, Czech Republic.

161
Rauber, A., Schweighofer, E. and Merkl, D. (2000b) Text Classification and
Labelling of Document Clusters with Self-Organising Maps, Journal of the Austrian Society for Artificial Intelligence (ÖGAI), Vol.13, 3 pp 17-23.
Reeke, G. N. (1997) In Handbook of Evolutionary Computation, Oxford University
Press. Riloff, E. (1995) Little Words Can Make a Big Difference for Text Classification,
Proceedings of the 18th annual international ACM SIGIR Conference on Research and Development in Information Retrieval, Seattle, Washington, United States, pp 130-136.
Salton, G. (1989) Automatic Text Processing: the Transformation, Analysis, and
Retrieval of Information by Computer, Addison-Wesley. Salton, G. and Lesk, M. E. (1968) Computer Evaluation of Indexing and Text
Processing, Journal of the ACM, Vol.15, 1 pp 8-36. Saracevic, T. (1995) Evaluation of Evaluation in Information Retrieval, Proceedings
of the 18th Annual International ACM SIGIR Conference on Research and Development in Information Retrieval, Seattle, Washington, United States, pp 138 - 146.
Sebastiani, F. (1999) A Tutorial on Automated Text Categarisation, Proceedings of
{ASAI}-99, 1st Argentinian Symposium on Artificial Intelligence, Buenos Aires, AR, pp 7-35.
Segovia-Juarez, J. L. and Colombano, S. (2001) Mutation Buffering Capabilities of
the Hypernetwork Model, The Third NASA/DoD Workshop on Evolvable Hardware, Long Beach, Cailfornia.
SIFTER (2002), Smart Information Filtering Technology for Electronic Resources,
http://sifter.indiana.edu/pubs.shtml. Squire, L. R. (2003) Memory, Human Neuropsychology,
http://cognet.mit.edu/MITECS/Articles/squire.html. Stricker, M., Vichot, F., Dreyfus, G. and Wolinski, F. (1999) Two-Step Feature
Selection and Neural Classification for the TREC-8 Routing, Proceedings of the 8th Text Retrieval Conference (TREC 8).
Tan, A. (2001) Predictive Self-Organizing Networks for Text Categorization,
Proceedings of PAKDD-01, 5th Pacific-Asia Conference on Knowledge Discovery and Data Mining, pp 66-77.
TREC (2003) Text REtrieval Conference (TREC), Data collection,
http://trec.nist.gov/data/docs_eng.html.

162
Tronia, G. and Walker, N. (1996) Document Classification and Searching - A Neural Network Approach, Frascati, Italy.
Tufis, D., Popescu, C. and Rosu, R. (2000) Automatic Classification of Document
Random Sampling, Proceedings of the Romanian Academy Series A, Vol.1, 2 pp 117-127.
Vogt, P. (1997) A Perceptual Grounded Self-Organising Lexicon in Robotic Agents,
Cognitive Science and Engineering Netherlands, (M.Sc. Thesis). Wang, B. B., McKay, R. I., Abbass, H. A. and Barlow, M. (2002) Domain Ontology
Guided Feature-Selection for Document Categorization, Australian Journal of Intelligent Information Processing Systems.
Weiss, G. (1994) Neural Networks and Evolutionary Computation. Part II: Hybrid
Approaches in the Neurosciences, Proceedings of the IEEE International Conference on Evolutionary Computation, Vol.1, pp 273-277.
Wood, S. and Gedeon, T. D. (2001) A Hybrid Neural Network for Automated
Classification, Proceedings of the 6th Australasian Document Computing Symposium, Coffs Harbour, Australia.
Yan, T. W. and Garcia-Molina, H. (1994) Index Structures for Information Filtering
Under the Vector Space Model, Proceedings of the 10th IEEE International Conference on Data Engineering, Houston, pp 337-347.
Yang, J. and Honavar, V. (1998) Feature Subset Selection Using a Genetic Algorithm,
IEEE Intelligent Systems, pp 44-48. Yang, Y. (1994) Expert Network: Effective and Efficient Learning From Human
Decisions in Text Categorization and Retrieval, Proceedings of the 17th Annual International ACM SIGIR Conference on Research and Development in Information Retrieval (SIGIR '94).
Yang, Y. and Liu, X. (1999) A Re-examination of Text Categorization Methods,
Proceedings of the 22nd Annual International ACM SIGIR Conference on Research and Development in Information Retrieval (SIGIR '99), California, USA, pp 42-49.
Yang, Y. and Pedersen, J. O. (1997) A Comparetive Study on Feature Selection in
Text Categorization, ICML '97, pp 412-420. Ye, H. and Liu, H. (2002) A SOM-Based Method for Feature Selection, Proceedings
of the 9th International Conference on Neural Information Processing (ICONIP 2002), Singapore, pp 1295-1299.
Zha, H. (1998) A Subspace-Based Model for Information Retrieval with Applications
in Latent Semantic Indexing, Department of Computer Science and Engineering, Pennsylvania State University (Technical Report).

163
Zhao, Y. and Karypis, G. (2002) Criterion Functions for Document Clustering, Experiments and Analysis, University of Minnesota, Army HPC Research Center, Minneapolis, pp. 1-40 (Technical Report).

164
BIBLIOGRAPHY Batty, P. C. (1999) Mathematical Symbols,
http://www.maths.ox.ac.uk/teaching/study-guide/symbols.html. Coward, L. A. (1999a) A Physiologically Based Approach to Consciousness, New
Ideas in Psychology, Vol.17, 3 pp 271-290. Coward, L. A. (1999b) A Physiologically Based Theory of Conciousness, Modelling
Consciousness Across the Disciplines (Ed, Jordan, S.), pp. 113-178. Enderton, H. B. (1977) Elements of Set Theory, Academic Press, Inc., New York. Iwayama, M. and Tokunaga, T. (1995) Cluster-Based Text Categorization: A
Comparison of Category Search Strategies, Proceedings of the 18th Annual International ACM SIGIR Conference on Research and Development in Information Retrieval, Seattle, Washington, United States, pp 273 - 280.
Peltonen, J., Sinkkonen, J. and Kaski, S. (2002) Discriminative Clustering of Text
Documents, Proceedings of the 9th International Conference on Neural Information Processing (ICONIP 2002), Singapore, pp 1956-1960.
Shanahan, J. (2001) Modelling with Words: an Approach to Text Categorization,
Proceedings of the IEEE International Fuzzy Systems Conference, Melbourne, Australia.
Soni, D., Nord, R. L. and Hofmeister, C. (1995) Software Architecture in Industrial
Applications, Proceedings of the 17th International Conference in Software Engineering (ICSE '95), Seattle, USA, pp 196-207.
Taylor, J. G. and Alavi, F. N. (1993) Mathematical Analysis of a Competitive Network
for Attention, Mathematical Approaches to Neural Networks (Ed, Taylor, J. G.) Elsevier, London, pp. 341-381.

165