Embed Size (px)
Citation preview

APPLICATION OF THE CLUSTER VARIATION
METHOD TO INTERSTITIAL SOLID SOLUTIONS
Marjon Indra PEKELHARING


APPLICATION OF THE CLUSTER VARIATION
METHOD TO INTERSTITIAL SOLID SOLUTIONS
Proefschrift
ter verkrijging van de graad van doctor
aan de Technische Universiteit Delft,
op gezag van de Rector Magnificus prof. dr. ir. J.T. Fokkema,
voorzitter van het College voor Promoties,
in het openbaar te verdedigen
op dinsdag 8 januari 2008 om 10.00 uur
door
Marjon Indra PEKELHARING
Doctorandus in de Geochemie, Universiteit Utrecht
geboren te Zevenaar

Dit proefschrift is goedgekeurd door de promotor:
Prof. dr. B.J. Thijsse
Toegevoegd promotor:
Dr. A.J. Böttger
Samenstelling promotiecommissie:
Rector Magnificus, voorzitter
Prof. dr. B.J. Thijsse, Technische Universiteit Delft, promotor
Dr. A.J. Böttger, Technische Universiteit Delft, toegevoegd promotor
Prof. J. Foct, Université de Lille
Prof. dr. ir. M.A.J. Somers, Technical University of Denmark
Prof. dr. R. Boom, Technische Universiteit Delft
Prof. dr. ir. S. van der Zwaag, Technische Universiteit Delft
Dr. ir. B.J. Kooi, Rijksuniversiteit Groningen
This work is part of the research programme of the 'Stichting voor Fundamenteel
Onderzoek der Materie (FOM)', which is financially supported by the 'Nederlandse
Organisatie voor Wetenschappelijk Onderzoek (NWO)'.
ISBN 978-90-8559-304-1

i
CONTENTS
1 GENERAL INTRODUCTION.............................................................................1
1.1. INTRODUCTION.......................................................................................................... 2
1.2. ORDERING OF INTERSTITIALS IN IRON NITRIDES............................................. 3
1.3. THE CLUSTER VARIATION METHOD..................................................................... 6
1.4. OUTLINE OF THIS THESIS ........................................................................................ 7
2 MODELING THERMODYNAMICS OF Fe-N PHASES:
CHARACTERIZATION OF ε-Fe2N1-z ..............................................................13
2.1. INTRODUCTION........................................................................................................ 14
2.2. EXPERIMENTAL PROCEDURES............................................................................. 16
2.2.1. SPECIMEN PREPARATION............................................................................... 16
2.2.2. MÖSSBAUER SPECTROSCOPY ....................................................................... 16
2.2.3. X-RAY DIFFRACTION ....................................................................................... 17
2.3. RESULTS AND DISCUSSION................................................................................... 18
2.3.1. THERMODYNAMICS OF ε-Fe2N1-z; THE NITROGEN ABSORPTION
ISOTHERM........................................................................................................... 18
2.3.2. MÖSSBAUER SPECTROSCOPY ....................................................................... 20
2.3.3. X-RAY DIFFRACTION ....................................................................................... 23
2.4. CONCLUSIONS .......................................................................................................... 25
3 APPLICATION OF THE CLUSTER VARIATION METHOD TO
ORDERING IN AN INTERSTITIAL SOLUTION; THE γ-Fe[N] / γ'-
Fe4N1-x EQUILIBRIUM ......................................................................................27
3.1. INTRODUCTION........................................................................................................ 28
3.2. DESCRIPTION OF LRO AND SRO OF INTERSTITIALS BY THE
CLUSTER VARIATION METHOD (CVM)............................................................... 29
3.2.1. APPLICATION TO AN INTERSTITIAL SOLID SOLUTION........................... 29
3.2.2. THERMODYNAMICS OF γ-Fe[N] AND γ'-Fe4N1-x ........................................... 30
3.2.3. CALCULATION OF PHASE EQUILIBRIA ....................................................... 34

ii
3.2.4. APPLICATION TO THE γ-Fe[N] / γ'-Fe4N1-x MISCIBILITY GAP.................... 37
3.3. DISCUSSION............................................................................................................... 40
3.3.1. LATTICE PARAMETERS OF THE FCC Fe-N PHASES................................... 40
3.3.2. THE γ-Fe[N] / γ'-Fe4N1-x MISCIBILITY GAP ..................................................... 41
3.3.3. ORDERING OF NITROGEN ATOMS IN γ-Fe[N] AND γ'-Fe4N1-x ................... 42
3.4. CONCLUSIONS .......................................................................................................... 48
4 APPLICATION OF THE CLUSTER VARIATION METHOD TO
AN INTERSTITIAL SOLID SOLUTION: THE γ'-Fe4N1-x / ε-Fe2N1-z
EQUILIBRIUM ...................................................................................................55
4.1. INTRODUCTION........................................................................................................ 56
4.2. THERMODYNAMICS OF γ'-Fe4N1-x.......................................................................... 57
4.2.1. CONFIGURATIONAL ENTROPY...................................................................... 58
4.2.2. INTERNAL ENERGY.......................................................................................... 59
4.2.3. INTERSTITIAL INTERACTIONS IN γ'-Fe4N1-x................................................. 60
4.3. THERMODYNAMICS OF ε-Fe2N1-z........................................................................... 60
4.3.1. CONFIGURATIONAL ENTROPY...................................................................... 62
4.3.2. INTERNAL ENERGY.......................................................................................... 63
4.3.3. INTERSTITIAL INTERACTIONS IN ε-Fe2N1-z.................................................. 64
4.4. THE CALCULATION OF THE γ'-Fe4N1-x / ε-Fe2N1-z EQUILIBRIUM ..................... 66
4.4.1. CALCULATION OF PHASE EQUILIBRIA USING THE CVM ....................... 67
4.5. DISCUSSION............................................................................................................... 69
4.5.1. THE γ'-Fe4N1-x / ε-Fe2N1-z PHASE EQUILIBRIA............................................... 70
4.5.2. ORDERING OF NITROGEN ATOMS IN γ'-Fe4N1-x........................................... 72
4.5.3. ORDERING OF NITROGEN ATOMS IN ε-Fe2N1-z ........................................... 73
4.5.4. COMPARISON WITH MÖSSBAUER DATA .................................................... 77
4.5.5. LATTICE PARAMETERS ................................................................................... 80
4.6. CONCLUSIONS .......................................................................................................... 82
5 APPLICATION OF THE CVM CUBE APPROXIMATION TO FCC
INTERSTITIAL ALLOYS .................................................................................85
5.1. INTRODUCTION........................................................................................................ 86
5.2. CVM CUBE APPROXIMATION................................................................................ 87

iii
5.2.1. INTERNAL ENERGY.......................................................................................... 88
5.2.2. CONFIGURATIONAL ENTROPY...................................................................... 90
5.2.3. CALCULATION OF PHASE EQUILIBRIA ....................................................... 91
5.3. APPLICATION TO FCC INTERSTITIAL ALLOY PHASE EQUILIBRIA.............. 93
5.3.1. PAIR DISTRIBUTION VARIABLES.................................................................. 95
5.3.2. CUBE DISTRIBUTION VARIABLES ................................................................ 98
5.4. CONCLUSIONS ........................................................................................................ 106
6 PHASE TRANSFORMATIONS AND PHASE EQUILIBRIA IN THE
IRON-NITROGEN SYSTEM AT TEMPERATURES BELOW 573 K ......109
6.1. INTRODUCTION...................................................................................................... 110
6.2. EXPERIMENTAL PROCEDURES........................................................................... 111
6.3. RESULTS AND DISCUSSION................................................................................. 113
6.3.1. AS-PREPARED CONDITION ........................................................................... 113
6.3.2. PHASE TRANSFORMATIONS IN ε-PHASE SPECIMENS............................ 118
6.3.3. PHASE TRANSFORMATIONS OF γ' SPECIMENS (GROUP B) ................... 131
6.3.4. PHASE TRANSFORMATION OF THE γ SPECIMEN (GROUP C)................ 133
6.3.5. PHASE TRANSFORMATION OF γ + ε TWO PHASE SPECIMENS
(GROUP D)......................................................................................................... 138
6.4. GENERAL DISCUSSION ......................................................................................... 142
6.5. CONCLUSIONS ........................................................................................................ 145
SUMMARY ..............................................................................................................149
SAMENVATTING ..................................................................................................153
LIST OF PUBLICATIONS ....................................................................................157
DANKWOORD........................................................................................................159
CURRICULUM VITAE..........................................................................................160


1
1
GENERAL INTRODUCTION

Chapter 1
2
1.1. INTRODUCTION
Nitrogen, carbon, boron, and hydrogen are among the lightest elements in the periodic
table and have a small enough size to fit in the interstitial spaces formed by the close-
packed structure of metals. This property is put to use in gas separation technology as
well as in processes intended to change the properties of materials.
The capability of certain metal alloys to absorb interstitial atoms forms the
basis of thermochemical treatments like nitriding, carburizing, and boriding, which
are widely applied to improve performance of steels with respect to wear, fatigue, and
corrosion[1]. Other applications include hydrogen storage, hydrogen gas separation
technology, the production of rechargeable hydride batteries[2], and the use of iron
nitrides in magnetic recording and as permanent magnets[3].
Although interstitial solid solutions such as nitrides and carbides are often
metastable, non-equilibrium phases, for the most part the kinetic decomposition
process is so slow that the materials can be applied and retained successfully at room
temperature[3]. Unfortunately, direct observation of precipitates of such phases is
complicated because of their small size, and thermodynamic calculations may provide
helpful information that cannot obtained otherwise. Knowledge of the
thermodynamics of interstitial solid solutions combined with the ability to predict
experimental thermodynamic data accurately is therefore an important tool for process
and material property optimization in industrial applications[4].
Changes in composition of interstitials in a solid solution can lead to extensive
changes in volume. The resulting microstructural deformation is, for example,
assumed to be the main mechanism of failure of palladium membranes in hydrogen
gas separation technology[5,6]. Despite durability contraints due to embrittlement upon
hydrogenation, high cost, and susceptibility of the membranes to fouling[7], future
application of palladium-based membranes looks very promising.
Besides changes in volume, order-disorder transitions can occur both on the
sublattice formed by the host matrix and on the sublattice formed by the interstitial
sites, making accurate description of the thermodynamics of the phases quite a
challenge. Hydrogen-induced ordering in Pd-alloys[8-12] has been observed, as well as
ordering transitions induced by interstitial atoms in Fe-Cr and Al-Mn based alloys[13].
Suppression of ordering on the metal sublattice after introduction of interstitial atoms
has been observed in ordered Pd7M (M = Sm, Gd) alloys of a Pt7Cu type crystal

General Introduction
3
lattice annealed in a hydrogen atmosphere (pH2 > 20 bar)[14]. In addition, the
substitution of Sm and Gd appears to strongly reduce the ability of the Pd7M alloys to
absorb hydrogen, which may be related to the preferential occupation by hydrogen of
the octahedral interstices located between nearest-neighbor Pd atoms as opposed to
interstitial spaces surrounded by interstices surrounded by both Pd and M atoms[14].
Thus, not only may the presence of interstitial atoms result in order-disorder
transitions on the host sublattice: vice versa, there are indications that the substitution
of metal atoms on the host sublattice of an alloy could also lead to ordering transitions
on the interstitial sublattice[14,15]. Including short- and/or long-range ordering, order-
disorder transformations, and the interaction between the interstitial and metal host
sublatttice in the thermodynamic description of interstitial solutions is therefore
appropriate as well as necessary.
Fig. 1.1. Face centered cubic (fcc) close packed structure with tetrahedral interstices,
located between three atoms in one layer and an atom in the layer directly above or
below; and octahedral interstices, formed by the space between three atoms in one
layer and three atoms in the layer above or below[16].
1.2. ORDERING OF INTERSTITIALS IN IRON NITRIDES
An example of a system that has been the subject of extensive study because it lays
the foundation for modeling of more complex systems common in the steel industry,
and a very suitable candidate for the purpose of studying the ordering of interstitials in
solid solutions, is the Fe-N system.

Chapter 1
4
Fig. 1.2. The Fe-N phase diagram[17,18]
Iron nitrides are metastable binary interstitial solid solutions consisting of a
metal sublattice, assumed to be fully occupied with iron atoms in a close-packed
arrangement, and an interstitial sublattice, consisting of the octahedral sites occupied
by nitrogen atoms and vacancies. The presence of the nitrogen atoms in the octahedral
interstices causes pronounced strain-induced interactions, which influences the
distribution of the nitrogen atoms (and vacancies) over the available interstitial sites[3].
The interaction between the nitrogen atoms and the metal sublattice does not favor a
random distribution of the interstitials. Depending on the nitrogen content of the
phase, the interstitial atoms may display short-range (local) ordering (SRO), which
has been reported to occur in γ-Fe[N][19,20], long-range ordering (LRO), like in
γ'-Fe4N1-x[21], or a combination of both, as has been observed in ε-Fe2N1-z
[22]. In order
to describe equilibrium phase boundaries and absorption isotherms of Fe-N phases
accurately, the ordering of the interstitial atoms needs to be taken into account.

General Introduction
5
The first models used to calculate phase equilibria that incorporated ordering
were based on (sub)regular solution models, which describe Fe-N phases as a
(sub)regular solution of stoichiometric groups of FeaNc and FeaVc (V = vacancy). This
approach is still in use[12] but remains rather limited in accuracy because LRO of the
interstitial atoms is not incorporated in the thermodynamic description[23-29].
Application of the Gorski-Bragg-Williams (GBW)[30] approach to the calculation of
phase boundaries and nitrogen absorption isotherms has proven to be more
successful[31]. However, although the GBW approach introduces LRO into the
description of the phases, SRO is not explicitly accounted for. In this thesis, the
Cluster Variation Method (CVM)[32], a cluster-based approach (described in more
detail in Section 1.3.) capable of including both LRO and SRO in the thermodynamic
description, is applied to the calculation of phase equilibria between interstitial solid
solutions such as iron nitrides.
Because of the metastability of the iron nitrogen phases, obtaining
thermodynamic properties (that are essential input parameters for the calculations)
through experiment is problematic[33,34]. In a recent study of the γ-Fe[N] / γ'-Fe4N1-x
phase equilibrium, first principles calculations were combined with the CVM. A set of
effective cluster interactions (ECIs)[35] was thus obtained, subsequently replacing the
phenomenological Lennard-Jones potential[36]. In addition, the Debye-Grüneisen
model was applied to account for the vibrational contributions to the entropy and
internal energy, giving the overall description of the free energy more of a physical
basis than the traditional CVM approach.
Another interesting issue to be addressed remained: how to handle the
interaction between the substitutional metal host sublattice and the interstitial
sublattice, which so far had been included in the parameters of the so-called effective
pair potentials, which mimic the host-interstitial interaction through an effective
interaction on the interstitial sublattice. An innovative approach, coupling the host
sublattice with the interstitial sublattice and incorporating the sites of both sublattices
into the basic CVM cluster to model a hypothetical alloy, was published in 2006[37].
This model has formed the starting point for a closer study of the interactions between
the metal atoms and the interstitials of a hypothetical system in this thesis.
Application of this concept to a non-hypothetical system may provide a future helpful
tool for controlling ordering phenomena in alloys for industrial processes and design
of new materials.

Chapter 1
6
1.3. THE CLUSTER VARIATION METHOD
The cluster variation method (CVM), published in 1951 by Kikuchi[32], has been
applied, modified, and expanded for more than half a century. The main concept in
the original publication was the derivation of a configurational entropy expression, as
well as the description of the enthalpy (and thus the free energy) in terms of cluster
distribution variables[38].
A major advantage of the CVM, compared to the previously mentioned
thermodynamic models, is that both LRO and SRO can be taken into account if the
basic cluster is large enough. The choice of the basic cluster in the CVM therefore
depends on the range of interactions to be included. For the basic cluster and its
subclusters, all possible arrangements of atoms are assigned an individual cluster
distribution variable, which describes the fraction of that particular configuration per
(sub)cluster. Since basic clusters typically consist of more than two lattice points, and
therefore automatically involve multiparticle interactions, another problem that can be
avoided by using the CVM is that of lattice frustration. Lattice frustration is a
fascinating but problematic phenomenon for nearest-neighbor triangular structures, a
basic feature for both fcc and hcp structures, and refers to the impossibility of forming
three unlike atom pairs A-B simultaneously[39]. The CVM handles lattice frustration
by simply considering all possible distributions of atoms in order to minimize the
system’s free energy.
Shortly after the CVM was first introduced, an easier, systematic method to
obtain the CVM entropy expression was derived by Barker[40]. In 1967, the CVM
superposition approximation, which describes the basic cluster distribution variables
as a function of the distribution variables of its subclusters, was published[41].
Although progress was being made on the theoretical side, practical application of the
CVM remained quite limited until 1973, when the CVM was picked up by Van
Baal[42] and used to model the fcc substitutional Cu-Ag system. Since then, the CVM
has been widely applied to systems with different, more complex structures and
composition. Still, simplification of the minimization procedure was urgently needed
for larger clusters. After all, one of the main disadvantages of the CVM is the rapidly
increasing complexity of calculations with increasing basic cluster size. The number
of correlation functions necessary to describe a cluster probability distribution equals
the number of subclusters composing the basic cluster, and increases exponentially

General Introduction
7
with increasing basic cluster size[43] (and even faster for non-symmetrical clusters[44]).
To address this problem, Sanchez and de Fontaine[43] proposed a scheme to generate a
set of independent cluster variables, with the number of variables equal to the total
number of subclusters into which the basic cluster can be decomposed. A linear
correlation function and degeneracy factor (the number of indistinguishable
configurations resulting from symmetry operations applied to the cluster) are
associated with each independent cluster. The resulting set of equations to be solved
simplified the minimization of the free energy considerably for large clusters and
paved the way for further implementation of the CVM to highly complex structures
such as aluminosilicate minerals[44-46].
Another modification that has been made about a decade ago to the
conventional CVM formulation targets the local displacement of atoms. For modeling
purposes, rigidity of the lattice structure is usually assumed. In real alloys however,
alterations in atomic positional arrangement occur to accommodate local lattice
distortions, which may result from differences in size between the atoms on the
substitutional sublattice, size misfit of the interstitial atoms in the structure, thermal
vibration effects, or elastic effects[38]. Continuous Displacement[47] CVM introduces
vectors indicating the actual position of the atom with regard to its reference lattice
point, and it has been shown to significantly reduce the discrepancy between
experimental data and calculated equilibrium phase boundaries[38].
1.4. OUTLINE OF THIS THESIS
The main focus of this thesis is the use of the cluster variation method to describe the
ordering of interstitial atoms in a metal host matrix, as occurring in phases such as
iron nitrides, and comparison of the obtained results with available experimental data
to verify the validity and applicability of the model.
Chapter 2 describes long-range ordering of nitrogen on the sublattice of
octahedral interstices of the Fe sublattice of ε-Fe2N1-x by application of the Gorski-
Bragg-Williams approach. The model is fitted to experimental nitrogen absorption
data and the determined probabilities for Fe atom surroundings are verified
successfully with Mössbauer spectroscopy. Using a synchrotron source, the
occurrence of X-ray diffraction superstructure reflections is analyzed.

Chapter 1
8
In Chapter 3, the tetrahedron approximation of the Cluster Variation Method
(CVM) is applied to describe the ordering of nitrogen atoms on the fcc interstitial
sublattices of γ-Fe[N] and γ'-Fe4N1-x. A type 8-4 Lennard-Jones potential is used to
describe the strain-induced interactions caused by the misfit of the N atoms in the
interstitial octahedral sites. The γ-Fe[N] / γ'-Fe4N1-x miscibility gap, SRO and LRO of
nitrogen in γ-Fe[N] and γ'-Fe4N1-x, respectively, and lattice parameters of the γ and γ'
phases are calculated. For the first time, nitrogen distribution parameters, as
calculated by CVM, are compared directly to Mössbauer spectroscopy data for
specific surroundings of Fe atoms.
The application of the cluster variation method to establish effective
interaction potentials that describe both γ'-Fe4N1-x / ε-Fe2N1-z miscibility gaps in the
Fe-N phase diagram is described in Chapter 4. The calculated nitrogen distributions
show that LRO occurs in the γ'-Fe4N1-x phase and that SRO, as well as LRO, occurs in
the ε-Fe2N1-z phase. The calculated nitrogen distributions for the ε-Fe2N1-z, pertaining
to temperatures and concentrations at the γ' / ε phase boundaries, are compared with
available data obtained by Mössbauer spectrometry. Preferential occupation of
specific interstitial sites occurs from about 16 at.% nitrogen on; at the highest
concentration considered, about 25 at.% nitrogen, the occupation is that of Fe3N as
proposed in literature on the basis of diffraction data.
Chapter 5 describes the application of the CVM simple cube approximation to
calculate a hypothetical fcc interstitial alloy phase equilibrium. Instead of limiting the
description of the alloy to the species occupying the interstitial sublattice sites and
including the interaction with the metal sublattice in the effective pair potentials like
in the previous chapters, the basic cluster is composed of both metal and interstitial
sublattice sites. The metal sublattice is described as fully occupied by two types of
metal atoms, while the interstitial sublattice sites are filled with two interstitial
species, one representing an atomic species and the other a vacancy. The Lennard-
Jones parameters chosen to describe the interaction between the species lie within the
range typical for transition metals. Analysis of the calculated cube distribution
variables shows that phase transitions on the metal and interstitial sublattices are
coupled: ordering of interstitial species can be influenced by introduction of extra
metal species to the host matrix of the alloy, which enables purposeful adjustment or
change of the properties of a material.

General Introduction
9
Finally, in Chapter 6 the phase transformations of homogeneous Fe-N alloys
with nitrogen contents ranging from 10 to 26 at.% are investigated by means of X-ray
diffraction analysis after ageing at temperatures in the range of 373 to 473 K. It is
found that precipitation of α"-Fe16N2 below 443 K does not only occur upon ageing
of supersaturated α (ferrite) and α' (martensite), but also upon transformation of
γ'- Fe4N1-z and ε-Fe2N1-x (<20 at.% nitrogen). No α" is observed to develop upon
ageing of γ (austenite). Therefore, it is proposed that γ' is a stable phase at
temperatures down to (at least) 373K. Phase formation upon annealing at low
temperatures is apparently governed by the (difficult) nucleation and (slow) growth of
new Fe-N phases: α" forms as a precursor for α because of slow nitrogen diffusion,
and nitrogen-enriched ε develops as a precursor for γ' because of a nucleation barrier.

Chapter 1
10
REFERENCES 1. Uglov, V.V. et al., Surface and Coatings Tech., 2002, vol. 158-159, pp. 349-55
2. Org. Economic Coop. Development / Int. Energy Agency, Hydrogen Implementing Agreement,
2006, pp. 3-33
3. Coey, J.M.D., P.A.I. Smith, J. Magn. and Magn. Mat., 1999, vol. 200, pp. 405-24
4. Pekelharing, M.I., A.J. Böttger, M.A.J. Somers, and E.J. Mittemeijer, Met. Mat. Trans. A, 1999,
vol. 30A, pp. 1945-52
5. Alvarez, A-M., I.M. Robertson, and H.K. Birnbaum, Acta Mater., 2004, vol. 52(14), pp. 4161-75
6. Buxbaum, R.E., A.B. Kinney, Ind. Eng. Chem. Res., 1996, vol. 35, pp. 530-37
7. Paglieri, S.N., J.D. Way, Separation and Purification Meth., 2002, vol. 31(1), pp. 1-169
8. Flanagan, T.B., and Y. Sakamoto, Platinum Met. Rev., 1993, vol. 37, pp. 26-37
9. Lee, S.M., T.B. Flanagan, and G.H. Kim, Scr. Metall. Mater., 1994, vol. 32, pp. 827-32
10. Kumar, P., et al., J. Alloys and Comp., 1995, vol. 217, pp. 151-56
11. Flanagan, T.B., H. Noh, J. Alloys and Comp., 1995, vol. 231, pp. 1-9
12. Huang, W.H., S.M. Opalka, D. Wang, and T.B. Flanagan, Comp. Coupling of Phase Diagr. and
Thermochem., 2007, vol. 31, pp. 315-29
13. Villars, P., A. Prince, and H. Okamoto, Handbook of Ternary Alloy Phase Diagrams, vols. 3,6,8,
Metals Park, OH: ASM international, 1995.
14. Sakamoto, Y., K. Takao, and T.B. Flanagan, J. Phys Condens. Matter, 1993, vol. 5, pp. 4171-78
15. Glowacka, A., et al., Solid State Phen., 2006, vol. 112, pp. 133-39
16. Housecroft, C.E. and A. Sharpe, Inorganic Chemistry, Harlow, England: Pearson, 2001, pp. 118
17. Lehrer, E., Z. Elektrochem., 1930, vol. 37(7), pp. 460-73
18. Wriedt, H.A., N.A. Gokcen, et al., Bull. Alloy Phase Diagrams, 1987, vol. 8, pp. 355
19. McLellan, R.B. and K. Alex, Scripta Met., 1970, vol. 4, pp. 967-70
20. Fall, I. and J.-M.R. Genin, Met. Mat. Trans. A, 1996, vol. 27A, pp. 2160-77
21. Jack, K.H., Proc. Roy. Soc., 1948, vol. A195, pp. 34-55
22. Pekelharing, M.I., A.J. Böttger, and E.J. Mittemeijer, Phil. Mag., 2003, vol. 83(15), pp. 1775-96
23. Hillert, M. and M. Jarl, Met. Trans. A, 1975, vol. 6A, pp. 553-59
24. Ågren, J., Met. Trans. A, 1979, vol. 10A, pp. 1847-52
25. Kunze, J., Steel Research, 1986, vol. 57 (8), pp. 361-67
26. Kunze, J., Nitrogen and Carbon in Iron and Steels; Thermodynamics, Phys. Res., vol. 16,
Akademie Verlag, Berlin, 1990
27. Frisk, K., CALPHAD, 1987, vol. 11(2), pp. 127-34
28. Frisk, K., CALPHAD, 1991, vol. 15(1), pp. 79-106
29. Du, H., J. Phase Eq., 1993, vol. 14(6), pp. 682-93
30. Gokcen, N.A., Statistical thermodynamics of alloys, Plenum Press NY, 1986
31. Kooi, B.J. , M.A.J. Somers, E.J. Mittemeijer, Met. Mat. Trans. A, 1996, vol. 27A, pp. 1063-71
32. Kikuchi, R.A. , Phys. Rev., 1951, vol. 81, pp. 988-1003
33. Kooi, B.J. , M.A.J. Somers, E.J. Mittemeijer, Met. Mat. Trans. A, 1996, vol. 27A, pp. 1055-61
34. Somers, M.A.J., B.J. Kooi, L. Maldzinski, et al. Acta Mat., 1997, vol. 45(5), pp. 2013-25

General Introduction
11
35. De Fontaine, D. Cluster Approach to order-disorder transformations in alloys. In: Ehrenreich H.,
Turnbull D., editors. Solid State Phys., 1994, vol. 47, New York: Academic Press, pp. 33
36. Shang, S., and A.J. Böttger, Acta Mat., 2005, vol. 53, pp. 255-64
37. Nanu, D.E., Y. Deng, and A.J. Böttger, Phys Rev. B, 2006, vol. 7401(1), pp. 216-24
38. Kikuchi, R. and K. Masuda-Jindo, CALPHAD, 2002, vol. 26(1), pp. 33-54
39. Colinet, C., CALPHAD, 2002, vol. 25(4), pp. 607-23
40. Barker, J.A., Proc. Roy. Soc., 1953, vol. A216, pp. 45-56
41. Kikuchi, R.A. and S.G. Brush, J. Chem. Phys., 1967, vol. 47, pp. 195-203
42. Van Baal, C.M., Physica, 1973, vol. 64, pp. 671-86
43. Sanchez, J.M. and D. de Fontaine, Phys. Rev. B, 1978, vol. 17(7), pp. 2926-36
44. Vinograd, V.L. and A. Putnis, Am. Min., 1999, vol. 311-24
45. Burton, B., and R. Kikuchi, Phys. Chem. Minerals, 1984, vol. 11, pp. 125-31
46. Burton, B., Phys. Chem. Minerals, 1984, vol. 11, pp. 132-39
47. Kikuchi, R.A., and A. Beldjenna, Physica A, 1992, vol. 182, pp. 617-34


13
2
MODELING THERMODYNAMICS OF Fe-N PHASES:
CHARACTERIZATION OF ε-Fe2N1-z
ABSTRACT
Long-range ordering of nitrogen on the sublattice of octahedral interstices of the Fe
sublattice of ε-Fe2N1-x was described by application of the Gorski-Bragg-Williams
approach. The model was fitted to experimental nitrogen absorption data and the
determined probabilities for Fe atom surroundings were verified successfully with
Mössbauer spectroscopy. Using a synchrotron source, the occurrence of X-ray
diffraction superstructure reflections was analyzed.

Chapter 2
14
2.1. INTRODUCTION
The degree and type of ordering of interstitial atoms play a very important role in
understanding and modelling of the experimentally observed absorption isotherms
and phase diagrams of binary interstitial iron alloys. In particular, ordering of nitrogen
atoms in ε-Fe2N1-x nitrides has not yet been determined unambiguously.
In a series of publications[1-3], a very good description was obtained of the
equilibrium nitrogen content in α-Fe[N][2], γ'-Fe4N1-x [1], and ε-Fe2N1-z
[3] as a function
of the chemical potential, imposed by an NH3/H2 mixture, as well as of the phase
boundaries in the Fe-N phase diagram[2], by considering these Fe-N phases as
constituted of two interpenetrating sublattices: one for the metal atoms and one for the
interstitial nitrogen atoms. According to this approach, the metal sublattice is assumed
to be fully occupied at temperatures below the melting temperature of iron, while the
interstitial sublattice, formed by the octahedral interstices of the Fe sublattice, is
occupied by nitrogen atoms, N, and vacancies, V. The thermodynamics of an Fe-N
alloy can thus be reduced to the thermodynamics of a binary “alloy” of N and V on
the interstitial sublattice. The occurrence of long-range ordering (LRO) of nitrogen
atoms on the interstitial sublattices of γ'-Fe4N1-x [1] and ε-Fe2N1-z
[3] was accounted for
by adopting the Gorski-Bragg-Williams (GBW) approach.
The ε-Fe2N1-z phase consists of an hcp iron sublattice and a simple hexagonal
interstitial sublattice. Thermodynamic analysis of the mixing of atoms N and
vacancies V on the interstitial sublattice of ε-Fe2N1-z[4] has indicated the occurrence of
two ground-state structures: configuration A for ε-Fe2N (50 at.% N) and configuration
B for ε-Fe3N (33.3 at.% N), which correspond with proposed arrangements of
nitrogen atoms in Refs. [5] and [6] (Fig. 2.1.). Mössbauer spectroscopy has indicated
that configuration B is predominant for compositions close to Fe3N and that
configuration A is predominant for compositions close to Fe2N. For intermediate
compositions, Mössbauer results have suggested the occurrence of a two-phase region
where both configurations coexist.
Long-range ordering (LRO) of the nitrogen atoms results in the occurrence of
superstructure reflections (with respect to the hcp metal sublattice), which can be
characterized by diffraction. With each configuration (A/B), a number of specific
superstructure reflections is associated[7]. Direct experimental verification of the

Modeling Thermodynamics of Fe-N Phases: Characterization of ε-Fe2N1-z
15
Fig. 2.1. The unit cell of the hcp sublattice of Fe atoms containing one unit cell of the
hexagonal interstitial sublattice. The ground-state structures A and B of the trigonal
prism for Fe3N and Fe2N, constituted by six kinds of sites A1..C2 forming the
interstitial sublattice, are shown as well.
ordered configurations, using X-ray diffraction analysis (XRD), has only been
realized for configuration B[6,3]. Both conventional X-ray and neutron diffraction
experiments could not distinguish all characteristic reflections for configuration A[3],
possibly because of the very low intensity of the superstructure reflections in
ε-Fe2N1-z. However, atomic displacements of the Fe atoms, caused by the misfit of the
interstitial nitrogen atoms occupying the octahedral interstices, also have a strong
influence on the intensity of the reflections[8]. A preliminary calculation of the
structure factor (including displacements of iron atoms) has indicated that the
intensities of the 001 and 301 reflections, which are specific for the A
configuration and have not yet been observed, are strongly reduced by such
displacements.
In this work, a new thermodynamic analysis of the absorption isotherm at
723 K, describing the nitrogen content in ε-Fe2N1-z as a function of an imposed
chemical potential of nitrogen, is given, applying the model presented in Refs. [3] and
[4]. Furthermore, a new series of ε-Fe2N1-z samples, prepared at 723 K, has been
characterized employing Mössbauer spectroscopy, XRD, and HRPD (High Resolution
Powder Diffraction – synchrotron radiation). A very good agreement between
thermodynamic model predictions and experimental results has been obtained.

Chapter 2
16
2.2. EXPERIMENTAL PROCEDURES
2.2.1. SPECIMEN PREPARATION
A series of seven homogeneous ε-Fe2N1-z powders was prepared by gaseous nitriding
of small amounts (0.2 to 0.4 g) of pure α-Fe powder (average particle size 5 ± 3
micron; composition: <0.002 wt% Ni; <0.002 wt% Mn; <0.01 wt% Al; <0.002 wt%
Cr; <0.002 wt% Ti; <0.01 wt% W; <0.002 wt% V; 0.04 wt% Si; 0.002 wt% N; 0.221
wt% O and balance Fe). Nitriding was performed in a vertical quartz-tube furnace for
16 hours, at a temperature of 723 K in an NH3/H2 gas mixture. The inlet gases NH3
and H2 were purified and dried before mixing and entering the furnace. The ratio
NH3:H2 was adjusted by thermal gas flow controllers and chosen on the basis of the
absorption isotherm for ε-Fe2N1-z at 723 K[3], such that the nitrogen content of the
samples covers the range from 26.1 to 31.4 at.% N. Nitriding was terminated by
pulling the samples into the lock-chamber on top of the vertical furnace to achieve
relatively fast cooling. An additional sample containing 24.9 at.% N was prepared
analogously by nitriding at 843 K for 5 hours.
2.2.2. MÖSSBAUER SPECTROSCOPY
Mössbauer spectroscopy uses the resonant absorption of γ-rays by a nucleus to probe
the hyperfine splitting of nuclear energy levels and thus provides information on the
atomic environment of the nucleus. Three types of hyperfine interactions between the
nucleus and its surroundings can be discerned: 1) the isomer shift, 2) the quadrupole
splitting, and 3) the hyperfine interaction.
(1) The isomer shift (δ) can be observed due to variations in the s-electron
density at the nucleus and leads to an overall shift of the pattern. The isomer shift
should have a more or less constant value, or, when Mössbauer spectroscopy is
applied to study the local surroundings of the iron atoms in Fe-N specimens, increase
a little with increasing nitrogen content.
2) The quadrupole splitting (QS) leads to splitting of the spectrum in two lines
and arises from the coupling between the quadrupole moment of the nucleus and a
non-spherical charge distribution in its immediate vicinity.

Modeling Thermodynamics of Fe-N Phases: Characterization of ε-Fe2N1-z
17
3) The most important interaction in magnetic materials is the hyperfine
interaction, which splits the spectrum into six lines and arises from coupling between
nuclear and atomic magnetic moments.
At temperatures below the Curie temperature, Tc, the hyperfine splitting
increases. The Tc of ε-Fe2N1-z strongly decreases with increasing nitrogen content[9].
Thus, to realize an (almost) complete hyperfine splitting into the subspectra
constituting the Mössbauer spectrum of the samples, Mössbauer spectra were
recorded at 4.2 K, with a constant acceleration spectrometer using a 57Co source.
The recorded spectra were fitted to a combination of sextuplets. Each sextuplet
represents an Fe atom at the centre of a trigonal prism of the interstitial sublattice
(Fig. 2.1.), while the prism sites are occupied by a specific number of interstitial
atoms. Magnetic texture in the powder samples was assumed to be absent.
Consequently, the ratio of the relative intensities of the peaks of each sextuplet
conform to 3:2:1:1:2:3[10,11]. In each sextuplet, the individual lines are assumed to be
Voigt functions, i.e. a convolution of Lorentzian and Gaussian components. The
Lorentzian component is due to the source and the Gaussian component is due to the
sample.
2.2.3. X-RAY DIFFRACTION
A suspension of nitrided powder and ethanol was deposited onto a Si <510> single
crystal slab. An adherent thin layer of ε-Fe2N1-z on this Si substrate was obtained by
allowing sedimentation of the powder from this suspension and by subsequent
evaporation of the ethanol. A Siemens D-500 goniometer equipped with a primary
beam monochromator set to select Co Kα1 radiation was used to scan the samples
within the angular range of 20 to 85 o2θ, employing a step size of 0.05 o2θ, and a
counting time of 500 seconds/step. Additionally, five samples were analysed also at
the Synchrotron Radiation Source (SRS) in Daresbury (UK), using the high-resolution
powder diffraction equipment. A quantitative analysis of the diffracted intensities was
made to establish the types and degrees of ordering as a function of nitrogen content.
Using synchrotron radiation, the intensity of the superstructure reflections with
respect to the background is higher than for conventional X-ray diffraction because
the wavelength can be chosen to minimize absorption by the Fe matrix, thereby
enhancing the scattered intensity of the very weak superstructure reflections. The

Chapter 2
18
reflections in the HRPD spectra were fitted using a pseudo-Voigt function. The peak
positions thus obtained were used to assess the lattice parameters a and c.
2.3. RESULTS AND DISCUSSION
2.3.1. THERMODYNAMICS OF ε-Fe2N1-z; THE NITROGEN ABSORPTION
ISOTHERM
Applying the Gorski-Bragg-Williams (GBW) approximation for long-range ordered
binary solutions to the interstitial sublattice occupied by atoms N and vacancies V, the
interstitial sublattice is subdivided into six sublattices, denoted as A1, B1, …, C2 (cf.
Fig. 2.1.). The following expression can then be derived for the Gibbs energy of
ε-Fe2N1-z [3,4]:
( )
( )
( ) ( )[ ]∑=
−−++
+++++−+
++−++=
2
1
222222111111
21212100
1ln1ln61
61
62
C
Ak
kkkk
CBCABACBCABA
NP
CCBBAA
NCNNFe
yyyyRT
yyyyyyyyyyyyyW
yyyyyyyWGyGGε
(1)
where 0FeG and 0
NG are the hypothetical Gibbs energies of pure Fe with an hcp lattice
and of pure N with a simple hexagonal lattice, respectively (cf. Fig. 2.1.), yN denotes
the fractional occupancy of the N sublattice, ky represents the fractional occupancy of
sublattice k by N atoms, and WP and WC are the exchange energies within the basal
plane of the hexagonal unit cell and in the direction perpendicular to the basal plane,
respectively.
Equilibrium of ε-Fe2N1-z implies that the chemical potentials of nitrogen on
each of the six sublattices A1..C2 are equal. If the ε-Fe2N1-z phase is in equilibrium
with an NH3/H2 gas mixture, the following equation1 is obtained for the nitrogen
absorption isotherm, i.e., the nitrogen content in the solid state as a function of the
chemical potential of nitrogen imposed by the gas mixture[3]:
1 Actually, six similar equations can be obtained from Eq. (1), one for each of the sublattices A1..C2.

Modeling Thermodynamics of Fe-N Phases: Characterization of ε-Fe2N1-z
19
( ) ( )RT
Wyy
RT
Wy
y
y
r
r PCBCA
A
A
N
N 1121
1
0 1211
lnln −−+−+
−= (2)
where rN is the nitriding potential of the NH3/H2 gas mixture and rN0 is defined as
0000
23 23
ln HNHNN GGGrRT +−= (3)
with 0
3NHG and 0
2HG as the Gibbs energies of NH3 and H2[4].
The experimentally determined absorption isotherm for 723 K from Ref. [3] is
given in Fig. 2.2., where the ordinate is chosen such that a Langmuir-type absorption
isotherm for the N sublattice, with only half of all sites available for occupation,
would give a horizontal line.
Fig. 2.2. Absorption isotherm data at 723 K [3], presented as the deviation from a
Langmuir-type isotherm, vs. the occupancy of the interstitial sublattice yN. Solid and
dashed line pertain to calculated absorption isotherms, using Eq. (2) with
WC/RT = -3.5 and WP/RT = -4.0 for configurations A and B.
In Ref. [3], the thermodynamics of ε-Fe2N1-z was assessed by fitting the set of
Eq. (2) for either configuration A or configuration B to the absorption isotherm data

Chapter 2
20
over the entire experimentally covered composition range, while optimizing the
values for exchange energies WP and WC (cf. Refs. [3] and [4]). As suggested by the
Mössbauer analysis in Ref. [3], configuration B is stable for compositions near Fe3N
and configuration A is stable for compositions near Fe2N. Thus, the dominant part of
the experimental absorption isotherm data may not be ascribed exclusively to
configuration A or to configuration B. This may make separate fitting of Eq. (2) for
either configuration A or configuration B problematic. Therefore, in the present
analysis, a different procedure was utilized. For one set of WP, WC, and rN0 values, a
pair of absorption isotherms corresponding to configuration A and configuration B
was calculated such that the experimental absorption isotherm data were enveloped
(note Fig. 2.2.). Substitution of the values for WC and WP and the nitrogen-content
dependent occupancies of the sublattices A1..C2, using
∑=
=2
1
C
Ak
N
k
N yy (4)
for configurations A and B, yields the Gibbs energy functions for configuration A and
B (cf. Eq. (1)). Then, the miscibility gap between configurations A and B can be
obtained straightforwardly using the common tangent construction to the
corresponding Gibbs energy functions. Thus, a two-phase region was determined
ranging from yN = 0.390 for configuration B to yN = 0.482 for configuration A.
2.3.2. MÖSSBAUER SPECTROSCOPY
All Mössbauer spectra could be satisfactorily described with 3 (or 4) sextuplets,
representing Fe atoms surrounded by 1, 2 or 3 N atoms, and denoted as sextuplet FeI,
FeII and FeIII, respectively. For the higher nitrogen contents, two sextuplets for FeIII
had to be adopted to obtain acceptable fits. By fitting the overall Mössbauer spectra
resulting from the combination of several sextuplets to the experimental data, the
values of the hyperfine field, the isomer shift, the widths of the Gaussian and
Lorentzian components for the specific sextuplets and the relative contribution of
each sextuplet were obtained.
The results of the analysis of the Mössbauer spectra are given in Table 2.1. As

Modeling Thermodynamics of Fe-N Phases: Characterization of ε-Fe2N1-z
21
Table 2.1. Hyperfine field (H), isomer shift (δ) and relative contribution (fi) of the
sextuplets designated by I,II, IIIa and IIIb to Mössbauer spectra of the ε-Fe2N1-z
powders, recorded at 4.2 K. Σfi(i/6) = yN is the fraction of interstitial sites occupied
by nitrogen atoms as calculated from the relative contributions of iron atoms
surrounded by i = 0,1,...,6 nitrogen atoms (there is one interstitial site per Fe atom
and each Fe atom is surrounded by six different sites) and as obtained from high
resolution powder diffraction data.
at.% N 26.1 26.8 27.4 28.4 29.5 30.4 31.4
H(kOe) 332.1 331.2 334.3 330.7 - - -
I δ 0.66 0.69 0.66 0.70 - - -
f (%) 4.1 1.3 3.0 1.5 - - -
H(kOe) 259.9 259.5 259.2 258.1 257.4 255.5 251.8
II δ 0.73 0.73 0.74 0.74 0.75 0.76 0.77
f (%) 69.9 65.7 59.5 55.1 43 30.9 21.9
H(kOe) 147.5 145.6 141.9 139.5 141.2 138.5 129.2
IIIa δ 0.83 0.81 0.80 0.81 0.81 0.82 0.81
f (%) 17.3 29.3 32.5 37.5 39.3 39.5 46.3
H(kOe) 128.0 62.2 81.6 86.7 95.2 87.8 56.5
IIIb δ 0.67 0.37 0.48 0.54 0.76 0.78 0.8
f (%) 8.7 3.7 5.1 5.9 17.7 29.7 31.7
yN Σfi(i/6) 0.3631 0.3838 0.3861 0.4006 0.4283 0.4486 0.4634
HRPD 0.3596 - 0.3830 0.3967 0.4213 0.4432 -
was demonstrated in Refs. [12] and [3], (at least) two sextuplets for FeIII of distinctly
different hyperfine field, H, are required to achieve a satisfactory fit. Within
experimental accuracy, the hyperfine field for a particular Fe environment is fairly
constant, indicating that magnetic saturation is attained at the measurement
temperature of 4.2 K (Table 2.1.).
The total fractional occupancy of the N sublattice, yN, can be obtained by
summation of the relative contributions of the sextuplets fj (j=1-3) given in Table 2.1.
to the overall spectrum; for f3 the contributions of FeIIIa and FeIIIb have been summed.
The relative contributions of the sextuplets fj for j=2,3, i.e. the relative contributions
of the iron atoms surrounded by 2 and 3 nitrogen atoms on the six sites of the trigonal
prism (note Fig. 2.1.), are given as a function of the total occupancy yN, in Fig. 2.3.
For comparison, similar results obtained here from previously published data
for Mössbauer spectra have been presented too in Fig. 2.3. Present and previous data
agree very well, despite differences in sample preparation and in procedures applied

Chapter 2
22
for fitting of the sextuplets to the measured Mössbauer spectra (cf., Refs [3], [9], and
[12]). The probabilities p2 and p3 for iron atoms to be surrounded by two and three
nitrogen atoms respectively, can be calculated straightforwardly from the occupancies ky of the sublattices A1..C2, pertaining to the absorption isotherms corresponding to
WC/RT = -3.5 and WP/RT = -4 for configurations A and B as shown in Fig. 2.2. (cf.,
Section 2.3.1.); they are represented by the dashed lines in Fig. 2.3.
Fig. 2.3. Relative abundances of Fe atoms surrounded by 2 (ƒ2) and 3 (ƒ3) N atoms as
a function of the occupied fraction of interstitial sites yN at 723 K (data points). The
probabilities p2 and p3 for iron atoms to be surrounded by 2 (p2) and 3 (p3) N atoms,
as calculated from the yN values using WC/RT = -3.5 and WP = -4.0 are shown as a
function of yN by the dashed lines for configuration A and B.
Recognizing the occurrence of the miscibility gap between configurations A
and B (hereafter designated as A+B region), in fact, a linear combination of the
probabilities p2 and p3 at the extremities of the A+B region, i.e. p2 and p3, for
configuration B at yN = 0.390 and p2 and p3 for configuration A at yN = 0.482 (see end
of Section 2.3.1.) should be presented for the dependence of p2 and p3 on yN in the
A+B region: see solid straight lines between the limiting compositions given in
Fig. 2.3. Clearly, the thus obtained calculated p2 and p3 values agree well with the

Modeling Thermodynamics of Fe-N Phases: Characterization of ε-Fe2N1-z
23
Fig. 2.4. X-ray diffractograms of ε-Fe2N1-z, containing 24.9 at.% N (bottom) and
31.4 at.% N (top). The positions of the superstructure reflections for configurations A
and B have been indicated (marked by s).
experimental f2 and f3 values. For yN < 0.390, where only configuration B is stable,
the values for f2 and f3 are in good agreement with p2 and p3 for configuration B. A
similar observation is not possible for configuration A, because the sample with the
highest N content is still within the A+B region.
2.3.3. X-RAY DIFFRACTION
The nitrogen content can be derived from the lattice parameters a and c of hexagonal
ε-Fe2N1-z [3]. The HRPD results are compared with the corresponding data derived
from the Mössbauer spectra (cf., Section 2.3.2.) in Table 2.1. The HRPD patterns of
two samples are given in Fig. 2.4.; the positions of the superstructure reflections
expected to be observed for the A and B configuration are indicated (marked by s).
The presence of the superstructure reflection 001 provides unambiguous evidence
for the occurrence of configuration A, but was not observed (Fig. 2.4.). Figure 2.5.

Chapter 2
24
shows the observed intensity of the 100, 200 and 102 reflections, specific for
configuration B, in samples with different nitrogen contents. With increasing nitrogen
content, the superstructure reflections specific for configuration B gradually
disappear. Note that none of the present specimens has a composition that would
correspond to pure configuration A (cf., Section 2.3.2.). If, for specimens in the A+B
region, phases A and B would diffract independently, the corresponding X-ray
diffraction patterns would display doublet peaks for the majority of the reflections:
one peak of the doublet due to phase B (yN=0.390; high 2θ) and one peak of the
doublet due to phase A (yN=0.482; low 2θ). The relative intensities of the two peaks
of the doublet would be proportional with the relative amounts of phases A and B. No
such doublet peaks are observed. Hence, it is concluded that in the specimen the
“domains” exhibiting configuration A and the “domains” exhibiting configuration B
diffract coherently.
Fig. 2.5. The superstructure reflections 100, 200 and 102, specific for ordering
of the nitrogen atoms according to configuration B, for different nitrogen contents.

Modeling Thermodynamics of Fe-N Phases: Characterization of ε-Fe2N1-z
25
2.4. CONCLUSIONS
The thermodynamics of ε-Fe2N1-z at 723 K can be described applying the Gorski-
Bragg-Williams approach to mixing of nitrogen atoms and vacancies on the
interstitial sublattice: long-range order of nitrogen atoms occurs. Both the nitrogen
absorption isotherm and the Mössbauer spectroscopic data demonstrate that ordering
of nitrogen takes place according to two ground-state structures: one for Fe3N
(configuration B) and one for Fe2N (configuration A). A two-phase region, where
domains of configuration B and domains of configuration A coexist, extends from
yN = 0.390 to yN = 0.482 at 723 K. These domains diffract coherently.
The present observations of superstructure reflections and local surroundings
of Fe atoms are consistent with ordering of the nitrogen atoms according to
configuration B for ε-Fe2N1-x with an Fe3N composition. The absence of the 001
superstructure reflection, specific for configuration A, in the diffraction pattern of
ε-Fe2N1-x with a nitrogen content close to Fe2N, and preliminary structure factor
calculations indicate that atomic displacements of the Fe atoms due to the presence of
N atoms in the structure occur, which may cause the 001 reflection to disappear.

Chapter 2
26
REFERENCES
1. Kooi, B.J., M.A.J. Somers, E.J. Mittemeijer, Metall. Mater. Trans. A, 1996, vol. 27A, pp.1055-61
2. Kooi, B.J., M.A.J. Somers, E.J. Mittemeijer, Metall. Mater. Trans. A, 1996, vol. 27A, pp.1063-71
3. Somers, M.A.J., B.J. Kooi, L. Maldzinski, E.J. Mittemeijer, A.A., van der Horst, A.M. van der
Kraan, N.M. van der Pers, Acta Mater., 1997, vol. 45, pp. 2013-25
4. Kooi, B.J., M.A.J. Somers, E.J. Mittermeijer, Metall. Mater. Trans. A, 1994, vol. 25A, pp. 2797-
2814
5. Hendricks, S.B., P.B. Kosting, Z. Kristallogr., 1930, vol. 74, pp. 511-33
6. Wriedt, H.A., N.A. Gokcen, R.H. Nafziger, Bull. of Alloy Phase Diagrams, 1987, vol. 8, pp. 355-
77
7. Jack, K.H., Acta Cryst., 1952, vol. 5, pp. 404-11
8. Genderen, M.J. van, A. Böttger, E.J. Mittemeijer, Metall. Trans., 1997, vol. 28A, pp. 63-77
9. Chen, G.M., N.K. Jaggi, J.B. Butt, E.B. Yeh, L.H. Schwartz, J. Phys. Chem., 1983, vol. 87, pp.
5326-32
10. Rancourt, D.G., Nucl. Instr. Meth. Phys. Res., 1989, vol. B44, pp. 199-210
11. McLean, A.B., J. Electr. Spectr., 1994, vol. 69, pp. 125-32
12. Schaaf, P., Chr. Illgner, M. Niederdrenk, K.P. Lieb, Hyperfine Interactions, 1995, vol. 95, pp. 199-
225

27
3
APPLICATION OF THE
CLUSTER VARIATION METHOD TO
ORDERING IN AN INTERSTITIAL SOLUTION;
THE γ-Fe[N] / γ'-Fe4N1-x EQUILIBRIUM
ABSTRACT
The tetrahedron approximation of the Cluster Variation Method (CVM) was applied
to describe the ordering of N atoms on the fcc interstitial sublattice of γ-Fe[N] and
γ'-Fe4N1-x. A Lennard-Jones potential was used to describe the dominantly strain-
induced interactions, caused by the misfitting of the N atoms in the interstitial
octahedral sites. The γ-Fe[N] / γ'-Fe4N1-x miscibility gap, short-range ordering (SRO)
and long-range ordering (LRO) of nitrogen in γ-Fe[N] and γ'-Fe4N1-x, respectively,
and lattice parameters of γ and γ' were calculated. For the first time nitrogen
distribution parameters, as calculated by CVM, were compared directly to Mössbauer
data for specific surroundings of Fe atoms.

Chapter 3
28
3.1. INTRODUCTION
Nitriding is a thermochemical treatment usually applied to workpieces of iron-based
alloys (steels) to improve the performance with respect to fatigue, wear and corrosion.
Knowledge of the thermodynamics of iron-nitrogen phases is a prerequisite for
process and property optimization.
Most descriptions of the Fe-N system are based on the (sub)regular-solution
model[1,2,3] and describe the Fe-N phases as a (sub)regular solution of postulated
stoichiometric groups FeaNc and FeaVc, where a and c are whole numbers and V
denotes a vacant interstitial site. In the regular solution (RS) model, an excess Gibbs
energy term, which can be physically interpreted as an excess enthalpy term due to
pairwise interaction of neighboring stoichiometric groups, is added to the Gibbs
energy of an ideal solution of these groups. If the Redlich-Kister polynomial[4] is
adopted for the description of the excess Gibbs energy, the corresponding series
expansion for the excess Gibbs energy has no physical meaning, apart from the first
term that corresponds with the RS model; incorporation of both the second and first
terms corresponds to the so-called subregular solution (SRS) model. In these models,
possible long-range ordering of atoms N on the interstitial sublattice is not taken into
account explicitly.
In Fe-N phases, the N atoms reside in the octahedral sites formed by the close-
packed Fe atoms. Pronounced strain-induced interactions occur due to misfitting of
the N atoms in the interstitial positions. Due to these interactions, the N atoms cannot
be distributed randomly over all available sites: ordering of N atoms over the sites of
the interstitial sublattice occurs. If the fraction of N atoms is low, short-range ordering
(SRO) is observed, i.e., order prevails locally as a consequence of the tendency of N
atoms not to be surrounded by N atoms at (nearest) neighboring sites. If the fraction
of N atoms is high, long-range ordering (LRO) occurs and a periodic arrangement of
N atoms on the interstitial sublattice becomes apparent.
The (sub)regular solution models cannot take into account LRO of N atoms
on the interstitial sublattice as present in γ'-Fe4N1-x (fcc Fe sublattice)[5] and ε-Fe2N1-z
(hcp Fe sublattice)[6]. Yet, the RS model has been applied to treat the FeN-phases with
bcc, fcc and hcp Fe sublattices, considering γ'-Fe4N1-x as a stoichiometric
compound[7,8]. Using the SRS model, the Fe-N system has been reevaluated, still
treating γ' as a stoichiometric phase[9-12]. The γ' phase was treated as a

Application of the CVM to an Interstitial Solid Solution: The γ-Fe[N] / γ'-Fe4N1-x Equilibrium
29
nonstoichiometric compound in the SRS model applied in Ref. 13 to account for the
presence of a composition range of the γ' phase. Recently, it was shown[14] that the
available nitrogen-absorption isotherms for γ'-Fe4N1-x cannot be accurately described
by any of the RS and SRS models, because they do not account for the presence of
LRO. Instead, it was shown that the Gorsky-Bragg-Williams approximation
(GBW)[15] could be used successfully to calculate both the phase boundaries and the
nitrogen-absorption isotherms (i.e. the N content as a function of N activity),
considering LRO of N atoms in γ'-Fe4N1-x and ε-Fe2N1-x[14,16,17]. Although the GBW
approximation provides a satisfactory description of the LRO in γ'-Fe4N1-x and
ε-Fe2N1-x, it cannot account for the presence of SRO. Short-range ordering has been
reported to occur for the N atoms in γ-Fe[N] (nitrogen austenite)[18,19].
In the present work, the tetrahedron approximation of the cluster variation
method (CVM)[20] (Section 3.2.2) is applied to describe the miscibility gap between
γ-Fe[N] and γ'-Fe4N1-x and the ordering (SRO or LRO) of nitrogen atoms N and
vacancies V on the interstitial sublattices of γ-Fe[N] and γ'-Fe4N1-x in particular. In the
thermodynamic description of γ'-Fe4N1-x, LRO has been incorporated explicitly
(Section 3.2.1). The results have been compared with available literature data.
3.2. DESCRIPTION OF LRO AND SRO OF INTERSTITIALS BY
THE CLUSTER VARIATION METHOD (CVM)
3.2.1. APPLICATION TO AN INTERSTITIAL SOLID SOLUTION
Binary solid solutions, consisting of metal atoms (M) and interstitial atoms (I), can be
described at temperatures well below the melting point by two interpenetrating
sublattices: one fully occupied by atoms M (M sublattice) and one partially occupied
by atoms I (I sublattice). The I sublattice is conceived as a solid solution of atoms I
and vacancies V[14]. Thus, both γ-Fe[N] and γ'-Fe4N1-x consist of an Fe fcc sublattice
wherein the nitrogen atoms occupy a fraction of the octahedral interstices.
In contrast with the models applied previously to the Fe-N system and as
indicated in Section 3.1, the CVM can take into account multi-particle interactions.
Therefore, a basic cluster, with reference to the previous models necessarily
containing more than two lattice points, is chosen such that the whole lattice can be

Chapter 3
30
constructed using only the basic cluster. Each possible distribution of atoms over the
sites of the basic cluster is accounted for by a cluster-distribution variable. The value
of each cluster-distribution variable equals the fractional occurrence of that particular
cluster in the crystalline solid. The enthalpy and entropy contributions to the energy
function are expressed in terms of the cluster-distribution variables[20,21].
Long-range ordering on the I sublattice implies that a distinction has to be
made between sites which are preferably occupied by atoms N and sites which are
preferably occupied by vacancies V. Hence, in order to describe LRO using the CVM,
a set of sublattices (i.e. specific lattice points in the chosen basic cluster) is indicated
such that the point group symmetry of the ordered phase is reflected. In the absence of
LRO, SRO is characterized by the discrepancy of the values obtained by CVM for the
cluster-distribution variables and those obtained straightforwardly for a random
distribution of the atomic species involved.
The CVM is usually applied to substitutional systems. In the present work
ordering of atoms N (and vacancies V) on the I sublattice is considered. The M-
sublattice is assumed to remain fully occupied by Fe atoms. Thereby, ordering of
interstitials N on the I sublattice can be described as ordering in a binary (N,V)
substitutional system.
The interaction of the Fe sublattice with the interstitials N is not accounted for
explicitly, but it is effectively incorporated in the interaction parameters for the N-N,
N-V and V-V pair interactions (see also Sections 3.2.3.1 and 3.2.4). In the Fe-N
system, a considerable part of the interaction of interstitials is based on the elastic
strains introduced by a misfitting N atom in an octahedral interstice[22]. Obviously, the
elastic interaction of interstitials is mediated by the Fe-sublattice. Using CVM indirect
interactions have also been adopted to describe the antiferromagnetic-paramagnetic
transition in α-Fe2O3[23] and ordering due to M-M electrostatic repulsion in the
hematite (α-Fe2O3) - ilmenite (FeTiO3) two-phase region[24]; in these cases the
interactions are mediated by the O sublattice.
3.2.2. THERMODYNAMICS OF γ-Fe[N] AND γ'-Fe4N1-x
Order-disorder phase transformations in substitutional binary and ternary systems
have been described extensively with the CVM[20,21,25-37]. To calculate equilibria
applying the CVM, usually the Helmholtz energy of the system is minimized.

Application of the CVM to an Interstitial Solid Solution: The γ-Fe[N] / γ'-Fe4N1-x Equilibrium
31
Recognizing that the volume changes pronouncedly with composition for interstitial
solid solutions, relative to substitutional solid solutions, in the present work the Gibbs
energy, G, is minimized to calculate equilibrium. Then, in addition to the temperature,
during minimization of G the external pressure is kept constant, instead of the volume
per atom as in the usual CVM approximations based on the Helmholtz energy.
Further, use of the Gibbs energy, as compared to use of the Helmholtz energy, leads
to an extra minimization condition (Section 3.2.3)[25].
Using the CVM tetrahedron approximation, the ordering of atoms N and
vacancies V on the interstitial sublattice of γ-Fe[N] and γ'-Fe4N1-x is described. The
interstitial (I) sublattice exhibits a disordered (A1) structure in the case of γ-Fe[N] and
an ordered (L12) structure in the case of γ'-Fe4N1-x. In turn, the I sublattice is
subdivided in four interpenetrating simple cubic lattices. In the tetrahedron
approximation the basic cluster is a regular tetrahedron[38] (Fig. 3.1.). Six nearest
neighbor I-I interactions can be discerned on the basis of the four tetrahedron
sublattice sites, denoted by the superscripts α, β, γ and δ. Whether the sites are
occupied by N (nitrogen atoms) or V (vacancies) is indicated by the value of the
subscripts i, j, k, and l, which take a value of 1 or 2.
Fig. 3.1. The interstitial sublattice is subdivided in 4 interpenetrating simple cubic
sublattices α, β, γ, and δ. The basic cluster in the CVM tetrahedron approximation is
constituted by one site of each of the sublattices α, β, γ, and δ.

Chapter 3
32
In the A1 structure, the probability of finding N or V on a sublattice site of
type α, X iα , is equal to that of sublattice sites of type β, γ, and δ. Thus the symmetry
of the A1 structure can be described by δγβαlkji XXXX === (with i=j=k=l equal to
1 or 2). In the L12 structure N and V reside preferably on their own type of sublattice
site. If sublattice sites of type α are denoted N-type sites and, consequently, sublattice
sites of type β, γ and δ are denoted V-type sites, the probability of finding an atom N
at an N-type sublattice site is X1α and at a V-type sublattice site is X1
β (= X1
γ = X1
δ ).
The probability of finding a vacancy V at an N-type sublattice site is X2α and at a V-
type sublattice site is X 2β
(= X 2γ = X 2
δ ). In γ'-Fe4N1-x the ratio of N:V-type sublattice
sites is 1:3[5]. The symmetry of the L12 structure is described by X iα ≠ X j
β= X k
γ= X l
δ
(with i = j = k = l equal to 1 or 2).
3.2.2.1. INTERNAL ENERGY
The internal energy of the system is taken equal to the sum of the internal energies of
all occurring tetrahedrons. In the present case a total number of N lattice sites (at the I
sublattice) corresponds with a total number of 2N tetrahedrons (two tetrahedrons per
lattice site). Hence, the internal energy of the system is given by
∑=ijkl
ijklijkl ZU αβγδαβγδεN2 (1)
where εijklαβγδ
is the energy of a specific tetrahedron configuration with a frequency of
occurrence given by the distribution variable Zijklαβγδ
, which indicates the probability
that a tetrahedron has configuration ijkl on the tetrahedron sublattice sites α, β, γ, and
δ. The tetrahedron energy εijklαβγδ
is described as the sum of the pairwise interactions
within the tetrahedron:
( ) ( ) ( ) ( ) ( ) ( ) ( )rrrrrrr kljljkilikijijkl
γδβδβγαδαγαβαβγδ εεεεεεε +++++= (2)
where ( )rij
αβε is the pair interaction energy of an N-N pair (εNN) or an N-V pair (εNV)
or an V-V-pair (εVV) on the sublattice sites i and j, depending on the interatomic
distance r.

Application of the CVM to an Interstitial Solid Solution: The γ-Fe[N] / γ'-Fe4N1-x Equilibrium
33
3.2.2.2. CONFIGURATIONAL ENTROPY
The configurational entropy in the tetrahedron approximation for an fcc lattice, as the
I sublattice considered here, is described as [20]
( ) ( ) ( )
( ) ( ) ( ) ( )
( ) ( ) ( ) ( )
++++
++++
+−−=
∑∑∑∑
∑∑∑∑
∑ ∑∑
l
l
k
k
j
j
i
i
kl
kl
jl
jl
jk
jk
il
il
ijkl ik
ik
ij
ijijkl
XLXLXLXL
YLYLYLYL
YLYLZLS
δγβα
γδβδβγαδ
αγαβαβγδ
45
2BNk
(3)
where kB is Boltzmann’s constant and the function L(a) = a ln a - a. Yijαβ
indicates the
probability that a pair of nearest neighbour tetrahedron sublattice sites of type α and β
has configuration ij. X iα and Yij
αβ can be calculated from the tetrahedron distribution
variables Zijklαβγδ
:
X iα = Zijkl
αβγδ
jkl∑ , ... (4a)
Yijαβ
= Zijklαβγδ
kl∑ , Yik
αγ= Zijkl
αβγδ, ...
jl∑ (4b)
The ordering of N and V is assumed to take place on an undistorted interstitial
sublattice. Atomic displacements of Fe atoms due to the presence of N atoms in the
octahedral interstices are not explicitly accounted for.
The change in vibrational entropy for the phase transition γ – γ' is regarded
small in comparison to the change in configurational entropy, because both γ and γ'
are based on interpenetrating fcc M and I sublattices. Therefore, vibrational entropy
terms are neglected in the present work[39].

Chapter 3
34
3.2.3. CALCULATION OF PHASE EQUILIBRIA
For each phase a thermodynamic function Ω , referred to as the grand potential
function, is defined [25]
( ) ∑∑==
∗∗ −=−+−≡Ω2
1
*2
1
*21 ,,,
n
nn
n
nn xGxpTSUTp µµµµ V (5)
where G is the Gibbs free energy, U is the internal energy, S is the entropy and V is
the volume, all per tetrahedron-cluster site. The term T is the temperature, p is the
external pressure and xn denotes the mole fraction of component n (n = 1, 2) in the
phase considered:
( ) 4/δγβαnnnnn XXXXx +++= (6)
Furthermore, µn∗ is an effective chemical potential (Appendix A), defined as
∑−=n
nnnc
µµµ1* (7)
where µn is the chemical potential of component n and c is the number of
components in the system. The constraint that the tetrahedron distribution variables
Z ijklαβγδ
obey,
1=∑ijkl
ijklZ αβγδ (8)
is accounted for by introduction of the Lagrange multiplier λ. Then, minimization of
the grand potential function with respect to Z ijklαβγδ [20] yields
8/52/1ijkl
8exp
kT
-exp
2kTexp −
∗∗∗∗
+++
= ijklijkl
lkji
ijkl XYkT
Zµµµµελαβγδ

Application of the CVM to an Interstitial Solid Solution: The γ-Fe[N] / γ'-Fe4N1-x Equilibrium
35
with Yijkl ≡ Yijαβ
Yikαγ
YilαδYjk
βγYjl
βδYkl
γδ
and δγβαlkjiijkl XXXXX ≡ (9a)
The volume per cluster site, V, corresponding to a particular Zijklαβγδ
for a phase at
constant p and T is obtained from
∑
=−
ij
ij
ijd
dY
wp
V
ε
2 (9b)
where w is the coordination number of the fcc lattice and εij denotes the pair
interaction energy between nearest neighbors (cf. text following Eq. (2)). (In this
work, atmospheric pressure is taken as the reference pressure).
Using Eqs. (9a) and (9b), the grand potential function in the tetrahedron
approximation is minimized with respect to Zijklαβγδ
applying the Natural Iteration (NI)
method[26,40]. At thermodynamic equilibrium, the Zijklαβγδ
(and thus the corresponding
composition and volume) of the phases involved, γ and γ', can be calculated for the
chosen range of temperatures from the following conditions (Appendix A):
minimum of Ωγ
= minimum of Ωγ '
(10)
µN∗,γ
= µN∗,γ '
µV∗,γ
= µV∗,γ '
The fit parameters (discussed in the next Section) are adjusted by trial and error, and
the procedure of calculating the composition of the phases involved is repeated until
the calculated and the experimental phase boundaries agree as well as possible.
Chapter 3
36
3.2.3.1. DESCRIPTION OF THE PAIR INTERACTION ENERGIES
3.2.3.1.1. LENNARD-JONES PAIR POTENTIAL
The dependence of the pair interaction energy ε12αβ
, for an atom 1 on a site of type α
and an atom 2 on a site of type β, on the interatomic distance r may be described by a
so-called 8-4 type Lennard-Jones interatomic potential[25]:
( )
−
=
4012
80120
1212 2r
r
r
rr εε αβ (11)
where ε12o is the pair interaction energy in the reference state and parameter r12
o
corresponds to the interatomic distance for which ( )rαβε12 has a minimum value, equal
to - o
12ε .
3.2.3.1.2. LENNARD-JONES PARAMETERS
In general, the parameters ε11o and r11
o can be estimated from the enthalpy of
formation o
f H1∆ per atom and the lattice constant (a1) of the pure element 1,
respectively: ε11o and r11
o can be written as
o
f
o Hw
111
2∆−=ε (12a)
and in the case of an fcc structure it holds for r11o
r11o =
a1
2 (12b)
In the present work the pair interaction energies ε ijαβ
etc. (cf. Eq. (2)) for the binary N,
V system on the I sublattice have to incorporate the interaction with the fully occupied
Fe sublattice. Hence, recognizing that the pure γ-Fe phase is associated with an
interstitial sublattice composed solely of vacancies, the effective pair interaction
energy in the reference state for an V-V pair at neighboring interstitial sites, εVVo , is

Application of the CVM to an Interstitial Solid Solution: The γ-Fe[N] / γ'-Fe4N1-x Equilibrium
37
calculated from the standard enthalpy of formation of γ-Fe[41] using Eq.(12a). The
parameter rVVo is calculated from the lattice parameter of pure γ-Fe[N] [42] using
Eq.(12b).
Unfortunately the available thermodynamic data do not allow an estimation of
εNNo , εNV
o , rNNo and rNV
o in a similar way. Therefore, to model the equilibrium
between γ-Fe[N] and γ'-Fe4N1-x, εNNo , εNV
o , rNNo and rNV
o were adopted as fit
parameters.
3.2.4. APPLICATION TO THE γ-Fe[N] / γ'-Fe4N1-x MISCIBILITY GAP
In Sections 3.2.1 through 3.2.3, the tetrahedron approximation of the CVM for the
case of ordering of atoms N and vacancies V on an fcc interstitial sublattice, as in
γ-Fe[N] and γ'-Fe4N1-x, has been presented, as well as the corresponding procedure to
calculate phase boundaries. On this basis, the equilibrium compositions of the γ-Fe[N]
and γ'-Fe4N1-x phases at the γ / γ+ γ' and γ+ γ' / γ' phase boundaries in the Fe-N system
were calculated for temperatures in the range of 864 to 923 K.
The equilibrium between the γ-Fe[N] and the γ'-Fe4N1-x phase extends over a
temperature region of only 60 K. A limited number of experimental phase-boundary
data are available [43-45]. However, the composition at the eutectoid temperature (the
α / γ / γ' triple point) is known accurately, and was taken as point of suspension
during the fitting procedure.
The experimental phase-boundary data and the calculated γ / γ' miscibility gap
are shown in Fig. 3.2(a). Differences with previous attempts to model this miscibility
gap can be assessed using Figs. 3.2(b) and (c). Note the differences between
descriptions of the γ+ γ' / γ' phase boundaries for constant composition of γ'-Fe4N1-x
and those based on a variable composition of γ'-Fe4N1-x. The values for the Lennard-
Jones parameters providing the best fit are gathered in Table 3.1.

Chapter 3
38
Table 3.1. Lennard-Jones parameters used in the CVM phase-boundary calculations
Parameters Normalised parameters Pair
interaction εo (kJ/mol) ro (nm) εo
/ ε VVo r
o/ rVV
o
Method of
determination
V-V 68.27 0.25265 1.000 1.000 Eqs. (12)
V-N 66.25 0.26687 0.971 1.056 fitting
N-N 47.79 0.29459 0.700 1.166 fitting
Fig 3.2. (a) The experimental phase-boundary data and the calculated
γ-Fe[N] / γ'-Fe4N1-x miscibility gap. Differences with previous attempts to model this
miscibility gap can be assessed using

Application of the CVM to an Interstitial Solid Solution: The γ-Fe[N] / γ'-Fe4N1-x Equilibrium
39
Figs. 3.2(b) and (c), showing the γ / γ + γ' and γ + γ' / γ' phase boundaries,
respectively.

Chapter 3
40
3.3. DISCUSSION
3.3.1. LATTICE PARAMETERS OF THE FCC Fe-N PHASES
The lattice parameters of γ-Fe[N] and γ'-Fe4N1-x, as calculated from the volume V of a
cluster site (Section 3.2.3), are compared with experimental values given in the
literature (Refs. 42 and 46) in Fig. 3.3. The calculated values are somewhat smaller
(up to 3% for γ'-Fe4N1-x) than the experimental ones.
Fig. 3.3. Calculated lattice parameters of γ-Fe[N] and γ'-Fe4N1-x as obtained by CVM
as a function of the percentage of nitrogen dissolved, and corresponding experimental
data.

Application of the CVM to an Interstitial Solid Solution: The γ-Fe[N] / γ'-Fe4N1-x Equilibrium
41
The fit parameter rNN is directly related to the lattice parameter of an
(interstitial) fcc sublattice fully occupied by nitrogen (refer to the discussion of rVV in
Section 3.2.3.1). Thus, the value determined for rNN can be used to calculate (cf. Eq.
(12b)) the lattice parameter of γ-FeN (NaCl structure). The phase γ-FeN has actually
been prepared by magnetron sputtering. The lattice parameters of two γ-FeN phases
(NaCl and ZnS structure) have been reported [47,48]. As follows from Fig. 3.3., again,
the lattice parameter calculated by CVM is smaller than these corresponding
experimental values.
With respect to the underestimation of the actual lattice parameter by the
CVM calculations, as compared to the available experimental data, the following
remarks can be made. i) Lattice parameters are temperature dependent. The
experimental data presented regard room temperature values for the lattice
parameters, whereas the calculated CVM data pertain to ~ 900 K. However, the effect
due to thermal expansion (0.4 to 1%) cannot explain the difference observed (linear
expansion coefficient of γ'-Fe4N1-x in Ref. 46). ii) In the CVM calculations, the Fe
sublattice is considered to be undistorted, whereas displacements of the Fe atoms
neighbouring N atoms can be expected [49]. Such effects will influence the average
lattice parameter. iii) A small discrepancy (0 to 5%), as observed here, between
calculated lattice parameters and experimental values has been observed before [25].
3.3.2. THE γ-Fe[N] / γ'-Fe4N1-x MISCIBILITY GAP
The γ / γ+ γ' phase-boundary on the left-hand side of the miscibility gap is shown in
Fig. 3.2(b). Clearly, as compared to the previous attempts, the present CVM
calculation provides a satisfactory fit with the experimental data for the γ / γ+ γ'
phase-boundary.
The γ+ γ' / γ' phase-boundary on the right-hand side of the miscibility gap is
shown in Fig. 3.2(c). Most previous attempts to model the γ + γ' / γ' phase-boundary
were based on the (S)RS approach. If γ' is conceived as a stoichiometric phase with
zero homogeneity width [8-12], then the γ+ γ' / γ' phase boundary appears as a straight
vertical line in the Fe-N phase diagram (cf. Fig. 3.2(c)). Since in the present work a
composition range in γ' was taken into account, the current results can best be
compared with only those previous works that also incorporate compositional
variation of γ', i.e. Ref. 13 and the extrapolation derived from the α + γ' / γ' phase

Chapter 3
42
boundary calculated in Ref. 14. The experimental data for the γ + γ' / γ' phase
boundary show considerable scatter, which is probably due to experimental
difficulties associated with precise determination of the nitrogen content. Yet, it may
be concluded that the γ + γ' / γ' phase-boundary is well described by the one
calculated by CVM. Note that the composition of the γ' phase at the triple point, as
calculated by CVM, agrees well with the compositions derived from Refs. 29 and 31
(differences <0.2 at.%).
3.3.3. ORDERING OF NITROGEN ATOMS IN γ-Fe[N] AND γ'-Fe4N1-x
The main results of the present work concern the description of nitrogen ordering in γ-
Fe[N] and γ'-Fe4N1-x. The distribution of the nitrogen atoms over the sites of the
interstitial sublattice is different for γ' and γ. In the γ'-phase long-range ordering
(LRO) occurs: a periodic arrangement of atoms N and vacancies V on the interstitial
sublattice, as indicated by diffraction experiments [5]. In the γ-phase, LRO of
interstitial atoms is absent, but Mössbauer experiments [19,50] indicate that the
distribution of atoms N over the octahedral interstices is not random; an indication
for short-range ordering (SRO) in γ also follows from the non-Henrian behaviour of
nitrogen-absorption isotherms for γ-Fe[N] [18,51].
3.3.3.1. LONG RANGE ORDERING OF NITROGEN IN γ'-Fe4N1-x
By denoting I sublattice sites of type α as N-type sites and I sublattice sites of types β,
γ and δ as V-type sites (Fig. 3.1. and Section 3.2.2), the probability of finding an atom
N at a N-type site is X1α and at a V-type site is X1
β (= X1
γ = X1
δ ). Then, the degree of
LRO of N atoms in γ'-Fe4N1-x can be described using an order parameter ρ, defined as
(cf. Ref. 16)
+−
= βα
βα
ρ11
11
3XX
XX (13)
The order parameter, ρ, is a function of the fraction of occupied interstitial
sites, yN; see the results for γ'-Fe4N1-x in equilibrium with γ-Fe[N] in Fig. 3.4. In the
temperature range considered the value of ρ is very close to 1, indicating occurrence

Application of the CVM to an Interstitial Solid Solution: The γ-Fe[N] / γ'-Fe4N1-x Equilibrium
43
of nearly perfect LRO of the N atoms. With decreasing temperature and increasing
occupation of the sites of the interstitial sublattice, the order parameter increases. A
similar trend can be derived from the data presented in Ref. 16 for γ'-Fe4N1-x in
equilibrium with NH3/H2 gas mixtures. The present value of ρ in γ'-Fe4N1-x at the
triple point α / γ / γ' at 863 K (0.9994) can be compared with the value derived by
extrapolation from the LRO data of Ref. 16 (0.998). Experimental data for the degree
of ordering have not been reported.
Fig. 3.4. The degree of order ρ for γ'-Fe4N1-x in thermodynamic equilibrium with
γ-Fe[N] as a function of the fraction of occupied interstitial sites, yN, as obtained
from the cluster-distribution variables, using Eq. 13, for the temperature range 864 K
to 923 K.
3.3.3.2. SHORT RANGE ORDERING OF NITROGEN IN γ-Fe[N]
Short-range ordering in γ-Fe[N] can be evaluated by comparing the site occupancies
of the tetrahedron clusters, as calculated from the cluster-distribution variables Zijklαβγδ
,
and as obtained by application of the CVM for a fixed composition and temperature,
with those for a random distribution of N for the same composition.
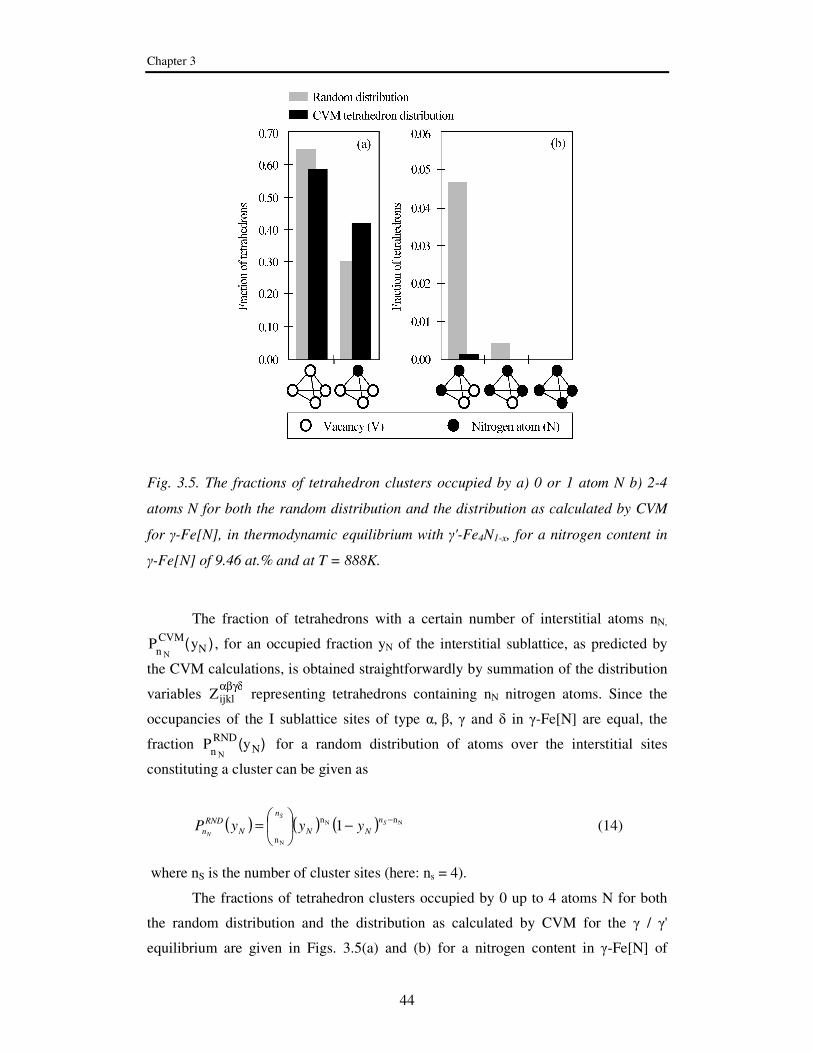
Chapter 3
44
Fig. 3.5. The fractions of tetrahedron clusters occupied by a) 0 or 1 atom N b) 2-4
atoms N for both the random distribution and the distribution as calculated by CVM
for γ-Fe[N], in thermodynamic equilibrium with γ'-Fe4N1-x, for a nitrogen content in
γ-Fe[N] of 9.46 at.% and at T = 888K.
The fraction of tetrahedrons with a certain number of interstitial atoms nN,
P
n N
CVM(yN ) , for an occupied fraction yN of the interstitial sublattice, as predicted by
the CVM calculations, is obtained straightforwardly by summation of the distribution
variables Zijklαβγδ
representing tetrahedrons containing nN nitrogen atoms. Since the
occupancies of the I sublattice sites of type α, β, γ and δ in γ-Fe[N] are equal, the
fraction P
n N
RND(yN) for a random distribution of atoms over the interstitial sites
constituting a cluster can be given as
( ) ( ) ( ) NN
N
nn
n1 −−
= S
S
N
n
NN
n
N
RND
n yyyP (14)
where nS is the number of cluster sites (here: ns = 4).
The fractions of tetrahedron clusters occupied by 0 up to 4 atoms N for both
the random distribution and the distribution as calculated by CVM for the γ / γ'
equilibrium are given in Figs. 3.5(a) and (b) for a nitrogen content in γ-Fe[N] of

Application of the CVM to an Interstitial Solid Solution: The γ-Fe[N] / γ'-Fe4N1-x Equilibrium
45
9.46 at.% (and T=888K, cf. Fig. 3.2(b)). According to the CVM calculations, for this
composition only a very small fraction of the tetrahedron clusters contains more than
1 N atom (Fig. 3.5(b)); most tetrahedron clusters contain 0 or 1 N atom (Fig. 3.5(a)).
As compared to a random distribution of N atoms over all available sites, SRO in γ-
Fe[N] involves that the probability of finding tetrahedrons with no N atoms is ~ 10%
lower and that the probability of finding tetrahedrons with 1 N atom is ~ 10% higher.
This reflects a preference for N-V nearest neighbors over N-N or V-V nearest
neighbors on the interstitial sublattice, which is the driving force for ordering.
3.3.3.3. COMPARISON WITH MÖSSBAUER DATA
Quantitative data of SRO of N atoms in γ-Fe[N] can be deduced from Mössbauer
spectroscopy data reported in Refs. 19, 50, and 53 as follows. Interpretation of
Mössbauer spectra leads to values of the fractions of Fe atoms in γ-Fe[N] surrounded
by 0, 1,...6 atoms N (A nN, nN = 0 to 6) on the 6 nearest neighbouring interstitial sites
forming an octahedron surrounding each Fe-atom (Fig. 3.6.); each type of Fe
surroundings corresponds with a subspectrum (component) in the overall Mössbauer
spectrum that has to be unraveled. The occupation of one (or more) of the 8 next
nearest neighboring sites can be included as well by fitting additional subspectra in
the overall spectrum. In γ-Fe[N] the fractions of Fe atoms surrounded by 3 or more
atoms N are too small to be quantified.
The CVM calculations yield values for the cluster variables αβγδijklZ which can
be used to calculate the pair probabilities αβijY , αγ
ikY ,... (cf. Eq. (4b)). For the γ phase
there is no distinction between the sites of type α, β, γ, and δ and, thus,
...==≡ αγαβikijij YYY The relation between the Mössbauer data for
NnA and the CVM
data for Yij can be derived as follows.
The fractional occurrences of N-N, V-V and N-V neighbor pairs on the total
number Mtot of interstitial sites neighboring an Fe atom can be calculated
straightforwardly for cases of 1, 2, nN, ... atoms N distributed over the Mtot interstitial
sites (Appendix B). The fractional occurrence of nN atoms N on the Mtot sites next to
an Fe atom is denoted by NnA (refer to the preceding discussion). Taking into account
all possible surroundings of an Fe atom, the fractional occurrences of N-N, V-V and
N-V pairs in the specimen can be expressed in terms of NnA (nN=0,1,... Mtot). These
expressions for Yij are linear in NnA . The set of expressions for Yij can be rewritten as

Chapter 3
46
a set of expressions for NnA in terms of Yij. Thus, the calculated CVM results for Yij
can be transformed into calculated CVM results for NnA , which then can be compared
with experimental (Mössbauer) results for NnA . Note that since only three pair
probabilities Yij exist, at most three surroundings NnA can be solved from the set of
expressions for NnA . In the present case A0, A1 and A2 are significant (refer to
preceding discussion).
Fig. 3.6. Each Fe atom in γ-Fe[N] can be surrounded by 0,1,...6 atoms N (NnA ,
nN = 0 to 6) on the 6 nearest neighboring interstitial sites forming an octahedron
surrounding each Fe-atom in the fcc structure.
The NnA (nN = 0,1,2) values obtained from the Yij (CVM) values are compared
with the experimental NnA (i = 0,1,2) values obtained from the Mössbauer
experiments reported in Refs. 20, 50, and 53 (Fig. 3.7.). The experimental NnA data
pertain to homogeneous (quenched) γ-Fe[N] samples prepared at temperatures in the
range 923-973 K; the calculated NnA data pertain to γ-Fe[N] in equilibrium with
γ'-Fe4N1-x for the temperature range 864 to 923 K.
It can be concluded that i) the calculations and the experiments indicate that
significant SRO occurs in γ-Fe[N] (refer to the difference with the predictions of NnA
for a random distribution, indicated in Fig. 3.7.) and ii) although the experimental
conditions are not exactly equal to those relevant to the calculations, calculated and
experimental results agree well.

Application of the CVM to an Interstitial Solid Solution: The γ-Fe[N] / γ'-Fe4N1-x Equilibrium
47
Fig. 3.7. The AnN(nN = 0,1,2) values (Fe atom surroundings) obtained from the Yij
values (pair probabilities) calculated by CVM and the corresponding experimental
AnN (nN = 0,1,2) values derived from Mössbauer data.

Chapter 3
48
3.4. CONCLUSIONS
Short- and long-range ordering (SRO and LRO) on the sublattice of interstitial sites
formed by a closed packed sublattice has been described successfully by application
of the Cluster Variation Method.
The CVM calculations demonstrate occurrence of SRO in γ-Fe[N] and distinct
LRO in γ'-Fe4N1-x, in agreement with Mössbauer data and X-ray diffraction.
Quantitative analysis of calculated CVM data and experimental Mössbauer
data for the fractional occurrences in γ-Fe[N] of certain Fe atom surroundings, in
terms of the number of neighboring nitrogen atoms, shows that the CVM predictions
agree well with the measured results.
The calculated miscibility gap between γ-Fe[N] (nitrogen austenite) and
γ'-Fe4N1-x (iron nitride) agrees well with the available experimental data.
As a side result, theoretical lattice parameter values were obtained for γ and
γ', which tended to be up to 4% smaller than available experimental values.

Application of the CVM to an Interstitial Solid Solution: The γ-Fe[N] / γ'-Fe4N1-x Equilibrium
49
APPENDIX A:
CALCULATION OF PHASE EQUILIBRIA
Consider the equilibrium at constant pressure p and temperature T between two
phases, I and II, for a closed binary system with components 1 and 2. The so-called
grand potential function for phase I is defined as:
( ) ∑=
−=Ω2
121 ,,,
i
I
i
I
i
IIII xGTp µµµ (A-1a)
with GI as the Gibbs energy of phase I per cluster site and where µ iI is the chemical
potential of component i in phase I. At constant p and T and for fixed µ1I and µ2
I it
follows from Eq. (A-1a)
IIIIII dxdxGdd 2211 µµ −−=Ω (A-1b)
Since II dxdx 21 −= (closed system), at a minimum of IΩ ( 0=Ω Id )
III
I
I
dx
Gdµµµ ∆≡−= 21
1
(A-2a)
Similarly for phase II:
IIIIII
II
II
dx
Gdµµµ ∆≡−= 21
1
(A-2b)
In order for equilibrium to exist between phase I and phase II, at least
II
II
I
I
dx
Gd
dx
Gd
11
= (A-3)
which is a consequence of GI and GII, both a function of x1, sharing the same tangent
(however, this is not a conclusive condition for a common tangent; as shown

Chapter 3
50
subsequently). Imposing equilibrium it follows that III
11 µµ = and III
22 µµ = and thus III µµ ∆=∆ µ∆≡ . Now the minimum of IΩ and the minimum of IIΩ can be
calculated as a function of µ∆ . At the point of intersection, 'µµ ∆≡∆ , the minima of IΩ and IIΩ are equal, which yields (cf. Eq. (A-1a))
( )( ) '
11
µ∆=−−
III
III
xx
GG (A-4)
Hence for 'µµ ∆=∆ , GI and GII, both as a function of x1, share the same tangent.
Thus the equilibrium between phases I and II is described by the minimum of IΩ (or IIΩ ) at 'µµ ∆=∆ .
Finding the minimum of IΩ and the minimum of IIΩ as a function of µ∆
may be done by choosing a value of, say, 2µ and by varying 1µ . However, only a
specific value of 2µ , unknown at this stage, is compatible with equilibrium between
the phases I and II. Therefore a more efficient approach is to choose only a value for
µ∆ without specifying a value for 2µ . This can be done by redefining the zero level
of the energy scale for each value of µ∆ such that the modified ∗1µ and ∗
2µ are
known, given a value for ∗∗ −=−=∆ 2121 µµµµµ . This leads to:
+−=∗
221
11
µµµµ ;
+−=∗
221
22
µµµµ (A-5)
implying: ∗=∆ 12µµ and ∗∗ −= 21 µµ .

Application of the CVM to an Interstitial Solid Solution: The γ-Fe[N] / γ'-Fe4N1-x Equilibrium
51
APPENDIX B:
CALCULATION OF THE PAIR PROBABILITIES FOR VARIOUS IRON
ATOM SURROUNDINGS ON THE INTERSTITIAL SUBLATTICE
Consider an Fe atom surrounded by a number of neighboring interstitial sites Mtot.
Any combination of two of these interstitial sites constitutes a pair of interstitial sites.
There are NP = (Mtot!)/(2!(Mtot-2)!) of such pairs. Only a fraction (f) of these pairs can
be designated as neighbor pairs. As an example refer to the six sites of the octahedron
of (nearest) neighbor interstitial sites surrounding an Fe atom in the fcc sublattices of
γ and γ'. There are 6!/(2!4!) = 15 pairs and 3 of the 15 pairs are not neighbor pairs,
implying f = 4/5.
Now, suppose there are nN atoms N and nV vacancies V on the Mtot interstitial
sites considered (nN + nV = Mtot). Any combination of two N atoms out of the nN
atoms N constitutes an N-N pair. There are NN-N = nN!/(2!(nN-2)!) N-N pairs. The
number of neighbor N-N pairs then is (cf. previous reasoning): fNN-N and the
fractional amount of N-N neighbor pairs is fNN-N/(fNP). Similarly it follows for the
fractional amount of neighbor V-V pairs: NV-V/NP, where NV-V is analogous to NN-N
given previously.
For the case considered, nN atoms N and nV vacancies V on Mtot sites, the
number of N-V pairs NN-V is given by the product of i) the number of ways to select
one N atom out of nN atoms (= nN!/(1!(nN-1)!) = nN) and ii) the number of ways to
select one V “atom” out of nV “atoms” (= nV!/(1!(nV-1)! = nV). The fractional amount
of neighbor N-V pairs then is NN-V/NP.

Chapter 3
52
REFERENCES
1. Hillert, M., L.I. Staffansson, Acta Chem. Scand., 1970, vol. 24(10), pp. 3618-26
2. Harvig, H., Acta Chem. Scand., 1971, vol. 25(9), pp. 3199-3204
3. Kaufman, L., H. Bernstein, Computer Calc. of Phase Diagrams, NY, 1970
4. Redlich, O., A.T. Kister, Ind. Eng. Chem., 1948, vol. 40, pp. 345
5. Jack, K.H., Proc. Roy. Soc., 1948, vol. A195, pp. 34-55
6. Jack, K.H., Acta Cryst., 1952, vol. 5, pp. 404-11
7. Hillert, M., M. Jarl, Met. Trans. A, 1975, vol. 6A, pp. 553-59
8. Ågren, J., Met. Trans. A, 1979, vol. 10A, pp. 1847-52
9. Kunze, J., Steel Research, 1986, vol. 57 (8), pp. 361-67
10. Kunze, J., Nitrogen and Carbon in Iron and Steels; Thermodynamics, Phys. Res., vol. 16,
Akademie Verlag, Berlin, 1990
11. Frisk, K., CALPHAD, 1987, vol. 11(2), pp. 127-34
12. Frisk, K., CALPHAD, 1991, vol. 15(1), pp. 79-106
13. Du, H., J. Phase Eq., 1993, vol. 14(6), pp. 682-93
14. Kooi, B.J., M.A.J. Somers, E.J. Mittemeijer, Met. Mat. Trans. A, 1996, vol. 27A, pp. 1063-71
15. Gokcen, N.A., Statistical thermodynamics of alloys, Plenum Press NY, 1986
16. Kooi, B.J., M.A.J. Somers, E.J. Mittemeijer, Met. Mat. Trans. A, 1996, vol. 27A, pp. 1055-61
17. Somers, M.A.J., B.J. Kooi, L. Maldzinski, E.J. Mittemeijer, A.A. van der Horst, A.M. van der
Kraan, N.M. van der Pers, Acta Mater., 1997, vol. 45(5), pp. 2013-25
18. McLellan, R.B., K. Alex, Scripta Met., 1970, vol. 4, pp. 967-70
19. Fall, I., J.-M.R. Genin, Met. Mat. Trans. A, 1996, vol. 27A, pp. 2160-77
20. Kikuchi, R., D. de Fontaine, Appl. of phase diagrams in Metall. and Ceramics, Proc. of workshop
at NBS Gaithersburg, 1977, pp. 967-79
21. De Fontaine, D., R. Kikuchi, Appl. of phase diagrams in Metall. and Ceramics, Proc. of workshop
at NBS Gaithersburg, 1977, pp. 999-1027
22. Zener, C., Phys. Rev., 1948, vol. 74(6), pp. 639-47
23. Burton, B., R. Kikuchi, Phys. Chem. Minerals, 1984, vol. 11, pp. 125-31
24. Burton, B., Phys. Chem. Minerals, 1984, vol. 11, pp. 132-39
25. Sanchez, J.M., J.R. Barefoot, R.N. Jarrett, J.K. Tien, Acta Met., 1984, vol. 32(9), pp. 1519-25
26. Kikuchi, R., J. Chem. Phys., 1974, vol. 60, pp. 1071-80
27. Kikuchi, R., Phys. Rev., 1951, vol. 81, pp. 988-1003
28. Colinet, C., Theory and Applications of the Cluster Variation Method and Path Probability
Methods, J.L. Morán-López and J.M. Sanchez, Plenum Press NY, 1996, pp. 313-40

Application of the CVM to an Interstitial Solid Solution: The γ-Fe[N] / γ'-Fe4N1-x Equilibrium
53
29. Van Baal, C.M., Physica, 1973, vol. 64, pp. 571-86
30. Sigli, C., J.M Sanchez, CALPHAD, 1984, vol. 8(3), pp. 221-31
31. Enomoto, M., H. Harada, Met. Trans. A, 1989, vol. 20A, pp. 649-64
32. Kikuchi, R., J.M. Sanchez, D. De Fontaine, H. Yamauchi, Acta Met., 1980, vol. 28, pp. 651-62
33. Sanchez, J.M., D. De Fontaine, Phys. Rev. B, 1980, vol. 21, pp. 216
34. Sanchez, J.M., D. De Fontaine, Phys. Rev. B, 1982, vol. 25, pp. 1759
35. Kikuchi, R., J. Chem. Phys., 1977, vol. 66, pp. 3352
36. Burton, B., R. Kikuchi, Am. Min., 1984, vol. 69, pp. 165-75
37. Colinet, C., G. Inden, R. Kikuchi, Acta Met. Mat., 1993, vol. 41(4), pp. 1109-18
38. Kikuchi, R., D. de Fontaine, M. Murakami, T. Nakamura, Acta Met., 1977, vol. 25, pp. 207-19
39. De Fontaine, D., C. Wolverton, Ber. Bunsenges. Phys. Chem., 1992, vol. 96 (11), pp. 1503-12
40. Kikuchi, R., Acta Met., 1977, vol. 25, pp. 195-205
41. Kubaschewski, O., C.B. Alcock, P.J. Spencer, Materials thermochemistry, 6th ed. Perg. Oxford
1993
42. Cheng, L., A. Böttger, Th.H. de Keijser and E.J. Mittemeijer, Scripta Met. Mat., 1990, vol. 24, pp.
509
43. Eisenhut, O., E. Kaupp, Z. Elektrochem., 1930, vol. 36(6), pp. 392-404
44. Lehrer, E., Z. Elektrochem., 1930, vol. 37(7), pp. 460-73
45. Paranjpe, V.G., M. Cohen, M.B. Bever, C.F. Floe, Trans. AIME, 1950, vol. 188, pp. 261-67
46. Somers, M.A.J., N.M. van der Pers, D. Schalkoord, E.J. Mittemeijer, Met. Trans. A, 1989,
vol. 20A, pp. 1533-39
47. Rissanen, L., K.P. Lieb, M. Niederdrenk, O.Schulte, P. Schaaf, Proc. ICAME-95, 1996, vol. 50,
pp. 595-98
48. Rissanen, L., M. Neubauer, K.P. Lieb, P. Schaaf, J. All. Comp., 1998, vol. 274, pp. 74-82
49. Van Genderen, M.J., A. Böttger, E.J. Mittemeijer, Met. Mat. Trans. A, vol. 28A, 1997, pp. 63-77
50. Oda, K., K. Umezu, H. Ino, J. Phys. Cond. Mat., 1990, vol. 2, pp. 10147
51. Atkinson, D., C. Bodsworth, J.I.S.I., 1970, vol. 27, pp. 587-93
52. Jack, K.H., Proc. Roy. Soc., 1951, vol. A208, pp. 200-15
53. Foct, J., R. Rochegude, A. Hendry, Acta Met., 1988, vol. 36(3), pp. 501-05


55
4
APPLICATION OF THE CLUSTER VARIATION
METHOD TO AN INTERSTITIAL SOLID SOLUTION:
THE γ'-Fe4N1-x / ε-Fe2N1-z EQUILIBRIUM
ABSTRACT
The cluster variation method has been applied to establish effective interaction
potentials that describe both γ'-Fe4N1-x / ε-Fe2N1-z miscibility gaps in the Fe-N phase
diagram. The calculated nitrogen distributions show that long-range order occurs in
the γ'-Fe4N1-x phase and that short-range ordering, as well as long-range ordering,
occurs in the ε-Fe2N1-z phase. The calculated nitrogen distributions for the ε-Fe2N1-z,
pertaining to temperatures and concentrations at the γ' / ε phase boundaries, are
compared with available data obtained by Mössbauer spectrometry. Preferential
occupation of specific interstitial sites occurs from about 16 at.% nitrogen on; at the
highest concentration considered, about 25 at.% nitrogen, the occupation is that of
Fe3N as proposed in literature on the basis of diffraction data.

Chapter 4
56
4.1. INTRODUCTION
Iron nitrides are metastable solid solutions, as produced in practice by a
thermochemical treatment called nitriding, which is applied to steels to improve their
performance with respect to fatigue, wear, and corrosion. Therefore, the knowledge of
the thermodynamics of Fe-N phases is a prerequisite for understanding and
controlling the process of nitriding in (industrial) applications.
In interstitial solid solutions like the Fe-N phases, the misfit of the interstitial
nitrogen atoms results in pronounced strain-induced interactions, which lead to short-
range ordering (SRO) or long-range ordering (LRO) of the interstitials. To model the
phase diagrams and absorption isotherms of Fe-N alloys, this ordering of the
interstitial atoms needs to be taken into account[1]. LRO has been first introduced in
the thermodynamic description of γ'-Fe4N1-x[1] and ε-Fe2N1-z
[2] by applying the
Gorsky-Bragg-Williams (GBW) approximation. In the present work, the cluster
variation method (CVM) is used. The cluster variation formalism allows considering
both SRO and LRO, which implies that the same set of (atomic interaction)
parameters can be used over the whole composition range of a phase to calculate
thermodynamic data. In addition, the CVM deals with correlations between the
occupations of lattice sites within the cluster (tetrahedron, prism etc.) used in the
approximation[3,4], whereas the GBW approach, which is equivalent to a point cluster
approximation, does not. The CVM was successfully used for calculation of the
γ-Fe[N] / γ'-Fe4N1-x phase boundary[5].
Interstitial solid solutions, consisting of metal atoms and interstitial atoms, can
generally be described by two interpenetrating sublattices: the metal sublattice, fully
occupied by metal atoms, and the interstitial sublattice, partially occupied by
interstitial atoms. The interstitial sublattice is constituted by the octahedral interstices
of the metal sublattice, and is conceived as a solid solution of interstitial atoms and
vacancies (V), in case of a binary metal-interstitial system[2]. The ordering of
interstitial N atoms on the interstitial sublattice can then be described as ordering on
the interstitial sublattice of a binary system consisting of nitrogen atoms N and
vacancies V. The atomic interactions between the metal and the interstitial sublattice
are not accounted for explicitly but incorporated in effective interaction parameters for
the N-N, N-V, and V-V pair interactions. The pair interaction parameters are kept
constant in the calculations, which implies that possible changes in the vibrational

Application of the CVM to an Interstitial Solid Solution: The γ'-Fe4N1-x / ε-Fe2N1-z Equilibrium
57
contributions caused by changes of temperature and composition are not taken into
account explicitly (see discussion Section 4.5.1.).
This chapter starts with the thermodynamic description of γ'-Fe4N1-x and
ε-Fe2N1-z using the CVM, followed by the procedure used to calculate the phase
equilibrium. From the calculation of the γ'-Fe4N1-x / ε-Fe2N1-z equilibrium data on the
ordering of the interstitial atoms and values for the lattice parameters are obtained.
The ordering of N in the γ'-Fe4N1-x phase has been studied in detail in Ref. [5]. The
focus is on the ordering of N in ε-Fe2N1-z, in equilibrium with γ'-Fe4N1-x, as a function
of the nitrogen content. Finally, the results are compared with literature data on the N
distribution, as obtained using Mössbauer spectroscopy.
4.2. THERMODYNAMICS OF γ'-Fe4N1-x
The (long-range) ordering of N and V on the interstitial sublattice of γ'-Fe4N1-x is
described using the CVM tetrahedron approximation as developed in Ref. [5]. In
contrast to ε-Fe2N1-z, the γ'-Fe4N1-x phase shows only small variations in composition:
0 < x < 0.05. The structure consists of an iron (Fe) fcc sublattice, wherein N atoms
occupy preferably a specific fraction of the interstitial fcc sublattice (see further)
constituted by the octahedral interstices. The interstitial fcc sublattice is subdivided in
four interpenetrating simple cubic sublattices, denoted by the superscripts α, β, γ, and
δ. The four sites of the basic regular tetrahedron cluster[6-8] (Fig. 4.1.), denoted by the
subscripts i, j, k, and l, each represent one of the simple cubic sublattices. Whether the
sites are occupied by atoms N or vacancies V is indicated by the value of the
subscripts i up to l, which take a value of 1 (occupied by N) or 2 (vacancy).
In γ'-Fe4N1-x, the atoms N and vacancies V on the interstitial sublattice exhibit
an ordered (Ll2) structure[9]. Both N and V preferably reside on their own type of
sublattice site. Here, sublattice sites of type α are denoted N-type sites, and sublattice
sites of types β, γ, and δ are denoted V-type sites. The probability of finding N on a α-
type site sublattice site in γ'-Fe4N1-x is indicated by X1γ ' ,α while the probability of
finding V on a α-type sublattice site is X2γ ' ,α . The symmetry of the Ll2 structure is
described by Xi
γ ' ,α ≠ X j
γ ' ,β = Xk
γ ' ,γ = Xl
γ ' ,δ( ) (i, j, k, and l can take the values 1 or 2).

Chapter 4
58
Fig. 4.1. The interstitial sublattice of γ'-Fe4N1-x Is subdivided into four penetrating
simple cubic sublattices α, β, γ, and δ. The basic cluster in the CVM tetrahedron
approximation, as indicated in the figure by the dashed lines, is constructed by taking
one site of each of these sublattices.
4.2.1. CONFIGURATIONAL ENTROPY
The configurational entropy of the ordering of N and V on the fcc interstitial
sublattice of γ'-Fe4N1-x is described as a function of the cluster distribution variables,
which indicate the frequency of occurrence of all possible arrangements of N and V
on the tetrahedron cluster and its subclusters (points and pairs). The subcluster
distribution variables are dependent on the tetrahedron distribution variable αβγδijklZ :
Pairs: Yij
αβ = Zijkl
αβγδ
kl
∑
Points: Xi
α = Zijkl
αβγδ
jkl
∑ (1)
where αβijY indicates the probability that a pair of nearest neighbor tetrahedron
sublattice sites of types α and β has configuration ij. For a binary system, i, j, k, l = 1,
2. The tetrahedron distribution variables obey the constraint
Zijkl
αβγδ
ijkl
∑ = 1 (2)
In the tetrahedron approximation, the configurational entropy contribution per lattice

Application of the CVM to an Interstitial Solid Solution: The γ'-Fe4N1-x / ε-Fe2N1-z Equilibrium
59
site of the fcc interstitial sublattice of γ'-Fe4N1-x is described by[7,5]:
( ) ( ) ( )
( ) ( ) ( ) ( )
( ) ( ) ( ) ( )
++
++
++++
+−−=
∑ ∑∑∑
∑ ∑ ∑∑
∑ ∑ ∑−−
k l
lk
j
j
i
i
jk jl kl
kljljk
il
il
ijkl ij ik
ikijijklB
NFe
XLXLXLXL
YLYLYLYL
YLYLZLkS x
δγβα
γδβδβγαδ
αγαβαβγδγ
45
214'
(3)
where kB is Boltzmann’s constant and the function L a( ) ≡ aln a .
4.2.2. INTERNAL ENERGY
The internal energy of the γ'-Fe4N1-x phase is taken equal to the sum of the internal
energies of all occurring tetrahedrons. For the interstitial sublattice of γ'-Fe4N1-x a
total number of N lattice sites corresponds with a total number of 2N tetrahedrons
(each interstitial lattice site pertains to two tetrahedrons). The internal energy U of the
system per lattice site is then described as
Uγ ' − Fe4 N1−x = 2 ε ijkl
αβγδZijkl
αβγδ
ijkl
∑ (4)
where αβγδε ijkl is the energy of a specific tetrahedron configuration. The tetrahedron
distribution variable αβγδijklZ indicates the frequency of occurrence of a specific
tetrahedron configuration. The tetrahedron energy αβγδε ijkl is described as a sum of the
pair-wise interaction energies within the tetrahedron:
( ) ( ) ( ) ( ) ( ) ( ) ( )[ ]rrrrrrr kljljkilikijijkl
γδβδβγαδαγαβαβχδ εεεεεεε +++++=21
(5)
where ( )rij
αβε is the pair interaction energy of an N-N pair ( 'γε NN ) or an N-V pair ( 'γε NV )
or a V-V-pair ( 'γεVV ) on the sublattice sites i and j, depending on the distance r
between the neighboring lattice sites i and j. The factor ½ takes into account that each
pair is shared by two tetrahedrons.

Chapter 4
60
4.2.3. INTERSTITIAL INTERACTIONS IN γ'-Fe4N1-x
The effective pair interaction energies in γ', ε ij
γ 'r( ), are described by an 8-4 type
Lennard-Jones potential given by Ref. [25]:
( )
−
=
4',08',0',0' 2
r
r
r
rr
ijij
ijij
γγγγ εε (6)
The parameter rij0,γ ' corresponds to the distance between the species (N or V)
on sites i and j, for which ε ij
γ 'r( ) has a minimum value equal to -ε ij
0,γ ' . For the
description of γ'-Fe4N1-x, all the interaction parameters were obtained in previous
work[5]. ',0 γεVV and rVV
o,γ ' were estimated from experimental values of the enthalpy of
formation and the lattice parameter of γ-Fe, respectively. The parameters εNV
o,γ ' , ',0 γε NN , ',0 γ
NVr , and rNN
o,γ ' , were obtained by optimizing the correspondence between the
calculated and the experimentally observed γ-Fe[N] / γ'-Fe4N1-x phase equilibrium
data. An overview of the Lennard-Jones parameters describing the pair-wise
interactions of γ'-Fe4N1-x is given in Table 4.1.
Table 4.1. Lennard-Jones parameters γ'-Fe4N1-x
Pair interaction oε (kJ/mol) o
VV
o εε / 0r (nm) 0
0
VV
VV
r
r
V-V 68.270 1.000 0.25265 1.000
V-N 0.971 0.26687 1.056
N-N 0.700 0.29459 1.166
4.3. THERMODYNAMICS OF ε-Fe2N1-z
In the CVM calculations, the (long-range) ordering of N and V on the simple
hexagonal interstitial sublattice of ε-Fe2N1-z is described using the prism
approximation[10,11]. The ε-Fe2N1-z phase displays a large solubility domain:

Application of the CVM to an Interstitial Solid Solution: The γ'-Fe4N1-x / ε-Fe2N1-z Equilibrium
61
0 < z < 0.6 [12]. The ε-phase structure is conceived as consisting of a fully occupied
hcp Fe sublattice and a simple hexagonal interstitial sublattice, constituted by the
octahedral interstices of the Fe sublattice. The simple hexagonal interstitial sublattice
is subdivided in six interpenetrating simple hexagonal sublattices, denoted by
superscripts α, β, γ, δ, η, and κ see Fig. 4.2.). Each site of the basic prism cluster
represents one type of the six simple hexagonal sublattices α up to κ. The occupation
of the prism sites by atoms N or vacancies V is indicated by the value of the
subscripts i, j, k, l, m and n, which take a value of 1 (occupied by N) or 2 (vacancy V).
Fig. 4.2. The interstitial sublattice of ε-Fe2N1-z is subdivided into six simple hexagonal
sublattices α, β, γ, δ, η, and κ. The basic cluster in the CVM prism approximation is
constructed by taking one site of each of these sublattices.
Both experimental data[13-17] and thermodynamic calculations[2] show that with
changes in composition, different types of long-range ordering of interstitial N atoms
and vacancies can occur. Because the types of ordering and their temperature and
composition ranges of occurrence are not well established yet, no a priori assumption

Chapter 4
62
has been made about the occupations by either atoms N or vacancies V of the prism
sublattice sites in the description of the thermodynamics of ε-Fe2N1-z. In advance
designation of N-type sites and V-type sites as for γ' (Section 4.2.) has not been
performed. The probabilities to find N or V on a sublattice site
Xi
ε ,α , Xj
ε , β , Xk
ε ,γ , Xl
ε ,δ , Xm
ε,η , Xn
ε ,κ (i, j, k, l, m, n equal to 1 or 2) are the outcome of the
calculations.
4.3.1. CONFIGURATIONAL ENTROPY
The configurational entropy of the ordering of N and V on the simple
hexagonal interstitial sublattice of ε-Fe2N1-z is described as a function of the cluster
distribution variables, which indicate the frequency of occurrence of all possible
arrangements of N and V on the prim cluster and its subclusters (points, pairs,
triangles and rectangles). The subcluster distribution variables are dependent on the
prism distribution variable Pijklmn
αβγδηκ :
Rectangles Rijlm
αβδη = Pijklmn
αβγδηκ
kn
∑ , ...
Triangles Tijk
αβγ = Pijklmn
αβγδηκ
lmn
∑ , ...
Horizontal pairs YHij = Pijklmn
αβγδηκ , ...klmn
∑
Vertical pairs YVil = Pijklmn
αβγδηκ , ...jkmn
∑
Points Xi = Pijklmn
αβγδηκ
jklmn
∑ , ...
(7)
The prism distribution variables obey the constraint
Pijklmn
αβγδηκ
ijklmn
∑ = 1 (8)
In the prism approximation the configurational entropy per lattice site for the simple
hexagonal interstitial sublattice is described by

Application of the CVM to an Interstitial Solid Solution: The γ'-Fe4N1-x / ε-Fe2N1-z Equilibrium
63
( ) ( ) ( )
( ) ( ) ( ) ( )
( ) ( ) ( ) ( )
( ) ( ) ( ) ( )
( ) ( ) ( ) ( ) ( ) ( )
+++++
−
+++
+++
+
+
+
+−
++−−=
∑∑∑∑∑∑
∑∑∑∑
∑∑∑∑
∑∑∑∑
∑ ∑∑−−
n
n
m
m
l
l
k
k
j
j
i
i
mn
mnj
lm
lm
jk
jk
ik
ik
ij
ij
kn
kn
jm
jm
il
il
lmn
lmn
ijk
ijk
ik
ik
ijklmn jkmn
jkmn
ijlm
ijlmijklmnB
NFe
XLXLXLXLXLXL
YHLYHLYHLYHL
YHLYHLYVLYVL
YVLTLTLRL
RLRLPLkS zN
κηδγβα
ηκδκδηβγ
αγαβγκβη
αδδηκαβγαγδκ
βγηκαβδηαβγδηκε
61
21
31
2
lnln
lnln
1
(9)
4.3.2. INTERNAL ENERGY
The internal energy is taken equal to the sum of the internal energies of all
occurring prisms. For the interstitial sublattice of ε-Fe2N1-z a total number of N lattice
sites corresponds with a total number of 2N prisms (each interstitial lattice site
belongs to two prisms). The internal energy U of the system per lattice site is then
described as
Uε −Fe2 N1−z = 2 εijklmn
αβγδηκPijklmn
αβγδηκ
ijklmn
∑ (10)
where ε ijklmn
αβγδηκ is the energy of a specific prism configuration. The prism distribution
variable Pijklmn
αβγδηκ indicates the frequency of occurrence of a specific prism
configuration. Each interstitial site in ε-Fe2N1-z is surrounded (on the interstitial
sublattice) by two nearest-neighbor sites in the vertical direction and six next-nearest-
neighbor sites in the horizontal direction (cf. Fig. 4.2.). Therefore, for the internal
energy of ε-Fe2N1-z, two types of interactions are distinguished: vertical (nearest-
neighbor) and horizontal (next-nearest-neighbor). The prism energy ε ijklmn
αβγδηκ is
described as the sum of the pair-wise interaction energies within the prism:
[] [ ])()()()(
)()()()()(41
)(
,,,,
,ln
,,,,
rrrr
rrrrrr
v
kn
v
jm
v
il
h
mn
hh
lm
h
jk
h
ik
h
ijijklmn
γκβηαδηκ
δκδηβγαγαβαβγδηκ
εεεε
εεεεεε
++++
++++= (11)

Chapter 4
64
where the factors 1/4 and 1/6 take into account that the next-nearest-neighbor
(horizontal) pairs and next-neighbor (vertical) pairs are shared by four and six prisms,
respectively. The superscripts v and h indicate whether vertical or horizontal
interactions are considered andε ij
αβr( ) is the pair interaction energy of an N-N pair
(εNN
ε ), an N-V pair (εNV ) or a V-V pair (εVV
ε ) on the sublattice sites i and j, depending
on the distance r between neighboring sites i and j.
4.3.3. INTERSTITIAL INTERACTIONS IN ε-Fe2N1-z
The effective pair interaction energies in ε are described by 8-4 type Lennard-
Jones potentials similar to that given in Eq. (6) for γ'. Two sets of Lennard-Jones
potentials are needed to account for the vertical nearest-neighbor and horizontal next-
nearest-neighbor interactions occurring in the prism cluster. The parameters rVV
0,ε ,v and
rNN
0,ε ,v (vertical interactions) and rVV
0,ε ,h and rNN
0,ε ,h (horizontal interactions) are estimated
from the lattice-parameter relationships[18]
a(yN ) = 0.44709 + 0.0673yN (nm)
c(yN ) = 0.42723 + 0.0318yN (nm) (12)
where yN is the fraction of occupied interstitial sites in the structure. The values of
rVV
0,ε ,v and rNN
0,ε ,h are obtained by extrapolation of Eqs. (12) to yN = 0 and yN = 1 and
taking:
rVV
0,ε ,h =a(yN = 0)
3,rNN
0,ε ,h =a(yN =1)
3
rVV
0,ε ,v =c(yN = 0)
2, rNN
0,ε ,v =c(yN = 1)
2
(13)
To restrict the number of fit parameters, rVN
0,ε ,h pertaining to the horizontal V-N
interactions in ε is chosen such that rVN
0,h : rVV
0,ε ,h =1.056, equal to the value of rVN
0,γ ' :rVV
0,γ ' as
obtained from the previous CVM calculation of the γ-Fe[N] / γ'-Fe4N1-x phase
equilibrium (cf. Table 4.1.). Next, the Lennard-Jones parameter rVN
0,ε ,v describing the
vertical V-N interaction in ε-Fe2N1-z is obtained from rVV
0,ε ,v by using the same ratio as
above (Tables 4.2. and 4.3.). Realizing that the energy difference between the close-

Application of the CVM to an Interstitial Solid Solution: The γ'-Fe4N1-x / ε-Fe2N1-z Equilibrium
65
Table 4.2. Horizontal Lennard-Jones parameters ε-Fe2N1-z
Pair interaction ho ,,εε (kJ/mol) ho
VV
ho ,,,, / εε εε hor .,ε (nm) ho
VV
ho
r
r,,
,,
ε
ε
V-V 68.270 1.000 0.258128 1.000
V-N 0.954 0.272583 1.056
N-N 0.700 0.296983 1.151 Table 4.3. Vertical Lennard-Jones parameters ε-Fe2N1-z
Pair interaction vo ,,εε (kJ/mol) vo
VV
vo ,,,, / εε εε vor ,,ε (nm) vo
VV
vo
r
r,,
,,
ε
ε
V-V 204.811 1.000 0.213615 1.000
V-N 0.954 0.219596 1.028
N-N 0.700 0.229515 1.074
packed structures fcc and hcp is small, the parameters εVV
0,γ ' and εNN
0,γ ' obtained from the
calculation of the γ / γ' phase equilibrium[5] are taken as an estimate for those for the ε-
Fe2N1-z as follows. For γ and γ' phases the Fe sublattice and the interstitial sublattice
structures are the same and thus the sum of all effective pair interactions obtained for
the interstitial lattice is representative for the total internal energy of the system
without more ado, recognizing that the effective interaction parameters incorporate
atomic interactions of the Fe and interstitial sublattices. For the ε-Fe2N1-z phase, the
structures of the Fe sublattice and the interstitial sublattice are different (hcp vs.
simple hexagonal) and hence the number of pair-wise interactions within each of the
sublattices is different. In the Fe sublattice each atom has twelve neighbors of which
six next-nearest-neighbor (= horizontal interactions) and six nearest-neighbor (=
vertical interactions) whereas in the interstitial sublattice each site has eight
neighboring sites of which six next-nearest-neighbor (= horizontal interactions) and
two nearest-neighbor (= vertical interactions). Thus the ratio of neighboring
horizontal lattice sites in the Fe hcp lattice and in the simple hexagonal interstitial
sublattice is 1:1 and the ratio of neighboring vertical lattice sites in the Fe hcp lattice
and the simple hexagonal interstitial lattice is 3:1. The sum of all effective pair

Chapter 4
66
interaction energies on the basis of the interstitial sublattice should represent the total
internal energy of the system, i.e. including the interactions of the Fe atoms. This
implies that the vertical effective pair-wise interaction energies (εVV
0, ε, v , εVN
0, ε, v and
εNN
0, ε, v ) based on the interstitial sublattice should be about three times εVV
0,γ ' , εVN
0,γ '
andεNN
0,γ ' , whereas the horizontal pair-wise effective interactions (εVV
0, ε, h , εVN
0, ε, h and
εNN
0, ε, h ) should be equal to approximately εVV
0,γ ' , εVN
0,γ ' andεNN
0,γ ' . The parameters εVN
0, ε (with
εVN
0, ε, v ≈ 3εVN
0,γ ' and εVN
0, ε, h ≈ εVN
0,γ ' ; see previous discussion) and rVN
0,ε ,v are used as fit
variables and are determined by minimizing the difference between the experimental
and calculated γ'-Fe4N1-x / ε-Fe2N1-z phase boundaries. The Lennard-Jones parameters
for ε-Fe2N1-z applied in the calculation of the internal energy of ε-Fe2N1-z have been
gathered in Tables 4.2. and 4.3.
4.4. THE CALCULATION OF THE γ'-Fe4N1-x / ε-Fe2N1-z
EQUILIBRIUM
By applying the CVM, both phase boundaries of a miscibility gap can be calculated
simultaneously using only one set of fitting parameters. Since in case of the phase
equilibrium between γ'-Fe4N1-x and ε-Fe2N1-z two miscibility gaps occur (Fig. 4.3.),
application of the CVM to the γ' / ε equilibrium implies that even four phase
boundaries are calculated simultaneously with one set of interaction parameters.
Previous calculations of the γ'-Fe4N1-x / ε-Fe2N1-z phase equilibrium were firstly based
on a (sub)-regular solution model without incorporating LRO[19,20] and, later, based on
the Gorsky-Bragg-Williams approximation[2,21] incorporating a priori two types of
LRO indicated by A and B[2]. In the present CVM approach, occurrence of SRO
and/or LRO for the N atoms on the interstitial lattice is not incorporated in advance,
but is established as the outcome of the calculations. Next, the procedure followed to
calculate the phase equilibria is briefly indicated, a detailed description can be found
in Ref. [5]. Compared with substitutional solid solutions, interstitial solid solutions
such as Fe-N phases exhibit a pronounced dependence of the volume on the solute
(nitrogen) content. To take this volume-effect into account, in the present work the
energy is expressed in terms of the Gibbs (instead of the Helmholtz) energy. The
temperature and external pressure were kept constant during the energy minimization.

Application of the CVM to an Interstitial Solid Solution: The γ'-Fe4N1-x / ε-Fe2N1-z Equilibrium
67
Fig. 4.3. Schematic Fe-N phase diagram indicating the two miscibility gaps
ε-Fe2N1-z / γ'-Fe4N1-x denoted by I and γ'-Fe4N1-x / ε-Fe2N1-z denoted by II.
4.4.1. CALCULATION OF PHASE EQUILIBRIA USING THE CVM
For each phase, a thermodynamic function Ω, referred to as the grand potential
function, is defined
Ω p,T ,µ1∗,µ 2
∗( )≡ U − TS + pV − µ n
*xn
n=1
2
∑ = G − µn
*xn
n=1
2
∑ (14)
where G is the Gibbs energy, U is the internal energy, S is the entropy and V is the
volume, all per cluster site. T is the temperature, p is the external pressure and xn
denotes the mole fraction of component n (n = 1,2; here N, V) in the phase
considered, that is for the tetrahedron approximation: xn = ( Xn
α + Xn
β + Xn
γ + Xn
δ ) / 4
and for the prism approximation xn = ( Xn
α + Xn
β + Xn
γ + Xn
δ + Xn
η + Xn
κ )/ 6 .
Furthermore, µn∗ is the effective chemical potential[8], defined as
µn
* = µn − 12 µn
n =1,2∑ (15)
where µn is the chemical potential of component n.

Chapter 4
68
The grand potential functions Ωγ', for the γ' phase, and Ωε, for the ε phase, can
be minimized with respect to αβγδijklZ and Pijklmn
αβγδηκ , respectively for an adopted value for
∆µ = µ1∗ - µ2
∗ (see Ref. [5], Appendix A). Lagrange multipliers λγ' and λε are introduced
to account for the normalization constraints of respectively the tetrahedron and prism
distribution variables (cf. Eqs. (2) and (8)). The grand potential functions are then
minimized by applying the Natural Iteration method[22,6]. The minimization condition
of the grand potential function Ωγ' with respect to αβγδijklZ yields
Zijkl
αβγδ = expλγ '
2kBT
exp
-ε ijkl
kBT
exp
µi
∗ + µ j
∗ + µk
∗ + µl
∗
8kBT
Yijkl
1 / 2Xijkl
−5 / 8 (16)
with Xijkl ≡ Xi
αX j
βXk
γX l
δ and Yijkl ≡ Yij
αβYik
αγYil
αδYjk
βγYjl
βδYkl
γδ (17)
Minimization of the grand potential function Ωε with respect to Pijklmn
αβγδηκ yields
12/16/14/12/12/1
******
12expexp
2exp
ijklmnijklmnijklmnijklmnijklmn
B
iiiiii
B
ijklmn
B
ijklmn
XYVYHTR
TkTkTkP
−−×
+++++
−
=
µµµµµµελεαβγδηκ
with
Rijklmn ≡ Rijlm
αβδηRjkmn
βγηκRikln
αγδκ (18)
Tijklmn ≡ Tijk
αβγTlmn
δηκ
YHijklmn ≡ YHij
αβYHik
αγYH jk
βγYHlm
δηYHln
δκYHmn
ηκ , YVijklmn ≡ YVil
αδYVjm
βηYVkn
γκ
Xijklmn ≡ X i
αXj
βXk
γXl
δXm
ηXn
κ
At the minimum of Ω for each phase the volume per cluster site, V, at constant
p (taken as atmospheric pressure), ∆µ and constant T is determined by –p = dU/dV.
At each temperature, a curve of Ω(minimum) versus µ* is thus obtained for each
phase. Thermodynamic equilibrium of the phases involved, γ' and ε, then is
determined by the points of intersection of the Ωγ ' (minimum) − µ *,γ ' and
Ωε(minimum) − µ*,ε curves for each temperature, representing the phase boundaries
of miscibility gap I and II, respectively (Fig. 4.4.).

Application of the CVM to an Interstitial Solid Solution: The γ'-Fe4N1-x / ε-Fe2N1-z Equilibrium
69
Fig 4.4. Schematic representation of the determination of the points of intersection of
the curves Ωγ' (minimum) – µ*, γ' and Ω (minimum) – µ*, ε
at a fixed temperature. From
each point of intersection, cluster distribution variables and lattice parameters for the
ε-Fe2N1-z and γ'-Fe4N1-x phases in thermodynamic equilibrium are obtained. The point
of intersection of the miscibility gap ε / γ' is indicated by I and for the miscibility gap
γ' / ε by II.
4.5. DISCUSSION
The procedure outlined in Sections 4.2. to 4.4. allows calculation of phase boundaries
and analysis of the distribution of nitrogen atoms over the interstitial lattice
(corresponding to occurrence of SRO or LRO) of γ'-Fe4N1-x and ε-Fe2N1-z.
The calculation of the compositions of γ'-Fe4N1-x and ε-Fe2N1-z at the ε / ε+ γ'
and ε+ γ' / γ' phase boundaries (miscibility gap I) and at the γ' / γ'+ε and γ'+ε / ε phase
boundaries (miscibility gap II) (Fig. 4.5.) is presented for temperatures in the range of
550 to 950 K (Section 4.5.1.).
The presence of the N atoms in interstitial octahedral sites of the iron nitrides
results in strain-induced N-N interactions and, upon increasing the nitrogen content,
the N atoms start to order. The variation in nitrogen content in ε-Fe2N1-z is very large
compared with other Fe-N phases; both short- and long-range ordering of N atoms are

Chapter 4
70
expected to occur. The values for the cluster distribution variables, pertaining to the
γ'-Fe4N1-x / ε-Fe2N1-z phase equilibrium, are used to discuss ordering of N in
γ'-Fe4N1-x (Section 4.5.2.) and in ε-Fe2N1-z (Section 4.5.3.). Finally, on the basis of the
values of the cluster distribution variables, values for the fractions of Fe atoms
surrounded by zero, one or more N atoms can be calculated. The latter values are
compared with Mössbauer data (Section 4.5.4.).
4.5.1. THE γ'-Fe4N1-x / ε-Fe2N1-z PHASE EQUILIBRIA
The γ'-Fe4N1-x / ε-Fe2N1-z phase equilibrium consists of two miscibility gaps
(Fig. 4.3.). The calculated miscibility gaps, using the atomic interaction parameters
given in Table 4.2. and 4.3., as well as the corresponding available experimental data,
are shown in Fig. 4.5.
The calculated ε / ε+ γ' phase boundary of miscibility gap I well agrees with the
experimental data (Fig. 4.5.). For both the ε+ γ' / γ' phase boundary (miscibility gap I)
and the γ' / γ'+ε phase boundary (miscibility gap II), the present CVM calculation
results in nitrogen contents of the γ' phase within the range of the experimental data. It
should be noted that the experimental data for the composition of γ' at both γ' / ε phase
boundaries show considerable scatter. The minimum solubility limit of N in γ' in the
temperature range of 923K to 940 K (miscibility gap I) as obtained from the
calculations, 19.5 at.% N to 19.6 at.% N, is within the experimentally observed
nitrogen contents that vary between about 18 at.% N to 19.6 at.% N. The maximum
solubility limit of nitrogen in γ' as obtained from the calculations in the temperature
range of 573 K to 940 K (miscibility gap II) is between 19.98 at.% N and 19.47 at.%
N, which is close to the experimentally obtained nitrogen contents that vary from20.7
at.% N to 19.2 at.% N. The solubility limit of the ε phase (gap II) agrees well with the
experimental data at high temperatures, but deviations occur in the low-temperature
region (< 800 K). The calculated phase boundary results in a nitrogen content of the ε
phase between 24.7 at.% N and 24.9 at.% N between 800 K and
600 K, whereas the corresponding experimental data range between 24.5 at.% N and
26.3 at.% N.

Application of the CVM to an Interstitial Solid Solution: The γ'-Fe4N1-x / ε-Fe2N1-z Equilibrium
71
Fig. 4.5. Part of the Fe-N phase diagram, showing the γ'-Fe4N1-x / ε-Fe2N1-z phase
equilibria calculated by CVM, as well as the available literature data. The miscibility
gap ε / γ' is indicated by I and the miscibility gap γ' / ε by II (cf. Fig. 3.3.)
In the present calculations, possible changes in the vibrational entropy, caused
by changes of temperature and composition, are not incorporated explicitly.
Neglecting changes in vibrational entropy is reasonable for γ'-Fe4N1-x because the
degree of ordering of N and the composition are almost constant along the phase
boundary (Section 4.5.2.). Indeed, in the temperature range considered, the changes in
vibrational entropy are reported to be very small for γ'-Fe4N1-x[23]. The ε-Fe2N1-z phase
has a broad composition range which corresponds to a large variation in the degree of
ordering of N atoms (Section 4.5.3.) that may cause a variation in vibrational entropy
contribution. Although contributions of the vibrational entropy are not explicitly
incorporated in the CVM calculations, their dependence on composition may be

Chapter 4
72
implicitly represented by the relative contributions of the V-V, N-V or N-N pair
interactions as a function of composition. Thus, the observed discrepancies between
the calculations and the experimental phase boundaries may be caused primarily by
neglecting possible temperature dependencies of the effective interaction parameters.
In this context it must be noted that the parameters used were optimized for the γ / γ'
phase boundary[5] (cf. Sections 4.2. and 4.3.); that is, they hold in particular for a
temperature range of about 800 to 900 K. Indeed, the discrepancies in Fig. 4.5. mainly
occur at temperatures below about 800 K. Furthermore, it should be remarked that for
the calculation of the γ' / ε phase equilibrium in the present work (Section 4.3.2.) only
the parameters εVN
0, ε and rVN
0,ε ,v describing the effective interactions in the ε phase were
adapted to optimize the correspondence of the calculated with the experimental phase
boundaries.
4.5.2. ORDERING OF NITROGEN ATOMS IN γ'-Fe4N1-x
The degree of long-range ordering of the interstitial nitrogen atoms in γ'-Fe4N1-x can
be described using an order parameter, ρ, defined as (cf. Refs. [1,5])
+−
= βγαγ
βγαγ
ρ ',1
',1
',1
',1
3XX
XX (19)
where the probability of finding N on a α-type sublattice site (i.e. N-type site) is
indicated by X1γ ' ,α while the probability of finding N on a β-type (i.e. V-type site)
sublattice site is X1γ ' ,β(= X1
γ ' ,γ = X1γ ' ,δ ) . The order parameter is a function of the
fraction of occupied interstitial sites yN and is shown in Fig. 4.6. for γ'-Fe4N1-x in
equilibrium with ε-Fe2N1-z. The order parameter is close to unity in the temperature
(and composition) range considered (Fig. 4.6.), indicating the nearly perfect long-
range ordering of the N atoms. As expected for lower N contents, a smaller order
parameter is observed[1,5].

Application of the CVM to an Interstitial Solid Solution: The γ'-Fe4N1-x / ε-Fe2N1-z Equilibrium
73
Fig. 4.6. The degree of order ρ for γ'-Fe4N1-x in equilibrium with ε-Fe2N1-z as a
function of the fraction of occupied interstitial sites, yN, as obtained from the cluster
distribution variables, using Eq. (19).
4.5.3. ORDERING OF NITROGEN ATOMS IN ε-Fe2N1-z
The prism distribution variables, Pijklmn
αβγδηκ , of the main configurations occurring in the
composition range of ε-Fe2N1-z, as studied in the present work, are shown as a
function of the nitrogen content in Fig. 4.7. The data correspond to ε-Fe2N1-z in
equilibrium with γ'-Fe4N1-x in the temperature range of 573 K to 940 K (i.e. each data
point corresponds to a different temperature). The fraction of prisms containing three
atoms N is less than 0.01 (not shown) and the fraction of prisms containing more than
three atoms N is negligible. The number of possible distributions over the sites of the
prism is large when the nitrogen content is low.
The fraction of prisms containing one or no nitrogen deviates from that of a
random distribution (Section 4.5.4.) suggesting the occurrence of short-range ordering
of atoms N and vacancies V on the interstitial sublattice. Upon increasing nitrogen
content prism configurations of two nitrogen atoms become more prominent, and at

Chapter 4
74
25 at.% N only one prism configuration, in which sites β and κ are fully occupied, is
present.
Fig. 4.7. The value of the predominantly occurring prism distribution variables
pertaining to the calculated γ'-Fe4N1-x / ε-Fe2N1-z phase equilibria as a function of the
nitrogen content ( N, V).
The corresponding occupations of the six interstitial sites α up to κ
constituting the prism cluster as derived from the prism distribution variables, are
shown in Fig. 4.8. as a function of the nitrogen content. Note that Fig. 4.8. consists of
the data on the occupation of the prism sites representing the ordering of the nitrogen

Application of the CVM to an Interstitial Solid Solution: The γ'-Fe4N1-x / ε-Fe2N1-z Equilibrium
75
atoms in ε-Fe2N1-z for both calculated miscibility gaps (I and II; Fig. 4.3.).
Apparently, no discontinuities occur for the point distribution variables as function of
the nitrogen content.
Clearly, the distribution of nitrogen over the interstitial lattice sites is not
random. The N atoms in ε-Fe2N1-z exhibit a preference not to be surrounded by N
atoms on nearest-neighboring interstitial sites, i.e. the sites β and κ, positioned
diagonally in the CVM basic prism cluster, are filled preferentially.
Fig. 4.8. The value of the point distribution variables representing the fractional
occupation of sites α, β, γ, δ, η, and κ, obtained by summation of the prism
distribution variables (Eq. (7)) pertaining to the calculated γ'-Fe4N1-x / ε-Fe2N1-z
phase equilibria.

Chapter 4
76
When the nitrogen content is low, i.e. only a small fraction of the interstitial sites in ε-
Fe2N1-z is occupied, the differences in occupation between the six sites are not
pronounced, but there is a slight preference for occupation of sites of type β and κ,
and α and δ. The X-ray diffraction pattern of a powder sample nitrided at 958 K
containing γ-Fe[N], γ'-Fe4N1-x and ε-Fe2N1-z is shown in Fig. 4.9. Indeed, for the ε-
Fe2N1-z phase containing less than 20 at.% N, only the main reflections (denoted by m
in Fig. 4.9.) are observed. The superstructure reflections (denoted by s in Fig. 4.9.),
generally present when long-range ordering of the N atoms on the interstitial
sublattice occurs, are absent. Even the most prominent superstructure reflection, of
which the position is indicated by ε 101s in Fig. 4.9., is not observed.
Fig. 4.9. X-ray diffraction pattern (Co Kα1 radiation) of an iron powder sample
nitrided at 958 K and containing the phases γ-Fe[N], γ'-Fe4N1-x, and ε-Fe2N1-z. The
ε-Fe2N1-z phase as a nitrogen content of <20 at. % N. The positions of the main
reflections (m) and the superstructure reflections (s) of ε-Fe2N1-z have been indicated.
Since no superstructure reflections due to the presence of N atoms are observed for
the ε phase, long-range ordering of N atoms is practically absent.

Application of the CVM to an Interstitial Solid Solution: The γ'-Fe4N1-x / ε-Fe2N1-z Equilibrium
77
Upon increasing nitrogen content, in particular the fractional occupation of the
sites β and κ, and also the fractional occupation of the (nearest neighboring) sites α
and δ increases (Fig. 4.8.). When the nitrogen content becomes larger than about 16
at.%, the preference for the occupation of sites β and κ increases rapidly, whereas the
occupation of the sites α, γ, δ and η decreases gradually. Occupation of the sites β
and κ creates as much distance as possible between the N atoms. When the fraction of
occupied sites in ε-Fe2N1-z approaches a nitrogen content of 25 at.% (i.e. ε-Fe3N) a
distinctly ordered configuration is observed: the sites β and κ are fully occupied,
whereas the sites α, γ, δ and η are empty. Note that in the CVM prism approximation
applied in the present work, no distinction has been made between interstitial lattice
sites preferably occupied by either nitrogen atoms or vacancies, implying that no
specific ordered structure was included explicitly. The result obtained here at 25 at.%
N pertains to an occupation of the prism sites compatible with the structure of Fe3N as
proposed in literature on the basis of diffraction experiments[13,15]. The resulting
distribution of N atoms over the interstitial sublattice is also compatible with the so-
called B configuration[2] obtained for Fe3N by thermodynamic calculations using the
Gorsky-Bragg-Williams approximation.
4.5.4. COMPARISON WITH MÖSSBAUER DATA
Quantitative data of ordering of nitrogen atoms in an iron matrix can be deduced from
Mössbauer spectra. In this section, results of the CVM calculations of the local
surroundings of Fe atoms in ε-Fe2N1-z by N atoms and vacancies are presented and
compared to the available Mössbauer data.
The interpretation of Mössbauer spectra provides values for the fractional
occurrences of Fe atoms in ε-Fe2N1-z surrounded by 0, 1, ..., 6 atoms N (AnN, nN = 0-6)
on the six nearest neighboring interstitial sites (α, β, γ, δ, η, and κ) surrounding an Fe
atom in the ε-Fe2N1-z structure, which constitute the CVM basic cluster (Fig. 4.2.).
The overall Mössbauer spectrum is composed of several subspectra, each
corresponding to a certain type of surroundings of the Fe atoms.
The CVM calculations yield values for the prism distribution variables, which
describe the fractional occurrences of all distributions of zero to six N atoms over the
sites of the prism cluster, adding up to a total of 26 = 64 possibilities (i.e. clusters).
Next, the fraction of prisms with a certain number of interstitial atoms nN, pertaining

Chapter 4
78
to ε with an occupied fraction of interstitial sites yN, PnN
CVM (yN), is obtained
straightforwardly by summation of the distribution variables Pijklmn
αβγδηκ for the prisms
containing nN nitrogen atoms.
While calculating the surroundings of the Fe atoms from the prism distribution
variables, all prisms containing one atom N (or three atoms N) are considered as
equivalent; the various configurations for prisms containing two atoms N are treated
separately.
Since the nitrogen content of ε-Fe2N1-z in equilibrium with γ'-Fe4N1-x is
relatively low, the surroundings for zero and one Fe atoms and one of the
surroundings for two Fe atoms (A0, A1 and A2D respectively, Fig. 4.10.(a)) are most
prominent. The probability of all other possible types of Fe surroundings is less than
1% (Fig. 4.10.(b)). Starting at low nitrogen contents, the occurrence of A0 decreases
gradually with increasing nitrogen content, while that of A2D increases strongly. The
occurrence of A1 increases slightly initially, and then starts to decrease from a
nitrogen content of about 14.5 at.% N, i.e. in parallel with the tendency for the N
atoms to order stronger (Fig. 4.8.). As has been described in the previous section, the
ordering that occurs when the composition of ε-Fe2N1-z approaches Fe3N, corresponds
with the occupation of two of the six interstitial (prism) sites, positioned diagonally
with respect to each other (corresponding to A2D in Fig. 4.10.(a)). The occurrences of
A2V, A2H and A3D each have only a small maximum value depending on the nitrogen
content (Fig. 4.10.(b)). The contribution of the remaining Fe surroundings (not
shown) can be neglected.
The probabilities PnN
CVM (yN) of the calculated total Fe surroundings A0, A1 and
A2 (equal to the sum of A2D, A2V and A2H), the corresponding probabilities PnN
random(yN)
for a random distribution of nitrogen and the few available literature data[24] as
obtained from Mössbauer experiments, are shown in Fig. 4.11. The probability of the
surroundings for a random distribution of nitrogen, PnN
random(yN), were calculated from
( ) ( ) ( ) NsNs
N
N
nn
N
n
N
n
nN
random
n yyyP−−
= 1 (20)
where yN is the fraction of occupied sites of the interstitial sublattice of ε-Fe2N1-z (the
atomic percentage of N equals 100*yN/(1+yN)) and nS is the number of cluster sites
(here, nS = 6). The calculated CVM data on the Fe-surroundings pertain to ε-Fe2N1-z in

Application of the CVM to an Interstitial Solid Solution: The γ'-Fe4N1-x / ε-Fe2N1-z Equilibrium
79
equilibrium with γ'-Fe4N1-x. The experimental Mössbauer data in Fig. 4.11. have been
obtained from samples prepared at temperatures different from the ones used in the
calculations. Considering the experimental error associated with fitting of Mössbauer
spectra, and, in particular, that no specific type of ordering was adopted in the CVM
description of the thermodynamics of ε-Fe2N1-z (Section 4.3.), the calculated data for
the occurrences of specific Fe surroundings describe the experimental data very well.
Fig. 4.10.(a) and (b) Calculated Fe-surroundings, CVM
nN
P (see text), as a function of the
nitrogen content of ε-Fe2N1-z (in equilibrium with γ'-Fe4N1-x). The values given pertain
to the total fraction of prisms with a certain number of interstitial atoms nN. This is
denoted by [ ]. Only for Fe surroundings by two N atoms, a distinction has been made
between the total of prism configurations with N atoms positioned horizontally,
vertically, or diagonally with respect to each other. For the range of nitrogen
contents of ε-Fe2N1-z, only one type of Fe surroundings by three N atoms occurs.

Chapter 4
80
Fig. 4.11. Calculated total surroundings of the Fe atoms by 0, 1, and 2 N atoms as a
function of the nitrogen content of ε-Fe2N1-z (in equilibrium with γ'-Fe4N1-x). The
corresponding values in case of a random distribution of N atoms on the interstitial
sublattice and the literature values as obtained by Mössbauer spectroscopy have been
indicated as well.
4.5.5. LATTICE PARAMETERS
The lattice parameters a (distance between next-nearest-neighboring N atoms) and c
(distance between nearest-neighboring N atoms) of ε-Fe2N1-z as obtained from the

Application of the CVM to an Interstitial Solid Solution: The γ'-Fe4N1-x / ε-Fe2N1-z Equilibrium
81
CVM calculations are compared with the corresponding experimental data[13,26] in
Fig. 4.12. It should be noted that the small (less than 0.6%) thermal expansion effects
caused by the differences between the temperature pertaining to the CVM calculations
and room temperature, at which the values of the experimental data hold, have been
neglected.
The calculated lattice-parameter values are smaller than the experimental ones
(Fig. 4.12.). This is compatible with the general observation that CVM calculations
underestimate[25,5] the value of the lattice parameters. Although the reason for this is
not established, it may be suggested that the adoption in the CVM calculation of the
N-N and V-V distances as linear extrapolations of the experimental lattice-parameter
data (see Eq. (13)), thereby neglecting the displacements of the locally surrounding Fe
atoms caused by the N atoms, may explain the discrepancy.
Fig. 4.12. Calculated values for the lattice parameters a and c of ε-Fe2N1-z as a
function of nitrogen content. The corresponding experimental data for the lattice
parameter relations Eq. (12) have been indicated.

Chapter 4
82
4.6. CONCLUSIONS
1. The thermodynamics of the short-range and long-range ordering of nitrogen
atoms on the interstitial sublattices of γ'-Fe4N1-x and ε-Fe2N1-z has been
described successfully by the application of the cluster variation method
(CVM). As basic clusters a tetrahedron (for γ'-Fe4N1-x) and a prism (for ε-
Fe2N1-z) of interstitial sublattice sites were chosen. The interactions with the
iron sublattice were incorporated through effective interaction parameters.
2. The two ε+ γ' miscibility gaps (i.e. four phase boundaries) were described by
adopting a single set of pair interaction energy parameters.
3. The CVM calculations demonstrate the occurrence of distinct long-range
ordering of N in γ'-Fe4N1-x and the occurrence of short- and long-range
ordering of N in ε-Fe2N1-z. The long-range ordering (type B) occurring in ε-
Fe2N1-z at N contents close to 25 at.% N is in agreement with the type of
ordering for Fe3N evidenced by diffraction experiments.
4. The occurrences of the surroundings of the Fe-atoms as predicted by the CVM
calculations are in good agreement with experimental data obtained from
Mössbauer spectrometry.
5. Theoretical values obtained for the lattice parameters of the ε-Fe2N1-z phase
tend to be up to 1% smaller than the few available experimental data in the
composition range studied.

Application of the CVM to an Interstitial Solid Solution: The γ'-Fe4N1-x / ε-Fe2N1-z Equilibrium
83
REFERENCES
1. Kooi, B.J., M.A.J. Somers, E.J. Mittemeijer, Metall. Mater. Trans. A, 1996a, vol. 27, pp. 1055
2. Kooi, B.J., M.A.J. Somers, E.J. Mittemeijer, Metall. Mater. Trans. A, 1994, vol. 25, pp. 2797
3. Kikuchi, R., H. Sato, Acta Metall., 1974, vol. 22, pp. 1099
4. DeFontaine, D., C. Wolverton, Ber. Bunsenges. Phys. Chem., 1992, vol. 96 (11), pp. 1503
5. Pekelharing, M.I., A.J. Böttger, M.A.J. Somers, E.J. Mittemeijer, Met. Mat. Trans., 1999, vol.
30A, pp. 1945
6. Kikuchi, R., D. De Fontaine, M. Murakami, T. Nakamura, Acta Met., 1977, vol. 25, pp. 207
7. Kikuchi, R., D. De Fontaine, Proceedings of a Workshop in the Application of Phase Diagrams in
Metallurgy and Ceramics (Gaithersburg, Maryland: National Bureau of Standards), 1977a, pp. 967
8. Kikuchi, R., D. De Fontaine, Proceedings of a Workshop in the Application of Phase Diagrams in
Metallurgy and Ceramics (Gaithersburg, Maryland: National Bureau of Standards), 1977b, pp. 999
9. Jack, K.H., Proc. Roy. Soc., 1948, vol. A195, pp. 34
10. Burton, B., Phys. Chem. Minerals, 1984, vol. 11, pp. 132
11. Burton, B. R. Kikuchi, Phys. Chem. Minerals, 1984, vol. 11, pp. 125
12. Wriedt, H.A., N.A. Gocken, R.H. Nafziger, Bull. Of Alloy Phase Diagrams, 1987, vol. 8 (4), pp.
355
13. Jack, K.H., Acta Crystallogr., 1952, vol. 5, pp. 404
14. Chen, G.M., N.K. Jaggi, J.B. Butt, E.B. Yeh, L.H. Swartz, J. Phys. Chem., 1983, vol. 87, pp. 5326
15. Leineweber, A., H. Jacobs, F. Hüning, H. Lueken, H. Schilder, W. Kockelmann, J. All. Comp.,
1999, vol. 288, pp. 79
16. Leineweber, A., H. Jacobs, F. Hüning, H. Lueken, W. Kockelmann, J. All. Comp., 2001, vol. 316,
pp. 21
17. Jacobs, H. A. Leineweber, W. Kockelmann, Mat.Sc. Forum, 2000, vol. 325-326, pp. 117
18. Somers, M.A.J., B.J. Kooi, L. Maldzinski, E.J. Mittemeijer, A.A. van der Horst, A.M. van der
Kraan, N.M. van der Pers, Acta. Mat., 1997, vol. 45(5), pp. 2013
19. Frisk, K., CALPHAD, 1991, vol. 51(1), pp. 79
20. Kunze, J., Nitrogen and Carbon in Iron and Steels: Thermodynamics, Akademie Verlag, Berlin,
1990
21. Kooi, B.J., M.A.J. Somers, E.J. Mittemeijer, Metall. Mater. Trans. A, 1996b, vol. 27, pp. 1063
22. Kikuchi, R. J. Chem. Phys., 1974, vol. 60, pp. 1071
23. Guillermet, A.F., H. Du, Z. Metallk., 1994, vol. 85 (3), pp. 154
24. Foct, J., P. Rocheguide, Hyperfine Interactions, 1986, vol. 28, pp. 1075
25. Sanchez, J.M., J.R. Barefoot, R.N. Jarrett, J.K. Tien, Acta Met., 1984, vol. 32(9), pp. 1519
26. Burdese, A. Metall. Ital., 1957, vol. 49, pp. 195
27. Brunauer, S., M.E. Jefferson, P.H. Emmett, S.B. Hendricks, J. Amer. Soc., 1931, vol.53, pp. 1778


85
5
APPLICATION OF THE CVM CUBE APPROXIMATION
TO FCC INTERSTITIAL ALLOYS
ABSTRACT
The CVM simple cube approximation is applied to calculate a hypothetical fcc
interstitial alloy phase equilibrium. Instead of limiting the description of the alloy to
the species occupying the interstitial sublattice sites and including the interaction with
the metal sublattice in the effective pair potentials like in the previous chapters, the
basic cluster is composed of both metal and interstitial sublattice sites. The metal
sublattice is described as fully occupied by two types of metal atoms, while the
interstitial sublattice sites are filled with two interstitial species, one representing an
atomic species and the other a vacancy. The Lennard-Jones parameters chosen to
describe the interaction between the species lie within the range typical for transition
metals. Analysis of the calculated cube distribution variables shows that phase
transitions on the metal and interstitial sublattices are coupled: ordering of interstitial
species can be influenced by introduction of extra metal species to the host matrix of
the alloy, which enables purposeful adjustment or change of the properties of a
material.

Chapter 5
86
5.1. INTRODUCTION
The formation of interstitial solid solutions involves the introduction of light elements
such as nitrogen, carbon, boron, and hydrogen into the interstitial spaces formed by
the host matrix of a material. The ability of materials such as close-packed metals to
incorporate single elements into the interstitial spaces of the structure forms the basis
of industrial applications such as gas mixture separation, hydrogen storage, and
thermochemical treatments like nitriding, carburizing, and boriding of steels.
Interstitial-induced order-disorder transitions have been documented for Pd-H[1,2,3],
Fe-Cr-C, Fe-Cr-N, Al-C-Mn, and Al-B-Mn based alloys[4].
Like ordering transitions can occur on the metal host sublattice due to the
introduction of atoms into the interstitial spaces, the substitution of metals on the host
sublattice may cause order-disorder transitions on the sublattice formed by the
interstitials. Substitution of Sm and Gd has been reported to strongly reduce the
ability of Pd7M (M = Sm, Gd) alloys to absorb hydrogen, which appears to be related
to the preferential occupation by hydrogen of the octahedral interstices located
between nearest-neighbor Pd atoms as opposed to interstices surrounded by both Pd
and M atoms[5]. Modeling of the thermodynamics of interstitial systems is therefore
an important tool for process and material property optimization in industrial
application. Moreover, direct observation of interstitial solid solutions is complicated,
and thermodynamic calculations may provide helpful information that cannot be
obtained otherwise.
In this chapter, the cluster variation method (CVM)[6-11] simple cube
approximation is applied to phase equilibrium calculations of hypothetical face
centered cubic (fcc) interstitial alloys[8]. In contrast to the previous chapters, both
metal host sublattice and interstitial sublattice sites are included in the basic CVM
cluster. Subsequent analysis of the cluster distribution variables provides new support
for the coupling of the interaction between the host and the interstitial sublattices
observed in real systems.

Application of the CVM Cube Approximation to FCC Interstitial Alloys
87
5.2. CVM CUBE APPROXIMATION
For the purpose of modeling the thermodynamics of interstitial alloys, the structure of
the alloys is described as consisting of an fcc host matrix, formed by metal atoms,
with interstitial atomic species occupying the interstitial octahedral sites in between
the close-packed metal atoms. The metal atoms constituting the host matrix structure
form a substitutional metal sublattice, assumed to be fully occupied. The interstitial
species are assumed to occupy the interstitial octahedral sites only, and form an fcc
interstitial sublattice. The assumption is made that only atoms of type M1 and M2 are
found on the metal sublattice, while the interstitial sublattice sites are occupied by
interstitial species I1 and vacancies I2 exclusively. When both atoms and vacancies are
treated as interstitial species distributed over the sites of the interstitial sublattice, the
occupation of the interstitial sublattice can be considered substitutional in nature as
well.
Fig. 5.1. Fcc interstitial alloy with metal and interstitial sublattice sites, represented
by large circles and small circles, respectively. Grouping of the metal and interstitial
sublattice sites of the fcc unit cell results in two tetrahedrons, together forming a
simple cube. The vertices of the cube are denoted by α, β, γ, and δ (interstitial
sublattice sites), and η, κ, ν, and ω (metal sublattice sites). The subscripts i, j, k, and l
(interstitial sublattice sites) and m, n, p, and s (metal sublattice sites), which take a
value of 1 or 2, indicate whether the sites are occupied by species type 1 or 2,
respectively.

Chapter 5
88
The basic CVM cluster is defined in such a way that the types of ordering
occurring on both the metal and interstitial sublattices are included. Two
interpenetrating tetrahedrons, one representing metal sublattice sites, and the other
representing interstitial sublattice sites, together form a simple cube which can be
used as the basic CVM cluster. The basic cube cluster thus obtained includes nearest-
neighbor (nn) metal-interstitial interactions as well as next nearest neighbor (nnn)
metal-metal and interstitial-interstitial interactions, as shown in Fig. 5.1.
5.2.1. INTERNAL ENERGY
The internal energy of the system can be obtained by summation of the internal
energies of all 28 = 256 possible configurations of the cube cluster. Since each lattice
site pertains to one simple cubic cluster, the internal energy U is given by:
∑=ijklmnps
ijklmnpsijklmnpsCU αβγδηκνωε (1)
with ijklmnpsε representing the energy of a specific cube configuration with a
probability of occurrence equal to cube distribution variable αβγδηκνωijklmnpsC . The cube
cluster sites are denoted by superscripts α, β, γ, and δ, representing the interstitial
sublattice sites, and η, κ, ν, and ω, representing the metal sublattice sites. Whether the
interstitial sublattice sites are occupied by species of type I1 (atom) or I2 (vacancy) is
indicated by the subscripts i, j, k, and l, which take a value of 1 or 2, respectively.
Likewise, the subscripts m, n, p, and s indicate the occupation of the metal sublattice
sites and the values 1 and 2 represent metal atoms of type M1 and M2. Note: each cube
cluster site represents a sublattice and is therefore unique. In this work, the internal
energy is described as the sum of the pairwise interactions between the cube cluster
sites, thus including both nearest neighbor and next-nearest neighbor interactions as a
function of the distance between the lattice sites r:

Application of the CVM Cube Approximation to FCC Interstitial Alloys
89
( ) ( ) ( ) ( ) ( ) ( )[( ) ( ) ( ) ( ) ( ) ( ) ( )]
( ) ( ) ( ) ( ) ( ) ( )[ ]
( ) ( )[ ( ) ( ) ( ) ( )]nnn
ps
nnn
ns
nnn
np
nnn
ms
nnn
mp
nnn
mn
nnn
kl
nnn
jl
nnn
jk
nnn
il
nnn
ik
nnn
ij
nn
ls
nn
lp
nn
lm
nn
ks
nn
kp
nn
kn
nn
js
nn
jn
nn
jm
nn
ip
nn
in
nn
imijklmnps
rrrrrr
rrrrrr
rrrrrrr
rrrrrr
νωκωκνηωηνηκ
γδβδβγαδαγαβ
δωδνδηγωγνγκβω
βκβηανακαηαβγδηκνω
εεεεεε
εεεεεε
εεεεεεε
εεεεεε
+++++
++++++
+++++++
+++++=
2121
41
(2)
where the fractions ¼ and ½ indicate that the nearest neighbor (nn) and next nearest
neighbor (nnn) pairs are shared by 4 and 2 cubes, respectively, and e.g. ακε mn
represents the interaction energy of a pair of cube cluster sublattice sites of type α and
κ with occupation mn. Nearest neighbor pairs are combinations of metal atoms
residing on the host sublattice and interstitial atoms occupying adjacent cube cluster
sites, belonging to the interstitial sublattice. Next nearest neighbor pairs however, are
formed between species residing on the same sublattice.
The pairwise interaction energy ακε12 for an atom of type I1 occupying an
interstitial sublattice site of type α and an atom of type M2 residing on a metal
sublattice site of type κ is described using a type 8-4 Lennard-Jones interatomic
potential[12]:
( )
−
=
4012
80120
1212 2r
r
r
rr εε ακ (3)
where parameters 012ε and 0
12r are referred to as the so-called Lennard-Jones (L-J)
parameters. In principle, the values of the L-J parameters 012ε , referring to the pair
interaction energy in the reference state, and 012r , corresponding to the interatomic
distance for which ακε12 has a minimum value equal to 012ε [13,14], can be derived from
thermodynamic data such as the cohesive energy, heat of formation, and lattice
constants of the pure components. In the present work, the interactions between atoms
occupying lattice sites that are situated further apart than next-nearest neighboring
sites are assumed to be incorporated into the L-J potentials, which therefore describe
effective pair potentials.

Chapter 5
90
5.2.2. CONFIGURATIONAL ENTROPY
The configurational entropy of the ordering of M1 and M2 on the metal sublattice and
I1 and I2 on the interstitial sublattice is described as a function of the cube distribution
variables, which indicate the probability of occurrence of all possible arrangements of
the four species (M1, M2, I1, and I2) over the sites of the simple cube cluster and its
subclusters (i.e. squares, pairs, and points). The subcluster distribution variables can
be obtained by summation of the cube distribution variables αβγδηκνωijklmnpsC according to:
Squares: ...,∑=mnps
ijklmnpsijkl CW αβγδηκνωαβγδ
Pairs: ...,∑=klmnps
ijklmnpsij CY αβγδηκνωαβ (4)
Points: ...,∑=ijklmnps
ijklmnpsi CX αβγδηκνωα
with αiX indicating the probability that a site of type α has configuration i,
αβijY indicating the probability that a pair of sites of type α and β has configuration ij,
and αβγδijklW indicating that a square consisting of cube cluster sublattice sites of type α,
β, γ, and δ has configuration ijkl. The configurational entropy S for the cube
approximation can be described as[9]:
[ ]
+++++
+++
++++
++++++
++−
++
++++−=
+−+−=
∑∑∑∑∑∑
∑∑∑∑∑∑
∑∑∑∑∑∑
∑∑∑∑∑
∑ ∑∑∑
s
s
p
p
n
n
m
m
l
l
k
k
j
j
i
i
ls
ls
lp
lp
lm
lm
ks
ks
kp
kp
kn
kn
js
js
jn
jn
jm
jm
ip
ip
in
in
im
im
klps
klps
jlms
jlms
jkns
jkns
ijklmnps ilmp
ilmp
iknp
iknp
ijmn
ijmnijklmnpsB
B
XLXLXLXLXLXL
XXLYLYLYLYL
YLYLYLYLYLYL
YLYLWLWLWL
WLWLWLCLk
pointLpairLsquareLcubeLkS
ωνκηδγ
βαδωδνδηγω
γνγκβωβκβηαν
ακαηγδνωβδηωβγκω
αδηναγκναβηκαβγδηκνω
81
41
21
3 3
(5)

Application of the CVM Cube Approximation to FCC Interstitial Alloys
91
where Bk is Boltzmann’s constant and the function aaaL ln= . Lattice distortion
resulting from the accommodation of interstitial species by the displacement of metal
atoms in the host matrix is not explicitly accounted for. Vibrational entropy
contributions to the free energy function are not included in the description of the
hypothetical system in this work, but may be significant for a real system[15].
5.2.3. CALCULATION OF PHASE EQUILIBRIA
For each phase, a thermodynamic function Ω, referred to as the grand potential
function, is defined in terms of cluster distribution variables[12]:
( )
+−+−≡Ω ∑∑
==
2
1
*2
1
**2
*1
*2
*1 2
1,,,,,
m
mM
i
iIIIMM xxpVTSUTpmi
µµµµµµ (6)
where U is the internal energy, S is the configurational entropy, and V is the volume,
all per cube cluster site. T represents the temperature and p the external pressure. The
terms iIx and
mMx indicate the mole fraction of components iI (i = 1,2) on the
interstitial sublattice and mM (m = 1,2) on the metal sublattice, respectively. The
mole fractions can be obtained from the point cluster variables using:
[ ] 4/δγβαiiiiI XXXXx
i+++= (7)
[ ] 4/ωνκηmmmmM XXXXx
m+++=
where αiX represents the probability that an interstitial sublattice site of type α is
occupied by either I1 or I2, while ηmX indicates the probability that a metal sublattice
site of type η is occupied by M1 or M2. The chemical potentials of components iI and
mM are denoted by iIµ and
mMµ , respectively. The effective chemical potentials can
then be defined as:
( ) 2/21
*IIII ii
µµµµ +−= (8)
( ) 2/21
*MMMM mm
µµµµ +−=

Chapter 5
92
with the effective chemical potentials obeying 0**
21=+ II µµ and 0**
21=+ MM µµ .
The cube distribution variables constraint
1=∑ijklmnps
ijklmnpsCαβγδηκνω (9)
is accounted for by introduction of the Lagrange multiplier λ in the grand potential
function. Minimization of the grand potential function with respect to αβγδηκνωijklmnpsC yields:
( ) ( ) ( ) 8
1
4
1
2
1****
****
8
exp
8expexpexp
ijklmnpsijklmnpsijklmnps
B
MMM
B
III
B
ijklmnps
B
ijklmnps
XYWTk
TkTkTkC
spMnm
lkIji
−×
+++
+++
−
=
µµµµ
µµµµελ αβγδηκνωαβγδηκνω
(10)
with γδνωβδηωβγκωαδηναγκναβηκklpsjlmsjknsilmpiknpijmnijklmnps WWWWWWW =
δωδνδηγωγνγκβωβκβηανακαηlslplmkskpknjsjnjmipinimijklmnps YYYYYYYYYYYYY = , and (11)
ωνκηδγβαspnmlkjiijklmnps XXXXXXXXX =
The volume per cluster site, V, corresponding to a particular αβγδηκνωijklmnpsC for a phase at
atmospheric pressure p and constant temperature T is obtained from:
αβγδηκνωµδδ
ijklmnpsCTVp
,, *
Ω=− (12)
The grand potential function is minimized with respect to αβγδηκνωijklmnpsC using the Natural
Iteration (NI) Method. The thermodynamic phase equilibrium is determined by
finding the intersection of the *
mMµ and *
iIµ versus grand potential Ω graphs of both
phases at a specific temperature.

Application of the CVM Cube Approximation to FCC Interstitial Alloys
93
Table 5.1. Lennard-Jones parameters used to describe a hypothetical fcc host
sublattice occupied by metal atoms M1 and M2, with interstitial species I1 and
vacancies I2 residing in the octahedral interstices. The parameters are normalized
with respect to the reference state, in this case a pure host M1, with 0
11MMε = 62.80 kJ/mol (15 kcal/mol) and 0
11MMr =0.27 nm.
Normalized parameters Normalized parameters
Pairs norm,0ε normr ,0
Pairs norm,0ε normr ,0
M1-M1 1.000 1.000 I2-I2 0.000 1.000
M1-M2 0.980 1.050 M1-I1 0.010 1.280
M2-M2 0.950 1.080 M2-I1 0.008 1.330
I1-I1 0.021 1.280 M1-I2 0.000 1.000
I1-I2 0.036 1.230 M2-I2 0.000 1.000
5.3. APPLICATION TO FCC INTERSTITIAL ALLOY PHASE
EQUILIBRIA
In order to study the interaction between the close packed metal atoms forming the
host matrix and the species occupying the octahedral interstitial spaces more closely,
in the present CVM approach a basic cluster has been chosen that explicitly
incorporates both metal and interstitial sublattice sites. Since the availability of
thermodynamic data necessary to derive the input parameters for the calculation of a
phase equilibrium by CVM are rather limited for substitutional alloys with interstitial
species, the Lennard-Jones (L-J) parameters used in the present work were obtained
from Ref. [37] and are shown in Table 5.1. The values of the L-J parameters lie within
the range typically used for transition metals[12,13].
In the present work, the value of the effective chemical potential 1*Mµ on the
metal sublattice is fixed at a value of zero (which implies 02* =Mµ as well, since
**
21 MM µµ −= ) Then, the equilibrium state for a specific temperature is found by
varying the effective chemical potential *
1Iµ ( *
2Iµ−= ) associated with the interstitial
sublattice. Fig. 5.2.(a)/(b) represent the temperature-composition phase diagram thus

Chapter 5
94
Fig. 5.2.(a) and (b). Phase diagram of a hypothetical fcc system for an effective
chemical potential ( ) 0*1
*
2=−= MM µµ . (a) Mole fraction
1Mx of species M1 on the
metal host sublattices of phase A and B (b) Corresponding mole fraction 1Ix of
species I1 on the interstitial sublattices of phase A and B.

Application of the CVM Cube Approximation to FCC Interstitial Alloys
95
obtained for a hypothetical fcc equilibrium at temperatures in the range of 200 to
1400 K, with mole fraction 1Mx of species M1 on the metal host sublattices of the
equilibrium phases on the left-hand side, and the corresponding mole fraction 1Ix of
species I1 on the interstitial sublattices of the equilibrium phases on the right-hand
side of the figure. In fact, two separate phase equilibria occur, one above and one
below about 500 K. In both equilibria, an I1-poor phase, referred to as phase A, and an
I1-rich phase, referred to as phase B, are observed. The phases above 500 K are
indicated by the suffix [high T], while the phases below 500 K are labeled [low T].
Note: the phases A(B)[low T] and A(B)[high T] belong to separate phase equilibria and
therefore refer to different phases. The results lead to the conclusion that phase
transitions on the metal and interstitial sublattices are coupled, i.e. the composition of
the interstitial sublattice was found to depend on the occupation of the metal host
sublattice. A detailed discussion of Fig. 5.2.(a)/(b), as well as phase diagrams
obtained at some other effective chemical potential values, has been given in Ref. [8].
5.3.1. PAIR DISTRIBUTION VARIABLES
Fig. 5.3. shows the 11IIY ,
21IIY , and 22IIY pair distribution variables IIY , representing
the calculated probability of occurrence of the next nearest neighbor pairs on the
interstitial sublattice, and their random distribution in phase A and B as a function of
1Ix . Preferential occupation (short-range ordering) of the interstitial sublattice sites by
species I1 and I2 takes place in phase B, regardless of the temperature range
considered, as evidenced by the slight deviation of the IIY distribution variable values
from those of the random distribution, with a preference for (I1, I2) pairs with regard
to (I1, I1,) and (I2, I2) pairs. Meanwhile, the distribution of interstitials in phase A
remains equal, or close, to a random distribution. Based on the observed trends of the
pair distribution variables IIY , the occurrence of ordering of the interstitials does not
seem to depend on temperature. The ordering on the interstitial sublattice appears to
be predominantly determined by the fraction of interstitials 1Ix present, i.e. the greater
the fraction of species I1, the more pronounced the preferential ordering.
Note: 21IIY (
21MMY ) includes both 21IIY (
21MMY ) and 12IIY (
12MMY ) pair
probabilities, since these are equivalent and therefore indistinguishable.

Chapter 5
96
Fig. 5.3. Pair distribution variables IIY , showing the probability of occurrence of the
next nearest neighbor pairs (I1, I1), (I1, I2), and (I2, I2) on the interstitial sublattice and
the associated random distributions as a function of 1Ix in phase A and B.
Fig. 5.4. (a) and (b) show 11MMY ,
21MMY , and 22MMY , representing the calculated
probability of occurrence of the next nearest neighbor pairs on the metal sublattice,
and their probability in case of a random distribution in phase B as a function of 1I
x .
In phase B[high T], which contains a considerably higher fraction of M2 ( 4.03.02
−≈Mx
of the metal sublattice sites) than any of the other phases, 21MMY is significantly higher
than for the random distribution, indicating the occurrence of short range ordering
(SRO). Thus, the introduction of metal species M2 seems to induce SRO on the metal
sublattice.
However, the information about ordering of the metal atoms occupying the
host lattice and their interaction with the alloy’s interstitial species that can be
obtained from the pair distribution variables remains limited. Next, the cube
distribution variables αβγδηκνωijklmnpsC , calculated using the fcc simple cube approximation,
are described.

Application of the CVM Cube Approximation to FCC Interstitial Alloys
97
Fig
. 5.4
. (a
) and (
b)
Pair
dis
trib
uti
on v
ari
ab
les
YM
M,
repre
senti
ng t
he
pro
bab
ilit
y o
f occ
urr
ence
of
the
nex
t nea
rest
nei
ghbor
pair
s (M
1,
M1),
(M
1,
M2),
and (
M2,
M2)
on t
he
met
al
subla
ttic
e, a
nd t
he
ass
oci
ate
d r
and
om
dis
trib
uti
ons
as
a
funct
ion o
f x I
1 i
n p
hase
B.

Chapter 5
98
5.3.2. CUBE DISTRIBUTION VARIABLES
As shown in Fig. 5.1, the basic cubic cluster in the simple cube approximation is
constituted of two intertwined tetrahedrons: one encompassing the sites of the
interstitial sublattice and the other those of the metal host sublattice. The 256 possible
arrangements of species over the cube cluster sites can be reduced to 35 unique types
by grouping equivalent cube configurations with an equal composition and with the
interstitial and metal atoms arranged in a similar way, i.e. similar nearest neighbor and
next nearest neighbor surroundings.
5.3.2.1. PHASE A
Fig. 5.5.(a)/(b) shows the cube distribution variables of the most frequently occurring
cube configurations observed in phase A as a function of temperature. For phase
A[low T], the number of different cube configurations observed is very limited and all
configurations represent cubes with a pure M1 metal sublattice. Compared to phase
A[low T], in phase A[high T] an increase in the number of cube configurations occurs (see
Fig. 5.5.(a)). With increasing temperature, a small percentage of M2 ( %5.42
≤Mx of
the metal sublattice sites) occupies the metal sublattice sites, as shown in Fig. 5.2.,
resulting in cube configurations with either a pure M1 metal sublattice, or a metal
sublattice occupied with M1:M2 = 3:1 (Fig. 5.5.(a)/(b)). The cubes’ interstitial
sublattice sites are occupied by 0 to 4 I1. Thus, the redistribution of atoms over a
larger variety of cube configurations seems more related to the presence of M2 on the
metal host sublattice (and, of course, to the increasing temperature) than to the
fraction of interstitial atoms on the interstitial sublattice. The distribution of
interstitials in phase A remains equal to, or close to, a random distribution (not
shown.)
5.3.2.2. PHASE B [Low T]
Fig. 5.6.(a) shows the five main cube distribution variables of phase B[low T] and those
for a random distribution as a function of the composition of the interstitial sublattice
1Ix . These cube configurations are similar to those observed in phase A. The cube
distribution variables of all configurations deviate significantly from those for a

Application of the CVM Cube Approximation to FCC Interstitial Alloys
99
random distribution, indicating that preferential occupation (SRO) is taking place.
Note: the metal sublattice of phase B[low T ] is almost fully ( %9.991
≥Mx of the metal
sublattice sites) occupied by metal species M1, while the number of interstitials of
species 1 varies from 0 to 4. Cubes with 0 or 4 I1 (representing a pure I2 or I1
sublattice, respectively) occur less frequently than in the case of a random
distribution, while cube configurations with I1:I2 = 1:1 occur more frequently than in
the case of a random distribution, regardless of the fraction of I1 on the interstitial
Fig. 5.5.(a) and (b) Cube distribution variables of the most frequently occurring cube
configurations observed in phase A as a function of temperature. Metal and
interstitial sublattice sites are represented by large and small circles, respectively.
Dark colored circles represent species of type 1, while open circles represent species
of type 2. The lines are a guide to the eye.

Chapter 5
100
Fig. 5.6.(a) Main cube distribution variables of phase B[low T] and the associated
random distribution values as a function of 1Ix . Fig. 5.6.(b) Less frequently occurring
cube distribution variables of phase B[low T] as a function of 1Ix . Note: the random
distribution curves for and ∇ overlap and are therefore indistinguishable. Metal
and interstitial sublattice sites are represented by large and small circles,
respectively. Dark colored circles represent species of type 1, while open circles
represent species of type 2.

Application of the CVM Cube Approximation to FCC Interstitial Alloys
101
sublattice. Also, the deviation from the random distribution for cubes with I1:I2 = 1:1
is greater than for any of the other configurations, indicating that SRO is taking place
on the interstitial sublattice. The greatest deviation from a random distribution is
observed at low temperatures (200 K). As expected, with increasing temperature, the
cube distribution variable values approach their random probability as a result of
increasing entropy contribution.
Although in this temperature range the metal sublattice of phase B has an
almost pure ( %9.991
≥Mx of the metal sublattice sites) M1 composition, small
fractions of a variety of cube configurations with M1:M2 = 3:1 are observed, as
shown in Fig. 5.6.(b). The highest fraction of cube configurations with M1:M2 = 3:1
occurs in the range of 400-440 K, which coincides with the temperature range in
which a slight increase in M2 occupying the metal sublattice sites is observed in phase
B. Like in phase A, the introduction of even a very minor fraction of M2 to a pure M1
metal sublattice causes a great increase in the number of cube configurations
observed.
One of the cubes with I1:I2 = 1:1 (small circles) and M1:M2 = 3:1 (large
circles) occurs more frequently than in the case of a random distribution while the
other occurs less frequently, indicating SRO of the species occupying the interstitial
sublattice sites. Both of these cubes represent a unique type (see Section 5.3.2.), i.e.
they represent a group of equivalent cube configurations with an equal composition
and with similar nearest neighbor and next nearest neighbor surroundings. In addition,
both groups consist of an equal number of configurations (12 in this case), and can
therefore be compared directly to one another. Comparison of the occurrence of the
two cubes shows that there is a preference for M1 to be surrounded by I1, while there
is a preference for M2 to be surrounded by I2.
5.3.2.3. PHASE B [High T]
The main difference between the I1-rich phases B observed in the low and high
temperature regions is the occupation of their metal sublattice. While in the low
temperature range a pure ( %9.991
≥Mx of the metal sublattice sites) M1 metal
sublatttice is observed, in the high temperature range a relatively high fraction
(roughly 0.3-0.4) of the metal sublattice sites is occupied by M2, which leads to the

Chapter 5
102
Fig
. 5.7
.(a)
Cum
ula
tive
clu
ster
dis
trib
uti
on v
ari
able
s of
all
cube
confi
gura
tions
wit
h 0
up t
o 4
I1 a
nd t
he
ass
oci
ate
d r
andom
dis
trib
uti
on
valu
es o
ccurr
ing i
n p
hase
B[h
igh
T]
as
a f
unct
ion o
f x I
1.
Fig
. 5.7
.(b)
Cum
ula
tive
clu
ster
dis
trib
uti
on v
ari
able
s of
all
cube
confi
gura
tion
s
wit
h 0
up t
o 4
M1 a
nd t
he
ass
oci
ate
d r
andom
dis
trib
uti
on
valu
es o
ccurr
ing i
n p
ha
se B
[hig
h T
] as
a f
unct
ion o
f th
e fr
act
ion o
f M
1 o
n t
he
met
al
subla
ttic
e x I
1.
Met
al
and i
nte
rsti
tial
subla
ttic
e si
tes
are
rep
rese
nte
d b
y la
rge
and s
mall
cir
cles
, re
spec
tive
ly.
Dark
colo
red c
ircl
es
repre
sent
spec
ies
of
type
1, w
hil
e open
cir
cles
rep
rese
nt
spec
ies
of
typ
e 2
.

Application of the CVM Cube Approximation to FCC Interstitial Alloys
103
occurrence of all 35 cube types in more significant fractions than in any of the other
phases. This makes phase B[high T] the most suitable for detailed analysis of individual
cube configurations.
In order to study what kind of preferential surrounding of the metal and
interstitial species takes place, the cube distribution variables are first grouped by
number of I1 or M1, respectively, and the total fractions are compared to the random
distribution as a function of 1Ix . Fig. 5.7.(a) shows the cumulative cluster distribution
variables of all cube configurations with 0 up to 4 I1 and those for a random
distribution as a function of 1Ix . While the probability of finding a cube with 0 or 4
atoms I1 on its interstitial sublattice is lower than for a random distribution, regardless
of the fraction of interstitial sites occupied with I1, the probability of finding cubes
with I1:I2 = 1:1 is always higher than for a random distribution for the composition
range considered. The probability of cubes with 1 or 3 atoms I1 varies with 1Ix , and
equals the probability for a random distribution for 1Ix = 0.5. Therefore, the
interstitial atoms I1 and vacancies I2 appear to distribute themselves over the
interstitial sublattice sites in an orderly fashion with a tendency to avoid grouping
together of similar species.
Fig. 5.7.(b) shows the cumulative cluster distribution variables of all cube
configurations with 0 up to 4 M1 and those for a random distribution as a function of
1Mx (the fraction of species M1 on the metal sublattice). Unlike the interstitial
sublattice, which is occupied by atoms and vacancies, the metal sublattice is
substitutional, i.e. occupied by two types of metal atoms. However, both the
interstitial and metal sublattice cube distribution variables show that the probability of
finding a cube with 0 or 4 atoms of type 1 (i.e. a pure I1 or I2 interstitial sublattice and
a pure M1 or M2 metal sublattice) is considerably lower than for a random
distribution, indicating that grouping of similar types of species on a sublattice is
unfavorable.
Finally, the 35 types of cube configurations are categorized by number of species M1
and I1 found in each cube cluster, and configurations are selected with an identical
number of M1, M2, I1, and I2 per cube cluster. To compare the individual cube
configurations, differences in degeneration factor have to be taken into account. The
differences in probability observed can be related to preferences in the distribution of
the metal and interstitial atoms over the sites of the simple cube cluster. A comparison
of the cube configurations in Fig. 5.8.(a)/(b) shows that for all sets of configurations,

Chapter 5
104
metal species M1 has a preference to group with species I1, while species M2 prefers
to be surrounded by vacancies I2. Similar observations have been described for
configurations occurring in phase B[low T] in Section 5.3.2.2.
Fig. 5.8.(a) Cube distribution variables, normalized with respect to the degeneracy
factor of each unique type (see Section 5.3.2.), for four sets of individual cube
configurations in phase B[high T] with identical occupation in terms of the number of
interstitial and metal species but with different distributions of the species over the
sites of the cube cluster, and the associated random distributions, as a function of
1Ix . Metal and interstitial sublattice sites are represented by large and small circles,
respectively. Dark colored circles represent species of type 1, while open circles
represent species of type 2.

Application of the CVM Cube Approximation to FCC Interstitial Alloys
105
Fig. 5.8.(b) Cube distribution variables, normalized with respect to the degeneracy
factor of each unique type (See Section 5.3.2.), for five sets of individual cube
configurations in phase B[high T] with identical occupation in terms of the number of
interstitial and metal species but with different distributions of the species over the
sites of the cube cluster, and the associated random distributions, as a function of
1Ix . Metal and interstitial sublattice sites are represented by large and small circles,
respectively. Dark colored circles represent species of type 1, while open circles
represent species of type 2.
An interesting observation is that the cubes with M1:M2 = 1:3 occur less
frequently than in the case of a random distribution, while the cubes with 2 or more

Chapter 5
106
M1 occupying the four cube metal sublattice sites occur more frequently than the
random distribution, regardless of the number of I1 occupying the interstitial
sublattice. In addition, the greater the number of M2 per cube, the greater the
deviation from the random distribution appears to be. A significant deviation of the
normalized CVM cube distribution variables from the associated random probabilities
is observed for all cube configurations, indicating that SRO is taking place.
Furthermore, an increase of the fraction of M2 occupying the metal sublattice sites
seems to be coupled to an increase in the degree of SRO, as reflected by the deviation
from the random distribution in Fig. 5.8.(a)/(b).
5.4. CONCLUSIONS
The CVM cube approximation has been applied successfully to describe order-
disorder transitions on the metal and interstitial sublattices of fcc alloys with
interstitial species by including sites of both sublattices into the basic cluster. Analysis
of the calculated cube distribution variables shows that phase transitions on the metal
and interstitial sublattices are coupled: not only does the introduction of a second
metal atoms type on the metal sublattice induce SRO on both the metal sublattice and
interstitial sublattice, preferential grouping of metal atoms with specific interstitials is
observed as well. These phenomena have been documented for non-hypothetical
systems[1-4] but the explicit incorporation of the metal-interstitial interaction into the
thermodynamic description of the phases by CVM is of a recent date[8]. To make the
transition from a hypothetical system to real interstitial alloys and for application of
the model to modify the properties of materials in industrial applications, ab initio
calculations may be able to provide the necessary information needed for an accurate
description of the internal energy in terms of effective cluster interactions (ECI’s)
instead of phenomenological Lennard-Jones parameters. The CVM-ECI path has been
proven to be successful for the description of phase boundaries in the Fe-N and Fe-C-
N systems[15].

Application of the CVM Cube Approximation to FCC Interstitial Alloys
107
REFERENCES
1. Noh, H., T.B. Flanagan, B. Cerundolo, A. Craft, Scr. Metall. Mater., 1991, vol. 25, pp. 225-30
2. Flanagan, T.B., Y. Sakamoto, Platinum Met. Rev., 1993, vol. 37, pp. 26-37
3. Lee, S.M., T.B. Flanagan, G.H. Kim, Scr. Metall. Mater., 1994, vol. 32, pp. 827-32
4. Villars, P., A. Prince, H. Okamoto, Handbook of Ternary Alloy Phase Diagrams, 1995, Vols.
3,6,8, Metals Park, OH: ASM international
5. Sakamoto, Y., K. Takao, T.B. Flanagan, J. Phys Condens. Matter, 1993, vol. 5, pp. 4171-78
6. Burton, B., R. Kikuchi, Phys. Chem. Minerals, 1984, vol. 11, pp. 125-131
7. Burton, B., Phys. Chem. Minerals, 1984, vol. 11, pp. 132-139
8. Nanu, D.E., Y. Deng, A.J. Böttger, Phys Rev. B, 2006, vol. 7401(1), pp. 216-24
9. Sanchez, J.M. D. de Fontaine, Phys. Rev. B, 1978, vol. 17(7), pp.2926-36
10. Kikuchi, R.A. , Phys. Rev., 1951, vol. 81, pp. 988-1003
11. Van Baal, C.M., Physica, 1973, vol. 64, pp. 671-86
12. Sanchez, J.M., J.R. Barefoot, R.N. Jarrett, J.K. Tien, Acta Met., 1984, vol. 32(9), pp. 1519-25
13. Pekelharing, M.I., A.J. Böttger, M.A.J. Somers, E.J. Mittemeijer, Met. Mat. Trans. A, 1999, vol.
30A, pp. 1945-53
14. Pekelharing, M.I., A.J. Böttger, E.J. Mittemeijer, Phil. Mag., 2003, vol. 83(15), pp. 1775-96
15. Shang, S., A.J. Böttger, Acta Mat., 2005, vol. 53, pp. 255-264


109
6
PHASE TRANSFORMATIONS AND PHASE
EQUILIBRIA IN THE IRON-NITROGEN SYSTEM AT
TEMPERATURES BELOW 573 K
ABSTRACT
The phase transformations of homogeneous Fe-N alloys with nitrogen contents
ranging from 10 to 26 at.% were investigated by means of X-ray diffraction analysis
upon aging in the temperature range 373 to 473 K. It was found that precipitation of
α"-Fe16N2 below 443 K does not only occur upon aging of supersaturated α (ferrite)
and α' (martensite), but also upon transformation of γ'-Fe4N1-z and ε-Fe2N1-x (<20
at.% N). No α" was observed to develop upon aging of γ-Fe[N] (austenite).
Therefore, it is proposed that γ' is a stable phase at temperatures down to (at least)
373K. Phase formation upon annealing at low temperatures is apparently governed by
the (difficult) nucleation and (slow) growth of new Fe-N phases: α" forms as a
precursor for α because of slow nitrogen diffusion, and nitrogen-enriched ε develops
as a precursor for γ' because of a nucleation barrier.

Chapter 6
110
6.1. INTRODUCTION
Phase transformations occurring in Fe-N alloys at low temperature are of particular
practical interest because of their industrial and technological importance. For
example, in industrial practice, the nitrided parts are usually cooled relatively slowly
due to the large size of the furnaces used. This slow induces transformation of phases
formed at the nitriding temperature.
The generally accepted Fe-N phase diagram† is largely based on data obtained
at temperatures above 573 K[1,2,3,4] because below this temperature, the dissociation of
ammonia proceeds so slowly that no equilibrium can be obtained between
ammonia/hydrogen mixtures and the surface of the solid. Consequently, published
data on phase boundaries at temperatures below 573 K are based on extrapolations,
and the prediction of the thermodynamic stability of Fe-N phases at these low
temperatures cannot be made with great accuracy. Recent thermodynamic calculations
indicate that γ'- Fe4N1-z may not be thermodynamically stable at temperatures below
583K[5], 449 K, or 294 K[6] depending on the model description used for the
thermodynamics of the Fe-N phases α, γ' and ε.
Most published research on the low-temperature stability of Fe-N phases is
devoted to phases with a relatively low nitrogen content (<10 at.%): supersaturated
ferrite (α)[7,8,9], martensite (α')[10-21] and austenite (γ)[22,23]. Only very few, partly
incompatible, data have been reported on the low temperature stability of Fe-N phases
with a relatively high nitrogen content[24-28]. Moreover, these results were generally
obtained by processing under far from equilibrium conditions, as, for example, by
mechanical alloying[26], laser nitriding[27] and ion implantation[24,28].
It has been reported that α" precipitates from both supersaturated ferrite and
Fe-N martensite as a supposedly intermediate phase in a temperature range up to ~473
K[9,10,12], ~493 K[14], and ~433 K[23], preceding the formation of γ' (Fe4N) and α. It has
been shown that, at 483 K, γ transforms directly into γ' (Fe4N1-z) and α, without the
precipitation of an intermediate α" phase[24]. Mössbauer spectra of aged ε-Fe2N1-z
samples indicated the presence of α”-Fe16N2 (suggested by Ref. [25]).
Thus, although some knowledge has been acquired regarding phase equilibria
and phase transformations at low temperatures in Fe-N alloys of a relatively low
† Note that the Fe-N phase diagram concerns data of Fe in equilibrium with ammonia/hydrogen gas mixtures at atmospheric pressure (equivalent to a N2 fugacity of the order of several gigapascals). This implies that, in general, Fe-N alloys are not stable with respect to decomposition into Fe and N2.

Phase Transformations / Phase Equilibria in the Iron-Nitrogen System at Temperatures below 573 K
111
nitrogen content, much less is known about the possible transformations in Fe-N
alloys of a relatively high nitrogen content: e.g., the possible coexistence of α"
(Fe16N2) and the phases γ' (Fe4N) and ε (Fe2N1-x) is undocumented.
Reviewing the current state of knowledge, the following questions arise:
1. Is α" (Fe16N2) a stable or an intermediate phase?
2. Do α "/ γ' and α "/ε phase equilibria occur?
3. Are γ' and ε stable phases at temperatures below 573 K?
The aim of the present research is to investigate phase transformations in Fe-N
phases, prepared at elevated temperature and with uniform nitrogen contents ranging
from 10 to 26 at.%, upon aging in the temperature range 373 to 473 K.
6.2. EXPERIMENTAL PROCEDURES
Specimens of different nitrogen content were prepared by nitriding pure iron powder
of the chemical composition: <0.002 wt% Ni, <0.002 wt% Mn, <0.01 wt% Al, <0.002
wt% Cr, <0.002 wt% Ti, <0.01 wt% W, <0.002 wt% V, 0.04 wt% Si, 0.002 wt% N,
0.221wt% O, balance Fe. The average size of the powder particles is about 10 micron,
and the particle sizes range from 5 to 20 µm. Disk–shaped specimens, 15 mm in
diameter and 0.28 to 0.38 mm thick, were prepared from the powder by sintering at
958 K in pure H2. After sintering, the specimens have a density of 4 to 5 g/cm3, which
corresponds to a degree of porosity between 35 and 50 vol.%. The large iron surface
area, combined with the short distance within the iron grains to be bridged by solid-
state diffusion, allows a relatively rapid establishment of a uniform nitrogen
concentration throughout the specimen characterizing a stationary state or imposed
equilibrium between nitrogen in the solid state and nitrogen in the gas mixture.
Nitriding experiments were performed in a vertical quartz tube furnace. In
order to obtain specimens and with nitrogen contents varying from 10 to 25 at.%
initial phase constitutions of γ, γ', ε + γ, and ε, different nitriding temperatures and gas
ratios of NH3/H2 were used. Nitriding occurred for 20 hours at temperatures between
723 and 963 K, and the volume ratios NH3/H2 were in the range from 97/3 to 10/90.

Chapter 6
112
For all NH3/H2 ratios, the flow rate of the NH3 + H2 gas mixture was 300
ml/min. After nitriding, the specimens were quenched in brine at room temperature.
In this way, the specimens were prepared. The nitrogen contents in the ε, γ' and γ
phases were determined from the lattice parameters measured by X-ray diffraction
using the latest published dependencies of the lattice parameters on nitrogen content:
Ref. [29] for ε, Ref. [30] for γ', and Ref. [31] for γ.
The as-prepared specimens were divided in several pieces, which were
subjected to various heat treatments. The aging of the nitrided specimens was
performed in oil-baths at specific temperatures (373, 413, 443, 463, and 473 K)
controlled at ± 2 K and for specific times (1, 3, 7, 14, 28, and 50 days). For aging at
413 to 443 K, all periods of time were applied, whereas at 373 K, only the long time
aging of 50 days was used, and, at the high temperatures of 463 K and 473 K, only the
short aging times (1 and 3 days) were applied.
The phase composition after nitriding (before aging) and after aging was
determined by X-ray diffraction. Before measurement, the specimens were cleaned in
ethanol and acetone and then powdered afterwards. The powder was put onto a <510>
single-crystal silicon wafer and placed in the specimen holder. The X-ray diffraction
measurements were made at room temperature using a SIEMENS‡ Type D-500 ω-
type diffractometer and applying Co Kα1 radiation using a monochromator in the
incident beam. The measurements were performed in the range 20 – 100 deg 2θ (in
some cases, 20 – 160 deg 2θ) with a step size of 0.05 deg 2θ, using total counting
times up to 2500 seconds per step. In order to be able to observe possible changes
occurring during the measurements, the long counting times were obtained by five
separate measurements, with 500 seconds per step in each case. In some cases, for
lattice- parameter determination, a step size of 0.01 deg 2θ was used. In order to
unravel partly overlapping peaks, the diffraction patterns were fitted§ using a
symmetric pseudo-Voigt function for the shape of peak profiles.
‡ SIEMENS is a trademark of Siemens Electrical Equipment, Toronto. § The program ProFit1.0b (1996 Philips Electronic Instruments Corp., Mahwah, NJ) was used to fit the diffraction profiles.

Phase Transformations / Phase Equilibria in the Iron-Nitrogen System at Temperatures below 573 K
113
6.3. RESULTS AND DISCUSSION
6.3.1. AS-PREPARED CONDITION
The Fe[N] specimens, with a nitrogen concentration in the range from about 10 to 26
at.%, were annealed at the temperatures presented in the overview given in Fig. 6.1.
Fig. 6.1. The composition of the specimens and the temperatures of aging are
indicated in the Fe-N phase diagram[4]
.

Chapter 6
114
The nitrided specimens were divided into several groups, according to their nitrogen
content and the phases initially present (Fig. 6.1.):
1. Group A1: ε-Fe2N1-z with a nitrogen content <19.5 at.%
2. Group A2: ε-Fe2N1-z with a nitrogen content >20 at.%
3. Group B: γ' Fe4N1-z with about 20 at.% N
4. Group C: γ-Fe[N] specimen; and
5. Group D: γ-Fe[N] + ε
After nitriding and quenching, the specimens were analyzed using X-ray
diffraction in order to establish the phases present and their nitrogen contents (Section
6.2.). In the following text, the as-prepared condition of each group of specimens will
be discussed.
6.3.1.1. εεεε SPECIMENS WITH <19.5 at.% NITROGEN (GROUP A1)
According to the Fe-N phase diagram, the ε phase with nitrogen content <19.5 at.%
occurs above 923 K[1-4]. Therefore, these specimens were prepared at a relatively high
nitriding temperature of 963 K. In total, five specimens with nitrogen contents varying
from 15.6 to 19.1 at. % were investigated (Table 6.1.). In the diffraction patterns of
the quenched specimens, only the reflections pertaining to the hcp Fe sublattice of the
ε phase could be observed. Superstructure reflections due to long-range ordering of
nitrogen atoms[32] were not observed, which indicates that, for these low nitrogen
contents, no pronounced long range ordering of nitrogen atoms is present.
After quenching, all specimens of this group contained a certain amount of γ'
in the as-prepared condition. Even by rapid quenching at a rate of about 500 K/s, it
was impossible to avoid the formation of some γ' (a similar observation was reported
earlier[32]). The amount of γ' formed during quenching is estimated on the basis of the
X-ray diffraction patterns by applying the "direct comparison method,"[33] thereby
using the 200γ' and 111ε reflections. In quenched specimens with a relatively low
nitrogen content (less than 18 at.% nitrogen), the amount of γ' is estimated to be about
0.3 - 1.0 vol.% , in quenched specimens with a nitrogen content close to that of γ', the
volume fraction of γ' increases to about 10-11 vol.%.

Phase Transformations / Phase Equilibria in the Iron-Nitrogen System at Temperatures below 573 K
115
Table 6.1. Phase transformation of ε specimens (Range of composition: 15 to 19.5
at.% N)
413 K 443 K Initial
Phase
Comp.
373 K
50
days
1 day 3
days
28
days
3
days
14
days
28
days
463 K
3
days
473
K
1 day
ε (15.6
at%.N)*
ε + γ'
↑
ε + γ'
↑
ε + γ'
+ α"
α" +
γ' +
ε
α" +
γ' +
ε +
α
- - γ' +
α" +
ε +
α
γ' +
α +
ε
ε (16.7
at%.N)*
- - - α" +
γ' +
ε
- - - - -
ε (17.9
at%.N)*
- - - α" +
γ' +
ε
- - - - -
ε (18.9
at%.N)*
+ 11.2
vol.%
γ'
ε + γ'
↑
- - γ' + α"
+
ε
γ' +
α" +
ε
- - γ' +
α" +
ε +
α
-
ε (19.1
at%.N)*
+ 10.4
vol.%
γ'
ε + γ'
↑
- - γ' + α"
+
ε
- γ' + ε*
+ α
γ' +
ε +
α
- -
* Amount of γ' in the quenched ε specimen is 0.3 to 1 vol.%
↑ Indicates an increased amount of γ' after aging
Enriched

Chapter 6
116
6.3.1.2. εεεε SPECIMENS WITH >20 at.% NITROGEN (GROUP A2)
Ten specimens were prepared in the concentration range from 20 to 27 at.% N, at
nitriding temperatures between 943 K and 963K (Table 6.2.). In the diffraction
patterns of the quenched specimens, the 101ε, 201ε, 211ε, and 103ε
superstructure reflections** could be observed, which indicates that a long-range order
of the nitrogen atoms is present. In the (quenched) ε specimens with a nitrogen
content in the range from 20 to 26 at.%, some γ' had also formed during quenching. In
a similar way as indicated above (Group A1), the volume of γ' was determined by X-
ray diffraction. In the specimens with a nitrogen content close to that of γ', the volume
fraction of γ' is about 0.3 to 1 vol. %; this amount is about 0.2 vol.% for specimens
with a nitrogen content of about 23 to 24 at.% . No γ' reflections were observed for
specimens with a nitrogen content higher than about 26 at.%.
6.3.1.3. γ' SPECIMENS (GROUP B)
Two pure γ' specimens were prepared by nitriding at 723 K and subsequent
quenching.
6.3.1.4. γ-Fe[N] SPECIMEN (GROUP C)
In order to obtain homogeneous, purely austenitic specimens, i.e., to prevent the
formation of martensite upon quenching to room temperature, the nitrogen content in
austenite should be as high as ~8 at.%[34].
The γ-Fe[N] specimen was prepared at a nitriding temperature of 963 K. After
quenching to room temperature, a pure γ phase was obtained, with a nitrogen content
of 9.75 at.%; the Ms temperature of this specimen is < 223 K[34].
** All Miller indices hkl for the ε-phase are given with respect to the hexagonal nitrogen sublattice, accounting for the occurrence of long range order[32].

Phase Transformations / Phase Equilibria in the Iron-Nitrogen System at Temperatures below 573 K
117
6.3.1.5. γ -Fe[N] + εεεε SPECIMEN (GROUP D)
One specimen was prepared at 963 K, such that the average composition lays in the γ
+ ε two-phase region. The nitrogen content of the ε phase was estimated to be about
Table 6.2. Phase transformation of ε specimens with a nitrogen content > 20 at.%
413 K Initial phase
composition
373 K
50 days 1 day 7 days 28 days
443 K
3 days
ε (20.2 at.% N)* - - - ε + γ' ↑ -
79 vol.% γ' + ε
(20.3 at.% N)
ε + γ' ↑ - - - -
ε (21.1 at.% N)* - - - ε + γ' ↑ -
ε (21.4 at.% N)* - ε + γ' ↑ - - -
ε (22.6 at.% N)* - - - ε + γ' ↑ -
ε (22.8 at.% N)* - - - - ε + γ' ↑
ε (23.0 at.% N)* - - - - ε + (γ')
ε (23.7 at.% N)** - - - ε + (γ') -
ε (24.6 at.% N)** - - - ε + (γ') -
ε (26.2 at.% N) ε - ε ε -
* Amount of γ' in the quenched ε specimen is 0.3 to 1 vol.%
** Amount of γ' in the quenched specimen is 0.1 to 0.2 vol.%
↑ Indicates an increased amount of γ' after aging
Enriched
13 at.%. This estimate was made using a linear extrapolation of the lattice-parameter
data pertaining to the range 20 to 33 at.% N given in Ref. [29]. The observed lattice
parameters are a=0.45737 nm and c = 0.42981 nm. The γ phase contained about
10.15 at.% N. These compositions correspond to the phase boundaries of the γ + ε
two-phase region at 963 K (Fig. 6.1.), which is the nitriding temperature of the
specimen. None of the superstructure reflections due to long-range order of the
nitrogen atoms in ε was observed in the diffractogram of the as-quenched specimen.

Chapter 6
118
6.3.2. PHASE TRANSFORMATIONS IN εεεε-PHASE SPECIMENS
6.3.2.1. PHASE TRANSFORMATIONS OF ε WITH <19.5 at.% NITROGEN
UPON ANNEALING UP TO 473K (GROUP A1)
According to the Fe-N phase diagram[35] on cooling, ε with a nitrogen content below
19.5 at.% N should undergo an eutectoid reaction of ε (15.9 at.% N) into γ + γ' at 923
K, which is followed by eutectoid reaction of γ (8 at.% N) into α and γ' at 865 K.
Upon further lowering the temperature, the α and γ' phases are expected to remain
present below 865 K down to at least 573 K; the nitrogen contents in α and γ' change
with temperature.
In Table 6.1., an overview is given of the phases observed after annealing of ε,
with a nitrogen content <19.5 at.%, at temperatures in the range from 373 K to 473 K
(note also Fig. 6.2.). The results can be summarized as follows:
1 the α" phase develops,
2 a nitrogen-enriched ε phase is formed,
3 the amount of γ' increases appreciably, and
4 a long range order of nitrogen atoms develops in the ε phase.
The results suggest that in the temperature range from 373 K to 473 K, transformation
of the ε phase into γ' and α" (or α) occurs under simultaneous enrichment of the ε
phase (indicated by ε (enriched)).
ε ⇒ α" (α) + γ' + ε (enriched)
The nitrogen content of the N-enriched ε phase formed is about 22 to 24 at.% N. The
nitrogen content of the ε (enriched) phase is higher in the specimens with an initially
low-nitrogen ε. Note that the nitrogen content of ε (enriched) is not only much higher
than that of the original ε, but also higher than the nitrogen content (~20 at.%)
required for the γ' phase. Upon annealing, a shoulder develops at the low-angle side of
the γ' reflections. The 200γ' line profile could be conceived as the enveloping profile
of two peaks (note the profile fit in Fig. 6.2.): one sharp peak at the same Bragg angle
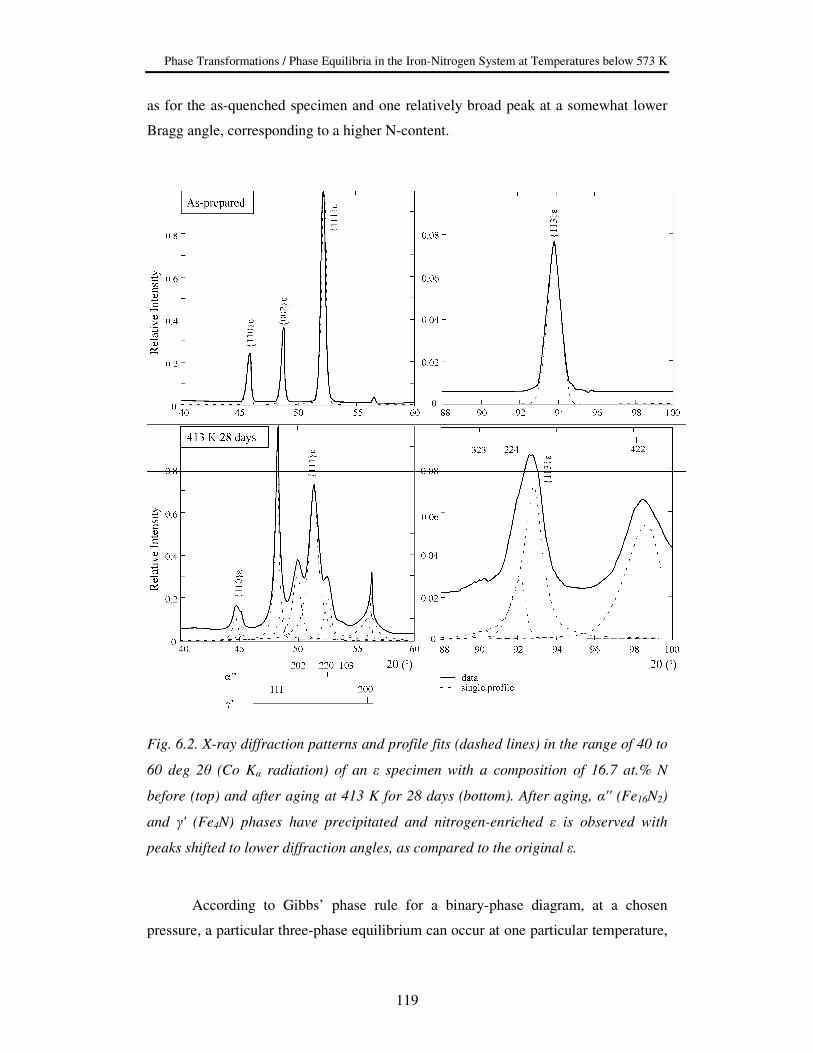
Phase Transformations / Phase Equilibria in the Iron-Nitrogen System at Temperatures below 573 K
119
as for the as-quenched specimen and one relatively broad peak at a somewhat lower
Bragg angle, corresponding to a higher N-content.
Fig. 6.2. X-ray diffraction patterns and profile fits (dashed lines) in the range of 40 to
60 deg 2θ (Co Kα radiation) of an ε specimen with a composition of 16.7 at.% N
before (top) and after aging at 413 K for 28 days (bottom). After aging, α'' (Fe16N2)
and γ' (Fe4N) phases have precipitated and nitrogen-enriched ε is observed with
peaks shifted to lower diffraction angles, as compared to the original ε.
According to Gibbs’ phase rule for a binary-phase diagram, at a chosen
pressure, a particular three-phase equilibrium can occur at one particular temperature,

Chapter 6
120
where the compositions of the respective phases in equilibrium are fixed. Since the
coexistence of at least three phases (α" (α), γ', and ε (enriched)) was observed in the
entire temperature range investigated, it has to be concluded that the annealed samples
do not represent thermodynamic equilibrium. Therefore, the observation of at least
three coexisting phases for a range of temperatures in the annealed samples is
attributed to two simultaneously occurring transformation reactions:
ε ⇒ α" (α) + γ' (1)
ε ⇒ α" (α) + ε (enriched) (2)
The first reaction may occur in particular at the γ' phase particles present in the as-
prepared samples (cf., Section 6.3.1.), which could serve as easy nucleation sites for
γ'. The development of γ' from an ε phase containing less than 19.5 at%. N leads to
nitrogen depletion of the ε phase and formation of the α'' phase. The second reaction
may occur within the pure ε phase. This would imply that α'' can readily nucleate in
the ε phase, whereas formation of γ' is thermodynamically or kinetically hindered.
The validity of the previous hypothesis cold not be verified by performing the same
heat treatment with a γ'-free, homogenous ε phase specimen, because such a
specimen could not be prepared.
The effects of temperature, time of annealing, and nitrogen content on the
transformation behavior will be discussed next.
6.3.2.1.1. EFFECT OF ANNEALING TEMPERATURE
Annealing at temperatures in the range from 413 K to 473 K leads to the formation of
α" (and α). X-ray diffraction patterns corresponding to a series of annealing steps of
the specimen initially containing ε with 15.6 at.% N are shown in Fig. 6.3. The
reflections of the (cubic) α phase are very close to (overlap with) some of the
reflections of the (tetragonal) α" phase and unraveling of the diffraction patterns by
profile fitting (cf. Section 6.2.) is necessary. Especially, the 2θ range from 40 to 60
deg 2θ, including the 202α", 220α" doublet and 110α reflections, and the 2θ
range from 96 to 100 deg 2θ, including the 422 α" and 211 α reflections, are

Phase Transformations / Phase Equilibria in the Iron-Nitrogen System at Temperatures below 573 K
121
appropriate to investigate the developments of α" and α. The reflections in the 40 to
60 deg 2θ range were used to investigate the (integrated) intensity ratio of α and α".
Reflections of α" were detected after annealing for 28 days at 413 K
(Fig. 6.3. (a), left-hand side). In this stage of transformation, the peak positions as
well as the ratio of the integrated intensities of the doublet 202α" / 220α"
(incorporating 110α, if present) are compatible with those for the α" phase. The
peak position (Fig. 6.3. (a), right-hand side) is about that of the 422 α" reflection,
and the integrated intensity ratio 202α" / 220α" is about 1.75, which corresponds
to that calculated for α" for a non-textured powder. Increasing the annealing
temperature leads to asymmetric broadening of the 422 α" peak toward higher
diffraction angles and to a shift of the peak maximum to higher diffraction angles.
Both observations strongly suggest the formation of ferrite during annealing.
Furthermore, the ratio of the (integrated) intensities of reflections of the doublet
202α" / 220α" decreases upon annealing at a temperature above 413 K. This hints
at the presence of a 110α peak overlapping with 220α". After annealing at 443 K
for 3 days, α" is still the predominantly precipitating low-nitrogen phase, but, at
463 K, α appears to be the dominant low-nitrogen phase. Prolonged annealing at
443 K leads to the formation of ferrite in addition to α". This last observation
indicates that the α" phase is less thermodynamically favorable than α above this
temperature. After annealing at 473 K, α" was not observed; only α was observed
after the shortest annealing time of 1 day. Ιt cannot be excluded that also for this
temperature, α" forms prior to the formation of α, since annealing times shorter than 1
day were not investigated for this temperature. Hence, it is concluded that α" is less
thermodynamically favorable than α, at temperatures above at least 413K.
Upon annealing at 373 K neither α nor α" was observed even after 50 days of
annealing. Only very small changes (an increase of the intensities of the γ' reflections
and a local enrichment of the initial ε) were observed. Because the nitrogen content of
the initial ε is smaller (<19.5 at.%) than that of γ' (about 20 at.%), an increase of the
amount of γ' should be accompanied by the simultaneous development of nitrogen-
depleted regions and/or development of a second phase with a nitrogen content less
than that of the initial ε (most probably α"), to ensure the mass balance. Apparently,
the amount of such a second phase (α") is too low to be observed.

Chapter 6
122
Fig. 6.3. X-ray diffraction pattern (Co Kα1 radiation) in the range of 40 to 60 deg 2θ and 96 to 100 deg 2θ of an initially ε specimen with a composition of 15.6 at.% N for
several annealing times and temperatures. (a) 413 K for 28 days (dashed line:
3 days): transformation of ε into nitrogen-enriched ε and α'' occurs; there is no clear
evidence for the presence of α. (b) 443 K for 3 days and (c) 463 K for 1 day: both the
α and α'' phases are present; he diffraction profiles (range: 96 to 100 deg 2θ) are
composed of the 422α'' and the 211α diffraction peaks. (d) 473 K for 1 day:
decomposition of ε into α and γ' has occurred; there is no evidence for the presence of
α''.

Phase Transformations / Phase Equilibria in the Iron-Nitrogen System at Temperatures below 573 K
123
Fig. 6.4. X-ray diffraction pattern (Co Kα1 radiation) of an ε specimen with a
composition of 15.6 at.% N after annealing at 413 K for different times showing the
kinetics of the phase transformations. The intensities are given relative (a) through (c)
to the maximum intensity of the 111ε reflections and (d) to the maximum intensity of
the 111γ' reflection. The decomposition starts with an increase of the amount of γ' (compare the intensity ratios of the 300ε / 220γ' and 002ε / 111γ' in the as-
prepared state (a) and after 1 day at 413 K (b)). After 3 days at 413 K (c), the
precipitation of α'' and local enrichment of ε (the mark on the left-hand side of the
111ε peak) are observed. Upon further annealing up to 28 days (d), a nitrogen-
enriched ε phase is observed; also, the α'' and γ' phases are present.

Chapter 6
124
6.3.2.1.2. EFFECT OF ANNEALING TIME
The effect of annealing time (at 413 K) for a specimen composed of ε (15.6 at.% N) is
shown in Fig. 6.4. Clearly, the transformation starts with the formation of locally
enriched ε, as follows from the development of shoulders at the low-angle side of the
ε reflections after 1 and 3 days (Fig. 6.4.(b)/(c)). The peak position indicates a
nitrogen content only slightly higher than that of the original ε phase. Simultaneously,
the amount of γ' increases. The first, unambiguous, observation of the phase of low
nitrogen content (α") is possible after annealing for 3 days (note the insert of Fig. 6.4.
(c)). Upon continued annealing at 413 K, the nitrogen content of the enriched ε phase
increases, as evidenced by the shift of the 110ε reflection in Fig. 6.2. (left-hand
side), while the reflections of the original ε phase disappear, resulting in a specimen
constituted of α" + γ' + ε (enriched) (Figs. 6.4.(d). and 6.2.).
Of course, the time necessary to reach a certain stage of decomposition is
temperature dependent. After annealing at 413 K for 3 days, more of the initial ε had
transformed than after annealing at 373 K for 50 days, and annealing at 443 K for 3
days leads approximately to the same amount of decomposed ε as that obtained by
aging at 413 K for 28 days. These observations can be correlated with the diffusion
distances of nitrogen in ε (note the calculated values for √Dt in Table 6.3., where D is
an effective diffusion coefficient for N in ε[36] and t the annealing time) for the
corresponding cases. The mean value of the integrated intensity change of various
reflections (relative to the initial intensities) for specimens (ε (15.6 at.% N)) tempered
according to the times and temperatures given in Table 6.1., is shown in Fig. 6.5. as a
function of the diffusion distance of N in ε. The approximately linear relationship
suggests that diffusion of nitrogen indeed is the decomposition rate-determining step
during the transformation.
6.3.2.1.3. EFFECT OF NITROGEN CONTENT
The higher the amount of α" (i.e., the intensity ratio, α"/ γ'), the lower the nitrogen
content in the initial ε phase (Fig. 6.6.): for a sample with 15.6 at.% N, α" is a
dominant phase at a stage of aging where α" can hardly be discerned for a sample
with 19.1 at.% N. Further, the smaller the amount of nitrogen-enriched ε phase, the
smaller the amount of α".

Phase Transformations / Phase Equilibria in the Iron-Nitrogen System at Temperatures below 573 K
125
Fig. 6.5. The mean integrated intensities (relative to the integrated intensities in the
as-prepared state) of the 110, 111, and 112 ε reflections measured after several
annealing temperatures and times as given in Table 6.1. of the ε specimen (15.6 at.%
N). An proximate linear relationship with the diffusion distance Dt is observed
(Section 6.3.).
Table 6.3. Calculated values of the diffusion distance of nitrogen, √Dt, for different
annealing temperatures and times; The values of the effective diffusion coefficient, D,
have been calculated according to Table 6.5. in Reference 36 for the temperatures of
annealing indicated and the composition of the specimens (15.6 at.% N)
Annealing time and
temperature D (m2 · s-1) Time (s) √Dt (m)
373 K, 50 days 4.78 · 10-24 4,320,000 4.55 · 10-9
413 K, 3 days 1.97 · 10-22 259,200 7.14 · 10-9
413 K, 28 days 1.97 · 10-22 2,419,200 2.18 · 10-8
443 K, 3 days 2.06 · 10-21 259,200 2.31 · 10-8
473 K, 1 day 1.60 · 10-20 86,400 3.71 · 10-8

Chapter 6
126
Fig. 6.6. X-ray diffraction patterns (Co Kα1 radiation) of ε specimens of different
nitrogen contents (15.6, 17.9, and 19.1 at.% N) after ageing at the same temperature
and for the same time (i.e. 413 K; 28 days). The intensities have been given relative to
the integrated intensity of the 111 γ' reflection. For the sake of clarity, the
diffraction patterns have been shifted with respect to each other. The amount of the α''
phase present appears to be correlated to the nitrogen content of the initial ε phase:
the lower the nitrogen content of the initial ε, the greater the amount of α'' present.
Mass-balance considerations for both Reactions (1), ε into α"+ γ', and (2)
ε into α" + ε (enriched), leads to the following conclusion. For ε with an initial
composition close to that of γ', Reaction (2) produces the largest amount of α". The
current observations, thus, suggest that the Reaction (2) is dominant for the specimens
of low initial N content whereas Reaction (1) is more dominant the higher the initial
nitrogen content.
6.3.2.2. PHASE TRANSFORMATIONS IN ε WITH >20 at.% NITROGEN
UPON ANNEALING UP TO 443 K (GROUP A2)
The transformation behavior of ten specimens with nitrogen contents in the range
from 20 at.% to 26.5 at.% was studied in the temperature range from 373 to 443 K.
The phases present after the annealing experiments have been indicated in Table 6.2.

Phase Transformations / Phase Equilibria in the Iron-Nitrogen System at Temperatures below 573 K
127
The most striking results from these experiments are:
1. the amount of the γ' phase increases for specimens of nitrogen contents in the
range from 20 to 22.8 at.%.,
2. the (remaining) ε phase is nitrogen enriched, and
3. the long-range order of nitrogen atoms in the ε phase becomes more
pronounced.
6.3.2.2.1. PRECIPITATION OF γ' -Fe4N1-z FROM εεεε-Fe2N1-x: THE ε/ε + ε/ε + ε/ε + ε/ε + γ'
PHASE BOUNDARY
For the specimens with an initial composition of the ε phase in the concentration
range from 20.2 to 22.8 at.% N, an increase of the integrated intensity of the γ'
reflections is observed. Simultaneously, the reflections of the ε phase have shifted to
lower diffraction angles, indicating nitrogen enrichment of the remaining ε, in
accordance with the conservation of nitrogen in the specimen. The enrichment is
about 1 at.% in the specimen with the lowest nitrogen content (20.2 at.%) and about
0.1 to 0.05 at.% for the other specimens, depending on the initial nitrogen content††.
Hence, for temperatures in the range from 413 K to 443 K and for nitrogen contents in
the range from 20.2 to 22.8 at.%, the initial ε phase transformed according to:
ε → ε (enriched) + γ' (3)
Further, a shoulder appeared at the low angle side of the γ' reflections after 28
days at 413 K (note the 200 γ' reflection shown in Fig. 6.7.). Such an observation,
but much less pronounced, was also made for specimens in Group A1 discussed in
Section 6.3.2.1. Apparently, the reflection appears to consist of two peaks: one small
sharp peak with a full width at half of the maximum intensity (FWHM) of 0.01 deg
∆2θ and a broad one with a FWHM of 1.49 deg ∆2θ. The peak position of the small
reflection cannot be determined very accurately because of the weakness of the
†† Since the nitrogen content of the remaining (enriched) ε after annealing for a given time and temperature depends on the nitrogen content of the initial ε phase, these results cannot be used to construct the equilibrium phase boundary. Also, the dependencies of the lattice parameters on the nitrogen content are not known for the composition range concerned.

Chapter 6
128
reflection, but this peak position is always at a significantly higher diffraction angle
than that of the broad reflection (Fig. 6.7.).
Fig. 6.7. The 200 γ' reflection (Co Kα1 radiation) after ageing of an ε specimen (20.2
at.% N) for 28 days at 413K (dashed line: single peaks obtained by profile fitting). At
the low angle side of the γ' reflection (of γ' formed during specimen preparation), a
new and broad diffraction peak appears. The intensities have been given relative to
the maximum of the 111 ε reflection.
The interpretation of the composite 200γ' line profile is identical to the one
given in Section 6.3.2.1. The sharp peak is caused by a pre-existing, relatively low N-
containing γ' phase, while the broad peak originates from γ' precipitated during
annealing, which has an nitrogen content significantly higher than the original γ'.
Considering the α + γ'/ γ' phase boundary in the (assumed) Fe-N phase diagram (cf.,
Fig. 6.1., this observation indicates that the initially present γ', precipitated during
quenching of the specimen, has developed at higher temperatures than the annealing
temperatures applied here.

Phase Transformations / Phase Equilibria in the Iron-Nitrogen System at Temperatures below 573 K
129
The results are consistent with the preservation of the two-phase equilibrium
ε + γ' down to temperatures as low as 413 to 443 K, for nitrogen contents of 20 (at
least) to 22.8 at.%.
For the specimens with a nitrogen content of 23 to 26.2 at.%, further
development of a γ' phase and enrichment of the ε phase were not observed,
indicating that the initial ε phase behaves as a stable phase in the temperature range
investigated.
Since no precipitation of γ' was observed after annealing of the specimen with
a nitrogen content of 23.0 at.%, and precipitation of γ' did occur for a specimen with ε
containing 22.8 at.%, this could indicate that the ε+ γ' /ε phase boundary in the
Fe-N phase diagram shifts to lower nitrogen contents for temperatures <573 K (Fig.
6.8.). At 573 K, the ε+ γ' / ε boundary occurs at about 26.5 at.% N[33]. Recent
thermodynamic calculations[5,6] suggested a similar trend. However, it could be also
argued that the transformation of ε at these temperatures is hindered (note also Section
6.4.). In this respect, it is worth mentioning that, upon (very slow) furnace cooling of
a fully nitrided powder containing 25 at.% N from a nitriding temperature of 783 K to
room temperature, a small amount of γ' phase could also be detected[29].
6.3.2.2.2. REDISTRIBUTION OF NITROGEN ATOMS AND LONG RANGE
ORDERING OF NITROGEN IN εεεε
After nitriding and quenching, the diffraction patterns of samples with a composition
near to that of Fe3N (i.e. containing 23 to 26 at.% N) showed only the 101ε, 201 ε,
211 ε, and 103 ε superstructure reflections. After aging, new superstructure
reflections were detected: 100 ε, 200 ε, 102 ε, and 201 ε. Simultaneously, an
increase in the integrated intensity of the initially present superstructure reflections
was observed.
Hence, it is concluded that the nitrogen atoms redistribute upon annealing,
thereby establishing a more ordered state[37]. The observed superstructure reflections
indicate that the type of ordering of the nitrogen atoms is typical for Fe3N[32],
indicated the B-type configuration in Refs. [29] and [38].

Chapter 6
130
Fig. 6.8. The ε / ε + γ' phase boundary according to Ref. [4] and the results of
annealing ε and γ + γ' specimens at temperatures below 443 K.
The results obtained on phase transformation in the ε phase (Sections 6.3.2.1.
and 6.3.2.2.), (1) the absence of α" in the aged specimens with a nitrogen content
higher than 20 at.% (Group A2) and (2) the precipitation of γ' in both specimens
containing less than 20 at.% (Group A1) and more than 20 at.% (Group A2), could
indicate that γ' is a stable phase in the investigated temperature range from 373 to
473 K. On the other hand, it may be argued that the development of γ' in specimens
containing less than 20 at.% N occurs because γ' nucleation sites are already present
and that the formation of α"/α + ε (enriched) leads to a thermodynamically stable
situation.

Phase Transformations / Phase Equilibria in the Iron-Nitrogen System at Temperatures below 573 K
131
6.3.3. PHASE TRANSFORMATIONS OF γ' SPECIMENS (GROUP B)
In the as-prepared condition, both γ' specimens have a composition of 19.93 at.% N‡‡.
According to the Fe-N phase diagram[4,35,39], transformation of γ' of this composition
into γ' of a slightly higher nitrogen content (<20 at.%) and ferrite is expected to occur
at temperatures down to 573 K. This was indeed observed to occur in a γ' layer at 603
K[40].
In order to investigate the phase diagram below 537 K, the γ' specimens were
annealed at 373 K and 413 K for up to 50 days. An overview of the temperatures and
tempering times applied and the phase composition observed after the anneals is given
in Table 6.4.
Table 6.4. Phase transformation of γ'-Fe4N1-z (19.9 at.% N) specimen
Initial phase composition 373K
50 days
413 K
28 days
413 K 28 days + 373 K 50 days*
γ' - γ' + α" γ' + α"
γ' γ' γ' + α" -
* A heat treatment at 413 K (28 days) was followed by a heat treatment at 373 K (50
days)
After long-term aging for 28 days at 413 K, in addition to the γ' reflections,
new weak reflections pertaining to the α" phase were detected (note the 202α",
220α", and 213α" reflections in Fig. 6.9.). No evidence was obtained for the
development of α. Simultaneously, the γ' reflections shifted slightly to lower
diffraction angles, implying nitrogen enrichment of γ' (cf. the lattic-parameter data in
Ref. [30]). Hence, at 413 K the initial γ' decomposes according to
γ' ⇒ γ' (enriched) + α" (4)
‡‡ Due to the strong dependency of the lattice parameter of γ' on the nitrogen content[30], the N content can be determined with an accuracy of 0.02 at.% N.

Chapter 6
132
Fig. 6.9. X-ray diffraction pattern (Co Kα1 radiation) of γ' (Fe4N1-x) specimen in the
as-prepared state and after ageing for 28 days at 413 K. The intensity (logarithmic
scale) is given relative to the maximum intensity of the 111γ' reflection: the
diffraction patterns have been shifted with respect to each other along the vertical
axis. After annealing (weak), reflections of α'' are observed (dashed lines in top
figures: results of profile fitting).
The development of α" and an N-enriched γ' from γ' has not been reported
before. Apparently, aging at 373 K does not allow this transformation to occur even
after 50 days. This may be understood by assuming that the nitrogen diffusion is rate
controlling. The diffusion distance, √Dt, is very small for the treatment at 373 K and
is about 3 times smaller than the one for the treatment at 413 K for 28 days: about
16 nm for 50 days at 373 K vs. about 50 nm for 28 days at 413 K (the data of
diffusivity are taken from Ref. [36]).

Phase Transformations / Phase Equilibria in the Iron-Nitrogen System at Temperatures below 573 K
133
Using the relation given in Ref. [30] between the lattice parameter of γ' and its
nitrogen content, the increase of the lattice parameter upon aging at 413 K (from
a = 0.37978 nm to a = 0.37989 nm)§§ corresponds to an increase in nitrogen content
from 19.93 at.% before annealing to 20 at.% after annealing. Hence, the phase
boundary of the γ' field in the Fe-N phase diagram shifts toward higher nitrogen
contents with decreasing of temperature (from the temperature of nitriding, 723 K, to
the temperature of annealing, 413 K). This is in agreement with an extrapolation of
previous evaluations (cf. Refs. [38] and [40]).
From a mass-balance consideration, the volume fractions of the two phases
after annealing (α" and γ') can be calculated as follows. The γ' phase contains
19.93 at.% N initially and contains 20 at.% N after annealing. Assuming that the
precipitated α" contains 11.11 at.% N, corresponding to Fe16N2, the volume fraction
of the two phases after annealing is calculated to be 0.8 vol.% α" + 99.2 vol.% γ'. The
amount of precipitated α" phase is small, which explains why only its strongest
reflections can be observed (Fig. 6.9.).
6.3.4. PHASE TRANSFORMATION OF THE γ SPECIMEN (GROUP C)
According to the published Fe-N phase diagram[35], γ (austenite) specimens should
transform into α and γ' upon annealing at temperatures below 865 K. In view of the
here-observed development of α" upon transformation of ε (<19.5 at.% N) and γ' at
temperatures below 573 K (Sections 6.3.2.1. and 6.3.3.), the transformation behavior
of γ at similar temperatures is of interest to establish the stability of α" at these
temperatures. The nitrogen content of the specimen is 9.75 at.%. The resulting phase
compositions after different anneals of the specimen are given in Table 6.5.
For all temperatures and times of aging investigated, in addition to γ
reflections, only α and γ' reflections were observed. No indications for the presence of
α" were obtained. The γ reflections did not shift upon aging (Fig. 6.10.), implying that
no composition change occurs for the remaining γ during transformation. Hence, in
the temperature range of 413 K to 463 K, γ decomposes according to
γ ⇒ α + γ' (5)
§§ The error in the value of the lattice parameter (derived from the 220γ' peak position) was ± 3 × 10⁻⁵ nm, corresponding to 1/5 of the employed step size in 2θ.

Chapter 6
134
Fig. 6.10. The lattice parameters of γ and γ' during the decomposition of γ into
α + γ'.
Table 6.5. Phase transformation of a γ specimen (9.75 at.% N)
413 K 443 K Initial phase
composition 7 days 28 days 3 days 14 days 28 days 50 days
463 K
3 days
γ γ + γ' +
α
γ + γ' +
α
γ + γ' +
α
γ + γ' +
α
γ' + α γ' + α γ + γ' +
α

Phase Transformations / Phase Equilibria in the Iron-Nitrogen System at Temperatures below 573 K
135
Diffraction patterns recorded at various stages of the transformation, upon
annealing at 443 K, are shown in Fig. 6.11. In the initial stage (after 3 days
annealing), weak α and γ' reflections are already observed. Prolonged annealing for
up to 14 days leads to an increase of the intensities of α and γ' reflections and the
observation of γ' superstructure reflections as 100γ'. After 28 days of annealing,
reflections of γ are absent: γ is fully decomposed into α and γ'.
Additional, cumulative annealing experiments were carried out in order to
study whether the specimens consisting of α and γ' after full decomposition of γ might
experience further phase transformations: e.g., formation of α". The annealing time
(at 443 K) was prolonged to 50 days, but no further changes were observed in the
diffraction patterns. Also, to check if α" would develop initially as an intermediate
phase, annealing was performed at 413 K for shorter time (7 days). Also, after this
short heat treatment, very weak reflections of only α and γ' were observed and no
reflections of α" could be detected.
The rate of transformation of γ strongly depends on the temperature of
annealing. For example, while after 28 days at 443 K austenite is fully decomposed,
after the same time at 413 K, the transformation is still in an initial stage. Note that
the transformation of γ in this single-phase specimen considered here is much slower
than that of γ, for the same heat treatment, in the ε + γ specimen (Section 6.3.5.
addresses the transformation of ε + γ two-phase specimens).
The type of transformation pertaining to the transformation of γ into α and γ'
follows from the intensity ratio of the appearing phases and their compositions. Apart
from the peak positions of the reflections of the parent γ phase (addressed previously),
those of the product phases γ' and α also remain constant during the transformation
(Fig. 6.10.). Further, the ratio of the integrated intensities of α and γ' reflections
remains constant (e.g. Iγ'220/Iα200; Fig. 6.12.), whereas the ratio of the integrated
intensities of γ and γ' reflections obviously decreases (e.g. Iγ220/Iγ'200; Fig. 6.12.).
The combination of a constant value of the ratio of integrated intensities and constant
composition, indicates that the transformation is of a eutectoid type. Recognizing the
low temperature at which the transformation proceeds, the transformation of γ to α
and γ' is suggested to be bainitic.

Chapter 6
136
Fig. 6.11. X-ray diffraction patterns (Co Kα1 radiation) of an iron-nitrogen austenite
(γ) specimen after ageing at 443 K for different times. The diffraction patterns have
been shifted with repect to each other along the vertical axis. Upon annealing, the γ specimen (9.75 at.% N) decomposes into α + γ'. Full decomposition is observed after
28 days.
Fig. 6.12. Ratio of the integrated intensities of (a) the 220 γ' and 200α reflections,
and (b) the 220 γ and 220 γ' reflections.

Phase Transformations / Phase Equilibria in the Iron-Nitrogen System at Temperatures below 573 K
137
Using the "direct comparison method"[33] (cf. Section 6.2.), the amounts of the
three phases during the different stages of the transformation were calculated, for
different times of aging at 443 K, from the integrated intensities of the 200α,
220γ', and 220 reflections, and the 110α, 200γ', and 200γ reflections (Table
6.6.). Starting with initially 100 % γ, the specimen consists of 54.8 vol.% α and 45.2
vol.% γ' after full decomposition (after 28 days at 443 K).
Table 6.6. Volume percentages of the α, γ, and γ' phases after different times of
annealing at 443 K of a γ specimen (9.75 at.% N)
Phase Initially present 3 days 14 days 28 days 42 days
α (vol.%) - 25.0 49.2 54.8 54.8
γ' (vol. %) - 20.1 40.7 45.2 45.2
γ (vol.%) 100 54.9 10.1 - -
Table 6.7. Phase transformation of the two-phase specimen ε (13 at.% N) +
γ (10.15 at.% N)
443 K Initial phase
composition
373 K
50 days
413 K
28
days
3 days 14 days 28 days
463 K
3 days
γ + ε γ + ε +
α"
γ + α
+ γ' +
α"
γ + α + γ' +
α" + ε
α + γ' + α"
+ ε
α+ γ' + α"
+ ε
α + γ' +
γ
Enriched
From the mass balance, the expected amount of α and γ' phases after the
transformation of austenite containing 9.75 at.% N can be calculated. Assuming that
the nitrogen content in the α and γ' phases at 443 K is 0.02 and 20 at.%, respectively,
the expected values for the volume percentages are calculated to be 51.3 vol.% α and
48.7 vol.% γ', which agree well with the experimental values derived from the
integrated intensities.

Chapter 6
138
From the previous above results on the transformation of γ during low-
temperature (413 to 463 K) annealing, it appears that γ' is a stable phase in the Fe-N
phase diagram in this temperature range.
6.3.5. PHASE TRANSFORMATION OF γ + εεεε TWO PHASE SPECIMENS
(GROUP D)
According to the published Fe-N phase diagram[35], γ + ε specimens should
decompose into α and γ' upon annealing at temperatures below 865 K (down to
573 K). In view of the development of α" (or α) from ε (<19.5 at.% N), the
development of α" from γ' and the development of γ' + α from γ specimens (Sections
6.3.2.1., 6.3.3., and 6.3.4.), the transformation behavior of a γ (10.15 at.% N) + ε
(13 at.% N) specimen is of interest for investigating the (meta)stability of α" at
temperatures below 473 K. With respect to the formation of α" from γ' (Section
6.3.3.) and not from γ (Section 6.3.4.), and the inevitable presence of some γ' in ε
(<19.5 at.% N) (Section 6.3.2.1.), it could be argued that the presence of γ' may be
decisive for the formation of α", for instance, by providing an easy a nucleation site.
No γ' is present in the as-prepared ε + γ specimens discussed in this section.
The phase constitution resulting after the anneals performed is given in Table 6.7.
(also note Fig. 6.13.). It follows that phase transformation of the two-phase γ + ε
specimens can be conceived as the superposition of the transformation of ε
(<19.5 at.% N) and γ, as observed before: ε → α" (α) + ε (enriched), ε → α" (α) + γ',
and γ → α + γ'. However, the kinetics of these reactions are different from those for
the "single"-phase specimens. From the results obtained after different times of
annealing at 443 K (Fig. 6.13.), it can be deduced that first the initial ε phase (13 at.%
N) transforms relatively rapidly. After 3 days at 443 K, it already has disappeared
fully. At the same time, a new, nitrogen-rich ε phase (with about 23 to 24 at.% N; cf.
Section 6.3.2.1. for ε (<19.5 at.% N)), with an appreciably higher nitrogen content
than the initial one, and α" have developed (cf. Fig. 6.13. (b)). The γ phase
decomposes into α and γ' (cf. Section 6.3.4.). This transformation in the current two-
phase ε + γ specimen is faster than in the single-phase γ specimen: the γ phase in the

Phase Transformations / Phase Equilibria in the Iron-Nitrogen System at Temperatures below 573 K
139
Fig. 6.13. X-ray diffraction patterns (Co Kα1 radiation) of a two-phase specimen γ (10.15 at.% N) + ε (13 at.% N) upon decomposition at 443 K: (a) The as-prepared

Chapter 6
140
state (b) After ageing for 3 days at 443 K, the initially present ε is fully decomposed
and the α, α'', γ', and nitrogen-enriched ε phases have developed; at this stage, some
austenite is still present. Ageing for the same time at 463 K results in decomposition
into α and γ' (c) After 14 days at 443 K, the austenite is also fully decomposed (d) At
443 K, the α, α'', γ', and nitrogen-enriched ε remain present even after a longer time
(28 days).
Fig. 6.14. X-ray diffraction patterns (Co Kα1 radiation) in the range of (a) 47 to
58 ˚2θ and (b) 90 to 100 ˚2θ for a two-phase specimen γ (10.15 at.% N) + ε (13 at.%
N) after ageing at 443 K. Upon prolonged ageing, an increase of the intensities of the
α and γ' reflections and a decrease of the α'' reflections are observed.
two-phase specimen has fully decomposed after 14 days at 443 K, whereas, in the
single-phase specimen (discussed in Section 6.3.4.), full decomposition of the γ phase
requires 28 days at 443 K.
In the current γ + ε specimen, the α" phase is clearly present after the third day
at 443 K (Fig. 6.13. (b)). The α" phase seems stable at this temperature in this sample,
as shown in the diffraction patterns in Fig. 6.13. (c) and (d) after annealing for 14 and
28 days, respectively. Prolonged annealing for up to 42 days showed that a small but
significant decrease of the integrated intensities of α" reflections and a corresponding
increase if the integrated intensities of α and γ' reflections occur (Fig. 6.14.). This
indicates that α + γ' develop during transformation of α", suggesting that α" is an
intermediate phase. The relatively slow transformation of α" → α for the
ε + γ specimen may be due to a nitrogen content near that of α" (11.11 at.%) or the
absence of initial γ' in the quenched specimens, so that no nucleation sites for γ' are
present (Section 6.3.2.1.).

Phase Transformations / Phase Equilibria in the Iron-Nitrogen System at Temperatures below 573 K
141
Table 6.8. Summary of the experimentally observed phase transformations during low
temperature aging of Fe-N alloys compared with the different possibilities of low
temperature Fe-N equilibria
Specimens α and α'* γ γ + ε ε (<19.5
at.% N)
γ' ε (>20
at.% N)
Experimental
ly observed
(this work)
trans-
formations
during low
temperature
(373 – 473K)
aging
- γ → α
+ γ'
γ → α + γ'
ε → α" +
γ' [1]
ε → α" +
ε [2]
if T ≥
443K
α" → α +
γ
ε → α" +
γ' [1]
ε → α" +
ε [2]
if T ≥
443K
α" → α +
γ'
γ' →
α" +
γ'
ε
(<23at.%)
→ γ + ε
ε
(>23at.%)
→ ε
+ordering
Reported
before [7-21]
Precipitation
of α"
(Fe16N2)
- - - - -
Stable phases
at low
temperature;
extrapolation
of Wriedt [4]
phase
boundaries
α+ γ' α + γ' α + γ' α + γ' γ' + α γ' + ε
(26.5 at.%
N)
* α' : martensite
Enriched

Chapter 6
142
6.4. GENERAL DISCUSSION
A summary of the phase transformations determined to occur during low-temperature
aging of Fe-N alloys in given in Table 6.8. The expected equilibrium phases,
corresponding to different proposals for the Fe-N phase diagram at low temperature,
have also been indicated in Table 6.8.
At constant pressure, at most, two phases can be in thermodynamic
equilibrium over a certain temperature range in the Fe-N system. Thus, the concurrent
presence of three phases in apparently fully transformed samples, i.e. after long-term
annealing, does not correspond with thermodynamic equilibrium: note, for instance,
the simultaneous presence of ε, γ' and α after the long-term annealing of the (initially)
γ + ε and ε specimens.
As an explanation for the simultaneous occurrence of more than two phases, it
is proposed that local structure and/or composition variations induce the system to
establish locally metastable equilibria. The low temperatures involved hinder long-
distance nitrogen diffusion to obtain a macroscopically homogeneous specimen. This
is, in particular, clear from the transformation of the two-phase γ + ε specimens, in
which the ε-phase regions and the γ-phase regions apparently behave as independent
entities upon tempering.
Apart from the development of α" from supersaturated ferrite (α) and from
martensite (α') at low temperatures, as known from the literature, this work
unequivocally demonstrates that α" also develops during low-temperature aging of γ'
and ε (<19.5 at.% N). The α" phase does not form upon low-temperature annealing of
γ specimens, which decompose into γ' + α. By aging above 413 K, the α" phase
initially formed in the ε phase transforms into α in the ε and the ε + γ specimens,
provided the ε phase contains less than 19.5 at.% N. No aging above 413 K has been
performed for γ' specimens. Prolonged annealing at 413 K or lower temperatures did
not lead to the dissolution of α" and the formation of α, neither in the γ' and ε (<19.5
at.% N) specimens nor in the ε + γ specimen.
Also, α" formed in supersaturated ferrite or martensite[9,10,12,14,23] is apparently
stable at temperatures below about 453 K. Considering these data and the present
observations of the apparent stability of α" below 413 K, it can be argued that α" is a
stable phase. Then, the peritectoid reaction α + γ' → α" is present in the Fe-N phase

Phase Transformations / Phase Equilibria in the Iron-Nitrogen System at Temperatures below 573 K
143
Fig. 6.15. The phase diagram at low temperatures (below gray dashed line) proposed
on the basis of this work: for an overall composition of <20 at.% N, α + γ' are the
equilibrium phases, whereas for an overall composition of > 20 at.% N, γ' + ε or only
ε (for nitrogen contents above about 24 at.% N at 413 K) are the equilibrium phases.
The γ' phase appears to be a stable phase at temperatures as low as 373 K. (a) The α''
phase is an equilibrium phase below about 440 K (b) The α'' phase is an intermediate
phase and precursor for the formation of α.
diagram at a temperature in the range from 410 to 450 K (note the proposed phase
diagram in Fig. 6.15. (a)). On the other hand, α" could be a transition phase on the
way to the equilibrium (α + γ'), which leads to the proposed Fe-N phase diagram in
Fig. 6.15. (b).
The kinetic preference for α" as an intermediate phase can be understood as
follows. By localized rearrangement of Fe atoms, the parent (ε or γ') iron sublattice
can be transformed into another sublattice (α" or α). However, the equilibrium α
phase can only contain a minor amount of nitrogen (~ 0.02 at.%), whereas the
transition phase α" can contain an appreciable amount of nitrogen (11.11 at.%). As
nitrogen diffusion at the temperatures considered is slow, it is conceivable that α"
forms as a transition stage for α development (and, consequently, metastable
equilibria arise), in particular in the specimens ε and γ' both containing larger nitrogen
contents than that of α".

Chapter 6
144
The observation that the γ' nitride develops and stays as a final transformation
product during aging of samples of Groups A1, A2, C, and D at the low temperatures
investigated, indicates strongly that this phase is stable at low temperatures. The
observation reported in Ref. 23, where the γ' phase vanished during low-temperature
aging assisted by ion bombardment, has to be attributed to irrelevant experimental
conditions for testing the low-temperature stability of phases (note the discussion in
Ref. 6).
If, as proposed earlier for nitrogen contents smaller than 20 at.%, α + γ' are the
equilibrium phases, then the simultaneous presence of ε (enriched), γ', and α" in
decomposing ε specimens should be understood as follows. As discussed previously,
α" develops as a precursor for α. The surrounding ε matrix incorporates the excess
nitrogen and becomes enriched in nitrogen. Apparently, the nucleation of γ' is not
easily realized, despite the similarity between the cubic and hcp Fe sublattices of the
γ' and ε phase, respectively, which would suggest an easy transformation from ε to γ'
by the introduction of stacking faults in the Fe sublattice. It appears,
thermodynamically more favorable to develop the α" phase, presumably in regions
where no nucleation sites for the γ' phase are available. Because of the slow diffusion
of nitrogen atoms, locally, the nitrogen content of the ε matrix becomes higher than
the maximum solubility of N in the (equilibrium) γ' phase. Thus, the metastable
equilibrium α"/ε (enriched) is established. In the current ε specimens, some γ'-phase
regions are already present initially, as a consequence of the specimen preparation
(Section 6.2.). These γ'-phase particles serve as nucleation sites, and γ' can form
relatively easily upon tempering because no nucleation is required. At these locations,
the equilibrium α" (as a precursor for α) + γ' is established.
Then, reviewing the results of this work (Table 6.8.), it is concluded that, for
an overall composition lower than 20 at.% N, α + γ' and, for an overall composition
higher than 20 at.% N, γ' +ε or ε (for nitrogen contents above about 24 at.% at 413 K)
are equilibrium phases, at least down to about 440 K. Below 440 K, α" has been
observed as either an intermediate phase or an equilibium phase. This leads to the
proposal for two possible Fe-N phase diagrams at low temperatures, as given in Fig.
6.15. The γ' is, then, an equilibrium phase at temperatures as low as 373 K. The
current experiments do not allow a precise determination of the ε+ γ'/ε phase
boundary, although the results suggest an extension of the ε phase toward lower
nitrogen contents at lowering temperatures, because the nitrogen contents of the

Phase Transformations / Phase Equilibria in the Iron-Nitrogen System at Temperatures below 573 K
145
nitrogen-enriched ε phases (at a certain temperature) depend strongly on the initial
nitrogen contents of the specimens.
6.5. CONCLUSIONS
The low-temperature part (373 K to 473 K) of the Fe-N phase diagram can be
investigated by analyzing annealed homogeneous specimens of about 10 to 26 at.% N
by X-ray diffraction. Homogeneous Fe-N alloys of a high nitrogen content could only
be prepared by nitriding highly porous specimens (here obtained by sintering pure
iron powder). The large surface area/volume ratio is essential, because the NH3/H2 –
Fe[N] equilibrium can only be imposed at the gas-solid interface.
From the results, the following conclusions are drawn:
1. The equilibrium phases below 860 K, for nitrogen contents <24 at.%, are α, γ'
(the γ' phase is stable down to at least 383 K), and ε.
2. Two possible interpretations for the formation of the α" phase at low
temperatures are that
o the α" phase develops as a precursor for α, not only from α
(ferrite) and α' (martensite), but also upon transformation of
ε (<20 at.% N) and γ'; or
o the α" phase develops as an equilibrium phase below about 440 K.
3. Because of the difficult nucleation of γ' and slow diffusion of nitrogen atoms,
the transformation of ε containing less than 20 at.%. N initially leads to the
development of the intermediate phases α" and ε, which is enriched in
nitrogen up to 24 at.% (i.e. more than the nitrogen content of γ').

Chapter 6
146
REFERENCES 1. Lehrer, E., Z. Elektrochem., 1930, vol.36 (7), pp. 460-73
2. Paranjpe, V.G., M. Cohen, M.B. Bever, C.F. Floe, Trans. AIME, 1950, vol. 88, pp. 261-67
3. Jack, K.H., Proc. R. Soc. A, 1951, vol. 208, pp. 200-15
4. ASM Handbook, Alloy Phase Diagrams, vol.3, ASM, 1993
5. Kunze, J., Physical Research, 1990, vol.16, Akademie Verlag, Berlin.
6. Kooi, B.J., M.A. J. Somers, E.J. Mittemeijer, Metall. Trans. A, 1996, vol. 27A, pp. 1063-71
7. Mittemeijer, E.J., A.B.P. Vogels, P.J. van der Schaaf, Scripta Metall., 1980, vol. 14 (4), pp. 411-16
8. Ferguson, P., K.H. Jack, HeatT treatment ’81, TMS, London, 1983, pp. 158-63
9. Dahmen, U., P. Ferguson, K.H. Westmacott, Acta Metall., 1987, vol.35 (5), pp. 1037-46
10. Wada, M., A. Fujii, T. Komazaki, T. Mori, Acta Metall., 1989, vol.37 (9), pp. 2349-55
11. van Gent, A., F.C. van Doorn, E.J. Mittemeijer, Metall. Trans. A, 1985, vol. 16A, pp. 1371-84
12. Böttger, A., L. Cheng, E. Frikkee, Th. H. de Keijser, E.J. Mittemeijer, J Phys.: Condens. Matter,
1990, pp. 9237-45
13. Cheng, L., E.J. Mittemeijer, Metall. Trans. A, 1990, vol. 21A, pp. 13-26
14. Fall, I., J.–M.R. Genin, Hyperfine Interactions, 1991, vol. 69, pp. 521-24
15. Han, K., H.W. Zandbergen, A. Böttger, E.J. Mittemeijer, Proc. Int. Conf. Solid-Solid Phase Trans.,
TMS, Warrendale, PA, W.C. Johnson, J.M. Howe, D.E. Laughlin, W.A. Soffa, 1994, pp. 791-96
16. Pithan, C., K. Katori, K. Hayashi, K. Aso, G. Petzow, J. Alloys Compounds, 1995, vol. 222 (1-2),
pp. 173-78
17. Fall, I., J.–M.R. Genin, Metall. Mater. Trans. A, 1996, vol. 27A, pp. 2160-77
18. Van Genderen, M.J., A. Böttger, E.J. Mittemeijer, Metall. Mater. Trans. A, 1997, vol. 28A, pp. 63-
77
19. Tanaka, H., S. Nagakura, Y. Hakamura, Y. Hirotsu, Acta Mater., 1997, vol. 45 (4), pp. 1401-10
20. Cheng, L., N.M. van der Pers, A. Böttger, Th. H. de Keijser, E.J. Mittemeijer, Metall. Trans. A,
1991, vol. 22A, pp. 1957-67
21. Gavriljuk, V.G., V.M. Nadutov, K. Ullakko, Scripta Metall. Mater., 1991, vol. 25 (4), pp. 905-10
22. DeCristofaro, N., R. Kaplow, Metall. Trans. A, 1977, vol. 8A, pp. 35-44
23. Vredenberg, A.M., C.M. Perez-Martin, J.S. Custer, D.O. Boerma, L. de Wit, F.W. Saris, N.M. van
der Pers, Th.H. de Keijser, E.J. Mittemeijer, J. Mater. Res., 1992, vol. 7 (10), pp. 2689-2712
24. Foct, J., P. Rochegude, A. Hendry, Acta Metall., 1988, vol.36 (3), pp. 501-05
25. Rochegude, P., J. Foct, Phys. Status Solidi A: Appl. Res., 1985, vol.88 (1), pp. 137-42
26. O’Donnell, K., X.-L. Rao, G. Laird, J.M.D. Coey, Phys. Status Solidi A: Appl. Res., 1996, vol.
153 (1), pp. 223-31
27. Illgner, C., K.-P. Lieb, P. Schaaf, H. Koster, K. Mann, G. Marowsky, Appl. Phys. A: Mater Sci.
Proc., 1996, vol. 62 (3), pp. 231-36
28. Tsubakino, H., M. Ando, Y. Takata, M. Terasawa, T. Mitamura, Mater. Lett., 1996, vol. 26 (3), pp.
155-59
29. Somers, M.A.J., B.J. Kooi, L. Maldzinski, E.J. Mittemeijer, A.A. van der Horst, A.M. van der
Kraan, N.M. van der Pers, Acta Mater., 1997, vol. 45 (5), pp. 2013-25

Phase Transformations / Phase Equilibria in the Iron-Nitrogen System at Temperatures below 573 K
147
30. Somers, M.A.J., N.M. van der Pers, D. Schalkoord, E.J. Mittemeijer, Metall. Trans. A, 1989, vol.
20A, pp.1533-39
31. Cheng, L., A. Böttger, Th.H de Keijser, E.J. Mittemeijer, Scripta Metall. Mater., 1990, vol. 24, pp.
509-14
32. Jack, K.H., Acta Cryst., 1952, vol. 5, pp. 404-11
33. Cullity, B.D., Elements of X-ray diffraction, Addison-Wesley Series in Metallurgy and Materials,
Reading, MA, 1978
34. Bell, T., J. Iron Steel Inst., 1968, vol. 206, pp. 1017-21
35. Binary Alloy Phase Diagrams, T.M. Massalski, ed., ASM, Materials Park, OH, 1990, vol. 2
36. Mittemeijer, E.J. M.A.J. Somers: Surf. Eng., 1997, Vol. 13 (6), pp. 483-97
37. Böttger, A.J., S. Malinov and M.I. Pekelharing, Delft University of Technology, Delft, The
Netherlands, unpublished research, 1999
38. Kooi, B.J., M.A. J. Somers, E.J. Mittemeijer, Metall. Mater. Trans. A, 1994, vol. 25A, pp. 2797-
813
39. Goldschmidt, H.J., Interstitial Alloys, Butterworth and Co., London, 1967
40. Somers, M.A.J., E.J. Mittemeijer, Metall. Trans. A, 1990, vol. 21A, pp. 901-12


149
SUMMARY
Obtaining accurate thermodynamic data for interstitial solid solutions is challenging.
Not only does it require incorporation of the changes in volume caused by the
introduction of small atoms (such as hydrogen, boron, carbon, and nitrogen) into the
interstitial spaces formed by the host lattice; the interaction between the atoms
forming the host lattice and the atoms occupying the interstitial sites, and the
occurrence of long range ordering (LRO) and short-range ordering (SRO) on both the
host and the interstitial sublattices need to be considered as well. Other complicating
factors concern the metastability of interstitial solid solutions such as nitrides and
carbides, which are often non-equilibrium phases, and the fact that direct observation
of precipitates of such phases is hampered by their small size. Therefore, the ability to
predict thermodynamic properties accurately renders valuable information for process
and material property optimization in industrial applications that cannot be obtained
otherwise.
(Sub)regular solution models, which are frequently used to describe the
thermodynamics of interstitial solid solutions, do not include LRO of the interstitial
atoms. The simplest approach which includes LRO in the description of the phases is
the Gorski-Bragg-Williams (GBW) model. However, this model does not explicitly
account for SRO. The main focus of this thesis is therefore the development of a
thermodynamic model for interstitial alloys, based on the Cluster Variation Method
(CVM), capable of incorporating SRO, LRO, and the mutual interaction between the
host and the interstitial sublattices. The obtained cluster-based model is then applied
to describe phase equilibria between iron nitrides.
Fe-N phases can be conceived as consisting of a metal sublattice, fully
occupied by iron atoms, and an interstitial sublattice, occupied by a mixture of
nitrogen atoms and vacancies. In other words, such a system can be approached as a
binary nitrogen-vacancy solution in the mean field of an iron host. This concept is
further explored in Chapter 2, which describes LRO of nitrogen atoms on the
sublattice formed by the octahedral interstices of the Fe sublattice of ε-Fe2N1-x by
application of the GBW approach. Both the fitting of the nitrogen absorption isotherm
to experimental nitrogen absorption data and the probabilities for Fe atoms
surroundings obtained with Mössbauer spectroscopy indicate that ordering of nitrogen

150
in ε-Fe2N1-x takes place according to two ground-state structures: Fe2N (configuration
A) and Fe3N (configuration B). Utilizing a synchrotron source, the superstructure
reflections are analyzed to verify the occurrence of both configurations. The
superstructure reflections and local surroundings of Fe atoms consistent with ordering
of the nitrogen atoms according to configuration B are observed. Interestingly, the
001 and 301 superstructure reflections, specific for configuration A, are not
detected, contrary to the expectations raised by the Mössbauer data. As shown by
preliminary structure factor calculations, the displacement of Fe atoms by the
(ordered) occupation of interstitial sites affects the diffracted intensity, which strongly
reduces the already weak reflections typical for configuration A.
Next, the Cluster Variation Method is implemented and the thermodynamic
model is expanded to include both LRO and SRO. Since the CVM is usually applied
to substitutional systems, the main adaptation of the model to be made for the Fe-N
phases is to allow for changes in volume as a function of the composition of the
interstitial sublattice and to approach the system in such a way that the limited
experimental data available suffices for an estimation of the input parameters
necessary for the calculations. Chapter 3 describes the calculation of the
γ-Fe[N] / γ'-Fe4N1-x phase equilibrium using the CVM tetrahedron approximation. A
Lennard-Jones potential is used to describe the dominantly strain-induced
interactions, caused by the misfit of the nitrogen atoms in the interstitial octahedral
sites. The CVM calculations clearly demonstrate the occurrence of SRO in γ-Fe[N]
and distinct LRO in γ'-Fe4N1-x, in agreement with Mössbauer and X-ray diffraction
data. For the first time, quantitative analysis of CVM calculations is directly
compared to experimental Mössbauer data, resulting in good agreement between the
CVM predictions and the fractional occurrences in γ-Fe[N] of specific Fe atom
surroundings in terms of the number of neighboring nitrogen atoms.
The γ'-Fe4N1-x / ε-Fe2N1-z phase equilibrium is calculated in Chapter 4, which
necessitates the introduction of the CVM prism approximation to facilitate the
description of ordering of nitrogen atoms on the interstitial sublattice of ε-Fe2N1-z.
The interactions with the iron sublattice are incorporated through effective interaction
parameters and two γ' + ε miscibility gaps (i.e. four phase boundaries) are described
by adopting a single set of pair interaction energy parameters. The CVM calculations
demonstrate the occurrence of distinct LRO of nitrogen in γ'-Fe4N1-x as well as the
occurrence of both SRO and LRO of nitrogen in ε-Fe2N1-z. The LRO occurring in

Summary
151
ε-Fe2N1-z at nitrogen contents close to 25 at.% is in agreement with the type of
ordering for Fe3N (configuration B) observed in diffraction experiments. Again, the
occurrences of the surroundings of the iron atoms, as predicted by the CVM
calculations, are in good agreement with experimental data obtained by Mössbauer
spectrometry. The theoretical values obtained for the lattice parameters of the
ε-Fe2N1-z phase tend to be up to a mere 1% smaller than the few available
experimental data in the composition range studied.
In Chapter 5, the CVM approximation is extended to explicitly include the
atom distributions over the sites of both the substitutional host sublattice and the
interstitial sublattice. By including sites of both sublattices into the basic cluster of the
cube approximation, the description of order-disorder transitions on the metal and
interstitial sublattices of hypothetical fcc alloys with interstitial species is realized.
Analysis of the calculated cube distribution variables demonstrates that phase
transitions on the metal and interstitial sublattices are coupled: a phenomenon that has
been experimentally observed for certain metal-hydrogen systems, but that has not
been explicitly incorporated into the thermodynamic description of phases by CVM
until recently. Not only the induction of SRO on both the metal and the interstitial
sublattices following the introduction of a second metal atom type on the metal
sublattice is shown, preferential grouping of metal atoms with specific interstitials is
observed as well.
Finally, a survey of the low-temperature region (373 K to 473 K) of the Fe-N
phase diagram is performed by analyzing annealed homogeneous specimens of about
10 to 26 at.% nitrogen by X-ray diffraction. A new method to prepare homogeneous
Fe-N alloys by nitriding highly porous specimens of sintered pure iron powder is
developed for this purpose, since a large surface area/volume ratio has proven to be an
essential requirement for the preparation of alloys with a high nitrogen content. Two
possible interpretations for the formation of the α"-Fe16N2 phase at low temperatures
are formulated: either the α" phase develops as a precursor for α, not only from α
(ferrite) and α' (martensite), but also upon transformation of ε (<20 at.% nitrogen) and
γ', or the α" phase develops as an equilibrium phase below about 440 K. The
decomposition process appears to be governed by the difficult nucleation of γ' and the
slow diffusion of the nitrogen atoms, causing the formation of intermediate phases.
The ideas and methods explored in this thesis combined with ab initio
calculations create an environment which supports design and development of

152
interstitial alloys exhibiting specific desirable properties and stabilities in a finite
range of temperatures for practical industrial applications. Currently, this approach is
used to improve the efficiency and life span of hydrogen gas separation membranes.

153
SAMENVATTING
Het nauwkeurig beschrijven van de thermodynamica van interstitiële vaste
oplossingen is om verschillende redenen een uitdaging. De introductie van kleine
atomen (zoals waterstof, boor, koolstof en stikstof) in de interstitiële holtes van een
(metaal)rooster heeft vervorming van de structuur en volumeveranderingen tot
gevolg. Bij de beschrijving moet rekening gehouden worden met de interacties tussen
de (metaal) atomen in de matrix en de atomen die de interstitiële plaatsen bezetten.
Daarbij is het optreden van korte-afstands orde (KO) en lange-afstands orde (LO) op
zowel het subrooster van de metaalatomen als op het subrooster van de interstitiële
atomen van belang. Het feit dat directe waarneming van interstitiële fasen moeilijk is
doordat de gevormde precipitaten erg klein zijn en dat nitrides en carbides vaak
metastabiel zijn, maakt duidelijk dat het voorspellen van thermodynamische
grootheden noodzakelijke informatie voor het optimaliseren van processen en
materiaaleigenschappen kan verschaffen die niet op andere wijze kan worden
verkregen.
Het eenvoudigste thermodynamische model dat in staat is om lange-afstands
orde in interstitiële vaste oplossingen te beschrijven is de Gorski-Bragg-Williams
(GBW) benadering. In die benadering wordt het voorkomen van KO echter niet
expliciet meegenomen. In dit proefschrift is een model ontwikkelt voor interstitiële
vaste oplossingen gebaseerd op de Cluster Variatie Methode (CVM), dat zowel KO
als LO beschrijft. Het model is vervolgens toegepast op evenwichten tussen ijzer-
stikstof fasen.
Fe-N fasen kunnen worden opgevat als bestaand uit een metaalsubrooster,
volledig bezet met ijzeratomen, en een interstitieel subrooster, dat gevormd wordt
door stikstofatomen en vacatures. Met andere woorden: een dergelijk systeem kan
worden benaderd als een binaire oplossing van stikstofatomen en vacatures in het
gemiddeld veld (“mean field”) van het metaalrooster, waarbij de interacties tussen de
individuele atomen vervangen zijn door een effectieve interactie. Dit concept wordt
uitgewerkt in hoofdstuk 2, dat de LO beschrijft van stikstofatomen op het interstitiële
subrooster van octaëderholtes in het ijzersubrooster. Zowel het fitten van de stikstof-
absorptie- isothermen aan de experimentele absorptiedata en de waarschijnlijkheden
van de verschillende omringingen van de ijzeratomen verkregen met
Mössbauerspectroscopie wijzen er op dat ordening van stikstof in ε-Fe2N1-x

154
plaatsvindt volgens twee configuraties: Fe2N (configuratie A) en Fe3N (configuratie
B). Om de aanwezigheid van deze configuraties te onderzoeken is gekeken naar de
aanwezigheid van karakteristieke superstructuurreflecties. De waargenomen
superstructuurreflecties zijn consistent met de ordening van de stikstofatomen volgens
configuratie B. De 001 en 301 superstructuurreflecties specifiek voor
configuratie A worden niet waargenomen, in tegenstelling tot wat op basis van de
Mössbauer data verwacht werd. Berekeningen van de structuurfactor geven aan dat
een mogelijke verklaring hiervoor is dat lokale vervorming van het ijzerrooster, door
de (geordende) bezetting van de interstitiële holten, zodanig is dat de intensiteit van
de toch al zwakke reflecties van configuratie A sterk afneemt.
In hoofdstuk 3 wordt de thermodynamische beschrijving uitgebreid met KO
door het toepassen van de Cluster Variatie Methode (CVM). Aangezien de CVM
oorspronkelijk is ontwikkeld voor substitutionele systemen, is de methode aangepast
voor interstitiële systemen door het implementeren van volumeveranderingen als
functie van de samenstelling en het invoeren van effectieve interacties opdat de
beperkte beschikbare experimentele data voldoende zijn voor een schatting van de
materiaalparameters. Hoofdstuk 3 beschrijft de berekening van het
γ-Fe[N] / γ'-Fe4N1-x fase-evenwicht met behulp van de CVM tetraëderbenadering. De
effectieve interacties, die hoofdzakelijk de vervorming van het rooster ten gevolge
van de mispassing van de stikstofatomen in de interstitiële octaëderholtes beschrijven,
worden weergegeven door een Lennard-Jones potentiaal. De berekeningen tonen
duidelijk aan dat KO optreedt in γ-Fe[N] en LO in γ'-Fe4N1-x. Voor het eerst is een
kwantitatieve analyse van berekende atoomverdelingen rechtstreeks vergeleken met
experimenteel verkregen atoomomringingen. De vergelijking laat zien dat er een
goede overeenkomst is tussen de CVM voorspellingen en de fracties ijzeratomen met
specifieke omringing door stikstof in γ-Fe[N].
Het γ'-Fe4N1-x / ε-Fe2N1-z fase-evenwicht wordt berekend in hoofdstuk 4,
waarbij de CVM prismabenadering wordt geïntroduceerd die de beschrijving van de
ordening van stikstofatomen op het interstitiële subrooster van ε-Fe2N1-z mogelijk
maakt. De interactie met het ijzersubrooster is wederom meegenomen door middel
van effectieve interactieparameters. Vervolgens worden twee γ' + ε ontmenggebieden
(dat wil zeggen: 4 fasegrenzen) beschreven met een enkele set paarinteractie-
parameters. De CVM berekeningen tonen onmiskenbaar aan dat zowel KO en LO in
ε-Fe2N1-z voorkomen. De LO in ε-Fe2N1-z bij stikstofgehaltes rond de 25 at.% komt

Samenvatting
155
overeen met het type ordening voor Fe3N (configuratie B) zoals waargenomen in
diffractie-experimenten. Opnieuw komen de omringingen van de ijzer atomen, zoals
voorspeld door de CVM berekeningen, goed overeen met experimentele data
verkregen via Mössbauerspectroscopie. De berekende waarden voor de
roosterparameters van ε-Fe2N1-z zijn slechts 1% kleiner dan de weinige beschikbare
experimentele data in het bestudeerde samenstellinggebied.
In hoofdstuk 5 wordt de CVM benadering zodanig uitgebreid dat de verdeling
van de atomen over zowel het substitutionele metaalsubrooster als het interstitiële
subrooster expliciet worden meegenomen in de beschrijving. Door beide subroosters
te integreren in het basiscluster van de CVM wordt het beschrijven van orde-wanorde
overgangen op het metaalsubrooster en de interstitiële subroosters mogelijk.
Berekening van de fase-evenwichten van hypothetische interstitiële legeringen en de
analyse van de berekende atoomverdelingen laten zien dat fase-overgangen op het
metaalsubrooster en het interstitiële subrooster van een fase zijn gekoppeld. Dit
fenomeen is experimenteel waargenomen voor bepaalde metaal-waterstof systemen,
maar werd tot voor kort nooit expliciet meegenomen in de thermodynamische
beschrijving van fasen met de CVM. Aangetoond wordt dat de aanwezigheid van een
tweede type metaalatoom op het metaalsubrooster KO teweeg kan brengen op zowel
het metaalsubrooster als het interstitiële subrooster. Daarnaast wordt voorkeur voor
groepering van metaalatomen met specifieke interstitiëlen waargenomen.
Tenslotte wordt het lage-temperatuurgebied (373-473 K) van het Fe-N
fasediagram experimenteel onderzocht, door homogene monsters met een
stikstofgehalte van 10 tot 26 at% te analyseren met röntgendiffractie. Voor het
prepareren van homogene ijzer-stikstoflegeringen is een nieuwe methode ontwikkeld,
waarbij een grote oppervlakte/volume verhouding (essentieel voor het produceren van
legeringen met een hoog stikstofgehalte) wordt bereikt door zeer poreuze monsters
van gesinterd zuiver ijzerpoeder te nitreren. Twee mogelijke interpretaties voor de
vorming van de α"-Fe16N2 fase worden geformuleerd: 1) de α" fase wordt gevormd
als voorloper voor α, niet alleen in het geval van het ontmengen van α' (martensiet),
maar ook bij transformatie van ε (<20 at.% stikstof) en γ', of 2) de α" fase vormt als
een evenwichtsfase bij temperaturen lager dan 440 K. Het ontmengproces lijkt te
worden bepaald door de langzame nucleatie van γ' en de trage diffusie van de stikstof
atomen, hetgeen resulteert in de vorming van intermediaire fasen.

156
De ideeën en methoden die in dit proefschrift zijn ontwikkeld maken het
mogelijk om interstitiële legeringen met specifieke eigenschappen en stabiliteit in een
gekozen temperatuur gebied te ontwerpen en te fabriceren. Momenteel wordt deze
benadering gebruikt voor het verbeteren van de efficiëntie en de levensduur van
membranen voor scheiding van waterstofgas.

157
LIST OF PUBLICATIONS
M.I. Pekelharing, A.J. Böttger, M.P. Steenvoorden, A.M. van der Kraan and E.J. Mittemeijer:
“Application of the cluster variation method to ordering in an interstitial solid solution: calculation of
the ε-Fe2N1-z / γ'-Fe4N1-x equilibrium”, Phil. Mag. A, 2003, vol. 83(15), pp. 1775-1796 – Chapter 4.
M.I. Pekelharing, A.J. Böttger, M.A.J. Somers and E.J. Mittemeijer: “Application of the cluster
variation method to ordering in an interstitial solid solution: the γ-Fe[N] / γ'-Fe4N1-x equilibrium”, Met.
Mat. Trans. A, 1999, vol. 30A, pp 1945-1953 – Chapter 3.
M.I. Pekelharing, A.J.Böttger, M.A.J. Somers, M.P. Steenvoorden, A.M. van der Kraan and E.J.
Mittemeijer: “Modeling thermodynamics of Fe-N phases: Characterization of ε-Fe2N1-z”, 5th
international conference on High Nitrogen Steels, 24th-28th May 1998, Material Science Forum, 1999,
vol. 318-320, p. 115-120 – Chapter 2.
M.I. Pekelharing, A.J. Böttger, S.S. Malinov, C.C. Tang, E.J. Mittemeijer, “Characterization of the
ordering of N atoms in ε-Fe2N1-z, analysis of superstructure-reflections using High Resolution Powder
Diffraction”, annual report 1998, SRS Daresbury Laboratory – Chapter 2.
M.I. Pekelharing and A.J. Böttger, “Application of the CVM Cube Approximation to FCC Interstitial
Alloys”, 2007, submitted for publication in Phys. Rev. – Chapter 5.
S. Malinov, A.J. Böttger, E.J. Mittemeijer, M.I. Pekelharing, M.A.J. Somers: “Phase Transformations
and Phase Equilibria in the Fe-N System at Temperatures below 573 K”, Met. Mat. Trans. A, 2001, vol.
32A(1), pp. 59-73 – Chapter 6.


159
DANKWOORD
Na enige omwegen is dan toch het moment gekomen om alle mensen te bedanken die
mij de mogelijkheid hebben geboden om mijn promotie onderzoek te verrichten.
Om te beginnen mijn promoter Barend Thijsse, voor zijn directe, enthousiaste
en menselijke werkwijze en het vertrouwen dat hij in mij gesteld heeft. Amarante
Böttger, mijn co-promotor, voor haar enorme flexibiliteit en inzet, haar kritische
benadering, hoge verwachtingen, en de zeer plezierige samenwerking. Eric
Mittemeijer, voor de goede onderzoeksfaciliteiten, het plaatsen van de juiste
kanttekeningen, en zijn beschikbaarheid en scherpe inzicht. Marcel Somers, voor zijn
gedrevenheid en betrokkenheid bij het onderzoek, het stellen van de juiste vragen, en
zijn bijdrage aan het verzette werk.
Daarnaast Nico Geerlofs voor de technische ondersteuning en de bereidheid
tot het verrichten van noodzakelijke aanpassingen aan de nitreerovens. Niek van der
Pers voor de assistentie bij en het verrichten van röntgendiffractie metingen. Adri van
der Kraan en Michel Steenvoorden van het Interfacultair Reactor Instituut voor de
Mössbauer metingen en de assistentie met het fitten en de interpretatie van de
verkregen spectra. C. Tang voor de assistentie bij de synchrotron metingen in
Daresbury. Diana Nanu voor het gebruik van de CVM kubus programmatuur.
Mijn kamergenoten Peter en Valentina: bedankt voor de afleiding, de steun, en
het nuttige en nodige commentaar. Daarnaast de andere promovendi, afstudeerders,
postdocs en stafleden in de vakgroep in de periode dat ik in Delft werkzaam was:
Camiel, Ton, Rinze, Regina, Jan-Dirk, Ludmila, Roland, Lars, Savko, Slobodan,
Jouk, Rob Delhez, Mijnheer van Lent, Jan Helmig, Ton de Graaf, Wim Sloof, Kees
Borsboom, Staf de Keijser, Anke Kerklaan-Koene, en een ieder die ik over het hoofd
heb gezien. Bedankt voor de aangename sfeer en de prettige samenwerking.
Johan, Jan en Sandra voor hun grenzeloze gastvrijheid bij gebrek aan
onderdak in Nederland en praktische en morele steun. Daniela Nicastro for her love
for research and refusal to give up. Scott Brown for network use and child care.
Tenslotte wil ik Govert en Adam bedanken: onderaan de lijst, maar jullie bijdrage aan
het proces is zeker niet de minste geweest.

160
CURRICULUM VITAE
7 augustus 1971 geboren te Zevenaar
1983 – 1988 VWO, Florens Radewijn College te Raalte
1988 – 1989 VWO, Geert Groote College te Deventer
1989 – 1990 Propaedeuse Scheikunde, Universiteit Utrecht
1990 – 1995 Doctoraal Geochemie, Universiteit Utrecht
1995 – 1999 Onderzoeker in Opleiding (FOM)
Sectie Fysische Chemie van de Vaste Stof, Laboratorium voor
Materiaalkunde, Technische Universiteit Delft
2007 – Group Structure & Change, Department of Materials Science &
Engineering, Delft University of Technology
1999 – 2001 Junior beleidsmedewerker NWO, Den Haag
2003 – Learning Center staff, Front Range Community College,
Longmont, Colorado (USA)
2007 – Nursing staff & MDS coordinator, Longmont United Hospital,
Longmont, Colorado (USA)