Embed Size (px)
Citation preview

A. De Vries and J. K. Reneau
production systemsApplication of statistical process control charts to monitor changes in animal
doi: 10.2527/jas.2009-2622 originally published online Jan 15, 2010; 2010.88:E11-E24. J Anim Sci
http://jas.fass.org/cgi/content/full/88/13_electronic_suppl/E11the World Wide Web at:
The online version of this article, along with updated information and services, is located on
www.asas.org
by on May 10, 2011. jas.fass.orgDownloaded from

ABSTRACT: Statistical process control (SPC) is a method of monitoring, controlling, and improving a process through statistical analysis. An important SPC tool is the control chart, which can be used to detect changes in production processes, including animal pro-duction systems, with a statistical level of confidence. This paper introduces the philosophy and types of con-trol charts, design and performance issues, and pro-vides a review of control chart applications in animal production systems found in the literature from 1977 to 2009. Primarily Shewhart and cumulative sum control charts have been described in animal production sys-tems, with examples found in poultry, swine, dairy, and beef production systems. Examples include monitoring of growth, disease incidence, water intake, milk produc-
tion, and reproductive performance. Most applications describe charting outcome variables, but more examples of control charts applied to input variables are needed, such as compliance to protocols, feeding practice, diet composition, and environmental factors. Common chal-lenges for applications in animal production systems are the identification of the best statistical model for the common cause variability, grouping of data, selec-tion of type of control chart, the cost of false alarms and lack of signals, and difficulty identifying the special causes when a change is signaled. Nevertheless, care-fully constructed control charts are powerful methods to monitor animal production systems. Control charts might also supplement randomized controlled trials.
Key words: control chart, monitoring, production system, statistical process control
©2010 American Society of Animal Science. All rights reserved. J. Anim. Sci. 2010. 88(E. Suppl.):E11–E24 doi:10.2527/jas.2009-2622
INTRODUCTION
Performance of animal production systems may be measured as the efficiency in which capital, labor, energy, and raw materials are converted into animal products with desirable characteristics. Profitability and environmental impact are also components of the performance of the animal production system. Timely signaling of unplanned changes in performance is con-sidered important to keep results within a predefined acceptable range and reduce economic loss (Huirne, 1990; Spahr, 1993). In addition, there is typically a need to quickly determine if planned interventions are
having the desired beneficial effects in the absence of a valid control.
Although there is general agreement on the need to monitor performance, it is not known how to do it ef-fectively (Dohoo, 1993). The analysis is complicated by the existence of natural variation. People often interpret variation in observations incorrectly without the help of proper aids (Hogarth, 1987). For example, people tend to underestimate the extent to which deviations from an expected value can be the result of a random pro-cess. Deming (1986), the leading management thinker in the field of quality after 1945, concluded that “The central problem in management and leadership ... is failure to understand the information in variation.”
Statistical process control (SPC) is a framework of ideas (Wheeler and Chambers, 1992) and a collection of problem-solving tools useful in achieving process stabil-ity through the reduction of variability (Quesenberry, 1997; Mitra, 1998; Montgomery, 2009). One aspect of the SPC approach is to assist in the continuous im-provement of performance by further reduction of un-explained variability. Another aspect of SPC is that planned and unplanned changes may be signaled as quickly as possible considering the natural process vari-
Application of statistical process control charts to monitor changes in animal production systems1
A. De Vries*2 and J. K. Reneau†
*Department of Animal Sciences, University of Florida, Gainesville 32611; and †Department of Animal Science, University of Minnesota, St. Paul 55108
1 Based on a presentation at the Beef Symposium titled “Popula-tion data analyses to evaluate trends in animal production systems” at the Joint Annual Meeting, July 12 to 16, 2009, Montreal, Canada. Manuscript publication sponsored by the Journal of Animal Science and the American Society of Animal Science. We thank the anon-ymous reviewers for their comments and suggestions, which have helped to improve this paper.
2 Corresponding author: [email protected] October 31, 2009.Accepted January 11, 2010.
E11
by on May 10, 2011. jas.fass.orgDownloaded from

ability. Statistical process control started in the manu-facturing industries in the 1920s, but there are now abundant applications in health care and epidemiology (Woodall, 2006; Thor et al., 2007).
The control chart is one of the major SPC tools. A control chart is a statistical tool applied to observations plotted over time to see whether a process is running as it should. Control charts have not been widely applied in animal production systems, but their use in animal agriculture has been advocated since the 1970s (Wrath-all, 1977; Sard, 1979).
This paper aims to provide an introduction to many aspects of control charts and a survey of published ex-amples of control charts in animal production systems. The paper further identifies opportunities and limita-tions for more widely adoption of control charts in ani-mal production systems.
SPC CHARTS
Sources of Variation
Walter A. Shewhart first pioneered statistical meth-ods for quality improvement (Olmstead, 1967). She-whart described process variability in terms of assign-able-cause and chance-cause variation (Montgomery, 2009). Chance causes, or common causes, are the many small, essentially unavoidable causes that are inherent to the production process. Assignable causes, or special causes, are identifiable causes and result in extra varia-tion or a shift in the production process output. A pro-cess that is operating with only chance causes is said to be in statistical control. Such processes display con-trolled variation, and process output can be predicted within limits. Assignable causes indicate an unplanned or planned change. A process that is operating in the
presence of assignable causes is said to be out of con-trol. The process output displays uncontrolled variation when assignable causes temporarily exist. Shewhart re-alized that unplanned assignable causes had to be re-moved first before the process could be fundamentally improved. Shewhart gave a series of lectures on SPC at the USDA in 1938 (Shewhart, 1939), but his ideas on quality control were not applied in animal agriculture.
Control Chart Philosophy
Monitoring for Unplanned Assignable Causes. Control charts help to quickly detect occur-rences of unplanned assignable causes so corrective action may be undertaken and the assignable causes removed. To distinguish between chance causes and as-signable causes, Shewhart developed the first control chart in 1924 at Western Electric Company in Chicago, Illinois (Olmstead, 1967). Control charts combine time-series analysis methods with graphical presentation of data.
A generic control chart is shown in Figure 1. Observa-tions of process performance are displayed over time so that the order in which they are generated is preserved. Control charts have a center line and typically upper and lower control limits that are above and below the center line, respectively. The center line represents the central tendency of the process observations. An ob-servation that plots outside the control limits is inter-preted as evidence that the process is out of control, an assignable cause is present, and therefore interference is warranted.
A central tenet of SPC is that a process that shows expected variability should be left alone until it is fundamentally improved. Interference to look for as-signable causes may be costly and should only occur
Figure 1. Generic Shewhart control chart with observations of process performance plotted over time, with upper control limit, center line, and lower control limit. The chart signals observation 24 because it is outside the control limits. The mean of the process changed starting between observation 10 and 11. The run length is, therefore, 24 − 10 = 14 observations.
De Vries and ReneauE12
by on May 10, 2011. jas.fass.orgDownloaded from
when there is enough evidence. It is still possible that observations outside the control limits were caused by chance causes only (i.e., a type I decision error, or false alarm), or that the presence of assignable causes does not immediately result in an observation outside the control limits (i.e., a type II decision error). Placement of the control limits seeks to reduce the costs associated with type I and type II errors.
Control charts for monitoring unplanned changes were first applied in the manufacturing industries, but applications spread to the service, financial, and health care sectors, as well as to agriculture (Quesenberry, 1997; Montgomery, 2009).
Monitoring Planned Interventions. More re-cently, control charts have been proposed to monitor planned interventions, especially in health care (So-lodky et al., 1998; Diaz and Neuhauser, 2005). These authors argued that control charts are preferred over randomized controlled trials when the immediate ben-efits and the results of the planned intervention are large. In cases when prior experience is valuable, control charts have greater statistical power to exclude chance as an explanation for the change than a randomized controlled trial. However, in cases where causal infer-ence is important, such as in scientific research, ran-
domized controlled trials cannot be replaced by control charts. With control charts, there is no real or virtual control that one can use to determine causality. Thus, conclusions drawn from the use of control charts alone intended to discover causality should generally be un-acceptable for publication in a scientific journal. Thor et al. (2007) reviewed the literature on the application of SPC in healthcare improvement and concluded that control charts had value, but their power depended on correct and smart application.
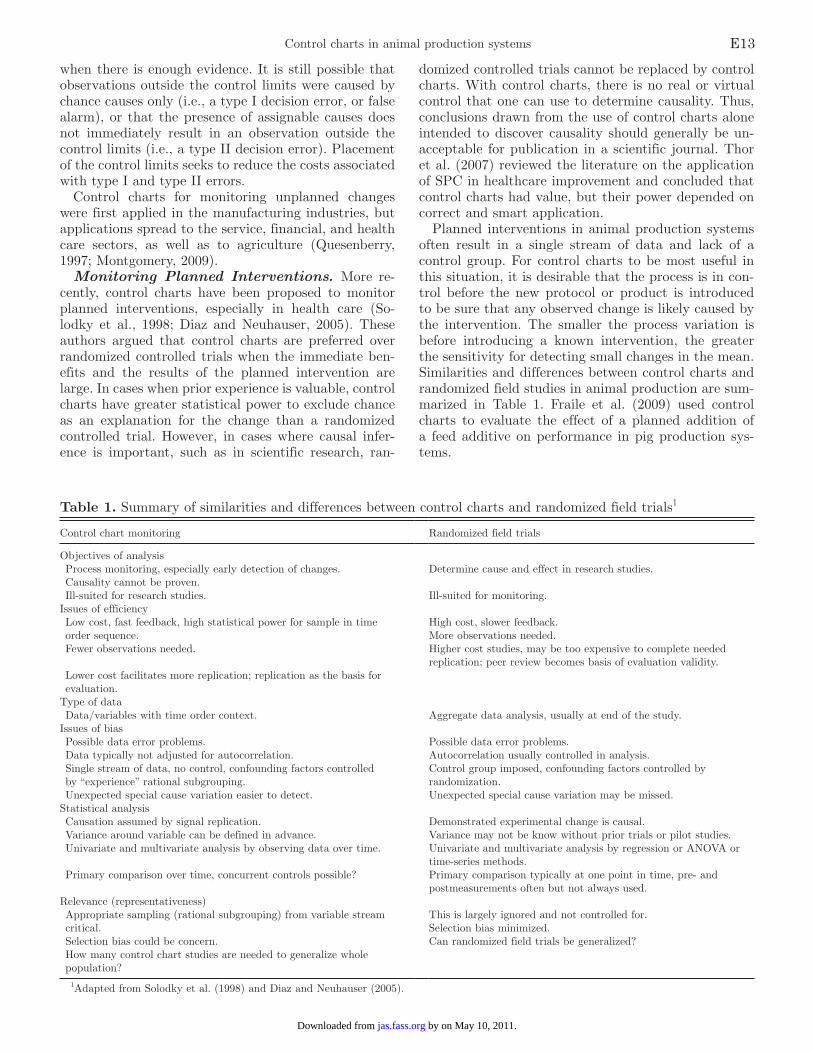
Planned interventions in animal production systems often result in a single stream of data and lack of a control group. For control charts to be most useful in this situation, it is desirable that the process is in con-trol before the new protocol or product is introduced to be sure that any observed change is likely caused by the intervention. The smaller the process variation is before introducing a known intervention, the greater the sensitivity for detecting small changes in the mean. Similarities and differences between control charts and randomized field studies in animal production are sum-marized in Table 1. Fraile et al. (2009) used control charts to evaluate the effect of a planned addition of a feed additive on performance in pig production sys-tems.
Table 1. Summary of similarities and differences between control charts and randomized field trials1
Control chart monitoring Randomized field trials
Objectives of analysis Process monitoring, especially early detection of changes. Determine cause and effect in research studies. Causality cannot be proven. Ill-suited for research studies. Ill-suited for monitoring.Issues of efficiency Low cost, fast feedback, high statistical power for sample in time order sequence.
High cost, slower feedback.More observations needed.
Fewer observations needed. Higher cost studies, may be too expensive to complete needed replication; peer review becomes basis of evaluation validity.
Lower cost facilitates more replication; replication as the basis for evaluation.Type of data Data/variables with time order context. Aggregate data analysis, usually at end of the study.Issues of bias Possible data error problems. Possible data error problems. Data typically not adjusted for autocorrelation. Autocorrelation usually controlled in analysis. Single stream of data, no control, confounding factors controlled by “experience” rational subgrouping.
Control group imposed, confounding factors controlled by randomization.
Unexpected special cause variation easier to detect. Unexpected special cause variation may be missed.Statistical analysis Causation assumed by signal replication. Demonstrated experimental change is causal. Variance around variable can be defined in advance. Variance may not be know without prior trials or pilot studies. Univariate and multivariate analysis by observing data over time. Univariate and multivariate analysis by regression or ANOVA or
time-series methods. Primary comparison over time, concurrent controls possible? Primary comparison typically at one point in time, pre- and
postmeasurements often but not always used.Relevance (representativeness) Appropriate sampling (rational subgrouping) from variable stream critical.
This is largely ignored and not controlled for.Selection bias minimized.
Selection bias could be concern. Can randomized field trials be generalized? How many control chart studies are needed to generalize whole population?
1Adapted from Solodky et al. (1998) and Diaz and Neuhauser (2005).
Control charts in animal production systems E13
by on May 10, 2011. jas.fass.orgDownloaded from
Implementing changes in estrus detection efficiency, De Vries and Conlin (2005) showed how stochastic simulation of a complex dairy production system could provide insight in the statistical performance of vari-ous control chart designs under practical conditions. The observed average time between false alarms using some conventional control chart designs was much less than expected. In addition, their approach allows for a quantitative comparison of alternative variables to de-tect an implemented change as quickly as possible. For example, control charts for the variable estrus detection index signaled a decrease in estrus detection efficiency much faster than control charts for days to first insemi-nation under the same rate of false alarms.
Types of Control Charts
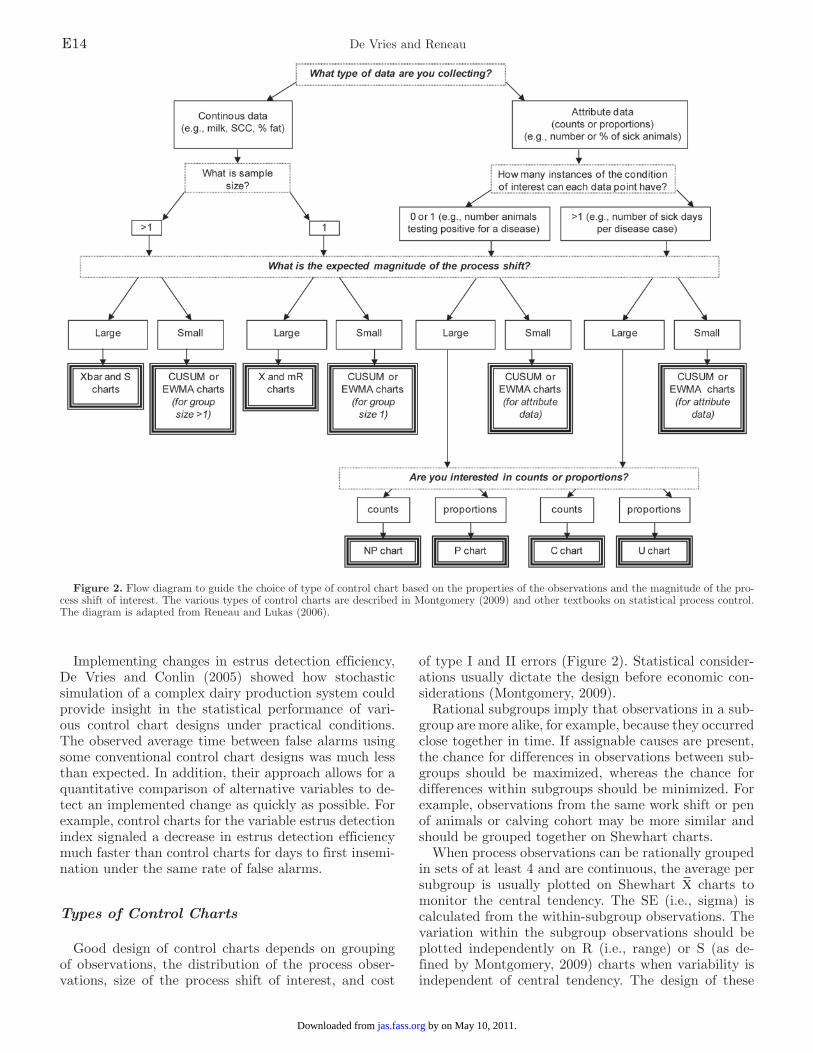
Good design of control charts depends on grouping of observations, the distribution of the process obser-vations, size of the process shift of interest, and cost
of type I and II errors (Figure 2). Statistical consider-ations usually dictate the design before economic con-siderations (Montgomery, 2009).
Rational subgroups imply that observations in a sub-group are more alike, for example, because they occurred close together in time. If assignable causes are present, the chance for differences in observations between sub-groups should be maximized, whereas the chance for differences within subgroups should be minimized. For example, observations from the same work shift or pen of animals or calving cohort may be more similar and should be grouped together on Shewhart charts.
When process observations can be rationally grouped in sets of at least 4 and are continuous, the average per subgroup is usually plotted on Shewhart X charts to monitor the central tendency. The SE (i.e., sigma) is calculated from the within-subgroup observations. The variation within the subgroup observations should be plotted independently on R (i.e., range) or S (as de-fined by Montgomery, 2009) charts when variability is independent of central tendency. The design of these
Figure 2. Flow diagram to guide the choice of type of control chart based on the properties of the observations and the magnitude of the pro-cess shift of interest. The various types of control charts are described in Montgomery (2009) and other textbooks on statistical process control. The diagram is adapted from Reneau and Lukas (2006).
De Vries and ReneauE14
by on May 10, 2011. jas.fass.orgDownloaded from

Shewhart charts is based on the central limit theorem. If the plotted observations are normally distributed and the process is in control, the probability of an observa-tion outside control limits set at, for example, 3 SE from the mean (i.e., 3-sigma) of the X chart, which is 0.0027. Thus, the frequency of a false alarm is 1 in 370 observations. The X chart is robust to the normality assumption and can be employed unless the observa-tions are extremely non-normal. The sampling distribu-tions of the R and S charts are not symmetric. An al-ternative design strategy is to determine the best statistical sampling distribution and calculate probabil-ity control limits such that the probability of a false alarm is, for example, 0.001 for each control limit.
The Shewhart X (i.e., individuals) and mR (i.e., moving range) charts are appropriate for continuous variables when rational subgrouping does not apply and all observations should be monitored sequentially. In general, the frequency of false alarms of the combined application of the X and standard mR charts may be much greater than 1 in 370; therefore, probability con-trol limits are recommended for the mR chart. Marked departure from normality can have a large effect on the frequency of false alarms.
Other traditional Shewhart control charts are the P (as defined by Montgomery, 2009) and NP charts for observations that follow a binomial distribution, and the C and U (as defined by Montgomery, 2009) chart for observations that follow a Poisson distribution. Because the variance and the mean are based on the same variable, only one chart is needed. Although the sampling distributions are not symmetric, these con-trol charts are typically designed with 3-sigma control limits. The performance of these control charts may be quite different from expected, for example, when the observations are overdispersed. Other distributions, such as the negative binomial or β-binomial, could be used to calculate control limits with better false alarm properties. Control charts for attribute (i.e., count) data are less powerful than those for continuous data. Examples of Shewhart control charts applied in animal production systems are described, for example, by Sard (1979), Cowen et al. (1994), Lukas et al. (2005), and Fraile et al. (2009).
The basic Shewhart charts only use the information from the process contained in the last plotted point and ignore any information given by the sequence of events. This feature makes these charts less sensitive to small shifts in the process. Furthermore, some as-signable causes result in patterns in the observations without a single observation outside the control lim-its. At least 10 sensitizing rules (i.e., supplementary run rules) have been proposed that help detect small shifts and nonrandom patterns (Montgomery, 2009). The well-known 4 Western Electric rules are 1) 1 or more observations outside of the control limits; 2) 2 of 3 consecutive observations outside the 2-sigma limits but still inside the control limits; 3) 4 of 5 consecutive observations beyond the 1-sigma limits, and 4) a run
of 8 consecutive observations on one side of the center lane. Although these sensitizing rules improve the abil-ity to detect smaller shift, the frequency of false alarms can be quite greater. For example, Champ and Woodall (1987) showed that adding the 4 Western Electric rules to the Shewhart chart for a normal distribution result-ed in a false alarm frequency of 1 in 91.25 observations instead of 1 in 370.
The cumulative sum (CUSUM) control chart incor-porates past observations and is therefore sensitive to detecting small shifts in the process. It is also a good candidate for individual observations that would be plotted on Shewhart X and mR charts. The CUSUM charts have been developed for distributions such as the normal, binomial, Poisson, and Weibull. They can also estimate the time when the processes went out of con-trol. A Shewhart chart is a special case of the CUSUM chart designed to detect a shift in the mean of 6 SE (Hawkins and Olwell, 1998). Exponentially moving weighted average (EWMA) control charts are an al-ternative to CUSUM charts with similar performance. The EWMA chart gives less and less weight to observa-tions as they are further removed in time. The perfor-mance of CUSUM and EWMA charts is less sensitive to rational subgrouping than Shewhart X charts (Hawk-ins and Olwell, 1998; Reynolds and Stoumbos, 2000). Proper SPC requires the use of both types of control: the CUSUM for persistent changes and Shewhart charts for transient problems (Hawkins and Olwell, 1998). Ex-amples of CUSUM charts applied in animal production systems were described by Quimby et al. (2001), Cor-nou et al. (2008), Mertens et al. (2008), and Pastell and Madsen (2008).
Knowledge of the false alarm rates of the Shewhart, CUSUM, and EWMA control charts require in-control values of the process parameters, which in practice are rarely known accurately. As an alternative, the use of changepoint methods in SPC has been proposed (Hawkins et al., 2003). A changepoint is a point in a time series at which some change occurs. Changepoint methods are based on the generalized likelihood ratio test. These methods do not require in-control values of the process parameters and are not set up to detect a shift of a certain magnitude. Their performance is never much worse than the optimal CUSUM chart and bet-ter when the CUSUM chart is not optimally designed. These methods are, therefore, more robust and may be preferred over CUSUM charts in practice.
Nonparametric control charts have been proposed that overcome the possible problem of an unknown rate of false alarms when the distribution of observations (when in-control) does not follow a classical distribu-tion (Amin et al., 1995). Although their false alarm rates are more accurately known, their performance to detect true shifts in the process output is compromised. De Vries and Conlin (2005) gave some examples of non-parametric charts in dairy herds and showed how their performance was worse than those of comparable para-metric charts.
Control charts in animal production systems E15
by on May 10, 2011. jas.fass.orgDownloaded from

Multivariate control charts such as the Hotelling T2 control chart may be useful to monitor multiple related variables collectively where independent monitoring of each variable on their own control charts would increase the collective false alarm rate greatly. For example, the false alarm rate of simultaneously applying 4 Shewhart X charts with 3-sigma control limits, assuming normal-ly distributed observations, would be 1 − (1 − 0.0027)4 = 0.0108 or 1 in 93 observations (Montgomery, 2009).
It is generally recommended that Shewhart control limits be based on at least 25 observations (Wheeler and Chambers, 1992). For CUSUM charts, a larger number of observations is recommended (Hawkins and Olwell, 1998). A self-starting approach, however, considers the uncertainty in the values of the process parameters and removes the estimation issue completely (Quesenberry, 1997; Hawkins and Olwell, 1998). In this approach, the parameter estimates get updated as more data are col-lected. Lukas et al. (2008a) illustrated the self-starting CUSUM chart for DMI after calving in dairy cows.
Performance of Control Charts
Statistical Performance. The standard measure of statistical performance of control charts is the aver-age run length (ARL), which is the average number of observations until a signal. The ARL should be large when the process is in control (ARL0), but small when the process is out of control (ARL1). The ARL0 is the inverse of the probability of a false alarm. The ARL1 depends on the magnitude of the shift. In some cases it may be more appropriate to measure the average time to a signal (ATS). In this context, sensitivity and power is the ability to quickly signal a true shift (i.e., ATS1), and specificity is the ability to not signal when the process is in control (i.e., ATS0). Sensitivity and specificity can be calculated when a limited amount of time or observations are considered before the sig-nal (or lack thereof) is judged to be a correct signal, false alarm, correct lack of a signal, or false positive. All control charts with feasible control limits eventually generate signals.
The theoretical run length distribution of control chart designs is typically obtained analytically or by simulation, but seldom using data from practice. The standard is to use an immediate and permanent change (i.e., step shift) to obtain the run length distribution after a change. De Vries and Conlin (2003a,b) used a stochastic dynamic simulation model of a dairy herd to obtain the ATS0 and ATS1-distribution of control chart designs to detect step shifts in estrus detection efficiency.
It is only fair to compare the ARL1-distribution of control charts when their rate of false alarms (i.e., 1/ARL0) is similar. Figure 3 shows the ARL for Shewhart X and CUSUM control charts for normal distributions with shifts in the mean (Champ and Woodall, 1987). When the shift is 0, the ARL represents the ARL0;
otherwise, ARL1 are represented. The CUSUM with 4.78-sigma control limits results in an ARL0 of 374, comparable with the ARL0 of 370 for the standard She-whart X control chart. The ARL0 decreases to 91.75 when the Shewhart X chart with 3-sigma limits is sup-plemented with the Western Electric rules. A similar ARL0 is obtained with a CUSUM with 3.42-sigma con-trol limits or a standard Shewhart X control chart with 2.54-sigma control limits. Small shifts in the mean are on average detected more quickly with a CUSUM than a Shewhart chart. For example, a shift of 1 SD in the mean is, on average, not signaled until 44 observations later with a standard Shewhart X control chart. From Figure 3, it is clear that the addition of supplementary run rules on the Shewhart chart results in greater sen-sitivity (i.e., smaller ARL1), but also more false alarms (i.e., smaller ARL0). Walker et al. (1991) explored this issue further.
Supplementary runs tests add power to the Shewhart chart to detect small changes. For the same frequency of false alarms; however, the CUSUM charts are slight-ly more effective in detecting small step shifts in the mean than Shewhart X charts supplemented with the Western Electric rules. Hawkins and Olwell (1998) therefore recommend the use of the CUSUM chart.
In practice, the real distribution of the observations on the control chart is often not known. The effect of nonnormality is the greatest when the CUSUM is tuned to detect large shifts. This implies that Shewhart X charts with wide (e.g., 3-sigma) control limits are espe-cially sensitive to deviations from normality (Hawkins and Olwell, 1998). Observations may also display au-tocorrelation, with CUSUM and EWMA charts being more sensitive to autocorrelation than Shewhart charts. In addition, Shewhart, CUSUM, and EWMA charts are usually designed with estimated parameters based on a limited, possibly out-of-control, set of data. When esti-mated parameters are used, the ARL0 of a chart is im-possible to control (Hawkins et al., 2003) unless a self-starting approach or changepoint formulation is used. Shewhart charts are less sensitive than CUSUM charts to errors in the parameter estimates (Hawkins and Ol-well, 1998). Using a stochastic simulation model of a dairy herd, De Vries and Conlin (2005) showed that the observed ATS0 of some common control chart designs could be quite different from the designed ATS0 when monitoring variables of dairy reproduction. Concerning CUSUM chart designs, nonoptimally designed charts have greater ARL1 given the same actual step shift. The actual change is in practice seldom known when the CUSUM chart is set up.
The change may be a gradual drift rather than a step change. Davis and Woodall (1988) showed ALR1 for Shewhart charts with and without supplementary runs rules under linear drift. Davis and Woodall (1988) found the additional trend rule (i.e., 5 or 6 successive observations either increasing or decreasing) of little value if the 4 Western Electric rules were already used.
De Vries and ReneauE16
by on May 10, 2011. jas.fass.orgDownloaded from

Gan (1992) reported ARL1 for CUSUM charts under linear drift. The relative power of these charts is com-parable with the step change results in Figure 3; that is, the CUSUM charts are slightly more sensitive to signal linear drift than the Shewhart charts with the 4 West-ern Electric rules. Other out-of-control patterns may exist that would result in earlier out-of-control signals by supplementary run rules on the Shewhart chart.
The importance of statistical properties of control charts is debated among professionals working in qual-ity control (Woodall, 2000). Some authors believe that many of the statistical considerations are less relevant in practice and point to Shewhart charts as being simple, robust, and effective (Wheeler and Chambers, 1992). Others believe that advances in automatic data pro-cessing make other types of control charts more practi-cal (Stoumbos et al., 2000).
Practical Performance. Practical performance is the value of the use of control charts for detection of planned and unplanned changes in practice. Practical performance should be the final criterion, but quantita-tive performance results are scarce. For example, many papers on SPC applications in health care describe how control charts were applied in case studies, but few tested the utility of the application (Thor et al., 2007). Some exceptions exist. Madsen and Kristensen (2005) showed how their CUSUM applied to water in-take of young pigs on average signaled sick pigs 1 d before clinical signs. Treatment could then start earlier so that economic losses would be minimized. Quimby et al. (2001) used a CUSUM to monitor how much time beef calves spent at the feedbunk and reported detection of sick calves on average 4.1 d earlier than by pen riders. False alarm rates were not reported in these studies, but Quimby et al. (2001) reported sensitivity and specificity.
Design Considerations and Diagnosis
Placing of Control Limits. The placing of the control limits on a control chart depends on the cost of false alarms (i.e., type I errors) and the cost after a true change occurs that is not detected (i.e., type II errors). The cost of the diagnosis affects both. Lost production may be another cost. In most production processes, the cost of diagnosis and lost production are generally not known. Shewhart (1931) wrote that “ex-perience indicates that t = 3 seems to be an acceptable economic value” and, therefore, placed control limits at 3-sigma units from the mean. Three sigma control limits have since then been the standard for Shewhart control charts in the United States. Shewhart’s rule to set control limits at 3-sigma units from the mean is said to be robust for observations from most kinds of distributions (Wheeler and Chambers, 1992) in terms of acceptable rates of false alarms but could result in poor performance when unplanned changes are costly and need to be detected quickly.
Nevertheless, the optimal placing of control limits and the optimal frequency of collecting observations has triggered much research (Montgomery, 2009). Sta-tistical considerations, such as the ARL, should also be considered in these economic designs (Saniga, 1989). Economic designs of control charts in livestock pro-duction are rare, but St-Pierre and Cobanov (2007a,b) showed economic designs for the optimal forage sam-pling schedule on dairy farms. Their optimal control limits were identified at 1.1-sigma under a wide range of simulated operating conditions, which indicated that false alarms were much less costly than false positives when rebalancing the diet was needed. Similarly, Ho-geveen and Ouweltjes (2003) present a table of the relative importance of sensitivity and specificity for
Figure 3. Average run lengths for Shewhart X and cumulative sum control charts for normal distributions with shifts in the mean. All charts signal when an observation falls outside the control limits. A shift of 0 represents the in-control average run length. A = Shewhart X chart with 3-sigma control limits; B = cumulative sum control chart with 4.78-sigma control limits; C = Shewhart X chart with 2.54-sigma control limits; D = Shewhart X chart with 3-sigma control limits and 4 Western Electric rules; E = cumulative sum control chart with 3.42-sigma control limits.
Control charts in animal production systems E17
by on May 10, 2011. jas.fass.orgDownloaded from

separation of abnormal milk, detection of mastitis, and diseased cows in milking systems. These considerations should affect the placement of control limits.
Probability control limits for the Shewhart charts are typically easy to calculate. Finding the control limits for the CUSUM and EWMA given a desired rate of false alarms requires special software or tables. Hawkins and Olwell (1998) present algorithms for control limits on CUSUM charts. Crowder (1989) shows constants for EWMA chart design.
It is incorrect to use targets or benchmarks for pa-rameters to establish the center line and control limits (Deming, 1986). When a signal is obtained on a chart designed with data that are independent of the pro-cess observations, it is not possible to know whether the signal is caused by an out-of-control process or by an incorrect parameter value to compute control limits (Quesenberry, 1997).
Diagnosis and Preadjustment. A signal on a control chart invokes diagnosis, which is the act of finding an assignable or root cause for the observed out-of-control behavior (Dooley et al., 1997). Diagnosis (i.e., troubleshooting) is often relatively unstructured in many companies (Dooley et al., 1997). Identifica-tion of one or a few assignable causes may be difficult, if not impossible. Users of control charts are likely to abandon them if they cannot easily find and correct an assignable cause (Rasmussen, 1993; Caulcutt, 1995). Therefore, false alarms should be kept to a minimum. In other cases, there are many plausible assignable causes that may have triggered the signal, but the real assignable cause may be hard to find.
In the simplest case, the control chart mean is the historical average of the process characteristics. In some cases, systematic nonrandom patterns in the observa-tions exist that are part of the in-control process. For example, seasonal or daily fluctuations may have an effect on reproductive outcomes or feed intake. A solu-tion is to fit a time-series model to past observations and monitor the residuals (i.e., actual minus predicted) on control charts (Alwan and Roberts, 1988). For ex-ample, Lukas et al. (2008a) used a time-series model to predict daily DMI of dairy cows. Madsen and Kris-tensen (2005) used a diurnal dynamic linear model of water consumption of pigs. Both papers used CUSUM control charts to monitor unplanned changes.
The underlying predictive model can be expanded with other variables that are known to affect the pro-cess characteristic, such as the age of the animals. For example, Mertens et al. (2008) used a mathematical model of egg weight by age to predict egg weight and then monitored the daily residual (i.e., actual minus predicted egg weights) on a CUSUM control chart. Woodall (2006) reviewed some risk-adjusted control charts where the expected probability of death could vary from person to person according to an assumed lo-gistic model. The purpose of these models is to remove known causes of variation so that the list of plausible assignable causes is decreased when signals occur. Such
adjustments are quite similar to the regression adjust-ment of variables charts as discussed, for example, by Hawkins (1993) and Wade and Woodall (1993). Dooley et al. (1997) proposed an algorithm to be used with a predictive model to search for the most likely assign-able cause.
Choice of Process Characteristics
An important consideration for any practical ap-plication is the selection of which process characteris-tics (i.e., variables) to monitor. Process characteristics should be associated with the goals of the livestock pro-ducer, such as improved quality or profit. In general, the earlier in the process sequence control can be es-tablished, the better (Montgomery, 2009). In practice, this suggests monitoring of inputs such as compliance of operating protocols, animal comfort and behavior, feed quality and intake, and environmental factors. For example, Wrathall and Hebert (1982) discussed how monitoring irregular returns to estrus in sow herds was related more closely in time to the occurrence of virus-induced embryonic deaths than to total liter size. They presented a table that relates trends in monitoring vari-ables with root causes for reproductive failure in sows. Milking parlors also provide basic inputs that can be monitored with control charts (Wallace, 2009).
CONTROL CHART APPLICATIONS IN ANIMAL PRODUCTION SYSTEMS
Much literature exists on how to detect changes in animal production systems without direct reference to control charts. Many different techniques have been used, for example, changepoint analysis to detect chang-es in disease incidence rates in pigs (Christensen and Rudemo, 1996). Kalman filters have been used to de-tect changes in poultry production (Roush et al., 1992), bulk tank somatic cell counts in milk (Thysen, 1993), estrus and diseases in dairy cattle (De Mol et al., 1999), or milk production (Van Bebber et al., 1999). Neural networks have been used to detect mastitis (Nielen et al., 1995; Cavero et al., 2008). Deviations from moving averages of feeding behavior were used as indicators of health disorders (González et al., 2008). Fuzzy logic was used to detect mastitis and estrus (De Mol and Woldt, 2001).
Animal performance in many of these applications is based on automatic sensors that measure milk charac-teristics (e.g., yield, temperature, electrical conductivi-ty), behavior, BW, body temperature, odor, or acoustics (Frost et al., 1997; De Mol and Woldt, 2001; Hogeveen and Ouweltjes, 2003). The principle is to monitor de-viations from expected performance, often based on the recent performance data of the animal. In these papers, changes are signaled when a process characteristic was greater than a threshold, an idea similar to a signal on a control chart.
De Vries and ReneauE18
by on May 10, 2011. jas.fass.orgDownloaded from

Table 2. Published examples of uses of statistical process control charts (SPC) in animal production systems (1977–2009)
Unit of measure Variables plotted
Type of chart(s)
Performance evaluation
Benefits of control charts (perceived, observed, measured)
Data preadjustment? Reference
Beef Batch of steers Mean daily
BW gain X1 No “The simple statistical control
chart … could perhaps find wider use in animal production.”
None Sard (1979)
Groups of steers Muscle pH n-CUSUM2 No “The CUSUM control chart is a useful tool to assist a farmer in monitoring any aspect of the farm operation, which is quantitative.”
None Pleasants et al. (1998)
Calf Feeding time n-CUSUM ATS,3 sensitivity, specificity
“The CUSUM procedure detected animal morbidity … 4.1 days earlier … than experienced feedlot personnel.”
Quimby et al. (2001)
Dairy Herd Estrous
detection ratioP,4 X,5 n-CUSUM, p-CUSUM6
ATS0,7 ATS18 (simulation study)
“Control charts detected changes … soon enough to be potentially useful in dairy management.”
None De Vries and Conlin (2003a)
Herd Estrous detection ratio
X and n-CUSUM
ATS0, ATS1, total cost (simulation study)
“Earlier detection (of large decreases) compensated for the higher losses in net return per day. Thus larger decreases were not more costly than smaller decreases.”
De Vries and Conlin (2003b)
Herd Days to first service, estrous detection index
Numerous parametric and nonparametric charts
ATS0, ATS1 (simulation study)
“Control charts for estrus detection index signaled decreases in estrus detection efficiency earlier than control charts for days to first service”
None De Vries and Conlin (2005)
Herd Daily bulk tank somatic cell count
X No “Monitoring individual bulk tank somatic cell counts will help identify true changes … on a daily basis.”
None Lukas et al. (2005)
Herd Forage quality X ARL0,9 ARL1,10 total cost (simulation study)
“Gradual changes in the process are readily detected by the optimum X chart.”
None St-Pierre and Cobanov (2007a,b)
Herd Bulk tank somatic cell count
X No “The consistency index in combination with the control chart … offers a proactive approach to maintaining consistently high milk quality.”
None Lukas et al. (2008b)
Cow DMI, water intake
X, self-starting n-CUSUM
Time between signal and diagnosis
“The proposed CUSUM-Shewhart … monitoring scheme successfully detected emerging disease.”
Time-series model
Lukas et al. (2008a)
Cow Individual leg weight
n-CUSUM Sensitivity, specificity
“The method enables objective monitoring of the changes in leg health”
First order exponential smoothing
Pastell and Madsen (2008)
Cow Daily milk weights, electro-conductivity
X, self-starting n-CUSUM
Sensitivity, specificity
“Charts are effect in early detection of disease onset”
Time-series model
Lukas et al. (2009)
Herd, cow Parlor data (milk production, flow rate, milking duration)
X (probability limits)
No “Although the milking process is a unique biological system and has more variability, SPC can be applied.”
None Wallace (2009)
Continued
Control charts in animal production systems E19
by on May 10, 2011. jas.fass.orgDownloaded from

Continued
Unit of measure Variables plotted
Type of chart(s)
Performance evaluation
Benefits of control charts (perceived, observed, measured)
Data preadjustment? Reference
Poultry Groups of chicks BW X No “These techniques can
be employed in assessing critically the consistency in growth of chicks”
None Ravindranathan and Unni (1990)
Flocks of turkeys Survival rate X No “SPC … is applicable to animal health and production monitoring for the turkey industry.”
None Cowen et al. (1994)
Eggs Average egg weight
n-CUSUM No “Control chart enables to quickly detect a decrease of the average egg weight.”
Continuously updated mathematical model of egg weight by age
Mertens et al. (2008)
Swine Herd of sows % return to
service, % fetuses born dead, No. of pigs born per litter
X No “… probably the most useful system of monitoring … involves the use of control charts.”
None Wrathall (1977)
Batch of pigs Snout-deformity score
n-CUSUM No “An efficient method of monitoring disease levels … when changes in variables are smaller.”
None Sard (1979)
Herd of sows % return to service, No. born alive/litter
X, n-CUSUM Time to signal after change
“The Shewhart chart and the CUSUM chart are particularly useful for monitoring reproductive parameters.”
Wrathall and Hebert (1982)
Herd of sows Many statistics: counts, averages, or proportions per week or month
P, X, S11 None “Through the use of statistical process control, emerging problems can be rapidly identified.”
Logarithmic transformations of non-normal data
Dial et al. (1996)
Group of pigs Growth coefficient of variation
Q12 None “This approach is promising for use in other types of food production … especially food animals, such as poultry.”
Growth model Quesenberry (1991)
Herd of sows No. of females mated per week
X Rate of signals
“SPC charts … are useful tools for veterinarians and farm managers to measure and control within-farm variability in swine production.”
Koketsu et al. (1999)
Herd of sows % return to service
X No “Control charts are helpful … to know when to intervene … and for reducing variation that is endemic in a process.”
None Morrison et al. (1997)
Groups of pigs Serologic responses
X, R13 ATS “Statistical process control … can be used as a tool for a Salmonella monitoring strategy.”
None Baum et al. (2005)
Groups of pigs Water consumption
n-CUSUM Time from signal to diagnosis
“Diarrhea can be detected … one day before physical signs are seen on the pigs.”
Dynamic linear model of water intake
Madsen and Kristensen (2005)
Groups of sows Electronic feeder visits to detect estrus, lameness, other health disorders
n-CUSUM Sensitivity and specificity
“The detection method performs generally better than when a list of sows that have not eaten … is used as an alarm.”
Dynamic linear model of eating rank
Cornou et al. (2008)
Table 2 (Continued). Published examples of uses of statistical process control charts (SPC) in animal produc-tion systems (1977–2009)
De Vries and ReneauE20
by on May 10, 2011. jas.fass.orgDownloaded from

Niza-Ribeiro et al. (2004) and Lukas et al. (2008b) provide capability indices for udder health measures of dairy cows. The capability index is a statistical mea-sure of the ability of a process to produce output within engineering tolerances and specification limits and an-other SPC tool (Montgomery, 2009).
The literature on successful applications of control charts to monitor trends in animal production systems is still relatively scarce. Most papers show examples of possible applications. Papers on the practical benefits of implemented control chart schemes were not found. Table 2 lists primarily peer-reviewed publications with some key characteristics of the applications. To be in-cluded in Table 2, the paper had to mention control charts. The list of peer-reviewed papers is thought to be rather complete. Some non-peer-reviewed papers with novel applications are included as well.
Most papers described the use of Shewhart control charts and illustrated their use with typically some out-put performance data of a group of animals. Run rules were often mentioned. The CUSUM control charts were described more often than EWMA charts. The most advanced applications monitored deviations from ex-pected individual animal performance. Expected values varied from moving averages to more advanced dynamic biological models. Use of such models is the equivalent of risk adjustment in health care.
Shewhart charts were typically designed with 3-sigma limits but 2-sigma and 3.09-sigma limits (3.09 results
in a false alarm rate of 1 per 1,000 observations, as is common in the United Kingdom) were used as well. Occasionally probability limits were described. Control limits should be based on the cost of type I and II er-rors. These costs are generally unknown but deserve further study for successful applications in animal pro-duction systems.
The performance of the control chart application is almost always evaluated based on testimonials: a few signals were explained by an apparent assignable root cause. In other cases, control charts detected unplanned changes faster than other means that were considered the gold standard. Run length distributions were only found in papers describing simulations studies. Studies that documented the actual economic value of the use of control charts in animal production systems were not found. De Vries and Conlin (2003b) showed that small decreases in estrus detection efficiency could be more costly than large changes because of the longer time it takes to signal small changes before correction occurs.
Many papers, especially with examples in swine pro-duction, plotted weekly or monthly averages. If data collection is continuous, the optimal period length of Shewhart charts may the different than a week or month (De Vries and Conlin, 2001). Alternatively, CUSUM charts may be designed to monitor observa-tions as soon as they become available and grouping in weekly or monthly averages or sums is not needed. For example, observations with a low frequency of occur-
Unit of measure Variables plotted
Type of chart(s)
Performance evaluation
Benefits of control charts (perceived, observed, measured)
Data preadjustment? Reference
Herd No. of piglets born, return to estrus rate
n-EWMA,14 n-CUSUM
ATS0, ATS1, sensitivity (simulation study)
“Both charts appear to be useful tools for tracking commercial swine farm processes and detecting emerging change in process performance.”
None Krieter et al. (2009)
Herd % culls, feed efficiency, % mortality, ADG
X Signals on control chart indicate implemented change worked
“Statistical process control may be used to assess the efficacy of products in pig production when formal studies are not feasible.”
Fraile et al. (2009)
1X: Shewhart chart of sample means (normal distribution).2n-CUSUM: cumulative sum chart for normally distributed data.3ATS: average time to signal.4P: Shewhart chart of binomial observations.5X: Shewhart chart of individual observations (normal distribution).6p-CUSUM: cumulative sum chart for binomially distributed data.7ATS0: average time between false alarms.8ATS1: average time to a signal since the change occurred.9ARL0: average run length (average number of observations) between false alarms.10ARL1: average run length (average number of observations) to a signal since the change occurred.11S: Shewhart chart of SD.12Q: Quesenberry (1997) chart.13R: Shewhart chart of the range (normal distribution).14n-EWMA: exponential weighted moving average chart for normally distributed data.
Table 2 (Continued). Published examples of uses of statistical process control charts (SPC) in animal produc-tion systems (1977–2009)
Control charts in animal production systems E21
by on May 10, 2011. jas.fass.orgDownloaded from

rence such as morbidity and mortality events, and some carcass traits (e.g., incidence of dark cutters) might be monitored with time-between-event control charts, for example, a Bernoulli CUSUM chart (Reynolds and Stoumbos, 2000).
Stoumbos et al. (2000) suggested that most practi-tioners are not familiar with the more recent technical advances made in SPC methods, and therefore, better application of control charts is often possible. Most of the recent developments and future research needs in-volve more complete but complex mathematical mod-els that improve automatic detection of changes with tightly controlled false alarm rates (Woodall and Mont-gomery, 1999; Stoumbos et al., 2000). More experience with newer control chart methods applied to animal production systems is needed. Better applications may require the availability of user-friendly software (Wood-all and Montgomery, 1999). Most of the control charts described in this paper can be easily set up with a spreadsheet. An abundance of commercial general-pur-pose SPC software is available. Application of control charts in animal production systems would be enhanced when they are integrated with animal production data-bases, such as management information systems. Such integration would resolve data transfer problems. Some commercial software developers for animal production systems are starting to develop control chart applica-tions.
SUMMARY AND CONCLUSIONS
Control charts can be used to detect planned and un-planned changes in animal production systems. Their use has been advocated for over 30 yr in the literature, but their routine use in practice appears not to be wide-spread. Possibly many practitioners are still unfamiliar with the techniques and philosophy of control charts. A major hindrance for further adoption may be the difficulty in finding the underlying root cause(s) once a control chart has issued a signal. False alarm rates of control charts in some applications are probably much greater than expected and desired. Lack of user-friendly software is another hindrance. The most technical ap-plications monitor deviations from expected individual animal performance, where expected performance may be determined by biological models. Published papers focus mostly on charting outcome variables, but more examples of control charts applied to input variables are needed, such as compliance, feeding practice, diet composition, and environmental factors. Applications of control charts to detect unplanned changes are ex-pected to grow with the advancement of biological sen-sors and computer technology to monitor individual animal performance.
LITERATURE CITED
Alwan, L. C., and H. V. Roberts. 1988. Time-series modeling for statistical process control. J. Bus. Econ. Stat. 6:87–95.
Amin, R. W., M. R. Reynolds, and S. Bakir. 1995. Nonparametric quality control charts based on the sign statistic. Comm. Stat. Theory Methods 24:1597–1623.
Baum, D. H., S. Ward, C. L. Baum, N. Lee, D. D. Polson, D. L. Har-ris, and B. Nielsen. 2005. Statistical process control methods used to evaluate the serologic responses of pigs infected with three Salmonella serovars. J. Swine Health Prod. 13:304–313.
Caulcutt, R. 1995. The rights and wrongs of control charts. Appl. Stat. 44:279–288.
Cavero, D., K.-H. Tölle, C. Henze, C. Buxadé, and J. Krieter. 2008. Mastitis detection in dairy cows by application of neural net-works. Livest. Sci. 114:280–286.
Champ, C. W., and W. H. Woodall. 1987. Exact results for She-whart control charts with supplementary runs rules. Techno-metrics 29:393–399.
Christensen, J., and M. Rudemo. 1996. Multiple change-point analy-sis of disease incidence rates. Prev. Vet. Med. 99:53–76.
Cornou, C., J. Vinther, and A. R. Kristensen. 2008. Automatic de-tection of oestrus and health disorders using data from elec-tronic sow feeders. Livest. Sci. 118:262–271.
Cowen, P., D. Fernandez, and H. J. Barnes. 1994. Surveillance strat-egies for monitoring variation in animal health and productiv-ity: The use of statistical process control in the turkey industry. The Kenya Vet. 18:202–204.
Crowder, S. V. 1989. Design of exponentially weighted moving aver-age scheme. J. Qual. Technol. 21:155–162.
Davis, R. B., and W. H. Woodall. 1988. Performance of the control chart trend rule under linear shift. J. Qual. Technol. 20:260–262.
Deming, W. E. 1986. Out of the Crisis. MIT Press, Cambridge, MA.
De Mol, R. M., A. Keen, G. H. Kroeze, and J. M. F. H. Achten. 1999. Description of a detection model for oestrus and diseases in dairy cattle based on time series analysis combined with a Kalman filter. Comput. Electron. Agric. 22:171–185.
De Mol, R. M., and W. E. Woldt. 2001. Application of fuzzy logic in automated cow status monitoring. J. Dairy Sci. 84:400–410.
De Vries, A., and B. J. Conlin. 2001. Optimal days in period to detect a change in estrus detection. J. Dairy Sci. 84(Suppl. 1):253. (Abstr.)
De Vries, A., and B. J. Conlin. 2003a. Design and performance of statistical process control charts applied to estrus detection ef-ficiency. J. Dairy Sci. 86:1970–1984.
De Vries, A., and B. J. Conlin. 2003b. Economic value of timely de-termination of unexpected decreases in detection of estrus using control charts. J. Dairy Sci. 86:3516–3526.
De Vries, A., and B. J. Conlin. 2005. A comparison of the perfor-mance of statistical quality control charts in a dairy production system through stochastic simulation. Agric. Syst. 82:317–341.
Dial, G. D., C. Duangkaew, and C. Rademacher. 1996. Statistical process control: Application to swine production. Pages 53–83 in Principles and Application of Constraint Theory and Ca-pacity Utilization to Pig Farms. Allen D. Leman Swine Conf., Univ. Minnesota, St. Paul.
Diaz, M., and D. Neuhauser. 2005. Pasteur and parachutes: When statistical process control is better than a randomized con-trolled trial. Qual. Saf. Health Care 14:140–143.
Dohoo, I. R. 1993. Monitoring livestock health and production: Ser-vice—Epidemiology’s last frontier? Prev. Vet. Med. 18:43–52.
Dooley, K., J. Anderson, and X. Liu. 1997. Model-based diagnosis of special causes in statistical process control. Int. J. Prod. Res. 35:1609–1616.
Fraile, L. J., E. Crisci, J. Weenberg, M. Armadans, L. Mendoza, L. Ruiz, S. Bernaus, and M. Montoya. 2009. Effect of treatment with phytosterols in three herds with porcine respiratory dis-ease complex. J. Swine Health Prod. 17:32–41.
Frost, A. R., C. P. Schofield, S. A. Beaulah, T. T. Mottram, J. A. Lines, and C. M. Wathes. 1997. A review of livestock monitor-ing and the need for integrated systems. Comput. Electron. Agric. 17:139–159.
De Vries and ReneauE22
by on May 10, 2011. jas.fass.orgDownloaded from

Gan, F. F. 1992. CUSUM control charts under linear drift. Statisti-cian 41:71–84.
González, L. A., B. J. Tolkamp, M. P. Coffey, A. Ferret, and I. Kyri-azakis. 2008. Changes in feeding behavior as possible indicators for automatic monitoring of health disorders in dairy cows. J. Dairy Sci. 91:1017–1028.
Hawkins, D. M. 1993. Regression adjustment for variables in multi-variate quality control. J. Qual. Technol. 25:170–182.
Hawkins, D. M., and D. H. Olwell. 1998. Cumulative Sum Charts and Charting for Quality Improvement. Springer-Verlag, New York, NY.
Hawkins, D. M., P. Qui, and C. W. Kang. 2003. The changepoint model for statistical process control. J. Qual. Technol. 35:355–366.
Hogarth, R. M. 1987. Judgement and Choice: The Psychology of Decision. 2nd ed. John Wiley and Sons, New York, NY.
Hogeveen, H., and W. Ouweltjes. 2003. Sensors and management support in high-technology milking. J. Anim. Sci. 81(Suppl. 3):1–10.
Huirne, R. B. M. 1990. Basic concepts of computerized support for farm management decisions. Eur. Rev. Agric. Econ. 17:69–84.
Koketsu, Y., C. Duangkaew, G. D. Dial, and D. E. Reeves. 1999. Within-farm variability in number of females mated per week during a one-year period and breeding herd productivity on swine farms. J. Am. Vet. Med. Assoc. 214:520–524.
Krieter, J., J. Engler, K.-H. Tölle, H. H. Timm, and E. Hohls. 2009. Control charts applied to simulated sow herd datasets. Livest. Sci. 121:281–287.
Lukas, J. M., D. M. Hawkins, M. L. Kinsel, and J. K. Reneau. 2005. Bulk tank somatic cell counts analyzed by statistical process control tools to identify and monitor subclinical mastitis inci-dence. J. Dairy Sci. 88:3944–3952.
Lukas, J. M., J. K. Reneau, and J. G. Linn. 2008a. Water intake and dry matter intake changes as a feeding management tool and indicator of health and estrus status in dairy cows. J. Dairy Sci. 91:3385–3394.
Lukas, J. M., J. K. Reneau, C. Munoz-Zanzi, and M. L. Kinsel. 2008b. Predicting somatic cell count standard violations based on herd’s bulk tank somatic cell count. Part II: Consistency index. J. Dairy Sci. 91:433–441.
Lukas, J. M., J. K. Reneau, R. Wallace, D. Hawkins, and C. Munoz-Zanzi. 2009. A novel method of measuring daily milk produc-tion and electrical conductivity to predict disease onset. J. Dairy Sci. 92:5964–5976.
Madsen, T. N., and A. R. Kristensen. 2005. A model for monitoring the condition of young pigs by their drinking behaviour. Com-put. Electron. Agric. 48:138–154.
Mertens, K., I. Vaesen, J. Löffel, B. Ostyn, B. Kemps, B. Kamers, F. Bamelis, J. Zoons, P. Darius, E. Decuypere, J. De Baerde-maeker, and B. De Ketelaere. 2008. Data-based design of an intelligent control chart for the daily monitoring of the average egg weight. Comput. Electron. Agric. 61:222–232.
Mitra, A. 1998. Fundamentals of Quality Control and Improvement. 2nd ed. Prentice Hall, Upper Saddle River, NJ.
Montgomery, D. C. 2009. Introduction to Statistical Quality Con-trol. 6th ed. John Wiley and Sons, New York, NY.
Morrison, R. B., G. D. Dial, P. B. Bahnson, W. E. Marsh, J. E. Col-lins, and D. Polson. 1997. Using statistical process control to in-vestigate reproductive failure. Chapter 116 in Current Therapy in Large Animal Theriogenology. R. S. Youngquist, ed. W. B. Saunders Co., Philadelphia, PA.
Nielen, M., M. H. Spigt, Y. H. Schukken, H. A. Deluyker, K. Maatje, and A. Brand. 1995. Application of a neural network to analyse on-line milking parlour data for the detection of clinical masti-tis in dairy cows. Prev. Vet. Med. 22:15–28.
Niza-Ribeiro, J., J. P. T. M. Noordhuizen, and J. C. Menezes. 2004. Capability index—A statistical process control tool to aid in ud-der health control in dairy herds. J. Dairy Sci. 87:2459–2467.
Olmstead, P. S. 1967. Our debt to Walter Shewhart (Issue dedicated to the life of Walter Shewhart). Ind. Qual. Control 24:72–73.
Pastell, M., and H. Madsen. 2008. Application of CUSUM charts to detect lameness in a milking robot. Expert Syst. Appl. 35:2032–2040.
Pleasants, A. B., D. G. McCall, and G. W. Sheath. 1998. Design and application of a cusum quality control chart suitable for monitoring effects on ultimate muscle pH. N. Z. J. Agric. Res. 41:235–242.
Quesenberry, C. P. 1997. SPC Methods for Quality Improvement. John Wiley and Sons, New York, NY.
Quimby, W. F., B. F. Sowell, J. G. P. Bowman, M. E. Branine, M. E. Hubbert, and H. W. Sherwood. 2001. Application of feeding behaviour to predict morbidity of newly received calves in a commercial feedlot. Can. J. Anim. Sci. 81:315–320.
Rasmussen, J. 1993. Diagnostic reasoning in action. IEEE Trans. SMC 23:981–982.
Ravindranathan, N., and A. K. K. Unni. 1990. A study on consis-tency in body weights of chicks using Shewhart control charts. Cheiron 19:156–158.
Reneau, J. K., and J. Lukas. 2006. Using statistical process control methods to improve herd performance. Vet. Clin. North Am. Food Anim. Pract. 22:171–193.
Reynolds, M. R. Jr., and Z. G. Stoumbos. 2000. A general approach to modeling cusum charts for a proportion. IIE Trans. 32:515–535.
Roush, W. B., K. Tomiyama, K. H. Garnaoui, T. H. D’Alfonso, and T. L. Cravener. 1992. Kalman filter and an example of its use to detect changes in poultry production responses. Comput. Electron. Agric. 6:347–356.
Saniga, E. M. 1989. Economic statistical control-chart designs with an application to X and R charts. Technometrics 31:313–320.
Sard, D. M. 1979. Dealing with data: The practical use of numerical information-(14) Monitoring changes. Vet. Rec. 105:323–328.
Shewhart, W. A. 1931. Economic Control of Quality of Manufac-tured Product. D. Van Nostrand Co., New York, NY.
Shewhart, W. A. 1939. Statistical Method from the Viewpoint of Quality Control. The Graduate School of the US Department of Agriculture, Washington, DC.
Solodky, C., H. Chen, P. K. Jones, W. Katcher, and D. Neuhauser. 1998. Patients as partners in clinical research: A proposal for applying quality improvement methods to patient care. Med. Care 36(Suppl.):AS13–AS20.
Spahr, S. L. 1993. New technologies and decision making in high producing herds. J. Dairy Sci. 76:3269–3277.
St-Pierre, N. R., and B. Cobanov. 2007a. A model to determine the optimal sampling schedule of diet components. J. Dairy Sci. 90:5383–5394.
St-Pierre, N. R., and B. Cobanov. 2007b. Optimal sampling schedule of diet components: Model robustness to departure from as-sumptions. J. Dairy Sci. 90:5395–5404.
Stoumbos, Z. G., M. R. Reynolds Jr., T. P. Ryan, and W. H. Wood-all. 2000. The state of statistical process control as we proceed into the 21st century. J. Am. Stat. Assoc. 95:992–998.
Thor, J., J. Lundberg, J. Ask, J. Olsson, C. Carli, K. Pukk Hären-stam, and M. Brommels. 2007. Application of statistical process control in healthcare and improvement: A systematic review. Qual. Saf. Health Care 16:387–399.
Thysen, I. 1993. Monitoring bulk tank somatic cell counts by a multi-process Kalman filter. Acta Agric. Scand. Sect. Anim. Sci. 43:58–64.
Van Bebber, J., N. Reinsch, W. Junge, and E. Kalm. 1999. Moni-toring daily milk yields with a recursive test day repeatability model (Kalman filter). J. Dairy Sci. 82:2421–2429.
Wade, M. R., and W. H. Woodall. 1993. A review and analysis of cause-selecting control charts. J. Qual. Technol. 25:161–169.
Walker, E., J. W. Philpot, and J. Clement. 1991. False signal rates for the Shewhart control chart with supplementary runs tests. J. Qual. Technol. 23:247–252.
E23Control charts in animal production systems
by on May 10, 2011. jas.fass.orgDownloaded from

Wallace, R. L. 2009. Milking systems: Your computer can tell you about more than reproduction. Pages 121–128 in NMC Annu. Meet. Proc., Charlotte, NC. NMC, Verona, WI.
Wheeler, D. J., and D. S. Chambers. 1992. Understanding Statistical Process Control. 2nd ed. SPC Press, Knoxville, TN.
Woodall, W. H. 2000. Controversies and contradictions in statistical process control. J. Qual. Technol. 32:341–350.
Woodall, W. H. 2006. The use of control charts in health-care and public-health surveillance. J. Qual. Technol. 38:89–104.
Woodall, W. H., and D. C. Montgomery. 1999. Research issues and ideas in statistical process control. J. Qual. Technol. 31:376–386.
Wrathall, A. E. 1977. Reproductive failure in the pig: Diagnosis and control. Vet. Rec. 100:230–237.
Wrathall, A. E., and C. N. Hebert. 1982. Monitoring reproductive performance in the pig herd. Pig Vet. Soc. Proc. 9:136–148.
E24 De Vries and Reneau
by on May 10, 2011. jas.fass.orgDownloaded from

References http://jas.fass.org/cgi/content/full/88/13_electronic_suppl/E11#BIBL
This article cites 64 articles, 5 of which you can access for free at:
Citations
shttp://jas.fass.org/cgi/content/full/88/13_electronic_suppl/E11#otherarticleThis article has been cited by 1 HighWire-hosted articles:
by on May 10, 2011. jas.fass.orgDownloaded from