Embed Size (px)
Citation preview

RESEARCH PAPER
PETROLEUM EXPLORATION AND DEVELOPMENT Volume 36, Issue 4, August 2009 Online English edition of the Chinese language journal
Cite this article as: PETROL. EXPLOR. DEVELOP., 2009, 36(4): 448–455.
Received date: 15 December 2008; Revised date: 25 April 2009.* Corresponding author. E-mail: [email protected] Copyright © 2009, Research Institute of Petroleum Exploration and Development, PetroChina. Published by Elsevier BV. All rights reserved.
Application of high-resolution sequence stratigraphy in improving the precision of reservoir prediction
Li Jinsong1,2,*, Zheng Xiaodong2, Gao Zhiyong2, Li Yonggen2, Liu Ying2, Li Xingli2
1. China University of Geosciences, Beijing 100083, China; 2. PetroChina Research Institute of Petroleum Exploration & Development, Beijing 100083, China
Abstract: On the basis of high-resolution sequence stratigraphy, this paper establishes a sequence stratigraphic frame, and predicts reservoirs by analyzing velocity field, seismic inversion, and seismic attributes. In the case study of the Jurassic Toutunhe Formationbraided river delta reservoir of Shinan 21 well block, middle of the Junggar Basin, space variant velocity field inversion and reservoir prediction were carried out based on the sequence stratigraphic frame and the reservoir prediction accuracy was improved. Comparingthe prediction results with the real drilling shows that, when the burial depth of bed of interest is 2 500 m, the maximum prediction error of depth is only 10 m, and the average relative prediction error is 0.16%; for appraisal wells with an average effective sandstone of 13 m, the maximum prediction error of sandstone thickness is only 5 m. The structure mapping and reservoir prediction constrained by thesequence stratigraphic frame achieved success.
Key words: sequence stratigraphic frame; reservoir prediction; Junggar Basin; braided river delta
As the exploration targets for hydrocarbons are changing from structural pools to various types of lithological ones[1-4],the foundation geology has gone through noticeable changes. As represented by high-resolution sequence stratigraphy, sedimentology has progressively become the primary theoretic basis of exploration for lithologic pools; on the basis of the classification and set-up of sequence stratigraphic frame for the study zone, the study on velocity field, seismic inversion, and analysis of seismic attributes would be more precise, consequently improving the reservoir prediction precision in a effective manner. Based on the case study of Jurassic Toutunhe Formation braided river delta reservoir of Shinan 21 well field, middle of Junggar Basin, this paper illustrates the role of high-resolution sequence stratigraphy in improving the precision of reservoir prediction, hopefully to provide new thought in the exploration for lithologic pools in the future[5].
1 Geological overview of study area
Perched on the center of Guerban Tonggute Desert in the middle part of Junggar Basin, the Shinan area was dominated by the braided river delta sedimentation in the mid-Jurassic era. Under the control of the NE fault slope break belt, the sand in the branch channels of the delta front extended in strips parallel to or diagonally intersected with
the structural lines, which was favorable for the forming of lithologic traps[6]. Featuring a low-energy braided river lithosomic body, the target formation, i.e., Jurassic Toutunhe Formation (J2t), could be classified (from top to bottom) into 3 sand members: J2t1, J2t2 and J2t3. Concretely, J2t1 and J2t3 are principally of mudstone, while J2t2 features the primary oil pay zone, consisting of dark-gray medium- and fine-grain sandstone, inequigranular sandstone, and a small quantity of arenaceous conglomerate. Overall, J2t2
member, according to the spontaneous potential log, presents the marked feature of “wrap-up of sandstone in mudstone”, where extensive sand develops laterally, indicating a satisfactory condition for the forming of lithologic pools. As demonstrated by drilling, J2t2 reservoir in Shinan 21 well field is principally controlled by lithologic boundary, except for its southern part which is under the control of oil-water boundary.
2 Single well classification and comparison of high-resolution sequence stratigraphy
2.1 Single well classification of short base-level cycle
In the study area, sequence classification is conducted to each well according to the periodic retrograding-prograding variation as reflected by its log, as well as the sequence interface identification marks, including mudstone color
Li Jinsong et al. / Petroleum Exploration and Development, 2009, 36(4): 448–455
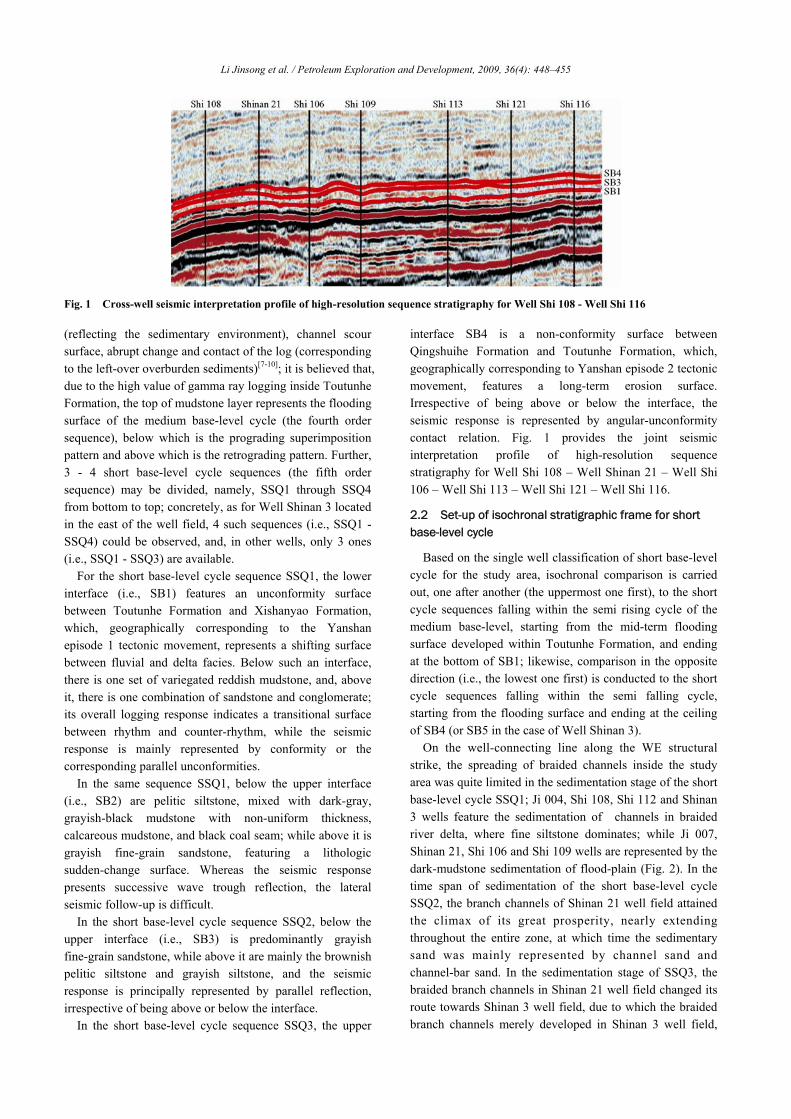
Fig. 1 Cross-well seismic interpretation profile of high-resolution sequence stratigraphy for Well Shi 108 - Well Shi 116
(reflecting the sedimentary environment), channel scour surface, abrupt change and contact of the log (corresponding to the left-over overburden sediments)[7-10]; it is believed that, due to the high value of gamma ray logging inside Toutunhe Formation, the top of mudstone layer represents the flooding surface of the medium base-level cycle (the fourth order sequence), below which is the prograding superimposition pattern and above which is the retrograding pattern. Further, 3 - 4 short base-level cycle sequences (the fifth order sequence) may be divided, namely, SSQ1 through SSQ4 from bottom to top; concretely, as for Well Shinan 3 located in the east of the well field, 4 such sequences (i.e., SSQ1 - SSQ4) could be observed, and, in other wells, only 3 ones (i.e., SSQ1 - SSQ3) are available.
For the short base-level cycle sequence SSQ1, the lower interface (i.e., SB1) features an unconformity surface between Toutunhe Formation and Xishanyao Formation, which, geographically corresponding to the Yanshan episode 1 tectonic movement, represents a shifting surface between fluvial and delta facies. Below such an interface, there is one set of variegated reddish mudstone, and, above it, there is one combination of sandstone and conglomerate; its overall logging response indicates a transitional surface between rhythm and counter-rhythm, while the seismic response is mainly represented by conformity or the corresponding parallel unconformities.
In the same sequence SSQ1, below the upper interface (i.e., SB2) are pelitic siltstone, mixed with dark-gray, grayish-black mudstone with non-uniform thickness, calcareous mudstone, and black coal seam; while above it is grayish fine-grain sandstone, featuring a lithologic sudden-change surface. Whereas the seismic response presents successive wave trough reflection, the lateral seismic follow-up is difficult.
In the short base-level cycle sequence SSQ2, below the upper interface (i.e., SB3) is predominantly grayish fine-grain sandstone, while above it are mainly the brownish pelitic siltstone and grayish siltstone, and the seismic response is principally represented by parallel reflection, irrespective of being above or below the interface.
In the short base-level cycle sequence SSQ3, the upper
interface SB4 is a non-conformity surface between Qingshuihe Formation and Toutunhe Formation, which, geographically corresponding to Yanshan episode 2 tectonic movement, features a long-term erosion surface. Irrespective of being above or below the interface, the seismic response is represented by angular-unconformity contact relation. Fig. 1 provides the joint seismic interpretation profile of high-resolution sequence stratigraphy for Well Shi 108 – Well Shinan 21 – Well Shi 106 – Well Shi 113 – Well Shi 121 – Well Shi 116.
2.2 Set-up of isochronal stratigraphic frame for short base-level cycle
Based on the single well classification of short base-level cycle for the study area, isochronal comparison is carried out, one after another (the uppermost one first), to the short cycle sequences falling within the semi rising cycle of the medium base-level, starting from the mid-term flooding surface developed within Toutunhe Formation, and ending at the bottom of SB1; likewise, comparison in the opposite direction (i.e., the lowest one first) is conducted to the short cycle sequences falling within the semi falling cycle, starting from the flooding surface and ending at the ceiling of SB4 (or SB5 in the case of Well Shinan 3).
On the well-connecting line along the WE structural strike, the spreading of braided channels inside the study area was quite limited in the sedimentation stage of the short base-level cycle SSQ1; Ji 004, Shi 108, Shi 112 and Shinan 3 wells feature the sedimentation of channels in braided river delta, where fine siltstone dominates; while Ji 007, Shinan 21, Shi 106 and Shi 109 wells are represented by the dark-mudstone sedimentation of flood-plain (Fig. 2). In the time span of sedimentation of the short base-level cycle SSQ2, the branch channels of Shinan 21 well field attained the climax of its great prosperity, nearly extending throughout the entire zone, at which time the sedimentary sand was mainly represented by channel sand and channel-bar sand. In the sedimentation stage of SSQ3, the braided branch channels in Shinan 21 well field changed its route towards Shinan 3 well field, due to which the braided branch channels merely developed in Shinan 3 well field,

Li Jinsong et al. / Petroleum Exploration and Development, 2009, 36(4): 448–455
Fig. 2 Illustration of isochronal stratigraphic frame of Toutunhe Formation for Ji 004 - Shinan 3 wells
Fig. 3 Illustration of isochronal stratigraphic frame of Toutunhe Formation for Shi 114 - Shi 107 wells
while the rest wells were principally represented by the dark-mudstone sedimentation of inter-braided channel flood-plain. SSQ4 was retained only in Shinan 3 well field, which, similarly, was represented by the sedimentation of braided branch channel.
On the well-connecting line along the SN structural strike, Shi 114 through Shi 107 wells were represented by the sedimentation of braided-river delta flood-plain in the sedimentary time span of the short base-level cycle SSQ1; Shi 114 and Shi 107 well fields were dominated by the brownish mudstone featuring the oxidation environment of flood-plain, while the remaining well fields by the dark mudstone featuring the weak reducing environment (Fig. 3). During the sedimentation of the short base-level cycle SSQ2, the braided branch channels of braided-river delta plain
nearly extended across the entire zone, and the dark-mudstone sedimentation of inter-braided channel flood-plain developed in a handful of well fields (including Shinan 22, and Shi 107) in the northern part of Shinan 21 well field. In such a stage, the sedimentary sand was mainly represented by the channel sand and the channel-bar sand, which, together with the lateral flood-plain dark-mudstone, could form the sand lateral pinch-out lithologic oil/gas pools; being of certain heterogeneity; the intra-channel sand reservoirs would also constitute lithologic traps. During the sedimentation of SSQ3, Shi 114, Shinan 21 and Shi 107 wells were apparently represented by the extensive sedimentation of dark-, brownish mudstone of the flood-plain facies.
On the basis of well-connecting isochronal stratigraphic

Li Jinsong et al. / Petroleum Exploration and Development, 2009, 36(4): 448–455
Fig. 4 Average velocity field illustration for SB3, with the sequence frame constraint incorporated (a) and not incorporated (b)
Fig. 5 Structural map for SB3 after well depth correction conducted to 9 wells
Fig. 6 Structural map for SB3 after well depth correction conducted to 20 wells
frame, and by leveraging the 3D seismic interpretation, full-zone tracking has been winded up (280 km2) for 3 sequences (i.e., SB1, SB3, and SB4), and the 3D sequence stratigraphic frame has been thus set up. Due to the isochronal sedimentation within each sequence, any sedimentation body falling between SB1 and SB3 or between SB3 and SB4 may be studied separately via seismic techniques on the basis of high-resolution sequence stratigraphic researches; relative to the reservoir prediction based on the conventional horizon interpretation (SB1 and SB4 to be interpreted only), the control of high-resolution sequence stratigraphic frame could effectively improve the precision in reservoir prediction.
3 Structural variable speed imaging technique under the constraint of sequence frame
Fig. 4a (constraint of sequence frame incorporated) and b
(no constraint of sequence frame incorporated) show the average velocity field of SB3, as resulted from the inversion based on velocity spectrum data[11]; as indicated therein, the average velocity field as constrained by sequence frame presents a more marked regularity, while the random noise would exist when no such constraint is imposed. It indicates that, with the constraint of sequence stratigraphic frame, the average velocity field could overcome partial impacts arising from the seismic data itself and artificial interpretation, consequently reflecting, in a more objective manner, the velocity field characteristics of the target interval, in addition to improving the precision of structural variable speed imaging.
Figs. 5 and 6 are the structural graphs after depth correction is conducted to 9 wells and 20 wells, respectively; evidently, the structural patterns are of high consistency. After the structural graph is plotted for SB3 on the basis of

Li Jinsong et al. / Petroleum Exploration and Development, 2009, 36(4): 448–455
Table 1 Depth prediction and error for each non-drilled well from the structural map in various rounds
Depth fetched from structural map / m Prediction error / m Well ID Penetration depth / m 9 wells 12 wells 15 wells 18 wells 9 wells 12 wells 15 wells 18 wells
Shi 112 2 531.000 2 526.760 4.243 Shi 113 2 504.000 2 507.250 - 3.254 Shi 114 2 581.000 2 573.230 7.773 Shi 115 2 442.500 2 443.200 2 446.610 - 0.704 - 4.101 Shi 116 2 457.000 2 457.840 2 459.560 - 0.836 - 2.560 Shi 117 2 435.000 2 438.450 2 439.470 - 3.457 - 4.469 Shi 118 2 502.500 2 494.150 2 494.990 2 492.670 8.354 7.510 9.829 Shi 119 2 458.000 2 451.830 2 453.810 2 451.340 6.169 4.194 6.657 Shi 120 2 510.000 2 505.590 2 506.280 2 504.150 4.411 3.718 5.843 Shi 121 2 504.500 2 504.820 2 506.370 2 503.950 2 504.550 - 0.321 - 1.878 0.550 - 0.053 Shi 122 2 430.000 2 427.780 2 429.860 2 429.860 2 430.110 2.217 0.140 0.131 - 0.106
Fig. 7 Waveform classification of formations between sequence interfaces
the velocity field resulted from sequence frame constraining, the drilling history is simulated for the exploration appraisal wells; firstly, well-site depth correction is carried out to the 9 appraisal wells in the first batch of drilling (namely, Ji 004, Ji 007, Shinan 3, Shinan 22, Shinan 21, Shi 106, Shi 107, Shi 108, and Shi 109 wells); thereafter, the well-site depths of the other 11 wells are fetched for the comparison against the penetration depth of each well, so as to acquire the predicted depth and prediction error of each well; such a process is then iterated for 12, 15, and 18 appraisal wells respectively, so as to get the predicted depth and prediction error of each of the other 8, 5, and 2 wells (see Table 1). According to Table 1, the maximum error in predicted depth is merely 10 m (target formation: about 2 500 m in depth), with the relative prediction error averaged at 0.16%. That is, a higher precision would be attained for the structural variable speed imaging on the basis of average velocity field resulted from the inversion of velocity spectrum data under the constraint of sequence frame.
4 Reservoir prediction techniques under constraint of sequence frame[12-14]
Fig. 7 shows the comparison between the waveform classification graphs on the basis of conventional horizon interpretation and the waveform classification graphs of inter-sequence interface seismic response; it shall be noted that the formation between sequence interfaces of SB1 and
SB3 includes the target reservoir. As indicated by the figure, the classification result of seismic waveforms between conventional horizon interpretation interfaces is nearly equivalent to the superimposition of the classification result between SB3 and SB4 interfaces with that between SB1 and SB3 interfaces. That is, the set-up of high-resolution sequence stratigraphic frame could differentiate relatively small sedimentary bodies, so that the seismic attribute analysis could be conducted specifically to a certain small sedimentary body; as a result, the reservoir prediction precision could be improved in the application of seismic attribute analysis technique.
Fig. 8 shows the logging constraint inversion profile through Well Shinan 21 plotted on the basis of conventional horizon interpretation results, which could be compared with the counterpart introducing high-resolution sequence stratigraphic frame (Fig. 9). According to the two inversion profiles, the overall reservoir development characteristics are consistent, with the latter presenting a more clear-cut depiction of the reservoir lateral variation particulars. After the introduction of the high-resolution sequence stratigraphic frame, the initial geological model approaches much closer to the actual sand spreading (both transverse and longitudinal), thus improving the reservoir prediction precision in the application of seismic inversion.
Figs. 10 and 11 show the thickness of sandstone, which is resulted from seismic inversion under the constraint of

Li Jinsong et al. / Petroleum Exploration and Development, 2009, 36(4): 448–455
Fig. 8 Conventional horizon interpretation results through Well Shinan 21
Fig. 9 Seismic inversion profile through Well Shinan 21, as constrained by sequence frame
sequence stratigraphic frame, for 9 wells and 20 wells, respectively. Obviously, the sand patterns in the two figures merely present low inconsistency; however, difference exists with the thickness of sand bodies. The drilling history of the exploration and appraisal wells is simulated as follows: firstly, carrying out logging restrained inversion to the 9 appraisal wells of the first batch of drilling (namely, Ji 004, Ji 007, Shinan 3, Shinan 22, Shinan 21, Shi 106l, Shi 107, Shi 108, and Shi 109 wells). On the resultant sandstone thickness maps, the predicted sandstone thickness for the other 11 wells is fetched, which is compared with the actual value of each well to calculate the prediction error concerning the sandstone thickness for respective well (Table 2); then, such a process is iterated for the cases of 12, 15, and 18 appraisal wells, so as to obtain the prediction errors of the other 8 wells, 5 wells, and 2 wells, respectively.According to the table, given the target layer with the burial
depth of about 2 500 m and the appraisal well with effective sandstone thickness averaged at 13 m, the maximum prediction error in sandstone thickness is about 5 m. Provided that the Shi 118, Shi 119, Shi 120, and Shi 121 wells are regarded as a sample set, the average relative error is 28.87%, no matter whether 9 wells or 12 wells are used for the prediction; when 15 wells are used for the prediction, the average relative error of the sample set arrives at 26.44%. In other words, even when the number of wells used for the prediction varies largely, the improvement in prediction precision is not evident, indicating that, whereas the high-resolution sequence stratigraphic frame has established a rational sedimentation comparison relation, seismic inversion could, with a less number of known wells, still attain the prediction precision equivalent to the case with a bigger number of known wells. Evidently, with the sequence frame being imposed, effective improvement

Li Jinsong et al. / Petroleum Exploration and Development, 2009, 36(4): 448–455
Fig. 10 Sandstone thickness predicted by seismic inversion with 9 wells constrained by sequence frame
Table 2 Depth prediction and error for each non-drilled well from the structural map in various rounds
9 wells 12 wells 15 wells 18 wells Well Name
Actual thickness / m Predicted
thickness / m Prediction error
/ m Predicted
thickness / mPrediction error
/ m Predicted
thickness / mPrediction error
/ m Predicted
thickness / m Prediction error
/ m Shi 112 21.000 18.000 3.000 Shi 113 14.000 13.000 1.000 Shi 114 12.000 11.700 0.300 Shi 115 0.000 1.000 -1.000 1.000 -1.000 Shi 116 20.000 15.000 5.000 15.000 5.000 Shi 117 19.000 18.300 0.700 18.300 0.700 Shi 118 5.000 6.200 -1.200 6.200 -1.200 6.400 -1.400 Shi 119 2.000 1.000 1.000 1.000 1.000 1.100 0.900 Shi 120 14.000 12.000 2.000 12.000 2.000 12.500 1.500 Shi 121 19.500 14.200 5.300 14.200 5.300 15.200 4.300 16.300 3.200
could be seen with the precision of both seismic attribute analysis and seismic inversion.
5 Conclusions
As indicated by its application in the braided-river
sedimentary reservoir of Jurassic Toutunhe Formation, Shinan 21 well field, Junggar Basin, as well as the analysis on error, the set-up of high-resolution sequence stratigraphic frame would play a significant role in improving the precision in seismic prediction, since the structural variable

Li Jinsong et al. / Petroleum Exploration and Development, 2009, 36(4): 448–455
Fig. 11 Sandstone thickness predicted by seismic inversion with 20 wells constrained by sequence frame
speed imaging under the constraint of sequence frame, together with the reservoir prediction technique under such constraint, could be highly effective in achieving this goal.
The study area elaborated in this paper concerns a cluster of exploration and appraisal wells (up to 20 wells), and abundant data are available for the classification of short base-level cycles. Nevertheless, the scheme provided herein could also be followed by the lithologic reservoir exploration in the zones with small number of wells. Whereas the objects of hydrocarbon exploration become increasingly subtle and complicated, a better answer for improving reservoir prediction precision would inevitably rest with the combination of sequence stratigraphy with the reservoir prediction techniques.
References
[1] Hu Jianyi. The symposium of subtle oil reservoirs exploration in China. Harbin: Heilongjiang Science and Technology Press,
1984.[2] Xiang Kui, Bao Zhidong, Zhuang Wenshan. Petroleum geology
and exploration of beach sandbar in Junggar Basin, NW China: A case from the Shawan Formation in Well Pai 2. Petroleum Exploration and Development, 2008, 35(2): 195-200.
[3] Pan Yuanlin. Subtle oil reservoirs in China. Beijing: Geological Publishing House, 1998.
[4] Jia Chengzao, Chi Yingliu. The symposium of the 3th subtle oil reservoirs international conference. Beijing: Petroleum Industry Press, 2004.
[5] Jia Chengzao, Zhao Wenzhi, Zou Caineng, et al. Two key technologies about exploration of stratigraphic/lithological reservoirs. Petroleum Exploration and Development, 2004, 31(3): 3-9.
[6] Guan Shuwei, Li Benliang, Hou Lianhua, et al. New hydrocarbon exploration areas in footwall covered structures in northwestern margin of Junggar Basin. Petroleum Exploration and Development, 2008, 35(1): 17-22.
[7] Cross T A, Lessenger M A. Sediment volume partitioning:

Li Jinsong et al. / Petroleum Exploration and Development, 2009, 36(4): 448–455
Rational for stratigraphic model evaluation and high resolution stratigraphic correlation. Gradstein F M, Sandvik K O, Milton N J, et al. Sequence stratigraphy concepts and applications. Oslo: NPF Special Publication, 1998. 171-195.
[8] Cross T A, Baker M R. Applications of high-resolution sequence- stratigraphy to reservoir analysis. Eschard R, Doligez B. Subsurface reservoir characterization from outcrop observations. Paris: The 7th IFP Exploration and Production Research Conference, 1993.
[9] Deng Hongwen. A new school of thought in sequence stratigraphic studies in U.S.: High resolution sequence stratigraphy. Oil & Gas Geology, 1995, 16(2):89-97.
[10] Deng Hongwen, Wang Hongliang. High resolution sequence
stratigraphy: Theory and application. Beijing: Geological Publishing House, 2002.
[11] Zhao Bangliu. Application of multi-component seismic exploration in the exploration and production of lithologic gas reservoirs. Petroleum Exploration and Development, 2008, 35(4): 397-409, 423.
[12] Li Qingzhong. The road to precision exploration. Beijing: Petroleum Industry Press, 2003.
[13] Liu Wenlin. The seismic technology of oilfield development. Beijing: Petroleum Industry Press, 1996.
[14] Yao Pengchang, Gan Lideng. Application and restriction of seismic inversion. Petroleum Exploration and Development, 2000, 27(2): 53-56.