Embed Size (px)
Citation preview

South Dakota State University South Dakota State University
Open PRAIRIE: Open Public Research Access Institutional Open PRAIRIE: Open Public Research Access Institutional
Repository and Information Exchange Repository and Information Exchange
Electronic Theses and Dissertations
2016
Application of New Materials and Innovative Detailing for Application of New Materials and Innovative Detailing for
Reinforced Concrete Structures Reinforced Concrete Structures
Ishtiaque Ahmed Tuhin South Dakota State University
Follow this and additional works at: https://openprairie.sdstate.edu/etd
Part of the Civil and Environmental Engineering Commons
Recommended Citation Recommended Citation Tuhin, Ishtiaque Ahmed, "Application of New Materials and Innovative Detailing for Reinforced Concrete Structures" (2016). Electronic Theses and Dissertations. 1119. https://openprairie.sdstate.edu/etd/1119
This Thesis - Open Access is brought to you for free and open access by Open PRAIRIE: Open Public Research Access Institutional Repository and Information Exchange. It has been accepted for inclusion in Electronic Theses and Dissertations by an authorized administrator of Open PRAIRIE: Open Public Research Access Institutional Repository and Information Exchange. For more information, please contact [email protected].

APPLICATION OF NEW MATERIALS AND INNOVATIVE DETAILING FOR
REINFORCED CONCRETE STRUCTURES
BY
ISHTIAQUE AHMED TUHIN
A thesis submitted in partial fulfillment of the requirements for the
Master of Science
Major in Civil Engineering
South Dakota State University
2016


iii
ACKNOWLEDGEMENTS
I would like to thank my fellow graduate research assistants Zachary Charles
Carnahan, Lucas Michael Bohn, Abdullah Bakri Boudaqa, Michael James Mingo, and
Abdullah Al Hashib for their assistance throughout this research. Advice and support
of the J. Lohr Structures Lab Manager, Mr. Zachary Gutzmer, are highly appreciated.
I would like to recognize Dr. Mostafa Tazarv, who was my advisor for this
research. I found this project, which he proposed to me, very interesting and
challenging yet extremely rewarding. His valuable insight knowledge, help, and
advice throughout the course of the project made the process a lot smoother. He was
so helpful and always encouraged me to learn new things, which are unforgettable
steps in my academic arena.
I am also very thankful to Dr. Nadim Wehbe, who was my academic advisor
for more than a year. He secured my funding and allocated fund for my research. He
gave us a lot of important instructions during our research. They, along with Dr.
Allen Jones, Dr. Suzethe Burckhard, Dr. Mohammand Seyed Ardakani, and Dr.
Junwon Seo have been superb instructors during my graduate studies at SDSU. I am
also thankful to Zachery Gutzmer and Dr. Jonathan Wood to guide me during my TA
duty at SDSU.
I would like to thank Steve Decker, Vice President of Business Development,
LINE-X, LLC for donating material for my research. I also would like to thank
Melissa Bommarito, Associated Steel Corporation for donating high strength steel
shafts for my research.

iv
Finally, I would like to thank my family members and friends for their
unforgettable support and encouragement throughout my graduate study at SDSU.

v
TABLE OF CONTENTS
LIST OF FIGURES ..................................................................................................... xii
LIST OF TABLES ....................................................................................................... xx
ABSTRACT ............................................................................................................... xxii
CHAPTER 1. INTRODUCTION .................................................................................. 1
1.1. Project Description .............................................................................................. 1
1.1.1. Rubber Confined Concrete ........................................................................... 1
1.1.2. Buckling Restrained Reinforcement ............................................................. 2
1.1.3. Behavior of Modern Beam-Column Connection.......................................... 2
1.2. Research Objectives and Scopes ......................................................................... 3
1.2.1. Rubber Confined Concrete ........................................................................... 3
1.2.2. Buckling Restrained Reinforcement ............................................................. 3
1.2.3. Behavior of Modern Beam-Column Connection.......................................... 3
1.3. Document Organization ...................................................................................... 4
CHAPTER 2. RUBBER CONFINED CONCRETE ..................................................... 5
2.1. Introduction ......................................................................................................... 5
2.2. Research Objectives ............................................................................................ 5
2.3. Properties of Rubber............................................................................................ 6
2.4. Unconfined and Confined Concrete .................................................................... 7
2.4.1. Steel-Confined Model by Kent and Park (1971) .......................................... 9
2.4.2. Steel-Confined Model by Popovics (1973) ................................................ 11

vi
2.4.3. Steel-Confined Model by Mander et al. (1988) .......................................... 11
2.4.4. FRP-Confined Model by Lim and Ozbakkaloglu (2014) ........................... 12
2.5. Experimental Program....................................................................................... 13
2.5.1. Test Matrix ................................................................................................. 13
2.5.1.1. Reference Specimens ........................................................................... 14
2.5.1.2. Rubber Confined Specimens................................................................ 14
2.5.2. Testing Procedure ....................................................................................... 18
2.6. Experimental Results......................................................................................... 21
2.6.1. Unconfined Concrete .................................................................................. 21
2.6.1.1. Observed Damage ................................................................................ 22
2.6.1.2. Mechanical Properties .......................................................................... 23
2.6.1.3. Full Stress-Strain Relationship ............................................................ 24
2.6.3. Rubber Confined Concrete ......................................................................... 25
2.6.3.1. Observed Damage ................................................................................ 25
2.6.3.2. Mechanical Properties .......................................................................... 32
2.6.3.3. Full Stress-Strain Relationship ............................................................ 33
2.7. Stress-Strain Model for Rubber-Confined Concrete ......................................... 36
2.7.1. Introduction ................................................................................................ 36
2.7.2. Proposed Stress-Strain Models ................................................................... 36
2.7.3. Confining Pressure ..................................................................................... 37
2.7.4. Residual Strength ........................................................................................ 38

vii
2.7.5. Ultimate Strain ............................................................................................ 39
2.7.6. Strain Corresponding to Initiation of Residual Strength ............................ 40
2.7.7. Nonlinear Stress-Strain Model ................................................................... 41
2.7.8. Simplified Stress-Strain Model .................................................................. 44
2.8. Comparison with other Confinements .............................................................. 48
2.9. Summary and Conclusions ................................................................................ 50
2.10. References ....................................................................................................... 51
CHAPTER 3. BUCKLING RESTRAINED REINFORCEMENT ............................. 54
3.1. Introduction ....................................................................................................... 54
3.2. Research Objectives .......................................................................................... 55
3.3. Buckling Restrained Reinforcement (BRR) ...................................................... 55
3.4. Past Research on External Energy Dissipaters .................................................. 56
3.4.1. Introduction ................................................................................................ 56
3.4.2. External Energy Dissipaters ....................................................................... 57
3.4.2.1. Study by Marriot et al. (2009).............................................................. 57
3.4.2.2. Study by Mesa and Dario (2010) ......................................................... 58
3.4.2.3. Study by Mashal et al. (2014) .............................................................. 59
3.4.2.4. Study by Guerrini et al. (2014) ............................................................ 59
3.4.2.5. Study by Guo et al. (2015) ................................................................... 61
3.4.2.6. Study by White and Palermo (2016) .................................................... 61
3.4.2.7. Study by Sarti et al. (2016) .................................................................. 62

viii
3.4.3. Use of External Energy Dissipaters in Concrete Elements ........................ 63
3.4.3.1. Study by Guerrini et al. (2014) ............................................................ 63
3.4.3.2. Study by Marriott et al. (2009) ............................................................ 64
3.4.3.3. Study by Marriott et al. (2011) ............................................................ 65
3.4.3.4. Study by Guo et al. (2015) ................................................................... 65
3.4.3.5. Study by Mashal et al. (2014) .............................................................. 65
3.4. Experimental Program....................................................................................... 66
3.4.1. Introduction ................................................................................................ 66
3.4.2. Test Matrix ................................................................................................. 67
3.4.3. Material Properties ..................................................................................... 68
3.4.3.1. Steel Tube ............................................................................................ 68
3.4.3.2. Reinforcing Steel Bar ........................................................................... 68
3.4.3.3. Non-Shrink Grout ................................................................................ 68
3.4.4. Construction of Buckling Restrained Reinforcement (BRR) ..................... 69
3.4.5 Test set up and Loading Protocol ................................................................ 70
3.5. Experimental Results......................................................................................... 72
3.5.1. Material Properties ..................................................................................... 72
3.5.2 Performance of Buckling Restrained Reinforcement .................................. 72
3.5.2.1. Failure Mechanism............................................................................... 72
3.5.2.2. Stress-Strain Relationship .................................................................... 75
3.6. Summary and Conclusions ................................................................................ 79

ix
3.7 References .......................................................................................................... 81
CHAPTER 4. BEHAVIOR OF MODERN BEAM-COLUMN CONNECTIONS ..... 83
4.1. Introduction ....................................................................................................... 83
4.2. Research Objectives .......................................................................................... 84
4.3. Past Studies on Beam-Column Joint ................................................................. 84
4.3.1. Study by Paulay and Park (1978) ............................................................... 84
4.3.2. Study by Durrani and Wight (1985) ........................................................... 84
4.3.3. Study by Ehsani and Wight (1985)............................................................. 85
4.3.4. Study by Ehsani et al. (1987)...................................................................... 85
4.3.5. Study by Fujii and Morita (1991) ............................................................... 86
4.3.6. Study by Joh et al. (1991) ........................................................................... 86
4.3.7. Study by Scott (1996) ................................................................................. 86
4.3.8. Study by Hwang et al. (2005) ..................................................................... 87
4.3.9. Study by Tsonos (2007) .............................................................................. 87
4.3.10. Study by Walsh et al. (2016) .................................................................... 88
4.4. Experimental Setup for Past Studies ................................................................. 88
4.5. Design of Prototype RC Building ..................................................................... 92
4.5.1. Special Moment Resisting Frames ............................................................. 92
4.5.2. Design of Nine-Story Special Moment-Resisting RC Building ................. 93
4.5.3. Design of Prototype Beam-Column Connection ........................................ 97
4.5.4. Design of Half-Scale Beam-Column Specimen ......................................... 98

x
4.6. Experimental Program..................................................................................... 101
4.6.1. Material Properties ................................................................................... 101
4.6.2. Pretest Load and Displacement Relationship ........................................... 102
4.6.3. Construction of Test Specimen ................................................................. 103
4.6.4. Test Setup ................................................................................................. 107
4.6.5. Instrumentations ....................................................................................... 110
4.6.6. Loading Protocol ...................................................................................... 113
4.7. Experimental Results....................................................................................... 114
4.7.1 Compressive Strength of Concrete ............................................................ 114
4.7.2. Strength of Reinforcing Bar ..................................................................... 114
4.7.3. Observed Damage ..................................................................................... 116
4.7.4. Force-Displacement Relationship ............................................................. 124
4.7.5. Moment-Curvature Relationship .............................................................. 128
4.7.6. Strain Profile ............................................................................................. 130
4.7.7. Residual Displacements ............................................................................ 131
4.8. Conclusions ..................................................................................................... 133
4.9. References ....................................................................................................... 134
CHAPTER 5. ANALYTICAL STUDIES ................................................................. 138
5.1. Introduction ..................................................................................................... 138
5.2. Analytical Studies of Beam-Column Test Specimen ...................................... 138
5.2.1. Description of Beam-Column Specimen Analytical Model ..................... 139

xi
5.2.2. Analysis Results ....................................................................................... 142
5.3. Analytical Studies of Rubber Confined RC Bridge Columns ......................... 144
5.3.1. Description of Bridge Column Analytical Model .................................... 145
5.3.2. Analytical Results ..................................................................................... 150
5.5. References ....................................................................................................... 152
CHAPTER 6. SUMMARY AND CONCLUSIONS ................................................. 154
6.1. Summary ......................................................................................................... 154
6.2. Conclusions ..................................................................................................... 156
6.2.1. Rubber Confined Concrete ....................................................................... 156
6.2.2. Buckling Restrained Reinforcement (BRR) ............................................. 157
6.2.3. Beam-Column Connection ....................................................................... 157

xii
LIST OF FIGURES
Figure 2-1. Top view of rubber-coated concrete sample ............................................... 6
Figure 2-2. Typical stress-strain curves: (a) confining materials (b) confined concrete8
Figure 2-3. Stress-strain relationship for unconfined and steel-confined concrete (Kent
and Park, 1971) .............................................................................................................. 9
Figure 2-4. Stress-strain relationship of FRP-confined normal strength concrete using
actively confined concrete model (Lim and Ozbakkaloglu, 2014) .............................. 13
Figure 2-5. Casting of concrete cylinders .................................................................... 14
Figure 2-6. Concrete surface preparation for two specimens ...................................... 15
Figure 2-7. Thin layer of base coat on concrete ........................................................... 16
Figure 2-8. Spraying rubber on concrete specimens .................................................... 16
Figure 2-9. Rubber thickness measurement ................................................................. 17
Figure 2-10. Rubber-coated concrete specimens ......................................................... 17
Figure 2-11. Test setup for concrete compressive testing............................................ 19
Figure 2-12. Complete stress-strain relationship ......................................................... 21
Figure 2-13. Typical crack patterns for normal concrete cylinders subjected to
uniaxial loads ............................................................................................................... 22
Figure 2-14. Failure of unconfined concrete specimens at different ages ................... 23
Figure 2-15. Measured and calculated stress-strain relationships for unconfined
concrete ........................................................................................................................ 24
Figure 2-16. Damage state of rubber confined concrete .............................................. 25
Figure 2-17. Failure of rubber confined concrete with different thicknesses .............. 26
Figure 2-18. Damage of confined concrete with a thick layer of rubber ..................... 28
Figure 2-19. Failure of rubber confined concrete at 18% strain .................................. 28
Figure 2-20. Failure of all rubber confined concrete specimens ................................. 29
xiii
Figure 2-21. Strain capacity of rubber confined concrete at different stages during
uniaxial compression test: Specimen LCC3-4 ............................................................. 30
Figure 2-22. Strain capacity of rubber confined concrete at different stages during
uniaxial compression test: Specimen LCC9-2 ............................................................. 31
Figure 2-23. Complete stress-strain relationship for conventional and rubber confined
concrete ........................................................................................................................ 34
Figure 2-24. Stress-strain relationships for rubber confined concrete specimens with
3-mm nominal thickness .............................................................................................. 34
Figure 2-25. Stress-strain relationships for rubber confined concrete specimens with
6-mm nominal thickness .............................................................................................. 35
Figure 2-26. Stress-strain relationship for rubber confined concrete specimens with 9-
mm nominal thickness ................................................................................................. 35
Figure 2-27. Nonlinear stress-strain relationship for rubber confined concrete .......... 36
Figure 2-28. Simplified stress-strain relationship for rubber confined concrete ......... 37
Figure 2-29. Confining pressure for rubber confined concrete .................................... 38
Figure 2-30. Residual strength vs. confining pressure for rubber confined concrete .. 39
Figure 2-31. Stress-strain relationships for 13 rubber confined concrete specimens
with a minimum rubber thickness of 0.05 in. (1.2 mm) .............................................. 40
Figure 2-32. Post-peak stress-strain relationship for 18 rubber confined concrete
specimens ..................................................................................................................... 41
Figure 2-33. Measured and calculated (nonlinear model) stress-strain relationships for
rubber confined concrete for specimen LCC3-4 .......................................................... 43
Figure 2-34. Measured and calculated (nonlinear model) stress-strain relationships for
rubber confined concrete for specimen LCC6-3 .......................................................... 43

xiv
Figure 2-35. Measured and calculated (nonlinear model) stress-strain relationships for
rubber confined concrete for specimen LCC9-4 .......................................................... 44
Figure 2-36. Measured and calculated (nonlinear model) stress-strain relationships for
rubber confined concrete for specimen LCC9-5 .......................................................... 44
Figure 2-37. Measured and calculated (nonlinear model) stress-strain relationships for
rubber confined concrete for specimen LCC3-4 .......................................................... 46
Figure 2-38. Measured and calculated (nonlinear model) stress-strain relationships for
rubber confined concrete for specimen LCC6-3 .......................................................... 46
Figure 2-39. Measured and calculated (nonlinear model) stress-strain relationships for
rubber confined concrete for specimen LCC9-4 .......................................................... 47
Figure 2-40. Measured and calculated (nonlinear model) stress-strain relationships for
rubber confined concrete for specimen LCC9-5 .......................................................... 47
Figure 2-41. Stress-strain relationship of concrete by various confinement methods . 49
Figure 3-1. Hysteretic behavior of concrete columns (Guerrini et al., 2015) .............. 56
Figure 3-2. Energy dissipaters for rocking systems (Marriott et al., 2011) ................. 56
Figure 3-3. Cyclic behavior of external energy dissipater (Mesa and Dario, 2010) .... 58
Figure 3-4. Stress-strain and force displacement relationship of the external
dissipaters (Mesa and Dario, 2010) ............................................................................. 59
Figure 3-5. Geometric configuration for buckling restrained energy dissipaters
(Guerrini et al., 2014)................................................................................................... 60
Figure 3-6. Hysteretic behavior of buckling restrained energy dissipaters (Guerrini et
al., 2014) ...................................................................................................................... 60
Figure 3-7. Hysteretic behavior of external energy dissipaters constructed with
aluminum bar (Guo et al., 2015) .................................................................................. 61

xv
Figure 3-8. Geometric configuration of external energy dissipaters (White & Palermo,
2016) ............................................................................................................................ 62
Figure 3-9. Geometric configuration for dog-bone energy dissipaters (Sarti et al.,
2016) ............................................................................................................................ 63
Figure 3-10. Structural behavior of dual-shell hybrid rocking bridge column under
reverse cyclic loading (Guerrini et al., 2014) .............................................................. 64
Figure 3.11. Force-displacement relationship of ABC low-damage and high-damage
bridge piers (Mashal et al., 2014) ................................................................................ 66
Figure 3-12. Geometric configuration of Buckling Restrained Reinforcement .......... 67
Figure 3-13. Construction of BRR specimens ............................................................. 70
Figure 3-14. BRR specimens after pouring non-shrink grout...................................... 70
Figure 3-15. Schematic Elevation view of BRR test setup .......................................... 71
Figure3-16. Photograph of BRR test setup .................................................................. 71
Figure 3-17. Failure of deformed reinforcing bars with and without steel nuts .......... 73
Figure 3-18. Failure of BRR specimens ...................................................................... 74
Figure 3-19. Stress-strain relationship for deformed reinforcing bars ......................... 75
Figure 3-20. Stress-strain relationship of deformed reinforcing bars with nuts .......... 76
Figure 3-21. Stress-strain response of all BRR devices ............................................... 77
Figure 3-22. Stress-strain relationship of buckling restrained reinforcement (BRR)
devices with different unsupported length ................................................................... 78
Figure 3-23. Stress-strain relationship of buckling restrained reinforcement (BRR)
with different overall length of deformed bars ............................................................ 78
Figure 3-24. Stress-strain relationship of buckling restrained reinforcement (BRR)
with different thickness of tube .................................................................................... 79

xvi
Figure 3-25. Behavior of buckling restrained reinforcement (BRR) device due to
cyclic loading ............................................................................................................... 79
Figure 4-1. Test setup for exterior beam-column connection (Youssef et al., 2008) .. 89
Figure 4-2. Applied load and static equilibrium for exterior beam-column connection
(Alva et al. 2013) ......................................................................................................... 89
Figure 4-3. Test setup for exterior beam-column connection (Tsonos, 1999) ............. 90
Figure 4-4. Experimental setup for interior beam-column connection (Quintero-
Febres, 2001)................................................................................................................ 90
Figure 4-5. Test setup for interior beam-column connection (Li et at., 2009) ............ 91
Figure 4-6. Actual boundary condition for exterior beam-column connection ........... 91
Figure 4-7. Collapse mechanism for moment-resisting frames ................................... 93
Figure 4-8. Plan view of nine-story RC building ......................................................... 94
Figure 4-9. Elevation of nine-story building................................................................ 95
Figure 4-10. Detailing of prototype exterior beam-column joint ................................ 98
Figure 4-11. Confined concrete stress-strain relationship for prototype and half-scale
columns ........................................................................................................................ 99
Figure 4-12. Confined concrete stress-strain relationship for prototype and half-scale
beams ......................................................................................................................... 100
Figure 4-13. Moment–curvature relationships for beam and column of test model .. 100
Figure 4-14. Detailing of test beam-column model ................................................... 101
Figure 4-15. Pretest lateral force-displacement relationship for beam-column test
model.......................................................................................................................... 103
Figure 4-16. Steel cage and formwork ....................................................................... 104
Figure 4-17. Slump of ready mix concrete ................................................................ 104
Figure 4-18. Concrete pouring for beam-column test specimen ................................ 105

xvii
Figure 4-19. Curing of beam-column test specimen .................................................. 106
Figure 4-20. Beam-column test specimen ................................................................. 106
Figure 4-21. Test setup for beam-column specimen .................................................. 108
Figure 4-22. Axial load test setup for beam-column specimen ................................. 109
Figure 4-23. Photograph of test setup for beam-column specimen ........................... 110
Figure 4-24. Location of strain gauges in beam-column specimen ........................... 111
Figure 4-25. Installation of strain gauges in beam-column specimen ....................... 111
Figure 4-26. Installation of LVDT, String POT, and Load Cell in beam-column
specimen .................................................................................................................... 112
Figure 4-27. Complete displacement-based loading protocol for beam-column
specimen .................................................................................................................... 113
Figure 4-28. Measured stress-strain relationship for No. 5 deformed reinforcing steel
bar .............................................................................................................................. 115
Figure 4-29. Measured stress-strain relationship for No. 4 deformed reinforcing steel
bar .............................................................................................................................. 115
Figure 4-30. Measured stress-strain relationship for No. 3 deformed reinforcing steel
bar .............................................................................................................................. 116
Figure 4-31. Cracks pattern for beam-column joint at 0.09 and 0.18% drift ratio .... 118
Figure 4-32. Cracks pattern for beam-column joint at 0.36 and 0.55% drift ratio .... 119
Figure 4-33. Cracks pattern for beam-column joint at 0.73 and 1.09% drift ratio .... 120
Figure 4-34. Cracks pattern for beam-column joint at 1.46 and 2.19% drift ratio .... 121
Figure 4-35. Cracks pattern for beam-column joint at 2.9 and 3.64% drift ratio ...... 122
Figure 4-36. Cracks pattern for beam-column joint after testing ............................... 123
Figure 4-37. Lateral force-displacement relationship of beam-column specimen .... 125

xviii
Figure 4-38. Force-displacement envelope for half-scale exterior beam-column joint
.................................................................................................................................... 126
Figure 4-39. Horizontal displacement of beam roller support ................................... 127
Figure 4-40. Column face rotation ............................................................................. 127
Figure 4-41. Beam end reaction for beam-column specimen .................................... 128
Figure 4-42. Moment - rotation relationship for beam at column interface .............. 129
Figure 4-43. Curvature profile for beam at different drift ratio ................................. 129
Figure 4-44. Strain profile for beam longitudinal reinforcement .............................. 130
Figure 4-45. Residual displacement of beam-column joint ....................................... 131
Figure 4-46. Damage of beam-column specimen at zero forces ............................... 132
Figure 5-1. Beam-column joint analytical model ...................................................... 140
Figure 5-2. Calculated and measured force-displacement relationships for beam-
column test model ...................................................................................................... 143
Figure 5-3. Calculated and measured force-displacement hysteresis for beam-column
test model ................................................................................................................... 144
Figure 5-4. Bridge Column Analytical Model ........................................................... 146
Figure 5-5. Stress-strain relationship for core concrete of low ductile bridge column
(𝝁 = 𝟑) ....................................................................................................................... 147
Figure 5-6. Stress-strain relationship for core concrete of moderate ductile bridge
column (𝝁 = 𝟓) .......................................................................................................... 147
Figure 5-7. Stress-strain relationship for core concrete of high ductile bridge column
(𝝁 = 𝟕) ....................................................................................................................... 148
Figure 5-8. Force-displacement relationship of low ductile bridge column (𝝁 = 𝟑) 151
Figure 5-9. Force-displacement relationship of moderate ductile bridge column (𝝁 =
𝟓) ................................................................................................................................ 151

xix
Figure 5-10. Force-displacement relationship of high ductile bridge column (𝝁 = 𝟕)
.................................................................................................................................... 152

xx
LIST OF TABLES
Table 2-1. Typical chemical and physical properties of PX-3350 (Technical data sheet
– PX-3350, 2016) ........................................................................................................... 7
Table 2-2. Typical properties of LINE-X XPM (Technical data sheet- LINEX- X
XPM, 2016).................................................................................................................... 7
Table 2-3. Test matrix for conventional and rubber confined concrete ....................... 13
Table 2-4. Compressive strength of unconfined concrete ........................................... 24
Table 2-5. Summary of test results for rubber confined concrete specimens .............. 26
Table 2-6. Compressive strength of rubber coated concrete cylinder specimens (6" X
12") with different thickness and at different ages ...................................................... 32
Table 2-7. Column geometry and material properties ................................................. 48
Table 2-8. Properties of bridge column with various confinement methods ............... 50
Table 3-1. Test matrix for Buckling Restrained Reinforcement.................................. 67
Table 3-2. Mechanical properties of steel tube in BRR ............................................... 68
Table 3-3. Mechanical properties of reinforcing steel bars ......................................... 68
Table 3-4. Strength of non-shrink grout at different conditions. ................................. 69
Table 3-5. Measured compressive strength of non-shrink grout ................................. 72
Table 3-6. Stress-strain characteristics of deformed reinforcing bars under
compressive loads ........................................................................................................ 75
Table 3-7. Stress-strain characteristics of deformed reinforcing bars enclosed in nuts
...................................................................................................................................... 76
Table 3-8. Stress-strain characteristics of BRR .......................................................... 77
Table 4-1. Configuration of proposed nine-story RC building .................................... 95
Table 4-2. Dead and Live loads for proposed nine-story RC building ........................ 96
Table 4-3. Seismic analysis of Nine-Story RC building .............................................. 96

xxi
Table 4-4. Displacement requirements ........................................................................ 96
Table 4-5. Load combinations ..................................................................................... 97
Table 4-6. Final dimension of structural elements for story RC building ................... 97
Table 4-7. Typical properties of reinforcing steel bars .............................................. 102
Table 4-8. Typical properties of deformed wire ........................................................ 102
Table 4-9. Compressive strength of concrete ............................................................ 114
Table 4-10. Measured mechanical properties for ASTM A706 steel bars ................ 114
Table 4-11. Measured mechanical properties for ASTM A496 deformed wires ...... 115
Table 5-1. Parameters for half-scale beam-column test model.................................. 139
Table 5-2. Model parameters for unconfined concrete used in beam-column joint .. 140
Table 5-3. Reinforcing steel (Longitudinal steel) material model properties used in
beam-column analytical model .................................................................................. 141
Table 5-4. Fibers used in beam-column analytical model ......................................... 142
Table 5-5. Measured and calculated response of beam-column test model .............. 143
Table 5-6. Model parameters for conventional steel-confined circular bridge columns
.................................................................................................................................... 145
Table 5-7. Conventional concrete properties assumed in bridge columns ................ 146
Table 5-8. Reinforcing steel material model properties used in bridge columns ...... 148
Table 5-9. Rubber confined concrete properties used in bridge columns.................. 148
Table 5-10. Concrete cover and steel fiber properties used in bridge column models
.................................................................................................................................... 149
Table 5-11. Core concrete fiber properties used in bridge column models ............... 149
Table 5.12. Displacement ductility capacity of bridge columns with and without
rubber confinement .................................................................................................... 152

xxii
ABSTRACT
APPLICATION OF NEW MATERIALS AND INNOVATIVE DETAILING FOR
REINFORCED CONCRETE STRUCTURES
ISHTIAQUE AHMED TUHIN
2016
Confinement enhances mechanical properties of concrete sections specifically
its strain capacity thus results is higher displacement capacity for reinforced concrete
members. Even though the behavior of concrete confined with external jackets has
been extensively investigated in previous studies, the use of rubber-based material as
an external confinement is new, and was investigated for the first time in the present
study. Thirty concrete cylinders were tested under uniaxial compression to
investigate mechanical properties of rubber confined concrete. It was found that
rubber does not increase the strength of confined concrete. However, the strain
capacity of rubber confined concrete was more than 10%, equal to or higher than
reinforcing steel bar tensile strain capacity. This unique property may make this type
of confinement a viable retrofit or rehabilitation method to increase the ductility of
low ductile members and structures in high seismic regions.
Repair of ductile components is often inevitable under strong earthquakes
mainly because of concrete failure, significant yielding of reinforcement, or large
residual lateral deformations. In this case, the structure needs to be demolished and
reconstructed as the repair of reinforced concrete (RC) structures is complex when
longitudinal reinforcement of ductile member fractures. External reinforcing bars are
capable to increase energy dissipation of rocking columns and frames. Deformed

xxiii
reinforcing steel bars without any reduction of the section enclosed in steel pipes was
proposed as external energy dissipaters, entitled as buckling restrained reinforcement
(BRR) in the present study. The test results showed that the compressive strain of
BRR at the peak stress can exceed 5%, which will be sufficient in most practical cases
since the strain of compressive reinforcement in a concrete section is usually
controlled by the core concrete strains.
Experimental and analytical investigations were carried out on RC beam-
column specimen under cyclic loading. A nine-story RC building was analyzed and
designed as special moment resisting frame (SMRF). A half-scale exterior beam-
column joint of the first floor of the prototype frame was tested to investigate the
seismic behavior of the specimen. The test result showed that the column
longitudinal and transverse reinforcement did not yield under the cyclic loading and
the damage of column was insignificant. Almost all cracks were formed in the beam
and more cracks were observed after drift ratio of 1.46%. The beam longitudinal
reinforcing bars yielded then fractured at a high drift ratio (3.5%). The beam-column
specimen showed 75% higher lateral drift capacity than the ASCE allowable drift
ratio, which was 2% for this building. The test results confirmed that the modern
seismic design codes ensure large displacement capacities for SMRF without any
premature failure.
1
CHAPTER 1. INTRODUCTION
Experimental and analytical studies on three different topics were carried out
in the present study to investigate the feasibility of new materials and innovative
detailing for reinforced concrete structures to improve their seismic performance. A
brief description of the topics covered in this study and the objectives are discussed
herein.
1.1. Project Description
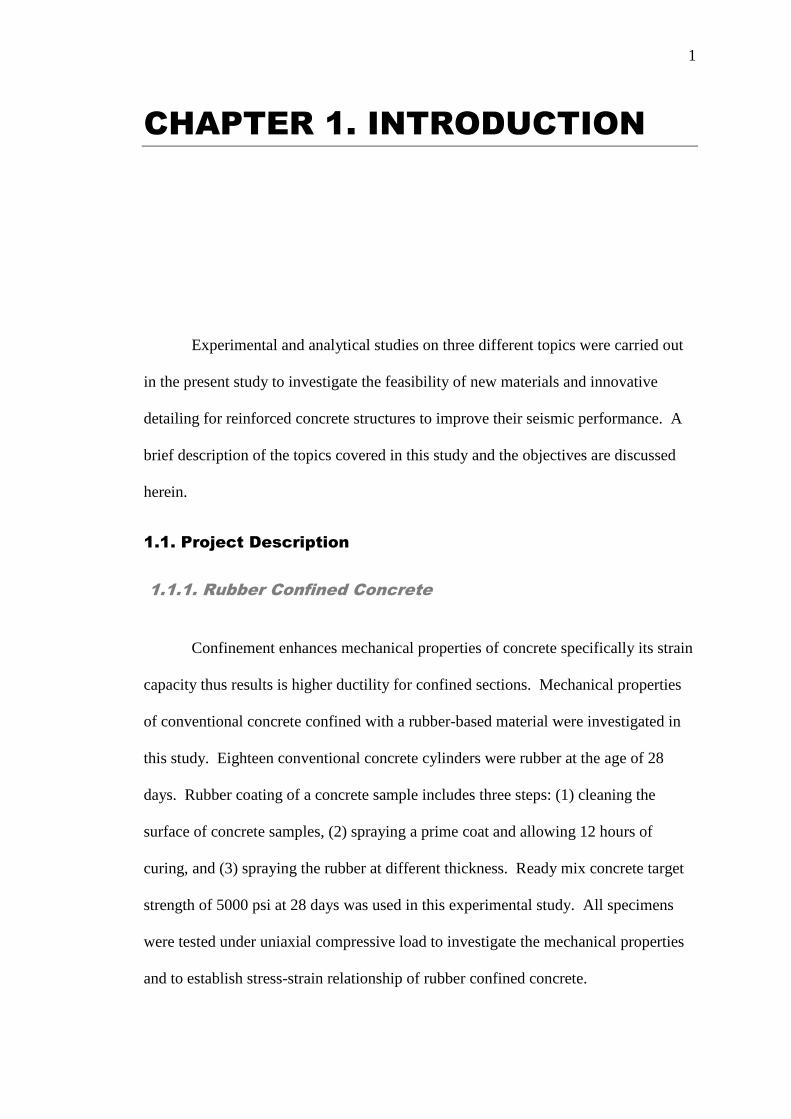
1.1.1. Rubber Confined Concrete
Confinement enhances mechanical properties of concrete specifically its strain
capacity thus results is higher ductility for confined sections. Mechanical properties
of conventional concrete confined with a rubber-based material were investigated in
this study. Eighteen conventional concrete cylinders were rubber at the age of 28
days. Rubber coating of a concrete sample includes three steps: (1) cleaning the
surface of concrete samples, (2) spraying a prime coat and allowing 12 hours of
curing, and (3) spraying the rubber at different thickness. Ready mix concrete target
strength of 5000 psi at 28 days was used in this experimental study. All specimens
were tested under uniaxial compressive load to investigate the mechanical properties
and to establish stress-strain relationship of rubber confined concrete.

2
1.1.2. Buckling Restrained Reinforcement
Reinforced concrete (RC) bridges and buildings are currently designed to
exhibit large displacement capacities during earthquake excitation through yielding of
reinforcement. External reinforcing bars have been used in previous studies to
increase energy dissipation of rocking columns and frames. With some modification,
this might be used as longitudinal reinforcement of RC sections thus RC structures
can be repaired in a few hours after an event without the need of total replacement of
the structure. Feasibility and performance of a new type of external energy dissipater,
which is referred to as “buckling restrained reinforcement (BRR)” was investigated in
this study. A series of BRR specimens were constructed and tested under monotonic
and cyclic axial compressive loading to failure. Two different sizes of deformed steel
bars, No. 4 and No. 8, were used in this experimental investigation. Steel tubes with
different geometry were used to prevent buckling of reinforcement and were filled
with non-shrink grout.
1.1.3. Behavior of Modern Beam-Column Connection
Several studies have investigated the seismic performance of moment resisting
frames (SMRF). However, none of these studies successfully included the actual
boundary conditions in their experimental setup. Furthermore, experimental data on
the performance of SMRFs designed with current codes is limited.
A nine-story SMRF RC building located in a high seismic region (Los
Angeles, US) was designed following current codes. One exterior beam-column joint
of the first floor of the building was selected to investigate the seismic performance of
the joint in through experiment. A new setup was designed to include the actual

3
boundary condition, which allows both columns and beams to sway. The half-scale
beam-column specimen was tested to failure under simulated earthquake cyclic
loading.
1.2. Research Objectives and Scopes
1.2.1. Rubber Confined Concrete
The main goal of this study was to investigate the stress-strain behavior of
conventional concrete confined with a new rubber-based material. Stress-strain
relationship was established for this type of confinement to be used in the repair,
retrofit, or rehabilitation of low-ductile or substandard bridge columns.
1.2.2. Buckling Restrained Reinforcement
The main objective of this study was to experimentally investigate the
feasibility and performance of conventional reinforcing steel bars as an external
energy dissipater instead of dog-bone mild steel or aluminum bars. The application of
conventional reinforcement as external energy dissipater will save time and money
compared to dog-bone energy dissipaters due to machining.
1.2.3. Behavior of Modern Beam-Column Connection
The main goal of this experimental study was to (1) simulate the actual
boundary conditions of beam-column specimens in experiments, and (2) investigate
the seismic performance of special moment-resisting beam-column joints designed
based on the current codes.

4
1.3. Document Organization
This study included multiple experimental and analytical studies to assess the
feasibility of new materials or detailing for reinforced concrete buildings and bridges
subjected to seismic loading. The thesis includes six chapters. Chapter 1 presents a
brief description of the work done and the scope of each study. Chapter 2 presents the
experimental investigation of rubber confined concrete to observe their mechanical
properties and stress-strain relationship. Chapter 3 presents experimental
investigation of external energy dissipaters to observe their compressive behavior and
anti-buckling efficiency. Chapter 4 presents the experimental results of external
beam-column connection, which was selected from analyzed nine story reinforced
concrete building. Chapter 5 presents the OpenSees model of conventional steel
confined prototype bridge column provides rubber as external jacket. Also presents
the OpenSees model of exterior beam-column connection. Chapter 6 presents the
exclusive conclusions of behavior of rubber confined concrete, buckling restrained
reinforcement, and external beam-column joint.

5
CHAPTER 2. RUBBER
CONFINED CONCRETE
2.1. Introduction
Concrete can be confined by using transverse reinforcement inside the section
or external jacketing usually made of concrete, steel, or fiber reinforced polymer
(FRP). Confinement enhances mechanical properties of concrete specifically its
strain capacity thus results is higher ductility for confined sections. Mechanical
properties of conventional concrete confined with a new rubber-based material, Line-
X, are investigated in this chapter. Since, rubber will be sprayed to concrete after
casting, the confined concrete may refer to as “rubber-coated concrete” in this study.
2.2. Research Objectives
Even though the behavior of FRP-confined concrete has been extensively
investigated, the use of rubber as an external confinement was new, and was
investigated for the first time in the present study. The main goal of this experimental
study was to investigate the behavior of conventional concrete confined with a new
rubber-based material. Mechanical properties of the rubber coated concrete was
established and a stress-strain material model was proposed.

6
2.3. Properties of Rubber
The coating used in the present study (Fig. 2-1) consisted of an outer shell
made with a layer of rubber named PX-3350, and a bed layer of LINE-X XPM to
bond rubber (PX-3350) to concrete.
Figure 2-1. Top view of rubber-coated concrete sample
PX-3350 is a protective and durable elastomer that has been used for various
applications (e.g. protect car beds, floors, concrete walls against abrasion, impact, and
corrosion). PX-3350 is made with two components: 100% high performance aromatic
polyurea as hardener, and 100% of Zero Volatile Organic Compounds (VOC) as
resin. The two components are sprayed on a surface with high pressure for proper
mixing and best polymerization results. In addition to providing protection, this
material is moisture insensitive because of its pure polyurea chemistry. PX-3350
offers good adhesion properties to properly prepared substrates. PX-3350 also
exhibits good resistance against chemical and moisture. The typical chemical and
physical properties of this rubber composite are presented in Table 2-1. This material
shows fast reactivity and cure time without any catalyst. This type of elastomer is
usually used for blast mitigation, high performance protective coating applications,
and high chemical resistance applications (LINE-X Franchise Development
Company, 2016).
Rubber Coat (PX-3350)
Concrete
Thin Layer of LINE-X XPM

7
Table 2-1. Typical chemical and physical properties of PX-3350 (Technical data sheet – PX-3350,
2016)
*A = Hardener; B = Resin
LINE-X XPM is a coat with high concentration of resin (usually referred to as
high solid coat) used to bond polyurethane or polyurea elastomer to the substrate. It
also provides a clean surface for the rubber coat (PX-3350). The typical properties of
LINE-X XPM are presented in Table 2-2.
Table 2-2. Typical properties of LINE-X XPM (Technical data sheet- LINEX- X XPM, 2016)
2.4. Unconfined and Confined Concrete
The concrete axial stress and strain capacities can be increased by applying
compressive stress in the directions transverse to the axial load direction. Concrete
confinement can be improved by jacketing or wrapping a section with either fiber
reinforced polymer (FRP), steel, or concrete or by providing closely-spaced transverse
reinforcement (e.g. hoops, spirals, and ties) in the section. In past, extensive studies
Properties Typical Value
Mix Ratio (by volume) * 1A:1B
Viscosity (cPS) @ 77°F 1000 ± 100 (A) & 370 ± 100 (B)
Material Density @ 77°F 9.50 lbs/gal (A) & 8.40 lbs/gal (B)
Elongation 82 %
Flexural Strength 2630 psi
Modulus of Elasticity 56000 psi
Tear Strength 497 lbs/in.
Tensile Strength 3432 psi
Volume Resistance 2.3X10¹⁴ ohm cm.
Friction Coefficient 0.305 (static)
Properties Typical value
Solids by volume 65 % ± 2
Volatile Organic Compounds 0.83 lb/gal
Theoretical Coverage (DFT) 1040 ft2/gal
Number of Coats 1
Mix Ratio (by volume) 0.6 “A” : 1.0 “B”
Shelf Life @ 60 -90°F Part A-6 mos. Part B-12 mos.
Adhesion ASTM C297 (1750 – 1910 psi)
Salt Spray Test ASTM B117 (3,000 hours)
Pot life @ 90°F 1 ½ hours
Surface dry @ 70 -89°F 6 -10 hours

8
have been conducted to establish the stress-strain behavior of unconfined and
confined concretes under uniaxial compressive loading.
The complete stress-strain relationship has been developed in previous studies
for different confinement methods usually using basic properties of conventional
concrete such as the compressive strength (𝑓𝑐′ ), the strain at the peak stress (ɛ𝑜), and
the modulus of elasticity of concrete (𝐸𝑐). Previous studies (Nanni and Bradford,
1995; Samaan et al., 1998; Spoelstra and Monti, 1999; Wu et al., 2006; Jiang and Wu,
2012) concluded that the compressive stress-strain behavior of concrete mainly
depends on the degree of confinement and the type of confining materials. It has been
reported that for a section sufficiently confined with FRP, the confining pressure
constantly increases resulting in a constant increase in stresses until FRP ruptures
(Fig. 2-2). However, stress is sustained in steel-confined sections even after the
yielding of reinforcing steel bars reaches (Wu and Wei, 2014). Several stress-strain
models have been developed for various type of confinement. A brief review of the
most cited concrete confinement models is presented herein.
(a) (b)
Figure 2-2. Typical stress-strain curves: (a) confining materials (b) confined concrete
fcu′
fcc′
𝑓𝑐𝑐 fc
′
ꜪoꜪc Ꜫ𝑐′ Ꜫu Ꜫu Ꜫu Ꜫs Ꜫfu
fs
ffu
FRP
Stress
Str
ain
Steel
Unconfined
FRP confined (highconfining pressure)
FRP confined (lowconfining pressure)
Steelconfined
Str
ain
Stress

9
2.4.1. Steel-Confined Model by Kent and Park (1971)
Kent and Park (1971) developed a stress-strain relationship (Fig. 2-3) for both
unconfined and steel-confined concrete based on the Hognestad’s model (Hognested,
1951). Kent’s model better represents the post-peak behavior of confined concrete
compared to the Hognestad’s model. The relationship for unconfined concrete up to
peak stress is:
𝑓𝑐 = 𝑓𝑐′ [
2ɛ𝑐
ɛ𝑜− (
ɛ𝑐
ɛ𝑜)
2
] (2.1)
where, 𝑓𝑐′ is the compressive strength of unconfined concrete, ɛ𝑜 is the strain at the
peak stress, 𝑓𝑐 is the concrete stress at different strain (ɛ𝑐).
Figure 2-3. Stress-strain relationship for unconfined and steel-confined concrete (Kent and
Park, 1971)
The post-peak branch was assumed to be a straight line with a slope that was a
function of the concrete compressive strength:
𝑓𝑐 = 𝑓𝑐′ [− 𝑍(ɛ𝑐 − ɛ𝑜)] (2.2)

10
where, 𝑍 is the slope of straight line, to be calculated using Eq. 2.3; ɛ50𝑢 is the strain
corresponding to the stress equal to 50% of peak stress for unconfined concrete
calculated using Eq. 2.4.
𝑍 =0.5
ɛ50𝑢 − ɛ𝑜 (2.3)
ɛ50𝑢 =3 + 0.002𝑓𝑐
′
𝑓𝑐′ − 1000
(𝑓𝑐′ 𝑖𝑛 𝑝𝑠𝑖) (2.4)
For confined concrete, it was assumed that the ascending branch of stress-
strain model was the same as that for unconfined concrete but the post-peak branch
was modified based on an empirical equation (Eq. 2.5).
𝑓𝑐 = 𝑓𝑐′ [− 𝑍(ɛ𝑐 − ɛ𝑜)] (2.5)
𝑍 =0.5
ɛ50ℎ + ɛ50𝑢 − ɛ𝑜 (2.6)
𝜀50ℎ = 𝜀50𝑐 − 𝜀50𝑢 = 3
4 𝜌𝑠 √
𝑏"
𝑠 (2.7)
ɛ50𝑢 =3 + 0.002𝑓𝑐
′
𝑓𝑐′ − 1000
(𝑓𝑐′ 𝑖𝑛 𝑝𝑠𝑖) (2.8)
where ɛ50𝑐 and ɛ50𝑢 are the strains corresponding to the stress equal to 50% of peak
stress for confined and unconfined concrete, respectively, b" is the diameter of the
core concrete (area inside the stirrups), s is the stirrup spacing, and 𝜌𝑠 is the stirrup
volumetric ratio.

11
2.4.2. Steel-Confined Model by Popovics (1973)
Popovics (1973) proposed a simple equation for the stress-strain behavior of
both unconfined and steel-confined concrete using only three parameters
(𝑓𝑐′, ɛ𝑜 , 𝑎𝑛𝑑 𝐸𝑐 ).
𝑓𝑐
𝑓𝑐′
=𝑛
ɛ𝑐
ɛ𝑜
(𝑛 − 1) + (ɛ𝑐
ɛ𝑜)
𝑛
(2.9)
where, 𝑓𝑐′ is the compressive strength of unconfined concrete, ɛ𝑜 is the strain at peak
stress, and 𝐸𝑐is the modulus elasticity of concrete.
The power “n” can be expressed as a function of the concrete compressive strength.
For normal-weight concrete, n is
𝑛 = 0.4 ⨯ 10−3𝑓𝑐′ + 1.0 (2.10)
2.4.3. Steel-Confined Model by Mander et al. (1988)
Mander et al. (1988) proposed an equation to represent the stress-strain
relationship of both unconfined and steel-confined concrete as
𝑓𝑐 = 𝑓𝑐
′ 𝑋 𝑟
𝑟 − 1 + 𝑋𝑟 (2.11)
where, 𝑓𝑐′ is the concrete stress at peak. The term X and r are defined as
𝑋 = ɛ𝑜
ɛ𝑐 (2.12)
𝑟 = 𝐸𝑐
𝐸𝑐 − (𝑓𝑐
′
ɛ𝑐)
(2.13)

12
where, ɛ𝑐 is the strain corresponds to a concrete stress and 𝐸𝑐is the modulus elasticity
of concrete defined as
𝐸𝑐 = 57000 √𝑓𝑐′ (𝑓𝑐
′ 𝑖𝑛 𝑝𝑠𝑖)
2.4.4. FRP-Confined Model by Lim and Ozbakkaloglu (2014)
Lim and Ozbakkaloglu (2014) proposed a stress-strain relationship (Fig. 2-4)
for the FRP-confined concrete sections:
𝑓𝑐 = 𝑓𝑐𝑐
′ (ɛ𝑐𝑜
ɛ𝑐) 𝑟
𝑟 − 1 + (ɛ𝑐𝑜
ɛ𝑐)
𝑟 𝑖𝑓 0 ≤ ɛ𝑐 ≤ ɛ𝑜 (2.14)
𝑓𝑐 = 𝑓𝑐𝑐′ −
(𝑓𝑐𝑐′ − 𝑓𝑟
′)
1 +0.45
(ɛ𝑐 − ɛ𝑐𝑜 ɛ𝑓 − ɛ𝑐𝑜
)−2
𝑖𝑓 ɛ𝑐 > ɛ𝑐𝑜
(2.15)
where, 𝑓𝑐𝑐′ is the compressive strength of confined concrete, ɛ𝑐𝑜 is the strain at peak
stress, 𝑓𝑟′ is the residual strength of the confined concrete, ɛ𝑓 is the strain at the
beginning of the residual strength, and 𝑟 and 𝐸𝑐 :
𝑟 = 𝐸𝑐
𝐸𝑐 − (𝑓𝑐𝑐
′
ɛ𝑐𝑜)
(2.16)
𝐸𝑐 = 44000 √𝑓𝑐′ (𝑓𝑐
′ 𝑖𝑛 𝑝𝑠𝑖) (2.17)

13
Figure 2-4. Stress-strain relationship of FRP-confined normal strength concrete using actively
confined concrete model (Lim and Ozbakkaloglu, 2014)
2.5. Experimental Program
More than 30 concrete cylinders were casted and tested in the Concrete and
Materials Laboratory at South Dakota State University in the present study to
investigate the confinement of rubber confined concrete.
2.5.1. Test Matrix
A series of compressive tests were conducted for conventional and rubber-
coated concrete specimens (Table 2-3) to investigate the mechanical properties of
rubber confined concrete. A total of 30 concrete cylinders (6 by 12 in.) were casted
(Fig. 2-5) according to ASTM C192-12 (2012)
Table 2-3. Test matrix for conventional and rubber confined concrete
Specimen No. of
Specimens Specimen ID(a) Specimen Size Materials Properties
C 12 C1 to C12 6 by 12 in. Cylinder Ready Mix Concrete with
a strength of 5000 psi,
Rubber Coat: PX-3350
LC-C-3 6 LCC3-1 to LCC3-6 6 by 12 in. Cylinder
LC-C-6 6 LCC3-1 to LCC3-6 6 by 12 in. Cylinder
LC-C-9 6 LCC3-1 to LCC3-6 6 by 12 in. Cylinder (a) LCC3=LC-C-3-1: “LC” refers to rubber coated, “C” refers to conventional unconfined concrete, “3”
is the thickness of the rubber coat in mm, and 1 is the specimen number.

14
Figure 2-5. Casting of concrete cylinders
2.5.1.1. Reference Specimens
Of 30, 12 unconfined concrete specimens were tested as reference models.
Ready mix concrete was used in this study in which Type II cement and two different
types of admixture (WRDA 82 and MIRA 110) were used to achieve a compressive
strength of 5000 psi (34.5 MPa). The slump of concrete was measured as 3.5 in.
(88.9 mm) according to ASTM Standard C143 (2012).
2.5.1.2. Rubber Confined Specimens
Eighteen concrete cylinders were sprayed with rubber at the age of 28 days.
Two steps were followed to complete coating: First, concrete surface was cleaned
then and sprayed with the base layer, LINE-X XPM, then rubber, PX-3350, was
sprayed (Fig. 2-1). Note that before applying the base layer, the concrete specimens
were prepared with two different methods. In the first method, which was used in 16

15
samples, the concrete was simply cleaned ensuring that samples were free from any
dust or loose concrete materials. In the second method, the concrete surface
roughened by a hand grinder (Fig.2-6).
Rubber coating of a concrete sample generally included three steps: (1)
preparing (for the case that the concrete surface was roughened as shown in Fig. 2-6)
and cleaning the concrete surface, (2) spraying a base layer and allowing 12 hours of
curing (Fig. 2-7), and (3) spraying the rubber (Fig. 2-8) using a high pressure (2000
psi) plural component spray gun. The rubber coat started to dry within 3 to 5 seconds.
The entire coating process for 18 cylinders took approximately three hours. The
thickness of rubber was measured during and after spraying (Fig. 2-9). Figure 2-10
shows the completed rubber-coated concrete specimens.
Figure 2-6. Concrete surface preparation for two specimens

16
Figure 2-8. Spraying rubber on concrete specimens
Figure 2-7. Thin layer of base coat on concrete

17
Figure 2-9. Rubber thickness measurement
Figure 2-10. Rubber-coated concrete specimens

18
The thickness of the rubber coat was constantly measured by the manufacturer
to achieve the nominal thicknesses. However, the actual thickness of the rubber
varied from 0.05 (1.3 mm) to 0.25 in. (6.6 mm), which was measured after the testing
of the specimens, indicating that the manufacturer current method of measuring the
thickness needs to be enhanced for structural applications since the actual thickness
was 54% lower than the nominal thickness on average. After completion of the
coating process, rubber coated concrete specimens were placed in the laboratory with
standard room temperature.
2.5.2. Testing Procedure
The test samples were prepared according to ASTM Standard C617-12 (2012).
The preparation included capping all specimens with high-strength Sulphur
compound in order to provide full contact between the specimens and the head of
loading platens.

19
Instron 400RD hydraulic compression testing machine (Fig. 2-11) was used to
measure the compressive behavior of the test specimens. ASTM Standard C39-12
(2012) could not be directly used for the testing of the specimens since a slow-rate
displacement-based loading protocol was needed to measure the full stress-strain
relationship. The test was initiated with a displacement rate of 0.01 in./min (0.25
mm/min). When the displacement reached 0.20 in. (5.1 mm), which is approximately
(a) Complete test Setup
(b) Close-up of uncoated sample (c) Close-up of coated Sample
Figure 2-11. Test setup for concrete compressive testing

20
equal to 1.25% strain in the concrete, the displacement-rate was increased to 0.1
in./min (2.54 mm/min).
A load cell was used to measure the forces thus stresses and an eight-inch
extensometer with an accuracy of 10-6 in./in. and a 0.1-in. (2.54 mm) stroke was used
to measure the strains of the concrete samples. The readings were recorded until
failure. For rubber confined concrete, the extensometer was removed after reaching
the extensometer limit. Subsequently, strains measured from head displacements
were calibrated and used to obtain the complete stress-strain relationship (Fig. 2-12).
The calibration of strains based on the head displacement readings was done by
shifting the curve (Fig. 2-12b) to match the strain at the peak stress from the
extensometer readings. For conventional concrete, the extensometer was removed
when peak stress dropped approximately 70% of peak stress to avoid the damage of
extensometer.

21
(a) Stress-strain relationships based on
extensometer and head measurement
(b) Adjustment of stress-strain relationship
(c) Final stress-strain curve for rubber confined concrete
Figure 2-12. Complete stress-strain relationship
2.6. Experimental Results
2.6.1. Unconfined Concrete
A total of 12 uncoated concrete cylinders were tested at different ages to
measure either only the compressive strength or the complete stress-strain behavior as
reference for unconfined concrete.
0
1
2
3
4
5
6
7
0 0.005 0.01 0.015 0.02
Str
ess
(k
si)
Strain (in/in)
Head Displacement
Extensometer
0
1
2
3
4
5
6
7
0 0.005 0.01 0.015 0.02
Str
ess
(k
si)
Strain (in/in)
Head Displacement
Extensometer
0
5
10
15
20
25
30
35
40
45
0
1
2
3
4
5
6
7
0 0.02 0.04 0.06 0.08 0.1 0.12 0.14
Str
ess
(M
Pa
)
Str
ess
(k
si)
Strain (in/in)
Combined Curve

22
2.6.1.1. Observed Damage
Previous experimental studies (Van Mier,1984; Torrenti et al.,1993) showed
that concrete may fail under compression by cracking in either diagonal or parallel to
the loading direction as shown in Fig. 2-13. It is reposted that the degradation of the
concrete strength and stiffness subjected to uniaxial compression is because of
cracking and splitting.
Figure 2-14 shows the failure mode of unconfined concrete specimens at
different ages. Cracks were developed in many samples in the direction of the applied
load. However, some samples failed near the ends with diagonal splitting.
Figure 2-13. Typical crack patterns for normal concrete cylinders subjected to
uniaxial loads
45o-cracking at close to
the ends
Cracks parallel to loads
away from the ends

23
2.6.1.2. Mechanical Properties
Table 2-4 presents the strength of unconfined concrete specimens. Three
samples were tested for each specimen. Only the average of the test data was
reported.
(a) 28 days (b) 45 days
(c) 45 days (d) 72 days
Figure 2-14. Failure of unconfined concrete specimens at different ages

24
Table 2-4. Compressive strength of unconfined concrete
2.6.1.3. Full Stress-Strain Relationship
Full stress-strain relationships of the unconfined concrete specimens were
measured using the testing method described in the previous section. Figure 2-15
shows a sample of the measured stress-strain relationship for specimen C3. Included
in the figure is the calculated stress-strain relationship based on the Mander’s model
(Mander et al., 1988) for unconfined concrete. It can be seen that the unconfined
concrete residual strength at strains greater than 0.005 in./in. was negligible.
Figure 2-15. Measured and calculated stress-strain relationships for unconfined concrete
0
5
10
15
20
25
30
35
40
45
0
1
2
3
4
5
6
7
0 0.002 0.004 0.006 0.008 0.01 0.012 0.014
Str
ess
(MP
a)
Str
ess
(k
si)
Strain (in/in)
Specimen: C3
Measured
Calculated
Specimen ID Age (Days) Compressive Strength, 𝑓𝑐′ (psi)
C-1 28 5955
C-2 45 6045
C-3 72 6105
C-4 92 6510
C-5 133 6610
Note: Three samples were tested for each specimen. Only the average of the test data was
reported.
25
2.6.3. Rubber Confined Concrete
A total of 18 rubber confined concrete specimens with different coat
thicknesses (Table 2-3) were tested to determine the mechanical properties and to
observe the stress-strain behavior.
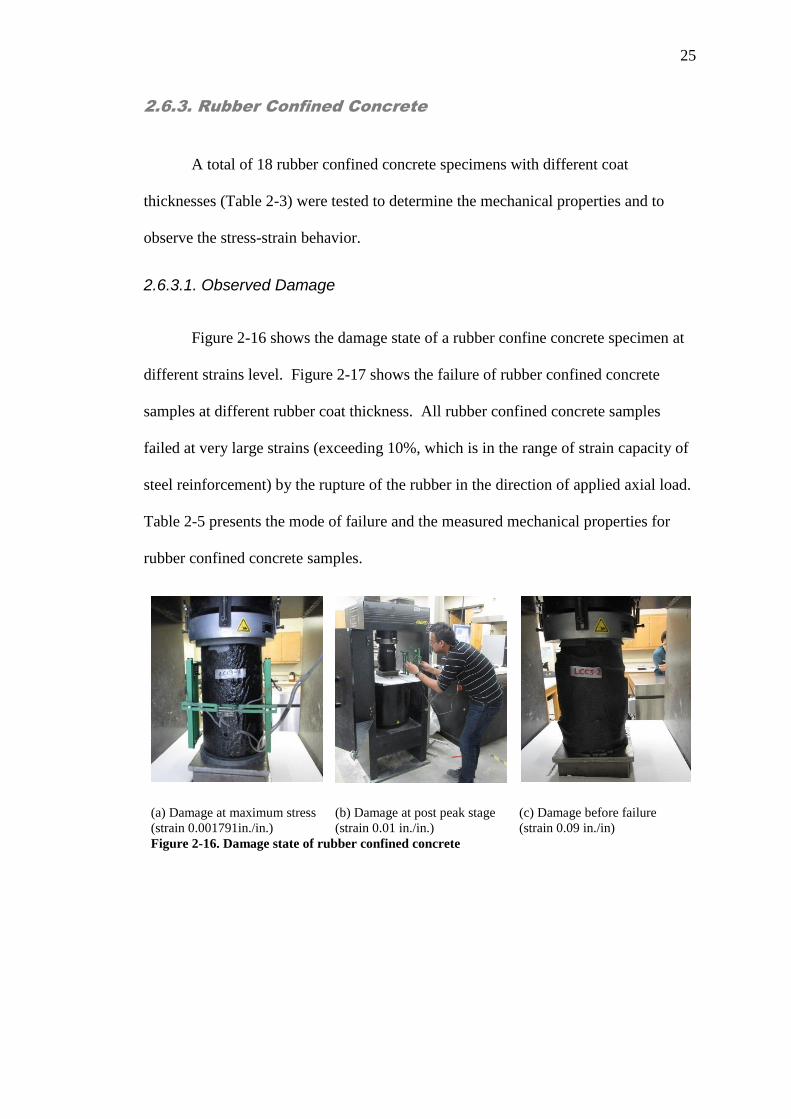
2.6.3.1. Observed Damage
Figure 2-16 shows the damage state of a rubber confine concrete specimen at
different strains level. Figure 2-17 shows the failure of rubber confined concrete
samples at different rubber coat thickness. All rubber confined concrete samples
failed at very large strains (exceeding 10%, which is in the range of strain capacity of
steel reinforcement) by the rupture of the rubber in the direction of applied axial load.
Table 2-5 presents the mode of failure and the measured mechanical properties for
rubber confined concrete samples.
(a) Damage at maximum stress
(strain 0.001791in./in.)
(b) Damage at post peak stage
(strain 0.01 in./in.)
(c) Damage before failure
(strain 0.09 in./in)
Figure 2-16. Damage state of rubber confined concrete

26
Table 2-5. Summary of test results for rubber confined concrete specimens
Spec. ID
Actual
Thickness,
t (in.)
Compressive
Strength,
𝑓𝑐′(ksi)
Residual
Strength,
𝑓𝑟′ (ksi)
Ultimate
Strain,
𝜀𝑐𝑢(in./in.)
Failure mode
LCC3-1 0.04 5.04 1.107 0.01847
Rubber rupture
approximately at the middle
of the specimens
LCC3-2 0.05 5.80 0.339 0.11142
LCC3-3 0.02 6.37 0.833 0.00765
LCC3-4 0.05 6.17 0.474 0.14631
LCC3-5 0.07 6.56 0.678 0.03823 Rubber rupture close to the
ends of specimens LCC3-6 0.05 6.61 0.585 0.08819
LCC6-1 0.06 6.38 0.614 0.12646
Rubber rupture
approximately at the middle
of the specimens
LCC6-2 0.06 6.67 0.547 0.05839
LCC6-3 0.09 6.58 0.651 0.09910
LCC6-4 0.10 6.15 0.572 0.10003
LCC6-5 0.10 5.85 0.506 0.07219
LCC6-6 0.08 5.75 0.802 0.20589
LCC9-1 0.19 6.40 1.211 0.20861
Rubber did not rupture since
the test was stopped to avoid
damage of the setup
LCC9-2 0.21 5.22 1.162 0.21197
LCC9-3 0.22 6.69 1.101 0.17824
LCC9-4 0.20 6.07 1.019 0.09469
LCC9-5 0.26 6.32 1.219 0.11955
LCC9-6 0.21 5.95 1.115 0.07368
In the specimens with a thick layer of rubber, the text and reading was stopped
to avoid damage of displacement head (Fig. 2-18). In these cases, the specimens was
adjusted and pushed to failure using a high displacement rate (Fig. 2-19). When the
specimens failed, samples of the rubber at the location of rupture were collected to
(a) Failure of rubber [t=0.125
in. (3 mm)]
(a) Failure of rubber [t=0.25 in.
(6 mm)]
(a) Failure of rubber [t=0.375
in. (9 mm)]
Figure 2-17. Failure of rubber confined concrete with different thicknesses

27
measure the thickness. The average of the measured (actual) thicknesses of the
samples was presented in Table 2-5. Figure 2-20 shows the failure of all rubber
confined concrete specimens.
Figure 2-21 and Figure 2-22 show that the rubber confinement appears
different at different strain capacity. It was observed that concrete was bulging inside
the samples, the rubber-coat was deviated from their original condition, but the
rubber-coat was capable to hold the concrete until to achieve very large strain
capacity, exceed the strain capacity of steel, especially, when the thickness of rubber
coat was greater than 0.08 in. (2 mm), Fig. 2-21. It was also observed that the higher
thickness of rubber-coat showed extreme strain capacity, Fig. 2-22, the machine was
stopped before failure of specimens as the head reached its maximum displacement
limit, Table 2-5.

28
(a) Before Stopping the Test (b) Extracting Rubber to determine thickness
Figure 2-18. Damage of confined concrete with a thick layer of rubber
(a) Before Stopping the Test (b) Manual Failure
Figure 2-19. Failure of rubber confined concrete at 18% strain

29
(i) LCC3-1 (ii) LCC3-2 (iii) LCC3-3
(iv) LCC3-4 (v) LCC3-5 (vi) LCC3-6
(vii) LCC6-1 (viii) LCC6-2 (ix) LCC6-3
(x) LCC6-4 (xi) LCC6-5 (xii) LCC6-6
(xiij) LCC9-1 (xiv) LCC9-2 (xv) LCC9-3
(xvi) LCC9-4 (xvii) LCC9-5 (xviii) LCC9-6
Figure 2-20. Failure of all rubber confined concrete specimens

30
Strain 0.0013 in/in Strain 0.0058 in/in Strain 0.0018 in/in
Strain 0.0103 in/in Strain 0.0216 in/in Strain 0.0473 in/in
Strain 0.1068 in/in Strain 0.1213 in/in Strain 0.1463 in/in
Figure 2-21. Strain capacity of rubber confined concrete at different stages during uniaxial
compression test: Specimen LCC3-4

31
Strain 0.0007 in/in Strain 0.0031 in/in Strain 0.0048 in/in
Strain 0.0144 in/in Strain 0.0371 in/in Strain 0.1023 in/in
Strain 0.1274 in/in Strain 0.1744 in/in Strain 0.1971 in/in
Strain 0.2171 in/in Strain 0.2197 in/in Machine was stopped
Figure 2-22. Strain capacity of rubber confined concrete at different stages during uniaxial
compression test: Specimen LCC9-2
32
2.6.3.2. Mechanical Properties
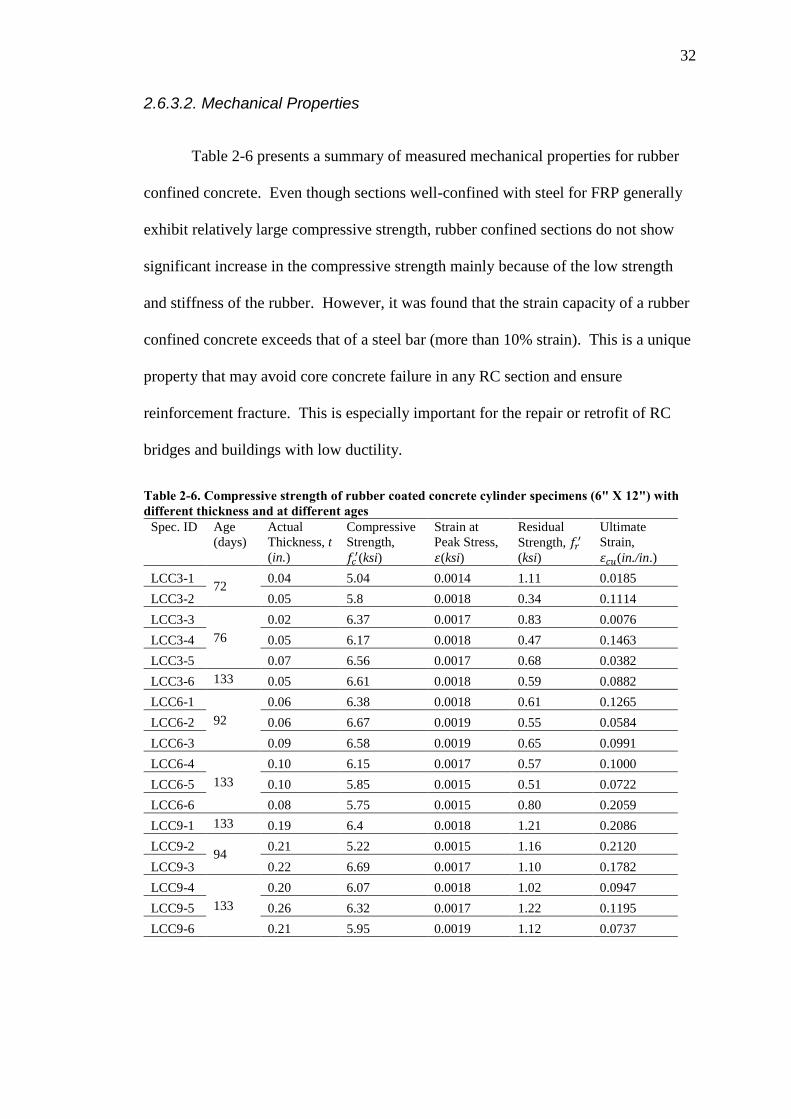
Table 2-6 presents a summary of measured mechanical properties for rubber
confined concrete. Even though sections well-confined with steel for FRP generally
exhibit relatively large compressive strength, rubber confined sections do not show
significant increase in the compressive strength mainly because of the low strength
and stiffness of the rubber. However, it was found that the strain capacity of a rubber
confined concrete exceeds that of a steel bar (more than 10% strain). This is a unique
property that may avoid core concrete failure in any RC section and ensure
reinforcement fracture. This is especially important for the repair or retrofit of RC
bridges and buildings with low ductility.
Table 2-6. Compressive strength of rubber coated concrete cylinder specimens (6" X 12") with
different thickness and at different ages
Spec. ID Age
(days)
Actual
Thickness, t
(in.)
Compressive
Strength,
𝑓𝑐′(ksi)
Strain at
Peak Stress,
𝜀(ksi)
Residual
Strength, 𝑓𝑟′
(ksi)
Ultimate
Strain,
𝜀𝑐𝑢(in./in.)
LCC3-1 72
0.04 5.04 0.0014 1.11 0.0185
LCC3-2 0.05 5.8 0.0018 0.34 0.1114
LCC3-3
76
0.02 6.37 0.0017 0.83 0.0076
LCC3-4 0.05 6.17 0.0018 0.47 0.1463
LCC3-5 0.07 6.56 0.0017 0.68 0.0382
LCC3-6 133 0.05 6.61 0.0018 0.59 0.0882
LCC6-1
92
0.06 6.38 0.0018 0.61 0.1265
LCC6-2 0.06 6.67 0.0019 0.55 0.0584
LCC6-3 0.09 6.58 0.0019 0.65 0.0991
LCC6-4
133
0.10 6.15 0.0017 0.57 0.1000
LCC6-5 0.10 5.85 0.0015 0.51 0.0722
LCC6-6 0.08 5.75 0.0015 0.80 0.2059
LCC9-1 133 0.19 6.4 0.0018 1.21 0.2086
LCC9-2 94
0.21 5.22 0.0015 1.16 0.2120
LCC9-3 0.22 6.69 0.0017 1.10 0.1782
LCC9-4
133
0.20 6.07 0.0018 1.02 0.0947
LCC9-5 0.26 6.32 0.0017 1.22 0.1195
LCC9-6 0.21 5.95 0.0019 1.12 0.0737

33
2.6.3.3. Full Stress-Strain Relationship
Figure 2-23 shows a sample of full stress-strain relationship for a rubber-
confined concrete specimen. It can be seen that the peak stress and its corresponding
strain for rubber coated concrete are approximately the same as those for uncoated
conventional concrete. Since this behavior was also seen for different thicknesses of
the rubber (Fig. 2-24 to Fig. 2-26), it was be inferred that this type of confinement
does not improve the peak stress as well as the strain at the peak stress. The residual
strength of the rubber coated concrete is higher than unconfined concrete but lower
than that seen in other confining methods (e.g. steel reinforcement, jacketing).
Nevertheless, rubber-confined concrete exhibits more than 10% strain capacity (Fig.
2-24 to Fig. 2-26), which is comparable to that of reinforcing steel bars. This unique
behavior will improve displacement capacity of low-confined concrete sections (e.g.
bridge columns, beams in old buildings) by eliminating the core concrete failure and
by allowing the reinforcement to reach their ultimate capacities.
Of 18 rubber coated concrete specimens, the concrete surface of two
specimens (LCC3-6 and LCC9-5) were made as roughened by grinding (described in
previous section) before provide a base layer concrete surface. This technique was
applied to observe the bonding behavior between concrete and rubber coat compared
two all other specimens. The stress-strain response of these two specimens was same
compared to other specimens, which indicate that roughened concrete surface does
not improve the structural behavior of rubber confined concrete.

34
Figure 2-23. Complete stress-strain relationship for conventional and rubber confined
concrete
Figure 2-24. Stress-strain relationships for rubber confined concrete specimens with 3-mm
nominal thickness
0
5
10
15
20
25
30
35
40
45
0
1
2
3
4
5
6
7
0 0.02 0.04 0.06 0.08 0.1 0.12
Str
ess (M
Pa)
Str
ess (
ksi)
Strain (in/in)
C3: Conventional ConcreteLCC9-4: Rubber Confined Concrete
0
2
4
6
0 0.002 0.004 0.006 0.008 0.01
Str
ess (
ksi)
Strain (in/in)
C3
LCC9-4
0
5
10
15
20
25
30
35
40
45
0
1
2
3
4
5
6
7
0 0.02 0.04 0.06 0.08 0.1 0.12 0.14 0.16
Str
ess
(MP
a)
Str
ess
(k
si)
Strain (in/in)
LCC3-1-0.04
LCC3-2-0.05
LCC3-3-0.02
LCC3-4-0.05
LCC3-5-0.07
LCC3-6-0.05

35
Figure 2-25. Stress-strain relationships for rubber confined concrete specimens with 6-mm
nominal thickness
Figure 2-26. Stress-strain relationship for rubber confined concrete specimens with 9-mm
nominal thickness
0
5
10
15
20
25
30
35
40
45
0
1
2
3
4
5
6
7
0 0.02 0.04 0.06 0.08 0.1 0.12 0.14 0.16 0.18 0.2 0.22
Str
ess
(MP
a)
Str
ess
(k
si)
Strain (in/in)
LCC6-1-0.06
LCC6-2-0.06
LCC6-3-0.09
LCC6-4-0.10
LCC6-5-0.10
LCC6-6-0.08
0
5
10
15
20
25
30
35
40
45
0
1
2
3
4
5
6
7
0 0.02 0.04 0.06 0.08 0.1 0.12 0.14 0.16 0.18 0.2 0.22
Str
ess
(MP
a)
Str
ess
(k
si)
Strain (in/in)
LCC9-1-0.19
LCC9-2-0.21
LCC9-3-0.22
LCC9-4-0.20
LCC9-5-0.26
LCC9-6-0.21

36
2.7. Stress-Strain Model for Rubber-Confined Concrete
2.7.1. Introduction
Complete stress-strain relationship for confined concrete is necessary for
displacement-based design of ductile members such as bridge columns and building
beams and columns. A stress-strain material model was developed for rubber
confined concrete based on the experimental data. First, a somewhat complex stress-
strain material model is presented followed by a simplified version, which allows the
analysis of rubber confined sections using most commercial finite element packages
without any further upgrade.
2.7.2. Proposed Stress-Strain Models
Two stress-strain material models for rubber confined concrete were
developed based on experimental results (Fig. 2-27 and 2-28). The model shown in
Fig. 2-27, represents the behavior of rubber confined concrete using nonlinear
relationships. However, lines were used to simulate the post-peak behavior of rubber
confined concrete in the simplified model (Fig. 2-28).
Figure 2-27. Nonlinear stress-strain relationship for rubber confined concrete

37
Figure 2-28. Simplified stress-strain relationship for rubber confined concrete
The critical points of the models are:
𝑓𝑐′ = the compressive strength of unconfined concrete,
ɛ𝑜 = the strain at peak stress,
𝑓𝑟′ = the residual strength of rubber confined concrete,
ɛ𝑓 = the strain at the initiation of the plateau,
ɛ𝑢 = the ultimate strain of rubber confined concrete,
𝑡 = the thickness of rubber.
A summary of derivation of equations that are need to obtain the critical parameters of
the rubber confined concrete models is presented herein. Note that since rubber does
not increase the compressive strength, no equation was developed for this parameter.
2.7.3. Confining Pressure
Concrete expands laterally when it is subjected to axial compression. This
expansion can be confined using a jacket (e.g. FRP) or transverse reinforcement. The
lateral confining pressure may be assumed constant for a steel-confined concrete
Str
ess,
o
fr
'
Strain, f
fc
u
'

38
section after the reinforcement yielding. However, the confining pressure provided
by an FRP jacket, increases due to linear-elastic behavior of FRP.
For rubber confined concrete, the confining pressure is assumed to be
uniformly distributed around the circumference of the section as schematically shown
in Fig. 2-29 thus:
𝑓𝑙 = 2𝐸𝑓ɛ𝑓𝑢𝑡
𝐷 (2.18)
where, 𝑓𝑙 is the confining pressure, 𝐸𝑓 is the modulus of elasticity of rubber, ɛ𝑓𝑢 is the
tensile strain capacity of rubber, 𝑡 is the thickness of rubber, and 𝐷 is the diameter of
concrete cylinder.
Figure 2-29. Confining pressure for rubber confined concrete
2.7.4. Residual Strength
Confined concrete usually exhibits residual strength after reaching the peak
stress. The test results of rubber confined concrete specimens show that the thickness
of the rubber affects the residual strength since thicker rubber increases the concrete
confining pressure. Fig. 2-30 shows the normalized residual strength (𝑓𝑟
′
𝑓𝑐′) versus the
normalized confining pressure (𝑓𝑙
𝑓𝑐′) for all specimens. A regression analysis was

39
carried out to establish a relationship between the residual strength and the confining
pressure, which includes the effect of the rubber thickness (Eq. 2.18).
Figure 2-30. Residual strength vs. confining pressure for rubber confined concrete
Based on the statistical analysis, the residual strength of a rubber confined concrete
section can be calculated:
𝑓𝑟′ = 𝑓𝑐
′ [3.15 (f𝑙
𝑓𝑐′) + 0.05] (2.19)
where, 𝑓𝑟′ is the residual strength for a rubber confined concrete section, 𝑓𝑙
′ is the
confining pressure, and 𝑓𝑐′ is the compressive strength of the unconfined concrete.
2.7.5. Ultimate Strain
Previous studies have shown that the ultimate strain of a steel-confined section
depends on the confining pressure and the strain at the peak stress of transverse
reinforcement. The same method can be used for the rubber confined section
concrete. However, the strain capacity of 13 out of 18 rubber confined specimens in
which the rubber thickness was 0.05 in. (1.27 mm) or greater was more than 10%
Trend Line: (f'r/f'c) = 3.15(fl/f'c) + 0.05
R² = 0.896
0
0.05
0.1
0.15
0.2
0.25
0 0.01 0.02 0.03 0.04 0.05 0.06
Resid
ual
Str
ess r
ati
o (
f' r/f' c
)
Confinement Stress ratio (fl/f'c)

40
(Fig. 2-31), which is comparable to that of reinforcing steel bars. The ultimate strain
in other specimens where lower since the actual thickness of the rubber at the failure
location was insufficient and was 50% lower than the nominal thickness. Overall, it
can be assumed that the ultimate strain of a rubber confined concrete section is 10%.
Figure 2-31. Stress-strain relationships for 13 rubber confined concrete specimens with a
minimum rubber thickness of 0.05 in. (1.2 mm)
2.7.6. Strain Corresponding to Initiation of Residual Strength
It was necessary to determine the strain at the beginning of the residual stress
plateau for the development of stress-strain relationships. The experimental results
showed that the post-peak stress behavior of a rubber confined concrete section
depends on the thickness of the rubber (Fig 2-31). The strain at the initiation of the
residual stress plateau was calculated based on the experimental results using a
statistical analysis (Fig. 2-32). First, the stress at 100, 75, 50, and 25% of the peak
stress on the descending branch of the test data was normalized to the peak stress (𝑓𝑙
𝑓𝑐′)
for all 18 specimens. Only the average less one standard deviation of the stresses at
each stress level was used for the further analysis. Subsequently, strains
0
5
10
15
20
25
30
35
40
45
0
1
2
3
4
5
6
7
0 0.02 0.04 0.06 0.08 0.1 0.12 0.14 0.16 0.18 0.2 0.22
Str
ess
(MP
a)
Str
ess
(k
si)
Strain (in/in)
LCC3-2-0.05 LCC3-4-0.05
LCC3-6-0.05 LCC6-1-0.06
LCC6-3-0.09 LCC6-4-0.10
LCC6-6-0.08 LCC9-1-0.19
LCC9-2-0.21 LCC9-3-0.22
LCC9-4-0.20 LCC9-5-0.26
LCC9-6-0.21

41
corresponding to 100, 75, 50, and 25% of the peak stresses were normalized to the
strain at the peak stress (ɛ𝑐
ɛ𝑜) then the average less one standard deviation of these
strains at each stress level was obtained. The normalized strains were plotted against
the normalized stresses as shown in Fig. 2-32. Finally, a curve was fitted to the
dataset and the strain at the initiation of the residual stress plateau (ɛ𝑓) was obtained
as:
ɛ𝑓 = ɛ𝑜 [−2.263 ln ( 𝑓𝑟
′
𝑓𝑐′) + 0.786] 2.20
All parameters were defined in the previous section.
Figure 2-32. Post-peak stress-strain relationship for 18 rubber confined concrete specimens
2.7.7. Nonlinear Stress-Strain Model
Complete stress-strain relationship (Fig. 2.27) for a rubber confined concrete
section can be expressed using two equations in which the initial behavior up to the
peak stress follows the Popovics’s model (Popovics, 1973):
Trend Line: (fc/f'c) = -2.263ln( o/ c) + 0.7864
R² = 0.9726
0
1
2
3
4
5
0 0.25 0.5 0.75 1 1.25
o/
c
fc/f'c

42
𝑓𝑐 = 𝑓𝑐
′ (ɛ𝑐
ɛ𝑜) 𝑟
𝑟 − 1 + (ɛ𝑐
ɛ𝑜)
𝑟 𝑖𝑓 0 ≤ ɛ𝑐 ≤ ɛ𝑜 2.21
where.
𝑟 = 𝐸𝑐
𝐸𝑐 − (𝑓𝑐
′
ɛ0)
(2.22)
𝐸𝑐 = 57000 √𝑓𝑐′ ( 𝑝𝑠𝑖) (2.23)
The descending branch can be expressed by an equation (Eq. 2.24) which was
originally developed by Lim and Ozbakkaloglu (2014). This equation was modified
to best fit the post-peak behavior of rubber confined concrete sections
𝑓𝑐 = 𝑓𝑐′ −
(𝑓𝑐′ − 𝑓𝑟
′)
1 +0.45
(ɛ𝑐 − ɛ𝑜 ɛ𝑓 − ɛ𝑜
)1.45
𝑖𝑓 ɛ𝑐 > ɛ𝑜
(2.24)
All parameters where defined in the previous sections.
The measured stress-strain relationships of four rubber confined concrete
specimens were compared with the calculated stress-strain relationships using the
proposed nonlinear model (Fig. 2-33 to 2-36). It can be seen that the proposed
nonlinear model reproduced the measured data with a reasonable accuracy.

43
Figure 2-33. Measured and calculated (nonlinear model) stress-strain relationships for rubber
confined concrete for specimen LCC3-4
Figure 2-34. Measured and calculated (nonlinear model) stress-strain relationships for rubber
confined concrete for specimen LCC6-3
0
5
10
15
20
25
30
35
40
45
0
1
2
3
4
5
6
7
0 0.02 0.04 0.06 0.08 0.1 0.12 0.14
Str
ess
(MP
a)
Str
ess
(k
si)
Strain (in/in)
Model Curve: LCC3-4-0.06
Measured: LCC3-4-0.06
0
5
10
15
20
25
30
35
40
45
0
1
2
3
4
5
6
7
0 0.02 0.04 0.06 0.08 0.1 0.12
Str
ess
(MP
a)
Str
ess
(k
si)
Strain (in/in)
Model Curve: LCC6-3-0.09
Measured: LCC6-3-0.09

44
Figure 2-35. Measured and calculated (nonlinear model) stress-strain relationships for rubber
confined concrete for specimen LCC9-4
Figure 2-36. Measured and calculated (nonlinear model) stress-strain relationships for rubber
confined concrete for specimen LCC9-5
2.7.8. Simplified Stress-Strain Model
A simple stress-strain model (Fig. 2-28) was developed for rubber confined
concrete sections to further help engineers in the modeling of RC members with this
type of confinement. The ascending branch of the stress-strain relationship can be
expressed using Popovics’s model (Popovics, 1973).
0
5
10
15
20
25
30
35
40
45
0
1
2
3
4
5
6
7
0 0.02 0.04 0.06 0.08 0.1 0.12
Str
ess
(MP
a)
Str
ess
(k
si)
Strain (in/in)
Model Curve: LCC9-4-0.20
Measured: LCC9-4-0.20
0
5
10
15
20
25
30
35
40
45
0
1
2
3
4
5
6
7
0 0.02 0.04 0.06 0.08 0.1 0.12
Str
ess
(MP
a)
Str
ess
(k
si)
Strain (in/in)
Model Curve: LCC9-5-0.26
Measured: LCC9-5-0.26

45
𝑓𝑐 = 𝑓𝑐
′ 𝑥 𝑟
𝑟 − 1 + 𝑥𝑟 (2.25)
where
𝑥 = ɛ𝑜
ɛ𝑐
(2.26)
𝑟 = 𝐸𝑐
𝐸𝑐 − (𝑓𝑐
′
ɛ0)
(2.27)
𝐸𝑐 = 57000 √𝑓𝑐′ ( 𝑝𝑠𝑖) (2.28)
The descending branch was assumed to be a straight line connecting the peak stress
point to the initiation of the residual stress.
𝑓𝑐 = 𝑓𝑐′ − 𝑀(ɛ𝑐 − ɛ𝑜) (2.29)
where, 𝑀 is the slope of straight line to be calculated:
𝑀 = (𝑓𝑐
′ − 𝑓𝑟′)
(ɛ𝑓 − ɛ𝑜)
(2.30)
All parameters where defined in the previous section.
The graphical representation of the simplified complete stress-strain
relationship of rubber confined concrete was shown in Fig. 2-28, which was
developed using proposed equation (Eq. 2.25 and Eq. 2.29). This proposed simplified
model shows good contribution with experimental data of each rubber coated
concrete. Figure 2-37 to 2-40 shows the comparison stress-strain relationship of
rubber coated concrete based on experimental data and proposed simplified model.
The measured stress-strain relationships of four rubber confined concrete
specimens were compared with proposed simplified model (Fig. 2-37 to Fig. 2-240).

46
It can be observed that the proposed simplified model produced confinement
properties of measured test data with a good accuracy. So, it can be concluded that it
is possible to develop the stress-strain relationship of rubber confinement concrete
with knowing the properties of rubber, such as, thickness, modulus of elasticity, and
the tensile strength of rubber.
Figure 2-37. Measured and calculated (nonlinear model) stress-strain relationships for rubber
confined concrete for specimen LCC3-4
Figure 2-38. Measured and calculated (nonlinear model) stress-strain relationships for rubber
confined concrete for specimen LCC6-3
0
5
10
15
20
25
30
35
40
45
0
1
2
3
4
5
6
7
0 0.02 0.04 0.06 0.08 0.1 0.12 0.14
Str
ess
(MP
a)
Str
ess
(k
si)
Strain (in/in)
Model Curve: LCC3-4-0.06
Measured: LCC3-4-0.06
0
5
10
15
20
25
30
35
40
45
0
1
2
3
4
5
6
7
0 0.02 0.04 0.06 0.08 0.1 0.12
Str
ess
(MP
a)
Str
ess
(k
si)
Strain (in/in)
Model Curve: LCC6-3-0.09
Measured: LCC6-3-0.09

47
Figure 2-39. Measured and calculated (nonlinear model) stress-strain relationships for rubber
confined concrete for specimen LCC9-4
Figure 2-40. Measured and calculated (nonlinear model) stress-strain relationships for rubber
confined concrete for specimen LCC9-5
0
5
10
15
20
25
30
35
40
45
0
1
2
3
4
5
6
7
0 0.02 0.04 0.06 0.08 0.1 0.12
Str
ess
(MP
a)
Str
ess
(k
si)
Strain (in/in)
Model Curve: LCC9-4-0.20
Measured: LCC9-4-0.20
0
5
10
15
20
25
30
35
40
45
0
1
2
3
4
5
6
7
0 0.02 0.04 0.06 0.08 0.1 0.12
Str
ess
(MP
a)
Str
ess
(k
si)
Strain (in/in)
Model Curve: LCC9-5-0.26
Measured: LCC9-5-0.26

48
2.8. Comparison with other Confinements
A reinforced concrete bridge column was selected to compare the confinement
effect of the rubber with different confinement methods (Table 2-7 and Fig. 2-41).
The column section was confined with a 0.5-in. (12.7- mm) thick rubber, 0.25-in.
(6.35- mm) thick FRP wrap, or No. 6 spirals at 4-in. (101.6- mm) pitch, each method
at a time. Engineered cementitious composite (ECC) is a type of fiber-reinforced
concrete with 4% tensile strain capacity and low damage under extreme loading.
Steel-confined ECC was also included in the analysis. The geometry of bridge
column and the material properties are presented in Table 2.7.
Table 2-7. Column geometry and material properties
Properties Value
Column Diameter (in.) 48
Column Height (in.) 16
Longitudinal Reinforcement No. 9
Diameter of Longitudinal Reinforcement (in.) 1.128
Total Number of Longitudinal Reinforcement 22
Transverse Reinforcement No. 6
Diameter of Transverse Reinforcement (in.) 0.75
Type of Transverse Reinforcement Spiral
Pitch (in.) 4
Concrete Cover (in.) 2
Concrete/ECC Compressive Strength (psi) 6
Yield Strength of Steel (ksi) 60
Thickness of FRP, tfrp (in.) 0.25
Tensile Strength of FRP(ksi) 150
Modulus of Elasticity of FRP (ksi) 11900
Thickness of Rubber, t (in.) 0.50
Tensile Strength of Rubber (psi) 3432
Modulus of Elasticity of Rubber (psi) 56000
The confined properties of the section were calculated using Mander’s model
(Mander et al., 1988) for the steel confined concrete, Motaref’s model (Motaref

49
Sarira, 2011) for the steel confined ECC, Lam and Tang’s model (Lam & Teng, 2003)
for the FRP confined concrete, and the present study for the rubber confined concrete
(Fig. 2-41). The calculated mechanical properties are presented in Table 2-8. It can
be seen that the peak stress and the residual strength are significantly higher for the
steel and FRP confined concrete sections compared to those of the steel confined ECC
and the rubber confined concrete sections. The residual strength for the steel confined
ECC section is comparable to that of the rubber confined concrete section.
Nevertheless, the rubber confined concrete section exhibits a strain capacity that is
substantially higher than any other types of confinement method. This unique
property may make this type of confinement a viable retrofit or rehabilitation method
to increase the ductility of low ductile members and structure in high seismic regions.
Further analytical and experimental studies are needed to show the robustness of
rubber confined concrete sections for seismic or other applications.
Figure 2-41. Stress-strain relationship of concrete by various confinement methods
0
5
10
15
20
25
30
35
40
45
50
55
60
65
0
1
2
3
4
5
6
7
8
9
10
0 0.02 0.04 0.06 0.08 0.1 0.12
Str
ess
(M
Pa
)
Str
ess
(k
si)
Strain (in/in)
Rubber Confined
Simplified Rubber Confined
Steel Confined(Mander et al., 1988)
FRP Confined (Lam and Teng, 2003)
ECC Confined (Motaref, 2011)
Unconfined Concrete
0123456789
10
0 0.004 0.008 0.012
Str
ess (
ksi)
Strain (in/in)

50
Table 2-8. Properties of bridge column with various confinement methods
Ref. Confining
Materials
Compressive
Strength, 𝑓𝑐′
(ksi)
Compressive
Strength of
Confined
Concrete,
𝑓𝑐𝑐′ (ksi)
Strain at
Peak
Stress, ɛ𝑜
(in./in.)
Residual
Strength,
𝑓𝑟′ (ksi)
Strain at
ultimate
Stress, ɛ𝑐𝑢
(in./in.)
Present
study
Rubber
thickness
0.50 in.
6.00 6.00 0.002 2.11 0.10
Mander, et
al., 1988
Steel
confined
#6 bar @ 4
in. pitch
6.00 7.85 0.00509 6.33 0.01383
Lam and
Teng, 2003
FRP
confined
Thickness
0.25 in.
6.00 6.00 0.002 0.01
Motaref et
al., 2011
ECC
confined
#6 bar @ 4
in. pitch
6.00 6.76 0.00336 2.71 0.01542
Unconfined 6.00 - 0.001844 0.005
2.9. Summary and Conclusions
The main objectives of the present study was to investigate stress-strain
relationship of rubber confined concrete. Total of 18 rubber confined concrete
cylinders were tested under uniaxial compressive loads. The mechanical properties
including stress-strain response of the rubber confined concrete was observed. Based
on the experimental investigation, the following conclusions can be drawn:
The peak stress and the corresponding strain of peak stress rubber confined
concrete were approximately same, even it was same for different thickness of
rubber coat.
The residual strength of rubber confined concrete was lower than other
confining materials such as steel confinement or FRP-confined concrete.
However, rubber confined concrete exhibits very large strain capacity
exceeding the strain capacity of reinforcing steel bar in tension.

51
The average residual strength of rubber confined concrete was approximately
10 to 25% of unconfined concrete stress when thickness of rubber was varied
0.05 in. (1.3 mm) to 0.26 in. (6.6 mm). Based on past studies, it has been
evaluated that the residual strength, 20 to 30% of the compressive strength of
unconfined concrete, are capable to avoid catastrophic damage in seismic area,
which suggest that this new rubber based confining material might be useful in
seismic area.
The proposed material model for rubber confined concrete can accurately
simulate this material behavior
Displacement ductility capacity of low-ductile bridge columns can be doubled
using rubber confinement as external jacket.
Overall, it was confirmed that the strain capacity of rubber confined concrete
can exceed 10%. This unique behavior of will improve displacement capacity of low-
ductile concrete sections by eliminating the core concrete failure and allowing the
reinforcement to reach their ultimate capacities.
2.10. References
1. ASTM Standard C39-12 (2012). "standard test method for compressive
strength of cylinder concrete specimens," ASTM International , West
Conshohocken, PA.
2. ASTM Standard C143 (2012). "standard test method for slump of hydraulic-
cement concrete," ASTM International , West Conshohocken, PA.
doi:10.1520/C0143_C0143M-12

52
3. ASTM Standard C617-12 (2012). "standard practice for capping cylindrical
concrete specimens," ASTM International , West Conshohocken, PA.
4. Hognested, E. (1951). "A study of combined bending and axial laod in
reinforced concrete memebrs; a report of an investigation conducted by the
engineering experiment station," University of Illinois, Under auspices of the
engineering foundation, through the reinforced concrete research council.
5. Jiang, J.-F., and Wu, Y.-F. (2012). "Identification of material parameters for
Drucker–Prager plasticity model for FRP confined circular concrete columns,"
International Journal of Solids and Structures, 49(3), 445-456.
6. Kent, D. C., and Park, R. (1971) "Flexural members with confined concrete,"
Journal of the Structural Division.
7. Lam, L., and Teng, J. (2003). "Design-oriented stress–strain model for FRP-
confined concrete," Construction and Building Materials, 17(6), 471-489.
8. Lim, J., and Ozbakkaloglu, T. (2014). "An accurate stress-strain model for
FRP-confined concrete based on a novel approach," 23rd Australasian
conference on the mechanics of structures and materials.
9. LINE-X Franchise Development Company (2016). "Technical data sheet -
PX3350," LINE-X LLC, 1862 Sparkman drive, Huntsville, AL 35816.
10. LINE-X Franchise Development Company (2016). "Technical data sheet -
LINE-X XPM," LINE-X LLC, 1862 Sparkman drive, Huntsville, AL 35816
11. Mander, J., Priestley, M., and Park, R. (1988). "Observed stress-strain
behavior of confined concrete," Journal of structural engineering, 114(8),
1827-1849.
12. Motaref Sarira, S. M. S., and Sanders David H. (2011). "Seismic response of
precast bridge columns with energy dissipating joints," Center for Civil

53
engineering Earthquake Research, Department of Civil and Environmental
Engineering, University of Nevada, Reno, Nevada, Report No. CCEER-11-02,
May 2011.
13. Nanni, A., and Bradford, N. M. (1995). "FRP jacketed concrete under uniaxial
compression," Construction and Building Materials, 9(2), 115-124.
14. Popovics, S. (1973). "A numerical approach to the complete stress-strain curve
of concrete," Cement and concrete research, 3(5), 583-599.
15. Samaan, M., Mirmiran, A., and Shahawy, M. (1998). "Model of concrete
confined by fiber composites," Journal of structural engineering, 124(9), 1025-
1031.
16. Spoelstra, M. R., and Monti, G. (1999). "FRP-confined concrete model,"
Journal of composites for construction, 3(3), 143-150.
17. Torrenti, J., Benaija, E., and Boulay, C. (1993). "Influence of boundary
conditions on strain softening in concrete compression test," Journal of
engineering mechanics, 119(12), 2369-2384.
18. Van Mier, J. G. M. (1984). "Strain-softening of concrete under multiaxial
loading conditions,” Technische Hogeschool Eindhoven.
19. Wu, Y.-F., Liu, T., and Oehlers, D. J. (2006). "Fundamental principles that
govern retrofitting of reinforced concrete columns by steel and FRP
jacketing," Advances in Structural Engineering, 9(4), 507-533.
20. Wu, Y.-F., and Wei, Y. (2014). "General stress-strain model for steel-and
FRP-confined concrete," Journal of composites for construction, 19(4),
04014069.

54
CHAPTER 3. BUCKLING
RESTRAINED REINFORCEMENT
3.1. Introduction
Reinforced concrete (RC) bridges and buildings are currently designed to
exhibit large displacement capacities in high seismic region through yielding of
reinforcements. However, repair of ductile components is often inevitable under
strong earthquakes mainly because of concrete failure, significant yielding of
reinforcement, or large residual lateral deformations. Repair of RC structures is
extremely difficult or impractical when longitudinal reinforcement of ductile
members fractures. In this case, the structure needs to be demolished and
reconstructed.
External steel bars has been proposed in previous studies to mainly increase
energy dissipation of rocking columns and frames. With some modification in
construction detailing, external energy dissipaters might be used as longitudinal
reinforcement of RC sections. With proposed detailing, damaged reinforcement can
be simply replaced after earthquakes. Therefore, RC structures can be repaired in a
few hours after an event without the need of total replacement of the structure.
Feasibility and performance of a new type of external energy dissipater, which is

55
referred to as “buckling restrained reinforcement (BRR)” in the present study, are
investigated in this chapter.
3.2. Research Objectives
Dog-bone mild steel or aluminum bars encased in steel tubes were used in
previous studies to enhance the energy dissipation of rocking structures.
Conventional deformed steel bars without any reduction of the section enclosed in
steel pipes were proposed in the present study as external energy dissipaters. The use
of original reinforcement in BRR will save time and money compared to dog-bone
energy dissipaters due to machining. The main objective of this study was to
experimentally investigate the feasibility and performance of conventional reinforcing
steel bars in BRR.
3.3. Buckling Restrained Reinforcement (BRR)
A non-conventional type of structural system, rocking, allows structural
members to rock and return to its original position after an event incorporating post-
tensioning tendons. When an internal or external energy dissipater is added to
rocking elements to enhance energy dissipation and to reduce displacements, it is
called “hybrid rocking members. Figure 3-1a shows the hysteretic behavior for a
conventional ductile column in which loops are fat because of large energy dissipation
through yielding of reinforcement with significant residual displacements. A simple
rocking system (no energy dissipater) shown in Fig. 3-1b exhibit self-centering
behavior but minimal energy dissipation and excessive lateral displacements under
earthquakes. A hybrid rocking column (Fig. 3-1c) with flag-shape hysteresis exhibits
self-centering behavior and displacements that can meet the current code deformation
requirements.

56
(a) Conventional Detailing (b) Simple Rocking (c) Hybrid Rocking
Figure 3-1. Hysteretic behavior of concrete columns (Guerrini et al., 2015)
In hybrid rocking columns (or structures in general), energy can be dissipated
using internal (e.g. longitudinal reinforcement as shown in Fig. 3.2a) or external
devices (Fig. 3-2b). External dissipaters provide an additional benefit of possible
replacement after severe events, if damaged.
(a) Internal Dissipater (b) External Dissipater
Figure 3-2. Energy dissipaters for rocking systems (Marriott et al., 2011)
3.4. Past Research on External Energy Dissipaters
3.4.1. Introduction
Dog-bone mild steel or aluminum bars enclosed in steel tubes (Fig. 3-2) were
used in previous studies as external energy dissipaters to reduce deformation of
rocking components during earthquake excitation. Tubes were filled with either a

57
grout or epoxy, or were not filled. Reinforcement are enclosed in tubes to prevent
buckling. In conventional reinforced concrete structures, concrete surrounding the
reinforcement prevents buckling. Capacities of this device mainly depends on the bar
properties and their geometry. With a proper design, buckling of the
tube/grout/reinforcement will be the main failure mode of the external energy
dissipaters. Sometimes fracture may occurred in dog-bone bars after many cycles
because of low effective slenderness ratio (25.7) of fuse bar (Sarti et al., 2016).
However, the failure mechanism can be controlled by changing the slenderness ratio
of dog-bone bars, lengths, and dog-bone bar diameter verse that of the unreduced bar.
3.4.2. External Energy Dissipaters
A limited number of dog-bone shape external energy dissipaters were tested in
previous studies (Guerrini et al., 2014; Marriott et al., 2009; Mashal et al., 2014; Mesa
and Dario, 2010; Sarti et al., 2016; White and Palermo, 2016) mainly for hybrid
rocking columns. A brief review of all past studies are discussed herein.
3.4.2.1. Study by Marriot et al. (2009)
Marriott et al. (2009) used twelve external energy dissipaters in hybrid bridge piers.
Three different fuse lengths of 75, 75, and 115 mm by following fuse diameters of
13.5, 10.0, and 8.0 mm, respectively were used to prepare the dissipaters. Fuse is
referred to the portion of the external energy dissipater in which section was reduced.
A 34-mm long steel tube with a wall thickness of 2 mm, was used to enclose
reinforcement. Subsequently, tube was filled with epoxy. Prior to their installation
within bridge pier, the individual dissipaters were tested subjected to cyclic, axial,
tension-compression tests to observe their cyclic energy dissipation and stability.
This test was conducted particularly to investigate the anti-buckling system. The

58
dissipater was capable to provide a large amount of energy dissipation. Moreover,
pinching was not observed during test and the response was very stable, indicating
that large inelastic cycles can be achieved without buckling of reinforcement. It was
also reported that when the bar is under large compressive deformation, the gap
between the grout and the unreduced portion of the bar (Fig. 3-3b) was closed
resulting in higher stiffness in compression than that in tension.
(a) Cyclic and monotonic behavior of dissipater (b) Compression behavior of dissipater
Figure 3-3. Cyclic behavior of external energy dissipater (Mesa and Dario, 2010)
3.4.2.2. Study by Mesa and Dario (2010)
Mesa and Dario (2010) tested three different types of external energy
dissipaters similar to those shown in Fig. 3-3 with diameters of 7, 10, 13 mm and a
fuse length of 90 mm. A steel tube with external diameter of 34 mm and a wall
thickness of 3 mm, was used as confining tube. Figure 3-4 shows the stress-strain /
force-displacement response for the 7 mm and 8 mm fuses incorporate with an
unbonded length of 150 mm. The test was carried out for the monotonic uniaxial and
cyclic loading. The dissipater failed at an elongation of 14 mm and 16 mm
corresponding to a 9% and 11% of the axial strain for 7-mm and 8-mm fuses,
respectively. The dissipaters show a reduction of the yield plateau under cyclic
loading and increase of the yield strength due to strain rate effects under monotonic

59
and cyclic loading. Both dissipaters were failed at similar elongation, which is
concluded that the level of elongation mainly controlled by the unbonded length of
dissipaters.
Figure 3-4. Stress-strain and force displacement relationship of the external dissipaters (Mesa
and Dario, 2010)
3.4.2.3. Study by Mashal et al. (2014)
Mashal et al. (2014) investigated the seismic performance of hybrid rocking
bridge columns using fuse-type external energy dissipaters. However, detailing and
test results for the dissipaters were not published because of patenting. However, they
experimentally showed that hybrid rocking bridge columns with external dissipaters
exhibited no damage and zero residual displacements up to 3% drift ratio, where test
was stopped.
3.4.2.4. Study by Guerrini et al. (2014)
Guerrini et al. (2014) incorporated buckling restrained energy dissipaters in a
column test. Dog-bone hot-rolled A576 Grade 1018 steel bars with the yield strength
of 331 MPa, ultimate strength of 190 MPa, and a strain of 23% at the peak stress were
used as external energy dissipaters. The machined portion of the bars was enclosed
by a steel tube and grouted to prevent buckling (Fig. 3-5). The bars were lubricated

60
inside tubes to minimize the friction between steel bars and grout, and mastic tape
was used at the tapered portion of the bars to minimize the bearing and to provide a
gap between the bar and the filler material. The stress-strain hysteresis of one of the
external dissipaters is shown in Fig. 3-6. It was reported that due to partial composite
action between the bar, filling material, and steel tube, the peak compressive stress
was larger than the peak tensile stress.
Figure 3-5. Geometric configuration for buckling restrained energy dissipaters
(Guerrini et al., 2014)
Figure 3-6. Hysteretic behavior of buckling restrained energy dissipaters (Guerrini et
al., 2014)

61
3.4.2.5. Study by Guo et al. (2015)
Goo et al. (2015) carried out an experimental study on hybrid rocking bridge
piers externally reinforced with aluminum energy dissipaters. Each bar had a
diameter of 25 mm and the diameter was machined down to 15 mm at the middle of
bar. The fuse length was 100 mm for all of test specimens but one, which had a fuse
length of 200 mm. This energy dissipater was not individually tested under direct
axial loads but was used in bridge column tests (Fig. 3-7). It was found that
aluminum energy dissipaters are a viable type of energy dissipater.
(a) Hysteretic behavior (b) Bridge pier with dissipater
Figure 3-7. Hysteretic behavior of external energy dissipaters constructed with aluminum bar
(Guo et al., 2015)
3.4.2.6. Study by White and Palermo (2016)
White and (2016) used external energy dissipater in hybrid rocking bridge
column to observe the structural behavior of bridge pier through experimental
investigation. These dissipaters were fabricated using 30-mm Grade 300 steel bars
machined down to a diameter of 24 mm at the middle as shown in Fig. 3-8. Two cross
sections were proposed for the reduced portion of the bar: circular and grooved.

62
Grooved sections provide higher radius of gyration compared to circular sections
resulting in a better resistant against buckling. This study did not provides test results
for individual energy dissipaters.
Figure 3-8. Geometric configuration of external energy dissipaters (White & Palermo,
2016)
3.4.2.7. Study by Sarti et al. (2016)
Sarti et al. (2016) tested six dog-bone buckling-restrained mild steel
dissipaters for different geometric parameters (Fig. 3-9). Grade 300 steel bars with
the yield strength of 300 MPa and AS/NZS 1163 grade C250L0 tubes were used to
form dissipaters. Either grout or epoxy was used to fill the tubes. This test was
conducted to investigate the failure mechanism of dissipater’s based on their
geometric configuration. It has been observed that the dissipaters showed a
significant improvement of stiffness under negative displacement, which is indicated
that the external energy dissipaters are very good in compression. Axial testing of
these dissipaters showed that stable hysteresis loops can be achieved with the average
strain capacity of 6%. Two different failure modes were observed: (1) low-cycle
fatigue in specimens with low effective slenderness ratio (25.7) by bar fracturing in
the reduced-diameter portion of the dissipater, and (2) buckling of tube. The effective

63
slenderness ratio is defined by an equation, which is depend on the fuse length, area
and second of moment of inertia of fuse bar and confining tube. The device showed
higher forces in compression when the tube buckled due to composite action of the
tube/grout/bar system in compression. It was also observed the filling materials, grout
or epoxy, do not affect the overall behavior of the dissipaters. Based on an analytical
study, a fuse slenderness ratio of 60 or lower was recommended.
Figure 3-9. Geometric configuration for dog-bone energy dissipaters (Sarti et al., 2016)
3.4.3. Use of External Energy Dissipaters in Concrete Elements
The performance of hybrid rocking concrete elements (post-tensioning
tendons and a type of energy dissipater) has been investigated in previous studies.
The main focus of recent studies has been on the development of hybrid rocking
elements (mainly columns) with the use of external energy dissipaters to control
displacement demands of the member in high seismic region. A brief review of
recent studies with external energy dissipaters in presented herein.
3.4.3.1. Study by Guerrini et al. (2014)
Guerrini et al. (2014) tested one dual-shell cantilever hybrid rocking bridge
column incorporated with external energy dissipaters. The column was designed for a
target drift ratio of 3%. The drift ratio is defined as the ratio of the column tip lateral
displacement to the column length. Six external buckling-restrained energy
dissipaters were mounted to control displacements. The energy dissipaters were

64
design not to fracture at the target drift ratio and the post-tensioning bars were
expected to remain elastic. An axial load of 63 kips were applied to the column using
two vertical hollow hydraulic jacks. Subsequently, the column was tested under,
subjected to quasi-static reversed cyclic loading. Buckling of the external energy
dissipaters were observed at 3% drift ratio. One dissipater fractured at the first cycle
7.5% drift ratio and two dissipaters fractured under subsequent cycles. The test was
stopped at 10% drift ratio. Figure 3-10 shows the hysteretic behavior of dual-shell
hybrid rocking bridge column mounted by external energy dissipaters.
(a) Hysteretic lateral force-displacement response (b) Bridge column incorporate with external
energy dissipater
Figure 3-10. Structural behavior of dual-shell hybrid rocking bridge column under reverse
cyclic loading (Guerrini et al., 2014)
3.4.3.2. Study by Marriott et al. (2009)
Marriott et al. (2009) tested one conventional RC bridge column as well as one
hybrid rocking bridge column reinforced with eight external energy dissipaters. Both
columns were tested under pseudo-dynamic loading protocols. The axial load for
both columns was 300 kN. The test results confirmed satisfactory performance for
external energy dissipaters and the post-tensioning tendons up to 3.5 % of drift ratio
where the test was stopped. The hybrid rocking column exhibited good energy

65
dissipation and re-centering characteristics. Since the column plastic hinge region
was jacketed with steel tube, the column damage was insignificant.
3.4.3.3. Study by Marriott et al. (2011)
Marriott et al. (2011) tested bridge columns with the same detailing as those
described in the previous study (Marriott et al., 2009) but subjected to biaxial loading.
For the conventional bridge column, concrete spalling was observed at 2% drift ratio,
first reinforced buckled at 2.5% drift ratio followed by strength degradation and bar
fracture at higher drift ratios. On the other hand, the hybrid bridge column exhibited
minimal damage and stiffness and strength degradation up to 2.5% drift ratio at which
one dissipater ruptured.
3.4.3.4. Study by Guo et al. (2015)
Guo et al. (2015) tested three 1/3-scale hybrid bridge columns reinforced with
external energy dissipaters under cyclic loading. Aluminum bars instead of mild steel
bars were used in external energy dissipaters because of their lower costs and better
corrosion resistance. Minimal damage was observed in the hybrid rocking columns at
4% drift ratio while the conventional RC specimen significantly damaged with large
residual drifts at 2.25% peak drift ratio. Even though a few of the dissipaters ruptured
at large drift cycles, the column exhibited large energy dissipation.
3.4.3.5. Study by Mashal et al. (2014)
Mashal et al. (2014) tested low-damage hybrid rocking two-column bents
under cyclic loading. External energy dissipaters were used to control displacements.
Steel jacket was used to confine the columns and to attach the dissipaters. Total 390
kN axial loads were applied on column head during test. The test results confirmed

66
low damage, high energy dissipation, and low residual displacement up to 3.5 drift
ratio where the test was stopped. Figure 3-11 shows the structural behavior of ABC
low-damage and high-damage bridge column under cyclic loading mounted with
external energy dissipater. There was no damage observed in bent after testing the
specimen.
(a) Force – displacement response (b) bent after testing
Figure 3.11. Force-displacement relationship of ABC low-damage and high-damage bridge
piers (Mashal et al., 2014)
3.4. Experimental Program
3.4.1. Introduction
Dog-bone energy dissipates showed promising performance in the previous
studies as discussed in the previous section. In an attempt to avoid bar machining,
straight un-reduced reinforcing steel bars, which is referred to as buckling restrained
reinforcement (BRR) in this chapter, were recommended as external energy
dissipaters (Fig. 3-12). To investigate the feasibility and performance of BRR, nine
buckling specimens were tested in the Lohr Structures Laboratory at South Dakota
State University under axial compressive loading. Detailing, testing procedure, and a
summary of the BRR test results are presented in this section.

67
Figure 3-12. Geometric configuration of Buckling Restrained Reinforcement
3.4.2. Test Matrix
A total of 16 specimens (Table 3-1) including four reference deformed bars,
three deformed bars restrained with steel nuts, and nine buckling restrained
reinforcement (BRR) were constructed and tested under monotonic and cyclic axial
compressive loading to failure. Two different sizes of deformed steel bar, No. 4 and
No. 8, were used in this experimental investigation. Steel tubes with different
geometry were used to prevent buckling of reinforcement and were filled with non-
shrink grout. Note that reinforcing steel bars were not machined.
Table 3-1. Test matrix for Buckling Restrained Reinforcement
Specimen ID
Reinforcing
Steel Bar
Steel Tube
Filling
Material Load
Size
(No.)
Length
(in.)
O.D.
(in.)
Gage Length
(in.) No4-BL11.00d 4 11.00 Monotonic
No4-BL10.94d 4 11.00 Monotonic
No8-BL16.91d 8 16.96 Monotonic
No8-BL10.25d 8 10.25 Monotonic
No4-BL11.00d-Nuts-G0.875 4 11.00 Monotonic
No4-BL11.00d-Nuts-G0.42 4 11.00 Monotonic
No4-BL11.00d-Nuts-G0.20 4 11.00 Monotonic
No4-BL11.00d-TL5.0s-TG18-G2.00 4 11.00 1 ¼ 18 GA 5 Grout Monotonic
No4-BL10.94d-TL5.0s-TG16-G1.94 4 10.94 1 ¼ 16 GA 5 Grout Monotonic
No4-BL12.28d-TL7.5s-TG16-G0.50 4 12.06 1 ¼ 16 GA 7.5 Grout Monotonic
No4-BL12.20d-TL7.5s-TG14-G0.50 4 12.20 1 ¼ 14 GA 7.5 Grout Monotonic
No4-BL14.81d-TL7.5s-TG14-G0.50 4 14.81 1 ¼ 14 GA 10 Grout Monotonic
No4-BL14.81d-TL7.5s-TG13-G0.50 4 14.81 1 ¼ 13 GA 10 Grout Cyclic
No8-BL14.56d-TL10.0s-TG13-G0.50 8 14.56 2 ¼ 13 GA 10 Grout Monotonic
No8-BL17.00d-TL10.0s-TG11-G1.00 8 17.00 2 ¼ 11 GA 10 Grout Monotonic
No8-BL19.62d-TL15.0s-TG11-G0.50 8 19.62 2 ¼ 11 GA 15 Grout Monotonic
Example of Specimen Identification: No4-BL10.94d-TL5.0s-TG16-G0.5
No4: No. 4 Reinforcing Bar
BL10.94d: Length of Reinforcing Bar = 10.94 in.; Bar Type d= Deformed, p= Plain
TL5.0s: Length of Tube = 5.0 in.; Tube Type s= steel, a=Aluminum
TG16: Tube Gage = 16
G0.5: Total Gap = 0.5 in.

68
3.4.3. Material Properties
3.4.3.1. Steel Tube
Tubes enclosing reinforcing bars were made of Grade 1026, carbon steel.
Two different tubes diameters with different wall thickness (Table 3-1) were
considered to investigate the behavior of BRR. The mechanical properties of steel
tube are presented in Table 3-2.
Table 3-2. Mechanical properties of steel tube in BRR
3.4.3.2. Reinforcing Steel Bar
ASTM A706, Grade 60, deformed steel bars were used in BRR. Two different
diameters and various lengths were included to optimize the performance of BRR.
The expected mechanical properties of reinforcing steel bars according to AASHTO
Seismic Guide Specifications are presented in Table 3-3. Measured strengths are
presented in the following sections.
Table 3-3. Mechanical properties of reinforcing steel bars
Property of ASTM A706 Value
Grade 60
Yield Stress, 𝑓𝑦 (ksi) 60
Modulus of Elasticity, 𝐸𝑠 (ksi) 29000
Expected Yield Stress, 𝑓𝑦𝑒 (ksi) 68
Ultimate Tensile Strength, 𝑓𝑢 (ksi) 95
Expected Yield Strain, ɛ𝑦𝑒 (in.) 0.0023
Ultimate Strain, ɛ𝑢 (in./in.) 0.09
3.4.3.3. Non-Shrink Grout
Conventional non-shrink fine-aggregate high-flow grout (1428 HP) was used
to fill the gap between reinforcing bars and steel tubes. This main purpose of using
Yield Strength
(psi)
Ultimate Tensile Strength
(psi)
Elongation
(%)
Hardness
(HRB)
Min 66,000 75,000 10.00 80.00
Max 73,546 86,524 20.00 91.00

69
the grout is to increase the moment of inertia of the device and to enhance durability
of reinforcement. The grout use was a non-metallic, mineral-based precision grout
designed to have high initial and ultimate strengths. The expected compressive
strength provided by the manufacturer is presented in Table 3-4.
Table 3-4. Strength of non-shrink grout at different conditions.
Age Condition
Plastic Flowable Fluid
1 day 6,500 psi 5,500 psi 4,500 psi
3 days 8,000 psi 7,000 psi 6,000 psi
7 days 10,000 psi 9,000 psi 8,000 psi
28 days 14,000 psi 12,000 psi 10,000 psi
3.4.4. Construction of Buckling Restrained Reinforcement
(BRR)
Buckling restrained reinforcement (BRR) were fabricated at the Lohr
Structures Laboratory at South Dakota State University (Fig. 3-12 and Fig. 3-13).
The test specimens were assembled and installed on a vertical support. The bottom of
specimens were sealed by a duct tape to prevent grout leak. Figure 3-14 shows the
specimens after pouring the non-shrink grout from the top. The test specimens were
removed after 28 days and placed in lab at room temperature.

70
Figure 3-13. Construction of BRR specimens
Figure 3-14. BRR specimens after pouring non-shrink grout
3.4.5 Test set up and Loading Protocol
Three ASTM A36 steel plates each with a thickness of 1 in. (25 mm)
connected with four post-tensioning rods were utilized in a self-reacting compressive
setup (Fig. 3-15 and 3-16). Steel cups at the center of the two steel plates were to

71
hold the specimens and to ensure that the specimen are secure during the compressive
test. A hydraulic hallow-core jack was used to apply compressive monotonic and
cyclic loads and was controlled with a manual oil pump. The average displacement
rate was 0.0052 in./sec (0.13 mm/sec). Four load cells and three string potentiometers
were used to measure forces and displacements of BRR, respectively.
Figure 3-15. Schematic Elevation view of BRR test setup
Sting PODDywidag Bar
Hydraulic Jack
Steel Plate
Steel cup
Load Cell (100 kips)
Teflon SheetConfining Steel Tube
Deformed Reinforcing BarFilling Materials (Grout)
GL
Gap Gap
Figure3-16. Photograph of BRR test setup

72
3.5. Experimental Results
The main objective of this research was to investigate the mechanical
properties and the failure mechanism of BRR. A summary of test data is presented
herein.
3.5.1. Material Properties
The compressive strength of 2-in. (51- mm) grout cubes tested according to
ASTM Standard C39-12 (2012) at different ages is presented in Table 3-5.
Table 3-5. Measured compressive strength of non-shrink grout
Age (days) Compressive Strength, 𝑓𝑐𝑔′ (psi)
7 6,210
14 7,750
28 9,850
50 10,180
Note: Three samples were tested. Only the average strength was reported.
3.5.2 Performance of Buckling Restrained Reinforcement
3.5.2.1. Failure Mechanism
Figure 3-17a shows the failure of a reference No. 4 deformed bar with a total
length of 11 in. (22 times the bar diameter) under compression in which the No. 4 bar
buckled at a 23.45 ksi (161.7 MPa) compressive stress. In an attempt to improve the
buckling resistance of bars, No. 4 bars were enclosed in conventional steel nuts (Fig.
3-17b to 3-17d). The only variable was the total gap between the nuts and the face of
the steel caps in the axial direction. Three gaps were 1.75db, 0.85db, and 0.4db (db is
the diameter of the bar). The compressive behavior of a BRR will be the same as that
of a conventional steel bar before the gap closure. It was found that a reinforcing
steel bar can fully resist against buckling and the compressive strength can exceed the

73
yield strength of the bar if the total gap does not exceed 0.5db. Bar buckling at small
stresses was observed when the gap was higher (Fig. 3-17b and Fig. 3-17c).
(a) No4-BL11.00d (b) No4-BL11.00d-Nuts-G0.875
(c) No4-BL11.00d-Nuts-G0.42 (d) No4-BL11.00d-Nuts-G0.20
Figure 3-17. Failure of deformed reinforcing bars with and without steel nuts
Figure 3-18 shows the failure mode of the nine BRR specimens under
compressive loads. For No. 4 BRRs, the device buckled at very large stresses [200 ksi
(1379 MPa)] when the total axial gap between the tube and the cup was not more than
0.5db. Similar to No. 4 BRRs, No. 8 BRRs showed large compressive stresses before
failure when the total axial gap was 0.5db.

74
(a) No4-BL11.00d-TL5.0s-TG18-G3.0 (b) No4-BL10.94d-TL5.0s-TG16-G2.94
(c) No4-BL12.20d-TL7.5s-TG14-G0.5 (d) No4-BL12.28d-TL7.5s-TG16-G0.29
(e) No4-BL14.81d-TL7.5s-TG13-G0.5 (f) No4-BL14.81d-TL7.5s-TG14-G0.5
(g) No8-BL17.00d-TL10.0s-TG11-G1.0 (h) No8-BL14.56d-TL10.0s-TG13-G0.5
(i) No8-BL19.62d-TL15.0s-TG11-G0.5 Figure 3-18. Failure of BRR specimens

75
3.5.2.2. Stress-Strain Relationship
Figure 3-19 shows the stress-strain relationship of unrestrained deformed steel
bars under monotonic compressive loads. The measured peak stresses are presented
in Table 3-6. It can be seen that unrestrained steel bars will buckle under low
compressive stresses.
Figure 3-19. Stress-strain relationship for deformed reinforcing bars
Table 3-6. Stress-strain characteristics of deformed reinforcing bars under compressive loads
Specimen ID Unrestrained Length to
Diameter (in.) Peak Stress (ksi) Peak Strain (in./in.)
No4-BL11.00d 14 23.45 0.005
No4-BL10.94d 13.88 21.06 0.003
No8-BL16.91d 12.91 51.48 0.007
No8-BL10.25d 6.25 53.19 0.008
Figure 3-20 shows the compressive stress-strain relationship of reinforcing
steel bars restrained against buckling with steel nuts. Table 3-7 presents the peak
values. It can be seen that large stresses even greater than the ultimate compressive
strength of the bar can be achieved when the total axial gap between the nuts and the
steel cup was less than 0.5 times the bar diameter. The stress was higher than the
0
50
100
150
200
250
300
350
400
0
10
20
30
40
50
60
0 0.01 0.02 0.03 0.04
Str
ess
(M
Pa
)
Str
ess
(k
si)
Strain (in/in)
No4-BL11.00d
No8-BL16.91d
No8-BL10.25d

76
reinforcement ultimate strength since the gap was closed and the nuts were engaged in
compression. The strain at the peak stress was approximately 3%.
Figure 3-20. Stress-strain relationship of deformed reinforcing bars with nuts
Table 3-7. Stress-strain characteristics of deformed reinforcing bars enclosed in nuts
Specimen ID Axial Gap Peak Stress (ksi) Peak Strain (in./in.)
No4-BL11.00d 14db 23.45 0.005
No4-BL11.00d-Nuts-G0.875 1.75db 28.14 0.005
No4-BL11.00d-Nuts-G0.42 0.85db 40.46 0.034
No4-BL11.00d-Nuts-G0.20 0.4db 144.71 0.034
Figure 3-21 shows stress-strain relationships of all BRR specimens. Table 3-8
presents a summary of the test results. It can be seen that with proper detailing (e.g.
total axial gap, tube diameter and wall thickness), it is possible to achieve large stress
and strain capacities for the proposed buckling restrained reinforcement. The
compressive stress of BRR can exceed the ultimate strength of the bar because of the
contribution of the tube/grout after the gap closure. The compressive strain at the
peak stress can exceed 5%, which will be sufficient in most practical cases since the
strain of compressive reinforcement in a concrete section is usually controlled by the
core concrete strains. The core concrete strain capacity even in a highly confined
section does not exceed 5%.
0
200
400
600
800
1000
1200
0
50
100
150
200
0 0.01 0.02 0.03 0.04 0.05
Str
ess
(M
Pa)
Str
ess
(k
si)
Strain (in/in)
No4-BL11.00d-Nuts-G0.875
No4-BL11.00d-Nuts-G0.42
No4-BL11.00d-Nuts-G0.20

77
Figure 3-21. Stress-strain response of all BRR devices
Table 3-8. Stress-strain characteristics of BRR
Specimen ID Axial Gap Peak Stress (ksi) Peak Strain (in./in.)
No4-BL11.00d-TL5.0s-TG18-G3.0 6.00db 42.46 0.021
No4-BL11.00d-TL5.0s-TG16-G2.94 5.88db 68.61 0.033
No4-BL12.28d-TL7.5s-TG16-G0.5 1.00db 168.03 0.062
No4-BL12.20d-TL7.5s-TG14-G0.5 1.00db 222.97 0.078
No4-BL14.81d-TL7.5s-TG14-G0.5 0.50db 196.24 0.052
No4-BL14.81d-TL7.5s-TG13-G0.5 0.50db 191.63 0.056
No8-BL14.56d-TL10.0s-TG13-G0.5 0.50db 150.04 0.113
No8-BL17.00d-TL10.0s-TG11-G1.0 0.50db 112.20 0.064
Figure 3-22 shows the stress-strain relationship of three BRRs with different
gaps. It can be seen that the total axial gap is a critical parameter to control the
behavior of BRR, and should not exceed 0.5 times the bar diameter.
0
400
800
1200
1600
2000
0
50
100
150
200
250
300
0 0.04 0.08 0.12 0.16 0.2
Str
ess
(M
Pa)
Str
ess
(k
si)
Strain (in/in)
No8-BL16.91d No4-BL11.00dNo4-BL11.00d-TL5.0s-TG16-G3.0 No4-BL11.00d-TL5.0s-TG16-G2.94No4-BL12.20d-TL7.5s-TG14-G0.5 No4-BL12.06d-TL7.5s-TG16-G0.5No4-BL14.81d-TL7.5s-TG14-G0.5 No4-BL14.81d-TL7.5s-TG13-G0.5No8-BL14.56d-TL10.0s-TG13-G0.5 No8-BL17.00d-TL10.0s-TG11-G1.0

78
Figure 3-22. Stress-strain relationship of buckling restrained reinforcement (BRR) devices
with different unsupported length
Furthermore, it was observed that the overall length of BRR also plays a
significant role in a way that shorter BRR with the same tube properties exhibit higher
compressive stress and strain capacities as shown in Fig. 3-23. Figure 3-24 shows the
stress-strain relationship of two BRRs with the same properties but two different
thickness for tubes. It can be seen that the tube thickness has insignificant effect on
the BRR performance if tubes are designed properly.
Figure 3-23. Stress-strain relationship of buckling restrained reinforcement (BRR) with
different overall length of deformed bars
0
200
400
600
800
1000
1200
1400
1600
1800
2000
0
50
100
150
200
250
300
0 0.02 0.04 0.06 0.08 0.1 0.12 0.14
Str
ess
(MP
a)
Str
ess
(k
si)
Strain (in/in)
No4-BL10.94d-TL5.0s-TG16-G1.94
No4-BL12.20d-TL7.5s-TG14-G0.5
No4-BL12.29d-TL7.5s-TG16-G0.29
0
200
400
600
800
1000
1200
1400
1600
1800
2000
0
50
100
150
200
250
300
0 0.02 0.04 0.06 0.08 0.1 0.12 0.14
Str
ess
(M
Pa
)
Str
ess
(k
si)
Strain (in/in)
No4-BL14.81d-TL7.5s-TG14-G0.5
No4-BL12.20d-TL7.5s-TG14-G0.5

79
Figure 3-24. Stress-strain relationship of buckling restrained reinforcement (BRR) with
different thickness of tube
Only one No. 4 BRR was tested under cyclic loading to failure as shown in
Fig. 3-25. The test results confirmed that BRR can exhibit larger compressive stress
and strain capacities under cyclic loads without low-cycle fatigue.
(a) Stress-strain response of BRR device (b) BRR device at
failure
Figure 3-25. Behavior of buckling restrained reinforcement (BRR) device due to cyclic loading
3.6. Summary and Conclusions
All previous studies focused on the performance of dog-bone energy
dissipaters to be used in hybrid rocking columns. In an attempt to minimize
0
200
400
600
800
1000
1200
1400
1600
1800
2000
0
50
100
150
200
250
300
0 0.02 0.04 0.06 0.08 0.1 0.12 0.14
Str
ess
(M
Pa
)
Str
ess
(k
si)
Strain (in/in)
No4-BL14.81d-TL7.5s-TG14-G0.5
No4-BL14.81d-TL7.5s-TG13-G0.5
0
200
400
600
800
1000
1200
1400
1600
0
50
100
150
200
250
0 0.02 0.04 0.06 0.08 0.1 0.12 0.14
Str
ess (M
Pa)
Str
ess (
ksi)
Strain (in/in)
No4-BL14.81d-TL7.5s-TG13-G0.5
No4-BL14.81d-TL7.5s-TG14-G0.5
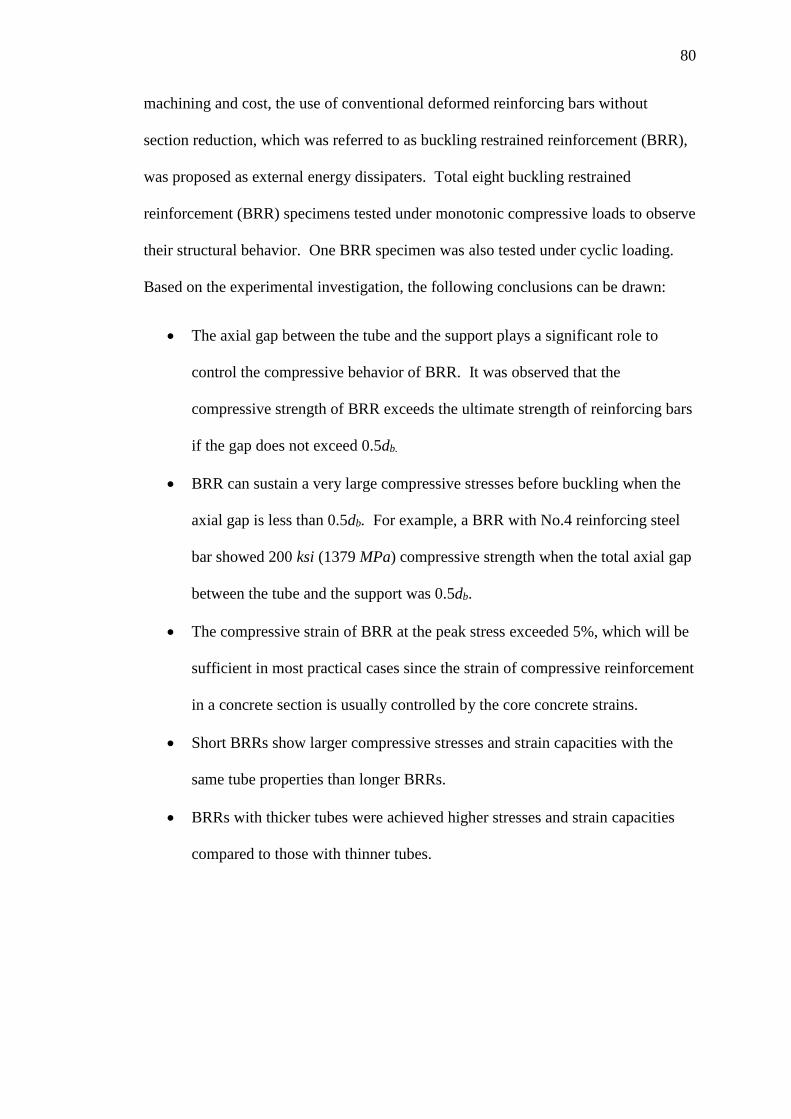
80
machining and cost, the use of conventional deformed reinforcing bars without
section reduction, which was referred to as buckling restrained reinforcement (BRR),
was proposed as external energy dissipaters. Total eight buckling restrained
reinforcement (BRR) specimens tested under monotonic compressive loads to observe
their structural behavior. One BRR specimen was also tested under cyclic loading.
Based on the experimental investigation, the following conclusions can be drawn:
The axial gap between the tube and the support plays a significant role to
control the compressive behavior of BRR. It was observed that the
compressive strength of BRR exceeds the ultimate strength of reinforcing bars
if the gap does not exceed 0.5db.
BRR can sustain a very large compressive stresses before buckling when the
axial gap is less than 0.5db. For example, a BRR with No.4 reinforcing steel
bar showed 200 ksi (1379 MPa) compressive strength when the total axial gap
between the tube and the support was 0.5db.
The compressive strain of BRR at the peak stress exceeded 5%, which will be
sufficient in most practical cases since the strain of compressive reinforcement
in a concrete section is usually controlled by the core concrete strains.
Short BRRs show larger compressive stresses and strain capacities with the
same tube properties than longer BRRs.
BRRs with thicker tubes were achieved higher stresses and strain capacities
compared to those with thinner tubes.

81
3.7 References
1. ASTM Standard C39-12 (2012). "Standard test method for compressive
strength of cylinder concrete specimens," ASTM International, West
Conshohocken, PA.
2. Guerrini, G., Restrepo, J. I., Massari, M., and Vervelidis, A. (2014). "Seismic
behaviorof posttensioned self-centering precast concrete dual-shell steel
columns," Journal of structural engineering, 141(4), 04014115.
3. Guerrini, G., Restrepo, J., Vervelidis, A., Massari,M. (2015). “Self-Centering
Precast Concrete Dual-Steel-Shell Columns for Accelerated Bridge
Construction: Seismic Performance, Analysis, and Design,” PEER Report No.
2015/13, Pacific Earthquake Engineering Research Center, Headquarters at the
University of California, Berkeley
4. Guo, T., Cao, Z., Xu, Z., and Lu, S. (2015). "Cyclic load tests on self-
centering concrete pier with external dissipators and enhanced durability,"
Journal of structural engineering, 142(1), 04015088.
5. Marriott, D., Pampanin, S., and Palermo, A. (2009). "Quasi‐static and pseudo‐
dynamic testing of unbonded post‐tensioned rocking bridge piers with external
replaceable dissipaters," Earthquake Engineering & Structural Dynamics,
38(3), 331-354.
6. Marriott, D., Pampanin, S., and Palermo, A. (2011). "Biaxial testing of
unbonded post‐tensioned rocking bridge piers with external replacable
dissipaters. Earthquake Engineering & Structural Dynamics," 40(15), 1723-
1741.
7. Mashal, M., Palermo, A., and Chegini, Z. (2014). "Quasi-static cyclic tests of
half-scale fully precast bridge bents incorporating emulative and posttensioned

82
low damage solutions," Paper presented at the 2nd European Conf. of
Earthquake Engineering and Seismology, Turkish Earthquake Foundation,
Istanbul, Turkey.
8. Mesa, A., and Dario, A. (2010). "Developments of Advanced Solutions for
Seismic Resisting Precast Concrete Frames," PhD thesis, University of
Canterbury, Christchurch, New Zealand.
9. Palermo, A., and Pampanin, S. (2008). "Enhanced seismic performance of
hybrid bridge systems: Comparison with traditional monolithic solutions,"
Journal of Earthquake Engineering, 12(8), 1267-1295.
10. Sarti, F., Palermo, A., and Pampanin, S. (2016). "Fuse-Type External
Replaceable Dissipaters: Experimental Program and Numerical Modeling,"
Journal of structural engineering, 04016134.
11. White, S., and Palermo, A. (2016). "Quasi-Static Testing of Posttensioned
Nonemulative Column-Footing Connections for Bridge Piers," Journal of
Bridge Engineering, 21(6), 04016025.

83
CHAPTER 4. BEHAVIOR OF
MODERN BEAM-COLUMN
CONNECTIONS
4.1. Introduction
Reinforced concrete (RC) buildings need to be designed for large lateral
displacement capacities in high seismic regions. Seismic detailing and special
provisions by current building codes ensure collapse prevention. For special moment-
resisting frames, current codes are as based on a design philosophy of “strong
columns, weak beams” in which all plasticity is concentrated on beams and columns
and the beam-column joints should experience minimal damage. The performance of
an exterior beam-column (BC) joint designed based on the current code (ACI 318,
2014), was experimentally investigated in this chapter to evaluate the design
philosophy.
First, a nine story special RC building was designed for a high seismic region.
A half-scale beam-column specimen was design and constructed based on one of the
exterior joints of the first story of the prototype model. A new test setup was
designed to include the actual boundary conditions. Then, the specimen was tested
under a cyclic loading protocol to simulate seismic effects. Finally, the performance
of the specimen was evaluated.

84
4.2. Research Objectives
Several studies have investigated the performance of BC joints (Pauly and
Park, 1970; Ehsani and Wight, 1995; Scott, 1996; Li et al. 2009; Tsonos, 2009).
However, none of them successfully modeled the boundary conditions in their
experiments. The main goal of this study was to investigate the seismic performance
of a modern BC joint including actual boundary conditions.
4.3. Past Studies on Beam-Column Joint
The behavior of external beam-column joint under cyclic loading has been
extensively investigated experimentally in the past few decades, which were mainly
focused on joint shear detailing. The summary of selected previous studies is reported
herein.
4.3.1. Study by Paulay and Park (1978)
Paulay and Park (1978) tested an interior-beam column joint of a ductile
reinforced concrete frame under reversed cyclic loading. This study concluded that
the shear resistance of the concrete in the joint is because of the contribution of the
joint diagonal struts. Due to forming the plastic hinge in the beam, the joint remained
elastic, and the shear was completely carried by the concrete as there was no
degradation in the shear force in the elastic region. The study also concluded that the
diameter of the beam longitudinal bars should not be excessive to avoid the bond
failure in the joint.
4.3.2. Study by Durrani and Wight (1985)
Durrani and Wight (1985) tested an interior beam-column joint under a cyclic
loading. It was reported that the joint shear stresses had significant effect on the

85
strength and stiffness of bean-column connection at high ductility levels (greater than
2). At lower ductilities, the effect of the transverse reinforcement of the joint was
more significant. It was observed that joint shear deformations, bars slippage, and the
pinching of hysteretic loops were mostly affected by the joint shear stresses.
Moderate amount of reinforcement with a low joint shear stress tends to be a better
design option than a heavily reinforced joint with high shear stresses. This study was
also concluded that the minimum column to beam flexural strength ratio of 1.5 is
suitable for the seismic design.
4.3.3. Study by Ehsani and Wight (1985)
Ehsani and Wight (1985) tested six exterior beam-column connections under
cyclic loading. The test variable were varied the column – beam flexural capacity, the
joint shear stresses, and the transverse reinforcement in the joint. The study
concluded that larger column to beam flexural strength ratios significantly improve
the behavior of beam-column connections. The column to beam flexural strength
ratio of 1.4 and higher prevents the formation of plastic hinges in the joint region. A
significant improvement in the behavior was observed for joints with a shear stress of
12√𝑓𝑐′ (psi) or lower. The study also concluded that additional transverse
reinforcement in the joint enhances the overall behavior of the connection.
4.3.4. Study by Ehsani et al. (1987)
Ehsani et al. (1987) tested four exterior beam-column connections under
cyclic loading. Both normal strength concrete (NSC) and high strength concrete
(HSC) were incorporated. This study concluded that RC joints with HSC exhibit
sufficient ductility and show similar ductile hysteretic response compared to RC

86
frames with NSC in the joint region. Specimens with high column to beam flexural
strength ratios and low joint shear stresses showed large displacement capacities.
4.3.5. Study by Fujii and Morita (1991)
Fujii and Morita (1991) tested eight, 1/3-scale exterior and interior beam-
column connections. The strength of reinforcing bars in beams, column axial loads,
and the joint transverse reinforcement were varied in these tests. It was concluded
that 200% increase in the column axial load [30 (133.4) to 90 kips (400.3 kN)] by did
not improve of the shear strength of the interior joints, but it was improved by 10% in
exterior joints. Furthermore, it was also observed that increasing the joint shear
reinforcement ratio from 0.41 to 1.15% by volume had insignificant effect on the
overall behavior
4.3.6. Study by Joh et al. (1991)
Joh et al. (1991) tested two series of beam-column joints in RC frames. This
study concluded that joint heavily reinforced with transverse bars showed minimal
bond-slip effects. This study suggested that bond deterioration of beam reinforcement
in the joint may be prevented significantly by relocation the plastic hinges away from
the column face.
4.3.7. Study by Scott (1996)
Scott (1996) tested 17 exterior beam-column connections subjected to both monotonic
and cyclic loading. Test variables were the beam depth, the beam tension steel
percentage, reinforcement details of beam tension steel, and the column load. The
study used three different seismic detailing of beam reinforcement: beam

87
reinforcement bent up or down into the column and beam reinforcement bent into U-
bar. The study compared the theoretical moment capacities with those from the test. It
was found that the performance of joints with reinforcement bent-down and U-bar
detailing was better that those with the bars-bent-up detailing. In case of seismic
loading, the bond deteriorated in the connection due to the large strain increments
from each loading cycle as well as concrete spalling away from the reinforcement.
4.3.8. Study by Hwang et al. (2005)
Hwang et al. (2005) tested an exterior beam-column connection under
earthquake type loading to investigate the effect of joint hoops on the shear strength.
It was concluded that the joint hoops act as tension ties and constrain the crack width.
The hoop reinforcement in joint up to 12 in. (304.8 mm) of spacing has no significant
influence to the performance of joints. This study also concluded that the
intermediate longitudinal bar of beams passing through the joint cannot be considered
as alternative to horizontal joint hoops due to their participation in beam flexure
behavior.
4.3.9. Study by Tsonos (2007)
Tsonos (2007) tested four half-scale exterior beam-column connections
subjected to a large number of inelastic cycles. This study followed weak beam-
strong column design philosophy based on Eurocode, Greek code, and ACI318-05
code. This study reported excessive damage in the joint region in two beam-column
connections as they performed poorly under reversed cyclic lateral deformations.
These two connections exhibited shear failure during the early stages of cyclic

88
loading. This happened because the calculated joint shear stress was higher than the
joint ultimate strength.
4.3.10. Study by Walsh et al. (2016)
Walsh et al. (2016) performed an experimental study on BC joints extracted
from a building damaged in 2016 Christchurch earthquake. Three precast RC
moment-resisting frame specimens were extracted and tested under cyclic loading. It
was found that the precast RC beams with shear ductile detailing had lower
displacement capacity compared to those of conventionally detailed beams.
4.4. Experimental Setup for Past Studies
The review of the previous experimental studies revealed that none of these
studies modeled the actual boundary condition of a beam-column joint the test in
which column and beam can both rotate and sway (Fig. 4-1). Many of the studies
installed an actuator at the end of beam to apply the cyclic load to the test specimen.
A handful of studies (Tsonos, 2009; Durrani, 1995; Carlos et al., 2001) applied actual
lateral load to the tip of the column but failed to allow the beam to sway with the
column. Li et al., (2009) used ideal test setup condition for lightly reinforced beam-
column joints under cyclic loading but they did not apply axial load at column head
(Fig. 4-5). However, this study did not allow the beam for horizontal movement.
Figure 4-6 shows the ideal condition for exterior beam-column connection.

89
Figure 4-1. Test setup for exterior beam-column connection (Youssef et al., 2008)
Figure 4-2. Applied load and static equilibrium for exterior beam-column connection (Alva et
al. 2013)

90
Figure 4-3. Test setup for exterior beam-column connection (Tsonos, 1999)
Figure 4-4. Experimental setup for interior beam-column connection (Quintero-Febres, 2001)

91
Figure 4-5. Test setup for interior beam-column connection (Li et at., 2009)
Figure 4-6. Actual boundary condition for exterior beam-column connection
a
Hx
Pu
b
FL 01
1 2 h
bottom
-sto
rey
1 2 h
top-sto
rey
1
2 Lbeam-span

92
4.5. Design of Prototype RC Building
A nine-story special moment-resisting RC office building was design
according to current specifications to serve as prototype model. One of the building
exterior beam-column joints was selected for experimental study. This section
includes a review of special moment-resisting frames, design of nine-story office
building as prototype, and design of the test specimen.
4.5.1. Special Moment Resisting Frames
The current earthquake-resistant design philosophy allows damage during
earthquake in some predetermined structural components to provide higher
displacement capacity. RC frames can be design as ordinary, intermediate, and
special for different seismic demands. Special moment-resisting frames (SMRF) are
used in high seismic regions since they exhibit relatively lateral displacement
capacities without significant loss of stiffness and strength. SMRF are designed based
on the “strong column, weak beam” philosophy since frames in which beams fail first
exhibit larger displacement capacities than those in which column fails before beams
as shown in Fig. 4-7. The design requirements for SMRF are presented in ACI318-14
(2014).

93
(a) Columns failure before beams (b) Beams failure before columns
Figure 4-7. Collapse mechanism for moment-resisting frames
4.5.2. Design of Nine-Story Special Moment-Resisting RC
Building
A five-bay by five-bay nine-story office building (Fig. 4-8, Fig. 4-9, and Table
4-1) was considered in the present study. The building was assumed to constructed in
Los Angeles, CA (Latitude 34.052235 N and Longitude 118.243683), which is
considered a high seismic zone. “Special moment-resisting” RC frames were selected
as the building lateral load resisting system. The floor plan was assumed to be the
same for all levels.
ASCE 7-10 (2010) and ACI318-14 (2014) were selected as the main design
codes. SAP2000 was used as the design software. Tables 4-2 to 4-5 present a
summary of design requirements and Table 4-6 presents the final size of structural
elements (beam and column). The specific concrete strength for all elements was
5000 psi (34.47 MPa).

94
Figure 4-8. Plan view of nine-story RC building
15'-
0"
15'-
0"
15'-
0"
15'-
0"
15'-
0"
15'-0" 15'-0" 15'-0" 15'-0" 15'-0"
C'C
Joint "A"
1
2
3
4
5
6
A B C D E F
N

95
Figure 4-9. Elevation of nine-story building
Table 4-1. Configuration of proposed nine-story RC building
Description Size/Dimension Unit
No. of Story 9
No. of Bay along X-axis 5
No. of Bay along Y-axis 5
Span Length c/c (Both ways) 15 ft
Floor Height 12 ft
Slab thickness 5 In.
12'-
0"
12'-
0"
12'-
0"
12'-
0"
12'-
0"
12'-
0"
12'-
0"
Level-1
Level-2
Level-3
Level-4
Level-5
Level-6
Level-7
Level-8
Level-9
ELEVATION (3-3)
Joint "A"
GL
A B C D E F
12'-
0"
12'-
0"
15'-0" 15'-0" 15'-0" 15'-0" 15'-0"

96
Table 4-2. Dead and Live loads for proposed nine-story RC building
Load Type Load Unit
A. Floor Load
Floor Finish (FF) 30 psf
Partition Wall (PW) 15 psf
Superimposed Dead Load (SD) 15 psf
Live Load (LL) 50 psf
B. Roof Load
Floor Finish (FF) 50 psf
Live Load (LL) 20 psf
C. Exterior Wall Load (Stud walls with brick veneer)
Exterior Line Load (LD) 0.48 k/ft
Exterior Line Load (LD) for roof 0.20 k/ft
Table 4-3. Seismic analysis of Nine-Story RC building
Type/Category Symbol Type/Value
Soil site class D
Seismic risk category ll
Seismic design category SDC D
Response modification coefficient R 8
The importance factor Ie 1
Peak ground acceleration PGA 0.92g
Spectral response acceleration parameter
SDS 1.622g
SD1 0.853g
SS 2.433g
S1 0.853g
Deflection amplification factor Cd 5.5
Over strength factor Ωo 3
Redundancy factor ρ 1
Table 4-4. Displacement requirements
Story
Level
Displacement (in.)
Analysis Result Story
Displacement
Amplified
Displacement
Allowable
Displacement
9 2.98 0.20 1.10 2.88
8 2.78 0.36 1.96 2.88
7 2.42 0.45 2.48 2.88
6 1.97 0.40 2.22 2.88
5 1.57 0.44 2.43 2.88
4 1.12 0.41 2.27 2.88
3 0.71 0.29 1.59 2.88
2 0.42 0.27 1.47 2.88
1 0.15 0.15 0.85 2.88

97
Table 4-5. Load combinations
Load No. Load combination
1 1.4 DL
2 1.2 DL + 1.6 LL
3 1.2 DL + 1.0 LL + 1.0 EQX
4 1.2 DL + 1.0 LL - 1.0 EQX
5 1.2 DL + 1.0 LL + 1.0 EQY
6 1.2 DL + 1.0 LL - 1.0 EQY
7 0.9 DL + 1.0 EQX
8 0.9 DL - 1.0 EQX
9 0.9 DL + 1.0 EQY
10 0.9 DL - 1.0 EQY
DL = Dead load; LL = Live load; EQX = Earthquake load in X direction, EQY = Earthquake load in Y
direction
Table 4-6. Final dimension of structural elements for story RC building
Element Type Floor Level Dimension
(in. × in.)
Column Ground floor to 3rd floor level 30 × 30
3rd floor level to 6th floor level 24 × 24
7th floor level to 9th floor level 20 × 20
Beam Ground floor to 3rd floor level 20 × 30
3rd floor level to 6th floor level 20 × 24
7th floor level to 9th floor level 20 × 20
4.5.3. Design of Prototype Beam-Column Connection
The building was designed for all possible load combinations meeting the
requirement of the codes. Subsequently, Joint A (Fig. 4-8 and Fig. 4-9) was selected
for the experimental study. This section includes the design parameters and the
detailing of Joint A.
ASTM A706 Grade 60 deformed reinforcement was used for all members.
The column design axial load, P, was 272 kips (1210 kN). Seismic detailing was
based on ACI 318 (2014) for special moment-resisting frames. The detailing of the
prototype beam-column specimen is shown in Fig. 4-10.

98
Figure 4-10. Detailing of prototype exterior beam-column joint
4.5.4. Design of Half-Scale Beam-Column Specimen
A half- model of the prototype beam-column specimen was selected for
testing in the present study. The scaling of test model was generally based on the
2'-6"
2'-6"
4'-9"
2'-6"
4'-9"
6'-0"
6'-0"
5'-0"
6'-3"
2'-6"
CL
CL
#[email protected]"c/c
Pu = 272 kips
2'-6"
2'-6"
#[email protected]"c/c
COLUMN SECTION A-A
Long Steel:
8 #10
BEAM SECTION B-B
4 #[email protected]"c/c
#[email protected]"c/c
#[email protected]"c/c
#[email protected]"c/c
2'-6"
1'-8"
#[email protected]"c/c
3 # 8
3 # 7
Concrete Clear Cover
Beam 1.5" all side
Column 1.5" all side
Material Properties
f'c = 5000 psi
f'y = 60 ksi
2'-6"
B
B
A A

99
procedure proposed by Krawlnkler and Piotr (1982). However, some of the design
parameters such as concrete cover and confinement cannot be directly scaled down.
To successfully simulate the structural behavior of the selected exterior beam-column
specimen and to relate the findings to the actual nine-story building, confinement of
the test model was selected to be the same as that for the prototype specimen.
Mander’s model (Mander et al., 1998) was used to match the confinement of
the prototype and the test model sections (Fig. 4-11and 4-12). Note that due to the
spacing limitation for the beam stirrups, the confinement properties (specially the
residual stress and the strain capacity) of the half-scale beam was slightly higher than
those for the prototype beam. Flexural capacity of columns in special moment-
resisting frames should be at least 20% stronger than that of the beams. Moment-
curvature analysis of the test model section (Fig. 4-13) shows that this requirement is
met. The detailing of the test model is shown in Fig. 4-14.
Figure 4-11. Confined concrete stress-strain relationship for prototype and half-scale columns
0
5
10
15
20
25
30
35
40
45
0
1
2
3
4
5
6
7
8
0 0.003 0.006 0.009 0.012 0.015 0.018
Str
ess
(M
Pa
)
Str
ess
(k
si)
Strain (in/in)
Column Section 15" X 15"
Column Section 30" X 30"

100
Figure 4-12. Confined concrete stress-strain relationship for prototype and half-scale beams
Figure 4-13. Moment–curvature relationships for beam and column of test model
0
5
10
15
20
25
30
35
40
45
0
1
2
3
4
5
6
7
8
0 0.003 0.006 0.009 0.012 0.015 0.018
Str
ess
(M
Pa
)
Str
ess
(k
si)
Strain (in/in)
Beam Section 10" X 15"
Beam Section 20" X 30"
0
200
400
600
800
1000
1200
1400
1600
0 0.002 0.004 0.006 0.008 0.01
Mo
me
nt
(kip
-in
)
Curvature (rad/in)
Column Section: 15"x15"
Beam Section: 10"x15"

101
Figure 4-14. Detailing of test beam-column model
4.6. Experimental Program
The half-scale beam-column specimen was constructed and tested the Lohr
Structural Laboratory at South Dakota State University (SDSU) to investigate the
performance of the special moment-resisting building designed based on the current
codes. The detail of test program is described in this section.
4.6.1. Material Properties
Ready mix concrete with a target compressive strength of 5000 psi (34.47
MPa) was used to cast the members. Eight ASTM A706 Grade 60 No. 5 bars were
CL
CL
CL
8"
3'-0"
3'-0"
8"
1'-3"
10"
1'-3" 2#5
2#4
#[email protected]"c/c
#[email protected]"c/c
3'-11
2"
8"
#[email protected]"c/c
#[email protected]"c/c
P = 68 kips
#[email protected]"c/c #[email protected]"c/c
1'-3"1'-3"
#[email protected]"c/c
COLUMN SECTION
Long Steel: 8#5
BEAM SECTION
11
2"
11
2"
[ HALF-SCALE MODEL]
11 2"
11 2"
11
2"
Material Properties
f'c = 5000 psi
f'y = 60 ksi
Concrete clear cover 11
2"
1'-3"

102
used as the column longitudinal reinforcement and the column was transversely
reinforced with No. 3 stirrups at 3.5 in. (88.9 mm) on center. For the beam, 2-No. 5
and 2-No. 4 bars (both ASTM A706 Grade 60 were used the top and bottom of the
section, respectively. To match the confinement of the scaled model beam with that
of the prototype, No. 2 deformed steel wire stirrups (with a diameter of 0.25 in. (6.35
mm) conforming to ASTM A496) spaced 3.25 in. (82.5 mm) were used as transverse
reinforcement. Typical properties of the deformed bars and wires used in the test
model are presented in Table 4-6 and Table 4-7.
Table 4-7. Typical properties of reinforcing steel bars
Property Value
Grade 60
ASTM Type A706
Yield Stress, 𝑓𝑦 (ksi) 60
Modulus of Elasticity, 𝐸𝑠 (ksi) 29,000
Expected Yield Stress, 𝑓𝑦𝑒 (ksi) 68
Ultimate Tensile Strength, 𝑓𝑢 (ksi) 95
Expected Yield Strain, ɛ𝑦𝑒 (in.) 0.0023
Ultimate Strain, ɛ𝑢 (in./in.) 0.09
Table 4-8. Typical properties of deformed wire
Property Value
ASTM Type A496
Yield Stress, 𝑓𝑦 (ksi) 75
Modulus of Elasticity, 𝐸𝑠 (ksi) 29,000
Ultimate Tensile Strength, 𝑓𝑢 (ksi) 85
4.6.2. Pretest Load and Displacement Relationship
A pretest pushover analysis was performed to estimate the yield and ultimate
displacements of the beam-column joint (Fig. 4-15). OpenSees (2013) was used for
the analytical study. It was found that the longitudinal reinforcement of the beam will
fail first indicating that a large displacement will be achieved. The yield and the
ultimate displacements based on the pretest analysis were 0.24 in. (6.1 mm) and 2.75
in. (69.85 mm), respectively.

103
Figure 4-15. Pretest lateral force-displacement relationship for beam-column test model
4.6.3. Construction of Test Specimen
Figure 4-16 shows the steel cage and the formwork. Bar spacers were used to
provide clear cover of 1.5 in. (38 mm). The slump of the ready mix concrete was 4.5
in. measured according to ASTM standard C143 (2012) (Fig. 4-17). Figures 4-18 to
4-20 shows the construction stages of the test specimen. Sixteen standard concrete
cylinders (6 by 12 in.) were collected for strength testing according to ASTM
Standard C617-12 (2012).
0
2
4
6
8
10
12
0 0.5 1 1.5 2 2.5 3 3.5
La
tera
l L
oa
d a
t C
olu
mn T
ip,
Fx
(k
ips)
Displacement, Δ (in)
Pretest Calculated Yield Point Ultimate Point

104
Figure 4-16. Steel cage and formwork
Figure 4-17. Slump of ready mix concrete

105
Figure 4-18. Concrete pouring for beam-column test specimen

106
Figure 4-19. Curing of beam-column test specimen
Figure 4-20. Beam-column test specimen

107
4.6.4. Test Setup
Figures 4-21 and 4-22 show the test setup designed for the beam-column
specimen. As was discussed before, previous experimental studies failed to simulate
the actual boundary condition of beam-column specimens in which both column and
beam should be free to sway under lateral loads. In an attempt to accurately model
the actual boundary conditions, a rocker and a roller were respectively designed for
the column base and the free end of the beam (Fig. 4-23). The rocker was made using
a heavy-duty steel shaft passing through a vertically slotted support and a steel pipe
installed at the column base (Fig. 4-23b). The beam end support was the same as that
of the column base but a long slotted hole was provided in the support (beam reaction
chair) to allow the specimen to move in the direction of the lateral loading (Fig. 4-
23c). The roller was restrained with a 1.5-in. (38.7-mm) threaded rod to prevent
uplift.
Figure 4-222 also shows the axial load setup in which the column 68-kip axial
load was applied by post-tensioning the rods using two 100-ton hollow-core jacks.
All setup components were design based on the capacity of the specimen according to
the allowable stress design (ASD) method of AISC (2011).

108
Fig
ure
4-2
1.
Tes
t se
tup
fo
r b
eam
-co
lum
n s
pec
imen
Actu
ato
r (C
ap. 22 k
ips)
Hyd
au
lic J
ack
Slo
tte
d h
ole
Lo
ad
cell
HS
S-b
eam
Re
actio
n C
hair
Ste
el I-
beam
Ste
el I-
beam
Ste
el I-
beam
Flo
or
Level
BC
Sp
ecim
en
Actu
ato
r S
upport
ing
Fra
me
Dyw
ida
g B
ar
(Ø1
1 4")
Lo
ad
cell
Lo
ad
cell
Re
actio
n C
hair
Ste
el I-
beam
LV
DT
LV
DT
LV
DT
LV
DT
LV
DT
LV
DT
Str
ing P
OD
Str
ing P
OD
Str
ing P
OD
Str
ing P
OD
Str
ing P
OD

109
Figure 4-22. Axial load test setup for beam-column specimen
HSS Beam
7"x7"x12"
Anchor Bolt
Actuator (22 kips)
Column
15"x15"
Beam
10"x15"
Steel Shaft (Ø 134")
Reaction Chair
6'-0"
CL
CL
Hollow Rec. Section
10"x10"x6"x0.5"
Hydaulic Jack
Load cell (100kips)Steel Plate
Steel Plate
Dywidag Bar (Ø 1 14")
Side View of Axial load Set up
Floor Level

110
(a) Complete test setup
(b) Reaction chair under beam (c) Reaction chair under column
Figure 4-23. Photograph of test setup for beam-column specimen
4.6.5. Instrumentations
The test specimen was instrumented with strain gauges, load cells, and
displacement measurement devices. Sixteen strain gauges were installed at different
locations (Fig. 4-24 and 4-25) of the beam-column specimen to measure the strains. Of
which, six strain gauges were installed on the top and the bottom of the longitudinal

111
reinforcing steel bars of the beam, six strain gauges were installed on the column
longitudinal bars of column at both inner and outer face of the joint, and the remaining
on the transverse reinforcement.
Figure 4-24. Location of strain gauges in beam-column specimen
Figure 4-25. Installation of strain gauges in beam-column specimen
Column Section
SG9, SG10, SG11SG12, SG13, SG14
SG15,SG16
SG12
Load Cell -1
Load Cell -2
SG13
SG14
SG15
SG16
SG1
SG2
SG3
SG6
SG5
SG4
SG7
SG8
SG11
SG10
SG9
3"3"
Beam Section
SG4,SG5, SG6
SG1,SG2, SG3
SG7,SG8

112
Six linear variable displacement transducers (LVDT) were installed at the top
and the bottom of the beam to measure the beam rotation and curvature (Fig. 4-26).
Furthermore, four string POTs were installed in different locations of the specimen
(Fig. 4-26) to measure the lateral displacements as well as the joint rotations.
An actuator with ±5 in. (±127 mm) stroke was used at the top of column to apply
lateral displacements.
Two 100-kip (444.8- kN) load cells were used at the top of the hydraulic jacks
to measure the axial load applied to the column. Two other load cells each with a 50-
kip (222.4 kN) capacity were used at the beam end roller to measure either the
compressive or tensile reactions.
Figure 4-26. Installation of LVDT, String POT, and Load Cell in beam-column
specimen
Load Cell -1
Load Cell -2
Load Cell -3 & 4
S POT 4
S POT 3
S POT 1
S POT 2
LVDT 1
LVDT 2
LVDT 3
LVDT 4
LVDT 5
LVDT6
4" 4" 4"

113
4.6.6. Loading Protocol
A displacement-based loading protocol (Fig. 4-27) conforming to the ACI
simulated seismic loading protocol (ACI 374.2R-13, 2013) was selected for the
testing of the beam-column specimen. Two full cycles were completed for each target
displacement. Two loading rates were utilized in the experiment: a displacement of
0.03 in./sec (0.76 mm/sec) up to 2 times the expected yield displacement to capture
the yield point, and a displacement rate of 0.15 in./sec (3.8 mm/sec) at higher
displacements. Drift ratio is defined as the ratio of the column tip displacement at the
actuator centerline to the column height from the pin to the actuator centerline (Fig. 4-
21). The column height was 72 in. (1828.8 mm)
Figure 4-27. Complete displacement-based loading protocol for beam-column specimen
-5
-4
-3
-1
0
1
2
4
5
-3.5
-2.5
-1.5
-0.5
0.5
1.5
2.5
3.5
0 4 8 12 16 20 24 28 32 36 40 44 48 52 56 60 64 68 72 76 80 84 88
Dri
ft r
ati
o (
%)
Dis
pla
cem
en
t (i
n)
Run
Loading History

114
4.7. Experimental Results
4.7.1 Compressive Strength of Concrete
A summary of the compressive strength of concrete cylinders tested according
to ASTM Standard C39-12 (2012) is presented in Table 4-9. Note that the reported
strengths are for both the beam and the column.
Table 4-9. Compressive strength of concrete
Age (day) Concrete Strength, 𝑓𝑐, (psi)
3 4075
14 4825
28 5110
Beam-Column Test Day 5415
Note: Three samples were tested for each day. The average data was reported.
4.7.2. Strength of Reinforcing Bar
Reinforcing steel bars and wires were tested according to ASTM Standard
A370-12 (2012). A summary of the measured mechanical properties is reported in
Table 4-10 and 4-11. Figure 4-28 to 4-30 shows the stress-strain behavior of
reinforcing steel bars.
Table 4-10. Measured mechanical properties for ASTM A706 steel bars
Property Bar Size
No. 3 No. 4 No. 5
Grade 60 60 60
Yield Stress, 𝑓𝑦 78.77 ksi (543.1 MPa) 77.25 ksi (532.6 MPa) 76.85 ksi (529.9 MPa)
Ultimate Tensile
Strength, 𝑓𝑢
117.8 ksi (812.2 MPa) 118.25 ksi (815.3 MPa) 113.27 ksi (781.0 MPa)
Strain at Peak
Stress, ɛ𝑢
0.0659 in./in. 0.0597 in./in. 0.0742 in./in.
Strain at fracture 0.119 in./in. 0.125 in./in. 0.139 in./in.

115
Table 4-11. Measured mechanical properties for ASTM A496 deformed wires
Figure 4-28. Measured stress-strain relationship for No. 5 deformed reinforcing steel bar
Figure 4-29. Measured stress-strain relationship for No. 4 deformed reinforcing steel bar
0
100
200
300
400
500
600
700
800
0
25
50
75
100
125
0 0.02 0.04 0.06 0.08 0.1 0.12 0.14 0.16
Str
ess
(M
Pa
)
Str
ess
(k
si)
Strain (in/in)
No.5_Sample-1
No.5_Sample-2
0
100
200
300
400
500
600
700
800
0
25
50
75
100
125
0 0.02 0.04 0.06 0.08 0.1 0.12 0.14 0.16
Str
ess
(M
Pa
)
Str
ess
(k
si)
Strain (in/in)
No. 4_Sample-1
No.4_Sample-2
No. 4_Sample-3
Property Bar Size
No. 2
Grade 60
Yield Stress, 𝑓𝑦 70.0 ksi (482.6 MPa)
Ultimate Tensile Strength, 𝑓𝑢 107.2 ksi (739.1 MPa)
Strain at Peak Stress, ɛ𝑢 0.0632 in./in.
Strain at fracture 0.146 in./in.

116
Figure 4-30. Measured stress-strain relationship for No. 3 deformed reinforcing steel bar
4.7.3. Observed Damage
The damages and crack pattern were monitored throughout the test. The
specimen withstand more than 20 full cycles before reinforcement fracture at the
bottom of the beam at 2.53 in. (3.51% drift ratio). Figures 4-31 to 4-36 show the
damage of the beam-column specimen at different drift ratios. During applying the
column axial load before the lateral load testing, a few cracks formed on the beam
(Fig. 4-31a) due to vertical reaction at the beam free end (roller support). The
reaction was cancelled out by adjusting the actuator displacement prior to testing.
The initial cracking slightly decreased the specimen stiffness in the push direction
(defined as the direction in which the beam bottom reinforcement is in tension) but
the overall effect of these cracks was insignificant since reinforcement did not yield.
The first crack was formed on the beam at a drift ratio of 0.34% during the
second cycle of 0.36% drift ratio. More cracks were observed at 1.46% drift ratio
mainly in the plastic hinge region (0.5h, where h is the depth of beam). Cracks were
also observed outside the plastic hinge region at higher drift ratios. Beam concrete
0
100
200
300
400
500
600
700
800
0
25
50
75
100
125
0 0.02 0.04 0.06 0.08 0.1 0.12 0.14 0.16
Str
ess
(M
Pa)
Str
ess
(k
si)
Strain (in/in)
No. 3_Sample-1
No. 3_Sample-2

117
cover spalled at the column interface at a drift ratio of 2.19% (Fig. 4-34b). However,
there was no concrete cover spalling for columns in the entire test. Only one crack
was observed on the column at 3.5% drift ratio (Fig. 4-35b). The first tensile
reinforcement yielded at SG 1 (Fig. 4-31a) at 0.19% push drift ratio during the first
cycle of 0.36%-drift ratio. This reinforcement fractured at 3.5% drift ratio during the
second cycle of 3.64%- drift ratio.
It can be concluded from the damage states that the special moment-resisting
beam-column specimen designed based on the current codes performed adequately
since all damage was concentrated in the beam and the column had minimal damage.
The “strong column, weak beam” philosophy was confirmed in this experiment.

118
(a) Drift ratio 0.09%
(b) Drift ratio 0.18%
Figure 4-31. Cracks pattern for beam-column joint at 0.09 and 0.18% drift ratio

119
(a) Drift ratio 0.36%
(b) Drift ratio 0.55%
Figure 4-32. Cracks pattern for beam-column joint at 0.36 and 0.55% drift ratio

120
(a) Drift ratio 0.73%
(b) Drift ratio 1.09%
Figure 4-33. Cracks pattern for beam-column joint at 0.73 and 1.09% drift ratio

121
(a) Drift ratio 1.46%
(b) Drift ratio 2.19%
Figure 4-34. Cracks pattern for beam-column joint at 1.46 and 2.19% drift ratio

122
(a) Drift ratio 2.90%
(b) Drift ratio 3.64% (failure)
Figure 4-35. Cracks pattern for beam-column joint at 2.9 and 3.64% drift ratio

123
(a) East-Side
(b) West-Side
Figure 4-36. Cracks pattern for beam-column joint after testing

124
4.7.4. Force-Displacement Relationship
Figure 4-37 shows the measured force-displacement relationship of the test
specimen. The force was the actuator force and the displacement was based on the
string POT No. 3 (Fig. 4-26). The maximum lateral force in the push and pull
direction was 7.98 (35.5) and 12.63 kips (56.2 kN), respectively. Note that the pull
lateral strength was 58% higher than that in the push since the total area of the beam
top reinforcement was 56% higher than that for the bottom reinforcement. The yield
displacement and the yield force in the push direction was 0.13 in. (3.3 mm) and 5.63
kips (25 kN), respectively (Fig. 4-38). Similarly, the yield displacement and the yield
force in the pull direction was 0.45 in. (11.4 mm) and 6.90 kips (30.7 mm),
respectively. The ultimate displacement of the beam-column specimen was 2.53 in.
(64.26 mm) at a lateral force of 12.63 kips (56.2 kN).
According to ASCE (2010), the allowable story drift ratio for this RC SMRF
building is 2%. The drift ratio capacity of the beam-column specimen was 3.5% in
the push direction and 3.59% in the pull direction. Therefore, this joint has at least
75% reserved capacity beyond the allowable drift ratio.

125
Figure 4-37. Lateral force-displacement relationship of beam-column specimen
-67
-55
-43
-31
-19
-7
5
17
29
41
53
65
-4.2 -3.15 -2.1 -1.05 0 1.05 2.1 3.15 4.2
-15
-12
-9
-6
-3
0
3
6
9
12
15
-3 -2 -1 0 1 2 3
Late
ral
Forc
e a
t C
olu
m T
ip
(kN
)
Drift ratio (%)
Late
ral
Forc
e a
t C
olu
mn
T
ip
(kip
s)
Displacement (in)
Displacement at Column Tip
ASCE Drift Limit

126
(a) Force-Displacement Envelope of Beam-Column Specimen
(b) Force-Displacement Envelope of Beam-Column Specimen
Figure 4-38. Force-displacement envelope for half-scale exterior beam-column joint
The beam roller support horizontal displacements (Fig. 4-39) and the joint
rotations at the column face (Fig. 4-40) were measured using string POTs 1 and 2
(Fig. 4-26). The maximum measured horizontal displacement of the roller was 1.29
in. (32.77 mm). The beam roller support reaction was also calculated from the
-67
-55
-43
-31
-19
-7
5
17
29
41
53
65
-4.2 -3.15 -2.1 -1.05 0 1.05 2.1 3.15 4.2
-15
-12
-9
-6
-3
0
3
6
9
12
15
-3 -2 -1 0 1 2 3
Late
ral
Forc
e a
t C
olu
m T
ip
(kN
)
Drift ratio (%)
La
tera
l F
orc
e a
t C
olu
mn
T
ip
(kip
s)
Displacement (in)
Backbone Curve
-67
-55
-43
-31
-19
-7
5
17
29
41
53
65
-4.2 -3.15 -2.1 -1.05 0 1.05 2.1 3.15 4.2
-15
-12
-9
-6
-3
0
3
6
9
12
15
-3 -2 -1 0 1 2 3
La
tera
l F
orc
e a
t C
olu
m T
ip
(kN
)
Drift ratio (%)
La
tera
l F
orc
e a
t C
olu
mn
T
ip
(kip
s)
Displacement (in)
PushPullYield PointUltimate Point

127
measured lateral load and the equilibrium equations (Fig. 4-41). It can be seen that
there is a good correlation between the measured and the calculated (from statics)
responses.
Figure 4-39. Horizontal displacement of beam roller support
Figure 4-40. Column face rotation
-67
-55
-43
-31
-19
-7
5
17
29
41
53
65
-3 -2 -1 0 1 2 3
-15
-12
-9
-6
-3
0
3
6
9
12
15
-2.16 -1.44 -0.72 0 0.72 1.44 2.16
Late
ral
Forc
e a
t C
olu
mn
T
ip (
kN
)
Drift ratio (%)
La
tera
l F
orc
e a
t C
olu
mn
T
ip
(kip
s)
Displacement (in)
Displacement at Column Center
-67
-55
-43
-31
-19
-7
5
17
29
41
53
65
-15
-12
-9
-6
-3
0
3
6
9
12
15
-0.04 -0.03 -0.02 -0.01 0 0.01 0.02 0.03 0.04
La
tera
l F
orc
e a
t C
olu
mn
T
ip (
kN
)
La
tera
l F
orc
e a
t C
olu
mn
T
ip
(kip
s)
Rotation of Column at Center (rad)
Column Rotation
Ø
Ø

128
Figure 4-41. Beam end reaction for beam-column specimen
4.7.5. Moment-Curvature Relationship
Plastic rotations were measured in the beam plastic hinge region. Figure 4-42
shows the beam rotation measured at the column interface at each cycle. The
curvature was also measured at three different locations of the beam from column
face using the measured rotations (Fig. 4-43). It can be seen that that the beam
curvature is higher close to the column interface indicating concentration of plasticity.
-133-113-93-73-53-33-13727476787107127
-4.2 -3.15 -2.1 -1.05 0 1.05 2.1 3.15 4.2
-30-26-22-18-14-10-6-226
101418222630
-3 -2 -1 0 1 2 3
Be
am
Re
act
ion
(k
N)
Drift ratio (%)
Beam
React
ion
(k
ips)
Displacement at Column Tip (in)
Measured Data
Static Calculation

129
Figure 4-42. Moment - rotation relationship for beam at column interface
Figure 4-43. Curvature profile for beam at different drift ratio
-135581
-110581
-85581
-60581
-35581
-10581
14419
39419
64419
89419
114419
-1200
-1000
-800
-600
-400
-200
0
200
400
600
800
1000
1200
-0.05 -0.04 -0.03 -0.02 -0.01 0 0.01 0.02 0.03 0.04 0.05
Late
ral
Forc
e a
t C
olu
mn T
ip (
kN
)
Late
ral
Forc
e a
t C
olu
mn
T
ip
(kip
s)
Rotation of Beam at Column Interface (rad)
-50.8
-25.8
-0.8
24.2
49.2
74.2
99.2
124.2
149.2
174.2
199.2
224.2
249.2
-2
0
2
4
6
8
10
-0.009 -0.006 -0.003 0 0.003 0.006 0.009
Dis
tan
ce f
rom
C
olu
mn
I
nte
rfa
ce (m
m)
Dis
tan
ce f
rom
C
olu
mn
I
nte
rfa
ce (i
n)
Curvature (rad/in)
Drift 0.55%
Drift 0.73%
Drift 1.09%
Drift 1.46%
Drift 2.19%
Drift 2.91%
Drift 3.64%
Push Pull

130
4.7.6. Strain Profile
Strains were measured for both longitudinal and transverse reinforcing bars of
the beam and column. The test data showed that the column longitudinal reinforcing
bars and the column transverse steel reinforcement did not yield during the cyclic
loading. All column bar strains were significantly lower than the yield strain.
Therefore, the column damage will be minimal during severe earthquakes if RC
frames are designed as SMRF. Nevertheless, the beam bottom longitudinal bars
yielded then fractured. Figure 4-44 shows the strain profile of the beam longitudinal
top and bottom reinforcement. The test data showed that the beam stirrups yielded
close the beam-column interface but did not failed during the test.
Figure 4-44. Strain profile for beam longitudinal reinforcement
-25.4
0
25.4
50.8
76.2
101.6
127
152.4
177.8
203.2
-1
0
1
2
3
4
5
6
7
8
-50000 -30000 -10000 10000 30000 50000
Str
ain
Gau
ge D
ista
nce f
rom
C
olu
mn
I
nte
rfa
ce (m
m)
Str
ain
Gau
ge D
ista
nce
from
C
olu
mn
I
nte
rfa
ce (i
n)
Strain (με)
Top Steel(No.5): Drift 2.9%
Top Steel(No.5): Drift 1.0%
Bottom Steel(No.4): Drift 2.9%
Bottom Steel(No.4):Drift 1.0%

131
4.7.7. Residual Displacements
In cyclic hysteresis, residual displacement is the displacement at the intersection of
the unloading curves with zero forces. Figure 4-45 shows the residual drift versus the
peak drift of the beam-column specimen. The residual drift is the ratio of the residual
displacement to the column height, which was 72 in. (1828.8 mm). The specimen
exhibited large residual displacements. Figure 4-46 shows the damage of the beam-
column specimen at zero forces subsequent to peak drifts simulating the specimen
damage after an earthquake.
Figure 4-45. Residual displacement of beam-column joint
0 0.2 0.4 0.6 0.8 1 1.2
0
1
2
3
4
0
1
2
3
0 1 2 3
Drift Ratio (%)
Dri
ft R
ati
o (
%)
Resi
dual
Dis
pla
cem
ent
(in
)
Peak Displacement (in/in)
Pull
Push

132
(a) After drift ratio of 0.73% (east side) (b) After drift ratio of 0.73% (west side)
(c) After drift ratio of 1.09% (east side) (d) After drift ratio of 1.09% (west side)
(e) After drift ratio of 2.19% (east side) (f) After drift ratio of 2.19% (west side)
(g) After drift ratio of 2.91% (east side) (h) After drift ratio of 2.91% (west side)
Figure 4-46. Damage of beam-column specimen at zero forces

133
4.8. Conclusions
The main objective of the present study was to investigate the structural
behavior of a half-scale exterior beam-column joint of a nine-story special moment-
resisting reinforced concrete building. A new boundary condition was incorporated to
simulate the actual beam-column behavior. The following conclusions can be made
based on the experimental data:
Column longitudinal and transverse reinforcement did not yield under the
cyclic loading and the column damage was insignificant. Therefore, beam-
column joints of special moment resisting frames (SMRF) designed using
current codes are sufficient to resist the joint shear stresses and to show
minimal damage.
Almost all cracks were formed in the beam. The beam longitudinal
reinforcing bars yielded then fractured at a high drift ratio. Therefore, “strong-
column, weak-beam” design philosophy can be achieved using current codes.
The drift ratio of the beam-column connection was 3.5% in the push direction
and 3.59% in the pull direction. The specimen exhibited 75% reserved
capacity beyond the ASCE allowable drift ratio.
Overall, it can be concluded that special moment-resisting frames designed
based on current codes are sufficient and exhibit larger displacements through
yielding of the beam reinforcement. Damage of columns and joint regions is expected
to be minimal.

134
4.9. References
1. American Concrete Institute (ACI) Committee 318 (2014). “Building code
requirements for structural concrete and commentary,” ACI 318-14, ACI,
Farmington Hills, MI.
2. American Concrete Institute (ACI) Committee 374 (2013). “Guide for testing
reinforced concrete structural elements under slowly applied simulated seismic
loads,” ACI 374.2R-13, ACI, Farmington Hills, MI.
3. AISC (2011). “Specification for structural steel buildings,” American Institute
of Steel Construction, Inc., One East Wacker Drive, Suite 700, Chicago,
Illinois 60601-1802
4. ASTM Standard C39-12 (2012). "standard test method for compressive
strength of cylinder concrete specimens," ASTM International, West
Conshohocken, PA.
5. ASTM Standard C143 (2012). "standard test method for slump of hydraulic-
cement concrete," ASTM International, West Conshohocken, PA.
doi:10.1520/C0143_C0143M-12
6. ASTM Standard C617-12 (2012). "standard practice for capping cylindrical
concrete specimens," ASTM International, West Conshohocken, PA.
7. ASTM Standard A706/A706M-09b (2009),” Standard specification for low-
alloy steel deformed and plain bars for concrete Reinforcement,” ASTM
International, West Conshohocken, PA.
8. ASTM Standard E8/E8M-11 (2011). “Standard test methods for tension
testing of metallic materials,” ASTM International, West Conshohocken, PA.

135
9. ASTM Standard A-496 (2007), “Standard specification for steel wire,
deformed, for concrete reinforcement,” ASTM International, West
Conshohocken, PA
10. ASTM International. A370-12 (2012). “Standard Test Methods and
Definitions for Mechanical Testing of Steel Products,” ASTM International,
West Conshohocken, PA, DOI: 10.1520/A0370-12a."
11. ASCE Standard (2010). “Minimum design loads for buildings and other
structures,” American Society of Civil Engineers (ASCE), 1801 Alexander
Bell Drive, Reston, Virginia 20191.
12. Alva, G.M.S. and de Cresce El, A.L.H. (2013). “Moment–rotation relationship
of RC beam-column connections: Experimental tests and analytical model,”
Engineering Structures, 56, pp.1427-1438.
13. Durrani, A. J., & Wight, J. K. (1985). "Behavior of interior beam-to-column
connections under earthquake-type loading," Paper presented at the Journal
Proceedings.
14. Ehsani, M., Moussa, A., and Valenilla, C. (1987). "Comparison of inelastic
behavior of reinforced ordinary-and high-strength concrete frames," Structural
Journal, 84(2), 161-169.
15. Ehsani, M., and Wight, J. (1985). "Exterior reinforced concrete beam-to-
column connections subjected to earthquake-type loading," Paper presented at
the Journal Proceedings.
16. Filippou, F. C., D’Ambrisi, A., and Issa, A. (1999). "Effects of reinforcement
slip on hysteretic behavior of reinforced concrete frame members," Structural
Journal, 96(3), 327-335.

136
17. Fujii, S., and Morita, S. (1991). "Comparison Between Interior and Exterior
R/C Beam-Column Joint Behavior," Special Publication, 123, 145-166.
18. Haach, V. G., El, A. L. H. D. C., and El Debs, M. K. (2008). "Evaluation of
the influence of the column axial load on the behavior of monotonically
loaded R/C exterior beam–column joints through numerical simulations,"
Engineering Structures, 30(4), 965-975.
19. Hwang, S.-J., Lee, H.-J., Liao, T.-F., Wang, K.-C., and Tsai, H.-H. (2005).
"Role of hoops on shear strength of reinforced concrete beam-column joints,"
ACI Structural Journal-American Concrete Institute, 102(3), 445-453.
20. IEBC Standard (2012). "International existing building code," International
code council, Inc., Country Club Hills, IL
21. Joh, O., Goto, Y., and Shibata, T. (1991). "Influence of Transverse Joint and
Beam Reinforcement and Relocation of Plastic Hinge Region on Beam
Column Joint Stiffness Deterioration," Special Publication, 123, 187-224.
22. Krawinkler, Helmut, and Piotr D. Moncarz (1982). "Similitude requirements
for dynamic models," Special Publication, 73, pp. 1-22
23. Li, B., Tran, C.T.N. and Pan, T.C. (2009). "Experimental and numerical
investigations on the seismic behavior of lightly reinforced concrete beam-
column joints," Journal of structural engineering, 135(9), pp.1007-1018.
24. Mander, J., Priestley, M., & Park, R. (1988) "Observed stress-strain behavior
of confined concrete," Journal of structural engineering, 114(8), 1827-1849
25. OpenSees. (2013). “Open System for Earthquake Engineering Simulations,”
Version 2.4.1, Berkeley, CA, Available online: http://opensees.berkeley.edu

137
26. Paulay, T., Park, R., and Preistley, M. (1978). "Reinforced concrete beam-
column joints under seismic actions," Paper presented at the Journal
Proceedings.
27. Quintero-Febres, C. G., & Wight, J. K. (2001). "Experimental study of
reinforced concrete interior wide beam-column connections subjected to
lateral loading," Structural Journal, 98(4), 572-582.
28. SAP2000 (2016). “Integrated finite element analysis and design of structures,”
CSI, Berkeley California
29. Scott, R. H. (1996). "Intrinsic mechanisms in reinforced concrete beam-
column connection behavior," ACI Structural Journal," 93(3), 336-346.
30. Tsonos, A.G. (1999). "Lateral load response of strengthened reinforced
concrete beam-to-column joints," ACI Structural Journal, 96, pp.46-56.
31. Tsonos, A. G. (2007). "Cyclic load behavior of reinforced concrete beam-
column subassemblages of modern structures," ACI Structural Journal, 104(4),
468.
32. Youssef, M.A., Alam, M.S. and Nehdi, M. (2008). "Experimental
investigation on the seismic behavior of beam-column joints reinforced with
superelastic shape memory alloys," Journal of Earthquake Engineering, 12(7),
pp.1205-1222.
33. Zhou, H. (2009). "Reconsideration of seismic performance and design of
beam-column joints of earthquake-resistant reinforced concrete frames,"
Journal of structural engineering, 135(7), 762-773.

138
CHAPTER 5. ANALYTICAL
STUDIES
5.1. Introduction
Analytical studies were carried out to investigate the seismic performance of
the special moment-resisting reinforced concrete beam-column test specimen as well
as reinforced concrete bridge columns confined with rubber. The detail of analytical
studies are reported herein.
5.2. Analytical Studies of Beam-Column Test Specimen
Robust analytical tools are required to accurately analyze and design structural
components, assess damage, and estimate their capacities. Analytical modeling
methods were proposed in this section to reproduce the overall response of the half-
scale beam-column specimen tested under cyclic loading as discussed in the previous
section. OpenSees (2013) was used for the analysis of the test model. Calculated
results are compared with those measured in the test. Table 5-1 presents the main
parameters of the beam-column test specimen.

139
Table 5-1. Parameters for half-scale beam-column test model
Parameter Column Beam
Length 72 in. (1828.8 mm) 45 in. (1143 mm)
Width 15 in. (381 mm) 10 in. (254 mm)
Depth 15 in. (381 mm) 15 in. (381 mm)
Size of longitudinal reinforcement No. 5 Top: No. 5
Bottom: No. 4
Total number of longitudinal
reinforcement 8
Top: 2
Bottom: 2
Diameter of longitudinal
reinforcement 0.625 in. (15.9 mm)
Top: 0.625 in. (16 mm)
Bottom: 0.5 in. (13 mm)
Size of transverse reinforcement No. 3 No. 2
Diameter of transverse reinforcement 0.375 in. (6 mm) 0.25 in. (6 mm)
Type of transverse reinforcement Ties Stirrup
Spacing 3.5 in. (76 mm) 3.25 in. (83 mm)
Clear concrete cover 1.5 in. (38 mm) 1.5 in. (38 mm)
Axial load 68 kips (302.5 kN) (5.6 f’c.Ag)
5.2.1. Description of Beam-Column Specimen Analytical Model
A three-dimensional finite element fiber-section model was constructed in
OpenSees (Fig. 5-1). Each section includes steel fibers, cover concrete fibers, and
core concrete (confined) fibers as shown in the figures. The support under the column
was considered as a pin (rocker) to allow rotation. The beam end support was
considered as a roller to allow horizontal movement. The column axial load of 68
kips (302.5 kN) was applied at the top of the column (Node 3). The compressive
strength of concrete at the test-day of the beam-column specimen was 5415 psi (37.4
MPa) as present in Table 5-2.
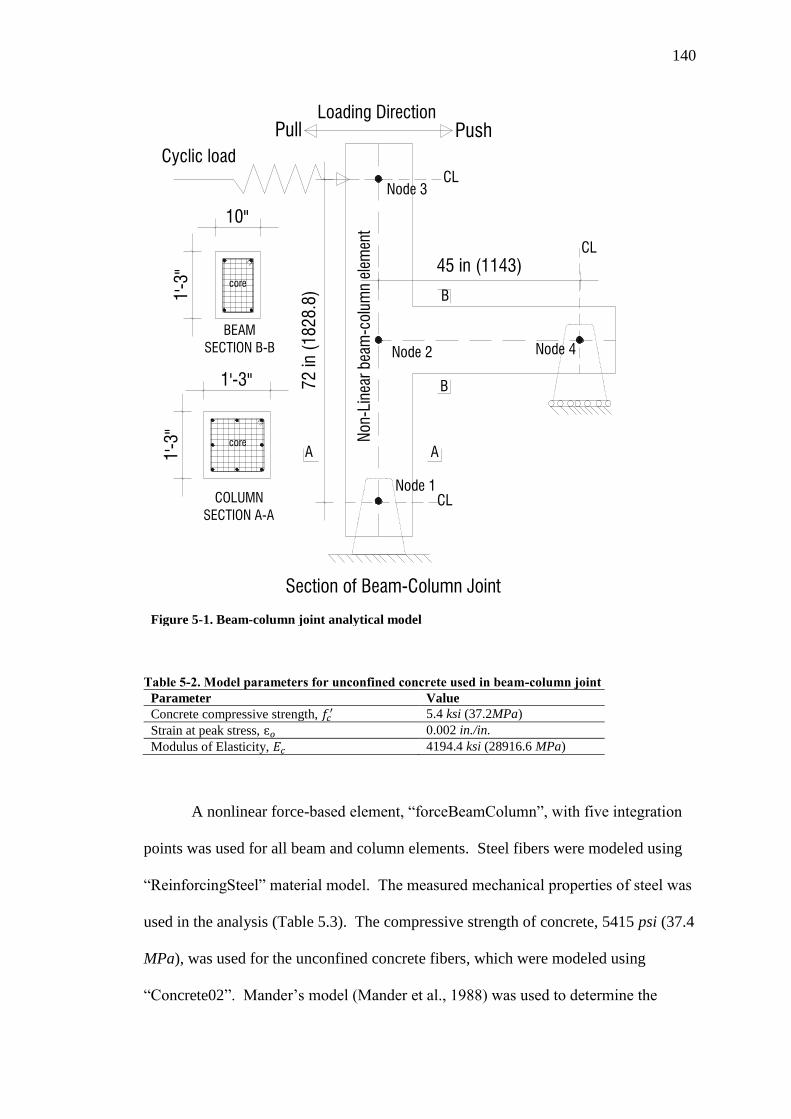
140
Figure 5-1. Beam-column joint analytical model
Table 5-2. Model parameters for unconfined concrete used in beam-column joint
A nonlinear force-based element, “forceBeamColumn”, with five integration
points was used for all beam and column elements. Steel fibers were modeled using
“ReinforcingSteel” material model. The measured mechanical properties of steel was
used in the analysis (Table 5.3). The compressive strength of concrete, 5415 psi (37.4
MPa), was used for the unconfined concrete fibers, which were modeled using
“Concrete02”. Mander’s model (Mander et al., 1988) was used to determine the
CL
CL
CL
72 in (
1828.8
)
45 in (1143)
Node 1
Node 3
Node 4Node 2
Non-Lin
ear b
eam
-colu
mn e
lem
ent
Section of Beam-Column Joint
COLUMN
SECTION A-A
BEAM
SECTION B-B
core
core
A A
B
B
1'-3"
1'-3"
1'-3"
10"
Loading Direction
PushPull
Cyclic load
Parameter Value
Concrete compressive strength, 𝑓𝑐′ 5.4 ksi (37.2MPa)
Strain at peak stress, ɛ𝑜 0.002 in./in.
Modulus of Elasticity, 𝐸𝑐 4194.4 ksi (28916.6 MPa)

141
confined concrete fiber parameters, which was also “Concrete02”. Note that concrete
confinement properties were different for the beam and column (Table 5-4). The
section discretization is schematically shown in Fig. 5-1. The core concrete was
discretized with 50 layers in both directions. The concrete cover was discretized with
20 layers in both directions. Steel fibers were modeled with either “ReinforcingSteel”
or “Steel02” material models using the measured mechanical properties at all
integration points. Steel02 was selected for No. 4 bars because they did not show
yielding plateau in the tensile tests (Fig. 4-29). Bond-slip effect was not included in
the analysis. However, the P-D effect was included.
Table 5-3. Reinforcing steel (Longitudinal steel) material model properties used in beam-column
analytical model
Parameter No. 4 Bar No. 5 Bar
Yield Stress, 𝑓𝑦 77.25 ksi (532.6 MPa) 76.85 ksi (529.9 MPa)
Ultimate Tensile Strength, 𝑓𝑢 118.25 ksi (815.3 MPa) 113.27 ksi (781.0 MPa)
Modulus of Elasticity, 𝐸𝑠 29000 ksi (200000 MPa) 29000 ksi (200000 MPa)
Strain at Peak Stress, ɛ𝑢 0.0597 in./in. 0.0742 in./in.
Strain at Fracture 0.125 in./in. 0.139 in./in.

142
Table 5-4. Fibers used in beam-column analytical model
Longitudinal Steel Fibers
Column Beam
Type: ReinforcingSteel
Bar Size: No. 5
𝑓𝑦 = 78.65 ksi (529.9 MPa)
𝑓𝑠𝑢 = 113.27 ksi (781.0 MPa)
𝐸𝑠 = 29000 ksi (200000 MPa)
ɛ𝑠ℎ = 0.005 in./in.
ɛ𝑠𝑢 = 0.0742 in./in.
Type: Steel02
Bar Size: No. 4
𝑓𝑦 = 77.25 ksi (532.6 MPa)
𝑓𝑠𝑢 = 118.25 ksi (815.3 MPa)
𝐸𝑠 = 29000 ksi (200000 MPa)
𝐵𝑠 = 0.02478
Type: ReinforcingSteel
Bar Size: No. 5
𝑓𝑦 = 78.65 ksi (529.9 MPa)
𝑓𝑠𝑢 = 113.27 ksi (781.0 MPa)
𝐸𝑠 = 29000 ksi (200000 MPa)
ɛ𝑠ℎ = 0.005 in./in.
ɛ𝑠𝑢 = 0.0742 in./in.
Unconfined Concrete Fibers
Column Beam
Type: Concrete01
𝑓𝑐𝑐′ = -5415 psi (37.4 MPa)
ɛ𝑐𝑐 = -0.002 in./in.
ɛ𝑐𝑢 = -0.005 in./in.
Type: Concrete01
𝑓𝑐𝑐′ = -5415 psi (37.4MPa)
ɛ𝑐𝑐 = -0.002 in./in.
ɛ𝑐𝑢 = -0.005 in./in.
Confined concrete Fibers (Mander’s model)
Column Beam
Type: Concrete01
𝑓𝑐𝑐′ = -7200 psi (49.6 MPa)
ɛ𝑐𝑐 = -0.005 in./in.
𝑓𝑐𝑢′ = -5870 psi (40.5 MPa)
ɛ𝑐𝑢 = -0.016 in./in.
Type: Concrete01
𝑓𝑐𝑐′ = -6500 psi (44.8 MPa)
ɛ𝑐𝑐 = -0.004 in./in.
𝑓𝑐𝑢′ = -5000psi (34.5 MPa)
ɛ𝑐𝑢 = -0.011 in./in.
5.2.2. Analysis Results
Figure 5-2 shows the calculated and the measured force-displacement
relationships of the beam-column specimen. Table 5-5 presents a summary of the
analysis results. The calculated lateral force was slightly higher in the pull direction
than the measured data. The calculated force-displacement behavior was very close to
the measured data up to 2% drift ratio in the push direction. After that, the calculated
lateral force was slightly higher than the measured data. However, the ultimate
displacements were close to those measured in the test with less than 6% error.
Overall, the general trend was reasonably simulated using the proposed modeling
method.

143
Figure 5-2. Calculated and measured force-displacement relationships for beam-column test
model
Table 5-5. Measured and calculated response of beam-column test model
Parameter Measured Calculated
Push Pull Push Pull
Yield displacement (in.) 0.13 0.45 0.24 0.31
Ultimate displacement (in.) 2.59 2.53 2.72 2.69
Maximum lateral force (kips) 7.98 12.63 9.38 13.27
Figure 5-3 shows the force-displacement hysteresis of the beam-column test
model. Reasonable accuracy was achieved. However, the unloading behavior
specially the pinching effect could not be fully reproduced.
-4.2 -3.15 -2.1 -1.05 0 1.05 2.1 3.15 4.2
-66
-55
-44
-33
-22
-11
0
11
22
33
44
55
66
-15
-12
-9
-6
-3
0
3
6
9
12
15
-3 -2 -1 0 1 2 3
Drift ratio (%)
Lat
eral
Fo
rce
at C
olu
mn
Tip
(K
N)
Lat
eral
F
orc
e at
Colu
mn T
ip (k
ips)
Displacement (in)
Yield point
Ultimate point
Measured (Actual)
Measured (Modified)
Calculated
PUSHPULL

144
Figure 5-3. Calculated and measured force-displacement hysteresis for beam-column test
model
5.3. Analytical Studies of Rubber Confined RC Bridge Columns
In recent years, repair, rehabilitation, and strengthening of existing bridges and
buildings have been emphasized to elongate their lifetime. Some of these structures
are damaged because of aging and others need strengthening because design codes
have changed demanding higher forcers or allowing more stringent capacities.
External jackets made of steel, concrete, or fiber-reinforced polymer are usually used
to increase the ductility and strength of existing reinforced bridge columns. A new
external confinement, rubber-coated concrete, was introduced in Chapter 2. Rubber
confined concrete exhibits more than 10% strain capacity, which may be a viable
alternative for current methods of repair, rehabilitation, or retrofit. The main purpose
of this analytical study was to evaluate the seismic performance of low-ductile bridge
columns confined with rubber.
To show the effect of rubber as a new confinement method on the
displacement ductility capacity of bridge columns, three columns with different
-4.2 -3.15 -2.1 -1.05 0 1.05 2.1 3.15 4.2
-66
-55
-44
-33
-22
-11
0
11
22
33
44
55
66
-15
-12
-9
-6
-3
0
3
6
9
12
15
-3 -2 -1 0 1 2 3
Drift ratio (%)
Lat
eral
Forc
e at
Colu
mn
Tip
(K
N)
Lat
eral
F
orc
e at
Colu
mn
Tip
(k
ips)
Displacement (in)
Measured
Calculated

145
displacement ductilities (3, 5, and 7) from Tazarv and Saiidi (2016) were selected for
analytical studies (Table 5-6).
Table 5-6. Model parameters for conventional steel-confined circular bridge columns
Parameter Column 1 Column 2 Column 3
Specimen ID RC-AR4-ALI5-D3 RC-AR4-ALI5-D5 RC-AR4-ALI5-D7
Target Displacement
Ductility (m) 3 5 7
Column diameter 48 in. (1219 mm) 48 in. (1219 mm) 48 in. (1219 mm)
Column height 192 in. (4877 mm) 192 in. (4877 mm) 192 in. (4877 mm)
Size of longitudinal
reinforcement No. 9 No. 9 No. 9
Total number of longitudinal
reinforcement 22 22 22
Diameter of longitudinal
reinforcement 1.128 in. (29 mm) 1.128 in. (29 mm) 1.128 in. (29 mm)
Size of transverse
reinforcement No. 3 No. 4 No. 6
Diameter of transverse
reinforcement 0.375 in. (9.5 mm) 0.5 in. (13 mm) 0.75 in. (19 mm)
Type of transverse
reinforcement Hoop Hoop Hoop
Pitch 12 in. (305 mm) 4 in. (305 mm) 4 in. (305 mm)
Clear concrete cover 2 in. (51 mm) 2 in. (51 mm) 2 in. (51 mm)
Axial load index [P/(f’c.Ag)] 5% 5% 5%
5.3.1. Description of Bridge Column Analytical Model
A three-dimensional finite element fiber-section model was constructed in
OpenSees (Fig. 5-4). The base of each column (node 1) was considered as fixed
support and the axial load, which was 5% of the product of the column gross-section
area and the compressive strength of concrete (axial load index), was applied to node
2 of all columns. The compressive strength of concrete at 28 days was taken as 5000
psi (34.5 MPa), present in Table 5-7.

146
Figure 5-4. Bridge Column Analytical Model
Table 5-7. Conventional concrete properties assumed in bridge columns
Parameter Value
Concrete compressive strength, 𝑓𝑐′ 5 ksi (34.5 MPa)
Strain at peak stress, ɛ𝑜 0.002 in./in.
Modulus of Elasticity, 𝐸𝑐 4030.5 ksi (27789.3 MPa)
Since all bridges meet the current code minimum displacement ductility
requirements (𝜇 ≥ 3), the combined effect of confinement from rubber and
reinforcing steel bars was used in the analytical models (Fig. 5-5 to 5-7). Mander’s
model (Mander et al., 1988) was used to determine the confinement properties of steel
(Table 5-8). The confinement properties of rubber was determined using non-linear
stress-strain relationship of rubber confined concrete (Table 5-9), which was descried
in chapter 2.
19
2 in.
(48
76
.8 m
m)
Node 1
Node 2
Non-Lin
ear b
eam
-colu
mn e
lem
ent
Bridge Column
Loading Direction
PushPull
Lateral Load
Column Section
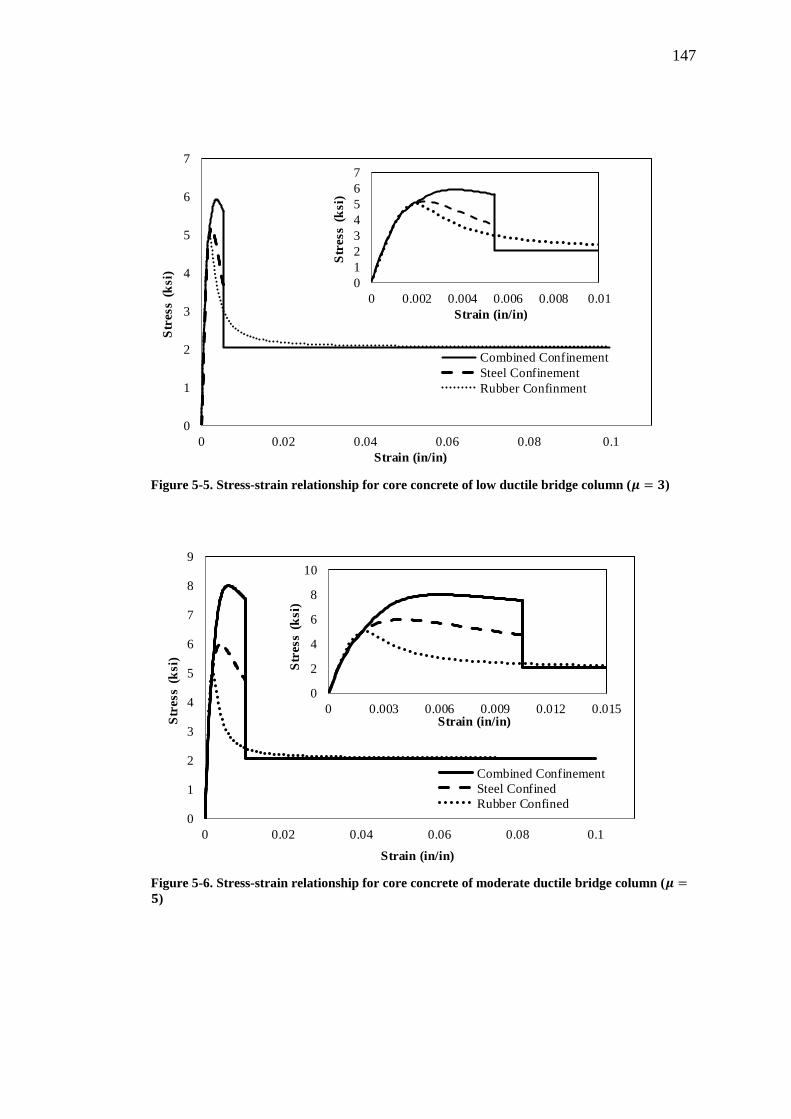
147
Figure 5-5. Stress-strain relationship for core concrete of low ductile bridge column (𝝁 = 𝟑)
Figure 5-6. Stress-strain relationship for core concrete of moderate ductile bridge column (𝝁 =𝟓)
0
1
2
3
4
5
6
7
0 0.02 0.04 0.06 0.08 0.1
Str
ess (
ksi)
Strain (in/in)
Combined Confinement
Steel Confinement
Rubber Confinment
0
1
2
3
4
5
6
7
0 0.002 0.004 0.006 0.008 0.01
Str
ess (
ksi)
Strain (in/in)
0
1
2
3
4
5
6
7
8
9
0 0.02 0.04 0.06 0.08 0.1
Str
ess (
ksi)
Strain (in/in)
Combined Confinement
Steel Confined
Rubber Confined
0
2
4
6
8
10
0 0.003 0.006 0.009 0.012 0.015
Str
ess (
ksi)
Strain (in/in)

148
Figure 5-7. Stress-strain relationship for core concrete of high ductile bridge column (𝝁 = 𝟕)
Table 5-8. Reinforcing steel material model properties used in bridge columns
Parameter Value
Yield Stress, 𝑓𝑦 68 ksi (468.8 MPa)
Ultimate Stress, 𝑓𝑢 95 ksi (655.0 MPa)
Modulus of Elasticity, 𝐸𝑠 29000 ksi (200000 MPa)
Strain hardening stiffness, 𝐸𝑠ℎ 1247 ksi (8783.9 MPa)
Strain at strain hardening, ɛ𝑠𝑢 0.005 in./in.
Yield Strain, ɛ𝑦𝑒 0.0023 in./in.
Ultimate Strain, ɛ𝑢 0.09 in./in.
Table 5-9. Rubber confined concrete properties used in bridge columns
Parameter Value
Rubber thickness, t 0.5 in. (12.7 mm)
Tensile strength of rubber, 𝑓𝑓 3432 psi (23.7 MPa)
Modulus of elasticity of rubber, 𝐸𝑓 56000 psi (386.1 MPa)
Compressive strength of confined concrete, 𝑓𝑐𝑐′ 5 ksi (34.5 MPa)
Strain at peak stress, ɛ𝑜 0.002 in./in.
Ultimate strain, ɛ𝑢 0.10 in./in.
Residual strength, 𝑓𝑟′ 2.05 ksi (14.2 MPa)
The column element was modeled using a force-based element,
“forceBeamColumn”, with five integration points. Unconfined concrete fibers were
modeled using “Concrete01” (Table 5-10). “Concrete 04” and “ElasticPPGap”
material models were used as parallel springs to simulated the combined effect of
0
2
4
6
8
10
12
0 0.02 0.04 0.06 0.08 0.1
Str
ess (
ksi)
Strain (in/in)
Combined Confinement Steel Confined
Rubber Confined
0
2
4
6
8
10
12
0 0.004 0.008 0.012 0.016 0.02
Con
fin
ed
Str
ess (
ksi)
Confined Strain (in/in)

149
steel and rubber on confinement in which “Concrete 04” was used to model the steel
confinement and “ElasticPPGap” material model was to simulate the residual strength
from rubber confinement.
Table 5-10. Concrete cover and steel fiber properties used in bridge column models
Unconfined Concrete fibers Steel fibers
Type: Concrete 01
𝑓𝑐𝑐′ = -5 ksi (34.5 MPa)
ɛ𝑐𝑐 = -0.002 in./in.
𝑓𝑐𝑢′ = -2.05 ksi (14.1 MPa)
ɛ𝑐𝑢 = -0.005 in./in.
Type: ReinforcingSteel
𝑓𝑦 = 68 ksi (468.8 MPa)
𝑓𝑠𝑢 = 95 ksi (655.0 MPa)
𝐸𝑠 = 29000 ksi (200000 MPa)
𝐸𝑠ℎ = 1247 ksi (8783.9 MPa)
ɛ𝑠ℎ = -0.0125 in./in.
ɛ𝑠𝑢 = 0.09 in./in.
The column section discretization is also shown in Fig. 5-4. The core concrete
was divided into 30 circumferential by 10 radial fibers, and the cover concrete was
divided into 10 circumferential by 10 radial fibers. Steel fibers were modeled using
“ReinforcingSteel” material model (Table 5-11). The bond-slip effect was not
included but P-D effect was considered.
Table 5-11. Core concrete fiber properties used in bridge column models
Confined Concrete fibers: Column ID RC-AR4-ALI5-D3
Type: Concrete 04
𝑓𝑐𝑐′ = -5.40 ksi (37.23 MPa)
ɛ𝑐𝑐 = -0.00238 in./in.
𝑓𝑐𝑢′ = -5.62 psi (38.75 MPa)
ɛ𝑐𝑢 = -0.00539 in./in.
Type: ElasticPPGap
𝑓𝑟′= 2.05 ksi (14.2 MPa)
𝐸𝑐 = 4030.5 ksi (27789.3 MPa))
ɛ𝑠𝑢 = 0.1 in./in.
Initial Gap = -0.00539 in./in.
Confined Concrete fibers: Column ID RC-AR4-ALI5-D5
Type: Concrete 04
𝑓𝑐𝑐′ = -7.52 ksi (51.85 MPa)
ɛ𝑐𝑐 = -0.00395 in./in.
𝑓𝑐𝑢′ = -7.51 psi (51.78 MPa)
ɛ𝑐𝑢 = -0.01047 in./in.
Type: ElasticPPGap
𝑓𝑟′= 2.05 ksi (14.2 MPa)
𝐸𝑐 = 4030.5 ksi (27789.3 MPa))
ɛ𝑠𝑢 = 0.1 in./in.
Initial Gap = -0.01047 in./in.
Confined Concrete fibers: Column ID RC-AR4-ALI5-D7
Type: Concrete 04
𝑓𝑐𝑐′ = -9.45 ksi (65.16 MPa)
ɛ𝑐𝑐 = -0.00605 in./in.
𝑓𝑐𝑢′ = -9.10 psi (62.74 MPa)
ɛ𝑐𝑢 = -0.01646 in./in.
Type: ElasticPPGap
𝑓𝑟′= 2.05 ksi (14.2 MPa)
𝐸𝑐 = 4030.5 ksi (27789.3 MPa))
ɛ𝑠𝑢 = 0.1 in./in.
Initial Gap = -0.01646 in./in.

150
5.3.2. Analytical Results
Figures 5-8 to 5-10 show the pushover relationship for the three bridge
columns and Table 5-12 presents a summary of the results. The column failure was
identified as a displacement in which the core concrete fails, the reinforcement
factures, or the lateral load-carrying strength drops 20% with respect to the peak. The
displacement ductility capacity was calculated based on AASHTO method (AASHTO
Seismic Guide Specification, 2014). It can be seen that the displacement ductility
capacity of the low-ductile column was doubled when a rubber jacket was used
(increased from 3 to 6). This is because core concrete failure will be eliminated when
concrete is confined with rubber. Columns with high ductilities will also benefit from
rubber jacketing. However, the effect is not as profound as the low-ductile columns
mainly because their core is already well-confined with steel.
Overall, the analytical studies showed that the proposed confinement method
is a viable technique to retrofit, rehabilitate, or repair bridge columns with low
ductilities. This method includes spraying rubber onsite, which can be easily done
with minimal onsite activities.

151
Figure 5-8. Force-displacement relationship of low ductile bridge column (𝝁 = 𝟑)
Figure 5-9. Force-displacement relationship of moderate ductile bridge column (𝝁 = 𝟓)
0
200
400
600
800
1000
1200
0
50
100
150
200
250
300
0 1 2 3 4 5 6 7
La
tera
l fo
rce
(k
N)
La
tera
l F
orc
e (
kip
s)
Drift (%)
Rubber Confined
Conventional Steel Confined
RC-AR4-ALI10-D3
0
200
400
600
800
1000
1200
0
50
100
150
200
250
300
0 1 2 3 4 5 6 7 8
La
tera
l fo
rce
(k
N)
La
tera
l F
orc
e (
kip
s)
Drift (%)
Rubber Confined
Conventional Steel Confined
RC-AR4-ALI10-D5

152
Figure 5-10. Force-displacement relationship of high ductile bridge column (𝝁 = 𝟕)
Table 5.12. Displacement ductility capacity of bridge columns with and without rubber
confinement
Column ID Conventional Steel-Confined Rubber confinement
RC-AR4-ALI5-D3 3.08 6.05
RC-AR4-ALI5-D5 4.98 5.98
RC-AR4-ALI5-D7 7.05 7.44
5.5. References
1. AASHTO. (2014). “AASHTO Guide Specifications for LRFD Seismic Bridge
Design,” Washington, DC: American Association of State Highway and
Transportation Officials.
2. Mander, J., Priestley, M., and Park, R. (1988). "Observed stress-strain
behavior of confined concrete," Journal of structural engineering, 114(8),
1827-1849.
3. OpenSees. (2013). “Open System for Earthquake Engineering Simulations,”
Version 2.4.1, Berkeley, CA, Available online: http://opensees.berkeley.edu.
0
200
400
600
800
1000
1200
0
50
100
150
200
250
300
0 1 2 3 4 5 6 7 8 9 10
La
tera
l fo
rce
(k
N)
La
tera
l F
orc
e (
kip
s)
Drift (%)
Rubber Confined
Conventional Steel Confined
RC-AR4-ALI10-D7

153
4. Tazarv, M. and Saiidi, M.S. (2016). “Seismic Design of Bridge Columns
Incorporating Mechanical Bar Splices in Plastic Hinge Regions,” Engineering
Structures, DOI: 10.1016/j.engstruct.2016.06.041, Vol. 124, pp. 507-520.
154
CHAPTER 6. SUMMARY AND
CONCLUSIONS
6.1. Summary
The main objective of the present study was to investigate the feasibility of
new materials and innovative detailing for concrete structures. Three different topics
were included in this study.
First, the use of rubber as external jackets for concrete to increase the ductility
was proposed. Eighteen rubber confined concrete cylinders and 12 conventional
concrete cylinders were prepared and tested under uniaxial compressive loads. Ready
mix concrete with a target strength of 5000 psi was used in this experiment. Non-
linear and simplified stress-strain models were developed for rubber confined
concrete based on the measured data. The stress-strain relationship of the rubber
confined concrete was compared with other types of confinement and materials such
as steel-confined concrete, FRP-confined concrete, and steel-confined Engineered
Cementitious Composite (ECC). Finally, the seismic performance of bridge columns
confined with steel or rubber was investigated.
In the second study, conventional deformed steel bars without any reduction of
the section area enclosed in steel pipes were experimentally investigated as external
energy dissipaters. This type of external energy dissipater, entitled as buckling

155
restrained reinforcement (BRR), was also new. Nine BRR were tested to investigate
their compressive behavior and anti-buckling efficiency. ASTM A706 Grade 60
deformed steel bars were used in BRR. Two different diameters and various lengths
were included to optimize the performance of BRR. Grade 1026, carbon steel tube
with different tube diameters and wall thicknesses were used as confining tubes.
Non-shrink grout was used as filler material. A self-reacting setup was design to for
testing of BRR. Load cells were used to capture the compressive loads and String
POTs were used to measure the displacements. Both monotonic and cyclic loading
were applied.
The seismic performance of a modern beam-column specimen including
actual boundary conditions was experimentally investigated in the third part of this
thesis. A nine-story special moment-resisting reinforced concrete office building was
design according to current specifications to serve as prototype model. One of the
building exterior beam-column joint was selected for experimental study. The RC
frame was design as special moment resisting frame (SMRF). ASCE 7-10 and
ACI318-14 were used for the design of the building. SAP2000 was used as design
software. A half- model of the prototype beam-column specimen was tested under
cyclic loading. ASTM A706 Grade 60 deformed reinforcing bars were used as
longitudinal reinforcement for the beam and column. ASTM A706 Grade 60
deformed reinforcing bars also used as transverse reinforcement of the column.
However, ASTM A496 deformed wires were used as transverse reinforcement in the
beam. Confinement of the half-scale beam-column specimen was matched with that
of the prototype beam-column specimen. A new test setup was developed to simulate
the actual boundary conditions of the beam-column specimens in which both column
and beam were free to sway under lateral loads. An axial load was applied at the

156
column top during test using hydraulic jacks and post-tensioning rods pump. Several
strain gauges, displacement measurement devices, and load cells were used to
measure strains, displacements, rotations, curvature, and load. A 22-kip actuator was
used to apply lateral displacement at the top of the column in horizontal direction.
The specimen was tested under a cyclic loading protocol to failure. Analytical studies
were also carried out by OpenSees to develop and validate the proposed analytical
model.
6.2. Conclusions
6.2.1. Rubber Confined Concrete
Based on the experimental investigation and analytical studies, the following
conclusions can be drawn:
The peak stress and the strain corresponding to the peak stress of rubber
confined concrete were approximately same as those of unconfined
conventional concrete.
The residual strength of rubber confined concrete was lower than other
confining methods such as steel confinement or FRP-confined concrete.
However, rubber confined concrete exhibits very large strain capacity
exceeding the strain capacity of reinforcing steel bar in tension.
The proposed material model for rubber confined concrete can accurately
simulate this material behavior.
Displacement ductility capacity of low-ductile bridge columns can be doubled
using rubber as an external jacket.

157
6.2.2. Buckling Restrained Reinforcement (BRR)
The proposed detailing for BRR showed good anti-buckling behavior. The
following conclusions can be drawn based on the experimental investigation:
The axial gap between the tube and the support plays a significant role to
control the compressive behavior of BRR.
BRR exhibits a very large compressive strength before buckling when the
axial gap is less than 0.5db.
The compressive strain at the peak stress can exceed 5% with the proposed
BRR, which will be sufficient in most practical cases since the strain of
compressive reinforcement in a concrete section is usually controlled by the
core concrete strains.
Short BRRs show larger compressive stresses and strain capacities with the
same tube properties than longer BRRs.
BRR with thicker tubes achieve higher stresses and strain capacities compared
to thinner tubes.
6.2.3. Beam-Column Connection
The following conclusion can be made based on the experimental data:
Column longitudinal and transverse reinforcement is not expected to yield
under cyclic loading such as earthquake, and the column damage will be
insignificant if they are designed based on the current code special moment
resisting frames (SMRF) requirements.
Almost all cracks were formed in the beam. The beam longitudinal
reinforcing bars yielded then fractured at a high drift ratio. Therefore, beams

158
are weaker than columns in modern SMRFs ensuring achieving large
displacement capacities.
The maximum lateral force in the push and pull direction was 7.98 (35.5) and
12.63 kips (56.2 kN), respectively. The ultimate displacement of the beam-
column specimen was 2.53 in (64.26 mm) at a lateral force of 12.63 kips (56.2
kN).
The drift ratio of tested beam-column connection was 3.5% in the push
direction and 3.59% in the pull direction. The test result showed that this joint
had 75% higher capacity in the push direction compared to the ASCE design
guideline for buildings (ASCE 7-10, 2010) allowable drift ratio, which was
2% for this frame. Similarly, the joint shown 80% reserved drift capacity in
the pull direction.
The proposed analytical modeling method for the exterior beam-column joint
showed a reasonable accuracy.