Embed Size (px)
Citation preview

Progress In Electromagnetics Research B, Vol. 56, 365–385, 2013
APPLICATION OF NEGATIVE SELECTION ALGO-RITHM IN SMART ANTENNA SYSTEM FOR LTE COM-MUNICATION
Abdul K. Evizal1, *, Tharek A. Rahman1,Sharul K. A. Rahim1, Sri L. Rosa2,and Alishir Moradikordalivand1
1Wireless Communication Centre (WCC), Faculty of ElectricalEngineering, Universiti Teknologi Malaysia, UTM Skudai, Johor81310, Malaysia2Soft Computing Research Group, Faculty of Computing, UniversitiTeknologi Malaysia, UTM Skudai, Johor 81310, Malaysia
Abstract—Interference and multipath is one of the current issuesin a wireless communication system, with complicated scenarios ofenvironment especially in urban areas with a high number of users.Introducing smart antenna systems at the base station can contributeto reducing interference and improve quality of service. This paperproposes and explores the application of artificial immune system andnegative selection algorithm to the prototype of smart antenna, wherethe proposed smart antenna is a hexagonal structure with 6-elementsof the antenna array and working in LTE band at 2.6GHz. Initialtesting was done to define the RSSI value by calculating the averageof the signal then comparing RSSI value defined by implementingartificial immune algorithm. To proof and determine actual RSSIsignal received, a test in an anechoic chamber is conducted as referencethat assumes free interference and multipath then compared to bothof results. X-Bee module was used for transmitter and receiver insystem at 2.4GHz band, and the proposed system prototype withhexagonal structure also used dual ARM microprocessor. Negativeselection algorithm is applied in smart antenna programming to defineactual values of receiving signal and angle of arrival. Every beam ofthe antenna was installed with an X-Bee module then connected tomicroprocessors, with an LED installed at each of the antenna as anindicator of beam switching or angle of arrival signal.
Received 9 September 2013, Accepted 6 November 2013, Scheduled 13 November 2013* Corresponding author: Abdul Kadir Evizal ([email protected]).

366 Evizal et al.
1. INTRODUCTION
Long Term Evolution (LTE) is a standard of high-speed data network,as radio platform technology that will allow user to access with higherpeak throughputs. Currently, most of mobile terminal accessing isin a standard called High Speed Packet Access (HSPA) evolutionand (HSPA+) in higher spectrum bandwidth. LTE is part of theevolutionary of wireless mobile technology, started with Global Systemfor Mobile Communication (GSM) standard for mobile broadband,following by Enhanced Data Rates for GSM Evolution (EDGE),Universal Mobile Telecommunications System (UMTS) or WidebandCode Division Multiple Access (WCDMA), HSPA combined HighSpeed Downlink Packet Access (HSDPA) and High Speed UplinkPacket Access (HSUPA) and HSPA Evolution (HSPA+). AlthoughHSPA+ is currently strongly positioned in its evolution and isdominant in wireless data networks or mobile data technology for thenext years or decades, the 3rd Generation Partnership Project (3GPP)family of standards must evolve toward the future [1].
The main objective of LTE network evolution is to improvecoverage area, data rates, user capacity and reducing latency to furtherimprove service provisioning. In order to achieve that objective, somemethods are proposed, and one of them is introducing smart antenna.A smart antenna system, expected to cater and improve efficiency oftransmitter, increases data rates, then reduces interference. Previousdiscussion on smart antenna is adaptive beamforming based oneigen-space and hybrid beamforming [2, 3]. A comparison for smartantenna as disused in [4] used particle swarm optimization technique,and another article used LMS (least mean square) algorithm toestimate DOA (direction of arrival) for GPS (global positioningsystem) application [5, 6]. Since smart antenna system is related tothe signal processing and controlling system for the beam switchingand beamforming, and selection of microcontroller and digital signalprocessing is important to obtain accurate result.
Algorithm is a part of signal processing in smart antenna, andselection of algorithm is a parameter to verify accuracy in decision ofarrival signal (angle of arrival) then beam switching [7, 8]. Currently,many researches propose to use common smart antenna systemalgorithm, such as LMS (Least Mean Square), MUSIC (MultipleSignal Classification) algorithm of ESPRIT (Estimation of SignalParameters via Rotational Invariance Technique) or combination ofthem [9, 10]. Another technique is the use of NN (Neural Networks)algorithm to determine AoA (Angle of Arrival) in a smart antennasystem as reported in [11]. Adaptive blind beamforming algorithm

Progress In Electromagnetics Research B, Vol. 56, 2013 367
on array smart antenna system using LMS algorithm then simulationusing simulink, smoothes wireless signal handoff decision algorithmas reported in [12] is applied to wireless sensor network. This paperproposes and explores applicable artificial immune system algorithmto the adaptive array smart antenna system, where negative selectionalgorithm is chosen and adopted in arriving signal processing algorithmthen a decision is defined for the antenna beam selection switching.
2. ARTIFICIAL IMMUNE SYSTEM
Artificial immune systems (AIS) are an adaptive system, inspired bytheoretical immunology and observed immune functions, principlesand models, which are applied to problem solving [13]. Thefield of artificial immune systems is concerned with abstracting thestructure and function of the immune system to computationalsystems and investigating the application of these systems towardssolving computational problems from mathematics, engineering, andinformation technology. AIS is a sub-field of biologically-inspiredcomputing and natural computation, with interests in machine learningand belonging to the broader field of artificial intelligence [14].Artificial immune systems have been recognized as an area of computerscience and engineering, which uses immune system metaphors for thecreation of novel solutions to problems. It is the majority view thatthe area of AIS is much wider and not confined to the development ofnew algorithms. Figure 1 shows a basic concept of biological immunesystem. Figure 1(a) shows antibody and antigen with paratope,epitope and idiotope, and Figure 1(b) shows an example of structurebiological antibody.
(a) (b)
Figure 1. Basic concept of biological immune system. (a) Antibodyand antigen with paratope, epitope and idiotope. (b) Antibody —antigen recognition and binding.

368 Evizal et al.
Biological immune system in computer systems serves asinspirations for a variety of computationally based learning systems(e.g., artificial neural networks and genetic algorithms). The immunesystem is composed of several different layers of physical, physiological,innate (non-adaptive) and adaptive defence. The adaptive defencemechanism is sometimes referred to as acquired one. Any activityof the immune system against a pathogen is known as an immuneresponse, and the most basic defence mechanism is the skin, whichserves as a physical barrier to many pathogens, and for pathogens thatelude the skin barrier, there are physiological barriers.
The negative selection algorithm (NSA) is one of the most widelyused techniques in the field of artificial immune systems. NSA usedto detect changes in data behavior and patterns of raw data, bygenerating detectors in the complementary space. Originally detectorsare applied directly to classify new data as self (normal) or non-self (abnormal). Previous research in [15] proposed a real valuednegative selection (RNSA) algorithm based on heuristics that try todistribute the detectors in the non-self-space in order to maximize thecoverage. The method used a real-valued algorithm representationfor the self/non-self-space that differs from the binary representationused in original negative selection algorithms. RNSA with higher-levelrepresentation is able to provide some advantages such as increasedexpressiveness, the possibility of extracting high-level knowledge fromthe generated detectors and in some cases improved scalability. Thereal algorithm does not need to convert raw data to other scales orbinary representation. It uses real data value to process and matchto a detector generated by using minimum distance [16]. Minimumdistance valued is set according to the high and low data received fromthe system.
3. ADAPTIVE ARRAY SMART ANTENNA
Smart antenna is an antenna array with a control system and digitalsignal processing for advanced and intelligent controller. A smartantenna system is a method used in wireless communications to locatemobile device (user) which is capable of directing its beam radiationto a particular user or direction. Nowadays, smart antenna technologywith improvement in designing offers a significant solution to overcomesome issues such as interference levels, improve system capacity andefficiency. In this technology, every signal comes from users or mobiledevices is transmitted and received by the base station only in thedirection of that particular user. This method of transmission andreception is called beam forming and is made possible through smart

Progress In Electromagnetics Research B, Vol. 56, 2013 369
(advanced) signal processing at the baseband.There are two types of smart antenna commonly used, which are
switching beam smart antenna and adaptive array (more intelligent).Switch beam or switch lobe is the simplest one, comprises onlya basic switching function between separate directive antennas orpredefined beams of an array and the setting that gives the bestchosen performance. Adaptive array is an antenna system completewith directional arrival signal algorithm for determining the directiontoward interference sources, and the radiation pattern can then beadjusted to null out the interferers. Figure 2 shows a basic concept oftwo different smart antenna systems. Figure 2(a) shows an antennaconsisting of a multiple fixed beam that can be switched to desiredparticular beam controlled by system, and Figure 2(b) shows anadaptive array antenna that is a more intelligent system. Both ofsystems have the same objective which is to forward the beam ofantenna to a desired user, but adaptive array is a more efficient andeffective system because of suppressing unwanted beam.
Antenna Array
Active Beam
Antenna Array
Target User
Interfering User
(a) (b)
Figure 2. Basic concept of smart antenna. (a) Switch beam.(b) Adaptive array.
In the smart antenna system, angle of arrival (AOA), also knownas direction of arrival (DOA), is one of the factors determining theaccuracy of calculating received signal from the mobile station. Afew techniques and algorithms calculate and estimate the AOA signalfrom the mobile device. Figure 3 shows a received signal arrivingfrom N directions, N number of angles of arrival, and number ofreceived signals by an array antenna of M elements with M potentialweights. All parameters (additive, zero mean, Gaussian noise) will becalculated. The number of times is represented by the kth sample oftime, thus a summary of array output antenna of y(k) can be written

370 Evizal et al.
Figure 3. M -number of array antennas with signal arrival.
as in the formula below:
y (k) = w−T · x(k) (1)
where,
x (k) = [a (θ1) a (θ2) . . . a (θN )] ·
s1 (k)s2 (k)
...sN (k)
+ n (k)
= A · s (k) + n (k) (2)
and
w = [w1w2, . . . , wM ]T = weight of array antenna.s(k) = vector of incident complex monochromatic signal at timek.n(k) = noise vector at each array element m, zero mean, varianceσn
2.a(θi) = M -element array steering vector for the θi direction ofarrival.A = [a(θ1) a(θ2) . . . a(θN )] M×D matrix of steering vector a(θi).
Number of radiation patterns of a typical element antenna arraycan be changed or designed by determining the number of antennasinstalled. Higher number of an array’s elements of the antenna willobtain a narrower beam radiation pattern, and complexity of signalprocessing is required because more elements’ beams of the antennaneed to be calculated. Similarly, by changing the relative phase

Progress In Electromagnetics Research B, Vol. 56, 2013 371
excitation, the orientation of radiation pattern will be changed. Each ofthe N -complex signals arrivals from various angles θi and is interceptedby others of the M antenna elements, and the number of arrivingsignals, N , is normally less than the number of array antennas M .Equation (1) represents summary of signal arriving from M element ofthe antenna and Equation (2) represents the number of x(k) elementantennas, where the vector of arrival signal at time k to number of M -element angles of arrival antenna. The number of M -element steeringvectors contains the response of all elements of the array antennato a narrow-band source of power received. As the response of thearray antenna has different directions between angles of signal arrival,a steering vector is associated with each directional source [17].
4. ANTENNA DESIGN AND PROTOTYPE
This paper proposes a smart antenna system designed by implemen-tation of smart algorithm which adopts and explores the capabilityof the artificial immune system. The proposed antenna system is de-signed with a prototype, then some measurement is carry out as wellas testing in the actual field, and this method is to check the perfor-mance of the proposed antenna. A few scenarios and possibilities areunder consideration to make sure the proposed system applicable tovarious models and type of environment. A prototype of mobile useris also developed with simulation of actual mobile user. In this casean X-Bee module with microcontroller is used as the user and keepssending data packet to receiver through the proposed smart antennasystem.
4.1. Initial Design of Smart Antenna
The design of the prototype of an adaptive smart antenna startedby designing each single element of array antenna. The proposedfrequency band in this antenna is LTE band 2.6 GHz, and the designachieves wide band that covers 2.4 GHz ISM band for Wireless LocalArea Network (WLAN) thus the prototype of a smart antenna systemdesigned in this frequency for the transmitter and receiver is used inthe system. The basic design of single array antenna is a microstriptype [18], where using inexpensive material available in the market,the proposed antenna is fabricated using FR4 material with a relativepermittivity of εr = 4.7, height h = 1.6mm and tan δ = 0.019. Figure 4shows fabrication of a single element of array antenna with directionaldirection, and beam width is 60 degrees.
Initial measurement has been done in antenna reflection coefficient

372 Evizal et al.
Figure 4. Single element ofarray antenna.
Figure 5. Reflection coefficient ofsingle element antenna.
and response of operating frequency. The proposed antenna hasmultiple bands starting from as low as 500 MHz to 6 GHz. Figure 5shows the response of the antenna and also shows that results betweensimulation and measurement have a good agreement in response.Simulation and measurement results have multiple responses as shownin Figure 5. The main response is at frequency 2.6GHz with maximumreflection coefficient at −30.5 dB, and other responses are 900 MHz,1.7GHz to 2.7GHz and 3.5 GHz. Response at 2.0 GHz is widebandthat covers GSM 1800 and UMTS 2000 bands. 2.4GHz is alsoincluded for WLAN application, and another is at 3.5 GHz that coversWiMAX. While measured result is indicated by the black line inFigure 5, the main response of the reflection coefficient is at frequency2.6GHz the same as simulation result with maximum values, whichis −26 dB. Other responses are scattered to some frequencies startedfrom 900 MHz to 3.5 GHz as shows in Figure 5. Overall, the proposedantenna has wideband response of reflection coefficient applicable tomany types of wireless technology.
Radiation pattern measurement of the proposed antenna has beendone at the center frequency of 2.6 GHz as the main response inreflection coefficient. Figure 6 shows the radiation pattern of theantenna, where Figure 6(a) and Figure 6(b) show the polar radiationpatterns of E-field and H-field of the proposed antenna, respectively,where the directional beam is generated for the E-field at the frontantenna and minor radiation at the back. Simulation and measurementresults give good agreement in their responses, in spite of minorradiation change. The proposed LTE antenna is able to radiate narrowbeams toward antenna direction with narrow beam and minor side lobeon left- and right-hand sides

Progress In Electromagnetics Research B, Vol. 56, 2013 373
0
30
60
90
120
150
180
210
240
270
300
330
-40
-30
-20
-10
0
-30
-20
-10
0
MeasurementSimulation
0
30
60
90
120
150
180
210
240
270
300
330
-40
-30
-20
-10
0
-30-20-100
-30
-20
-10
0MeasurementSimulation
-40 -30 -20 -10 0
(a) (b)
-40 -30 -20 -10-30-20-100 0
Figure 6. Simulated and measured radiation pattern of proposedantenna. (a) E-field. (b) H-field.
4.2. Proposed Hexagonal Prototype
The propose prototype of the adaptive array smart antenna has ahexagon structure, with six directional beams of antenna. As shownin Figure 6, each antenna covered 60 degrees, then six beams coveredin all directions. Figure 7 shows the proposed smart antenna system.Figure 7(a) shows the proposed hexagonal structure, and Figure 7(b)shows fabricated proposed antenna. The hexagonal structure of theantenna is designed by combining all elements of the array antennathan an omnidirectional with spatially beams of direction. Everybeam of a single antenna will receive wireless signal from the mobiledevice (user) in different values. Each beam of antenna is assumed tohave different values depending on the angle and location of the user,and the nearest user to the beam has high values compared to theother beams of the antenna. An LED was installed for every beam ofantenna as indicator that received signal comes from that direction,and microcontroller will switch the beam of the antenna toward aparticular direction.
Each beam of the antenna is attached to the X-Bee moduleas receiver, which is to detect and define signal strength receivedfrom mobile devices. Every module of X-Bee is connected to themicroprocessor, and received signal strength value of each beamis indicated. After that all process of received signal is done bymicroprocessor. Figure 8 shows a design of smart antenna system.
374 Evizal et al.
Antenna-5
Antenna-6
Antenna-1
Antenna-2
Ant
enna
-4A
nten
na-3
X-BeeModule X-Bee
Module
X-BeeModule
X-BeeM
odule
X-Be
e
Mod
ule
X-Be
eM
odul
e
(a) (b)
Figure 7. Structure of proposed hexagonal smart antenna.(a) Proposed hexagonal structure. (b) Fabricated proposed antenna.
(a) (b)
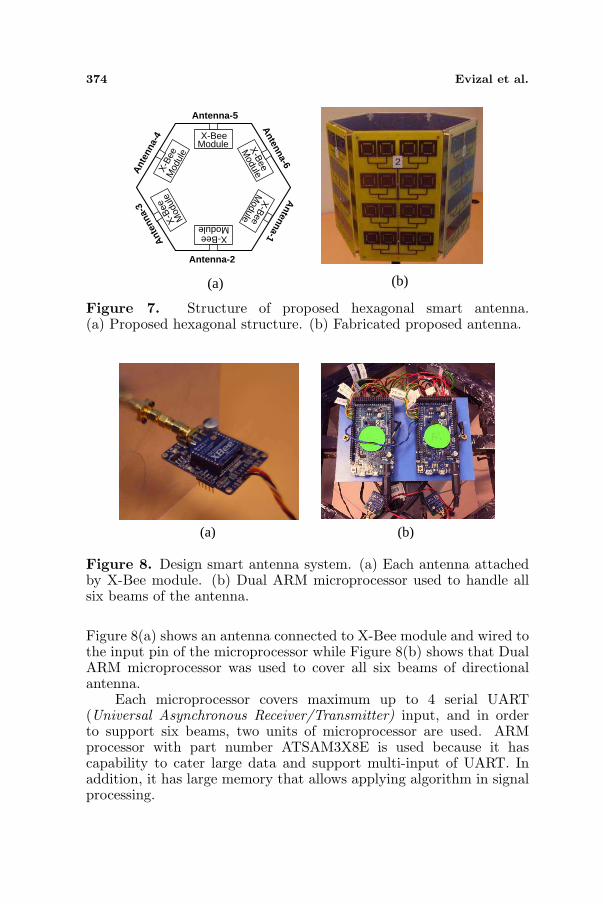
Figure 8. Design smart antenna system. (a) Each antenna attachedby X-Bee module. (b) Dual ARM microprocessor used to handle allsix beams of the antenna.
Figure 8(a) shows an antenna connected to X-Bee module and wired tothe input pin of the microprocessor while Figure 8(b) shows that DualARM microprocessor was used to cover all six beams of directionalantenna.
Each microprocessor covers maximum up to 4 serial UART(Universal Asynchronous Receiver/Transmitter) input, and in orderto support six beams, two units of microprocessor are used. ARMprocessor with part number ATSAM3X8E is used because it hascapability to cater large data and support multi-input of UART. Inaddition, it has large memory that allows applying algorithm in signalprocessing.

Progress In Electromagnetics Research B, Vol. 56, 2013 375
4.3. Measurement Setup
The single array antenna is assembled in a hexagonal structurewith 6-elements to cover all angles in 360 degrees, to check theperformance of reflection coefficient every single angle of the antenna,thus a measurement is needed. Referring to Figure 5, aboveinitial measurement reflection coefficient of single antenna gives goodresponse for the band 2.4 GHz to 2.6GHz, thus remeasurement isneeded after antenna assemble becomes hexagonal structure to validatethe performance maintained for the require bandwidth. Figure 9 showsmeasurement setup to measure reflection coefficient of antenna oncethe antennas share the same ground element, and the measurementof radiation pattern has been done to compare with the initial resultsof the single antenna. Once results of both reflection coefficient andradiation pattern are fulfilled as required in LTE band, a prototypeof 2.4 GHz band is required in order to match the X-Bee band. Thenext step is live measurement on site to test the performance of smartantenna by using a mobile device.
Figure 9. Measurement of antenna reflection coefficient in hexagonstructure.
Figure 10 shows a test that has been performed at the actualfield in an open area, where a mobile device (user) is placed aroundantenna, then radio signal strength indicator (RSSI) reading for eachantenna is recorded. In the initial testing, 10 samples of data RSSIare taken, and the average is calculated. Next test takes more sampledata RSSI from each antenna, while mobile device is placed in one ofthe beam area of the antenna. Sample data taken are for 100 samplesand should be different for each of the antennas because every antenna

376 Evizal et al.
Figure 10. Measurement of signal strength received by each ofantenna in outdoor.
receives from a different angle, then average of all data received iscalculated to compare with previous small amount of sample datawith only 10 data. All above testings are an initial testing withoutimplementing intelligence algorithm into data processing because asobserved, the RSSI received from each antenna keeps changing andsignal value received, which match up each antenna, does not representrelevant value compared to the angle of mobile device.
Introducing smart algorithm, which is an artificial immune system(AIS), is to reduce and overcome the current issues in inconsistentsignal strength received in each antenna, then define actual valuesreceived. One of the AIS methods is a negative selection algorithm(NSA) where every signal received and collected by receiver is keptin a database to be analyzed. As long as the collected data are goodfor the system because AIS concept is a learning process from thebehaviour of previous data, a decision is achieved based on new datareceived. Data from different scenarios, such as environment, angle ofmobile device (user) and distance, are required to make the systemmore intelligent and a decision made more accurately to the actualdata.

Progress In Electromagnetics Research B, Vol. 56, 2013 377
4.4. Implement of Artificial Immune System Algorithm
The use of the negative selection algorithm in smart antenna is amethod to determine actual signal strength value received from mobiledevice, as initial testing values of RSSI received from each of theantennas are inconsistent. Specifically, real value negative selectionalgorithm (RNSA) is used in this case because real values of thesignal strength received will be compared and analyzed by processingunit without converting to other unit such as binary. Signal trainingprocess is done to collect sample data as much as possible and variousscenarios of wireless communication. Figure 11 shows a flowchart ofthe algorithm. Figure 11(a) shows a flowchart to generate negativeselection algorithm detector, and Figure 11(b) shows a flowchart ofthe algorithm to process signal received and determine actual receivedsignal value. The basic concept of an artificial immune system is togenerate detector by collecting sample data as much as possible fortraining process, then a detector set will check and define signal orvalue to be processed based on requirement. Once the actual value ofthe signal strength received is defined, the next process is to analyzewhich is the highest values. Antenna direction toward mobile deviceshould receive the highest values because of the direct beam.
The whole system process in digital signal processing (DSP) is
Start
Collect Candidate Detector Data
New Detector Accepted
Enough of Detector Number?
Match Self Sampleof Data?
End
Y
N
Y
N
Begin
Store Self Data as Actual RSSI
Match to Detector?
End
N
Y
Input Live RSSI Data
Self Non-Self
Ignore Non-Self Data
(a) (b)
Figure 11. Flowchart of negative selection algorithm process flow.(a) Detector set generation. (b) Define of actual RSSI value.

378 Evizal et al.
Start
Switch Beam to Highest Valueand On LED Indicator at Antenna
Enough of Sample Data?
End
Y
N
Y
User Device Send Packet of Data
Smart Antenna SystemReceived Packet of Data
DSP Check RSSI Value and Number of Data Received
for First Antenna
DSP Check RSSI Value and Number of Data Received
for Sixth Antenna
AIS Algorithm Processingas Shown in Figure 11
Enough of Sample Data?
Y
N
Comparing Actual RSSI ValueFrom Antenna 1-6 Than DefineRepresented Antenna Received
RSSI ValueChanging?
N
Figure 12. Flowchart of algorithm complete process smart antennasystem.
shown in the algorithm flowchart in Figure 12, starting by collectingdata of RSSI until switching antenna beam toward user device beam. Amobile device is used as user transmitter and programmed to be ableto transmit a packet of data. Moreover, X-Bee module is availablewith RSSI value data in the packet, thus the signal value is receivedby signal processing to be analyzed as live data and candidate of thedetector. Artificial immune system determines the values of live data

Progress In Electromagnetics Research B, Vol. 56, 2013 379
based on a detector set generated, and the number of detectors isnormally bigger than the number of data to process. In this case, thenumber of sample data to be analyzed is 10 and 100, and the numberof detector sets should be bigger than live data. For 10 live data, thenumber of detector sets is 50, and for 100 live data, the number ofdetectors is 500, five times of the live data. After real values of RSSIare defined from each of antenna beam controller will set the beam tothe highest value of RSSI as represented beam of the angle of arrival(direction of arrival) signal of the user device. An LED indicator isalso installed at the bottom of the antenna as a sign that activatedbeam in this direction and indicates that user device is also detectedfrom this beam area.
The proposed process of system can be completed on personalcomputer for testing and simulation, then actual implementation usesdigital signal processing, where all the proposed algorithm and softwarewill be implemented in digital signal processing (DSP) chip. Ascommon software and algorithm system has a code or pseudocode toperform all the raw data, Figure 13 shows the pseudocode used in theproposed smart antenna system. Figure 13(a) shows that the algorithmprovides a pseudocode listing of the detector generation procedure forthe negative selection algorithm (NSA), and Figure 13(b) shows thatthe algorithm provides a pseudocode listing of the detector applicationprocedure for the negative selection algorithm [19].
(a) (b)
Figure 13. Pseudocode of smart antenna system. (a) Detectorgeneration procedure. (b) Detector application procedure.
5. RESULTS AND DISCUSSION
In order to collect the RSSI value of X-Bee module, a packet of dataneed to be sent from any pairing of X-Bee device, and in this scenarioa set of X-Bee module attached to a microcontroller sends a packet

380 Evizal et al.
Number of RSSI Hexadecimal(dBm)
Decimal(-dBm)Value Collected
1 3C 60
2 39 57
3 33 51
4 32 50
5 33 51
6 35 53
7 38 56
8 3F 63
9 45 69
10 38 56
(a) (b)
Figure 14. Raw data received consist of RSSI value. (a) Byte 7is represent RSSI data. (b) RSSI value in hexadecimal converts todecimal.
of data that consist of RSSI value. By using demo software of X-Bee which is X-CTU, where software receives raw data representingpacket sent by transmitter (user device), as the data sheet of X-Beemodule [20], RSSI value is at 7th byte and in hexadecimal value.Figure 14 shows X-CTU demo software received packet of data fromthe transmitter. Figure 14(a) shows raw data in hexadecimal, and7th byte represents RSSI value. Figure 14(b) shows that RSSI valuereceived is converted from hexadecimal to decimal for easy analysis andobservation, and the proposed algorithm is also in real values whichdoes not need to convert to other unit.
Measurement results as mentioned earlier are initially obtained bycollecting RSSI data received at each antenna with 10 numbers, thenthe average to determine actual signal values received by representativeof each antenna beam is calculated. Table 1 shows the numberof antenna beams as proposed hexagon structure, number of datacollected and average values for 10 of sample data. Results of RSSIvalues received for every reading is mostly changing, lower numberof data maintains the same values due to environment and path lossof the wireless signal. In this scenarios, the user device is located atbeam 2 (antenna 2 zone). In this beam expected signal value receiveis the highest among all beams, and the weak RSSI value is in beam 5(the opposite side) while the rest beams received RSSI value are in themiddle range.

Progress In Electromagnetics Research B, Vol. 56, 2013 381
Table 1. Number of RSSI data collected for user device on beam 2.
Number of RSSI Value (dBm)
RSSI
CollectedBeam 1 Beam 2 Beam 3 Beam 4 Beam 5 Beam 6
1 −60 −60 −65 −76 −88 −73
2 −63 −57 −66 −76 −89 −70
3 −66 −51 −62 −78 −89 −76
4 −64 −50 −60 −74 −85 −76
5 −64 −51 −69 −71 −83 −71
6 −65 −53 −63 −73 −89 −72
7 −67 −56 −65 −73 −88 −76
8 −63 −63 −65 −75 −85 −78
9 −63 −69 −65 −74 −89 −78
10 −61 −56 −60 −71 −89 −75
Average
RSSI Value−63.6 −56.6 −63.0 −74.1 −87.4 −74.5
While increasing the number of RSSI samples to determineactual values by calculating the average still inaccurate as representedactual values of RSSI. The second measurement is by collectingsample data of RSSI values from every antenna by 100 samples, thensimilar to previous technique, the average is calculated to determinerepresentative actual signal strength value. To make analysis andobservation easy, those sample data plotted in the chart by y-axisrepresent values of RSSI in dBm and x-axis number of sample datacollected. Figures 15(a)–(f) shows graphs of sample data collected forevery beam starting from the first beam until the sixth beam. Thegraphs also show the straight lines at y-axis which indicate averagevalue.
Results of signal strength value collected from every beam as showsin Figure 15 indicate that the average value of RSSI still does notrepresent actual values of received signal. The figure shows that almostall the average values of RSSI are higher than the values determinedby algorithm processing. For example, in this scenario as mentionedearlier, user device location in antenna 2 beams and reading from thatantenna shows −56.6 dBm while the signal strength value based on theartificial immune system algorithm shows that the values is−52.9 dBm.Similar to the other beams of antenna, reading data from user deviceshow an average value higher than the value determined by immunealgorithm. To prove that the values of RSSI received determined by

382 Evizal et al.
(a) (b)
(c) (d)
(e) (f)
Figure 15. Raw data received consist of RSSI value. (a) 1st antenna.(b) 2nd antenna. (c) 3rd antenna. (d) 4th antenna. (e) 5th antenna.(f) 6th antenna.
AIS algorithm are true, in this case, a measurement has been donein an anechoic chamber with almost zero interference, and RSSI valueis collected based on similar distance. This method to prove and as

Progress In Electromagnetics Research B, Vol. 56, 2013 383
Table 2. Comparison of RSSI results measurement and calculation.
Beam of
Antenna
Initial
RSSI
Value
RSSI Value
Average
Calculation
Percent
of Error
RSSI Value
Determine
Algorithm
Percent
of Error
Antenna-1 −62 dBm −65.59 dBm 5.47% −63.65 dBm 2.59%
Antenna-2 −52 dBm −57.25 dBm 9.17% −52.49 dBm 0.93%
Antenna-3 −62 dBm −65.15 dBm 4.83% −61.36 dBm 1.04%
Antenna-4 −71 dBm −76.18 dBm 6.80% −73.28 dBm 3.11%
Antenna-5 −81 dBm −82.95 dBm 2.35% −79.67 dBm 1.67%
Antenna-6 −73 dBm −75.69 dBm 3.55% −72.11 dBm 1.23%
a reference of RSSI values given by algorithm processing is correctand can be used as an indicator for smart antenna beam switching.Table 2 shows a summary of measurement result and comparisonbetween average calculations (current results of system) and thosedetermined by artificial immune algorithm (proposing new system byalgorithm). Comparison result shows measurement of RSSI signal in ananechoic chamber as initial values of RSSI for reference, and percentageerror of average calculation is higher than that determine by immunealgorithm. This mean value of RSSI defined by AIS algorithm is moreaccurate than that by average calculation although it has some errorpercentage.
6. CONCLUSIONS
A smart antenna system for long term evolution communication asproposed has been designed, measured and tested. The use of smartantenna is related to the arrival of the signal and processing system,thus selection of algorithm is important to obtain actual signal valuesreceived, define angle of signal arrival and correct beam switching.The proposed artificial immune system (AIS) using real value negativeselection algorithm to determine the actual signal value received bysmart antenna system has been tested and proved to be applicablein signal processing. RSSI value is used as reference parametersbecause in common radio frequency transmitter and receiver shouldhave radio signal strength properties, thus this signal is used todetermine direction of arrival (angle of arrival) of user device ina wireless communication system. This method is proposed as analternative and explored applicability of an artificial immune systemapplied into antenna signal processing. The smart antenna structureproposed is hexagonal with 6-elements of antenna array, thus the

384 Evizal et al.
antenna system has possibility to receive signals from 6 angles ofarrival. Implementation of the artificial immune algorithm contributesefficiency and accuracy in determinnation of the angle of arrivalcompared to calculation of average signal received. To prove that thesignal defined by the algorithm is correct value to the actual signal,a measurement in anechoic chamber has been done on early stage asa reference to RSSI value, and the result of measurement is recordedin every beam of antenna directions. A comparison has been made inthe last stage to see the error percentage of the result determinedby average calculation compared to result determined by immunealgorithm. The proposed smart antenna system is able to switch theantenna beam toward the direction of user device and continues totrack user device location.
ACKNOWLEDGMENT
The authors would like to acknowledge and express sincere appreciationto Universiti Teknologi Malaysia and Wireless Communication Centrefor financing this project.
REFERENCES
1. 3GPP, “The mobile broadband standard,” 2013, Available:http://www.3gpp.org/About-3GPP.
2. Weon-Cheol, L. and C. Seungwon, “Adaptive beamformingalgorithm based on eigen-space method for smart antennas,” IEEECommunications Letters, Vol. 9, No. 10, 888–890, 2005.
3. Celik, N., et al., “Implementation and experimental verification ofhybrid smart-antenna beamforming algorithm,” IEEE Antennasand Wireless Propagation Letters, Vol. 5, No. 1, 280–283, 2006.
4. Mahmoud, K. R., M. El-Adawy, S. M. M. Ibrahem, R. Bansal, andS. H. Zainud-Deen, “A comparison between circular and hexagonalarray geometries for smart antenna systems using particle swarmoptimization algorithm,” Progress In Electromagnetics Research,Vol. 72, 75–90, 2007.
5. Byun, G., et al., “Optimum placement of DF antenna elementsfor accurate DOA estimation in a harsh platform environment,”IEEE Transactions on Antennas and Propagation, Vol. 61, No. 9,4783–4791, 2013.
6. Carlin, M., et al., “Directions-of-arrival estimation throughBayesian compressive sensing strategies,” IEEE Transactions onAntennas and Propagation, Vol. 61, No. 7, 3828–3838, 2013.

Progress In Electromagnetics Research B, Vol. 56, 2013 385
7. Malajner, M., et al., “Angle of arrival estimation using RSSIand omnidirectional rotatable antennas,” IEEE Sensors Journal,Vol. 12, No. 6, 1950–1957, 2012.
8. Hood, B. N. and P. Barooah, “Estimating DoA from radio-frequency RSSI measurements using an actuated reflector,” IEEESensors Journal, Vol. 11, No. 2, 413–417, 2011.
9. Celik, N., et al., “Experimental verification of the hybrid smartantenna algorithm with modulated waveforms,” IEEE Antennasand Wireless Propagation Letters, Vol. 8, 236–239, 2009.
10. Hislop, G., et al., “Direction finding with MUSIC and CLEAN,”IEEE Transactions on Antennas and Propagation, Vol. 61, No. 7,3839–3849, 2013.
11. Gotsis, K. A., et al., “On the direction of arrival (DoA) estimationfor a switched-beam antenna system using neural networks,” IEEETransactions on Antennas and Propagation, Vol. 57, No. 5, 1399–1411, 2009.
12. Kunarak, S. and R. Suleesathira, “Algorithmic vertical handoffdecision and merit network selection across heterogeneous wirelessnetworks,” WSEAS Transactions on Communications, Vol. 12, 1–13, 2013.
13. De Castro, L. R. and J. Timmis, Artificial Immune Systems: ANew Computational Intelligence Paradigm, Springer-Verlag NewYork, Inc., 2002.
14. Timmis, J., et al., “Immune systems and computation:An interdisciplinary adventure,” Unconventional Computing,Vol. 5204, 8–18, C. Calude, et al., Eds., Springer, Berlin,Heidelberg, 2008.
15. Gonzalez, F., et al., “A randomized real-valued negative selectionalgorithm,” Artificial Immune Systems, Vol. 2787, 261–272,J. Timmis, et al., Eds., Springer, Berlin, Heidelberg, 2003.
16. Hunt, J., et al., “JISYS: Development of an artificial immunesystem for real world applications,” Artificial Immune Systemsand their Applications, 157–186, Springer, 1998.
17. Gross, F. B., Smart Antenna for Wireless Communication,McGraw-Hill, United States, 2005.
18. Balanis, C. A., Antenna Theory: Analysis and Design, John Wiley& Sons, 2005.
19. Brownlee, J., Clever Algorithms, 1st Edition, Lulu Enterprises,Australia, 2011.
20. DI Inc., “XBee R©/XBee-PRO R© RF modules,” Product Manualv1.xEx — 802.15.4 Protocol, M. N. Minnetonka, Ed., 2009.