Embed Size (px)
Citation preview
Application of Narrow-Spectrum Illumination and Image Processing to Measure Surface Char Formation in Lateral Ignition and Flame Spread Tests
Seth Gatien 1, Tim Young 2, Matthew S. Hoehler 3, John Gales 4*
1 Research Assistant, Carleton University, Ottawa, Canada 2 Research Assistant, York University, Toronto, Canada
2 Research Structural Engineer, National Institute of Standards and Technology, Gaithersburg, USA 3 Assistant Professor, York University, Toronto, Canada
*Corresponding author; [email protected]
SUMMARY
The Lateral Ignition and Flame Spread Test (LIFT) is used to characterize fire ignition and flame spread on solid materials. This test requires the operator to visually monitor the flame spread over a combustible material and manually record the position of the flame during an experiment. Visual inspection limits the quantity of data obtained from a test and introduces uncertainty in the measurement. In this study, we use narrow-spectrum light with a peak wavelength of 450 nm and a digital camera with frequency-matched optical filters to capture images of surface charring, which underlies the flaming combustion, in a LIFT apparatus. The imaging technique reduced unwanted energy emissions from the flame in the visible light spectrum, allowing the test operator to directly view the charring of the material; which is otherwise hidden behind the flames. We describe data processing routines to analyze the sequences of high-resolution images. The method improves temporal and spatial resolution of the surface charring compared to visual observations.
Key words: Imaging; Narrow-spectrum illumination; Fire; Surface charring; Lateral Ignition and Flame Spread Test
1. Introduction
Testing of combustible solid materials often relies on visual observations to quantify flame spread. While flame spread is a useful metric of fire behavior, the underlying thermo-physical mechanisms, in particular surface material char formation, can also be important [1]. For example, combustible materials used for building construction can exhibit charring mechanisms that require detailed understanding to be used safety in fire-exposed installations; a relevant example being engineered timber [2, 3]. A more comprehensive measurement of surface charring mechanisms could be used to improve validation of material degradation models under a variety of fire scenarios, as well as for product development. A common test to measure flame spread over a combustible element is the Lateral Ignition and Flame Spread Test (LIFT); the relevant American Society of Testing and Materials (ASTM) standard being ASTM E1321 [4]. The test involves subjecting an 800-mm long sample to a defined incident heat flux and visually tracking the flame spread across the sample using the human eye. The technique requires the operator to manually record the time when the flame front passes markers on the test apparatus spaced at 50 mm intervals, thereby producing 16 data points along the length of a sample. The standard technique does not capture variation of the flame front
position across the height of the specimen and can be sensitive to operator bias (human error). Although it is not the stated intent of the test, it can also be used to study material surface charring by making assumptions about the position of the charring, which lags behind the visible flame front, as well as by studying the specimen after the test is complete. Though its acknowledged as discussed below that this is normally not a specific material property that the test aims to derive. Quantitative optical metrology has become an increasingly popular tool for measurement [5]. These techniques use sequences of images taken by one or more cameras to detect and quantify changes in the position or shape of objects in the field of view. They have the advantage that there is no contact between the sensor (camera) and the target object and can cover large regions of interest with high data point density. A natural approach to obtain more information from a LIFT test, and specifically to quantify surface charring progression, would be to apply an image-based technique for data collection. However, the use of optical metrology is hindered by several obstacles including the thermal radiation emitted from the fire that hides the underlying charring, obscuration of the target by soot and smoke, and distortion of the images by light refraction in the heated air. Fortunately, in LIFT tests the flames are typically thin (flame thickness is a small fraction of the length of the sample) and the combustion products (soot and smoke) are exhausted directly above the specimen; leaving the radiation emitted by the flames and refraction-induced image distortion as the primary challenges to imaging surface charring. Efforts to dimensionally measure materials at high temperatures using imaging have been made in the past at various scales. Many of these studies have focused on metallic materials heated by radiant or induction heating; i.e., without flaming combustion. A comprehensive discussion of image distortion at high temperatures is provided by Jones and Reu [6]. To overcome target emissions of black-body radiation from a resistance-heated specimen, Grant et al. [7] propose the use of blue illumination and filters. Pan et al. [8] use a similar approach to study stainless steel plates heated to 1200 °C from the back side by an infrared heat source. To improve image contrast at even higher temperatures, Berke and Lambros [9] use ultraviolet (UV) lights and UV optics to investigate heated nickel superalloys. Gales et al. [10] apply a different, but related, solution to the problem of imaging targets at 625 °C in an environmental chamber by providing sufficient broad-band illumination. To deal with the additional optical challenges when flaming combustion is present, Dos Santos et al. [11] use high-pass filtering of images to separate high frequencies from low frequencies (background, flames, and smoke) and return a flat gray background everywhere except where small structures are observed; char for example. The technique is practical for small flame depths and non-glowing materials. Matsuyama et al. [12] investigate the use of a terahertz array illuminator and a near-infrared radiation (NIR) detection system to locate objects in smoky rooms and Hu et al. [13] used a commercial IR camera to study the droplet shape and temperature of burning polymers. For larger fires, Smith and Hoehler [14] apply high-intensity, narrow-spectrum light (450 nm wavelength) to illuminate targets obstructed by low soot yield fires and image the targets using a camera with frequency-matched optical filters. Because light emitted from flames is more intense at the red end of the visible spectrum, the illumination at the shorter wavelength in conjunction with the optical filtering increases the image signal-to-noise ratio by several orders of magnitude; greatly improving optical contrast and allowing imaging of targets behind fires up to 1000 kW in magnitude.
In this paper, we apply the narrow-spectrum lighting technique by Smith and Hoehler [14] to the ASTM E1321 Lateral Ignition and Flame Spread Test to successfully image surface charring in Laminated Veneer Lumber (LVL) and plywood panels. An image analysis procedure that increases the temporal and spatial data for the surface charring progression compared to visual inspection is described. Finally, the uncertainties associated with this method are discussed. ASTM E1321 is used primarily for research and development purposes; it is not referenced, nor required, within in building codes. The LIFT test is intended to study ignition and subsequent lateral flame spread at small scale; often prior to more expensive qualification tests. The narrow spectrum illumination technique discussed herein is useful to study the spatial extent and spread rate of surface char formation on materials. While this is demonstrated using the LIFT setup, other standardized tests may benefit by the additional data provided by this simple and inexpensive measurement technique.
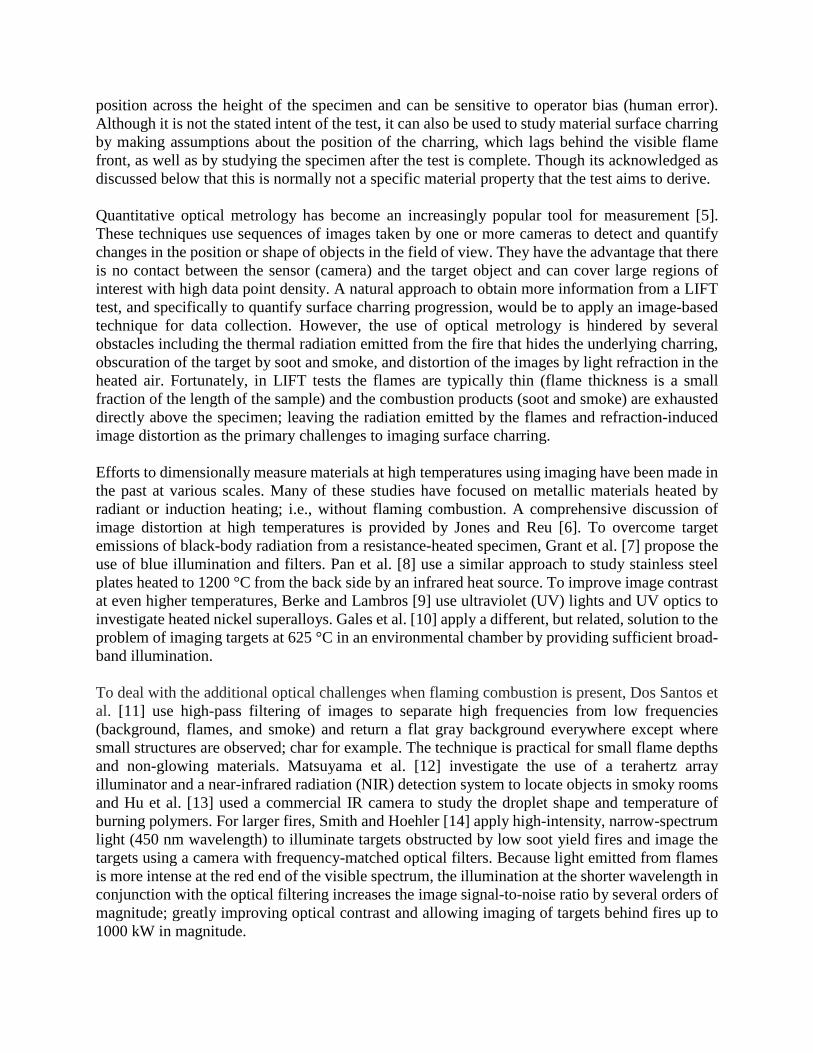
2. Experimental Setup and Procedure A commercially-available LIFT apparatus compliant with ASTM E1321 [4] was used to conduct the experiments. The setup uses a radiant heater fueled by a pre-mixture of methane and air to provide a well-controlled incident heat flux to a test specimen. The heater is fixed at a prescribe angle facing the specimen and a pilot flame is located at the end of specimen where the incident heat flux is highest. A combustible material (test specimen) is placed in a specimen holder in front of the radiant heater. The angle of the heater and presence of the pilot flame induce ignition in the specimen and flame can spread across a material. An exhaust hood located directly above the specimen exhausts the combustion products. Flame spread is traditionally tracked along one horizontal line across the mid-height of the specimen’s surface using visual observations of the flame position relative to reference pins located every 50 mm up to a maximum specimen length of 800 mm. The test operator manually records the time when she observes the flame passing a reference pin. Prior to testing, the LIFT apparatus requires calibration to achieve a prescribed heat flux across the 800-mm long test specimen. Figure 1a shows the calibration setup. A ceramic board is placed in the sample holder and a calibrated heat flux gauge is sequentially placed into each of the specified perforations to measure the heat flux at the location of the perforation. The incident radiant heat flux varied from 50.5 kW/m2 to 2.5 kW/m2 (Figure 1b) with an expanded total uncertainty of ± 5 % of the reading (95 % confidence) from left to right along the specimen.
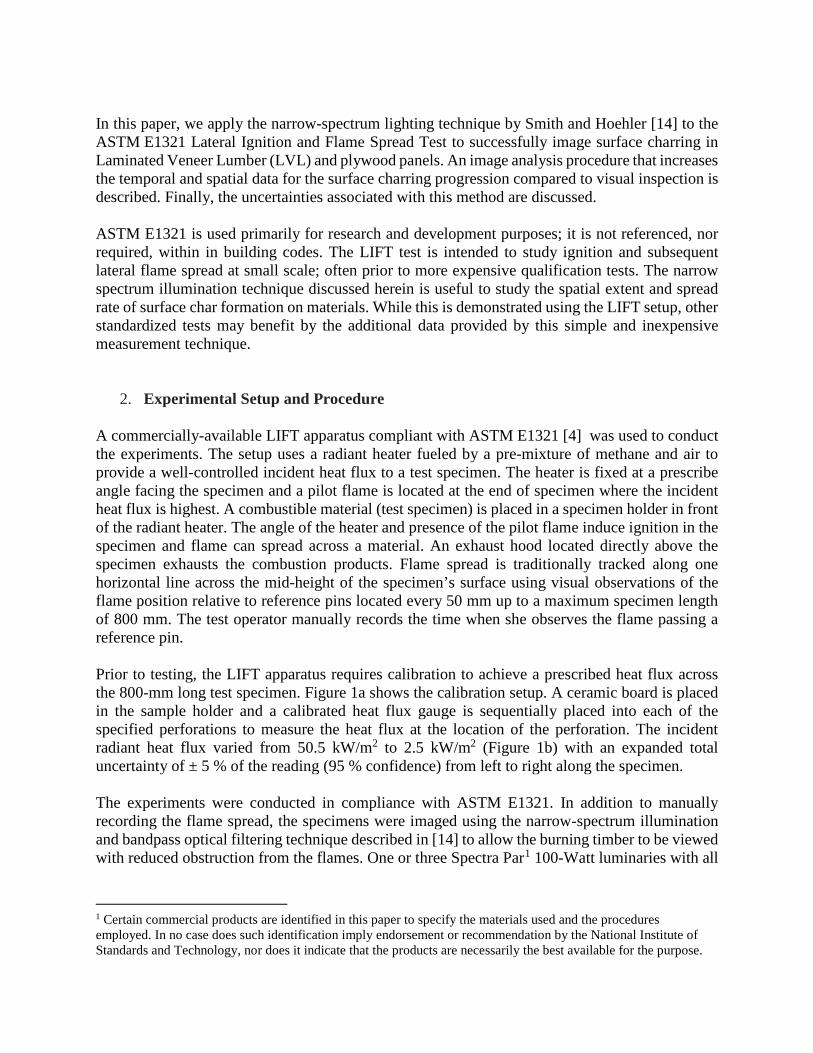
The experiments were conducted in compliance with ASTM E1321. In addition to manually recording the flame spread, the specimens were imaged using the narrow-spectrum illumination and bandpass optical filtering technique described in [14] to allow the burning timber to be viewed with reduced obstruction from the flames. One or three Spectra Par1 100-Watt luminaries with all
1 Certain commercial products are identified in this paper to specify the materials used and the procedures employed. In no case does such identification imply endorsement or recommendation by the National Institute of Standards and Technology, nor does it indicate that the products are necessarily the best available for the purpose.
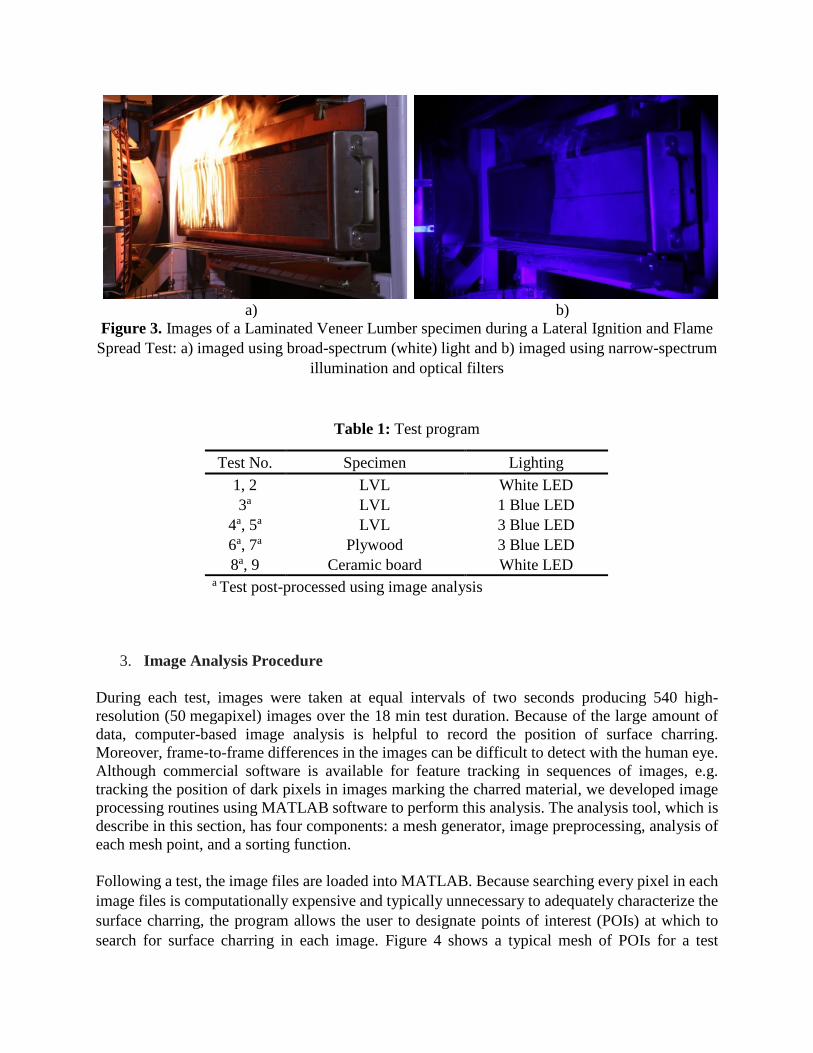
blue (450 nm wavelength) Light Emitting Diodes (LEDs)2 were used to illuminate the sample (see Figure 2). For comparison, a ‘white’ 27-Watt LED luminary was used in select tests. A Canon EOS 5Ds Mark III DSLR camera was used to image the specimens. The camera’s 50 Megapixel resolution (images of 5792 x 8688 pixels) allows it to be placed far away from the specimen during testing while retaining high resolution. This reduces the risk of damage to the camera and lenses due to heating and thermal radiation from the LIFT apparatus. The following camera settings were nominally used: frame rate of 0.5 frames per second, ISO 2000, aperture f/13, shutter 1/800. These setting will vary based on specific application conditions. A bandpass optical filter consisting of two stacked filters (HOYA Corporation B440 and Midwest Optical Systems BP470) was attached to the front of the camera. Two stacked filters provided a low-cost and effective band-pass filter at the desired frequency (450 nm). A second camera was placed adjacent to the camera with the filters to compare unfiltered and filtered images. Figure 3 illustrates the images taken with and without the illumination and filtering. The test programme is shown in Table 1. Laminated Veneer Lumber (LVL) and structural plywood are investigated to compare tracking of char and flame fronts using the method in ASTM E1321 with digital image analysis using the narrow-spectrum illumination technique. The intent of this study is not to characterize these wood products, but rather to use different materials to illustrate the technique for measuring surface charring. In Test 1 to Test 5 the type and intensity of the illumination vary. Test 6 and Test 7 look at different materials (Plywood versus LVL). Test 8 and Test 9 use a non-flammable ceramic specimen to characterize the position error caused by refraction of light due to thermal gradients in the air between the camera and the specimen due to the radiant panel. Each test ran a maximum of 18 minutes. All wood samples had a moisture content at the time of testing near 10 % by mass achieved through normal pre-conditioning inside the laboratory. The LVL was made of unspecified Grade 2.0E-3100Fb spruce, pine and fir. The plywood material was unspecified, ungraded spruce, pine and fir. The thickness of the laminate in both the plywood and LVL was approximately 3 mm. Both materials utilised phenol formaldehyde adhesive. The LVL had a (blue) surface treatment to prevent moisture penetration; chemical composition unknown.
2 High-intensity light in this frequency range can be harmful to your eyes. Appropriate eye protection and/or measures to prevent direct viewing of the light at close range are recommended.
a) b)
Figure 1. Calibration of incident heat flux in LIFT apparatus according to ASTM E1321 [4]: a) photograph of setup and b) measured incident heat flux as a function of position along the
specimen
Figure 2. Photograph of apparatus showing camera and LED light locations
a) b)
Figure 3. Images of a Laminated Veneer Lumber specimen during a Lateral Ignition and Flame Spread Test: a) imaged using broad-spectrum (white) light and b) imaged using narrow-spectrum
illumination and optical filters
Table 1: Test program
3. Image Analysis Procedure
During each test, images were taken at equal intervals of two seconds producing 540 high-resolution (50 megapixel) images over the 18 min test duration. Because of the large amount of data, computer-based image analysis is helpful to record the position of surface charring. Moreover, frame-to-frame differences in the images can be difficult to detect with the human eye. Although commercial software is available for feature tracking in sequences of images, e.g. tracking the position of dark pixels in images marking the charred material, we developed image processing routines using MATLAB software to perform this analysis. The analysis tool, which is describe in this section, has four components: a mesh generator, image preprocessing, analysis of each mesh point, and a sorting function. Following a test, the image files are loaded into MATLAB. Because searching every pixel in each image files is computationally expensive and typically unnecessary to adequately characterize the surface charring, the program allows the user to designate points of interest (POIs) at which to search for surface charring in each image. Figure 4 shows a typical mesh of POIs for a test
Test No. Specimen Lighting 1, 2 LVL White LED 3a LVL 1 Blue LED
4a, 5a LVL 3 Blue LED 6a, 7a Plywood 3 Blue LED 8a, 9 Ceramic board White LED
a Test post-processed using image analysis

specimen. Since our camera is placed at an angle to the specimen, the image must first be projection-corrected; this is why the image in Figure 4 is elongated compared to Figure 3b. Points of interest can then be located at the positions of the reference pins used in the standard ASTM E1321 test method; but additional points can be added, e.g. along the top and bottom of the specimen. An auto-generated mesh feature allows the points of interest to be distributed logarithmically – being more clustered at the ignition location – to account for the faster char rate at the beginning of the test.
The image preprocessing function then prompts the user to select regions of the image to establish colour contrast limits to distinguish between charred and uncharred material. First, an image that contains both charred and uncharred material is separated into its component red, green, and blue images. The program only requires one of these colours for analysis, since each colour has its own light intensity distribution. Since 450 nm light was used to illuminate the specimens, the best color contract is provided by the blue component of the images. The user is then prompted to select several points of charred and uncharred material to determine the minimum and maximum light intensity values. The intensity values (pixel depth) range from 0 to 255. The program checks to see if the intensity values overlap; i.e., if the program would falsely conclude that an uncharred part is charred. The maximum value (lightest value) picked from a charred region is used as the ‘char threshold’. Each test has a unique char threshold since lighting conditions can change between tests and the reflectivity of specimens can vary.
The analysis function then searches the blue components of all 540 images and determines the pixel intensity for each point of interest. The intensity at each point of interest is compared with the surface charring threshold intensity. If the point of interest intensity drops below the surface charring threshold, the program concludes that the point has charred and records a 1 for the pixel location of that point of interest, otherwise the point of interest remains at its initial value of 0. By saving the information as a Boolean operator and looking at each image individually, the user can quickly manually correct false positives for a specific image if required after an analysis has completed.
Finally, the sorting function finds the image where surface charring first appears for each point of interest. This indicates the time when the char front passed this point of interest. If there are false positives recorded by the analysis function, they must be corrected before executing the function.
Figure 4. Point of interest selection of 45 points
4. Results and Discussion
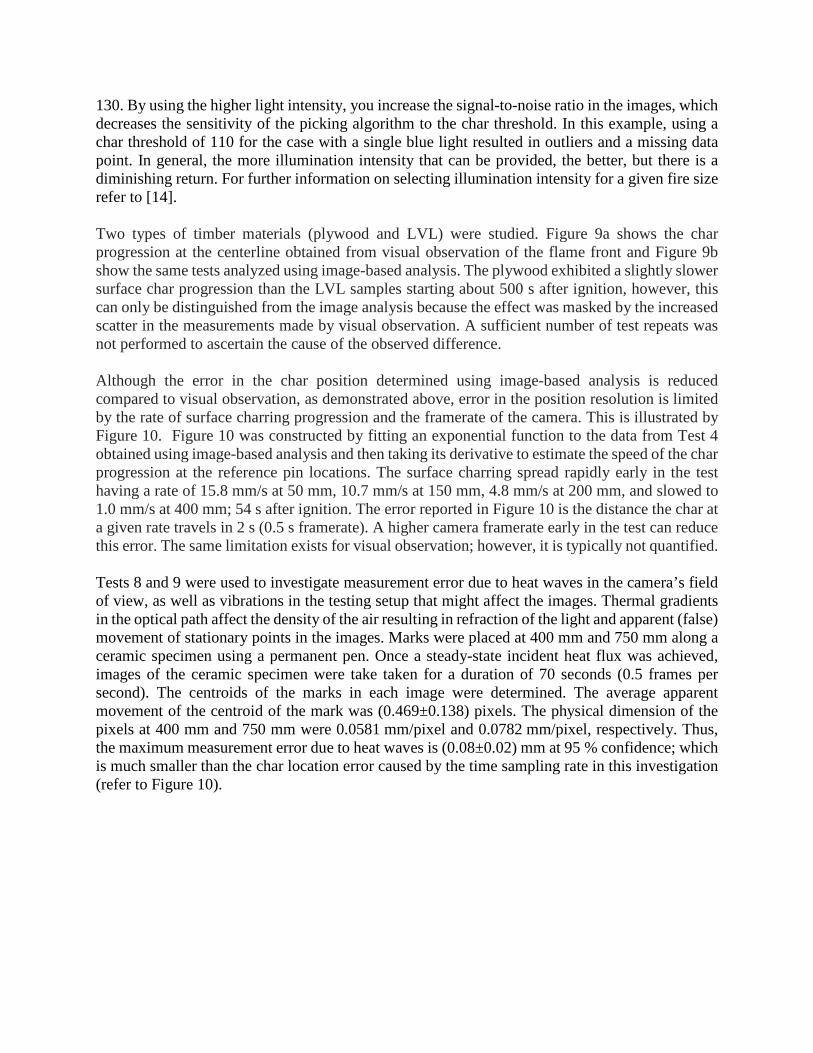
When burning a combustible material that can char, the location of the surface char is often close to the location of the flaming combustion. Therefore, the position of flames can be used to approximate the position of the underlying surface char. Figure 5 plots the progression of the flame front on the investigated laminated veneer lumber specimens obtained using visual observation according to ASTM E1321. The variation in the time required for the flames to reach a specific position increases as they progress along the specimen from left to right (larger scatter on the right). The increased variation is due in part to the fact that as the incident heat flux decreases toward the right side of the specimen and the surface charring slows and the influence of inherent specimen-to-specimen surface charring rate variation becomes more apparent. However, part is related to the method used to measure the extent of flame spread. Because the time when the observer sees the flame pass a reference pin is subjective, there is increased systematic uncertainty in the measurement as the flame front movement slows down. The subjectivity in the manually-picked flame positions comes from sources including: (i) the observer’s reaction time between when they see the flame pass a reference pin and when they record the time, (ii) the observer’s position relative to the mirror on the LIFT apparatus used to view the flames, and, (iii) the fact that the flame front is often not linear from top to bottom of the specimen. This last point is illustrated by Figure 6. Figure 6a shows the char front at various times throughout the test determined using images analysis at each of the indicated times. Figure 6b shows a graph of the times the surface charring passes the reference pin locations as determined by image analysis along the dashed lines marked ‘Top’, ‘Middle’ and ‘Bottom’ in Figure 6a. For this specimen, the char front progresses faster near the top of the specimen compared to the bottom. If visual observation is used and the observer considers the flame front slightly above (or below) the centerline, this will cause the measurement to vary. Moreover, using a single value of the flame (surface charring) front at the centerline disregards potentially valuable information about variation of the surface charring across the specimen (top to bottom) that is captured by the image analysis. The subjectivity introduced by sources (i) and (ii) are also eliminated by using an automated, image-based analysis. A further advantage of image-based analysis is that the char position can be determined at any time for which an image is available. Thus, the time sampling frequency is limited only by the framerate of the camera, whereas for visual observation the time sampling frequency depends on the rate of the surface charring and the locations of the reference pins. For the current tests with a framerate of 0.5 frames per second, up to 540 time-samples (N) could be achieved; although as shown by Figure 7, N=35 is sufficient to achieve adequate time resolution. Since surface charring (and flame spread) progresses much more rapidly early in the test (refer to Figure 6a), the framerate of the camera could be slowed later in the test and fewer images would be required. Figure 7 also shows an example of a case with significant variation in the visually observed surface charring rate from the image-based analysis as the test progressed; likely caused by the observer’s judgement about when the slow-moving, amorphous, flame passed a reference pin. Figure 8 illustrates the influence of the intensity of the narrow-spectrum illumination on the image analysis. Test 3 used a single 100 W blue light, whereas Test 5 used three of them (300 W). The ‘char threshold’ in the image processing function was manually set to a pixel depth of 110, 120 or
130. By using the higher light intensity, you increase the signal-to-noise ratio in the images, which decreases the sensitivity of the picking algorithm to the char threshold. In this example, using a char threshold of 110 for the case with a single blue light resulted in outliers and a missing data point. In general, the more illumination intensity that can be provided, the better, but there is a diminishing return. For further information on selecting illumination intensity for a given fire size refer to [14].
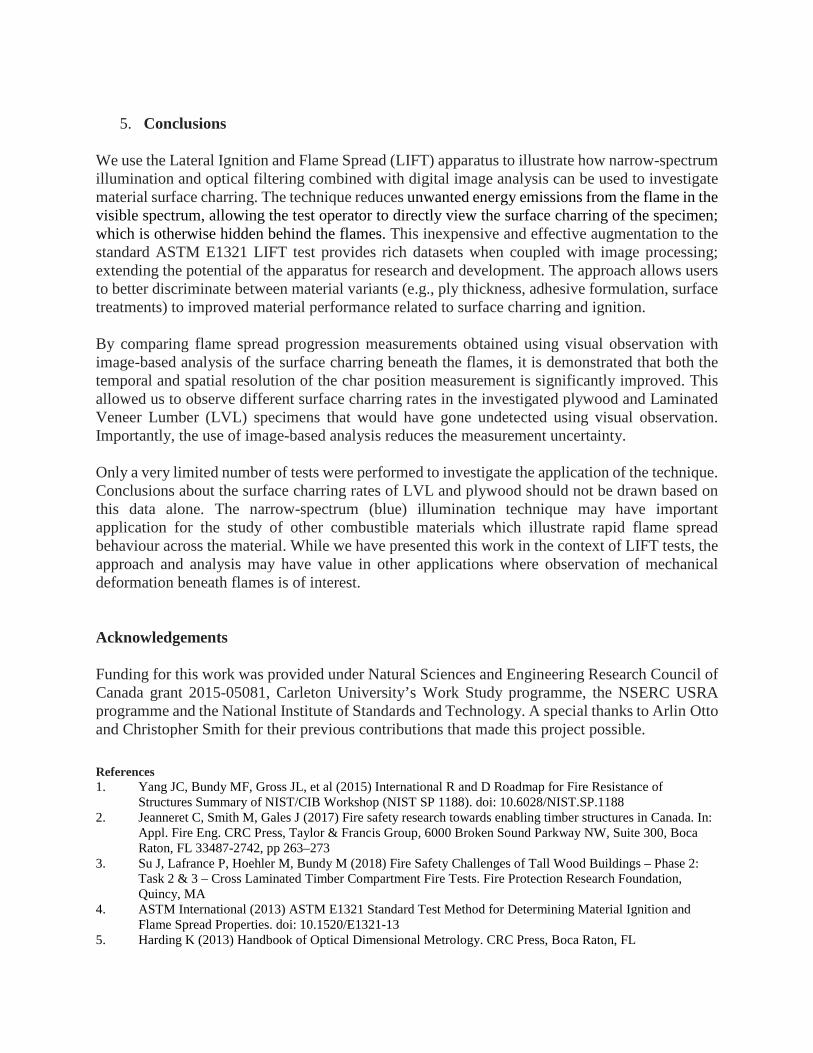
Two types of timber materials (plywood and LVL) were studied. Figure 9a shows the char progression at the centerline obtained from visual observation of the flame front and Figure 9b show the same tests analyzed using image-based analysis. The plywood exhibited a slightly slower surface char progression than the LVL samples starting about 500 s after ignition, however, this can only be distinguished from the image analysis because the effect was masked by the increased scatter in the measurements made by visual observation. A sufficient number of test repeats was not performed to ascertain the cause of the observed difference.
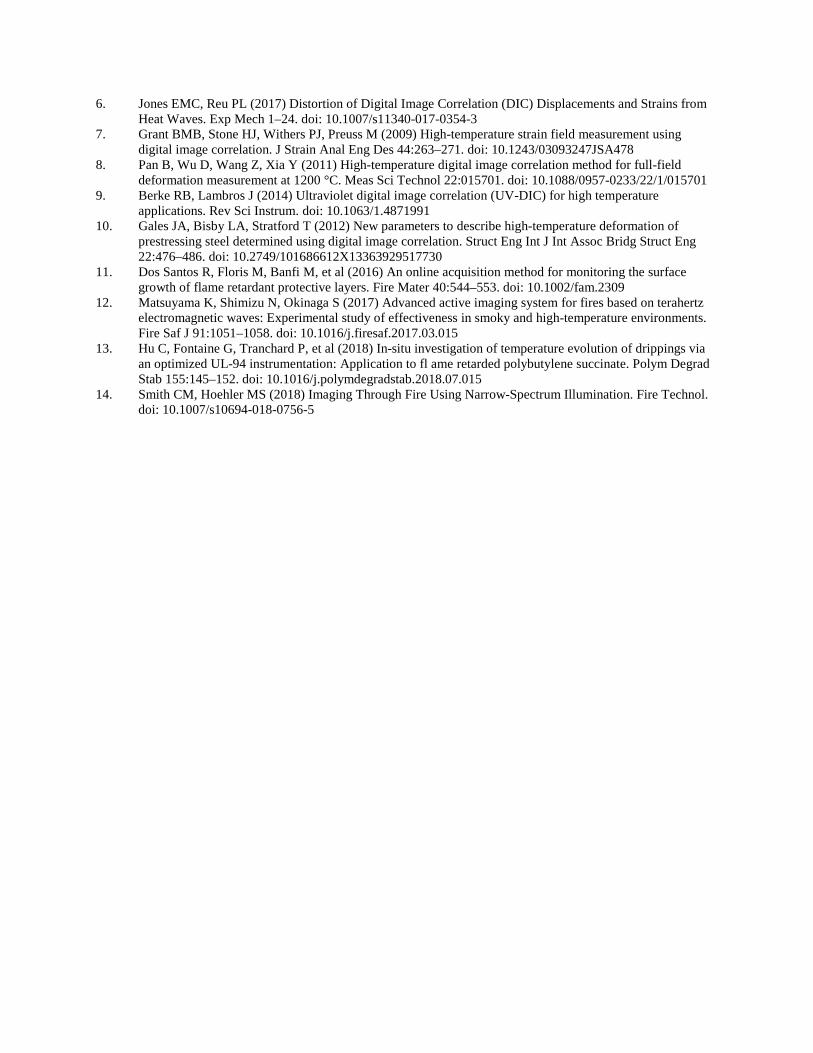
Although the error in the char position determined using image-based analysis is reduced compared to visual observation, as demonstrated above, error in the position resolution is limited by the rate of surface charring progression and the framerate of the camera. This is illustrated by Figure 10. Figure 10 was constructed by fitting an exponential function to the data from Test 4 obtained using image-based analysis and then taking its derivative to estimate the speed of the char progression at the reference pin locations. The surface charring spread rapidly early in the test having a rate of 15.8 mm/s at 50 mm, 10.7 mm/s at 150 mm, 4.8 mm/s at 200 mm, and slowed to 1.0 mm/s at 400 mm; 54 s after ignition. The error reported in Figure 10 is the distance the char at a given rate travels in 2 s (0.5 s framerate). A higher camera framerate early in the test can reduce this error. The same limitation exists for visual observation; however, it is typically not quantified. Tests 8 and 9 were used to investigate measurement error due to heat waves in the camera’s field of view, as well as vibrations in the testing setup that might affect the images. Thermal gradients in the optical path affect the density of the air resulting in refraction of the light and apparent (false) movement of stationary points in the images. Marks were placed at 400 mm and 750 mm along a ceramic specimen using a permanent pen. Once a steady-state incident heat flux was achieved, images of the ceramic specimen were take taken for a duration of 70 seconds (0.5 frames per second). The centroids of the marks in each image were determined. The average apparent movement of the centroid of the mark was (0.469±0.138) pixels. The physical dimension of the pixels at 400 mm and 750 mm were 0.0581 mm/pixel and 0.0782 mm/pixel, respectively. Thus, the maximum measurement error due to heat waves is (0.08±0.02) mm at 95 % confidence; which is much smaller than the char location error caused by the time sampling rate in this investigation (refer to Figure 10).
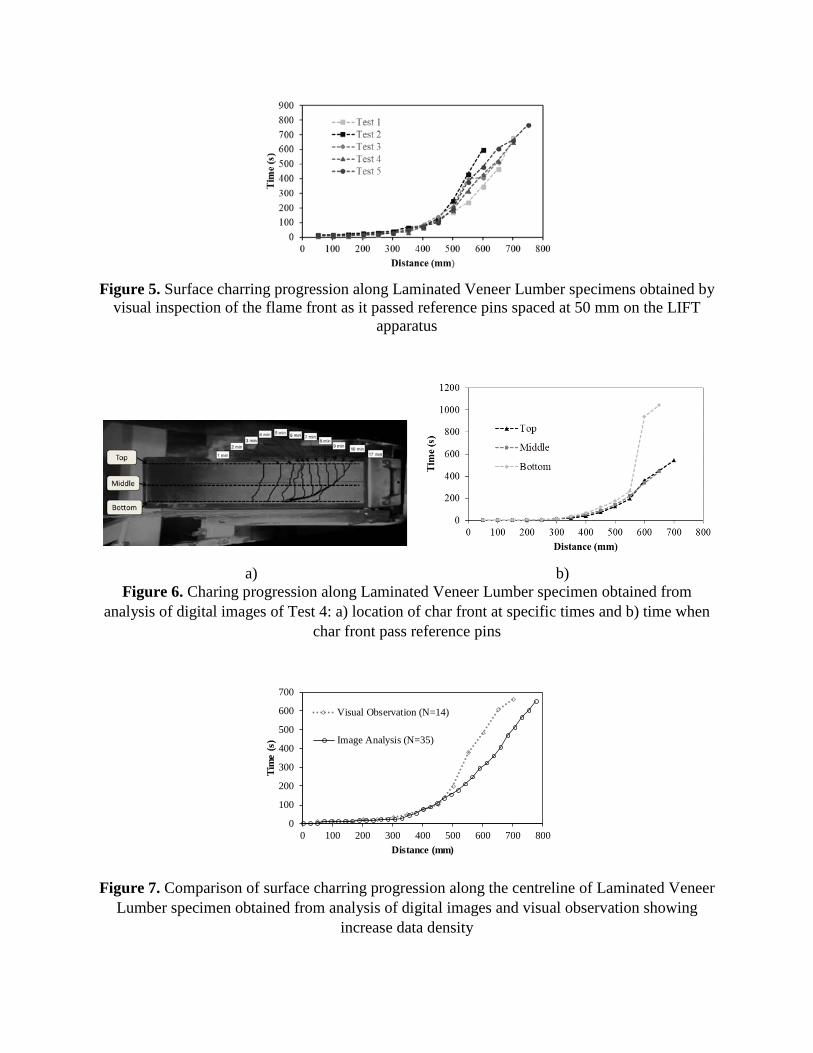
Figure 5. Surface charring progression along Laminated Veneer Lumber specimens obtained by
visual inspection of the flame front as it passed reference pins spaced at 50 mm on the LIFT apparatus
a) b) Figure 6. Charing progression along Laminated Veneer Lumber specimen obtained from
analysis of digital images of Test 4: a) location of char front at specific times and b) time when char front pass reference pins
Figure 7. Comparison of surface charring progression along the centreline of Laminated Veneer Lumber specimen obtained from analysis of digital images and visual observation showing
increase data density
0
100
200
300
400
500
600
700
0 100 200 300 400 500 600 700 800
Tim
e (s
)
Distance (mm)
Visual Observation (N=14)
Image Analysis (N=35)
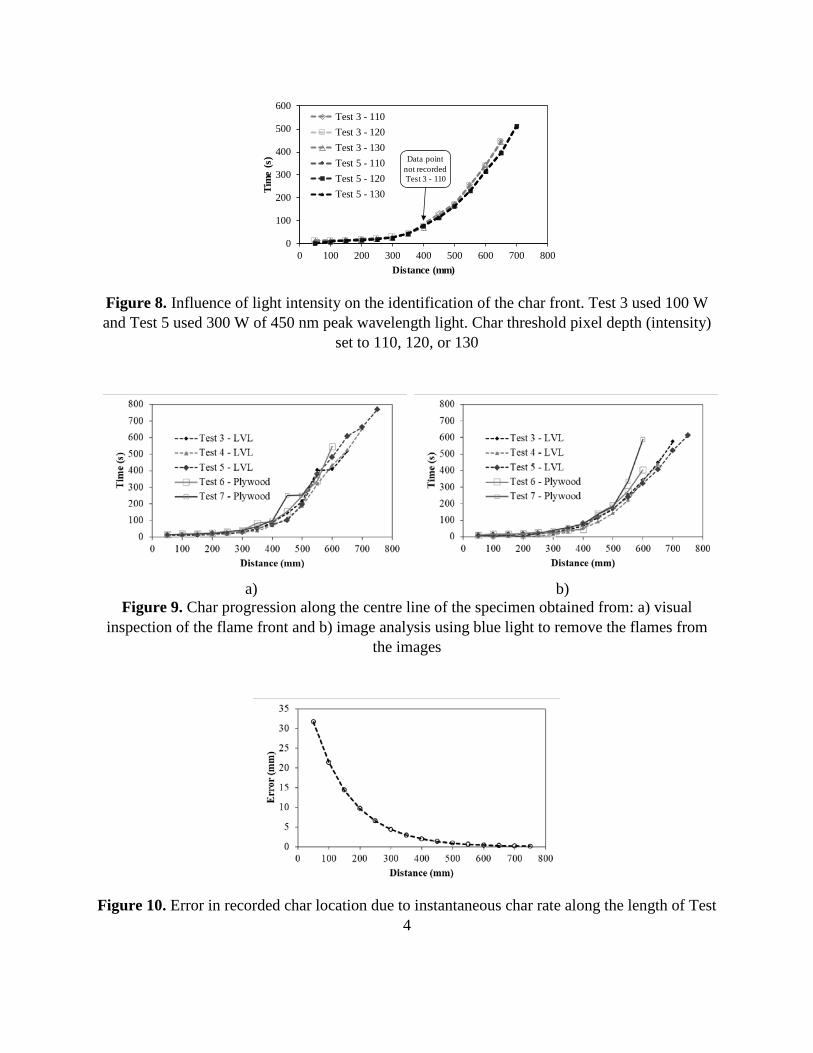
Figure 8. Influence of light intensity on the identification of the char front. Test 3 used 100 W and Test 5 used 300 W of 450 nm peak wavelength light. Char threshold pixel depth (intensity)
set to 110, 120, or 130
a) b)
Figure 9. Char progression along the centre line of the specimen obtained from: a) visual inspection of the flame front and b) image analysis using blue light to remove the flames from
the images
Figure 10. Error in recorded char location due to instantaneous char rate along the length of Test 4
0
100
200
300
400
500
600
0 100 200 300 400 500 600 700 800Ti
me
(s)
Distance (mm)
Test 3 - 110Test 3 - 120Test 3 - 130Test 5 - 110Test 5 - 120Test 5 - 130
Data point not recordedTest 3 - 110
5. Conclusions
We use the Lateral Ignition and Flame Spread (LIFT) apparatus to illustrate how narrow-spectrum illumination and optical filtering combined with digital image analysis can be used to investigate material surface charring. The technique reduces unwanted energy emissions from the flame in the visible spectrum, allowing the test operator to directly view the surface charring of the specimen; which is otherwise hidden behind the flames. This inexpensive and effective augmentation to the standard ASTM E1321 LIFT test provides rich datasets when coupled with image processing; extending the potential of the apparatus for research and development. The approach allows users to better discriminate between material variants (e.g., ply thickness, adhesive formulation, surface treatments) to improved material performance related to surface charring and ignition. By comparing flame spread progression measurements obtained using visual observation with image-based analysis of the surface charring beneath the flames, it is demonstrated that both the temporal and spatial resolution of the char position measurement is significantly improved. This allowed us to observe different surface charring rates in the investigated plywood and Laminated Veneer Lumber (LVL) specimens that would have gone undetected using visual observation. Importantly, the use of image-based analysis reduces the measurement uncertainty. Only a very limited number of tests were performed to investigate the application of the technique. Conclusions about the surface charring rates of LVL and plywood should not be drawn based on this data alone. The narrow-spectrum (blue) illumination technique may have important application for the study of other combustible materials which illustrate rapid flame spread behaviour across the material. While we have presented this work in the context of LIFT tests, the approach and analysis may have value in other applications where observation of mechanical deformation beneath flames is of interest. Acknowledgements Funding for this work was provided under Natural Sciences and Engineering Research Council of Canada grant 2015-05081, Carleton University’s Work Study programme, the NSERC USRA programme and the National Institute of Standards and Technology. A special thanks to Arlin Otto and Christopher Smith for their previous contributions that made this project possible.
References 1. Yang JC, Bundy MF, Gross JL, et al (2015) International R and D Roadmap for Fire Resistance of
Structures Summary of NIST/CIB Workshop (NIST SP 1188). doi: 10.6028/NIST.SP.1188 2. Jeanneret C, Smith M, Gales J (2017) Fire safety research towards enabling timber structures in Canada. In:
Appl. Fire Eng. CRC Press, Taylor & Francis Group, 6000 Broken Sound Parkway NW, Suite 300, Boca Raton, FL 33487-2742, pp 263–273
3. Su J, Lafrance P, Hoehler M, Bundy M (2018) Fire Safety Challenges of Tall Wood Buildings – Phase 2: Task 2 & 3 – Cross Laminated Timber Compartment Fire Tests. Fire Protection Research Foundation, Quincy, MA
4. ASTM International (2013) ASTM E1321 Standard Test Method for Determining Material Ignition and Flame Spread Properties. doi: 10.1520/E1321-13
5. Harding K (2013) Handbook of Optical Dimensional Metrology. CRC Press, Boca Raton, FL
6. Jones EMC, Reu PL (2017) Distortion of Digital Image Correlation (DIC) Displacements and Strains from Heat Waves. Exp Mech 1–24. doi: 10.1007/s11340-017-0354-3
7. Grant BMB, Stone HJ, Withers PJ, Preuss M (2009) High-temperature strain field measurement using digital image correlation. J Strain Anal Eng Des 44:263–271. doi: 10.1243/03093247JSA478
8. Pan B, Wu D, Wang Z, Xia Y (2011) High-temperature digital image correlation method for full-field deformation measurement at 1200 °C. Meas Sci Technol 22:015701. doi: 10.1088/0957-0233/22/1/015701
9. Berke RB, Lambros J (2014) Ultraviolet digital image correlation (UV-DIC) for high temperature applications. Rev Sci Instrum. doi: 10.1063/1.4871991
10. Gales JA, Bisby LA, Stratford T (2012) New parameters to describe high-temperature deformation of prestressing steel determined using digital image correlation. Struct Eng Int J Int Assoc Bridg Struct Eng 22:476–486. doi: 10.2749/101686612X13363929517730
11. Dos Santos R, Floris M, Banfi M, et al (2016) An online acquisition method for monitoring the surface growth of flame retardant protective layers. Fire Mater 40:544–553. doi: 10.1002/fam.2309
12. Matsuyama K, Shimizu N, Okinaga S (2017) Advanced active imaging system for fires based on terahertz electromagnetic waves: Experimental study of effectiveness in smoky and high-temperature environments. Fire Saf J 91:1051–1058. doi: 10.1016/j.firesaf.2017.03.015
13. Hu C, Fontaine G, Tranchard P, et al (2018) In-situ investigation of temperature evolution of drippings via an optimized UL-94 instrumentation: Application to fl ame retarded polybutylene succinate. Polym Degrad Stab 155:145–152. doi: 10.1016/j.polymdegradstab.2018.07.015
14. Smith CM, Hoehler MS (2018) Imaging Through Fire Using Narrow-Spectrum Illumination. Fire Technol. doi: 10.1007/s10694-018-0756-5


![Illumination-Aware Age Progressionnovel illumination-aware age progression technique, lever-aging illumination modeling results [1,31], that properly account for scene illumination](https://img.dokumen.tips/doc/110x75/5e72745a0ac7de5cbf4199be/illumination-aware-age-progression-novel-illumination-aware-age-progression-technique.jpg)