Embed Size (px)
Citation preview

Application of Microwave Spectroscopy Analysis on Determining Quality of Vegetable Oil
S. B. Osman, O. Korostynka, A. Mason, J. D. Cullen, A. I. Al-Shamma’a BEST Research Institute, School of the Built Environment,
Liverpool John Moores University, Liverpool, L3 3AF, UK
Abstract— Recently there has been an increasing interest in the classification of edible oils as an effective means to examine authenticity and to detect possible adulteration of virgin olive oils with seed oils or low-quality olive oils. Classical methods based on gas chromatography (GC) and high-performance liquid chromatography (HPLC) are too expensive for widespread industrial use and require samples to be analysed in dedicated laboratories thus incurring a significant time penalty. This paper demonstrates that microwave spectrometry is able to offer real-time measurement of oils adequate for determining product authenticity. It does this by evaluating a bespoke sensor system which is used to measure the dielectric properties common-place edible oils. In particular, the capability of the system to distinguish between these oils, even when mixed, is demonstrated. This is important as it is a common technique used by fraudsters in the production of counterfeit oils.
Keywords-microwave spectroscopy, sensor, virtual network analyser, edible oils, adulteration, real time analysis
I. INTRODUCTION
It has been demonstrated that some vegetable oils are richer and possess more quality than others in term of use and composition in everyday life. Furthermore due to the processes involved in producing these oils the price range could vary from decimals for low quality oils to few digits for the high quality ones in price money. This leads to the mixture of the low quality oils with the high quality ones. Adulterations of this kind benefit from the lack of ways and means to detect the changes with normal human senses or with basic tools.
To help preserve the high-quality of the product, renowned international organizations, such as the international olive council have defined quality standards and ways to monitor adulteration on olive oils [1]. The European community (EU) has established some specific criteria for classifying olive oils and for assessing their quality [2, 3]. For example, EU regulations require that the production of extra virgin olive oil, which is the oil with best known quality, should abide by precise norms (e.g. It must be produced only by physical means, without any refine processes, and its free acidity levels must not exceed 0.8 g per 100 g). Extra virgin olive oil and other valuable oils are often prone to be diluted with
cheaper vegetable oils, such as refined olive oil, seed oils (e.g. Sunflower, soy, corn, and rapeseed oils) [4], and nut oils (e.g. Hazelnut and peanut oils) [5].
To hinder oil adulteration, anti-fraud controls require that specific tests are performed to assess the quality of oils; but such controls usually rely on highly-sophisticated and expensive methods (i.e. Gas chromatography [6], liquid chromatography [7], Fourier transform infrared [8], and nuclear magnetic resonance [9]). However, despite being able to give detailed constituent analysis, these methods are too expensive for widespread industrial use, requiring samples to be analysed in dedicated laboratories instead which incurs a significant time penalty. Other studies [10, 11] have demonstrated that nonconventional methods, such as microwave spectrometry, are able to offer real-time measurement of oils adequate for determining product authenticity.
Our object of study is mainly on the classification of edible oils as an effective way to examine their authenticity and by this the ability to detect possible adulteration.
II. METHODOLOGY
The methodology used is mainly laboratory experiment using a substrate sensor and a network analyser.
2.1 Microwave Sensor Careful trial and selection of numerous sensors to find a suitable one was realised. Laboratory testing was carried out using a Vector Network Analyser (VNA). Figure 1 shows the microwave sensor applied for the test. The sensor is made of polyimide laminate substrate of 2mm thick with printed pattern conductive area of 14mm x 5mm. The MUT cavity is 14mm x 14mm x 2mm. the 2 terminal plates of the printed pattern are terminated on a male F connector.
2.2 Analysis of Some Vegetable Oils
A drop of approximately 50 µL of oil sample on the sensor connected to a single port of the VNA and set to read the S11 scattering parameters, the reflected power. This mode allow
Proceedings of the 8th International Conference on Sensing Technology, Sep. 2-4, 2014, Liverpool, UK
556

for a display of the characteristics similar to dielectric properties of the oil used. For effectiveness each test was carried a number of times, minimum n = 5. Individual oil samples were tested and for the purpose of differentiating the parameters a combination of mixtures at various proportions were tested and analysed.
Table 1: supermarket oil used for experimentation
Sample Description
1 Sun flower Oil (100%)
2 Grape-seed Oil (100%)
3 Groundnut Oil (100%)
4 Olive Oil (mixed)
5 Olive Oil (medium flavour)
6 Olive Oil (fruity flavour)
7 Olive Oil (Extra Virgin)
Pattern observed in most of the charts show an activity zone in the area in the region of 6 GHz. This prompted for an expansion of frequency range to 12 GHz, hence using a higher range VNA, the VZA24. Analyses from the expanded range showed other activities within the region of 6 to 12GHz, but
unlike the first results from the reduced range, results from this portion was inconsistent. Repeated test from same sample of oil while maintain same characteristics in the range between 2 and 6GHz, vary between 6 and 12GHz depending on precision of the tool used and/or quantity of the oil. Figure 4 illustrates an example of oil sample test analyses using the extended range.
Figure 4: test of same sample using extended range
Further analysis was carried on mixtures in proportions of 5%, 10%, 20%, 30%, 40% and 50% of sunflower oil and extra virgin olive oil and the results were subjected to analysis to determine the difference. Finally a correlation analysis was carried on all the mixtures and the pure olive oil.
III. RESULTS
-40
-30
-20
-10
0
2 7 12
POW
ER (d
B)
FREQUENCY (GHz)
GROUNDNUT OIL 1
GROUNDNUT OIL 2
GROUNDNUT OIL 3
-25
-20
-15
-10
-5
0
5
2.0 3.0 4.0 5.0 6.0
POW
ER
(dB
)
FREQUENCY (GHz)
Sunflower OilGrapeseed OilGroundnut Oil Olive Oil Refined MiixedOlive Oil Medium FlavourOlive Oil Fruity FlavourExtra Virgin Oil
Proceedings of the 8th International Conference on Sensing Technology, Sep. 2-4, 2014, Liverpool, UK
557
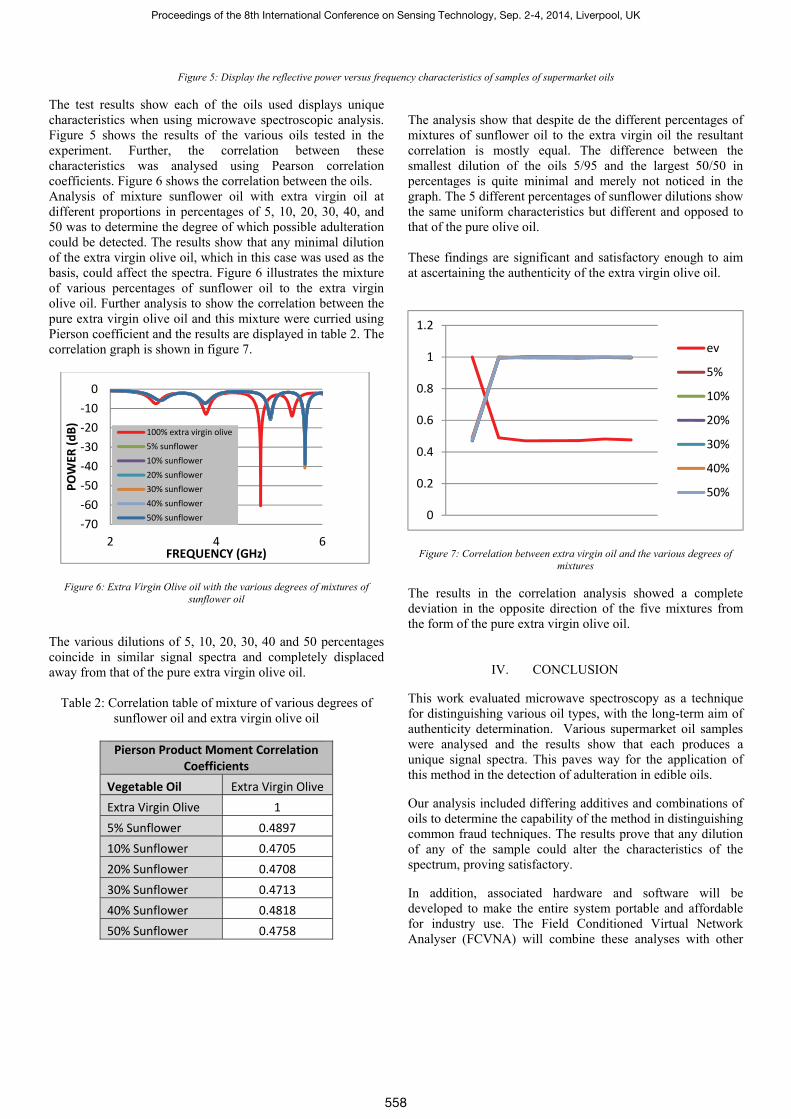
Figure 5: Display the reflective power versus frequency characteristics of samples of supermarket oils
The test results show each of the oils used displays unique characteristics when using microwave spectroscopic analysis. Figure 5 shows the results of the various oils tested in the experiment. Further, the correlation between these characteristics was analysed using Pearson correlation coefficients. Figure 6 shows the correlation between the oils. Analysis of mixture sunflower oil with extra virgin oil at different proportions in percentages of 5, 10, 20, 30, 40, and 50 was to determine the degree of which possible adulteration could be detected. The results show that any minimal dilution of the extra virgin olive oil, which in this case was used as the basis, could affect the spectra. Figure 6 illustrates the mixture of various percentages of sunflower oil to the extra virgin olive oil. Further analysis to show the correlation between the pure extra virgin olive oil and this mixture were curried using Pierson coefficient and the results are displayed in table 2. The correlation graph is shown in figure 7.
Figure 6: Extra Virgin Olive oil with the various degrees of mixtures of sunflower oil
The various dilutions of 5, 10, 20, 30, 40 and 50 percentages coincide in similar signal spectra and completely displaced away from that of the pure extra virgin olive oil.
Table 2: Correlation table of mixture of various degrees of sunflower oil and extra virgin olive oil
Pierson Product Moment Correlation
Coefficients Vegetable Oil Extra Virgin Olive Extra Virgin Olive 1 5% Sunflower 0.4897 10% Sunflower 0.4705 20% Sunflower 0.4708 30% Sunflower 0.4713 40% Sunflower 0.4818 50% Sunflower 0.4758
The analysis show that despite de the different percentages of mixtures of sunflower oil to the extra virgin oil the resultant correlation is mostly equal. The difference between the smallest dilution of the oils 5/95 and the largest 50/50 in percentages is quite minimal and merely not noticed in the graph. The 5 different percentages of sunflower dilutions show the same uniform characteristics but different and opposed to that of the pure olive oil. These findings are significant and satisfactory enough to aim at ascertaining the authenticity of the extra virgin olive oil.
Figure 7: Correlation between extra virgin oil and the various degrees of mixtures
The results in the correlation analysis showed a complete deviation in the opposite direction of the five mixtures from the form of the pure extra virgin olive oil.
IV. CONCLUSION
This work evaluated microwave spectroscopy as a technique for distinguishing various oil types, with the long-term aim of authenticity determination. Various supermarket oil samples were analysed and the results show that each produces a unique signal spectra. This paves way for the application of this method in the detection of adulteration in edible oils.
Our analysis included differing additives and combinations of oils to determine the capability of the method in distinguishing common fraud techniques. The results prove that any dilution of any of the sample could alter the characteristics of the spectrum, proving satisfactory.
In addition, associated hardware and software will be developed to make the entire system portable and affordable for industry use. The Field Conditioned Virtual Network Analyser (FCVNA) will combine these analyses with other
-70-60-50-40-30-20-10
0
2 4 6
POW
ER (d
B)
FREQUENCY (GHz)
100% extra virgin olive5% sunflower10% sunflower20% sunflower30% sunflower40% sunflower50% sunflower 0
0.2
0.4
0.6
0.8
1
1.2
ev
5%
10%
20%
30%
40%
50%
Proceedings of the 8th International Conference on Sensing Technology, Sep. 2-4, 2014, Liverpool, UK
558

capabilities to achieve real-time quality control of vegetable oils.
V. REFERENCES [1] G.Bertuccio, L.Fasoli, C.Fiorini, M.Sampietro, "Spectroscopy charge
amplifier for detectors with integrated front-end FET", IEEE Trans.Nucl.Sci., 42, No.4, 1399-1405, 1995.
[2] Zvanovec, S., Cerny, P., Piksa, P., Korinek, T., Pechac, P., et al. The use of the Fabry-Perot interferometer for high resolution microwave spectroscopy. Journal of Molecular Spectroscopy, 2009, vol. 256, no. 1, p. 141-145. ISSN 0022-2852.
[3] International Olive Council Website. <http://www.international oliveoil.org/> (retrieved 26.10.09).
[4] European Community, Commission Regulation No. 2568/91/EEC, July 11, Official Journal of the European Communities L248 (1991) 1– 83.
[5] European Community, Commission Regulation 702/2007 of 21 June 2007 amending Commission Regulation No. 2568/91/EEC, Official Journal of the European Communities L161 (2007) 11–27.
[6] F. Gimlet, J. Ferre, R. Boque, Rapid detection of olive-pomace oil adulteration in extra virgin olive oils from the protected denomination of origin Siurana using excitation–emission fluorescence spectroscopy and three-way methods of analysis, Analytica Chimica Acta 544 (1–2) (2005) 143–152.
[7] G.P. Blanch, M. del Mar Caja, M.L. Ruiz del Castillo, M. Herraiz, Comparison of different methods for the evaluation of the authenticity of olive oil and hazelnut oil, Journal of Agricultural and Food Chemistry 46 (8) (1998) 3153–3157.
[8] G. Morchio, A. DiBello, C. Mariani, E. Fedeli, Detection of refined oils in virgin olive oil, Rivista Italiana Sostanze Grasse 66 (5) (1989) 251–257.
[9] A.H. El-Hamdy, N.K. El-Fizga, Detection of olive oil adulteration by measuring its authenticity factor using reversed-phase high-performance liquid chromatography, Journal of Chromatography 708 (2) (1995) 351–355.Tay, R.K. Singh, S.S. Krishnan, J.P. Gore, Authentication of olive oil adulterated with vegetable oils using Fourier transform infrared spectroscopy, Lebensmittel-Wissenschaft und-Technologie 35 (2) (2002) 99–103.
[10] E. Bader, A. Attar, A. Mason, L. Wendling, A. Al-Shamma'a “Investigation of an Embedded Microwave Spectrometer for Alcohol Detection and Measurement”, School of Built Environment, Liverpool John Moores University
Proceedings of the 8th International Conference on Sensing Technology, Sep. 2-4, 2014, Liverpool, UK
559