Embed Size (px)
Citation preview

RESEARCH ARTICLE
Application of Meta-Mesh on the analysis ofmicrobial communities from humanassociated-habitats
Xiaoquan Su†, Xiaojun Wang†, Gongchao Jing, Shi Huang, Jian Xu and Kang Ning*
Bioinformatics Group of Single cell Center, Shandong Key Laboratory of Energy Genetics and CAS Key Laboratory of Biofuels,Qingdao Institute of Bioenergy and Bioprocess Technology, Chinese Academy of Sciences, Qingdao 266101, China* Correspondence: [email protected]
Received December 2, 2014; Revised February 5, 2015; Accepted February 11, 2015
With the current fast accumulation of microbial community samples and related metagenomic sequencing data, dataintegration and analysis system is urgently needed for in-depth analysis of large number of metagenomic samples(also referred to as “microbial communities”) of interest. Although several existing databases have collected a largenumber of metagenomic samples, they mostly serve as data repositories with crude annotations, and offer limitedfunctionality for analysis. Moreover, the few available tools for comparative analysis in the literature could onlysupport the comparison of a few pre-defined set of metagenomic samples. To facilitate comprehensive comparativeanalysis on large amount of diverse microbial community samples, we have designed a Meta-Mesh system for avariety of analyses including quantitative analysis of similarities among microbial communities and computation ofthe correlation between the meta-information of these samples. We have used Meta-Mesh for systematically andefficiently analyses on diverse sets of human associate-habitat microbial community samples. Results have shown thatMeta-Mesh could serve well as an efficient data analysis platform for discovery of clusters, biomarker and othervaluable biological information from a large pool of human microbial samples.
Keywords: metagenome; microbial community; data mining
INTRODUCTION
Microbes are ubiquitous on our planet, and it is well-known that the total number of microbial cells on earth ishuge [1]. These organisms usually live in communities,and each of these communities has a different structure.As such, microbial communities would serve as thelargest reservoir of genes and genetic functions for a vastnumber of applications in “bio”-related disciplines,including biomedicine, bioenergy, bioremediation, andbiodefense [2].Since over 90% of strains in a microbial community
could not be isolated or cultivated [3], metagenomicmethods have become popular for analysis of a microbialcommunity as a whole. Such an approach enables theexploration of the relationships among microbes, theircommunities and habitats at the most fundamental
genomic level. Understanding the taxonomical structureof a microbial community (alpha diversity) and thedifferences in taxa among microbial communities (betadiversity) have been two of the most important problemsin metagenomic research [4], in which understanding betadiversity is especially critical for studying microbialcommunities’ heterogenity. For example, the HumanMicrobiome Project [5] and related efforts to studymicrobial communities occupying various human bodyhabitats have shown a surprising amount of diversityamong individuals in skin [6,7], gut [8,9], and mouthecosystems [10,11]. Furthermore, even microbial com-munities from similar types of environment might differsignificantly [12].Next-generation sequencing techniques have enabled
fast profiling of large volumes of metagenomic samples.As a result, a rapidly increasing number of metagenomic
† These authors contributed equally to this work
4 © Higher Education Press and Springer-Verlag Berlin Heidelberg 2015
Quantitative Biology 2015, 3(1): 4–18DOI 10.1007/s40484-015-0040-3

profiles of microbial communities have been archived inpublic repositories and research labs around the world.Therefore, it is becoming more and more important toperform in-depth analysis for the valuable biologicalinformation hidden in large number of samples. Hence, asystem that provides functionalities for data analysis andmining would be of significant value to a worldwide user-base from multiple disciplines.Current metagenomic databases, such as MG-RAST
[13] and CAMERA2 [14], serve mainly as datarepositories, with neither comprehensive tools for com-parative analysis nor capabilities for extensive search. Anumber of methods have been proposed for thecomparison and clustering of different metagenomicsamples. MEGAN [15] is a metagenomic analysis toolfor taxonomical comparisons [16] and statistical analyses[17], which can only compare single pairs of metage-nomic samples based on taxonomical annotations, as isalso the case with STAMP [18]. ShotgunFunctionalizeR[19], Mothur [20] and METAREP [21] identify thedifferences between samples using standard statisticaltests (mainly t-tests with some modifications). UniFrac[22] and Fast UniFrac [23] examine the similaritiesamong species based on their overlaps in phylogenetictree to discover ecological patterns.In this work we introduce Meta-Mesh, an integrated
metagenomic analysis system that includes a set of highlyefficient tools, and verified the reliability and correctnessbased on simulated datasets constructed by knowngenomes. Then we applied Meta-Mesh on two studieswith human associated-habitat samples from differentbody sites and health status: one study including gutsamples from feces, oral samples from tongue, skinsamples from left palm and right palm; another study withsaliva samples from naturally occurring gingivitis,healthy gingivae and experimental gingivitis. Meta-Mesh quantitatively evaluated the similarity amongsamples, distinguished samples from different conditionsby the taxonomical distributions and phylogeneticrelationships, elucidated the key taxa led to the structuredifference by biomarker analysis, and further calculatedthe correlation between the taxa distribution and theenvironmental meta-data (e.g., hosts, habitats, healthyconditions). Results have shown that Meta-Mesh wouldserve as an effective data analysis platform to quicklydiscovery the valuable biological information from a largepool of metagenomic samples.
RESULTS
In this work we have applied the Meta-Mesh in twostudied of human-associated habitat microbial commu-nities for data comparison and biomarker discovery.
Case study 1: Study on simulated microbialcommunity samples for accuracy assessment andcorrectness verification
In this case we constructed two simulated metagenomicdatasets with human oral related genomes and human gutrelated genomes, respectively. Each dataset contained 50samples. The oral related genomes mainly includedActinomyces odontolyticus, Campylobacter rectus, Fuso-bacterium periodonticum, Neisseria subflava, Porphyr-omonas gingivalis and Prevotella denticola , which wereall from HOMD database [24], and mixed with someother randomly selected oral genomes in very low ratio.The gut related genomes mainly included Bacillus cereus,Clostridium beijerinckii, Deinococcus radiodurans,Escherichia coli and Helicobacter pylori, which wereall from the NCBI database (http://www.ncbi.nlm.nih.gov/), and also mixed with some other randomly selectedgut genomes in very low ratio.We parsed out the taxonomical structure of all samples
by metagenomic structure analysis, and evaluated theerror rate of the analysis by the Euler distance of therelative abundance between the calculated values and realvalues of all taxa. Suppose that N taxa (Ti, i = 0 to N-1)existed in a simulated sample, Vi was the calculatedrelative abundance value and V#i was the real relativeabundance value for Ti, then the error was evaluated byformula (1). Results in Figure 1A showed the averageerror rate of all samples was lower than 4% (2.86% and3.25% for oral sample on phylum and genus level, 2.10%and 3.59% for gut sample on phylum and genus level),which indicated the high reliability of the metagenomicstructure analysis in Meta-Mesh system.
E=
ffiffiffiffiffiffiffiffiffiffiffiffiffiffiffiffiffiffiffiffiffiffiffiffiffiffiffiffiffiffiffiffiffiffiffi
XN – 1
i=0ðVi –V#iÞ2N
s
: (1)
Then we computed the pair-wised similarity matrix fororal samples and gut sample separately by Meta-Meshscoring function, and verified the results by the UniFrac[23] that had already been widely used for comparisonamong microbial communities. The strong correlationbetween results by Meta-Mesh scorning function andweighted UniFrac (Pearson coefficient R = 0.9928 for oralsamples and R = 0.9731 for gut samples, Figure 1B andFigure 1C) illustrated that Meta-Mesh could preciselyassess the quantitative difference among metagenomicsamples. Based on the pair-wised similarity matrix weperformed the clustering analysis by PCoA. It wasobvious that samples from two datasets could bedifferentiate based on their similarity scores (Figure1D), and the following biomarker analysis also explainedthe reason by the dissymmetrical distribution of therelative abundance on abundant taxa between two
© Higher Education Press and Springer-Verlag Berlin Heidelberg 2015 5
Application of Meta-Mesh

Figure
1.
Theaccuracyassess
mentofMeta-M
eshbasedonsim
ulateddatasets.(A)Errorrate
ofm
etagenom
icstructure
analysisonphylum
andgen
usleve
l.(B)Correlatio
nofM
eta-
Mesh
scorningfunc
tionandweightU
niFracwith
simulatedoralsamples.
(C)Correlatio
nofM
eta-M
esh
scorningfunctionandweightU
niFracwith
simulatedguts
amples.
(D)PCoAanalysis
resu
ltsofsimulateddatase
ts.(E)Biomarkeranalysisresu
ltsofsimulateddatase
ts.
6 © Higher Education Press and Springer-Verlag Berlin Heidelberg 2015
Xiaoquan Su et al.

datasets (Figure 1E), which was coincident to the differentgenomes used for simulation.
Case study 2: Study on microbial communitysamples from different human-habitats
In this case we used 1,758 human-associated habitatmicrobial community samples from four different bodysites [25] (gut samples from feces, oral samples fromtongue, skin samples from left palm and right palm, Table1) of two individuals of opposite genders from the samefamily.We firstly generated the pair-wised similarity matrix
(Figure 2A) of all sample pairs among the 1,758 samples,and performed the clustering and PCoA analysis (Figure2B) based on the similarity matrix. Results in Figure 2have shown that samples from the same body site typecould be clustered together. In Figure 2A we found thatsamples from the same site (skin, oral and gut) havehigher similarity values, compared with those fromdifferent sites. Among them, the taxonomical structuresoral samples were very similar with those for skinsamples, while the taxonomical structure of gut sampleswere quite different from others. The PCoA analysisresults (Figure 2B) supported the similarity patterns inFigure 2A. In Figure 2B, gut samples and oral sampleswere divided by PC1 very well, and clear separation ofsamples from oral and gut could also been observed byPC2, yet samples from left palm and right palm weremixed.The following biomarker analysis (Figure 3) on the
taxonomical structure analysis also elucidated the reasonsthat taxa Bacteroidaceae and Clostridiaceae weredominated in gut samples, among which Bacteroidaceaepredominantly habitats in the alimentary canal or onmucous surfaces of warm-blooded animals [25], whichcould serve well as biomarkers for gut microbiota. AndNeisseriaceae and Prevotellaceae were dominated in oralsamples, among which species Prevotellaceae is amongthe most abundant microbes cultivable from the rumenand hind gut of cattle and sheep as well as human oralenvironment, where they help the breakdown of protein
and carbohydrate in foods [25]. Corynebacterineae weredominated in skin samples.We further compared samples of each body site
separately, and found that the microbial communitystructures in gut and oral environment of the two hostshad difference distribution in PCoA results (Figure 4Aand Figure 4B). The reason was that the high abundancetaxa in gut (Clostridiaceae and Prophyromonadaceae,Figure 5A) and oral (Neisseriaceae and Streptococca-ceae, Figure 5B) showed significant different withWilcoxon Rank-sum Test P-value< 0.001. However,skin samples from different hosts and palms had highersimilarity to each other reflected in the PCoA results(Figure 4C and Figure 4D), which could also beenexplained by the biomarker analysis that their abundanttaxa (Corynebacterineae and Streptococcaceae, Figure5C and Figure 5D) had similar pattern between hosts andpalms.As regard to efficiency, we have evaluated Meta-Mesh
for it running time on pair-wise similarity analysis, PCoAand biomarker analysis. Meta-Mesh would be able tocompute (based on GPU) the pair-wise similarity valuesfor 1,758 human-associated habitat microbial communitysamples within six minutes and following PCoA andbiomarker analysis (based on all samples) within nineminutes (Figure 6), which in theory have outpaced thespeed of metagenomic data generation by several folds.Therefore, the efficient computational engine in Meta-Mesh have enabled near real-time process of microbialcommunities.
Case study 3: Study on oral microbial communitiesof different health status
In this case study we applied the Meta-Mesh in the studyof oral samples to discover the microbial communitystructure variation among different health status. 150samples were collected from 50 hosts’ saliva in 3 stages:naturally occurring gingivitis (I), healthy gingivae (B) andexperimental gingivitis (E) by Huang, et al, 2014 [26].The Mazza Gingival Index (MGI) of each stage for thehost was recorded to reflect the gingival conditions frommedical aspect.All samples were compared to construct the similarity
matrix (Figure 7A). Then we performed the clustering(Figure 7A) and PCoA analysis (Figure 7B). From theresults we can observe that samples could be divided bythe gingival status: healthy and gingivitis (both naturallyand experimental occurred).Then the in-depth biomarker analysis focused on
discovering the taxa that caused the differences. Fromthe results (Figure 8) we found that the distribution of taxaStreptococcaceae, Actinomycineae, Micrococcineae andPrevotellaceae had significant different between gingival
Table 1. Information of human associated-habitatsamples.Type Habitat Sex # of Samples
Gut Feces Female 130
Gut Feces Male 331
Oral Tongue Female 131
Oral Tongue Male 365
Skin Left palm Female 123
Skin Left palm Male 276
Skin Right palm Female 128
Skin Right palm Male 274
© Higher Education Press and Springer-Verlag Berlin Heidelberg 2015 7
Application of Meta-Mesh

Figure 2. The clustering analysis results of human associated-habitat samples from different body sites based on thesimilarity matrix. (A) Similarity matrix and hierarchical clustering results. (B) PCoA analysis results of body sites.
8 © Higher Education Press and Springer-Verlag Berlin Heidelberg 2015
Xiaoquan Su et al.
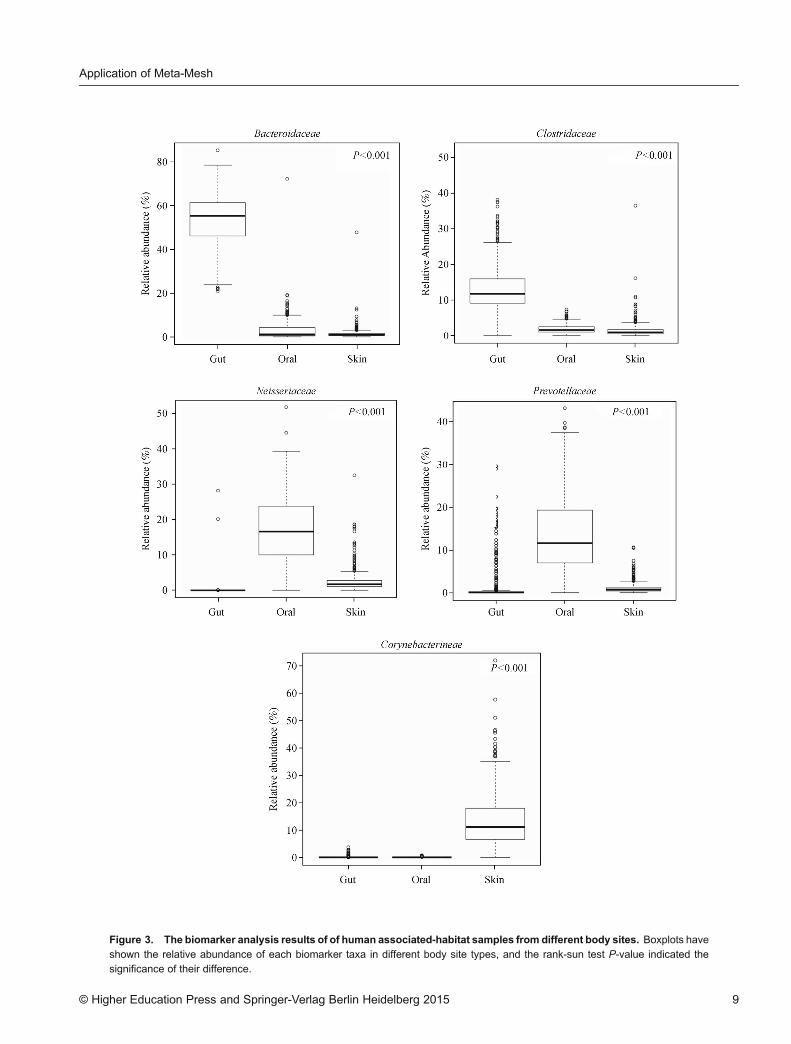
Figure 3. The biomarker analysis results of of human associated-habitat samples from different body sites. Boxplots have
shown the relative abundance of each biomarker taxa in different body site types, and the rank-sun test P-value indicated thesignificance of their difference.
© Higher Education Press and Springer-Verlag Berlin Heidelberg 2015 9
Application of Meta-Mesh

status (Wilcoxon Rank-sum Test P-value< 0.001).Among them, Prevotellaceae was abundant in gingivitissamples (I and E), while other three taxa were abundant in
healthy samples (B), which has also been verified by theprevious works in Huang, et al, 2014 [26].We also measured the correlation between the taxa
Figure 4. The PCoA analysis results of samples from different body sites. (A) Gut samples from different hosts. (B) Oralsamples from different hosts. (C) Skin samples from different hosts and (D) Skin samples from different palms.
10 © Higher Education Press and Springer-Verlag Berlin Heidelberg 2015
Xiaoquan Su et al.

Figure 5. Biomarker analysis results of samples from each body site. (A) Gut samples from different hosts. (B) Oral samples fromdifferent hosts. (C) Skin samples from different hosts and (D) Skin samples from different palms.
© Higher Education Press and Springer-Verlag Berlin Heidelberg 2015 11
Application of Meta-Mesh
pattern and the MGI and calculated the Pearson correla-tion coefficient (R). Results in Figure 9 illustrate thestrong correlation of the abundant taxa to the MGI: thepattern of Streptococcaceae (R = – 0.806), Actinomyci-neae (R = –0.755), Micrococcineae (R = – 0.879) werenegatively correlated to the MGI, while Prevotellaceaewas positively correlated (R = 0.810) to the MGI.Interesting, the abundant yet dynamic species Prevotella-ceae, which can server as biomarker of oral samples fromgut and skin samples, could again serve as biomarkers todifferentiate healthy and gingivitis samples within oralenvironment, indicating that it could serve as the “localweather forecaster” for oral health status.For processing speed, again we observed that Meta-
Mesh could analyze 150 oral microbial communitysamples, including pair-wise similarity analysis, PCoAand biomarker analysis (based on all samples), withinonly 30 seconds. This also showed the capability of Meta-Mesh for facilitating near real-time oral microbialcommunity monitoring.
DISCUSSION AND CONCLUSIONS
With the rapid accumulation of metagenomic samples andsequencing data, methods for efficient comparison anddatabase search for metagenomic samples are becomingincreasingly important. However, a good integratedsystem for organizing metagenomic samples, providinglarge-scale comparison, as well as data-mining is stilllacking and thus urgently needed. Current metagenomicsample comparison methods are generally based on pair-wise comparisons (which make them difficult for largescale analysis) without efficient data indexing that couldsupport large-scale comparison and data-mining. Over-coming of this drawback has been attempted by our Meta-Mesh system, an integrated platform that could be used
for sample taxonomical structure analysis, samplecomparison and similarity matrix generation, sampleclustering and biomarker identification, all based on anefficient computational engine.The application of Meta-Mesh on comparison of
different metagenomic samples has shown that it is ableto accurately and efficiently cluster similar microbialcommunities and identify the biomarkers for thesecommunities, as well as shedding new light on thefunctional diversity of the microbial communities. Forexample from thousands of oral microbial communities,Meta-Mesh could quickly differentiate communities fromhosts with different health status with very high accuracy,and identify biomarkers that might contribute for suchdifferences. Therefore, Meta-Mesh has proven its abilityfor efficient data-mining for large-scale metagenomicdatasets.With the advancements in Whole Genome Sequencing
(WGS) of human related metagenomic samples, it isanticipated that the profiling and comparison of a largenumber of metagenomic samples would become moreand more important, for which an integrated comparisonsystem would be of great help. Currently bioinformaticsanalysis of metagenomic data has also entered the era of“big-data”. Having this in its development philosophy,Meta-Mesh is well-positioned to provide key methods forhuman microbiome projects to facilitate research inmetagenomics, and thus would be suitable for data-drivenand in-depth data-mining for a variety of human microbialcommunity datasets, including those from HumanMicrobiome Project, etc.The Meta-Mesh system that we presented in this work
will be continuously updated (http://www.meta-mesh.org/).Firstly, for the metagenomic sample database, automaticand manual curation will continuously provide high-quality metagenomic data, ensuring that users have accessto accurate and consistently annotated experimentalinformation coupled with manually verified sequenceanalysis results. Secondly, some text-mining techniquesto further improve the efficiency in data curation wouldalso be attempted for more accurate annotation. Thirdly,the current Meta-Mesh database is optimized fortaxonomical annotation; with the fast accumulation ofhuman related metagenomic data, a functional annotation-based system would be developed in the future.
METHODS
Meta-Mesh is an open-source system designed forefficient and integrated analysis of metagenomic samplesthat offer functions such as community structure analysis,sample comparison and metagenomic data mining formicrobial community researches. The overall scheme ofMeta-Mesh database is illustrated in Figure 10.
Figure 6. Efficiency analysis for processing speed
of Meta-Mesh for 1,758 human-associated habitatmicrobial community samples.
12 © Higher Education Press and Springer-Verlag Berlin Heidelberg 2015
Xiaoquan Su et al.

Figure 7. The clustering analysis results of human associated-habitat samples from different body sites based on thesimilarity matrix. (A) Similarity matrix and hierarchical clustering results. (B) PCoA analysis results by different healthy status.
Saliva samples could be categorized into 3 groups: naturally occurring gingivitis (I), healthy gingivae (B) and experimental gingivitis(E).
© Higher Education Press and Springer-Verlag Berlin Heidelberg 2015 13
Application of Meta-Mesh

Metagenomic structure analysis
Meta-Mesh parses taxonomical and phylogenetic struc-ture of metagenomic samples based on the Parallel-META software [27,28] with configurable parameters.Parallel-META extracts 16S rRNA or 18S rRNAfragments which are considered as bio-markers by theHMM algorithm [29] with the model built by Slivadatabase [30], and maps these extracted rRNA sequencesto GreenGenes [31], RDP [32], Sliva [30] or Oral Core[33] database using megablast for high accuracy speciesidentification, taxonomical annotation and phylogeneticanalysis.
Quantitative phylogenetic-based samplecomparison and similarity matrix
Meta-Mesh evaluated the similarity value (0%–100%)between each sample pair based on their quantitativecomparison of common phylogenetic tree using the Meta-Storms scoring function [34]. This scoring functioncompares two microbial community samples’ structuresby bottom-up recursive traversal to their commonweighted phylogenetic tree, in which edge weightrepresents the phylogenetic distance and node weightrepresents the species abundance. The similarity value ofeach leaf node (species) is the common relative
Figure 8. Biomarker analysis results of samples in different healthy status. Saliva samples could be categorized into threegroups: naturally occurring gingivitis (I), healthy gingivae (B) and experimental gingivitis (E).
14 © Higher Education Press and Springer-Verlag Berlin Heidelberg 2015
Xiaoquan Su et al.

Figure 9. Correlation analysis results of the biomarker taxa of samples in different healthy status gauged by MGI.
© Higher Education Press and Springer-Verlag Berlin Heidelberg 2015 15
Application of Meta-Mesh

abundance of the two samples. Then the value of theirabundance difference is reduced to the ancestor node bymultiplying the phylogenetic distance for the calculationon upper level in the phylogenetic tree as the leaf nodes.Finally the sum of similarity values on all nodes is theoverall similarity score (between 0% and 100%) of thesetwo samples (for more details please refer to Su, et al.,2012 [34]). Then the pair-wised similarity values of allgiven sample pairs construct a similarity matrix. Meta-Mesh produces a visualization of the matrix where eachtile represents a similarity value between two samplesfrom a color gradient between red and green: red color
indicates higher similarity value and green color indicateslower similarity value, with red/green shades in betweenindicating intermediate values.
Clustering analysis based on similarity matrix
The hierarchical clustering analysis measures the relation-ships among the microbial community samples based onthe similarity matrix. This method is implemented by“HClust” function of CRAN R [35], and results arevisualized by MetaSee software [36] and “gplots”package (Gregory R., et al., gplots: Various R program-
Figure 10. The overall scheme of Meta-Mesh system.
16 © Higher Education Press and Springer-Verlag Berlin Heidelberg 2015
Xiaoquan Su et al.

ming tools for plotting data. http://CRAN.R-project.org/package = gplots) of CRAN R. The Principal CoordinatesAnalysis (PCoA) are used to elucidate the distribution ofsimilarity among samples by a give meta-data (e.g., host,body site) which is implemented by “vegan” package (ariOksanen, et al., vegan: Community Ecology Package.http://CRAN.R-project.org/package = vegan) of CRANR.
Biomarker and correlation analysis
In biomarker analysis the Meta-Mesh select abundant taxawhich are considered as key factor led to the variationsamong sample clusters and groups. The significance ofdifference in abundance distributions is measured by theWilcoxon and Kruskal rank-sum test, then Meta-Meshselect the taxa that have P-value smaller or equal to 0.001.Meta-Mesh also calculates the Pearson correlationcoefficient (R) between abundance values of biomarkertaxa their meta-data, and select the taxa with absolute Rvalue equal to or larger than 0.7 which indicate the strongcorrelated varying trend between the abundance valuesand meta-data.
High-performance computation techniques forMeta-Mesh
In Meta-Mesh system, all steps are supported by high-performance computation techniques including multi-thread computation and GPU computation.In metagenomic structure analysis we implemented
CPU based parallel computing to improve the analysisefficiency. In Parallel-META software we developed theOpenMP technology based parallel 16S/18S rRNAsequence mapping on multi-core CPU. This strategycould achieved much higher efficiency based on multi-core CPU and OpemMP technology than single threadserial computing [27,28].In sample comparison analysis we used GPU comput-
ing for calculation of similarity matrix with large numberof samples. Benefited by the many-core architecture ofGPU, scoring function can be invocated in parallel bymulti-threading to compute the similarities amongmassive amount of samples. To calculate the pair-wisesimilarity matrix of N samples, N�(N-1)/2 threads arelaunched in GPU to make each similarity value in thematrix processed by one independent thread. In ourprevious experiment the running time with GPU would beable to compute the pair-wise similarity values for 10, 240samples within 10 min, which gained a speed-up of> 17,000 times compared with single-core CPU, and> 2,600 times compared with 16-core CPU [37].Therefore, the high-performance computation back-
bone for Meta-Mesh could significantly accelerate the
comparison analysis, thus facilitate in-depth data miningamong massive microbial community samples.
ACKNOWLEDGMENTS
This work is supported in part by Chinese Academy of Sciences’ e-Science
grant (NO. INFO-115-D01-Z006), Ministry of Science and Technology’s
high-tech (863) grant (NO. 2009AA02Z310 and NO. 2014AA21502),
National Science Foundation of China Grant (NO. 61103167, NO.
31271410 and NO. 61303161), and The Open Fund of Key Laboratory of
Marine Ecology and Environmental Science, Institute of Oceanology,
Chinese Academy of Sciences (NO. KLMEES201304).
COMPLIANCE WITH ETHICS GUIDELINES
The authors Xiaoquan Su, Xiaojun Wang, Gongchao Jing, Shi Huang, Jian
Xu and Kang Ning declare that they have no conflict of interest.
This article does not contain any studies with human or animal subjects
performed by any of the authors.
REFERENCES
1. Proctor, G. N. (1994) Mathematics of microbial plasmid instability and
subsequent differential growth of plasmid-free and plasmid-containing
cells, relevant to the analysis of experimental colony number data.
Plasmid, 32, 101–130
2. National Research Council. (2007) The New Science of Metagenomics:
Revealing the Secrets of Our Microbial Planet. Washington: the
National Academies Press
3. Jurkowski, A., Reid, A. H. and Labov, J. B. (2007) Metagenomics: a
call for bringing a new science into the classroom (while it’s still new).
CBE Life Sci. Educ., 6, 260–265
4. Ley, R. E., Lozupone, C. A., Hamady, M., Knight, R. and Gordon, J. I.
(2008) Worlds within worlds: evolution of the vertebrate gut
microbiota. Nat. Rev. Microbiol., 6, 776–788
5. Turnbaugh, P. J., Ley, R. E., Mahowald, M. A., Magrini, V., Mardis, E.
R. and Gordon, J. I. (2006) An obesity-associated gut microbiome with
increased capacity for energy harvest. Nature, 444, 1027–1031
6. Grice, E. A. and Segre, J. A. (2011) The skin microbiome. Nat. Rev.
Microbiol., 9, 244–253
7. Kong, H. H. and Segre, J. A. (2012) Skin microbiome: looking back to
move forward. J. Invest. Dermatol., 132, 933–939
8. Turnbaugh, P. J., Hamady, M., Yatsunenko, T., Cantarel, B. L., Duncan,
A., Ley, R. E., Sogin, M. L., Jones, W. J., Roe, B. A., Affourtit, J. P., et
al. (2009) A core gut microbiome in obese and lean twins. Nature, 457,
480–484
9. Yatsunenko, T., Rey, F. E., Manary, M. J., Trehan, I., Dominguez-Bello,
M. G., Contreras, M., Magris, M., Hidalgo, G., Baldassano, R. N.,
Anokhin, A. P., et al. (2012) Human gut microbiome viewed across age
and geography. Nature, 486, 222–227
10. Yang, F., Zeng, X., Ning, K., Liu, K. L., Lo, C. C., Wang, W., Chen, J.,
Wang, D., Huang, R., Chang, X., et al. (2012) Saliva microbiomes
distinguish caries-active from healthy human populations. ISME J., 6,
1–10
11. Nasidze, I., Li, J., Schroeder, R., Creasey, J. L., Li, M. and Stoneking,
M. (2011) High diversity of the saliva microbiome in Batwa Pygmies.
PLoS One, 6, e23352
12. Muegge, B. D., Kuczynski, J., Knights, D., Clemente, J. C., González,
A., Fontana, L., Henrissat, B., Knight, R. and Gordon, J. I. (2011) Diet
© Higher Education Press and Springer-Verlag Berlin Heidelberg 2015 17
Application of Meta-Mesh
drives convergence in gut microbiome functions across mammalian
phylogeny and within humans. Science, 332, 970–974
13. Meyer, F., Paarmann, D., D’Souza, M., Olson, R., Glass, E. M., Kubal,
M., Paczian, T., Rodriguez, A., Stevens, R., Wilke, A., et al. (2008) The
metagenomics RAST server— a public resource for the automatic
phylogenetic and functional analysis of metagenomes. BMC Bioinfor-
matics, 9, 386
14. Seshadri, R., Kravitz, S. A., Smarr, L., Gilna, P. and Frazier, M. (2007)
CAMERA: a community resource for metagenomics. PLoS Biol., 5,
e75
15. Huson, D. H., Auch, A. F., Qi, J. and Schuster, S. C. (2007) MEGAN
analysis of metagenomic data. Genome Res., 17, 377–386
16. Mitra, S., Gilbert, J. A., Field, D. and Huson, D. H. (2010) Comparison
of multiple metagenomes using phylogenetic networks based on
ecological indices. ISME J., 4, 1236–1242
17. Mitra, S., Klar, B. and Huson, D. H. (2009) Visual and statistical
comparison of metagenomes. Bioinformatics, 25, 1849–1855
18. Parks, D. H. and Beiko, R. G. (2010) Identifying biologically relevant
differences between metagenomic communities. Bioinformatics, 26,
715–721
19. Kristiansson, E., Hugenholtz, P. and Dalevi, D. (2009) ShotgunFunc-
tionalizeR: an R-package for functional comparison of metagenomes.
Bioinformatics, 25, 2737–2738
20. Schloss, P. D., Westcott, S. L., Ryabin, T., Hall, J. R., Hartmann, M.,
Hollister, E. B., Lesniewski, R. A., Oakley, B. B., Parks, D. H.,
Robinson, C. J., et al. (2009) Introducing mothur: open-source,
platform-independent, community-supported software for describing
and comparing microbial communities. Appl. Environ. Microbiol., 75,
7537–7541
21. Goll, J., Rusch, D. B., Tanenbaum, D. M., Thiagarajan, M., Li, K.,
Methé, B. A. and Yooseph, S. (2010) METAREP: JCVI metagenomics
reports—an open source tool for high-performance comparative
metagenomics. Bioinformatics, 26, 2631–2632
22. Lozupone, C. and Knight, R. (2005) UniFrac: a new phylogenetic
method for comparing microbial communities. Appl. Environ. Micro-
biol., 71, 8228–8235
23. Hamady, M., Lozupone, C. and Knight, R. (2010) Fast UniFrac:
facilitating high-throughput phylogenetic analyses of microbial com-
munities including analysis of pyrosequencing and PhyloChip data.
ISME J., 4, 17–27
24. Chen, T., Yu, W. H., Izard, J., Baranova, O. V., Lakshmanan, A. and
Dewhirst, F. E. (2010) The Human Oral Microbiome Database: a web
accessible resource for investigating oral microbe taxonomic and
genomic information. Database, 2010, baq013
25. Caporaso, J. G., Lauber, C. L., Costello, E. K., Berg-Lyons, D.,
Gonzalez, A., Stombaugh, J., Knights, D., Gajer, P., Ravel, J., Fierer,
N., et al. (2011) Moving pictures of the human microbiome. Genome
Biol., 12, R50
26. Huang, S., Li, R., Zeng, X., He, T., Zhao, H., Chang, A., Bo, C., Chen,
J., Yang, F., Knight, R., et al. (2014) Predictive modeling of gingivitis
severity and susceptibility via oral microbiota. ISME J., 8, 1768–1780
27. Su, X., Xu, J. and Ning, K. (2012) Parallel-META: efficient
metagenomic data analysis based on high-performance computation.
BMC Syst. Biol., 6, suppl 1, S16
28. Su, X., Pan, W., Song, B., Xu, J. and Ning, K. (2014) Parallel-META
2.0: enhanced metagenomic data analysis with functional annotation,
high performance computing and advanced visualization. PLoS One, 9,
e89323
29. Rabiner, L. R. (1989) A tutorial on hidden Markov models and selected
applications in speech recognition. Proc. IEEE, 77, 257–286.
30. Pruesse,E., Quast, C., Knittel, K., Fuchs, B. M., Ludwig, W., Peplies, J.
and Glöckner, F. O. (2007) SILVA: a comprehensive online resource for
quality checked and aligned ribosomal RNA sequence data compatible
with ARB. Nucleic Acids Res., 35, 7188–7196
31. DeSantis, T. Z., Hugenholtz, P., Larsen, N., Rojas, M., Brodie, E. L.,
Keller, K., Huber, T., Dalevi, D., Hu, P. and Andersen, G. L. (2006)
Greengenes, a chimera-checked 16S rRNA gene database and work-
bench compatible with ARB. Appl. Environ. Microbiol., 72, 5069–
5072
32. Cole, J. R., Wang, Q., Cardenas, E., Fish, J., Chai, B., Farris, R. J.,
Kulam-Syed-Mohideen, A. S., McGarrell, D. M., Marsh, T., Garrity, G.
M., et al. (2009) The Ribosomal Database Project: improved alignments
and new tools for rRNA analysis. Nucleic Acids Res., 37, D141–
D145
33. Griffen, A. L., Beall, C. J., Firestone, N. D., Gross, E. L., Difranco, J.
M., Hardman, J. H., Vriesendorp, B., Faust, R. A., Janies, D. A. and
Leys, E. J. (2011) CORE: a phylogenetically-curated 16S rDNA
database of the core oral microbiome. PLoS One, 6, e19051
34. Su, X., Xu, J. and Ning, K. (2012) Meta-Storms: efficient search for
similar microbial communities based on a novel indexing scheme and
similarity score for metagenomic data. Bioinformatics, 28, 2493–2501
35. Dessau, R. B. and Pipper, C. B. (2008) “R”—project for statistical
computing. Ugeskr Laeg, 170, 328–330
36. Song, B., Su, X., Xu, J. and Ning, K. (2012) MetaSee: an interactive
and extendable visualization toolbox for metagenomic sample analysis
and comparison. PLoS One, 7, e48998
37. Su, X., Wang, X., Jing, G. and Ning, K. (2014) GPU-Meta-Storms:
Computing the structure similarities among massive amount of
microbial community samples using GPU. Bioinformatics, 1031–
1033
18 © Higher Education Press and Springer-Verlag Berlin Heidelberg 2015
Xiaoquan Su et al.