Embed Size (px)
Citation preview

Application of Indicators f th A t ffor the Assessment of
Ecosystem HealthEcosystem Health
By S. E. Jørgensen, DFU, Environmental Chemistry Universitetsparken 2 2100 pCopenhagen Ø, Denmark
sej@dfuni [email protected]

The presentation will cover:
• Various answers to the question: what is ecosystem health?ecosystem health?
• Which indicators to apply?Whi h t f EH th ?• Which aspects of EH can they cover?
• Special emphasis on Odum,s attributes d h li ti i di tand holistic indicators
• Conclusions about the use of indicators ith h i ifiwith emphasis on exergy. specific exergy
and buffer capacities as EHI?

Important book:
• Jørgensen, S.E., Robert Costanza and Xu Fuliu Handbook of Ecolgical IndicatorsHandbook of Ecolgical Indicators for the Assessment of Ecosystem Health, crc, Lewis Publ 2004Publ. 2004.

Do you know the disease?
• The disease may define• The disease may define the indicator, for instancethe indicator, for instance PCB pollution in the Great Lakes
• Invasion by zebra mussels

25
µg / g ww in birds
25
20
1515
1010
5
1974 2000

V B t l ff (1950) h t i d th l ti f lVon Bertalanffy (1950) characterised the evolution of complex systems in terms of four major attributes: 1) progressive integration (entails the development of integrat1) progressive integration (entails the development of integratlinkages between different species of biota and between biota, habitat and climate), 2) progressive differentiation (progressive specialisation as syevolve biotic diversity to take advantage of abilities to partitionreso rces more finel and so forth)resources more finely and so forth),3) progressive mechanisation (covers the growing number of febacks and regulation mechanisms),backs and regulation mechanisms),4) progressive centralisation (it does probably not refer to a centralisation in the political meaning, as ecosystems are charsed by short and fast feed backs and decentralised control, bumore and more developed (synergistic) cooperation among theorganisms (the Gaia effect) and the growing adaptation to all oorganisms (the Gaia effect) and the growing adaptation to all ocomponent in the ecosystem).

What should ecologicalWhat should ecological indicators cover?indicators cover?
• l) homeostasis; ) ;• 2) absence of disease, • 3) diversity or complexity; • 4) stability or resilience;• 4) stability or resilience; • 5) vigor or scope for growth5) vigor or scope for growth • 6) balance between system
components

Two methods may beTwo methods may be applied:applied:
B Di t M t /• By Direct Measurements / Observations MethodObse at o s et od
• By the Application of Models, f i ECOPATHfor instance ECOPATH or a bio-geochemical modelbio geochemical model

Classification of EcologicalClassification of Ecological IndicatorsIndicators
• Reductionistic (single) indicators - like for instance PCBinstance PCB
• Species present / absentS ih li ti i di t f i t Od ’• Semiholistic indicators: f.inst. Odum’s attributesH li ti i di t bi di it /• Holistic indicators - biodiversity / ecological network“S h li ti ” th d i• “Super-holistic” - thermodynamic indicators

Present and absent ofPresent and absent of species;species;
• ANN has been applied on big data bases to find relationships between species present / absent and water p pquality in rivers: for fish species, for diatom species and for species ofdiatom species and for species of benthic fauna. The present of species have been applied asspecies have been applied as indicators.
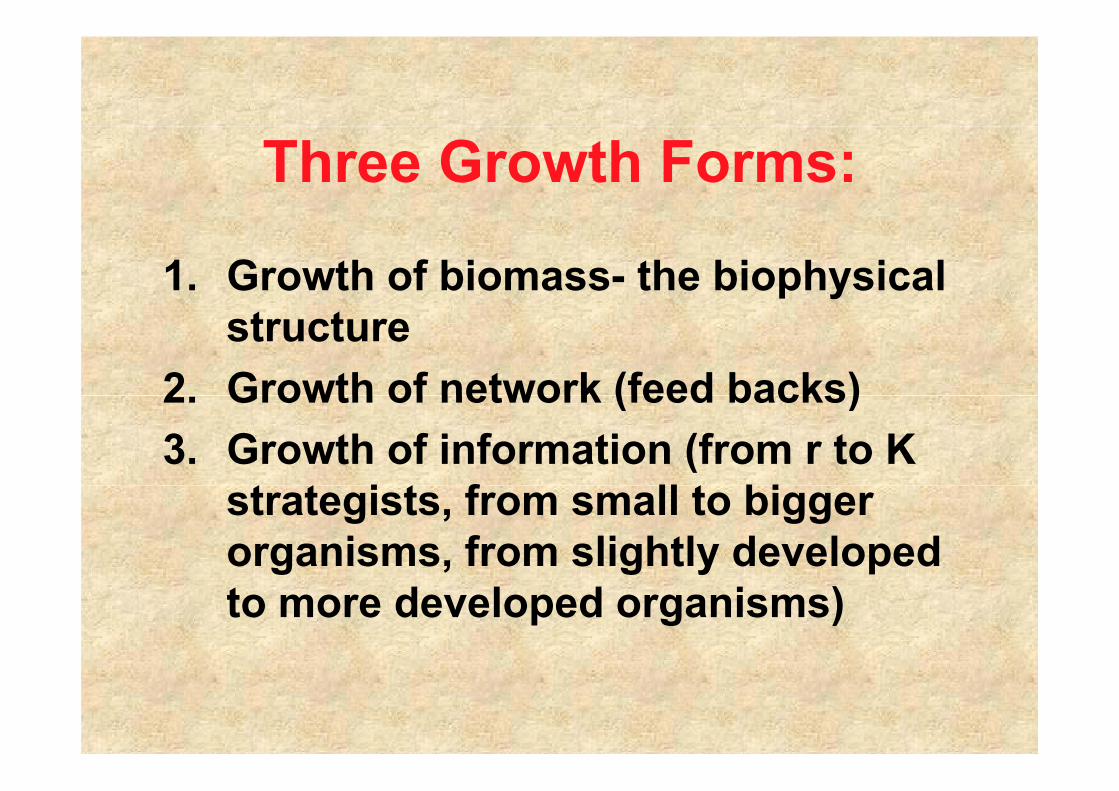
Three Growth Forms:
1. Growth of biomass- the biophysical structure
2 Growth of network (feed backs)2. Growth of network (feed backs)3. Growth of information (from r to K
t t i t f ll t bistrategists, from small to bigger organisms, from slightly developed to more developed organisms)
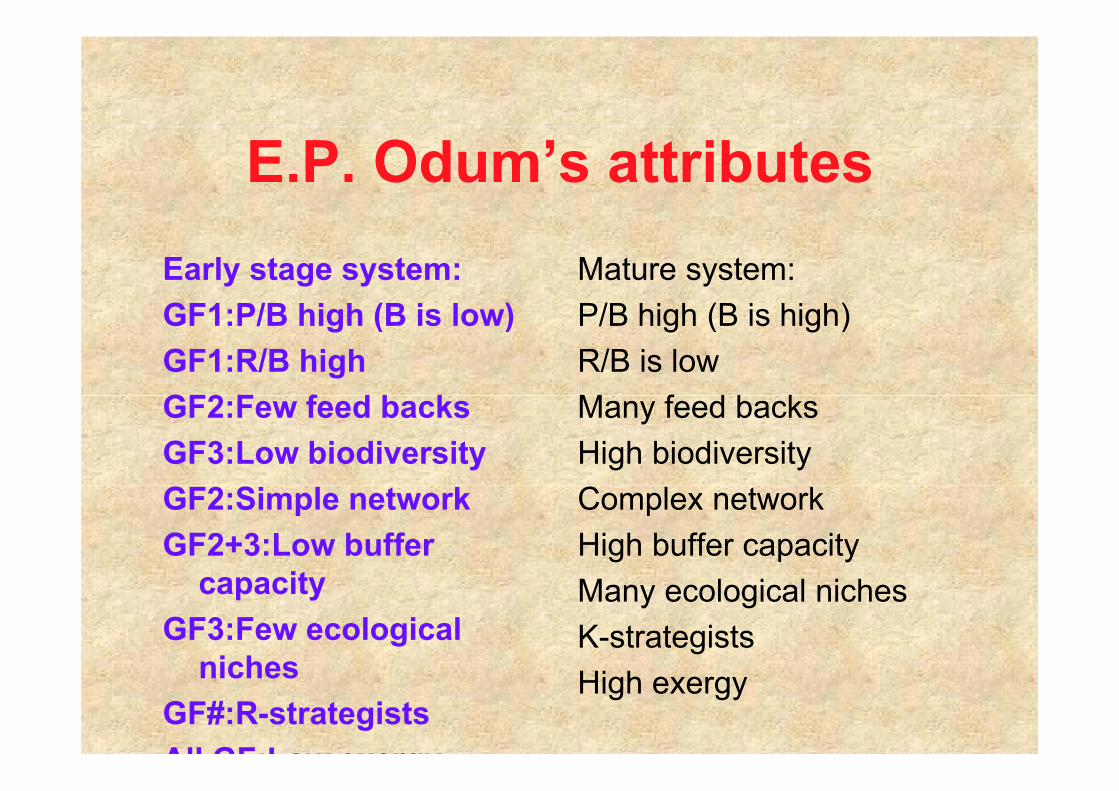
E.P. Odum’s attributesEarly stage system:GF1 P/B hi h (B i l )
Mature system:P/B hi h (B i hi h)GF1:P/B high (B is low)
GF1:R/B highGF2 F f d b k
P/B high (B is high)R/B is lowM f d b kGF2:Few feed backs
GF3:Low biodiversityMany feed backsHigh biodiversity
GF2:Simple networkGF2+3:Low buffer
it
Complex networkHigh buffer capacity
capacityGF3:Few ecological
niches
Many ecological nichesK-strategists
nichesGF#:R-strategistsAll GF:Low exergy
High exergy

EELS 11.0
ADULT PREDATORS 6.1
YOUNG PREDATORS 11 5 11.5
ZOOPLANKTON 267
SILVERSIDES
ADULT MUGILIDS 9 2
9.1
ADULT MUGILIDS 9.2
BENTHOS 13.1
MOLLUSCS 477
PHYTOPLANKTON 15.0
BENTHIC PRODUCERS1071
DETRITUS 5000
Ascendency is a networkAscendency is a network measuremeasure
• Higher flow of energy• Higher flow of energy through the system higher ascendencyMore complex network flow• More complex network flow, higher exergyg gy
• Ascendency and exergy are l t d f d lcorrelated for models

SUN1000 100 10 1
kJ / m2 h
SUN
Solar Equivalents kJ / m2 h
1000SUN
1000 1000 1000
E T f ti R tiEnergy Transformation Ratios = Embodied Energy Equivalents. kJ / m2 h
1 10 100 10001 10 100 1000SUN

Biodiversity is determinedBiodiversity is determined by the use of :by the use of :
• The number of speciesp• Shannons index =∑pi * ln pi∑p p

Results of differentResults of different indicators by EHA on 60 y
Italian and Chinese Lakes
Si l i di• Single indicators• Semi-holistic indicatorsSemi holistic indicators• Biodiversity• Thermodynamic indicators: exergy,
specific exergy and buffer capacityp gy p y

Dynamics in lake trophic states
R i di t Oligo- Eutrophication—Responses indicators Oligoeutrophication
—Eutrophication
EutrophicationHyper-
eutrophication
Phytoplankton cellnumber a,b Increase IncreasePhytoplankton cell number
Phytoplankton bio mass (BA) a,b Increase Increase
Phytoplankton cell size a,b Increase Increase
Phytoplankton diversity a Decrease Decrease
Zooplankton biomass (BZ) a,b Increase Decrease
Zooplanktonbod si e a,b Decrease Decrease
Structuralresponses
Zooplankton body size , Decrease Decrease
Zooplankton diversity a Decrease Decrease
BZ/BA ratio a,b Decrease Decrease
BZmacro./BZmicro. Ratio a,b Decrease Decrease
Phytoplankton primaryproduction a Increase Increaseproduction
P/B ratio a ≈ 1 < 0.5Functionalresponses
P/R ratio a ≈ 1 < 1.0
Exergy a,b Increase DecreaseSystem-level
responses Structural exergy a,b Decrease Decrease

4 The ecological indicators for lake ecosystem health assessmentRelative healthy state
Ecological indicators Good Bad
Methods for indicator values
St t l 1 Ph t l kt ll i S ll L MStructuralndicators
1. Phytoplankton cell size2. Zooplankton body size3. Phytoplankton biomass (BA)4 Zooplanktonbiomass (BZ)
Small Large Low
High
LargeSmallHighLow
Measure Measure Measure
Measure4 Zooplankton biomass (BZ)5 Macrozooplankton biomass (Bmacroz.)6 Microzooplanktonbiomass
High High
Low
LowLow
High
Measure Measure
Measure6. Microzooplankton biomass (Bmicroz.)7. BZ/BA ratio8 Bmacroz/Bmicroz ratio
Low
HighHigh
High
LowLow
Measure
CalculateCalculate8. Bmacroz./Bmicroz. ratio
9. Species diversity (DI) High
HighLow
CalculateMeasure & Calculate
Functionalndicators
10. Algal C assimilation ratio11 Resource use efficiency
HighHigh
LowLow
MeasureMeasure&Calculatendicators 11. Resource use efficiency
(RUE)12. Community production (P)13 P/Rratio
High Low ≈ 1
High
LowHigh
> or < 1Low
Measure & Calculate MeasureMeasure & CalculateMeasure&Calculate13. P/R ratio
14. P/B ratio15. B/E ratio
High High
LowLow
Measure & CalculateMeasure & Calculate
System-level 16. Buffer capacities ( ) High Low CalculateSystem levelndicators
16. Buffer capacities (_)17. Exergy (Ex)18. Structural exergy (Exst)
HighHighHigh
LowLowLow
Calculate Calculate Calculate

The ecological indicators and their measured values in different period in the Lake Chao(from April 1987 to March 1988)
Measured indicator values indifferent period**Ecological Relative order of healthpgindicators* A B C D E state in different period
(good _ poor)BA 4.5 1.31 21.82 0.60 0.58 E> D >B>A >CBA E D B A CBZ 0.33 0.34 1.76 4.15 13.54 E > D > C > B > A
BZ/BA 0.073 0.26 0.081 6.92 23.24 E > D > B > C > AP 1.42 1.38 7.03 0.74 0.21 E > D > B > A > C
P/B 0.292 1.053 0.322 1.233 0.363 D > B > E > C > ADI 1 59 1 62 0 28 1 83 1 97 E> D >B>A >CDI 1.59 1.62 0.28 1.83 1.97 E > D > B > A > CEx 112.0 98.5 606.3 1075.1 3350.9 E > D > C > A > BExst 25.33 52.8 48.0 213.6 238.6 E > D > B > C > A
β((TP)(Phyto.)) -0.014 6.45 0.04 0.92 -0.371 B > D > C > A > EComprehensive results E > D > B > A > C
* BA Ph l k bi ( 3) BZ Z l k bi ( 3) P* BA: Phytoplankton biomass (mg•m-3); BZ:Zooplankton biomass (mg•m-3); P:Algal primary productivity (gC•m-2•d-1); DI: Algal diversity index; Ex: Exergy(MJ•m-3); Exst: Structural exergy (MJ•mg-1); β((TP)(Phyto.)): Phytoplankton buffer
it t t t l h hcapacity to total phosphorus
** A: Apr. - May 1987; B: Jun. - Jul. 1987; C: Aug. - Oct. 1987; D: Nov. - Dec.1987; E: Jan. - Mar. 1988

System at temperature T, pressure p and the chemical potential µ(1)potential µ(1)
Exergy difference or gradient=
k d d b thwork produced by the gradient in chemical potential
Reference environment at same tempera- ture T and pressure p but by a chemicalture T and pressure p, but by a chemical potential at thermodynamic equilibrium (no free energy available, no gradients):µ[0)gradients):µ[0)
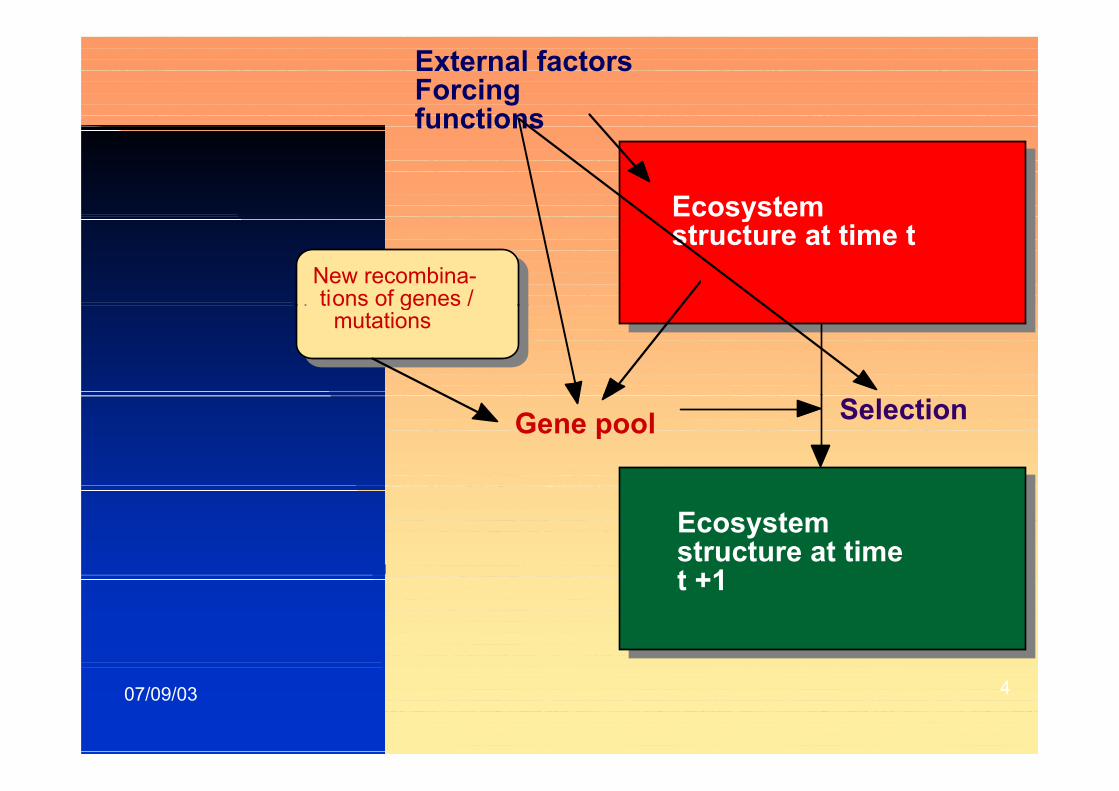
External factors Forcing functionsfunctions
EcosystemEcosystem structure at time t
New recombina- tions of genes / o s o ge es / mutations
Gene pool Selection
Ecosystem structure at time t +1t +1
07/09/03 4

H t l l t thHow to calculate the exergy• 1) Use models or other overviw of the• 1) Use models or other overviw of the
systems• 2) It can be shown that the following
approximation is valid Ex = ∑ ßici, pp ∑ i i,where ß is found from the embodied infomation Normalization ß = 1 basedinfomation. Normalization, ß 1 based on detritus (1 g detritus contains 18.7 kJ) ß for bacteria 3 8 for algae 18;kJ) ß for bacteria 3.8. for algae 18; jellyfs 118, worms 135. fish 499. Birds980, reptils 890,mammals 2130. The exergy found by this method will be

EXERGY INCREASES WITH:
• Growth form I: Increased biomassG h f II I d• Growh form II: Increased network (cycling and feed backs)( y g )
• Growth form III: Increased i f ti (k t t i tinformation (k strategists, regulation, genome)g , g )

Optimums
180
. .. .
Juvenile Regeneration
Optimum
Mixed
e nu
mbe
rs Juvenile
n, re
lativ
e
160
. Gap
estr
uctio
nEx
ergy
de
140
E
120
. Pasture
Exergy stored (GJ / ha)
1200 5 10 15 20 25 30 35 40

SPECIFIC EXERGYSPECIFIC EXERGY INCREASES WITHINCREASES WITH
• Growth form II:Increased network means better utilization of the exergyutilization of the exergy captured by the ecosysystem
• Growth form III: Increased in-formation means less exergyformation means less exergy lost and better cooperation (synergy)

Costanza (1992) summarises the concept definition of ecosystem health as follows:definition of ecosystem health as follows:health as 1) homeostasis (growth form II+III)1) homeostasis (growth form II+III)2) absence of disease (growth form I)3) diversity or complexity (growth form II+III))4) stability or resilience (buffer capacity isproportional with exergy)proportional with exergy)5) vigour or scope for growth and (all 3 growth forms)growth forms)6) balance between system components.( )(sp. exergy)

PROPERTIES OF EXERGY:
Increases with Measure:1) Distance from ther1) Biomass
2) The network (i.e.
1) Distance from ther-modynamic equili-brium) (
cycling, feed backs)3) Information (i e
brium2) Structure (biomassand network size) and3) Information (i.e.
regulation, size of
and network size) andfunction (information)3) Survival expressed as
ge-nomes, r->k
) pbiomass and information
strategists)

Table 2: Relationships between growth forms and goal functions
Growth FormI II III
____________________________________________________________
Exergystorage up up upgy g p p pPower / throughflow up up upAscendency up up upAscendency up up upExergy dissipation up equal equalRetention time equal up upEntropy up equal equalEntropy up equal equalExergy / Biomass=specific exergy equal up upentropy/biomass=entropy /biomass=spec. entropy prod. equal down downRatio indirect /di-
t ff t lrect effects equal up up______________________________________________________________

R2 5
2 0
2.5 +
2.0+
+
1.0
+
+
+
0.5 0 5 1 0 1 5 2 00.5 1.0 1.5 2.0
Log (N/P)

III. CONSERVATION
II EXPLOITATION
Trend of each further cycle
I. RENEWALIV CREATIVE DESTRUCTION
Specific exergy = exergy / biomass


The results of 18 EcopathThe results of 18 Ecopath models of marine systemsmodels of marine systems
• Exergy is correlated to the th h fl ( 2 0 975)through-flow (r2= 0.975)
• Exergy is correlated to R/B (r2=Exergy is correlated to R/B (r = 0.859)
• Exergy is correlated to B/P (r2 = 0 868)0.868)
• Specific exergy is correlated to p gythe number of species (r2= 0.843)

Eutrophication studies byEutrophication studies by modelsmodels
1200Exergy versus nutrients (mg /l)
800
1000
600
800
Ex TJ / l
TJ /
l
400Ex T
0
200
20100
nutrients

1,8
Structural exergy versus nutrients (mg /l)
1,7
1 5
1,6
E t TJ/TJ/g
1,4
1,5 Ex-struc TJ/g
Ex-s
truc
T
1,3
E
201001,2
nutrientsnutrients

Results from lakes 200000
y = 4222 9 + 2 5966x R^2 = 0 845
Exergy / total biomass incl. export
y = 4222,9 + 2,5966x R^2 = 0,845
100000 EXEX
06000050000400003000020000100000
biomass+exp

Structural exergy versus eutrophication, measured by the plant biomass + export
30y p p
2020
Struc exergyergy
10
Struc. exergy
Stru
c. e
xe
60000500004000030000200001000000
eutrophication

Coastal lagoon with clamCoastal lagoon with clam production and Ulvaproduction and Ulva
First figure exergy, second figure ifispecific exergy:
Full line: usual situationDotted line: Economic optimum cost /
benefit ulva removal / clambenefit ulva removal / clam production
Dashed line: Treatment of waste waterDashed line: Treatment of waste water discharged to the lagoon


Table 1 Empower density, exergy density and exergy/empower ratio for seven ecosystems
Control
Pond
Waste
Pond
Caprolace
Lagoon
Trasimeno
Lake
Figheri
Basin
Iberá
Lagoon
Galarza
Lagoono d o d agoo a e as agoo agoo
Empower density
(sej/year·l)20.1·108 31.6·108 0.9·108 0.3·108 12.2·108 1.0·108 1.1·108
(sej/year·l)
Exergy density1.6·104 0.6·104 4.1·104 1.0·104 71.2·104 7.3·104 5.5·104
(J/l)1.6 10 0.6 10 4.1 10 1.0 10 71.210 7.3 10 5.5 10
Exergy/empower
(J·year/sej) (x10-
5)
0.8 0.2 44.3 30.6 58.5 73 50.0
)

Buffer capacity defined as ∆forcing funtion / ∆state
i blvariable
• 1) It can be shown by models that the sum of many bufferthat the sum of many buffer capacities is proportional with exergy2) Notice that there is an• 2) Notice that there is an almost infinite number of buffer capacities

Use of buffer capacities inUse of buffer capacities in EHAEHA
• Use models to find relevant buffer capacities for instance ∆ h h / ∆∆ phosphorus / ∆ phytoplankton or ∆ dischargephytoplankton or ∆ discharge of ww / ∆ oxygen concentration in bottom water etcwater etc.

3
onun
ctio
2
cing
Fu
Forc 1
State Variable

Exergy and specific exergy have been applied as ecological indicators:g
1. By a comparison and health assessment of eutrophied lakes p2. By comparison and health assessment of coazones 3. By health assessment of Mondego Estuary in Portugal (Marques et al.)g ( q )4. By health assessment of Chinese lakes (Xu et 5. As ecological indicators for coastal lagoons ing gEurope (Jose, Zaldivar,ISPRA)6. For health assessment of different farming gsystems7. For health assessment in a situation where tox
contamination of ecosystems has taken place

Important holistic indicators
• Exergy and specific exergy• Important buffer capacities• Emergygy• Exergy/ emergy• Biodiversity• Biodiversity• Map of the network• Ascendency• Connectivity = the number of connection/ y
number of possible connections

How to consider severalHow to consider several indicators simultaneously?y
• By use of amoebeBy use of amoebe illustrations
• A few examples will be shown

C t dCase studyecosystem comparison
Beech ForestArable Land

E C t E t E tExergy Capture Entropy Export
BiodiversityMetabolicEffiency -1
Abi i Bi i W
ff y
Abiotic Heterogeneity
Biotic Water Flows
StN t i t L 1 StorageNutrient Loss -1
C it f S lfC it f S lf O i tiO i tiCapacity for SelfCapacity for Self--OrganisationOrganisation
Baumann et al. 2001

E C t E t E tExergy Capture Entropy Export
BiodiversityMetabolicEffiency -1
Abi i Bi i W
ff y
Abiotic Heterogeneity
Biotic Water Flows 50 %
Beech
StN t i t L 1
100 %
150 %
Beech Forest
StorageNutrient Loss -1 %
C it f S lfC it f S lf O i tiO i tiCapacity for SelfCapacity for Self--OrganisationOrganisation

E C t E t E tExergy Capture Entropy Export
BiodiversityMetabolicEffiency -1
Abi i Bi i W
ff y
Abiotic Heterogeneity
Biotic Water Flows 50 %
Beech MaizeMaize
StN t i t L 1
100 %
150 %
Beech Forest
MaizeMaizeFieldField
StorageNutrient Loss -1
C it f S lfC it f S lf O i tiO i tiCapacity for SelfCapacity for Self--OrganisationOrganisation

CONCLUSIONS:CONCLUSIONS:• Exergy and sp. gy p
exergy are consistent with the various definitions ofvarious definitions of ecosystem health
• They measure yecosy- system growth (three growth forms)forms)
• Practical applications show their usefulness
• They are not ffi i t b t tsufficient, but must
be supple-mented with other EHI