Embed Size (px)
Citation preview

Application of Hydrogen Peroxide for the Removal of Cyanobacteria and Cyanotoxins from Wastewater Treatment
Ponds in Western Australia
Danielle Jennifer Barrington Bachelor of Engineering (Environmental)
Bachelor of Science (Chemistry/Environmental Chemistry) The University of Western Australia
(Barrington 2007)
Supervised by Dr Anas Ghadouani
The University of Western Australia
In collaboration with the Water Corporation

Acknowledgements
Sincerest thanks to my supervisor Anas, for all your help this last two years. Nothing you
do goes unappreciated. Though please don’t dance on podiums anymore.
Lots of hugs go out to Penny and Hannah, for braving the ‘poo water’ for the greater good of my honours thesis
Thanks to Di, for taking the time to teach me how to use… well, the entire lab!
Dean Puzey - your help in the form of resources and time was greatly appreciated, especially risking drowning to row us into the centre of pond one
Brett Kerenyi- thanks for driving; sorry about the speeding ticket!
Thankyou to the third and final year SESE students for helping me stay sane in the computer lab, in particular to Dan for helping me get through MATLAB, but also
providing distraction and comic relief in times of stress
The Scrubs scriptwriters- I couldn’t have gotten through my degree without them!
To my absolutely fantastic family, who have always supported me in my chosen career path, even if that career is to become a tree-hugging hippie who wants to save the world
“Not I, not anyone else, can travel that road for you,
You must travel it for yourself.
I answer that I cannot answer,
You must find out for yourself.”
-Walt Whitman

Abstract
Harmful cyanobacterial blooms have increased in frequency and intensity within Western
Australia in recent decades. Freshwater blooms are primarily of the species Microcystis
aeruginosa, which contains variants of the cyanobacterial hepatotoxin microcystin, which
is detrimental to human and animal health. Cyanobacterial blooms are common in
wastewater treatment plants, and treated wastewater is currently released to waterways.
Wastewater plant effluent is required to be free of toxins prior to release to the
environment, and to achieve this, application of hydrogen peroxide has been proposed by
the Water Corporation to induce cyanobacterial cell death and toxin degradation.
Hydrogen peroxide is a known and marketed algicide, and is environmentally benign as
its degradation products are hydrogen and oxygen gases.
For the purposes of this study, samples were collected from the Burekup wastewater
treatment plant in order to undergo analysis in the laboratory. A statistically robust
factorial design was devised to establish the response of cyanobacterial biomass and
cyanobacterial toxins to the addition of various doses of hydrogen peroxide over time.
Fluorescence was measured using a bbe-Moldaenke FluoroProbe to determine the
photosynthetic activity of the sample, and cyanobacterial toxins were measured using an
Abraxis PN 520011, Microcystins/Nodularins (ADDA) ELISA Kit, Microtiter Plate
(96T).
Results suggest that hydrogen peroxide is effective at reducing the biomass of algal
communities within wastewater treatment ponds, and effective doses displayed an
exponential chlorophyll a decay curve with ANOVA p values less than 0.01, and r2
values greater than approximately 0.8. It is likely that the optimal application dose for
hydrogen peroxide to wastewater treatment ponds is above 0.148 gL-1. The minimum
detection limit for microcystin and nodularin concentration was 0.1 μgL-1, and all
samples tested within this study were below this concentration according to the analysis.
Hence the behaviour of microcystin concentrations with hydrogen peroxide application
could not be examined.
Our interpretation of the results based upon algal ecophysiology suggests that the
reduction of algal photosynthetic activity following the addition of hydrogen peroxide is

due to hydroxyl radicals attacking the cell wall and photosynthetic apparatus of
cyanobacteria, and destroying pigments and photosynthetic proteins to induce cell death.
It is believed that microcystin toxicity is reduced by hydroxyl radicals inducing oxidative
cleavage of the Adda bond, effectively severing the toxin molecule.
It is expected that further analysis will indicate an effective dose rate for wastewater
treatment plants to reduce cyanobacterial cell and toxin concentrations to within
acceptable levels, within acceptable monetary and time limits. Where cyanobacteria
removal methods are already in place, hydrogen peroxide may be viewed as a more
environmentally sensitive method of water treatment.

Acronyms
CRM – Certified Reference Materials
ELISA – Enzyme Linked Immunosorbent Assay
GC – Gas Chromatography
HPLC – High Performance Liquid Chromatography
LC – Liquid Chromatography
MMPB – 3-methoxy-2-methyl-4-phenylbutyric acid
MRM – Multiple Reaction Monitoring
MS – Mass Spectrometry
PDA – Photodiode Array
PPIA – Protein Phosphatase Inhibition Assay
SIM – Selected Ion Monitoring
SRM – Selected Reaction Monitoring
TLC – Thin Layer Chromatography
UV – Ultraviolet
WHO – World Health Organization
WWTP – Wastewater Treatment Plant

Table of Contents
1 Introduction.......................................................................................... 15
2 Literature Review ................................................................................ 17
2.1 Cyanobacteria in Western Australia ................................................................. 17
2.2 Western Australian Wastewater........................................................................ 18
2.3 Cyanobacteria and cyanobacterial toxins.......................................................... 19
2.4 Detection of cyanobacteria by fluorometry ...................................................... 26
2.5 Detection of cyanobacterial toxins.................................................................... 29
2.6 Prevention of high cyanobacterial concentrations ............................................ 36
2.7 Degradation and removal of cyanobacteria and cyanotoxins ........................... 37
2.8 Mode of action of hydrogen peroxide............................................................... 42
3 Methodology ......................................................................................... 45
3.1 Sampling and incubation................................................................................... 45
3.2 Determination of chlorophyll a......................................................................... 51
3.3 Determination of extracellular microcystin and nodularin concentrations....... 53
3.4 Data Analyses ................................................................................................... 56
4 Results ................................................................................................... 57
4.1 Cyanobacterial biomass .................................................................................... 57
4.2 Cyanobacterial toxins........................................................................................ 91
5 Discussion.............................................................................................. 93
5.1 Chlorophyll a concentration.............................................................................. 93
5.2 Cyanobacterial toxins........................................................................................ 96
6 Recommendations ................................................................................ 99
6.1 Refine analysis method ..................................................................................... 99
6.2 Field trial ......................................................................................................... 101
6.3 Hydrogen peroxide dosage protocol ............................................................... 101
7 Conclusion........................................................................................... 102
8 References ........................................................................................... 103

Figures
Figure 1: Microcystis aeruginosa bloom at Ron Stone Park, Mount Lawley (Fon Sing
2006) ................................................................................................................................. 17
Figure 2: Water Corporation Cyanobacterial Monitoring, Brunswick Junction WWTP . 18
Figure 3: Cells of Microcystis aeruginosa aggregating (Ghadouani 2006)..................... 21
Figure 4: Microcystis aeruginosa bloom at Ron Stone Park, Mount Lawley (Fon Sing
2006) ................................................................................................................................. 22
Figure 5: Chemical structure of Microcystin-LR.............................................................. 24
Figure 6: bbe-Moldaenke FluoroProbe assembled for laboratory use.............................. 28
Figure 7: Adding the Stop Solution to samples on an ELISA plate (Barrington 2007) ... 34
Figure 8: 1) Hydroxyl radicals attack the 4-5 or 6-7 bonds of the microcystin’s Adda
moiety. 2) Bonds 4-5 or 6-7 of Adda become dihydroxylated. 3) Oxidative cleavage of
the microcystin molecule occurs at the 4-5 or 6-7 bond of the Adda moiety. .................. 44
Figure 9: Locations of water samples collected in mid-2007 (Google 2007)................... 46
Figure 10: Lake adjacent to Sir Charles Gairdner Hospital, Nedlands (Barrington 2007)47
Figure 11: Laboratory incubation attempt (Barrington 2007) .......................................... 48
Figure 12: Collecting concentrated samples by use of a plankton net (Barrington 2007) 49
Figure 13: Preparing the boat for sample collection (Barrington 2007)........................... 50
Figure 14: Rowing the boat to collect samples from Pond 1 of the Burekup WWTP...... 51
Figure 15: Dosed samples undergoing incubation under fluorescent light (Barrington
2007) ................................................................................................................................. 52
Figure 16: Analysing a sample on the bbe-Moldaenke Fluoroprobe (Barrington 2007).. 53
Figure 17: Adding 50 μL of antibody solution to samples ............................................... 55
Figure 18: In situ chlorophyll a monitoring, Burekup WWTP. Standard error bars are
shown but are small in comparison to chlorophyll a values ............................................. 57

Figure 19: Total algal chlorophyll a concentration over time after dosing with various
concentrations of hydrogen peroxide ranging from 0 to 296 gL-1. Error bars represent the
standard error, where ten fluorescence measurements were taken for each repetition..... 58
Figure 20: Cyanobacterial chlorophyll a concentration over time after dosing with various
concentrations of hydrogen peroxide ranging from 0 to 296 gL-1. Error bars represent the
standard error, where ten fluorescence measurements were taken for each repetition..... 59
Figure 21: Dosed samples at 24 hours incubation. Left sample is a deionised water
control, the right sample has been dosed with 1.48gL-1 hydrogen peroxide (Barrington
2007) ................................................................................................................................. 60
Figure 22: Dosed samples at 24 hours incubation time. From left: control, 0.0296 gL-1,
0.148 gL-1, 0.296 gL-1, 0.740 gL-1, 1.48 gL-1 (Barrington 2007) ...................................... 61
Figure 23: Total algal chlorophyll a concentration normalised to the control. Error bars
represent the standard error, where ten fluorescence measurements were taken for each
repetition. .......................................................................................................................... 62
Figure 24: Cyanobacterial chlorophyll a concentration normalised to the control. Error
bars represent the standard error, where ten fluorescence measurements were taken for
each repetition. .................................................................................................................. 63
Figure 25: Chlorophyta chlorophyll a concentration normalised to the control. Error bars
represent the standard error, where ten fluorescence measurements were taken for each
repetition. .......................................................................................................................... 64
Figure 26: Diatom chlorophyll a concentration normalised to the control. Error bars
represent the standard error, where ten fluorescence measurements were taken for each
repetition. .......................................................................................................................... 65
Figure 27: Cryptophyta chlorophyll a concentration normalised to the control. Error bars
represent the standard error, where ten fluorescence measurements were taken for each
repetition. .......................................................................................................................... 66
Figure 28: Cyanobacterial chlorophyll a decay for the control. Error bars represent the
standard error, where ten fluorescence measurements were taken for each repetition..... 68

Figure 29: Cyanobacterial chlorophyll a decay for addition of 0.00296 gL-1 hydrogen
peroxide. Error bars represent the standard error, where ten fluorescence measurements
were taken for each repetition........................................................................................... 69
Figure 30: Cyanobacterial chlorophyll a decay for addition of 0.0296 gL-1 hydrogen
peroxide. Error bars represent the standard error, where ten fluorescence measurements
were taken for each repetition........................................................................................... 70
Figure 31: Cyanobacterial chlorophyll a decay for addition of 0.148 gL-1 hydrogen
peroxide. Error bars represent the standard error, where ten fluorescence measurements
were taken for each repetition........................................................................................... 71
Figure 32: Cyanobacterial chlorophyll a decay for addition of 0.296 gL-1 hydrogen
peroxide. Error bars represent the standard error, where ten fluorescence measurements
were taken for each repetition........................................................................................... 72
Figure 33: Cyanobacterial chlorophyll a decay for addition of 0.740 gL-1 hydrogen
peroxide. Error bars represent the standard error, where ten fluorescence measurements
were taken for each repetition........................................................................................... 73
Figure 34: Cyanobacterial chlorophyll a decay for addition of 1.48 gL-1 hydrogen
peroxide. Error bars represent the standard error, where ten fluorescence measurements
were taken for each repetition........................................................................................... 74
Figure 35: Cyanobacterial chlorophyll a decay for addition of 2.96 gL-1 hydrogen
peroxide. Error bars represent the standard error, where ten fluorescence measurements
were taken for each repetition........................................................................................... 75
Figure 36: Cyanobacterial chlorophyll a decay for addition of 296 gL-1 hydrogen
peroxide. Error bars represent the standard error, where ten fluorescence measurements
were taken for each repetition........................................................................................... 76
Figure 37: Cyanobacterial chlorophyll a first order rate constants plotted against
hydrogen peroxide dose. The line of best fit is a 3 parameter sigmoid. Error bars represent
the standard error. ............................................................................................................. 78
Figure 38: Total algal chlorophyll a decay for the control. Error bars represent the
standard error, where ten fluorescence measurements were taken for each repetition..... 80

Figure 39: Total algal chlorophyll a decay for addition of 0.00296 gL-1 hydrogen
peroxide. Error bars represent the standard error, where ten fluorescence measurements
were taken for each repetition........................................................................................... 81
Figure 40: Total algal chlorophyll a decay for addition of 0.0296 gL-1 hydrogen peroxide.
Error bars represent the standard error, where ten fluorescence measurements were taken
for each repetition. ............................................................................................................ 82
Figure 41: Total algal chlorophyll a decay for addition of 0.148 gL-1 hydrogen peroxide.
Error bars represent the standard error, where ten fluorescence measurements were taken
for each repetition. ............................................................................................................ 83
Figure 42: Total algal chlorophyll a decay for addition of 0.296 gL-1 hydrogen peroxide.
Error bars represent the standard error, where ten fluorescence measurements were taken
for each repetition. ............................................................................................................ 84
Figure 43: Total algal chlorophyll a decay for addition of 0.740 gL-1 hydrogen peroxide.
Error bars represent the standard error, where ten fluorescence measurements were taken
for each repetition. ............................................................................................................ 85
Figure 44: Total algal chlorophyll a decay for addition 1.48 gL-1 hydrogen peroxide.
Error bars represent the standard error, where ten fluorescence measurements were taken
for each repetition. ............................................................................................................ 86
Figure 45: Total algal chlorophyll a decay for addition of 2.96 gL-1 hydrogen peroxide.
Error bars represent the standard error, where ten fluorescence measurements were taken
for each repetition. ............................................................................................................ 87
Figure 46: Total algal chlorophyll a decay for addition of 296 gL-1 hydrogen peroxide.
Error bars represent the standard error, where ten fluorescence measurements were taken
for each repetition. ............................................................................................................ 88
Figure 47: Total algal chlorophyll a first order rate constants plotted against hydrogen
peroxide dose. The line of best fit is a 3 parameter sigmoid. Error bars represent the
standard error. ................................................................................................................... 90
Figure 48: Combined microcystin and nodularin concentrations detected by ELISA
analysis. All measurements were below the minimum reliable detection limit of 0.1 μgL-1
........................................................................................................................................... 92
Tables
Table 1: Advisory levels for cyanobacteria in wastewater effluent (Water Corporation
2004) ................................................................................................................................. 19
Table 2: Statistical analysis of total algal chlorophyll a concentration normalised to the
control ............................................................................................................................... 62
Table 3: Statistical analysis of cyanobacterial chlorophyll a concentration normalised to
the control ......................................................................................................................... 63
Table 4: Statistical analysis of chlorophyta chlorophyll a concentration normalised to the
control ............................................................................................................................... 64
Table 5: Statistical analysis of diatom chlorophyll a concentration normalised to the
control ............................................................................................................................... 65
Table 6: Cyanobacterial first order rate constant for the control ...................................... 68
Table 7: Cyanobacterial first order rate constant for addition of 0.00296 gL-1 hydrogen
peroxide............................................................................................................................. 69
Table 8: Cyanobacterial first order rate constant for addition of 0.0296 gL-1 hydrogen
peroxide............................................................................................................................. 70
Table 9: Cyanobacterial first order rate constant for addition of 0.148 gL-1 hydrogen
peroxide............................................................................................................................. 71
Table 10: Cyanobacterial first order rate constant for addition of 0.296 gL-1 hydrogen
peroxide............................................................................................................................. 72
Table 11: Cyanobacterial first order rate constant for addition of 0.740 gL-1 hydrogen
peroxide............................................................................................................................. 73
Table 12: Cyanobacterial first order rate constant for addition of 1.48 gL-1 hydrogen
peroxide............................................................................................................................. 74
Table 13: Cyanobacterial first order rate constant for addition of 2.96 gL-1 hydrogen
peroxide............................................................................................................................. 75
Table 14: Cyanobacterial first order rate constant for addition of 296 gL-1 hydrogen
peroxide............................................................................................................................. 76
Table 15: Average first order rate constants for cyanobacterial chlorophyll a................. 77
Table 16: Total algal first order rate constant for the control ........................................... 80
Table 17: Total algal first order rate constant for addition of 0.00296 gL-1 hydrogen
peroxide............................................................................................................................. 81
Table 18: Total algal first order rate constant for addition of 0.0296 gL-1 hydrogen
peroxide............................................................................................................................. 82
Table 19: Total algal first order rate constant for addition of 0.148 gL-1 hydrogen
peroxide............................................................................................................................. 83
Table 20: Total algal first order rate constant for addition of 0.296 gL-1 hydrogen
peroxide............................................................................................................................. 84
Table 21: Total algal first order rate constant for addition of 0.740 gL-1 hydrogen
peroxide............................................................................................................................. 85
Table 22: Total algal first order rate constant for addition of 1.48 gL-1 hydrogen peroxide
........................................................................................................................................... 86
Table 23: Total algal first order rate constant for addition of 2.96 gL-1 hydrogen peroxide
........................................................................................................................................... 87
Table 24: Total algal first order rate constant for addition of 296 gL-1 hydrogen peroxide
........................................................................................................................................... 88
Table 25: Average first order rate constants for total algal chlorophyll a ........................ 89
Table 26: Total microcystin and nodularin concentrations (μgL-1) detected by ELISA .. 92
Table 27: Fluoroprobe data for chlorophyll a concentration for the control, repetition 1
......................................................................................................................................... 116

Table 28: Fluoroprobe data for chlorophyll a concentration for the control, repetition 2
......................................................................................................................................... 116
Table 29: Fluoroprobe data for chlorophyll a concentration for the control, repetition 3
......................................................................................................................................... 117
Table 30: Fluoroprobe data for chlorophyll a concentration with 2.96 x 10⁻³ gL-1
hydrogen peroxide addition, repetition 1 ........................................................................ 117
Table 31: Fluoroprobe data for chlorophyll a concentration with 2.96 x 10⁻³ gL-1
hydrogen peroxide addition, repetition 2 ........................................................................ 118
Table 32: Fluoroprobe data for chlorophyll a concentration with 2.96 x 10⁻³ gL-1
hydrogen peroxide addition, repetition 3 ........................................................................ 118
Table 33: Fluoroprobe data for chlorophyll a concentration with 2.96 x 10⁻² gL-1
hydrogen peroxide addition, repetition 1 ........................................................................ 119
Table 34: Fluoroprobe data for chlorophyll a concentration with 2.96 x 10⁻² gL-1
hydrogen peroxide addition, repetition 2 ........................................................................ 119
Table 35: Fluoroprobe data for chlorophyll a concentration with 2.96 x 10⁻² gL-1
hydrogen peroxide addition, repetition 3 ........................................................................ 120
Table 36: Fluoroprobe data for chlorophyll a concentration with 1.48 x 10⁻¹ gL-1
hydrogen peroxide addition, repetition 1 ........................................................................ 120
Table 37: Fluoroprobe data for chlorophyll a concentration with 1.48 x 10⁻¹ gL-1
hydrogen peroxide addition, repetition 2 ........................................................................ 121
Table 38: Fluoroprobe data for chlorophyll a concentration with 1.48 x 10⁻¹ gL-1
hydrogen peroxide addition, repetition 3 ........................................................................ 121
Table 39: Fluoroprobe data for chlorophyll a concentration with 2.96 x 10⁻¹ gL-1
hydrogen peroxide addition, repetition 1 ........................................................................ 122
Table 40: Fluoroprobe data for chlorophyll a concentration with 2.96 x 10⁻¹ gL-1
hydrogen peroxide addition, repetition 2 ........................................................................ 122
Table 41: Fluoroprobe data for chlorophyll a concentration with 2.96 x 10⁻¹ gL-1
hydrogen peroxide addition, repetition 3 ........................................................................ 123
Table 42: Fluoroprobe data for chlorophyll a concentration with 7.4 x 10⁻¹ gL-1 hydrogen
peroxide addition, repetition 1 ........................................................................................ 123
Table 43: Fluoroprobe data for chlorophyll a concentration with 7.4 x 10⁻¹ gL-1 hydrogen
peroxide addition, repetition 2 ........................................................................................ 124
Table 44: Fluoroprobe data for chlorophyll a concentration with 7.4 x 10⁻¹ gL-1 hydrogen
peroxide addition, repetition 3 ........................................................................................ 124
Table 45: Fluoroprobe data for chlorophyll a concentration with 1.48 gL-1 hydrogen
peroxide addition, repetition 1 ........................................................................................ 125
Table 46: Fluoroprobe data for chlorophyll a concentration with 1.48 gL-1 hydrogen
peroxide addition, repetition 2 ........................................................................................ 125
Table 47: Fluoroprobe data for chlorophyll a concentration with 1.48 gL-1 hydrogen
peroxide addition, repetition 3 ........................................................................................ 126
Table 48: Fluoroprobe data for chlorophyll a concentration with 2.96 gL-1 hydrogen
peroxide addition, repetition 1 ........................................................................................ 126
Table 49: Fluoroprobe data for chlorophyll a concentration with 2.96 gL-1 hydrogen
peroxide addition, repetition 2 ........................................................................................ 127
Table 50: Fluoroprobe data for chlorophyll a concentration with 2.96 gL-1 hydrogen
peroxide addition, repetition 3 ........................................................................................ 127
Table 51: Fluoroprobe data for chlorophyll a concentration with 296 gL-1 hydrogen
peroxide addition, repetition 1 ........................................................................................ 128
Table 52: Fluoroprobe data for chlorophyll a concentration with 296 gL-1 hydrogen
peroxide addition, repetition 2 ........................................................................................ 128
Table 53: Fluoroprobe data for chlorophyll a concentration with 296 gL-1 hydrogen
peroxide addition, repetition 3 ........................................................................................ 129

1. Introduction 15
1 Introduction
Harmful cyanobacterial blooms have increased in frequency and intensity within Western
Australia in recent decades, mainly due to increased nutrient loadings to waterways
(Griffin et al. 2001; Pennifold and Davies 2001; Robson and Hamilton 2004). Freshwater
blooms are primarily of the species Microcystis aeruginosa, which contains variants of
the cyanobacterial hepatotoxin microcystin (Kemp and John 2006). Hepatotoxins are
detrimental to human and animal health, and microcystin variants have been reported to
have caused liver disease resulting in death, in particular the death of 56 haemodialysis
patients at a Brazil clinic in 1996 (Carmichael 2001; Jochimsen et al. 1998). Hepatotoxins
have also been implicated in causing liver cancer (Carmichael 1992; Carmichael 1997;
Nishiwaki-Matsushima et al. 1992; Tsuji et al. 1997; Ueno et al. 1996).
Cyanobacterial blooms occur in most waterway types, including wastewater treatment
ponds (Fleming et al. 2002). Treated wastewater is currently released to waterways, and it
is a legal requirement that such effluent is free of toxins prior to release to the
environment (Water Corporation 2007). Given the possibility for future wastewater
treatment and redistribution for scheme use, human interaction with cyanobacteria could
be greatly increased in coming years. Thus knowledge of the degradation rates of
cyanobacteria and their toxins is of utmost importance to the water industry.
Water industries worldwide currently use various algicides to remove cyanobacteria
before releasing water into the environmental flow. However, many of these methods
generate environmentally harmful by-products (Tsuji et al. 1997), and few studies have
been conducted on their effectiveness for the removal of cyanobacteria and
cyanobacterial toxins from water treatment ponds. Hydrogen peroxide is a known and
marketed algicide, and is environmentally benign as its degradation products are oxygen
gas and water (Barroin and Feuillade 1986). The Water Corporation has thus proposed
the application of hydrogen peroxide to induce cyanobacterial cell death and toxin
degradation.

16 1. Introduction
This project had several aims:
1. Determine a hydrogen peroxide dosage for the effective removal of
cyanobacteria and cyanotoxins from wastewater treatment ponds, that optimises
cost, response time and environmental impacts, and provide results to assist in the
creation of a protocol for treatment of cyanobacteria in wastewater treatment
plants Australia wide;
2. Determine the decay functions for both cyanobacterial cells and their toxins as
a function of dosage and response time;
3. Establish the response time and the relationship between the concentration of
hydrogen peroxide added and the decay functions of cyanobacterial biomass and
cyanotoxins.
The Australian water industry will benefit from the knowledge gained through this
project, in particular through the eventual development of a protocol for dosing
wastewater with hydrogen peroxide to remove cyanobacteria and their toxins. This will
be of great socioeconomic and environmental benefit within Australia, by reducing the
risk of cyanobacterial toxicosis to humans and animals. The acquired knowledge could
also be of use for dosing natural systems such as lakes and rivers, in particular areas of
the Swan and Canning Rivers which commonly suffer cyanobacterial blooms in the warm
summer months.

2. Literature Review 17
2 Literature Review
2.1 Cyanobacteria in Western Australia
Increased nutrient loadings into the Swan River and its tributaries has led to an increased
frequency of algal blooms in recent years (Robson and Hamilton 2004; Griffin et al.
2001; Pennifold and Davies 2001). Algal blooms have also occurred in Western
Australian freshwater bodies such as lakes (Figure 1) and water treatment ponds
(unpublished data, Water Corporation 2007). Blooms generally belong to the genera of
Microcystis, Anabaena, Aphanizomenon and Nodularia, and the predominant algal toxin
in fresh waters of the Swan Coastal Plain is microcystin-LR (Kemp and John 2006). This
cyanotoxin is detrimental to human and animal health (Bourne et al. 2006).
Figure 1: Microcystis aeruginosa bloom at Ron Stone Park, Mount Lawley (Fon Sing 2006)

18 2. Literature Review
2.2 Western Australian Wastewater
In Western Australia, wastewater from households, businesses and industry is transported
to Wastewater Treatment Plants managed by the Water Corporation, where it is treated to
a prescribed standard prior to release to the environment (Water Corporation 2006). In
the smaller WWTPs of the South-West Region, wastewater is treated using an outdoor
consecutive pond system, and raw water samples are collected from WWTPs monthly.
Analysis of samples from the Brunswick Junction WWTP polishing pond, the final water
body prior to release, show elevated levels of potentially toxic phytoplankton, in
particular Microcystis aeruginosa, throughout the year (Figure 2).
Date
17 Aug '06 13 Sept '06 26 Oct '06 30 Oct '06 9 Nov '06 14 Dec '06 10 Jan '07 15 Feb '07 14 Mar '07 30 May '07 13 Jun '07
Cya
noba
cter
ial c
ell d
ensi
ty (c
ells
/mL)
0.0
2.0e+4
4.0e+4
6.0e+4
8.0e+4
1.0e+5
1.2e+5
Figure 2: Water Corporation Cyanobacterial Monitoring, Brunswick Junction WWTP
It is a legal requirement that treated effluent has a cyanobacterial density below Water
Corporation guideline levels (Table 1) prior to release to the environment, and the Water
Corporation has previously used various algicides to achieve this aim. However, many
current removal methods generate environmentally harmful by-products such as
Maximum Detection Limit

2. Literature Review 19
trihalomethanes (Tsuji et al. 1997). Hence application of the environmentally benign
algicide hydrogen peroxide has been proposed by the Water Corporation to induce cell
lysis and toxin degradation.
Table 1: Advisory levels for cyanobacteria in wastewater effluent (Water Corporation 2004)
Indicative cyanobacteria level (cells mL-1) Indicative toxin level1 (μgL-1) Microcystis aeruginosa Anabaena
circinalis Microcystis aeruginosa
Anabaena circinalis
Occupational Health and Safety Spray aerosol exposure 5000 5000 1 3 Public Health Direct exposure to grass/pasture Low risk, no advisory level Low risk, no advisory level Spray aerosol exposure See above See above Primary recreational contact Level 1: Direct contact not restricted 20000 20000 2 4 Level 2: Direct contact restricted 100000 (or scums) 100000 (or scums) 20 20 Wildlife and Domestic Animals Livestock pasture grazing Low risk, no advisory level Low risk, no advisory level Livestock drinking water 50000 100000 10 20 High value animals2 10000 20000 2 4 Wildlife3 50000 100000 10 20
1Should be applied to the total cell-bound and extracellular microcystins/saxitoxins 2These might include stud animals, horses, family pets 3These advisory levels are based on those proposed by the CSIRO for general livestock and poultry exposure
2.3 Cyanobacteria and cyanobacterial toxins
2.3.1 Cyanobacteria
Cyanobacteria belong to the kingdom Monera, division eubacteria, and although they are
not technically plants, they are often mistakenly known as blue-green algae because of
their ability to photosynthesise (Ressom et al. 1994). They thrive over a large range of
salinity and temperature (Svrcek and Smith 2004), and prefer habitats with neutral or
slightly alkaline pH (Ressom et al. 1994).
In natural ecosystems, cyanobacteria are responsible for providing oxygen to aerobic
microorganisms and converting inorganic nitrogen into organic forms (Antoniou et al.
2005). They are the organisms responsible for providing the rich oxygen atmosphere of
Earth (Svrcek and Smith 2004) and need only light, carbon dioxide, water and some

20 2. Literature Review
minerals to survive (Ressom et al. 1994). Cyanobacteria are also primary producers with
nutritional value to organisms at higher trophic levels, and thus increase the fertility of
their natural habitats (Chorus and Bartram 1999).
Cyanobacteria are single celled organisms which have a tendency to aggregate into
colonies (Figure 3), resulting in cyanobacterial blooms (Figure 4) (Carmichael 2001),
which are defined as having a cell density in excess of 106 cells L-1 (Hitzfeld et al. 2000).
Such blooms have been reported in freshwater in over 45 countries, as well as in marine
environments (Codd et al. 2005). Favourable conditions for blooms are stagnant water,
low wind speeds, temperatures between 15 and 30 degrees Celsius, a pH ranging from 6-
9, thermal stratification and high nutrient loads (Carmichael 1994; Chorus and Bartram
1999). The typical controlling nutrient for producing blooms is phosphorus, with nitrogen
also being of great importance (Chorus and Bartram 1999). However, water bodies do not
require eutrophic conditions to produce cyanobacterial blooms, and reports of blooms
under oligotrophic conditions have been documented (Chorus and Bartram 1999; de
Figueiredo et al. 2004).

2. Literature Review 21
Figure 3: Cells of Microcystis aeruginosa aggregating (Ghadouani 2006)

22 2. Literature Review
Figure 4: Microcystis aeruginosa bloom at Ron Stone Park, Mount Lawley (Fon Sing 2006)
Under favourable temperature, nutrient, meteorological and pH conditions,
cyanobacterial blooms can persist for several weeks (Perez and Aga 2005). Such blooms
are common in wastewater treatment ponds (Fleming et al. 2002), including those of
South-West Western Australia (unpublished data, Water Corporation 2007).
2.3.2 Cyanobacterial toxins
Many genera of cyanobacteria contain cyanotoxins, and approximately 50% of blooms
can be expected to contain toxic species (Carmichael 1992). Such toxins are thought to
act primarily as protective compounds against grazing by zooplankton (Carmichael
1992). High concentrations of cyanobacterial toxins can be released into surrounding
waters following the destruction, whether natural or anthropogenic, of algal blooms
(McElhiney and Lawton 2005).

2. Literature Review 23
Toxins are compounds which have a detrimental effect on other tissues, cells or
organisms (Svrcek and Smith 2004), and in cyanobacteria include hepatotoxins,
neurotoxins, cytotoxins, dermatoxins and lipopolysaccharides (Wiegand and Pflugmacher
2005). The most common cyanobacterial toxins are variants of the hepatotoxins
microcystin (Codd 2000).
2.3.3 Microcystins
Microcystins are cyclic heptapeptides with five invariant amino acids and two variants
(Antoniou et al. 2005; Carmichael 1992; Fawell et al. 1993), amounting to more than 75
different microcystin chemicals (Codd 2000). Microcystins are named according to their
variant amino acids using a two letter suffix: arginine (R), leucine (L), tyrosine (Y),
alanine (A), phenylalanine (F) and tryptophan (W). The microcystins generally detected
in freshwater bodies are microcystin-LR, -RR and YR (Perez and Aga 2005).
One invariant amino acid found in microcystins is 3-amino-9-methoxy-10-phenyl-2,6,8-
trimethyl-deca-4(E),6(E)-dienoic acid (Adda), which increases the hydrophobicity of the
whole microcystin molecule (Perez and Aga 2005), and is essential for the toxin’s
expression of biological activity (An and Carmichael 1994). The other invariant amino
acids are alanine, methylaspartic acid and glutamic acid (Al Momani et al. In press 2007).
Microcystins derive their toxicity because they are potent inhibitors of serine/threonine
protein phosphatase 1 and 2A enzymes (Carmichael and An 1999; MacKintosh et al.
1990).
Microcystins are stable with respect to biological degradation (Harada 1996), but
isomerise on exposure to UV light (Tsuji et al. 1994). The extent of isomerisation is
dependent on the pigment concentration within the water sample (Tsuji et al. 1994).
Thermal destruction of the toxin occurs above 120ºC, meaning the common removal
method of boiling is insufficient for degradation (Harada 1996).
The most common cyanobacterial toxin, which is also of the greatest risk to human
health, is microcystin-LR (Figure 5) (Carmichael 1992; Fawell et al. 1993). This toxin
contributes 23-94% of the total toxin concentration of most cyanobacterial blooms (Perez

24 2. Literature Review
and Aga 2005). This toxin is stable in unsterilised reservoir water for approximately one
week, and in deionised water for up to 27 days (Cousins et al. 1996).
Figure 5: Chemical structure of Microcystin-LR
2.3.4 Health risks and effects
Microcystin blooms cause bad odour and taste, and cyanobacterial toxins pose a
significant health risk to humans and animals on exposure (Antoniou et al. 2005; Codd
2000; Cousins et al. 1996; Drikas et al. 2001; Mohamed 2001). The most common routes
of human contact with cyanobacterial toxins are through the contamination of drinking
water (Carmichael 1994; Codd et al. 1999a; Gilroy et al. 2000; Ueno et al. 1996; Falconer
1999), the recreational use of lakes and rivers containing cyanobacteria (Pilotto et al.
1997) and via the ingestion of blue-green algal supplements (Gilroy et al. 2000). Water
containing blooms probably becomes unpalatable to humans well before concentrations
reach levels which pose a threat to health (Fitzgerald et al. 1999). Although cyanotoxins
Adda Moiety

2. Literature Review 25
are rarely ingested or absorbed in quantities large enough to induce acute effects, long
term exposure can result in chronic toxicosis (Bogialli et al. 2005).
Another possible exposure route is through the ingestion of plant and animal matter in
which the toxins have bioaccumulated (Codd et al. 1999b; McElhiney et al. 2001; Carbis
et al. 1997; Vasconcelos 1995; Eriksson et al. 1989). Although the large size of
microcystin molecules prevents their diffusion through cell walls, it is believed the
gastrointestinal uptake could be a viable mechanism for transporting hepatotoxins into the
body (Perez and Aga 2005).
Cyanobacterial poisoning of humans and animals has been reported since the 1800s
(Carmichael 1994). A bloom in Lake Bonney, South Australia, in 1959, claimed the lives
of approximately 300 sheep, five cattle and one horse (Hallegraeff 1992). The 1996 death
of 56 haemodialysis patients in a Brazil clinic was confirmed to be a result of microcystin
in treatment water (Carmichael 2001; Jochimsen et al. 1998).
Microcystin-LR is probably responsible for the most common cyanobacterial toxicosis,
acute hepatotoxicosis (Carmichael 1997). Symptoms of this condition include weakness,
anorexia, pallor, cold limbs, breathing difficulties, vomiting and diarrhea, sometimes
leading to death within days or hours (Carmichael 1992). The toxin causes separations of
liver cells leading to blood accumulations and hepatocyte necrosis, which may result in
death by hemorrhaging shock or liver failure (Carmichael 1997; Bhattacharya et al.
1997).
There has also been evidence to suggest that microcystins may cause liver cancer
(Carmichael 1992; Carmichael 1997; Nishiwaki-Matsushima et al. 1992; Tsuji et al.
1997; Ueno et al. 1996), and in Florida a correlation has been found between liver cancer
and residents’ proximity to wastewater treatment plants, where cyanobacteria may bloom
in treatment ponds (Fleming et al. 2002). A similar correlation was found with
cyanobacterially contaminated ponds, ditches and rivers in the Jian-Su and Guangxi
provinces of China (Ueno et al. 1996). Hence it is of importance to public health that the
formation and destruction of cyanobacterial blooms and cyanotoxins be investigated.

26 2. Literature Review
2.3.5 World Health Organization guidelines
Microcystin-LR is the microcystin variant specified under the WHO Guidelines for
Drinking Water Quality (1993). In drinking water, total microcystin-LR (sum of the
intracellular and extracellular concentrations) must be found below 1 μgL-1. This is a
provisional guideline, as the health effects of microcystin-LR are not known
quantitatively (World Health Organization 1993). The WHO daily tolerable intake for
microcystin-LR is 40 ngkg-1 body weight (Chorus and Bartram 1999). In recreational
waters, the World Health Organization recommends a guideline level of 100 000 cells
mL-1 for Microcystis aeruginosa, which equates to approximately 20 μgL-1 of
microcystin-LR (World Health Organization 2003).
Although microcystin-LR is the most toxic of the microcystin family, it is often not the
most prevalent. Utilising the 1 μgL-1 limit for other species of microcystins assumes
higher than actual toxicity, but, due to algal blooms often containing several microcystin
variants, this assumption is often necessary (Chorus and Bartram 1999).
2.4 Detection of cyanobacteria by fluorometry
2.4.1 Fluorescence of cyanobacteria
Most current techniques for measuring cyanobacterial biomass are constrained by a lack
of in situ and temporal resolution (Beutler et al. 2002), high associated maintenance costs
and low specificity and sensitivity (Leboulanger et al. 2002). A method which has proven
successful in identifying algal groups in prior studies is spectrofluorescence, particularly
when performed over multiple wavelengths (Beutler et al. 2002). This classification
process is based upon the fluorescence of the photosynthetic pigment chlorophyll a,
which is found in all phytoplankton species (Gregor and Marsalek 2004). Chlorophyll a
concentrations can be utilised to determine total biomass, depending on the average
chlorophyll a concentration of a cell. In cyanobacteria, a chlorophyll a concentration of
50μgL-1 is indicative of a cell density of approximately 106 cells mL-1 (World Health
Organization 2003).

2. Literature Review 27
During photosynthesis, energy not utilised by photosystem II for photochemistry is
emitted by chlorophyll a, from the antenna system, as red light (Gregor and Marsalek
2004). This fluorescence is a measure of the photosynthetic electron transfer rate of the
organism (Beutler et al. 2002), dependent on the chlorophyll a concentration. Each algae
group has a slightly different fluorescence spectrum dependent on its composition (van
den Hoek et al. 1995). Cyanobacteria fluoresce at approximately 650nm, though this can
vary slightly under differing light conditions, nutrient availability, cell age and cell
history (Gregor et al. 2007).
2.4.2 Traditional chlorophyll a detection method
The traditional chlorophyll a detection method is outlined by the ISO 260 (1992) method.
Phytoplankton samples are collected on a filter and extracted with hot ethanol, followed
by acidification and measurement of light absorbance (Gregor et al. 2007). The total
chlorophyll a content is calculated from absorbance measurement, however this method
often results in high within sample variance, dependent on the equation utilised to
determine concentrations (Gregor and Marsalek 2004), and is extremely time consuming.
2.4.3 Multispectral fluorescence analysis
Multispectral fluorescence probes utilise diodes which emit light at 450nm, 525nm,
570nm, 590nm and 370nm (Gregor and Marsalek 2004). Such probes determine the
chlorophyll a concentrations of several algal groups, including chlorophyta,
cyanobacteria, diatoms and cryptophyta, as well as yellow substances. Concentrations are
determined by comparison of fluorescence with normal curves for each species (Gregor
and Marsalek 2004; Beutler et al. 2002).
The bbe-Moldaenke Fluoroprobe (Figure 6) is a submersible probe which performs
multispectral fluorescence and can be used both in the laboratory and in situ (Beutler et
al. 2002). In situ spectrofluorescence allows for the detection of spatial and temporal
variations in concentrations, and is a rapid and continuous monitoring method. It also

28 2. Literature Review
requires less skill than the traditional methods of microscopic identification and counting
(Leboulanger et al. 2002; Gregor et al. 2007; Beutler et al. 2002).
Errors in chlorophyll a detection by the bbe-Moldaenke FluoroProbe may arise from the
shading, scattering or reabsorption of light emitted from the diodes, or the fluorescence
response of other chemicals within the pelagic column (Gregor and Marsalek 2004).
Studies have also suggested that non-linear concentration responses may occur for total
chlorophyll a concentrations above 50μL-1 (Gregor and Marsalek 2004). Leboulanger et
al. (2002) determined that fluorescence quenching errors could occur due to
photoinhibition, decreasing the measured concentrations of chlorophyll a.
Figure 6: bbe-Moldaenke FluoroProbe assembled for laboratory use

2. Literature Review 29
2.4.4 Comparison of fluorescence analysis methods
Results of phytoplankton chlorophyll a measurements by multispectral fluorescence
analysis utilising the bbe-Moldaenke FluoroProbe and the standard extraction method
have been compared. The methods are highly correlated with an r-squared value of 0.97
(Gregor and Marsalek 2004), and multispectral fluorescence analysis also correlated well
with microscopic cell counts (Leboulanger et al. 2002). However, the multispectral probe
measured consistently lower values than the standard extraction method, likely due to the
calibration of the instrument by High Performance Liquid Chromatography (HPLC),
which separates some microcystin isomers which fluoresce at 665nm (Gregor and
Marsalek 2004), and thus such compounds are excluded from chlorophyll a
measurements by the FluoroProbe.
2.5 Detection of cyanobacterial toxins
Many studies have been conducted into the detection of cyanobacterial toxins, and
current analytical procedures can only detect the compounds in the dissolved state
(Nicholson and Burch 2001). Thus the determination of extracellular cyanotoxins is
possible, but to determine intracellular toxins, or the total toxins in a sample, cell lysis
must be induced. This is normally performed by freeze drying the sample, followed by
freeze thawing or sonication in solution (Nicholson and Burch 2001). It has been
determined that sonication is more effective at cell lysis than freeze thawing, indicating
that past studies utilising the thawing method may have underestimated toxin
concentrations (Rapala et al. 2002). The cyanotoxins are then extracted using water and
organic solvents, with ratios specific to the toxin to be extracted (Nicholson and Burch
2001).
A range of techniques are available for qualifying and quantifying the toxins present in
water samples. These include both qualitative and quantitative physicochemical and
biological methods (Svrcek and Smith 2004). The method to be utilised can be
determined by rapid screening methods such as microscopic examination (Harada et al.
1999). The most common physicochemical analysis method for microcystins is HPLC

30 2. Literature Review
coupled with UV, PDA or MS analysis. Biological methods include bioassays, PPIA and
ELISA. The methods differ in their accuracy, specificity, mode of detection, ease of use
and time requirements (Ward et al. 1997). For microcystins to be detected, the toxin must
be able to be unequivocally defined, an analytical standard present, and a LD50 dosage
known for the specific compound, so that toxins can be converted to toxicity values
relative to microcystin-LR (Nicholson and Burch 2001).
2.5.1 High Performance Liquid Chromatography
HPLC is a sensitive detection method which is often coupled with single wavelength UV
analysis, PDA or MS. The long history of HPLC in laboratories means it is a well
documented and refined method of chemical identification (Nicholson and Burch 2001).
HPLC-UV analysis observes the UV response of samples at a single wavelength, 238nm.
However, microcystins with aromatic acid constituents absorb at approximately 222nm
(Lawton et al. 1994). This results in single wavelength UV detection being a poor method
compared to MS and PDA, due to its low sensitivity and selectivity (Perez and Aga
2005).
The most common method for detecting microcystins is HPLC coupled with PDA
(Hyenstrand et al. 2001). HPLC-PDA is a sensitive detection method which satisfactorily
separates most microcystins on a chromatography column prior to identification by photo
diodes (Nicholson and Burch 2001). HPLC-PDA records not only the UV-response of the
compound, but also the spectrum of the analyte over various wavelengths (Nicholson and
Burch 2001).
HPLC-MS is another sensitive identification technique, but as such incurs very large
costs, and is not widely used for microcystin detection. As several microcystins are of
equivalent molecular mass, identification of intact compounds can be difficult
(McElhiney and Lawton 2005), and several microcystins have equivalent responses to
PDA (Nicholson and Burch 2001). However, microcystins produce unique patterns of
ions in the mass spectra, meaning HPLC-MS is a highly accurate identification technique
(Namikoshi et al. 1992; Kondo et al. 1992; Rinehart et al. 1994; Lawton et al. 1995). The

2. Literature Review 31
sensitivity of HPLC-MS can be further improved by the use of SIM, SRM, or MRM
(Perez and Aga 2005).
A major drawback to the use of HPLC is the lack of commercially available microcystin
standards, making identification difficult (Rapala et al. 2002; Mountfort et al. 2005),
often leading to an overestimation of toxicity by assuming the toxin is microcystin-LR
(Nicholson and Burch 2001). Thus there has been interest from the scientific community
into the production of Certified Reference Materials to assist in toxin detection via this
method. HPLC is time consuming and expensive, and difficult to calibrate to be
quantitatively accurate (Rapala et al. 2002).
2.5.2 Bioassay
The traditional method for determining toxicity is through the use of animal based assays.
In particular, mouse bioassays have been widely utilised in the past, though for the
detection of microcystins they have very limited sensitivity, are non-specific to various
toxins, and have poor reproducibility (Chorus and Bartram 1999; Chu et al. 1990; Perez
and Aga 2005). Other bioassays have been investigated for quantifying and qualifying
microcystins, including an African locust (Hiripi et al. 1998), larvae of the crustacean
Thamnocephalus platyurus (Torokne et al. 2000) and species of the genera Daphnia
(Kyselkova and Marsalek 2000). However, these organisms are also unable to distinguish
between various cyanobacterial toxins. Considering the growing public opposition to
toxicity testing on live animals (Falconer 1993), it may be considered morally
unacceptable to utilise animals to obtain quantitative data on toxins, especially when such
accuracy requires the infection of many specimens (Nicholson and Burch 2001).
2.5.3 Protein Phosphatase Inhibition Assays
PPIAs utilise microcystins’ mode of toxicity, by binding to a subunit of protein
phosphatases 1 and 2A in an irreversible fashion (Carmichael and An 1999; Ward et al.
1997). After the addition of a water sample to a protein phosphatase 1 or 2A plate, p-

32 2. Literature Review
nitrophenyl phosphate is added. Where protein phosphatase has already bound
microcystins, it will not react with the additive. Unbound protein phosphatase
dephosphorylates the compound, forming the yellow coloured compound p-nitrophenyl
(Carmichael and An 1999). Thus an increase in colour indicates a low concentration of
microcystins in the water sample, whilst a colourless or pale solution indicates high
microcystin concentrations (Carmichael and An 1999). Quantitative concentrations can
be determined by the use of spectrophotometric plate readers.
Although PPIA results correlate well with HPLC at high concentrations of toxins
(Carmichael and An 1999; Rapala et al. 2002; Heresztyn and Nicholson 2001), results
lack agreeability with other methods at low toxin concentrations (Perez and Aga 2005;
Heresztyn and Nicholson 2001), and PPIA cannot be used where the third amino acid of
the microcystin is aspartic acid (Rapala et al. 2002). PPIA also binds to other protein
phosphatase inhibitors such as okadaic acid, cayculin A and tautomycin (Metcalf et al.
2001), and has varying specificity for different toxins (Carmichael and An 1999;
Mountfort et al. 2005; Chorus and Bartram 1999). The detection method is based on
microcystins’ activity, not structure (Carmichael and An 1999), and as protein
phosphatase 2A inhibits microcystins approximately 50 times more than protein
phosphatase 1, results can differ significantly between the two tests (Heresztyn and
Nicholson 2001).
The main detection issue for PPIA is the occurrence of false positives due to its ability to
react with other protein phosphatases within samples. However, methanol extraction of
the samples, or the application of molecular sieves prior to analysis, have been shown to
significantly reduce such reactivity (Carmichael and An 1999). A study by Heresztyn and
Nicholson (2001) displayed that detection of microcystins by PPIA was not affected by
up to 50% methanol in applied abstracts.
PPIA is a cheap detection method which gives reasonable results when applied to water
samples, without the necessity for sample cleanup or pre-concentration (Rapala et al.
2002). However, because there is no known direct relationship between enzyme
inhibition and mammal toxicity, data suggests that these assays may overestimate sample
toxicity (Nicholson and Burch 2001).

2. Literature Review 33
2.5.4 Enzyme Linked Immunosorbent Assays
ELISA methods have high sensitivity and are easy to use; their sensitivity depends upon
the cross-reactivity of microcystins, determined by their similarity in chemical structure
to other antibodies. ELISA tests have sensitivity in the range of parts per billion
(Carmichael and An 1999), and are best suited to water bodies with consistent toxin
profiles (Nicholson and Burch 2001).
ELISA test kits can be purchased commercially, and are based upon polyclonal
antibodies that bind microcystins (Carmichael and An 1999; Engstrom-Ost et al. 2002).
The first ELISA plate was designed and tested by Chu et al. (1990), and consisted of a
plate coated with anti-microcystin-variant leucine-arginine antibody, where microcystin-
LR peroxidase was used as an enzyme marker. The peroxidase competed with the
microcystin-LR in the water sample for binding sites of the antibody attached to the plate
(Carmichael and An 1999). Since this, two forms of ELISA have been developed, direct
and indirect.
Direct ELISA follows the principles of Chu et al. (1990), where an anti-microcystin
antibody is attached to a microtiter plate, and microcystin-LR peroxidase competes with
microcystin in the sample for binding sites (Carmichael and An 1999). Indirect ELISA
utilises two antibodies, microcystin-LR-bovine serum albumin, which is allowed to react
with the water sample first, a horseradish peroxidase conjugated goat IgG antibody,
which develops the colour of the plate, and a stop solution containing dilute sulfuric acid
(Figure 7), allowing for spectrophotometric measurement (Carmichael and An 1999).
ELISA is convenient to use and allows for rapid determination of microcystin
concentration (Mathys and Surholt 2004; Rapala et al. 2002). In several studies, results
have been comparable to those collected via HPLC-PDA or LC-MS (Fastner et al. 2002;
Rapala et al. 2002; Mathys and Surholt 2004). However, in a study where microcystin
concentration was determined in animal livers, ELISA determined concentrations to be
greater than one thousand times higher than results measured by LC-MS and GC-MS. It
has been inferred that this was due to cross-reactivity of the plates with a liver
component, rather than microcystin-LR (Orr et al. 2003).

34 2. Literature Review
ELISA detection provides approximately equivalent responses for microcystin-LR, YR
and RR (Mountfort et al. 2005), and concentrations determined from ELISA kits are
expressed in terms of microcystin-LR equivalents (McElhiney and Lawton 2005).
However, other microcystin variants show different responses, and thus accurate analysis
is unlikely in samples where several microcystins are present (Perez and Aga 2005).
Figure 7: Adding the Stop Solution to samples on an ELISA plate (Barrington 2007)
2.5.5 Other methods
Several other methods of detecting cyanobacterial toxins have been investigated, but
most require further testing before they can be implemented as viable indicators of toxin
concentrations.
Electrochemical detection has shown promise, although it is unable to detect microcystins
that do not contain arginine, tryptophan or tyrosine (Meriluoto et al. 1998). Capillary
electrophoresis lacks sensitivity and has not yet been sufficiently developed to become a

2. Literature Review 35
monitoring tool (Boland et al. 1993; Onyewuenyi and Hawkins 1996; Bouaicha et al.
1996; Bateman et al. 1995; John et al. 1997; Siren et al. 1999). TLC has been investigated
by separating toxin components followed by examination of the UV spectra of the
components on the plates, although it is not yet a robust detection method (Poon et al.
1987; Al-Layl et al. 1988; Ojanpera et al. 1995; Pelander et al. 1996; Pelander et al.
1998). The oxidation of microcystins to produce MMPB, which can then be detected
using GC, GC combined with MS (Sano et al. 1992; Kaya and Sano 1999; Tanaka et al.
1993) or HPLC combined with fluorescence studies (Sano et al. 1992) has shown good
results in trials, though it is unable to differentiate between toxins.
2.5.6 Comparison of detection methods
Although the common cyanobacterial toxin detection methods show promise in
determination of concentrations in water samples, none alone provide precise
measurement of total concentration, toxicity, and the various microcystins present
(Harada et al. 1999). Immunoassays have detection limits 10-2-10-5 lower than
physicochemical methods (Codd et al. 2001), allowing for detection where algal blooms
may not yet be evident.
A study by Fastner et al. (2002) provided 31 international laboratories with a standard
sample of microcystin-LR, and an environmental sample. Various laboratories analysed
the samples using the methods HPLC-PDA, HPLC-UV, HPLC-MS, ELISA and PPIA.
ELISA kits showed significantly higher reproducibility than other detection methods for
the standard sample, though all results correlated well. Thus it may be inferred that the
precision of each detection method is comparable, and should be chosen based on the
availability of instrumentation, time and monetary constraints, and whether toxicity,
microcystin profile or overall concentration are of most importance.

36 2. Literature Review
2.5.7 Potential problems with analysis
Several problems have arisen during laboratory analysis of microcystins. At current, even
practices which show good results have some associated errors arising from their method,
and attempts should be made to minimise such errors during analysis.
Several studies have determined that plastics should be avoided, wherever possible, in
microcystin analysis. It has been shown that final microcystin concentrations were lower
using plastic rather than glass equipment (Metcalf et al. 2000b; Rapala et al. 2002;
Hyenstrand et al. 2001). This is possibly due to hydrophobic interactions between
microcystins and plastic surfaces (Hyenstrand et al. 2001). Another problem is that
common additives present in the lab ware absorb at 238nm, and could thus affect
spectrophotometric analysis (Ikawa et al. 1999).
Methanol has posed some issues in microcystin analysis (Hyenstrand et al. 2001).
Methanol concentrations up to 30% have been shown to produce false positive results
when using an ELISA method, and may also remove ELISA components from microtiter
plate wells (Metcalf et al. 2000b). However, the addition of methanol does appear to
decrease microcystin interactions with plastic surfaces (Hyenstrand et al. 2001). Thus,
although methanol is a useful solvent throughout the extraction process, it should be
removed prior to ELISA analysis, and samples dissolved in pure distilled water before
addition to wells.
Storage of cyanobacterial samples has been shown to affect concentrations of
microcystins. In the presence of pigments, degradation of microcystins can occur rapidly,
leading to underestimates of toxin concentrations (Nicholson and Burch 2001; Tsuji et al.
1994). Alternatively, cyanobacteria may grow significantly during long distance
transport, resulting in the overestimation of microcystin concentrations (Jia et al. 2003).
2.6 Prevention of high cyanobacterial concentrations
Several methods of preventing algal blooms have been suggested, including reducing
nutrient inputs to prevent eutrophication (Svrcek and Smith 2004), altering the
hydrophysical conditions to favour those of other phytoplankton (Hrudey et al. 1999),

2. Literature Review 37
destratifying the water body by aeration or mechanical mixers (Svrcek and Smith 2004)
or destroying cyanobacterial gas vacuoles by ultrasonic radiation (Nakano et al. 2001).
Chemically treating water to remove cyanobacteria and their toxins should not be
implemented unless physical measures such as barriers, offtake by bank filtration and a
variation of intake depth have been trialed for both prevention and degradation (Hitzfeld
et al. 2000). If such techniques are unsuccessful, chemical treatment may be the only
viable treatment option.
2.7 Degradation and removal of cyanobacteria and cyanotoxins
Many artificial methods for both destroying cyanobacterial blooms and degrading
cyanobacterial toxins have been investigated in the past three decades. Some common
degradation methods include dilution, adsorption, consumption, flocculation, bacterial
degradation, chemical degradation and photolysis (Jones and Orr 1994; Tsuji et al. 1994;
Lahti et al. 1997; Welker et al. 2001). Several such methods also destroy other algal
species, though often the decay of other species is not as pronounced (Yousef et al.
2003).
Cyanobacterial toxins differ in their retention time in water bodies (Sivonen and Jones
1999; Chorus 2001; Welker et al. 2001), though a study by Welker and Steinberg (2000)
estimated the half-lives of various microcystins to be approximately 90-120 days within
both natural and artificial water bodies. Natural removal of cyanotoxins from water
bodies is likely due to native bacteria (Bourne et al. 1996; Cousins et al. 1996; Park et al.
2001; Christoffersen et al. 2002; Rapala et al. 2005). Microcystins are relatively stable if
left untreated, though photolytic degradation can occur very quickly in waters where
pigment concentrations are high (Tsuji et al. 1994).
2.7.1 Copper reagents
Using a chelated organic copper algicide on Microcystis aeruginosa has been shown to
induce rapid cell lysis, followed by the release of cyanotoxins to the water column.

38 2. Literature Review
Following application to a lake, toxins around the banks remained constant for
approximately nine days, followed by a 90-95% reduction within the next three (Jones
and Orr 1994). Murray-Gulde et al. (2002) found that although copper reagents were
effective at causing cell lysis, they had very small margins of safety between which
application was effective and aquatic biota were harmed. Copper sulphate is the algicide
currently used by the Water Corporation on South-West WWTPs (Dean Puzey pers.
comm. 2007).
2.7.2 Chlorine reagents
Chlorine compounds remove cyanobacterial toxins at varying pH values, with the
optimum rate occurring at pH below 8 (Acero et al. 2005; Nicholson et al. 1994).
However, there is a high possibility that chlorinated by-products are of risk to human and
animal health (Antoniou et al. 2005). In the presence of organic matter, such as humic
and fulvic acids, chlorine may be consumed, producing non toxic by-products (Kull et al.
2006), though in water treatment plants concentrations of organic matter may be too low
to promote this. Preoxidation of the cyanobacteria cells themselves can lead to
trihalomethanes being introduced into the treatment plant (Tsuji et al. 1997).
2.7.3 Permanganate
An oxidation agent used to degrade cyanotoxins is permanganate, where pH does not
appear to significantly influence degradation rates (Rodrıguez et al. 2007). A 1998 study
found that permanganate can reduce microcystin-LR concentrations by 90% within ten
minutes of application (Rositano et al. 1998), and a full-scale trial conducted in
Wisconsin water treatment plants found that permanganate removed approximately 61%
of microcystins (Karner et al. 2001). However, little is known about the possibility of
toxic by-products from permanganate oxidation (Svrcek and Smith 2004).

2. Literature Review 39
2.7.4 Lime and aluminium sulfate
Lime and aluminium sulfate have been investigated as flocculants of cyanobacterial
blooms, such that cells can be removed without inducing cell lysis (Chow et al. 1999;
Lam et al. 1995; Mohamed 2001). Flocculation is the process whereby gentle mixing
encourages particles to aggregate into large flocs, followed by sedimentation, for easier
removal (Svrcek and Smith 2004). Most studies have shown that both lime and
aluminium sulfate are valid flocculation agents for cyanobacteria, and one study
determined that after flocculation microcystins took approximately 26 days to degrade
within the cells (Lam et al. 1995).
2.7.5 Activated Carbon
Activated carbon has been found to assist in cyanotoxin degradation by adsorption, and
has often been coupled with other removal methods. Studies have shown that the
performance of the carbon depends on the particular microcystins and their solubilities
and concentrations, and the dose and origin of the carbon (Lawton and Robertson 1999;
Mohamed et al. 1999). The best performance carbon has been identified as that
originating from wood, followed by coal, where the poorest came from coconuts and
peat-moss (Donati et al. 1994). Lambert et al. (1996) found that by incorporating
coagulation-sedimentation, dual media filtration and chlorination, then activated carbon,
greater than 80% of microcystins could be removed from water.
2.7.6 Filtration
Sand filters are another option for cyanotoxin degradation, and their method of action
appears to work by adsorption and biodegradation (Grutzmacher et al. 2002; Ho et al.
2006). In column tests conducted by Ho et al. (2006) there appeared to be a three day
period before degradation began, with no microcystin detected after four days.
Grutzmacher et al. (2002) conducted degradation through sand filters with both intra and
extracellular cyanotoxins. This study indicated that dissolved cyanotoxins could be

40 2. Literature Review
removed by up to 95%, with half lives of approximately one hour. Biodegradation was
the main removal mechanism and adsorption was slow. Where toxins were primarily
within live cells an 85% reduction was recorded.
Other filtration work has also had positive results for the removal of cyanobacterial
toxins. Even domestic water filters can remove between 10-60% of cyanobacterial cells,
depending on their morphology, although none can do so without several filtration cycles
(Lawton et al. 1998). Reverse osmosis can remove 95-99% of microcystins LR and RR
from salt and tap water (Neumann and Weckesser 1998), and nanofiltration is highly
effective against microcystins due to steric hindrance (Teixeira and Rosa 2006b).
Teixeira and Rosa also found that coupling dissolved gas flotation with nanofiltration
resulted in complete removal of microcystins with an 84% recovery of water (2006a).
2.7.7 Bacteria
Bacterial communities from frequently eutrophic ponds have shown promise as possible
treatment options for degrading microcystins (Christoffersen et al. 2002; Park et al.
2001). Evidence has been gathered to suggest that during the healthy stages of
microcystin blooms, organisms capable of degrading the toxins are established
(Heresztyn and Nicholson 1997).
In one study, microcystin was added to a frequently eutrophic lake containing indigenous
bacteria, and the resulting decrease in both microcystin and dissolved organic carbon
concentrations suggested that microbial activity was degrading both classes of
compounds at comparable rates (Christoffersen et al. 2002). Another study isolated a
bacterium from a hypertrophic lake and determined its ability to degrade microcystins in
a dark laboratory environment (Park et al. 2001). Although promising results have been
gathered, the utilisation of indigenous or introduced bacteria as toxin degraders may not
be feasible for wastewater treatment ponds, especially as repeatability has not yet been
investigated thoroughly.

2. Literature Review 41
2.7.8 Advanced oxidation processes
Oxidation processes which occur at near ambient temperature and pressure are known as
‘advanced oxidation processes’, and generate hydroxyl radicals for use as oxidants (Glaze
et al. 1987).
Ozonation has been found to successfully degrade microcystins, with the greatest rates
achieved at acidic pH values. Rositano et al. (1998) found that ozone removed 99% of
microcystins within the first 15 seconds of application, and Himberg et al. (1989)
determined that the application of ozone and activated carbon completely removed the
toxins. Analysis of the degradation products show they are most likely benign (Brooke et
al. 2006). Apart from expense, the major complication of ozone oxidation is that ozone
prefers to react with dissolved organic carbon than cyanobacterial toxins, which can
significantly impact degradation rates (Rositano et al. 1998).
Many advanced oxidation processes have been found to effectively treat cyanotoxins
through the use of hydrogen peroxide coupled with other chemical or physical methods
(Svrcek and Smith 2004). Hydrogen peroxide is easily degraded by photolysis, and is
thus considered an environmentally benign reactant (Antoniou et al. 2005).
When applied alone, hydrogen peroxide appears relatively ineffective at degrading
cyanobacterial toxins, with only 17% removal recorded 60 minutes after addition
(Rositano et al. 1998). This is likely because, although kinetically the degradation is
favoured, hydrogen peroxide requires a catalyst to produce hydroxyl radicals in
significant amounts (Svrcek and Smith 2004).
Rositano et al. (1998) found that application of ozone and hydrogen peroxide to a
solution of microcystin-LR reduced concentrations by 54% so quickly that researchers
could not determine rates. The same study determined that by combining the application
of hydrogen peroxide with UV irradiation, approximately 50% of microcystin-LR could
be removed within the first 30 minutes. Although this result is numerically not as
significant as some other treatment methods, it is easily the most cost effective in water
treatment plants (Svrcek and Smith 2004), and is environmentally safe as it degrades to
form oxygen gas and water (Barroin and Feuillade 1986). The UV radiation causes
isomerisation of the microcystin and production of hydroxyl radicals from the hydrogen

42 2. Literature Review
peroxide. A study by Bandala et al. (2004) suggests that the rate of degradation by
hydrogen peroxide and UV light can be further increased by the addition of Fenton
reagents, where the addition of iron ions can result in complete degradation of
microcystins in 35-40 minutes.
2.8 Mode of action of hydrogen peroxide
Hydroxyl radicals are the most reactive oxygen species, and are generated from hydrogen
peroxide (Drabkova et al. 2007). Although some radicals are generated in the absence of
UV light, the concentration of hydroxyl radicals, and hence the toxicity of the solution, is
greatly increased by UV irradiance (Drabkova et al. 2007).
2.8.1 Induction of cyanobacterial cell death
A study by Barroin and Feuillade (1986) indicated that for a given set of light conditions,
the concentration of hydrogen peroxide required to substantially decrease photosynthetic
activity in cyanobacteria is likely a threshold value. It is probabilistic that cyanobacteria
are degraded by hydrogen peroxide at much lower concentrations than other algae species
as they are prokaryotic, their photosynthetic apparatus are not contained within
organelles, and thus have a direct connection with the plasma membrane (Barroin and
Feuillade 1986). Hydrogen peroxide inhibits photosynthetic electron transfer in
Photosystem II by inhibiting the ascorbate peroxidase system of hydrogen peroxide
detoxication (Samuilov et al. 2001), and by causing the division of D1 peptide bonds
(Lupinkova and Komenda 2004). D1 is a crucial protein in Photosystem II, and has been
observed by polyacrylamide gel electrophoresis and immunoassays to rapidly disappear
when dosed with sufficient hydrogen peroxide concentrations (Lupinkova and Komenda
2004). Hydrogen peroxide also destroys pigments including billiproteins, carotenoids and
chlorophyll a at low concentrations (Barroin and Feuillade 1986), and inhibits the fixation
of carbon dioxide by attacking enzymes involved in the Calvin cycle (Samuilov et al.
2001).

2. Literature Review 43
2.8.2 Induction of microcystin degradation
Hydroxyl radicals attack the conjugated diene structure of microcystin variants to form
dihydroxylated products. Oxidative cleavage then occurs at the 4-5 and/or 6-7 bonds of
the Adda moiety (Figure 8), effectively destroying the toxicity of the microcystin (Perez
and Aga 2005).

44 2. Literature Review
Figure 8: 1) Hydroxyl radicals attack the 4-5 or 6-7 bonds of the microcystin’s Adda moiety. 2) Bonds 4-5 or 6-7 of Adda become dihydroxylated. 3) Oxidative cleavage of the microcystin molecule occurs at the 4-5 or 6-7 bond of the Adda moiety.
-OH
-OH
1
2
3

3. Methodology 45
3 Methodology
3.1 Sampling and incubation
When sampling to determine water quality, samples should be taken from various points
within the water body to account for horizontal and vertical stratification (Perez and Aga
2005). However, in this study the sample could be taken from any point or depth of the
wastewater treatment pond, as spatial variation was not being considered. An opaque
container was used to transport the samples, as algae can grow during long distance
transport (Jia et al. 2003) and isomerise under UV light (Perez and Aga 2005).
The objective of the laboratory analysis was to determine reaction rates, not toxin
concentrations within the water body. Samples were analysed as soon as possible after
collection, to prevent large changes in toxin concentration due to cell lysis or degradation
(Perez and Aga 2005; Heresztyn and Nicholson 1997). Due to their low tendency to
hydrolyse, the pH of stored samples was not important (Rositano and Nicholson 1994).
3.1.1 Incubation attempt
During the winter months there was a lack of cyanobacterial blooms in South-West
wastewater treatment ponds. Thus water samples were collected from the metropolitan
area and incubated, to determine whether a Microcystis aeruginosa bloom could be
cultured using locally sourced water samples.
Samples suspected to contain Microcystis aeruginosa were collected from several water
bodies (Figure 9) including Ron Stone Park in Mount Lawley, the lake adjacent to Sir
Charles Gairdner Hospital in Nedlands (Figure 10), John Oldham Park in Perth, David
Carr Park in Perth, and at various locations along the Canning River. Several
unconcentrated samples were taken at each site. At each location a concentrated sample
was also collected by filtering large amounts of water using a plankton net. Both
concentrated and unconcentrated samples were incubated at 25 degrees Celsius for one
week under fluorescent light on a 12 hour day/night cycle (Figure 11). However, at one

46 3. Methodology
week’s incubation time, no samples showed a noticeable increase in cyanobacterial
concentration.
Figure 9: Locations of water samples collected in mid-2007 (Google 2007)
PPeerrtthh CCBBDD

3. Methodology 47
Figure 10: Lake adjacent to Sir Charles Gairdner Hospital, Nedlands (Barrington 2007)

48 3. Methodology
Figure 11: Laboratory incubation attempt (Barrington 2007)
3.1.2 Study site
Preliminary samples were collected from the Burekup and Brunswick Junction WWTPs
in the South-West of Western Australia in April 2007 (Figure 12). These samples were
examined under a light microscope, and the presence of Microcystis aeruginosa was
confirmed. There appeared to be a decrease in cyanobacterial concentration as the
wastewater passed through the treatment stages. Water from both plants was deemed
suitable for analysis, though the Brunswick Junction samples did display lower
cyanobacterial levels due to the application of copper sulfate as an algicide.

3. Methodology 49
Figure 12: Collecting concentrated samples by use of a plankton net (Barrington 2007)
In situ spectrofluorescence monitoring during early spring indicated cyanobacterial levels
greater than 50 μgL-1 at the Burekup WWTP. This was considered an appropriate level
for testing the reactions of blooms to hydrogen peroxide dosing using both
spectrofluorescence and ELISA. On several occasions samples were collected from pond
one at the Burekup WWTP. 20 L samples were collected from the centre of the pond by
the use of a metal dinghy powered by oars, so that pelagic water samples could be
collected without disturbing benthic sediments (Figure 13 and Figure 14).

50 3. Methodology
Figure 13: Preparing the boat for sample collection (Barrington 2007)

3. Methodology 51
Figure 14: Rowing the boat to collect samples from Pond 1 of the Burekup WWTP
Carboys of raw water were transported to UWA covered in black plastic, so as to avoid
stimulating photodecomposition or growth. Samples were stored without light at 25
degrees Celsius.
3.2 Determination of chlorophyll a
Raw water samples were analysed within one week of collection, as advised by Harada et
al. (1999). The hydrogen peroxide doses chosen for investigation ranged from 0.00296
gL-1, approximately the highest dosage found to have no effect on microcystin
concentrations (Lawton and Robertson 1999), to 296 gL-1. The upper dosage limit was
equal to the addition of 50% hydrogen peroxide, as purchased by the Water Corporation
for use as an algicide, to raw wastewater at a 1:1 ratio. Although this is likely an
impractical dosage in the field, it gave a fair indication of the effect of excess hydrogen

52 3. Methodology
peroxide on Microcystis aeruginosa and microcystins. The moderate doses considered
were 2.96 gL-1 and 0.0296 gL-1. From this initial investigation, a second hydrogen
peroxide dosing experiment was conducted using hydrogen peroxide concentrations of
0.0296 gL-1, 0.148 gL-1, 0.296 gL-1, 0.740 gL-1 and 1.48 gL-1.
Conical flasks were placed at 25 degrees Celsius under fluorescent lighting, and filled
with 250 mL of raw water. 25 mL of each sample was analysed by spectrofluorescence,
where ten measurements were taken, to determine the original chlorophyll a
concentration, and returned to the flask. 250 mL of each hydrogen peroxide stock
solution, and a control of deionised water, were added to raw water samples in triplicate.
Incubation at 25 degrees Celsius was continued for 48 hours (Figure 15).
Figure 15: Dosed samples undergoing incubation under fluorescent light (Barrington 2007)
The initial sampling period was set at 1 hour, as a study by Rositano et al. (1998) found
that with the application of hydrogen peroxide alone, 17% of toxins were removed within
the hour following application. Measurement of cyanobacterial and total algal biomass

3. Methodology 53
were determined by multiwavelength spectrofluorescence using the bbe-Moldaenke
FluoroProbe, where ten repetitions were performed for each fluorescence measurement.
Chlorophyll a concentrations of chlorophyta, diatoms, cryptophyta and yellow substances
were also measured. 25mL of sample were taken from each flask hourly up to six hours,
and multiwavelength spectrofluorescence performed. Samples were also taken at
approximately 18, 24 and 48 hours after hydrogen peroxide addition, to determine the
longer term reaction characteristics.
Figure 16: Analysing a sample on the bbe-Moldaenke Fluoroprobe (Barrington 2007)
3.3 Determination of extracellular microcystin and nodularin
concentrations
A study by Fastner et al. (2002) determined that microcystin concentration measurements
of adequate precision could be performed by the methods of HPLC-PDA, HPLC-UV,

54 3. Methodology
HPLC-MS, PPIA and ELISA. Chromatographic measurements were deemed too
expensive for this study, and required calibration which was difficult without well
defined microcystin standards (Rapala et al. 2002; Mountfort et al. 2005). Protein
Phosphatase Inhibition Assays were considered cheaper, but have a tendency for the
occurrence of false positives due to the inhibition of other protein phosphatases within
water samples (Carmichael and An 1999), and lack agreeability with other methods at
low concentrations (Perez and Aga 2005; Heresztyn and Nicholson 2001). ELISA
appears to have high reproducibility and sensitivity, and is cheap compared to
chromatographic methods, though a possible error in measurement may arise from cross-
reactivity of coated ELISA plates (Orr et al. 2003). ELISA was chosen as the most
suitable method of analysing microcystin concentrations and degradation rates in water
sampled from wastewater treatment ponds.
Although samples can be pre-concentrated and contaminants, such as dissolved organic
matter, removed using solid phase extraction cartridges (Nicholson and Burch 2001), the
collected water samples had reasonably high cyanobacterial concentrations and were
undergoing ELISA analysis, so did not require cleanup (Harada et al. 1999; Mountfort et
al. 2005; Carmichael and An 1999).
Conical flasks were placed at 25 degrees Celsius under fluorescent lighting, and filled
with 250 mL of raw water. 50 μL of each sample was analysed by ELISA, to determine
the original extracellular microcystin and nodularin concentrations. 250mL of each
hydrogen peroxide stock solution, and a control of deionised water, were added to raw
water samples in duplicate. Incubation at 25 degrees Celsius was continued for 48 hours.
Duplicate samples were taken from each flask hourly up to six hours, and ELISA
performed. Samples were also taken at approximately 18 and 24 hours after hydrogen
peroxide addition and analysed by ELISA to determine the longer term reaction
characteristics.
To determine microcystin concentrations, the Abraxis PN 520011,
Microcystins/Nodularins (ADDA) ELISA Kit, Microtiter Plate (96T) was utilised. This
test kit allows for detection of nodularins, DM-MCRR and MCLR and MC-LR, YR, LF,
RR and LW, with a minimum detection limit of 0.1 ppb. At each time step, duplicate

3. Methodology 55
50 μL aliquots of each sample were pipetted onto the microtiter plate coated with an
analog of microcystins conjugated to a protein. 50 μL of an antibody solution was then
pipetted into each well (Figure 17), and the samples incubated at room temperature for 90
minutes. Wells were emptied and washed with 250 μL of wash solution and dried on
paper towels. 100 μL of enzyme conjugate was added to each well and incubated for 30
minutes. Wells were again emptied and washed, and 100 μL of horseradish peroxidase
added to each well. Samples were incubated for 20 minutes, in the absence of light,
before the addition of 50 μL of stop solution. The microtiter plate was then placed in a
Mertech Inc. AccuReader 965 to determine the absorbance of each sample, and hence its
microcystin concentration.
Figure 17: Adding 50 μL of antibody solution to samples

56 3. Methodology
3.4 Data Analyses
3.4.1 Chlorophyll a concentration
At each time step, ten fluorescence measurements were taken using the bbe-Moldaenke
FluoroProbe. These values were averaged and their standard deviation calculated.
Chlorophyll a concentrations contributed by cyanobacteria, chlorophyta, diatoms,
cryptophyta and their sum were expressed as percentages of their original concentration,
and normalised to the control chlorophyll a values over the 48 hour incubation period.
Exponential decay curves were fit to the normalized concentration curves for each
hydrogen peroxide dose over time. r2 and ANOVA probability values were calculated to
determine whether the exponential fits were statistically significant. These fits also
provided equations for the curves and their associated error values.
To determine the cyanobacterial and total algal decay rates without normalising to the
control, exponential decay curves were fit to each repetition of each hydrogen peroxide
dose and normalised. r2 and ANOVA probability values were calculated to determine
whether the exponential fits were statistically significant. These fits again provided
equations for the curves and their associated error values.
3.4.2 Extracellular microcystin and nodularin concentrations
Extracellular microcystin and nodularin concentrations determined by ELISA were
plotted over time. As all values were below the minimum detection limit of 0.1 μgL-1,
further analysis of this data was not possible.

4. Results 57
4 Results
4.1 Cyanobacterial biomass
4.1.1 In situ monitoring
In situ monitoring of chlorophyll a levels in the three pond system at Burekup WWTP
indicated significant levels of algae throughout the process, gradually decreasing as the
wastewater passes through the treatment stages (Figure 18)
Algal species
Chlorophyta Cyanobacteria Diatoms Cryptophta Yellow Substances Total Algae
Chl
orop
hyll
a (u
g/L)
0
50
100
150
200
250
300
350
Pond 1Pond 2Pond 3
Figure 18: In situ chlorophyll a monitoring, Burekup WWTP. Standard error bars are shown but are small in comparison to chlorophyll a values
4.1.2 Fluoroprobe investigation 1
An initial investigation was performed by dosing raw water samples with hydrogen
peroxide concentrations of 0.00296 gL-1, 0.0296 gL-1, 2.96 gL-1 and 296 gL-1. Results of
the total algal and cyanobacterial chlorophyll a concentration over a 45 hour period

58 4. Results
(Figure 19 and Figure 20) allowed for the determination of a smaller concentration range
to be investigated on a second set of raw water samples.
Time since hyrogen peroxide addition (hours)
0 10 20 30 40 50
Perc
ent o
f orig
inal
con
cent
ratio
n
0
50
100
150
200
250
Control0.00296 g/L0.0296 g/L2.96 gL296 g/LExponential Fit BlankExponential Fit 0.00296 g/LExponential Fit 0.0296 g/LExponential Fit 2.96 g/LExponential Fit 296 g/L
Figure 19: Total algal chlorophyll a concentration over time after dosing with various concentrations
of hydrogen peroxide ranging from 0 to 296 gL-1. Error bars represent the standard error, where ten
fluorescence measurements were taken for each repetition.

4. Results 59
Time since hydrogen peroxide addition (hours)
0 10 20 30 40 50
Per
cent
of o
rigin
al c
once
ntra
tion
0
20
40
60
80
100
120
140
Control0.00296 g/L0.0296 g/L2.96 g/L296 g/LExponential Fit ControlExponential Fit 0.00296 g/LExponential Fit 0.0296 g/LExponential Fit 2.96 g/LExponential Fit 296 g/L
Figure 20: Cyanobacterial chlorophyll a concentration over time after dosing with various
concentrations of hydrogen peroxide ranging from 0 to 296 gL-1. Error bars represent the standard
error, where ten fluorescence measurements were taken for each repetition.
4.1.3 Fluoroprobe investigation 2
The initial Fluoroprobe investigation indicated that a practical hydrogen peroxide dose
for reducing cyanobacterial and total algal biomass in wastewater treatment ponds was
between 0.00296 gL-1 and 2.96 gL-1. Hence raw water samples were dosed with hydrogen
peroxide concentrations of 0.0296 gL-1, 0.148 gL-1, 0.296 gL-1, 0.740 gL-1 and 1.48 gL-1.
A highly visible difference was observed between samples of various doses at 24 hours
incubation time (Figure 21 and Figure 22). This was further confirmed by chlorophyll a
data for the algal species cyanobacteria, chlorophyta, diatoms and their sum (data
provided in Appendix A).

60 4. Results
Figure 21: Dosed samples at 24 hours incubation. Left sample is a deionised water control, the right sample has been dosed with 1.48gL-1 hydrogen peroxide (Barrington 2007)

4. Results 61
Figure 22: Dosed samples at 24 hours incubation time. From left: control, 0.0296 gL-1, 0.148 gL-1, 0.296 gL-1, 0.740 gL-1, 1.48 gL-1 (Barrington 2007)
Data for chlorophyll a concentration was converted to a percentage of the original
concentration for that replicate, and normalised relative to a raw water sample dosed with
deionised water (the control). An exponential decay curve was plotted for each dosage
and each algal species, where
[Chl a] = [Chl a]0e-bt
[Chl a] = The chlorophyll a concentration at a given time t (relative to control)
[Chl a]0 = The initial chlorophyll a concentration (t=0) (relative to control)
b = First order rate constant (hour-1)
t = Time since hydrogen peroxide addition (hours)

62 4. Results
4.1.3.1 Total Algal Chlorophyll a
The total algal chlorophyll a concentration, normalised to the deionised water blank,
showed statistically significant exponential decay for concentrations of 0.148 gL-1 and
above (Figure 23 and Table 2). Hydrogen peroxide doses of 0.00296 gL-1 and 0.0296 gL-1
did not induce significant chlorophyll a decay over time.
Time since hydrogen peroxide addition (hours)0 10 20 30 40 50
Tota
l alg
al C
hl a
con
cent
ratio
n no
rmal
ised
to c
ontro
l
0.0
0.2
0.4
0.6
0.8
1.0
1.2
1.4
1.6
1.8
0.00296 g/L0.0296g/L0.148 g/L 0.296 g/L0.740 g/L1.48g/L2.96g/L296g/LExponential Fit 0.00296g/LExponential Fit 0.0296g/LExponential Fit 0.148g/L Exponential Fit 0.296g/LExponential Fit 0.740 g/LExponential Fit 1.48 g/LExponential Fit 2.96 g/LExponential Fit 296 g/L
Figure 23: Total algal chlorophyll a concentration normalised to the control. Error bars represent the standard error, where ten fluorescence measurements were taken for each repetition.
Table 2: Statistical analysis of total algal chlorophyll a concentration normalised to the control
H2O2 dose (gL-1) a b r2 ANOVA Regression probability
Statistically significant (P<0.01)?
0.00296 ± 0.00004 0.9788 ± 0.1221 0.0021 ± 0.0080 0.0117 0.7816 No 0.0296 ± 0.0003 0.4770 ± 0.1213 0.0000 ± 0.0141 0.0000 1.0000 No
0.148 ± 0.002 0.8943 ± 0.0877 0.2381 ± 0.0471 0.8981 <0.0001 Yes 0.296 ± 0.002 1.0935 ± 0.0899 0.1376 ± 0.0291 0.9221 <0.0001 Yes 0.740 ± 0.002 1.3323 ± 0.1857 0.2150 ± 0.0630 0.8276 0.0003 Yes 1.48 ± 0.02 1.3492 ± 0.1600 0.1569 ± 0.0447 0.8611 0.0001 Yes 2.96 ± 0.02 1.0866 ± 0.0619 0.1606 ± 0.0218 0.9644 <0.0001 Yes
296 ± 1 1.0270 ± 0.0746 0.6045 ± 0.0827 0.9472 <0.0001 Yes

4. Results 63
4.1.3.2 Cyanobacteria
The cyanobacterial chlorophyll a concentration, normalised to the control, showed
statistically significant exponential decay for all concentrations of 0.148 gL-1 and above,
though interestingly not for the highest concentration of 296 gL-1 (Figure 24 and Table 3).
Hydrogen peroxide doses of 0.00296 gL-1 and 0.0296 gL-1 did not induce significant
chlorophyll a decay over time.
Time since hydrogen peroxide addition (hours)0 10 20 30 40 50C
yano
bact
eria
Chl
a c
once
ntra
tion
norm
alis
ed to
con
trol
0.0
0.2
0.4
0.6
0.8
1.0
1.2
1.4
0.00296 g/L0.0296 g/L0.148 g/L0.296g/L0.740 g/L1.48 g/L2.96 g/L296g/LExponential Fit 0.00296 g/LExponential Fit 0.0296g/LExponential Fit 0.148 g/LExponential Fit 0.296 g/LExponential Fit 0.740 g/LExponential Fit 1.48g/LExponential Fit 2.96 g/LExponential Fit 296 g/L
Figure 24: Cyanobacterial chlorophyll a concentration normalised to the control. Error bars represent the standard error, where ten fluorescence measurements were taken for each repetition.
Table 3: Statistical analysis of cyanobacterial chlorophyll a concentration normalised to the control
H2O2 dose (gL-1) a b r2 ANOVA Regression probability
Statistically significant (P<0.01)?
0.00296 ± 0.00004 0.9087 ± 0.0956 0.0089 ± 0.0083 0.1787 0.2570 No 0.0296 ± 0.0003 0.5848 ± 0.0978 0.0000 ± 0.0092 0.0000 1.0000 No
0.148 ± 0.002 0.9713 ± 0.0759 0.1892 ± 0.0328 0.9210 <0.0001 Yes 0.296 ± 0.002 1.1105 ± 0.0944 0.2520 ± 0.0422 0.9251 <0.0001 Yes 0.740 ± 0.002 1.1024 ± 0.0881 0.4256 ± 0.0614 0.9400 <0.0001 Yes 1.48 ± 0.02 1.0814 ± 0.1011 0.2817 ± 0.0497 0.8929 <0.0001 Yes 2.96 ± 0.02 0.9740 ± 0.0385 0.4552 ± 0.0325 0.9837 <0.0001 Yes
296 ± 1 0.8676 ± 0.1532 0.1774 ± 0.0712 0.4323 0.0388 No

64 4. Results
4.1.3.3 Chlorophyta
The chlorophyta chlorophyll a concentration, normalised to the control, showed
statistically significant exponential decay for all concentrations of 0.148 gL-1 and above
(Figure 25 and Table 4). Hydrogen peroxide doses of 0.00296 gL-1 and 0.0296 gL-1 did
not induce significant chlorophyll a decay over time.
Time since hydrogen peroxide addition (hours)0 10 20 30 40 50C
hlor
ophy
ta c
hl a
con
cent
ratio
n no
rmal
ised
to c
ontro
l
0.0
0.5
1.0
1.5
2.0
0.00296 g/L0.0296 g/L0.148 g/L0.296 g/L0.740 g/L1.48 g/L2.96 g/L296 g/LExponential Fit 0.00296 g/LExponential Fit 0.0296 g/LExponential Fit 0.148 g/LExponential Fit 0.296 g/LExponential Fit 0.740 g/LExponential Fit 1.48 g/LExponential Fit 2.96 g/LExponential Fit 296 g/L
Figure 25: Chlorophyta chlorophyll a concentration normalised to the control. Error bars represent the standard error, where ten fluorescence measurements were taken for each repetition.
Table 4: Statistical analysis of chlorophyta chlorophyll a concentration normalised to the control
H2O2 dose (gL-1) a b r2 ANOVA Regression probability
Statistically significant (P<0.01)?
0.00296 ± 0.00004 0.9941 ± 0.1280 0.0026 ± 0.0084 0.0156 0.7491 No 0.0296 ± 0.0003 0.4489 ± 0.1316 0.0000 ± 0.0162 0.0000 1.0000 No
0.148 ± 0.002 0.8648 ± 0.1040 0.2683 ± 0.0625 0.8571 0.0001 Yes 0.296 ± 0.002 1.1670 ± 0.1028 0.1216 ± 0.0291 0.9097 <0.0001 Yes 0.740 ± 0.002 1.4488 ± 0.2271 0.1837 ± 0.0648 0.7897 0.0006 Yes 1.48 ± 0.02 1.4618 ± 0.1945 0.1408 ± 0.0473 0.8311 0.0002 Yes 2.96 ± 0.02 1.2388 ± 0.1107 0.1181 ± 0.0290 0.9093 <0.0001 Yes
296 ± 1 1.0430 ± 0.0742 0.8116 ± 0.1188 0.9584 <0.0001 Yes

4. Results 65
4.1.3.4 Diatoms
The diatom chlorophyll a concentration, normalised to the control, showed statistically
significant exponential decay for all concentrations of 0.148 gL-1 and above (Figure 26
and Table 5). Hydrogen peroxide doses of 0.00296 gL-1 and 0.0296 gL-1 did not induce
significant chlorophyll a decay over time.
Time since hydrogen peroxide addition (hours)0 10 20 30 40 50 60
Dia
tom
Chl
a c
once
ntra
tion
norm
alis
ed to
con
trol
0.0
0.2
0.4
0.6
0.8
1.0
1.2
1.4
1.6
1.8
0.00296 g/L0.0296 g/L0.148 g/L0.296 g/L0.740 g/L1.48 g/L2.96 g/L296 g/LExponential Fit 0.00296 g/LExponential Fit 0.0296 g/LExponential Fit 0.148 g/LExponential Fit 0.296 g/LExponential Fit 0.74 g/LExponential Fit 1.48 g/LExponential Fit 2.96 g/LExponential Fit 296 g/L
Figure 26: Diatom chlorophyll a concentration normalised to the control. Error bars represent the standard error, where ten fluorescence measurements were taken for each repetition.
Table 5: Statistical analysis of diatom chlorophyll a concentration normalised to the control
H2O2 dose (gL-1) a b r2 ANOVA Regression probability
Statistically significant (P<0.01)?
0.00296 ± 0.00004 0.7483 ± 0.1350 0.0000 ± 0.0108 0.0000 1.0000 No 0.0296 ± 0.0003 0.4383 ± 0.1220 0.0000 ± 0.0154 0.0000 1.0000 No
0.148 ± 0.002 0.8966 ± 0.0874 0.2469 ± 0.0479 0.8987 <0.0001 Yes 0.296 ± 0.002 0.9819 ± 0.0720 0.1215 ± 0.0242 0.9308 <0.0001 Yes 0.740 ± 0.002 1.1875 ± 0.1231 0.2609 ± 0.0529 0.8962 <0.0001 Yes 1.48 ± 0.02 1.2214 ± 0.1130 0.1853 ± 0.0380 0.9129 <0.0001 Yes 2.96 ± 0.02 1.0170 ± 0.0420 0.1943 ± 0.0175 0.9817 <0.0001 Yes
296 ± 1 1.0675 ± 0.0963 0.7154 ± 0.1277 0.9346 <0.0001 Yes

66 4. Results
4.1.3.5 Cryptophyta
The cryptophyta chlorophyll a concentration, normalised to the control, did not display an
obvious growth or decay pattern with the addition of various doses of hydrogen peroxide
(Figure 27).
Time since hydrogen peroxide addition (hours)0 10 20 30 40 50C
rypt
ophy
ta C
hl a
con
cent
ratio
n no
rmal
ised
to c
ontro
l
-200
-100
0
100
200
0.00296 g/L0.0296 g/L0.148 g/L0.296 g/L0.740 g/L1.48 g/L2.96 g/L296 g/L
Figure 27: Cryptophyta chlorophyll a concentration normalised to the control. Error bars represent the standard error, where ten fluorescence measurements were taken for each repetition.

4. Results 67
4.1.3.6 First order rate constants
Exponential decay curves were fitted to each repetition at each hydrogen peroxide
dosage. Regression curves were statistically significant for most hydrogen peroxide
doses, and thus the total and cyanobacterial chlorophyll a degradation first order rate
constants were determined assuming a first order reaction. Such a reaction assumes that
the rate of decay of chlorophyll a is dependent upon its concentration at a given time, and
not upon the hydrogen peroxide concentration. This can be assumed as the hydrogen
peroxide is clearly at a concentration in excess of the chlorophyll a.
First order reaction concentrations can be expressed as:
[Chl a] = [Chl a]0e-bt
Where:
[Chl a] = The chlorophyll a concentration at a given time t
[Chl a]0 = The initial chlorophyll a concentration (t=0)
b = First order rate constant (hour-1)
t = Time since hydrogen peroxide addition (hours)
And, as the rate of decay is dependent upon the concentration at any time t:
d[Chl a]/dt = -b[Chl a]
The rate constant of a reaction is not the rate at which the reaction will occur, but allows
for such a rate to be calculated for given reactant concentrations. Greater rate constants
infer faster decay rates (Atkins 1998). Rate constant values were averaged for each
hydrogen peroxide concentration and the half life determined (Table 15 and Table 25).
4.1.3.6.1 Cyanobacterial chlorophyll a decay
It is apparent from Figure 24 that cyanobacterial chlorophyll a exhibits an exponential
decay function when dosed with hydrogen peroxide above a certain concentration. The

68 4. Results
first order rate constant for each hydrogen peroxide addition was determined (Figure 28
and Table 6, Figure 29 and Table 7, Figure 30 and Table 8, Figure 31 and Table 9, Figure
32 and Table 10, Figure 33 and Table 11, Figure 34 and Table 12, Figure 35 and Table
13, Figure 36 and Table 14).
Time since hydrogen peroxide addition (hours)0 10 20 30 40 50
Cya
noba
cter
ial C
hl a
con
cent
ratio
n (μ
g/L)
0
5
10
15
20
25
30
Repetition 1Repetition 2Repetition 3Exponential Fit Repetition 1Exponential Fit Repetition 2Exponential Fit Repetition 3
Figure 28: Cyanobacterial chlorophyll a decay for the control. Error bars represent the standard error, where ten fluorescence measurements were taken for each repetition.
Table 6: Cyanobacterial first order rate constant for the control
a b r2 ANOVA Regression probability Statistically significant (P<0.01)? 1 19.6502 ± 0.9846 0.0029 ± 0.0030 0.1084 0.3529 No 2 16.1393 ± 1.4204 0.0000 ± 0.0049 0.0000 1.0000 No 3 19.2890 ± 1.6710 0.0000 ± 0.0048 0.0000 1.0000 No Average rate constant N/A
Cyanobacterial chlorophyll a concentration does not exhibit the characteristics of
exponential decay for the control solution.

4. Results 69
Time since hydorgen peroxide addition (hours)0 10 20 30 40 50
Cya
noba
cter
ial C
hl a
con
cent
ratio
n (u
g/L)
0
10
20
30
40
Repetition 1Repetition 2Repetition 3Exponential Fit Repetition 1Exponential Fit Repetition 2Exponential Fit Repetition 3
Figure 29: Cyanobacterial chlorophyll a decay for addition of 0.00296 gL-1 hydrogen peroxide. Error bars represent the standard error, where ten fluorescence measurements were taken for each repetition.
Table 7: Cyanobacterial first order rate constant for addition of 0.00296 gL-1 hydrogen peroxide
a b r2 ANOVA Regression probability Statistically significant (P<0.01)? 1 21.5059 ± 2.9700 0.0125 ± 0.0124 0.1617 0.2833 No 2 21.7947 ± 2.3039 0.0229 ± 0.0127 0.4424 0.0506 No 3 19.1959 ± 1.2643 0.0027 ± 0.0044 0.0541 0.5470 No Average rate constant N/A
Cyanobacterial chlorophyll a concentration does not exhibit the characteristics of
exponential decay for the addition of 0.00296gL-1 hydrogen peroxide.

70 4. Results
Time since hydrogen peroxide addition (hours)0 10 20 30 40 50
Cya
noba
cter
ial C
hl a
con
cent
ratio
n (μ
g/L)
0
2
4
6
8
Repetition 1Repetition 2Repetition 3Exponential Fit Repetition 1Exponential Fit Repetition 2Exponential Fit Repetition 3
Figure 30: Cyanobacterial chlorophyll a decay for addition of 0.0296 gL-1 hydrogen peroxide. Error bars represent the standard error, where ten fluorescence measurements were taken for each repetition.
Table 8: Cyanobacterial first order rate constant for addition of 0.0296 gL-1 hydrogen peroxide
a b r2 ANOVA Regression probability Statistically significant (P<0.01)? 1 3.5206 ± 0.7061 0.0000 ± 0.0111 0.0000 1.0000 No 2 3.1552 ± 0.5031 0.0000 ± 0.0088 0.0000 1.0000 No 3 2.8258 ± 0.4872 0.0000 ± 0.0095 0.0000 1.0000 No Average rate constant N/A
Cyanobacterial chlorophyll a concentration does not exhibit the characteristics of
exponential decay for the addition of 0.0296gL-1 hydrogen peroxide.

4. Results 71
Time since hydrogen peroxide addition (hours)0 10 20 30 40 50
Cya
noba
cter
ial C
hl a
con
cent
ratio
n (μ
g/L)
0
1
2
3
4
5
6
7
Repetition 1Repetition 2Repetition 3Exponential Fit Repetition 1Exponential Fit Repetition 2Exponential Fit Repetition 3
Figure 31: Cyanobacterial chlorophyll a decay for addition of 0.148 gL-1 hydrogen peroxide. Error bars represent the standard error, where ten fluorescence measurements were taken for each repetition.
Table 9: Cyanobacterial first order rate constant for addition of 0.148 gL-1 hydrogen peroxide
a b r2 ANOVA Regression probability Statistically significant (P<0.01)? 1 5.2147 ± 0.3605 0.1808 ± 0.0284 0.9402 <0.0001 Yes 2 5.1204 ± 0.4075 0.1603 ± 0.0308 0.9111 <0.0001 Yes 3 5.3019 ± 0.2613 0.1558 ± 0.0189 0.9677 <0.0001 Yes Average rate constant 0.1656 ± 0.0260 hour-1
Cyanobacterial chlorophyll a concentration exhibits statistically significant exponential
decay for the addition of 0.148 gL-1 hydrogen peroxide.

72 4. Results
Time since hydrogen peroxide addition (hours)0 10 20 30 40 50
Cya
noba
cter
ial C
hl a
con
cent
ratio
n (μ
g/L)
0
5
10
15
20
25
Repetition 1Repetition 2Repetition 3Exponential Fit Repetition 1Exponential Fit Repetition 2Exponential Fit Repetition 3
Figure 32: Cyanobacterial chlorophyll a decay for addition of 0.296 gL-1 hydrogen peroxide. Error bars represent the standard error, where ten fluorescence measurements were taken for each repetition.
Table 10: Cyanobacterial first order rate constant for addition of 0.296 gL-1 hydrogen peroxide
a b r2 ANOVA Regression probability Statistically significant (P<0.01)? 1 19.8787 ± 1.3375 0.1867 ± 0.0279 0.9504 <0.0001 Yes 2 20.2193 ± 2.0014 0.2306 ± 0.0464 0.8981 <0.0001 Yes 3 20.7033 ± 0.6387 0.3172 ± 0.0182 0.9899 <0.0001 Yes Average rate constant 0.2448 ± 0.033 hour-1
Cyanobacterial chlorophyll a concentration exhibits statistically significant exponential
decay for the addition of 0.296 gL-1 hydrogen peroxide.

4. Results 73
Time since hydrogen peroxide addition (hours)0 10 20 30 40 50
Cya
noba
cter
ial C
hl a
con
cent
ratio
n (μ
g/L)
0
5
10
15
20
25
Repetition 1Repetition 2Repetition 3Exponential Fit Repetition 1Exponential Fit Repetition 2Exponential Fit Repetition 3
Figure 33: Cyanobacterial chlorophyll a decay for addition of 0.740 gL-1 hydrogen peroxide. Error bars represent the standard error, where ten fluorescence measurements were taken for each repetition.
Table 11: Cyanobacterial first order rate constant for addition of 0.740 gL-1 hydrogen peroxide
a b r2 ANOVA Regression probability Statistically significant (P<0.01)? 1 21.3287 ± 1.8080 0.3934 ± 0.0605 0.9324 <0.0001 Yes 2 18.6661 ± 0.7536 0.4707 ± 0.0348 0.9851 <0.0001 Yes 3 21.0398 ± 1.6927 0.3979 ± 0.0581 0.9381 <0.0001 Yes Average rate constant 0.4207 ± 0.0524 hour-1
Cyanobacterial chlorophyll a concentration exhibits statistically significant exponential
decay for the addition of 0.740 gL-1 hydrogen peroxide.

74 4. Results
Time since hydrogen peroxide addition (hours) 0 10 20 30 40 50
Cya
noba
cter
ial C
hl a
con
cent
ratio
n (μ
g/L)
0
2
4
6
8
Repetition 1Repetition 2Repetition 3Exponential Fit Repetition 1Exponential Fit Repetition 2Exponential Fit Repetition 3
Figure 34: Cyanobacterial chlorophyll a decay for addition of 1.48 gL-1 hydrogen peroxide. Error bars represent the standard error, where ten fluorescence measurements were taken for each repetition.
Table 12: Cyanobacterial first order rate constant for addition of 1.48 gL-1 hydrogen peroxide
a b r2 ANOVA Regression probability Statistically significant (P<0.01)? 1 6.2759 ± 0.7241 0.2443 ± 0.0550 0.8136 0.0004 Yes 2 5.6769 ± 0.2626 0.2930 ± 0.0252 0.9758 <0.0001 Yes 3 7.0024 ± 0.7523 0.2531 ± 0.0533 0.8713 <0.0001 Yes Average rate constant 0.2635 ± 0.0458 hour-1
Cyanobacterial chlorophyll a concentration exhibits statistically significant exponential
decay for the addition of 1.48 gL-1 hydrogen peroxide.

4. Results 75
Time since hydrogen peroxide addition (hours)0 10 20 30 40 50
Cya
noba
cter
ial C
hl a
con
cent
ratio
n (μ
g/L)
0
5
10
15
20
25
30
Repetition 1Repetition 2Repetition 3Exponential Fit Repetition 1Exponential Fit Repetition 2Exponential Fit Repetition 3
Figure 35: Cyanobacterial chlorophyll a decay for addition of 2.96 gL-1 hydrogen peroxide. Error bars represent the standard error, where ten fluorescence measurements were taken for each repetition.
Table 13: Cyanobacterial first order rate constant for addition of 2.96 gL-1 hydrogen peroxide
a b r2 ANOVA Regression probability Statistically significant (P<0.01)? 1 23.3858 ± 1.5714 0.4347 ± 0.0526 0.9559 <0.0001 Yes 2 25.0197 ± 1.5508 0.5262 ± 0.0601 0.9608 <0.0001 Yes 3 20.3027 ± 1.1020 0.3704 ± 0.0364 0.9672 <0.0001 Yes Average rate constant 0.4438 ± 0.1035 hour-1
Cyanobacterial chlorophyll a concentration exhibits statistically significant exponential
decay for the addition of 2.96 gL-1 hydrogen peroxide.

76 4. Results
Time since hydrogen peroxide addition (hours)
0 10 20 30 40 50
Cya
noba
cter
ial C
hl a
con
cent
ratio
n (μ
g/L)
0
5
10
15
20
25
30
Repetition 1Repetition 2Repetition 3Exponential Fit Repetition 1Exponential Fit Repetition 2Exponential Fit Repetition 3
Figure 36: Cyanobacterial chlorophyll a decay for addition of 296 gL-1 hydrogen peroxide. Error bars represent the standard error, where ten fluorescence measurements were taken for each repetition.
Table 14: Cyanobacterial first order rate constant for addition of 296 gL-1 hydrogen peroxide
a b r2 ANOVA Regression probability Statistically significant (P<0.01)? 1 18.9731 ± 2.9930 0.2046 ± 0.0688 0.5484 0.0143 No 2 15.6895 ± 2.2416 0.0588 ± 0.0284 0.5039 0.0215 No 3 12.7119 ± 1.8034 0.0418 ± 0.0214 0.4257 0.0409 No Average rate constant N/A
Cyanobacterial chlorophyll a concentration does not exhibit the characteristics of
exponential decay for the addition of 296gL-1 hydrogen peroxide.
The average first order rate constant and half life of cyanobacterial chlorophyll a were
determined for each hydrogen peroxide dose which displayed a statistically significant
exponential decay (Table 15).

4. Results 77
Table 15: Average first order rate constants for cyanobacterial chlorophyll a
H2O2 dose (gL-1) Rate constant (hour-1) Half life (hours) 0.148 ± 0.002 0.1656 ± 0.0260 4.1867 ± 0.6573 0.296 ± 0.002 0.2448 ± 0.0330 2.8315 ± 0.3817 0.740 ± 0.002 0.4207 ± 0.0524 1.6476 ± 0.2052 1.48 ± 0.02 0.2635 ± 0.0458 2.6305 ± 0.4572 2.96 ± 0.02 0.4438 ± 0.1035 1.5618 ± 0.3642
The rate constants were plotted against the hydrogen peroxide doses, and a sigmoidal
regression attempted (Figure 37). A sigmoidal fit was chosen as it is likely that
chlorophyll a decay exhibits a threshold effect when dosed with hydrogen peroxide, such
that there is no visible response at doses below a threshold algicidal concentration.
Sigmoidal fits also assume there is some algicidal concentration at which rate constants
do not increase further, assuming a threshold rate constant has been reached, as would be
expected from this system.

78 4. Results
Hydrogen Peroxide Concentration (g/L)
0 1 2 3
Firs
t ord
er ra
te c
onst
ant (
/hou
r)
0.0
0.1
0.2
0.3
0.4
0.5
0.6
Figure 37: Cyanobacterial chlorophyll a first order rate constants plotted against hydrogen peroxide dose. The line of best fit is a 3 parameter sigmoid. Error bars represent the standard error.

4. Results 79
Where a sigmoidal regression was attempted
First order rate constant = a/{1+exp[-(x-x0)/b]} (hour-1)
x0 = 0.3733 ± 0.0248 gL-1
a = 0.0868 ± 0.0285 hour-1
b = 0.2134 ± 0.0355 gL-1
x = hydrogen peroxide dose (gL-1)
r2 = 0.8321
ANOVA p <0.0001
Which is statistically significant, and hence indicates that the first order rate constant of
cyanobacterial chlorophyll a decay increases sigmoidally with increasing hydrogen
peroxide concentration.
4.1.3.6.2 Total algal chlorophyll a decay
It is apparent from Figure 23 that total algal chlorophyll a exhibits an exponential decay
function when dosed with hydrogen peroxide above a certain concentration. The first
order rate constant for each hydrogen peroxide addition was determined (Figure 38 and
Table 16, Figure 39 and Table 17, Figure 40 and Table 18, Figure 41 and Table 19,
Figure 42 and Table 20, Figure 43 and Table 21, Figure 44 and Table 22, Figure 45 and
Table 23, Figure 46 and Table 24).

80 4. Results
Time since hydrogen peroxide addition (hours)0 10 20 30 40 50
Tota
l alg
al C
hl a
con
cent
ratio
n (μ
g/L)
0
20
40
60
80
100
120
140
160
180
200
Repetition 1Repetition 2Repetition 3Exponential Fit Repetition 1Exponential Fit Repetition 2Exponential Fit Repetition 3
Figure 38: Total algal chlorophyll a decay for the control. Error bars represent the standard error, where ten fluorescence measurements were taken for each repetition.
Table 16: Total algal first order rate constant for the control
a b r2 ANOVA Regression probability Statistically significant (P<0.01)? 1 98.0316 ± 9.4992 0.0000 ± 0.0053 0.0000 1.0000 No 2 98.0316 ± 9.4992 0.0000 ± 0.0053 0.0000 1.0000 No 3 117.1566 ± 11.3511 0.0000 ± 0.0053 0.0000 1.0000 No Average decay rate N/A
Total algal chlorophyll a concentration does not exhibit the characteristics of exponential
decay for the control solution.

4. Results 81
Time since hydorgen peroxide addition (hours)0 10 20 30 40 50
Tota
l alg
al C
hl a
con
cent
ratio
n (μ
g/L)
0
20
40
60
80
100
120
140
160
Repetition 1Repetition 2Repetition 3Exponential Fit Repetition 1Exponential Fit Repetition 2Exponential Fit Repetition 3
Figure 39: Total algal chlorophyll a decay for addition of 0.00296 gL-1 hydrogen peroxide. Error bars represent the standard error, where ten fluorescence measurements were taken for each repetition.
Table 17: Total algal first order rate constant for addition of 0.00296 gL-1 hydrogen peroxide
a b r2 ANOVA Regression probability Statistically significant (P<0.01)? 1 92.6039 ± 9.5705 0.0005 ± 0.0065 0.0007 0.9457 No 2 88.6667 ± 8.6443 0.0043 ± 0.0069 0.0594 0.5273 No 3 89.1495 ± 7.7081 0.0000 ± 0.0054 0.0000 1.0000 No Average decay rate N/A
Total algal chlorophyll a concentration does not exhibit the characteristics of exponential
decay for addition of 0.00296 gL-1 hydrogen peroxide.

82 4. Results
Time since hydrogen peroxide addition (hours)0 10 20 30 40 50
Tota
l alg
al C
hl a
con
cent
ratio
n (μ
g/L)
0
10
20
30
40
50
60
Repetition 1Repetition 2Repetition 3Exponential Fit Repetition 1Exponential Fit Repetition 2Exponential Fit Repetition 3
Figure 40: Total algal chlorophyll a decay for addition of 0.0296 gL-1 hydrogen peroxide. Error bars represent the standard error, where ten fluorescence measurements were taken for each repetition.
Table 18: Total algal first order rate constant for addition of 0.0296 gL-1 hydrogen peroxide
a b r2 ANOVA Regression probability Statistically significant (P<0.01)? 1 32.0444 ± 17.2246 0.4020 ± 0.3907 0.0000 1.0000 No 2 29.2837 ± 12.6194 0.3510 ± 0.2782 0.0000 1.0000 No 3 23.0465 ± 11.6038 0.3779 ± 0.3450 0.0000 1.0000 No Average decay rate N/A
Total algal chlorophyll a concentration does not exhibit the characteristics of exponential
decay for addition of 0.0296 gL-1 hydrogen peroxide.

4. Results 83
Time since hydrogen peroxide addition (hours)0 10 20 30 40 50
Tota
l alg
al C
hl a
con
cent
ratio
n (μ
g/L)
0
5
10
15
20
25
30
35
Repetition 1Repetition 2Repetition 3Exponential Fit Repetition 1Exponential Fit Repetition 2Exponential Fit Repetition 3
Figure 41: Total algal chlorophyll a decay for addition of 0.148 gL-1 hydrogen peroxide. Error bars represent the standard error, where ten fluorescence measurements were taken for each repetition.
Table 19: Total algal first order rate constant for addition of 0.148 gL-1 hydrogen peroxide
a b r2 ANOVA Regression probability Statistically significant (P<0.01)? 1 24.7896 ± 3.1185 0.1915 ± 0.0532 0.8421 0.0002 Yes 2 25.7223 ± 3.4108 0.1964 ± 0.0571 0.8180 0.0003 Yes 3 26.6582 ± 2.1042 0.1810 ± 0.0328 0.9317 <0.0001 Yes Average decay rate 0.1896 ± 0.0474 hour-1
Total algal chlorophyll a concentration exhibits statistically significant exponential decay
for the addition of 0.148 gL-1 hydrogen peroxide.
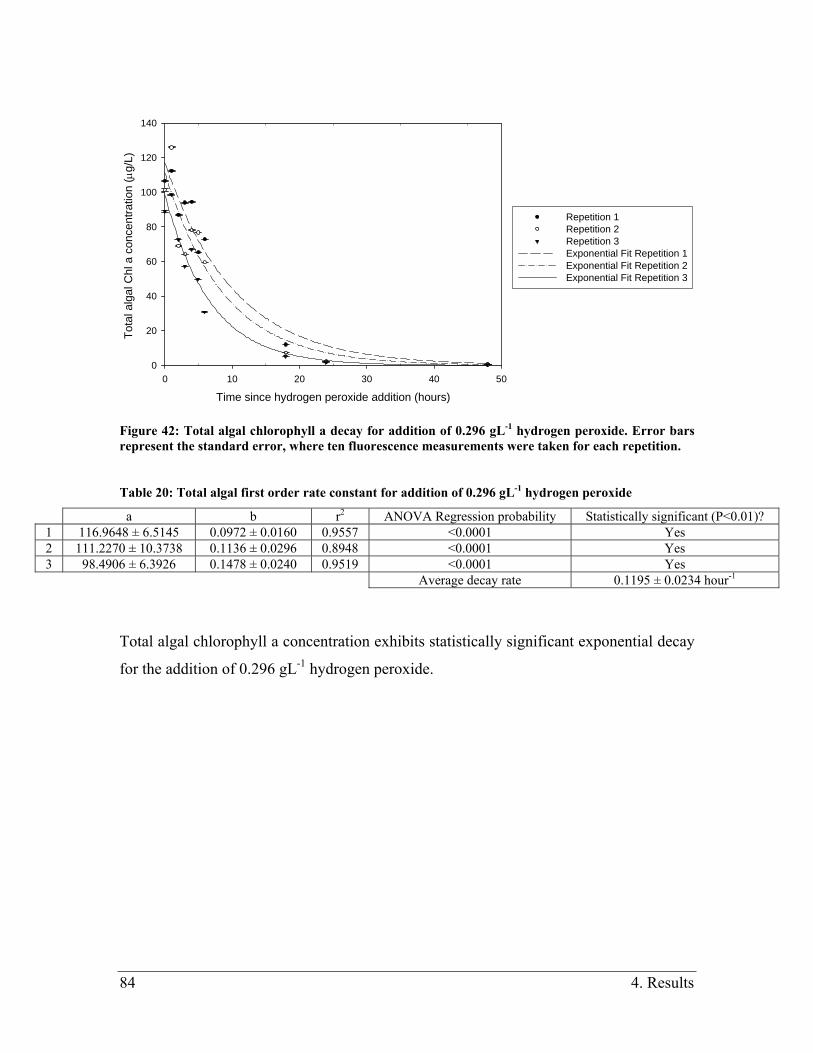
84 4. Results
Time since hydrogen peroxide addition (hours)0 10 20 30 40 50
Tota
l alg
al C
hl a
con
cent
ratio
n (μ
g/L)
0
20
40
60
80
100
120
140
Repetition 1Repetition 2Repetition 3Exponential Fit Repetition 1Exponential Fit Repetition 2Exponential Fit Repetition 3
Figure 42: Total algal chlorophyll a decay for addition of 0.296 gL-1 hydrogen peroxide. Error bars represent the standard error, where ten fluorescence measurements were taken for each repetition.
Table 20: Total algal first order rate constant for addition of 0.296 gL-1 hydrogen peroxide
a b r2 ANOVA Regression probability Statistically significant (P<0.01)? 1 116.9648 ± 6.5145 0.0972 ± 0.0160 0.9557 <0.0001 Yes 2 111.2270 ± 10.3738 0.1136 ± 0.0296 0.8948 <0.0001 Yes 3 98.4906 ± 6.3926 0.1478 ± 0.0240 0.9519 <0.0001 Yes Average decay rate 0.1195 ± 0.0234 hour-1
Total algal chlorophyll a concentration exhibits statistically significant exponential decay
for the addition of 0.296 gL-1 hydrogen peroxide.

4. Results 85
Time since hydrogen peroxide addition (hours)0 10 20 30 40 50
Tota
l alg
al C
hl a
con
cent
ratio
n (μ
g/L)
0
50
100
150
200
Repetition 1Repetition 2Repetition 3Exponential Fit Repetition 1Exponential Fit Repetition 2Exponential Fit Repetition 3
Figure 43: Total algal chlorophyll a decay for addition of 0.740 gL-1 hydrogen peroxide. Error bars represent the standard error, where ten fluorescence measurements were taken for each repetition.
Table 21: Total algal first order rate constant for addition of 0.740 gL-1 hydrogen peroxide
a b r2 ANOVA Regression probability Statistically significant (P<0.01)? 1 147.1269 ± 20.9134 0.1892 ± 0.0601 0.8181 0.0003 Yes 2 117.8792 ± 10.2468 0.2046 ± 0.0386 0.9205 <0.0001 Yes 3 144.8794 ± 21.1722 0.1847 ± 0.0614 0.8082 0.0004 Yes Average decay rate 0.1928 ± 0.0539 hour-1
Total algal chlorophyll a concentration exhibits statistically significant exponential decay
for the addition of 0.740 gL-1 hydrogen peroxide.

86 4. Results
Time since hydrogen peroxide addition (hours) 0 10 20 30 40 50
Tota
l alg
al C
hl a
con
cent
ratio
n (μ
g/L)
0
10
20
30
40
50
60
70
Repetition 1Repetition 2Repetition 3Exponential Fit Repetition 1Exponential Fit Repetition 2Exponential Fit Repetition 3
Figure 44: Total algal chlorophyll a decay for addition 1.48 gL-1 hydrogen peroxide. Error bars represent the standard error, where ten fluorescence measurements were taken for each repetition.
Table 22: Total algal first order rate constant for addition of 1.48 gL-1 hydrogen peroxide
a b r2 ANOVA Regression probability Statistically significant (P<0.01)? 1 41.4229 ± 4.6484 0.1513 ± 0.0410 0.8715 <0.0001 Yes 2 36.3585 ± 3.0817 0.1473 ± 0.0307 0.9247 <0.0001 Yes 3 50.5170 ± 7.6134 0.1194 ± 0.0491 0.7747 0.0008 Yes Average decay rate 0.1393 ± 0.0414 hour-1
Total algal chlorophyll a concentration exhibits statistically significant exponential decay
for the addition of 1.48 gL-1 hydrogen peroxide.

4. Results 87
Time since hydrogen peroxide addition (hours)0 10 20 30 40 50
Tota
l alg
al C
hl a
con
cent
ratio
n (μ
g/L)
0
20
40
60
80
100
120
Repetition 1Repetition 2Repetition 3Exponential Fit Repetition 1Col 45 vs Col 46 Exponential Fit Repetition 2Exponential Fit Repetition 3
Figure 45: Total algal chlorophyll a decay for addition of 2.96 gL-1 hydrogen peroxide. Error bars represent the standard error, where ten fluorescence measurements were taken for each repetition.
Table 23: Total algal first order rate constant for addition of 2.96 gL-1 hydrogen peroxide
a b r2 ANOVA Regression probability Statistically significant (P<0.01)? 1 98.0875 ± 8.9310 0.1342 ± 0.0318 0.9097 <0.0001 Yes 2 98.3546 ± 5.5159 0.1580 ± 0.0214 0.9646 <0.0001 Yes 3 93.3827 ± 10.2246 0.1273 ± 0.0373 0.8710 <0.0001 Yes Average decay rate 0.1398 ± 0.0310 hour-1
Total algal chlorophyll a concentration exhibits statistically significant exponential decay
for the addition of 2.96 gL-1 hydrogen peroxide.

88 4. Results
Time since hydrogen peroxide addition (hours)0 10 20 30 40 50
Tota
l alg
al C
hl a
con
cent
ratio
n (μ
g/L)
0
20
40
60
80
100
Repetition 1Repetition 2Repetition 3Exponential Fit Repetition 1Exponential Fit Repetition 2Exponential Fit Repetition 3
Figure 46: Total algal chlorophyll a decay for addition of 296 gL-1 hydrogen peroxide. Error bars represent the standard error, where ten fluorescence measurements were taken for each repetition.
Table 24: Total algal first order rate constant for addition of 296 gL-1 hydrogen peroxide
a b r2 ANOVA Regression probability Statistically significant (P<0.01)? 1 73.3967 ± 7.7940 0.5366 ± 0.1053 0.8924 <0.0001 Yes 2 87.7402 ± 5.2722 0.6139 ± 0.0702 0.9617 <0.0001 Yes 3 75.1619 ± 5.4011 0.6412 ± 0.0888 0.9465 <0.0001 Yes Average decay rate 0.5972 ± 0.0894 hour-1
Total algal chlorophyll a concentration exhibits statistically significant exponential decay
for the addition of 296 gL-1 hydrogen peroxide.
The average first order rate constant and half life of total algal chlorophyll a were
determined for each hydrogen peroxide dose which displayed a statistically significant
exponential decay (Table 25).

4. Results 89
Table 25: Average first order rate constants for total algal chlorophyll a
H2O2 dose (gL-1) Rate constant (hour-1) Half life (hours) 1.48x10⁻¹ ± 2.0x10⁻³ 0.1896 ± 0.0474 3.6558 ± 0.9140 2.96x10⁻¹ ± 2.0x10⁻³ 0.1195 ± 0.0234 5.8004 ± 1.1358 7.40x10⁻¹ ± 2.0x10⁻³ 0.1928 ± 0.0539 3.5952 ± 1.0051
1.48 ± 2.0x10⁻² 0.1393 ± 0.0414 4.9759 ± 1.4788 2.96 ± 2.0x10⁻² 0.1398 ± 0.0310 4.9581 ± 1.0994
296 ± 1 0.5972 ± 0.0894 1.1607 ± 0.2017
The first order rate constants were plotted against the hydrogen peroxide doses and a
sigmoidal regression attempted (Figure 47). The first order rate constant for 296 gL-1
hydrogen peroxide addition was not included as it was not statistically significant for the
cyanobacterial rate constant, which is a component of the total algal rate constant. A
sigmoidal fit was chosen as it is likely that chlorophyll a decay exhibits a threshold effect
when dosed with hydrogen peroxide, such that there is no visible response at doses below
a threshold algicidal concentration. Sigmoidal fits also assume there is some algicidal
concentration at which the rate constants do not increase further, assuming a threshold
rate constant has been reached, as would be expected from this system.

90 4. Results
Hydrogen Peroxide Concentration (g/L)
0 1 2 3
Firs
t ord
er ra
te c
onst
ant (
/hou
r)
0.08
0.10
0.12
0.14
0.16
0.18
0.20
0.22
0.24
0.26
Figure 47: Total algal chlorophyll a first order rate constants plotted against hydrogen peroxide dose. The line of best fit is a 3 parameter sigmoid. Error bars represent the standard error.

4. Results 91
Where a sigmoidal regression was attempted
First order rate constant = a/{1+exp[-(x-x0)/b]} (hour-1)
x0 = -5.2204 ± 725.1127 gL-1
a =0.5299 ± 27.6140 hour-1
b = -7.6705 ± 190.2397 gL-1
x = hydrogen peroxide dose (gL-1)
r2 = 0.0183
ANOVA p = 0.8470
Which is not statistically significant, and hence indicates that the first order rate constant
of total algal chlorophyll a decay does not display sigmoidal regression with increasing
hydrogen peroxide concentration.
4.2 Cyanobacterial toxins
Duplicate raw water samples were dosed with hydrogen peroxide at 0.0296 gL-1, 0.148
gL-1, 0.296 gL-1, 0.740 gL-1 and 1.48 gL-1. Samples were taken at six time steps and
analysed using the Abraxis PN 520011, Microcystins/Nodularins (ADDA) ELISA Kit,
Microtiter Plate (96T) and the Metertech Inc AccuReader 965 (Table 26 and Figure 48).

92 4. Results
Table 26: Total microcystin and nodularin concentrations (μgL-1) detected by ELISA
Time since H2O2 addition (hours) Dose (gL-1) 0 1 2 3 4 23
0 g/L (control) 0.0200 0.0000 0.0000 0.0000 0.0000 0.0000 0.0296 ± 0.0003 0.0000 0.0043 0.0000 0.0000 0.0000 0.0000 0.148 ± 0.002 0.0231 0.0000 0.0000 0.0000 0.0000 0.0000 0.296 ± 0.002 0.0000 0.0132 0.0644 0.0000 0.0000 0.0000 0.740 ± 0.002 0.0277 0.0000 0.0000 0.0000 0.0000 0.0000
1.48 ± 0.02 0.0000 0.0161 0.0000 0.0000 0.0000 0.0000
Time since hydrogen peroxide addition (hours)
0 5 10 15 20 25
Mic
rocy
stin
/nod
ular
in c
once
ntra
tion
(ug/
L)
0.00
0.02
0.04
0.06
0.08
0.10
Blank0.0296 g/L0.148 g/L0.296 g/L0.74 g/L1.48 g/L
Figure 48: Combined microcystin and nodularin concentrations detected by ELISA analysis. All measurements were below the minimum reliable detection limit of 0.1 μgL-1
The minimum detection limit of the Abraxis PN 520011, Microcystins/Nodularins
(ADDA) ELISA Kit, Microtiter Plate (96T) is 0.1 μgL-1, and all samples tested within
this study were below this concentration according to the analysis (Figure 48). Hence the
behaviour of microcystin concentrations with hydrogen peroxide application could not be
examined.
Minimum Detection Limit

5. Discussion 93
5 Discussion
5.1 Chlorophyll a concentration
It is evident from this study that hydrogen peroxide is effective at inducing cyanobacterial
cell death, as has been suggested by the literature (Barroin and Feuillade 1986; Perez and
Aga 2005; Rositano et al. 1998; Svrcek and Smith 2004). The results of the chlorophyll a
analysis indicate it is highly likely that the application of hydrogen peroxide at a
concentration of 0.148 gL-1 and above induces cell lysis of cyanobacteria, chlorophyta
and diatoms in wastewater. There is no apparent correlation between cryptophyta
chlorophyll a and hydrogen peroxide dose. It also appears that the first order rate constant
of cyanobacterial chlorophyll a decay reaches an upper value of approximately 0.4438
hour-1, corresponding to a half life of 1.5618 hours.
Our interpretation of the results based upon algal ecophysiology suggests that the
reduction of algal photosynthetic activity following the addition of hydrogen peroxide is
due to hydroxyl radicals attacking the cell wall and photosynthetic apparatus of
cyanobacteria to induce cell death, as well as cleaving D1 peptide bonds and destroying
pigments such as billiproteins, carotenoids and chlorophyll a (Barroin and Feuillade
1986; Lupinkova and Komenda 2004; Samuilov et al. 2001).
5.1.1 Response of control and lower hydrogen peroxide doses
The control and lower hydrogen peroxide doses of 0.00296 ± 0.00003 gL-1 and 0.0296 ±
0.0004 gL-1 did not appear to induce cell death. In some instances algal biomass increased
during incubation, which was likely due to fluorescent lighting allowing for
photosynthesis. Where chlorophyll a concentration was seen to decrease within the
incubation period it is possible that natural cell death occurred, or there was some grazing
by zooplankton (Griffin et al. 2001). Zooplankton of the genera Daphnia were observed
to survive the 48 hour incubation period of the control and two lower hydrogen peroxide
concentrations.

94 5. Discussion
5.1.2 Response of higher hydrogen peroxide doses
Although hydrogen peroxide doses of 0.148 ± 0.002 gL-1 and above induced exponential
decay of cyanobacteria, chlorophyta and diatoms with high statistical significance, the
response did not increase orderly with dosage. Rates were disordered but similar at higher
hydrogen peroxide doses. It has been theorised that hydrogen peroxide induced
cyanobacterial death exhibits a threshold effect, whereby decay rates do not increase
above a certain hydrogen peroxide concentration (Barroin and Feuillade 1986). This is a
possible explanation for the disordered behaviour at higher hydrogen peroxide
concentrations.
Total algal chlorophyll a exhibited exponential decay at a hydrogen peroxide dose of
0.148 gL-1 and above, with high r2 values ranging between 0.8276 and 0.9644, and
ANOVA p values of 0.0003 or less. This indicated that total algal chlorophyll a
concentration modelled by exponential decay was statistically significant at these doses.
Cyanobacterial chlorophyll a exhibited exponential decay at hydrogen peroxide doses of
0.148 gL-1 to 2.96 gL-1, with high r2 values ranging between 0.8929 and 0.9837, and
ANOVA p values of less than 0.0001. This indicated that cyanobacterial chlorophyll a
concentration modelled by exponential decay was statistically significant at these doses.
However, at the highest dose, 296 gL-1 hydrogen peroxide, exponential decay was not
statistically significant. It is possible this was due to an unexplained phenomenon when
there is a large excess of hydrogen peroxide to chlorophyll a, the threshold effect as
described above, or could have been caused by an experimental error. It was noticed that
at the higher hydrogen peroxide doses of 1.48 gL-1, 2.96 gL-1 and 296 gL-1, oxygen
bubbles were visible within samples when undergoing spectrofluorometric analysis. It is
possible that this caused some interference with measurement, and thus affected the
concentration readings for these hydrogen peroxide doses.
5.1.3 Cyanobacterial first order rate constants
The first order rate constants determined for cyanobacteria at hydrogen peroxide doses of
0.148 ± 0.002 gL-1 and above were statistically significant, and exhibited half lives

5. Discussion 95
between 1.5618 and 4.1867 hours. A sigmoidal regression described the response of
cyanobacterial decay rate with increasing hydrogen peroxide dose with a high r2 value of
0.8321 and ANOVA p value of less than 0.0001. This regression is likely a statistically
significant fit as it assumes that cyanobacterial chlorophyll a concentration does not
decay until it reaches some threshold value of hydrogen peroxide dose, and that there is
some value of hydrogen peroxide dose above which the rate of decay cyanobacterial
chlorophyll a does not increase further.
5.1.4 Total algal first order rate constants
The total algal first order rate constant of chlorophyll a decay is not a scientifically robust
measurement, as it is probably highly dependent on the algal composition of the raw
water prior to hydrogen peroxide application. However, knowledge of the approximate
rate constant for algal decay from hydrogen peroxide addition is a useful tool in
wastewater management to determine appropriate algicidal doses for the induction of
algal cell death. Although exponential decay rates were statistically significant for
hydrogen peroxide doses of 0.148 ± 0.002 gL-1 and above, rates did not increase with
hydrogen peroxide concentration in an ordered fashion. This was evidenced by the
sigmoidal fit for the rate constant with various hydrogen peroxide doses not being
statistically significant. The lowest half life determined was approximately one hour, and
the longest six hours, but these did not correspond to the highest and lowest doses
respectively. Within the range of hydrogen peroxide doses from 2.5 x 10⁻³% to 25%, it
can be inferred that the longest half life of total algal species within a laboratory
environment would likely not be significantly greater than six hours.
5.1.5 Possible effect of UV radiation
In the laboratory incubation, it is not likely that factors other than hydrogen peroxide
addition, and possibly zooplankton grazing, significantly enhanced algal cell death.
However, when applied to outdoor wastewater treatment plants, it is highly probable that
wastewater will be subject to UV light for several hours per day. UV light has been

96 5. Discussion
proven to increase the decay rate of cyanobacterial biomass in hydrogen peroxide dosed
water by significantly increasing the concentration of hydroxyl radicals in solution
(Cornish et al. 2000; Lawton and Robertson 1999). Hence algal chlorophyll a decay
should be faster in the field than the laboratory. The ratio of light to dark hours in
WWTPs must also be considered.
5.1.6 Reliability of instrumentation
The reliability of the fluorescence instrument itself should be considered. Studies of the
bbe-Moldaenke Fluoroprobe have indicated that measurements of cyanobacterial
chlorophyll a concentration can encounter some variability depending on the age of algal
cells (Gregor et al. 2007), and that the probe may exhibit a nonlinear response in algal
chlorophyll a concentrations for samples containing algal biomass in excess of 50 μgL-1
(Gregor and Marsalek 2004). It has also been suggested that results from the probe could
be affected by the shading, scattering or reabsorption of light throughout the water
column (Gregor and Marsalek 2004), or fluorescence quenching errors when algal cells
have been exposed to high levels of sunlight, causing photoinhibition (Leboulanger et al.
2002). It is unlikely that fluorescence quenching occurred within this study, as samples
were only subjected to moderate levels of artificial light.
5.2 Cyanobacterial toxins
It was expected that hydrogen peroxide would reduce microcystin toxicity by the
induction of oxidative cleavage of the Adda bond by hydroxyl radicals (Perez and Aga
2005). However, the minimum detection limit of the Abraxis PN 520011,
Microcystins/Nodularins (ADDA) ELISA Kit, Microtiter Plate (96T) is 0.1 μgL-1, and all
samples tested within this study were below this concentration according to the analysis.
Hence the behaviour of microcystin concentrations with hydrogen peroxide application
could not be examined.

5. Discussion 97
5.2.1 Cyanobacterial toxin detection
Microcystins may have been undetected due to very low concentrations of cyanobacterial
toxins in the raw water sampled, or this may have been caused by an error within the
analysis. Studies have shown that microcystins can be degraded rapidly in the presence of
pigments (Nicholson and Burch 2001; Tsuji et al. 1994), which may have been collected
along with the raw water samples. Native bacteria within the samples could also have
considerably reduced the toxin concentrations of the water samples (Christoffersen et al.
2002). Although ELISA analysis was conducted within one week of sample collection,
this time period may have allowed for significant degradation by these two processes.
It is unlikely that other microcystin toxins were present but undetected by the ELISA
analysis, as the kit utilised has shown good cross reactivity with nodularins and
microcystins YR, LF, LR, RR and LW (Abraxis 2007). Preconcentration could have been
performed on samples to improve detection (Nicholson and Burch 2001), but this was not
initially performed as it was not deemed necessary for raw water with significant algal
concentrations (Harada et al. 1999; Mountfort et al. 2005; Carmichael and An 1999).
5.2.2 Microcystin interaction with plastic
Several studies have shown that hydrophobic interactions between microcystins and
plastic surfaces can reduce the concentration of toxins in samples (Hyenstrand et al.
2001). Hence it has been suggested that plastic lab ware use be restricted (Perez and Aga
2005), and in this study only the initial pipetting of samples into wells used plastic tips. It
is unlikely that original microcystin concentrations in solutions were significantly higher
than those measured; they were likely still below the detection limit.
5.2.3 Laboratory hydrogen peroxide dose
The preliminary results suggest that a hydrogen peroxide dose of approximately 0.148
gL-1 will reduce cyanobacterial biomass by 50% within 4.2 hours. This is approximately a
raw water : 50% hydrogen peroxide ratio of 2000:1. At this dosage, virtually all

98 5. Discussion
cyanobacteria, chlorophyta and diatom biomass will be removed within 48 hours of
application. However, the toxins released from such cell death pose a significant health
risk (Carmichael 1992; Fawell et al. 1993), which could not be investigated within this
study due to low levels of toxins within raw samples. Thus the behaviour of
cyanobacterial toxins with hydrogen peroxide addition should be investigated further.

6. Recommendations 99
6 Recommendations
6.1 Refine analysis method
6.1.1 Further analysis of extracellular toxins
The behaviour of cyanobacterial toxins, in particular microcystin variants and nodularin,
could not be investigated within this study due to undetectable levels within raw water
samples. However, such toxins do pose a substantial risk to human and animal health, and
thus the relationship between such toxins and hydrogen peroxide addition should be
investigated in samples with high microcystin concentrations, or where samples can be
preconcentrated prior to analysis. It is likely if samples were collected from wastewater
ponds during a bloom breakdown in summer that high levels of microcystins would be
observed. Hence it is recommended that further analysis be conducted during warmer
months to determine the response of cyanobacterial toxins to hydrogen peroxide addition.
6.1.2 Extraction of intracellular toxins
To further investigate the effects of hydrogen peroxide addition on both cell death and
toxin destruction, an analysis of intracellular toxins should be performed. This will allow
for the determination of the rates of cell death, toxin degradation, and toxin release from
cells. The results of ELISA analysis on extracellular microcystins indicated that toxin
levels within the Burekup samples were too low to warrant extraction of intracellular
toxins. However, an analytical method for this step has been devised from a review of the
literature, and is proposed here.
The technique deemed most appropriate for extracting intracellular toxins from
cyanobacteria is freeze-drying the solid portion of a water sample followed by thawing
and extraction in an appropriate solvent (Nicholson and Burch 2001; An and Carmichael
1994; Harada et al. 1999; Fastner et al. 1998; Mathys and Surholt 2004; Carmichael and
An 1999; Lawton et al. 1994).

100 6. Recommendations
The method of intracellular toxin extraction ruptures the cell walls through the freezing
and thawing techniques, followed by dissolution of the toxins in a chosen solvent
(Nicholson and Burch 2001). Appropriate precautions should be taken when handling the
freeze-dried samples as they pose a health hazard (Harada et al. 1999). Within this project
it is proposed that dosed samples be filtered at each time step and the filtrate snap frozen
followed by freeze drying for two days.
Samples should then be extracted. Triple extraction with 70-80% methanol has shown
promising results (An and Carmichael 1994; Lawton et al. 1994; Mathys and Surholt
2004; Fastner et al. 1998; Carmichael and An 1999; Rapala et al. 2002; Nicholson and
Burch 2001), and some studies also combined methanol extraction with centrifuging (An
and Carmichael 1994), stirring or sonication (Mathys and Surholt 2004; Rapala et al.
2002; Carmichael and An 1999), and rotary evaporation (Lawton et al. 1994). However,
satisfactory results have been gathered by air drying supernatants overnight, without the
need for further treatment (An and Carmichael 1994; Carmichael and An 1999; Mathys
and Surholt 2004). Although methanol contents up to 75% do not appear to affect toxin
detection during HPLC (Metcalf et al. 2000a), methanol may interfere with ELISA at
concentrations above 20%, and thus it has been suggested that dissolution in methanol
should be avoided (Metcalf et al. 2000b). From consideration of past studies, it is
recommended that freeze dried samples be dissolved in 75% methanol and the
supernatants dried overnight at 25-30 degrees Celsius under air or nitrogen.
Dried toxins should be completely free of methanol, and redissolved in water prior to
analysis. Some difficulty has been encountered in the past regarding the solubility of the
dried compounds in pure water. The addition of 0.9% sodium chloride solution appears to
assist in complete dissolution of toxins without interfering with ELISA detection (Mathys
and Surholt 2004), and is recommended by this project. Microcystin concentrations can
then be measured by the ELISA method, as outlined in section 3.3.

6. Recommendations 101
6.2 Field trial
Following a thorough laboratory analysis of the behaviour of both intracellular and
extracellular cyanobacterial toxins with hydrogen peroxide addition, a field trial should
be performed. It should be attempted to simulate water quality and common
meteorological conditions of South-West WWTPs. During hours of daylight, it would be
expected that cyanobacterial, chlorophyta and diatom decay rates would increase from
laboratory measurements, due to the significant increase in hydroxyl radical
concentration caused by UV light (Cornish et al. 2000; Lawton and Robertson 1999).
Another consideration is the shading of deeper cells by those above, as all cells receive
approximately equivalent fluorescent light doses within the laboratory environment.
Analysis of results from this trial will likely allow for a pilot study to be conducted by the
Water Corporation in South-West WWTPs. This should be conducted to ensure that the
observed decay of cyanobacterial biomass, total algal biomass and cyanobacterial toxins
within the laboratory and field can be scaled up to the WWTP scale.
6.3 Hydrogen peroxide dosage protocol
The pilot study will establish the behaviour of cyanobacterial and total algal biomass
within the WWTP environment. A protocol for the implementation of hydrogen peroxide
in WWTP ponds should then be designed. This method will outline appropriate doses of
hydrogen peroxide and the frequency of addition. Doses and frequency will likely depend
upon the cyanobacterial cell biomass and the likely weather patterns. It is suggested that
monthly monitoring of WWTP ponds be continued, and hydrogen peroxide added when
cyanobacterial biomass reaches some critical value outlined within the protocol, as
determined from the pilot study. Treatment of infected water prior to the formation of
bloom conditions will reduce the chance of high cyanobacterial biomass resulting before
the following measurement period. Early treatment will likely be economically
beneficial, as preventing large scale blooms will allow for less algicide use than
remediating the water once they occur.

102 7. Conclusion
7 Conclusion
The results of this study suggest it is highly likely the application of hydrogen peroxide at
a concentration of 0.148 gL-1 and above induces cell lysis in cyanobacteria, chlorophyta
and diatoms in wastewater. First order rate constants for cyanobacterial decay exhibit a
sigmoidal regression, indicating that it is likely that there is some hydrogen peroxide dose
below which cyanobacterial chlorophyll a decay is negligible, and a dose above which
the decay rate does not increase further. The greatest statistically significant
cyanobacterial chlorophyll a decay first order rate constant determined was 0.4438 hour-1,
corresponding to a half life of 1.5618 hours. Data collected on the degradation of
cyanobacterial toxins by hydrogen peroxide was insufficient to provide additional
information as to their behaviour after algicidal addition.
Depending on the results from a field trial, it may be possible to apply hydrogen peroxide
on the large scale to a WWTP. It is expected that further analysis of the results will
indicate an effective dose rate for WWTPs to reduce cyanobacterial cell and toxin
concentrations to within acceptable levels, within acceptable monetary and time limits.
This may allow for the addition of hydrogen peroxide to outdoor WWTPs throughout the
South-West region.
This treatment also has the potential to be used by water authorities throughout Australia
and other countries. Where cyanobacteria removal methods are already in place,
hydrogen peroxide may be seen as a more environmentally sensitive method of removal.
Hydrogen peroxide also has a possible application in under-developed areas where
drinking and bathing water sources suffer cyanobacterial blooms and are untreated prior
to human use.

8. References 103
8 References
Acero, J. L., Rodrigueza, E. and Meriluoto, J. 2005, 'Kinetics of reactions between chlorine and the cyanobacterial toxins microcystins', Water Research, vol. 39, no. 8, pp. 1628-1638.
Al-Layl, K. J., Poon, G. K. and Codd, G. A. 1988, 'Isolation and purification of peptide and alkaloid toxins from Anabaena flos-aquaeI using high-performance thin-layer chromatography', Journal of Microbiological Methods, vol. 7, pp. 251-258.
Al Momani, F., Smith, D. W. and Gamal El-Din, M. In press 2007, 'Degradation of cyanobacteria toxin by advanced oxidation processes', Journal of Hazardous Materials.
An, J. and Carmichael, W. M. 1994, 'Use of a colorimetric protein phosphatase inhibition assay and enzyme linked immunosorbent assay for the study of microcystins and nodularins', Toxicon, vol. 32, no. 12, pp. 1495-1507.
Antoniou, M. G., Armah, A. and Dionysiou, D. D. 2005, 'Cyanotoxins: New generation of water contaminants', Journal of Environmental Engineering, vol. 131, no. 9, p. 1239.
Atkins, P. W. 1998, Physical Chemistry, Sixth edn, Oxford University Press, Oxford.
Bandala, E. R., Martinez, D., Martinez, E. and Dionysiou, D. D. 2004, 'Degradation of microcystin-LR toxin by Fenton and Photo-Fenton processes', Toxicon, vol. 43, no. 7, pp. 829-832.
Barroin, G. and Feuillade, M. 1986, 'Hydrogen peroxide as a potential algicide for Oscillatoria rubescens D.C.' Water Research, vol. 20, no. 5, pp. 619-623.
Bateman, K. P., Thibault, P., Douglas, D. J. and White, R. L. 1995, 'Mass spectral analyses of microcystins from toxic cyanobacteria using on-line chromatographic and electrophoretic separations', Journal of Chromatography A, vol. 712, no. 1, pp. 253-268.
Beutler, M., Wiltshire, K. H., Meyer, B., Moldaenke, C., Luring, C., Meyerhofer, M., Hansen, U. P. and Dau, H. 2002, 'A fluorometric method for the differentiation of algal populations in vivo and in situ', Photosynthesis Research, vol. 72, no. 1, pp. 39-53.
Bhattacharya, R., Sugendram, K., Dangi, R. S. and Rao, P. V. 1997, 'Toxicity evaluation of freshwater cyanobacterium Microcystis aeruginosa PCC7806:II. Nephrotoxicity in rats.' Biomedical Environmental Science, vol. 10, pp. 93-101.
Bogialli, S., Bruno, M., Curini, R., Di Corcia, A., Lagana, A. and Mari, B. 2005, 'Simple assay for analyzing five microcystins and nodularin in fish muscle tissue: hot water extraction followed by liquid chromatography-tandem mass spectrometry', Journal of Agricultural and Food Chemistry, vol. 53, no. 17, pp. 6586-6592.

104 8. References
Boland, M. P., Smillie, Chen, D. Z. X. and Holmes, C. F. B. 1993, 'A unified bioscreen for the detection of diarrhetic shellfish toxins and microcystins in marine and freshwater environments', Toxicon, vol. 31, no. 11, pp. 1393-1405.
Bouaicha, N., Rivasseau, C., Hennion, M. C. and Sandra, P. 1996, 'Detection of cyanobacterial toxins (microcystins) in cell extracts by micellar electrokinetic chromatography', Journal of Chromatography B, vol. 685, no. 1, pp. 53-57.
Bourne, D. G., Blakeley, R. L., Riddles, P. and Jones, G. J. 2006, 'Biodegradation of the cyanobacterial toxin microcystin LR in natural water and biologically active slow sand filters', Water Research, vol. 40, no. 6, pp. 1294-1302.
Bourne, D. G., Jones, G. J., Blakeley, R. L., Jones, A., Negri, A. P. and Riddles, P. 1996, 'Enzymatic pathways for the bacterial degradation of the cyanobacterial cyclic peptide toxin Microcystin LR', Applied and Environmental Microbiology, vol. 62, no. 11, pp. 4086-4094.
Brooke, S., Newcombe, G., Nicholson, B. and Klass, G. 2006, 'Decrease in toxicity of microcystins LA and LR in drinking water by ozonation', Toxicon, vol. 48, no. 8, pp. 1054-1059.
Carbis, C. R., Rawlin, G. T., Grant, P., Mitchell, G. F., Anderson, J. W. and McCauley, I. 1997, 'A study of feral carp Cyprinus carpio L., exposed to Microcystis aeruginosa at Lake Mokoan, Australia, and possible implication on fish health', Journal of Fish Diseases, vol. 20, no. 2, pp. 81-91.
Carmichael, W. W. 1992, 'Cyanobacterial secondary metabolites- the cyanotoxins', Journal of Applied Bacteriology, vol. 72, pp. 445-459.
Carmichael, W. W. 1994, 'Toxins of cyanobacteria', Scientific American, vol. 270, no. 1, pp. 78-86.
Carmichael, W. W. 1997, 'The cyanotoxins', Advanced Botanical Research, vol. 27, pp. 211-256.
Carmichael, W. W. 2001, 'Health effects of toxin-producing cyanobacteria: the cyanoHAMs', Human Ecological Risk Assessment, vol. 7, no. 5, pp. 1393-1407.
Carmichael, W. W. and An, J. 1999, 'Using an Enzyme Linked Immunosorbent Assay (ELISA) and a Protein Phosphatase Inhibition Assay (PPIA) for the detection of Microcystins and Nodularins', Natural Toxins, vol. 7, no. 6, pp. 377-385.
Chorus, I. 2001, 'Cyanotoxin occurrence in freshwaters- a summary of survey results from different countries', in Cyanotoxins: Occurrence, Causes, Consequences, ed. I. Chorus, Springer.
Chorus, I. and Bartram, J. 1999, Toxic Cyanobacteria in Water. A Guide to Public Health Consequences, Monitoring and Management, World Health Organization, London.
Chow, C. W. K., Drikas, M., House, J., Burch, M. D. and Velzeboer, R. M. A. 1999, 'The impact of conventional water treatment processes on cells of the cyanobacterium Microcystis aeruginosa', Water Research, vol. 33, no. 15, pp. 3253-3262.

8. References 105
Christoffersen, K., Lyck, S. and Winding, A. 2002, 'Microbial activity and bacterial community structure during degradation of microcystins', Aquatic Microbial Ecology, vol. 27, no. 2, pp. 125-136.
Chu, F. S., Huang, X. and Wei, R. D. 1990, 'Enzyme-Linked Immunosorbent Assay for Microcystins in Blue-Green Algal Blooms', Journal of the Association of Analytical Chemists, vol. 73, no. 3, pp. 451-456.
Codd, G. A. 2000, 'Cyanobacterial toxins, the perception of water quality, and the prioritisation of eutrophication control', Ecological Engineering, vol. 16, no. 1, pp. 51-60.
Codd, G. A., Bell, S. G., Kaya, K., Ward, C. J., Beattie, K. A. and Metcalf, J. S. 1999a, 'Cyanobacterial toxins, exposure routes and human health', European Journal of Phycology, vol. 34, no. 4, pp. 405-415.
Codd, G. A., Metcalf, J. S. and Beattie, K. A. 1999b, 'Retention of Microcystis aeruginosa and microcystin by salad lettuce (Lactuca sativa) after spray irrigation with water containing cyanobacteria', Toxicon, vol. 37, no. 8, pp. 1181-1185.
Codd, G. A., Metcalf, J. S., Ward, C. J., Beattie, K. A., Bell, S. G., Kaya, K. and Poon, G. K. 2001, 'Analysis of cyanobacterial toxins by physicochemical and biochemical methods', Journal of AOAC International, vol. 84, no. 5, pp. 1626-1635.
Codd, G. A., Morrison, L. F. and Metcalf, J. S. 2005, 'Cyanobacterial toxins: risk management for health protection', Toxicology and Applied Pharmacology, vol. 203, no. 3, pp. 264-272.
Cornish, B. J. P. A., Lawton, L. A. and Robertson, P. K. J. 2000, 'Hydrogen peroxide enhanced photocatalytic oxidation of microcystin-LR using titanium dioxide', Applied Catalysis B: Environmental, vol. 25, no. 1, pp. 59-67.
Cousins, I. T., Bealing, D. J., James, H. A. and Sutton, A. 1996, 'Biodegradation of microcystin-LR by indigenous mixed bacterial populations', Water Research, vol. 30, no. 2, pp. 481-485.
de Figueiredo, D. R., Azeiteiro, U. M., Esteves, S. M., Goncalves, F. J. M. and Pereira, M. J. 2004, 'Microcystin producing blooms- a serious global public health issue', Ecotoxicology and Environmental Safety, vol. 59, no. 2, pp. 151-163.
Donati, C., Drikas, M., Hayes, R. and Newcombe, G. 1994, 'Microcystin-LR adsorption by powdered activated carbon', Water Research, vol. 28, no. 8, pp. 1735-1742.
Drabkova, M., Admiraal, W. and Marsalek, B. 2007, 'Combined exposure to hydrogen peroxide and light - Selective effects on cyanobacteria, green algae, and diatoms', Environmental Science and Technology, vol. 41, no. 1, pp. 309-314.
Drikas, M., Chow, C. W. K., House, J. and Burch, M. D. 2001, 'Toxic Cyanobacteria', American Water Works Association Journal, vol. 93, no. 2, pp. 100-111.
Engstrom-Ost, J., Lehtiniemi, M., Green, S., Kozlowsky-Suzuki, B. and Viitasalo, M. 2002, 'Does cyanobacterial toxin accumulate in mysid shrimps and fish via copepods?' Journal of Experimental Marine Biology and Ecology, vol. 276, no. 1-2, pp. 95-107.

106 8. References
Eriksson, J. E., Meriluoto, J. and Lindholm, T. 1989, 'Accumulation of a peptide toxin from the cyanobacterium Oscillatoria agardhii in the freshwater mussel Anadonta cygnea', Hydrobiologia, vol. 183, no. 3, pp. 211-216.
Falconer, I. R. 1993, 'Measurement of toxins from blue-green algae in water and foodstuffs', in Algal Toxins in Seafood and Drinking Water, ed. I. R. Falconer, Academic Press, London, pp. 165-175.
Falconer, I. R. 1999, 'An overview of problems caused by toxic blue-green algae (cyanobacteria) in drinking and recreational water', Environmental Toxicology, vol. 14, no. 1, pp. 5-12.
Fastner, J., Codd, G. A., Metcalf, J. S., Woitke, P., Wiedner, C. and Utkilen, H. 2002, 'An international intercomparison exercise for the determination of purified microcystin-LR and microcystins in cyanobacterial field material', Analytical and Bioanalytical Chemistry, vol. 374, no. 3, pp. 437-444.
Fastner, J., Flieger, I. and Neumann, U. 1998, 'Optimised extraction of microcystins from field samples- a comparison of different solvents and procedures', Water Research, vol. 32, no. 10, pp. 3177-3181.
Fawell, J., Hart, J., James, H. A. and Parr, W. 1993, 'Blue-green algae and their toxins: analysis, toxicity, treatment, and environmental control', Water Supply, vol. 11, no. 3-4, pp. 109-121.
Fitzgerald, D. J., Cunliffe, D. A. and Burch, M. D. 1999, 'Development of health alerts for cyanobacteria and related toxins in drinking water in South Australia', Environmental Toxicology, vol. 14, no. 1, pp. 203-209.
Fleming, L. E., Rivero, C., Burns, J., Williams, C., Bean, J. A., Shea, K. A. and Stinn, J. 2002, 'Blue green algal (cyanobacterial) toxins, surface drinking water, and liver cancer in Florida', Harmful Algae, vol. 1, pp. 157-168.
Gilroy, D. J., Kauffman, K. W., Hall, R. A., Huang, X. and Chu, F. S. 2000, 'Assessing Potential Health Risks from Microcystin Toxins in Blue–Green Algae Dietary Supplements', Environmental Health Perspectives, vol. 108, no. 5, p. 435.
Glaze, W., Kang, J. and Chapin, D. 1987, 'The chemistry of water treatment processes involving ozone, hydrogen peroxide and ultraviolet radiation', Ozone Science and Engineering, vol. 9, no. 4, pp. 335-352.
Gregor, J. and Marsalek, B. 2004, 'Freshwater phytoplankton quantification by chlorophyll alpha: a comparative study of in vitro, in vivo and in situ methods', Water Research, vol. 38, no. 3, pp. 517-522.
Gregor, J., Marsalek, B. and Sipkova, H. 2007, 'Detection and estimation of potentially toxic cyanobacteria in raw water at the drinking water treatment plant by in vivo fluorescence method', Water Research, vol. 41, no. 1, pp. 228-234.
Griffin, S. L., Herzfeld, M. and Hamilton, D. P. 2001, 'Modelling the impact of zooplankton grazing on phytoplankton biomass during a dinoflagellate bloom in the Swan River Estuary, Western Australia', Ecological Engineering, vol. 16, no. 3, pp. 373-394.

8. References 107
Grutzmacher, G., Bottcher, G., Chorus, I. and Bartel, H. 2002, 'Removal of microcystins by slow sand filtration', Environmental Toxicology, vol. 17, no. 4, pp. 386-394.
Hallegraeff, G. M. 1992, 'Harmful algal blooms in the Australian region', Marine Pollution Bulletin, vol. 25, no. 5, pp. 186-190.
Harada, K.-I. 1996, 'Chemistry and detection of microcystins', in Toxic Microcystis, eds M. F. Watanabe, K.-I. Harada, W. W. Carmichael and H. Fujiki, CRC, Boca Raton, pp. 103-148.
Harada, K.-I., Kondo, F. and Lawton, L. A. 1999, 'Laboratory analysis of cyanotoxins', in Toxic Cyanobacteria in Water, eds I. Chorus and J. Bartram, World Health Organization, London, pp. 369-405.
Heresztyn, T. and Nicholson, B. C. 1997, 'Nodularin concentrations in Lakes Alexandrina and Albert, South Australia, during a bloom of the cyanobacterium (blue-green alga) Nodularia spumigena and degradation of the toxin', Environmental Toxicology and Water Quality, vol. 12, no. 4, pp. 273-282.
Heresztyn, T. and Nicholson, B. C. 2001, 'Determination of cyanobacterial hepatotoxins directly in water using a protein phosphatase inhibition assay', Water Research, vol. 35, no. 13, pp. 3049-3056.
Hiripi, L., Nagy, L., Kalmar, T., Kovacs, A. and Voros, L. 1998, 'Insect (Locusta migratoria migratorioides) test monitoring the toxicity of cyanobacteria', Neurotoxicology, vol. 19, no. 4-5, pp. 605-608.
Hitzfeld, B. C., Hoger, S. J. and Dietrich, D. R. 2000, 'Cyanobacterial toxins: Removal during drinking water treatment, and human risk assessment', Environmental Health Perspectives, vol. 108, pp. 113-122.
Ho, L., Meyn, T., Keegan, A., Hoefel, D., Brookes, J., Sainta, C. P. and Newcombe, G. 2006, 'Bacterial degradation of microcystin toxins within a biologically active sand filter', Water Research, vol. 40, no. 4, pp. 768-774.
Hrudey, S. E., Burch, M. D., Drikas, M. and Gregory, R. 1999, 'Remedial measures', in Toxic cyanobacteria in water: a guide to their public health consequences, monitoring, and management, eds I. Chorus and J. Bartram, World Health Organization, New York, pp. 275-312.
Hyenstrand, P., Metcalf, J. S., Beattie, K. A. and Codd, G. A. 2001, 'Losses of the cyanobacterial toxin microcystin-LR from aqueous solution by adsorpotion during laboratory manipulations', Toxicon, vol. 39, no. 4, pp. 589-594.
Ikawa, M., Phillips, N., Haney, J. F. and Sasner, J. J. 1999, 'Interference by plastic additives in the HPLC determination of microcystin-LR and -YR', Toxicon, vol. 37, pp. 923-929.
Jia, R. B., Zhang, X. H., Zhang, W. H., Zhang, G. M. and Wang, Z. S. 2003, 'Fluctuation of Microcystins in water plant', Journal of Environmental Science and Health, Part A, vol. 38, no. 12, pp. 2867 - 2875.
Jochimsen, E. M., Carmichael, W. W., An, J., Cardo, D. M., Cookson, S. T., Holmes, C. E. M., Antunes, M. B. d. C., Filho, D. A. d. M., Lyra, T. M., Barreto, V. S. T.,

108 8. References
Azevedo, S. M. F. O. and Jarvis, W. R. 1998, 'Liver failure and death after exposure to microcystins at a haemodialysis center in Brazil', New England Journal of Medicine, vol. 338, no. 13, pp. 873-878.
John, W., Raynor, M. W. and Rae, B. 1997, 'Micellar electrokinetic capillary chromatography of algal toxins', Journal of High Resolution Chromatography, vol. 20, no. 1, pp. 34-38.
Jones, G. J. and Orr, P. T. 1994, 'Release and degradation of microcystin following algicide treatment of a Microcystis aeruginosa bloom in a recreational lake, as determined by HPLC and protein phosphatase inhibition assay', Water Research, vol. 28, no. 4, pp. 871-876.
Karner, D. A., Standridge, J. H., Harrington, G. W. and Barnum, R. P. 2001, 'Microcystin algal toxins in source and finished drinking water', American Water Works Association Journal, vol. 93, no. 8, pp. 72-79.
Kaya, K. and Sano, T. 1999, 'Total microcystin determination using erythro-2-methyl-3-(methoxy-d(3))-4-phenylbutyric acid (MMPB-d(3)) as the internal standard', Analytica Chimica Acta, vol. 386, no. 1-2, pp. 107-112.
Kemp, A. and John, J. 2006, 'Microcystins associated with Microcystis dominated blooms in the Southwest Wetlands, Western Australia', Environmental Toxicology, vol. 21, no. 2, pp. 125-130.
Kondo, F., Ikai, Y., Oka, H., Ishikawa, N., Watanabe, M. F., Watanabe, M., Harada, K.-I. and Suzuki, M. 1992, 'Separation and identification of microcystins in cyanobacteria by frit-fast atom bombardment liquid chromatography/mass spectrometry', Toxicon, vol. 30, no. 3, pp. 227-237.
Kull, T. J., Sjovall, O., T , Tammenkoski, M. K., Backlund, P. H. and Meroluoto, J. A. O. 2006, 'Oxidation of the cyanobacterial hepatotoxin Microcystin-LR by chlorine dioxide: Influence of natural organic matter', Environmental Science and Technology, vol. 40, pp. 1504-1510.
Kyselkova, I. and Marsalek, B. 2000, 'Using of Daphnia pulex, Artemia salina and Tubifex tubifex for cyanobacterial microcystins toxicity detection', Biologia, vol. 55, no. 6, pp. 637-643.
Lahti, K., Rapala, J., Fardig, M., Niemela, M. and Sivonen, K. 1997, 'Persistence of cyanobacterial hepatotoxin, microcystin-LR in particulate material and dissolved in lake water ', Water Research, vol. 31, no. 5, pp. 1005-1012.
Lam, A. K. Y., Prepas, E. E., Spink, D. and Hrudey, S. E. 1995, 'Chemical control of hepatotoxic phytoplankton blooms: implications for human health', Water Research, vol. 29, no. 8, pp. 1845-1854.
Lambert, T. W., Holmes, C. F. B. and Hrudey, S. E. 1996, 'Adsorption of microcystin-LR by activated carbon and removal in full scale water treatment', Water Research, vol. 30, no. 6, pp. 1411-1422.

8. References 109
Lawton, L. A., Cornish, B. J. P. A. and MacDonald, A. W. R. 1998, 'Removal of cyanobacterial toxins (microcystins) and cyanobacterial cells from drinking water using domestic water filters', Water Research, vol. 32, no. 3, pp. 633-638.
Lawton, L. A., Edwards, C., Beattie, K. A., Pleasance, S., Dear, G. J. and Codd, G. A. 1995, 'Isolation and characterization of microcystins from laboratory cultures and environmental samples of Microcystis aeruginosa and from an associated animal toxicosis', Natural Toxins, vol. 3, pp. 50-57.
Lawton, L. A., Edwards, C. and Codd, G. A. 1994, 'Extraction and high-performance liquid chromatographic method for the determination of microcystins in raw and treated waters', Analyst, vol. 119, no. 7, pp. 1525-1530.
Lawton, L. A. and Robertson, P. K. J. 1999, 'Physico-chemical treatment methods for the removal of microcystins (cyanobacterial hepatotoxins) from potable waters', Chemical Society Review, vol. 28, no. 4, pp. 217-224.
Leboulanger, C., Dorigo, U., Jacquet, S., Le Berre, B., Paolini, G. and Humbert, J. F. 2002, 'Application of a submersible spectrofluorometer for rapid monitoring of freshwater cyanobacterial blooms: a case study', Aquatic Microbial Ecology, vol. 30, no. 1, pp. 83-89.
Lupinkova, L. and Komenda, J. 2004, 'Oxidative modification of the Photosystem II D1 protein by reactive oxygen species: From isolated protein to cyanobacterial cells', Photochemistry and Photobiology, vol. 79, no. 2, pp. 152-162.
MacKintosh, C., Beattie, K. A., Klumpp, S., Cohen, P. and Codd, G. A. 1990, 'Cyanobacterial microcystin-LR is a potent and specific inhibitor of protein phosphatases 1 and 2A from both mammals and higher plants', FEBS Letters, vol. 264, pp. 187-192.
Mathys, W. and Surholt, B. 2004, 'Analysis of microcystins in freshwater samples using high performance liquid chromatography and an enzyme-linked immunosorbent assay', International Journal of Hygiene and Environmental Health, vol. 207, no. 6, pp. 601-605.
McElhiney, J. and Lawton, L. A. 2005, 'Detection of the cyanobacterial hepatotoxins microcystins', Toxicology and Applied Pharmacology, vol. 203, no. 3, pp. 219-230.
McElhiney, J., Lawton, L. A. and Leifert, C. 2001, 'Investigations into the inhibitory effects of microcystins on plant growth, and toxicity of plant tissues following exposure', Toxicon, vol. 39, no. 9, pp. 1411-1420.
Meriluoto, J., Kincaid, B., Smyth, M. R. and Wasberg, M. 1998, 'Electrochemical detection of microcystins, cyanobacterial peptide hepatotoxins, following high performance liquid chromatography', Journal of Chromatography A, vol. 810, no. 1-2, pp. 226-230.
Metcalf, J. S., Bell, S. G. and Codd, G. A. 2000a, 'Production of novel polyclonal antibodies against the cyanobacterial toxin microcystin-LR and their application for the detection and quantification of microcystins and nodularin', Water Research, vol. 34, no. 10, pp. 2761-2769.

110 8. References
Metcalf, J. S., Bell, S. G. and Codd, G. A. 2001, 'Colorimetric Immuno-Protein Phosphatase Inhibition Assay for specific detection of Microcystins and Nodularins of cyanobacteria', Applied and Environmental Microbiology, vol. 67, no. 2, pp. 904-909.
Metcalf, J. S., Hyenstrand, P., Beattie, K. A. and Codd, G. A. 2000b, 'Effects of physicochemical variables and cyanobacterial extracts on the immunoassay of microcystin-LR by two ELISA kits', Journal of Applied Microbiology, vol. 89, no. 3, pp. 532-538.
Mohamed, Z. A. 2001, 'Alum and lime-alum removal of toxic and nontoxic phytoplankton from the Nile River water: laboratory study', Water Resources Management, vol. 15, no. 4, pp. 213-221.
Mohamed, Z. A., Carmichael, W. W., An, J. and El-Sharouny, H. M. 1999, 'Activated carbon removal efficiency of microcystins in an aqueous cell extract of Microcystis aeruginosa and Oscillatoria tenuis strains isolated from Egyptian freshwaters', Environmental Toxicology, vol. 14, no. 1, pp. 197-201.
Mountfort, D. O., Holland, P. and Sprosen, J. 2005, 'Method for detecting classes of microcystins by combination of protein phosphatase inhibition assay and ELISA: comparison with LC-MS', Toxicon, vol. 45, no. 2, pp. 199-206.
Murray-Gulde, C. L., Heatley, J. E., Schwartzman, A. L. and Rodgers, J. H. 2002, 'Algicidal Effectiveness of Clearigate, Cutrine-Plus, and Copper Sulfate and Margins of Safety Associated with Their Use', Archives of Environmental Contamination and Toxicology, vol. 43, no. 1, pp. 19-27.
Nakano, K., Lee, T. J. and Matsumura, M. 2001, 'In situ algal bloom control by the integration of ultrasonic radiation and jet circulation to flushing', Environmental Science and Technology, vol. 35, no. 24, pp. 4941-4946.
Namikoshi, M., Rinehart, K. L., Sakai, R., Stotts, R. R., Dahlem, A. M., Beasley, V. R., Carmichael, W. W. and Evans, W. R. 1992, 'Identification of 12 hepatotoxins from a Homer Lake bloom of the cyanobacteria Microcystis aeruginosa, Microcystis viridis, and Microcystis wesenbergii. Nine new microcystins', Journal of Organic Chemistry, vol. 57, no. 3, pp. 866-872.
Neumann, U. and Weckesser, J. 1998, 'Elimination of microcystin peptide toxins from water by reverse osmosis', Environmental Toxicology and Water Quality, vol. 13, no. 2, pp. 143-148.
Nicholson, B. C. and Burch, M. D. 2001, Evaluation of analytical methods for detection and quantification of cyanotoxins in relation to Australian drinking water guidelines, National Health and Medical Research Council of Australia.
Nicholson, B. C., Rositano, J. and Burch, M. D. 1994, 'Destruction of cyanobacterial peptide hepatotoxins by chlorine and chloramine', Water Research, vol. 28, no. 6, pp. 1297-1303.
Nishiwaki-Matsushima, R., Ohta, T., Nishiwaki, S., Suganuma, M., Kiyomi Kohyama, K., Ishikawa, T., Carmichael, W. M. and Fujiki, H. 1992, 'Liver tumor promotion

8. References 111
by the cyanobacterial cyclic peptide toxin microcystin-LR', Journal of Cancer Research and Clinical Oncology, vol. 118, no. 6, pp. 420-424.
Ojanpera, I., Pelander, A., Vuori, E., Himberg, K., Waris, M. and Niinivaara, K. 1995, 'Detection of cyanobacterial hepatotoxins by TLC', Journal of Planar Chromatography, vol. 8, no. 1, pp. 69-72.
Onyewuenyi, N. and Hawkins, P. 1996, 'Separation of toxic peptides (microcystins) in capillary electrophoresis, with the aid of organic mobile phase modifiers', Journal of Chromatography A, vol. 749, no. 1-2, pp. 271-278.
Orr, P. T., Jones, G. J., Hunter, R. A. and Berger, K. 2003, 'Exposure of beef cattle to sub-clinical doses of Microcystis aeruginosa: toxin bioaccumulation, physiological effects and human health risk assessment', Toxicon, vol. 41, no. 5, p. 613.
Park, H.-D., Sasaki, Y., Maruyama, T., Yanagisawa, E., Hiraishi, A. and Kato, K. 2001, 'Degradation of the cyanobacterial hepatotoxin Microcystin by a new bacterium isolated from a hypertrophic lake', Environmental Toxicology, vol. 16, no. 4, pp. 337-343.
Pelander, A., Ojanpera, I., Sivonen, K., Himberg, K., Waris, M., Niinivaara, K. and Vuori, E. 1996, 'Screening for cyanobacterial toxins in bloom and strain samples by thin layer chromatography', Water Research, vol. 30, no. 6, pp. 1464-1470.
Pelander, A., Ojanpera, I. and Vuori, E. 1998, 'Analysis of cyanobacterial hepatotoxins by overpressured layer chromatography', Journal of Planar Chromatography, vol. 11, no. 5, pp. 365-369.
Pennifold, M. and Davies, J. 2001, 'Macrofauna and nutrient cycling in the Swan River Estuary, Western Australia: experimental results', Hydrological Processes, vol. 15, no. 13, pp. 2537-2553.
Perez, S. and Aga, D. S. 2005, 'Recent advances in the sample preparation, liquid chromatography tandem mass spectrometric analysis and environmental fate of microcystins in water', Trends in Analytical Chemistry, vol. 24, no. 7, pp. 658-670.
Pilotto, L. S., Douglas, R. M., Burch, M. D., Cameron, S., Beers, M., Rouch, G. J., Robinson, P., Kirk, M., Cowie, C. T., Hardiman, S., Moore, C. and Attewell, R. G. 1997, 'Health effects of exposure to cyanobacteria (blue-green algae) during recreational water-related activities', Australian and New Zealand Journal of Public Health, vol. 21, no. 6, pp. 562-566.
Poon, G. K., Priestley, I. M., Hunt, S. M., Fawell, J. K. and Codd, G. A. 1987, 'Purification procedure for peptide toxins from the cyanobacterium Microcystis aeruginosa involving high-performance liquid chromatography', Journal of Chromatography, vol. 387, pp. 551-555.
Rapala, J., Berg, K. A., Lyra, C., Niemi, R. M., Manz, W., Suomalainen, S., Paulin, L. and Lahti, K. 2005, 'Paucibacter toxinivorans gen. nov., sp. nov., a bacterium that degrades cyclic cyanobacterial hepatotoxins microcystins and nodularin',

112 8. References
International Journal of Systematic and Evolutionary Microbiology, vol. 55, no. 4, pp. 1563-1568.
Rapala, J., Erkomaa, K., Kukkonen, J., Sivonen, K. and Lahti, K. 2002, 'Detection of microcystins with protein phosphatase inhibition assay, high-performance liquid chromatography–UV detection and enzyme-linked immunosorbent assay: Comparison of methods', Analytica Chimica Acta, vol. 466, no. 2, pp. 213-231.
Ressom, R., Soong, F. S., Fitzgerald, J., Turczynowicz, L., El Saadi, O., Roder, D., Maynard, T. and Falconer, I. R. 1994, Health effects of toxic cyanobacteria (blue-green algae), National Health and Medical Research Council of Australia, Commonwealth Department of Human Services and Health, Australian Government Publishing Service, Canberra.
Rinehart, K. L., Namikoshi, M. and Choi, B. W. 1994, 'Structure and biosynthesis of toxins from blue-green algae (cyanobacteria)', Journal of Applied Phycology, vol. 6, no. 2, pp. 159-176.
Robson, B. J. and Hamilton, D. P. 2004, 'Three dimensional modelling of a Microcystis bloom event in the Swan River Estuary, Western Australia', Ecological Modelling, vol. 174, no. 1-2, pp. 203-222.
Rodrıguez, E., Majadoa, M. E., Meriluoto, J. and Aceroa, J. L. 2007, 'Oxidation of microcystins by permanganate: Reaction kinetics and implications for water treatment', Water Research, vol. 41, no. 1, pp. 102-110.
Rositano, J. and Nicholson, B. C. 1994, 'A method for the detection of cyanobacterial peptide toxins by HPLC', in Detection Methods for Cyanobacterial Toxins, eds G. A. Codd, T. M. Jeffries, C. W. Keevil and E. Potter, Royal Society of Chemistry, Cabridge, pp. 155-157.
Rositano, J., Nicholson, B. C. and Picronne, P. 1998, 'Destruction of cyanobacterial toxins by ozone', Ozone Science and Engineering, vol. 20, no. 3, pp. 223-238.
Samuilov, V. D., Bezryadnov, D. B., Gusev, M. V., Kitashov, A. V. and Fedorenko, T. A. 2001, 'Hydrogen peroxide inhibits photosynthetic electron transport in cells of cyanobacteria', Biochemistry-Moscow, vol. 66, no. 6, pp. 640-645.
Sano, T., Nohara, K., Shiraishi, F. and Kaya, K. 1992, 'A method for micro-determination of total microcystin content in water blooms of cyanobacteria (blue-green algae)', International Journal of Environmental Analytical Chemistry, vol. 49, pp. 163-170.
Siren, H., Jussila, M., Liu, H. W., Peltoniemi, S., Sivonen, K. and Riekkola, M. L. 1999, 'Separation, purity testing and identification of cyanobacterial hepatotoxins with capillary electrophoresis and electrospray mass spectrometry', Journal of Chromatography A, vol. 839, no. 1-2, pp. 203-215.
Sivonen, K. and Jones, G. J. 1999, 'Cyanobacterial Toxins', in Toxic Cyanobacteria in Water: A guide to their public health consequences, monitoring and management, eds I. Chorus and J. Bartram, World Health Organization, London, p. 400.

8. References 113
Svrcek, C. and Smith, D. W. 2004, 'Cyanobacteria toxins and the current state of knowledge on water treatment options: a review', Journal of Environmental Engineering and Science, vol. 3, no. 3, pp. 155-185.
Tanaka, Y., Takenaka, S., Matsuo, H., Kitamori, S. and Tokiwa, H. 1993, 'Levels of microcystins in Japanese lakes', Toxicology and Environmental Chemistry, vol. 39, no. 1-2, pp. 21-27.
Teixeira, M. R. and Rosa, M. J. 2006a, 'Integration of dissolved gas flotation and nanofiltration for M. aeruginosa and associated microcystins removal', Water Research, vol. 40, no. 19, pp. 3612-3620.
Teixeira, M. R. and Rosa, M. J. 2006b, 'Neurotoxic and hepatotoxic cyanotoxins removal by nanofiltration', Water Research, vol. 40, no. 15, pp. 2837-2846.
Torokne, A. K., Laszlo, E., Chorus, I., Sivonen, K. and Barbosa, F. A. R. 2000, 'Cyanobacterial toxins detected by Thamnotoxkit (A double blind experiment)', Environmental Toxicology, vol. 15, no. 5, pp. 549-553.
Tsuji, K., Naito, S., Kondo, F., Ishikawa, N., Watanabe, M. F., Suzuki, M. and Harada, K.-i. 1994, 'Stability of Microcystins from cyanobacteria: Effect of light on decomposition and isomerisation', Environmental Science and Technology, vol. 28, no. 1, pp. 173-177.
Tsuji, K., Watanuki, T., Kondo, F., Watanabe, M. F., Nakazawa, H., Suzuki, M., Uchida, H. and Harada, K.-i. 1997, 'Stability of microcystins from cyanobacteria- IV. Effect of chlorination on decomposition', Toxicon, vol. 35, no. 7, pp. 1033-1041.
Ueno, Y., Nagata, S., Tsutsumi, T., Hasegawa, A., Watanabe, M. F., Park, H.-D., Chen, G.-C., Chen, G. and Yu, S.-Z. 1996, 'Detection of microcystins, a blue-green algal hepatotoxin, in drinking water sampled in Haimen and Fusui, endemic areas of primary liver cancer in China, by highly sensitive immunoassay', Carcinogenesis, vol. 17, no. 6, pp. 1317-1321.
van den Hoek, C., Mann, D. G. and Jahns, H. M. 1995, Algae: An Introduction to Phycology, Cambridge University Press, Cambridge.
Vasconcelos, V. M. 1995, 'Uptake and depuration of the heptapeptide toxin microcystin-LR in Mytilus galloprovincialis', Aquatic Toxicology, vol. 32, no. 2-3, pp. 227-237.
Ward, C. J., Beattie, K. A., Lee, E. Y. C. and Codd, G. A. 1997, 'Colorimetric protein phosphatase inhibition assay of laboratory strains and natural blooms of cyanobacteria: comparisons with high-performance liquid chromatographic analysis for microcystins', FEMS Microbiology Letters, vol. 153, pp. 465-473.
Water Corporation 2006, Perth's Wastewater System: Protecting our Health and our Environment, Water Corporation, Perth.
Welker, M. and Steinberg, C. 2000, 'Rates of humic substance desensitized degradation of microcystin-LR in natural waters', Environmental Science and Technology, vol. 34, pp. 3415-3419.

114 8. References
Welker, M., Steinberg, C. and Jones, G. J. 2001, 'Release and persistance of Microcystins in natural waters', in Cyanotoxins: Occurrence, Causes, Consequences, ed. I. Chorus, Springer.
Wiegand, C. and Pflugmacher, S. 2005, 'Ecotoxicological effects of selected cyanobacterial secondary metabolites a short review', Toxicology and Applied Pharmacology, vol. 203, no. 3, pp. 201-218.
World Health Organization 1993, 'Chemical Aspects', in Guidelines for Drinking-Water Quality, Second edn, World Health Organization, Geneva.
World Health Organization 2003, 'Algae and Cyanobacteria in Fresh Water', in Guidelines for Safe Recreational Water Environments: Volume 1: Coastal and freshwaters, World Health Organization, Geneva.
Yousef, N., Pistorius, E. K. and Michel, K. P. 2003, 'Comparative analysis of idiA and isiA transcription under iron starvation and oxidative stress in Synechococcus elongatus PCC 7942 wild-type and selected mutants', Archives of Microbiology, vol. 180, no. 6, pp. 471-483.

Appendix A
bbe-Moldaenke Fluoroprobe Data

Table 27: Fluoroprobe data for chlorophyll a concentration for the control, repetition 1
Time since addition (h)
Chlorophyta (μgL-1)
Standard Error
Cyanobacteria (μgL-1)
Standard Error
Diatoms (μgL-1)
Standard Error
Cryptophyta (μgL-1)
Standard Error
Yellow Substances (μgL-1)
Standard Error
Total algal (μgL-1)
Standard Error
0.000 57.582 0.092 17.890 0.110 16.671 0.141 6.922 0.215 5.372 0.028 99.065 0.091 1.033 63.871 0.586 18.890 0.131 20.192 0.119 0.000 0.000 6.298 0.027 102.013 0.824 2.050 52.993 0.849 23.161 0.880 20.477 1.534 4.396 2.365 6.975 0.197 101.026 1.037 3.000 73.977 0.848 21.589 0.199 23.027 0.258 0.369 0.169 5.789 0.024 118.962 1.195 4.033 74.166 0.788 21.050 0.243 22.962 0.367 2.773 0.261 5.048 0.018 120.950 1.164 5.033 73.292 0.819 20.829 0.132 22.578 0.255 3.754 0.550 4.300 0.032 120.452 1.334 5.983 75.358 0.571 22.101 0.242 24.813 0.361 3.222 0.251 4.353 0.015 125.495 0.930
17.950 58.059 0.230 16.589 0.094 12.175 0.195 8.025 0.293 5.672 0.024 94.847 0.252 23.983 63.252 0.173 15.891 0.047 12.873 0.187 1.400 0.164 5.334 0.020 93.420 0.113 48.000 89.532 0.258 20.033 0.169 14.401 0.337 7.561 0.513 6.014 0.056 131.528 0.244
Table 28: Fluoroprobe data for chlorophyll a concentration for the control, repetition 2
Time since addition (h)
Chlorophyta (μgL-1)
Standard Error
Cyanobacteria (μgL-1)
Standard Error
Diatoms (μgL-1)
Standard Error
Cryptophyta (μgL-1)
Standard Error
Yellow Substances (μgL-1)
Standard Error
Total algal (μgL-1)
Standard Error
0.000 57.382 0.332 18.541 0.087 20.604 0.069 2.785 0.072 4.973 0.017 99.310 0.405 1.000 62.039 0.705 17.402 0.134 19.668 0.178 0.000 0.000 5.915 0.024 99.108 1.011 2.017 59.144 1.139 15.112 0.176 18.694 0.275 0.000 0.000 4.796 0.020 92.949 1.586 2.983 68.611 0.948 17.933 0.214 19.311 0.439 2.375 0.311 5.109 0.037 108.233 1.358 4.000 47.471 0.710 12.668 0.118 13.660 0.265 0.202 0.110 3.715 0.026 74.002 1.014 5.000 65.391 0.792 18.172 0.117 20.931 0.217 0.000 0.000 3.823 0.017 104.496 1.114 5.950 65.071 0.440 18.857 0.106 19.507 0.180 0.270 0.110 3.685 0.018 103.704 0.629 17.933 38.891 0.097 9.950 0.045 6.208 0.078 0.887 0.109 4.309 0.009 55.937 0.093 23.967 74.298 0.289 19.843 0.060 17.313 0.200 0.149 0.100 6.517 0.014 111.599 0.238 47.967 97.559 0.367 20.585 0.042 14.326 0.127 7.882 0.146 6.392 0.036 140.348 0.268

Table 29: Fluoroprobe data for chlorophyll a concentration for the control, repetition 3
Time since addition (h)
Chlorophyta (μgL-1)
Standard Error
Cyanobacteria (μgL-1)
Standard Error
Diatoms (μgL-1)
Standard Error
Cryptophyta (μgL-1)
Standard Error
Yellow Substances (μgL-1)
Standard Error
Total algal (μgL-1)
Standard Error
0.000 56.797 0.343 18.223 0.085 21.660 0.093 2.810 0.089 4.521 0.031 99.490 0.421 0.983 54.385 0.650 15.930 0.105 16.789 0.157 1.815 0.270 5.663 0.026 88.916 0.939 2.000 78.157 0.967 22.510 0.138 23.530 0.298 2.555 0.568 6.113 0.047 126.752 1.626 2.967 77.332 1.429 19.690 0.304 23.899 0.524 1.902 0.251 5.256 0.022 122.825 2.046 4.000 62.988 1.101 16.683 0.211 20.150 0.419 0.613 0.235 3.950 0.035 100.437 1.552 4.967 85.991 1.108 24.591 0.171 28.788 0.333 0.025 0.025 4.119 0.029 139.394 1.593 5.917 84.112 0.985 24.898 0.212 26.927 0.322 2.559 0.289 4.271 0.051 138.497 1.464 17.933 64.598 0.105 17.192 0.091 13.253 0.177 2.415 0.246 5.596 0.028 97.459 0.111 23.967 67.481 0.458 15.438 0.023 11.414 0.175 0.000 0.000 5.920 0.015 94.333 0.371 47.950 123.790 0.881 25.405 0.082 18.920 0.190 4.721 0.206 6.638 0.039 172.833 0.993
Table 30: Fluoroprobe data for chlorophyll a concentration with 2.96 x 10⁻³ gL-1 hydrogen peroxide addition, repetition 1
Time since addition (h)
Chlorophyta (μgL-1)
Standard Error
Cyanobacteria (μgL-1)
Standard Error
Diatoms (μgL-1)
Standard Error
Cryptophyta (μgL-1)
Standard Error
Yellow Substances (μgL-1)
Standard Error
Total algal (μgL-1)
Standard Error
0.000 53.424 2.147 26.317 0.780 17.447 0.412 1.381 1.104 8.598 0.230 98.570 2.231 0.950 54.478 2.353 23.149 0.668 15.794 0.612 0.723 0.534 8.900 0.108 94.142 3.164 1.917 83.775 3.177 34.525 0.925 18.810 0.420 0.000 0.000 11.908 0.217 137.108 4.005 2.933 42.252 0.468 16.723 0.251 8.272 0.428 8.542 0.830 7.988 0.075 75.786 1.454 3.967 39.563 0.687 13.684 0.570 6.992 0.828 10.555 0.999 7.282 0.255 70.795 1.285 4.900 42.549 1.021 13.155 0.570 4.439 0.950 14.977 0.987 7.948 0.186 75.122 1.763 5.900 47.392 0.512 20.422 0.515 12.946 0.576 1.754 0.572 7.368 0.072 82.517 0.620
17.867 71.542 0.879 20.670 1.285 10.994 1.802 15.292 2.562 8.520 0.209 118.501 1.471 43.850 57.557 0.778 14.060 0.596 7.949 0.875 6.458 1.270 8.938 0.115 86.025 1.221

Table 31: Fluoroprobe data for chlorophyll a concentration with 2.96 x 10⁻³ gL-1 hydrogen peroxide addition, repetition 2
Time since addition (h)
Chlorophyta (μgL-1)
Standard Error
Cyanobacteria (μgL-1)
Standard Error
Diatoms (μgL-1)
Standard Error
Cryptophyta (μgL-1)
Standard Error
Yellow Substances (μgL-1)
Standard Error
Total algal (μgL-1)
Standard Error
0.000 61.131 1.846 29.800 0.704 21.761 0.582 0.336 0.336 9.195 0.426 113.027 2.225 0.950 67.031 3.056 26.302 1.076 11.942 0.341 0.238 0.238 10.990 0.508 105.514 3.743 1.917 54.145 1.096 22.608 0.471 13.061 0.378 6.502 1.792 9.145 0.128 96.316 0.718 2.950 46.306 0.462 20.339 0.371 12.413 0.299 1.502 1.116 7.870 0.133 80.560 0.583 4.250 36.306 0.333 14.024 0.222 9.193 0.208 5.582 0.513 6.633 0.163 65.107 0.450 4.933 33.525 0.523 13.839 0.236 7.487 0.345 1.565 0.591 6.701 0.095 56.415 0.666 5.900 45.688 0.404 17.591 0.435 10.998 0.537 7.776 1.290 6.909 0.103 82.055 0.875
17.867 62.647 0.949 18.488 1.184 13.995 1.301 11.659 2.048 7.605 0.162 106.794 1.613 43.983 47.492 0.556 10.454 0.812 3.258 1.039 9.738 1.414 7.897 0.084 70.941 1.198
Table 32: Fluoroprobe data for chlorophyll a concentration with 2.96 x 10⁻³ gL-1 hydrogen peroxide addition, repetition 3
Time since addition (h)
Chlorophyta (μgL-1)
Standard Error
Cyanobacteria (μgL-1)
Standard Error
Diatoms (μgL-1)
Standard Error
Cryptophyta (μgL-1)
Standard Error
Yellow Substances (μgL-1)
Standard Error
Total algal (μgL-1)
Standard Error
0.000 34.577 0.761 16.545 0.408 12.896 0.490 1.476 0.991 6.987 0.133 65.493 0.808 0.967 64.128 1.890 24.997 0.519 14.632 0.568 0.446 0.446 10.256 0.111 104.202 2.702 1.900 59.443 1.153 23.908 0.448 11.710 1.202 6.987 1.889 9.738 0.293 102.046 1.210 2.933 49.444 0.456 17.366 0.969 8.458 1.055 11.811 1.330 7.969 0.100 87.080 1.087 4.233 46.398 0.777 19.376 0.496 13.061 0.935 4.341 1.229 7.686 0.172 83.177 0.800 4.917 41.176 0.363 17.861 0.269 11.404 0.455 1.812 0.787 7.393 0.243 72.254 0.207 5.883 44.078 0.659 18.389 0.262 10.075 0.427 2.286 0.598 7.557 0.155 74.826 0.538
17.850 63.259 0.285 20.184 0.976 13.249 1.128 6.892 1.772 6.861 0.128 103.583 0.615 43.967 75.713 0.976 17.841 2.238 10.703 3.316 13.985 4.115 7.776 0.216 118.244 2.450

Table 33: Fluoroprobe data for chlorophyll a concentration with 2.96 x 10⁻² gL-1 hydrogen peroxide addition, repetition 1
Time since addition (h)
Chlorophyta (μgL-1)
Standard Error
Cyanobacteria (μgL-1)
Standard Error
Diatoms (μgL-1)
Standard Error
Cryptophyta (μgL-1)
Standard Error
Yellow Substances (μgL-1)
Standard Error
Total algal (μgL-1)
Standard Error
0.000 20.749 0.186 6.719 0.033 8.052 0.064 0.000 0.000 3.666 0.006 35.520 0.280 0.950 10.956 0.082 5.185 0.034 4.358 0.038 0.064 0.038 4.070 0.013 20.561 0.136 1.867 5.340 0.050 3.513 0.011 2.688 0.011 0.000 0.000 3.574 0.005 11.540 0.052 2.900 5.732 0.016 3.702 0.005 2.362 0.015 0.000 0.000 3.480 0.005 11.798 0.015 3.933 3.473 0.013 2.885 0.003 1.670 0.010 0.000 0.000 3.251 0.004 8.028 0.014 4.800 3.831 0.024 3.070 0.005 1.609 0.007 0.000 0.000 3.208 0.004 8.510 0.024 5.850 3.071 0.022 2.922 0.003 1.383 0.008 0.000 0.000 3.082 0.002 7.375 0.017 17.817 9.887 0.053 3.554 0.007 2.231 0.044 0.014 0.012 3.375 0.006 15.685 0.030 23.833 14.600 0.027 3.683 0.019 2.339 0.015 0.000 0.000 3.290 0.008 20.621 0.038 47.833 36.610 0.209 7.643 0.068 4.668 0.046 0.000 0.000 4.618 0.019 48.920 0.287
Table 34: Fluoroprobe data for chlorophyll a concentration with 2.96 x 10⁻² gL-1 hydrogen peroxide addition, repetition 2
Time since addition (h)
Chlorophyta (μgL-1)
Standard Error
Cyanobacteria (μgL-1)
Standard Error
Diatoms (μgL-1)
Standard Error
Cryptophyta (μgL-1)
Standard Error
Yellow Substances (μgL-1)
Standard Error
Total algal (μgL-1) Error
0.000 19.124 0.151 6.383 0.024 7.741 0.044 0.000 0.000 3.628 0.006 33.247 0.213 0.933 10.677 0.082 4.874 0.012 4.036 0.021 0.000 0.000 4.087 0.008 19.588 0.107 1.867 5.514 0.036 3.669 0.007 2.420 0.023 0.000 0.000 3.592 0.007 11.603 0.049 2.883 6.215 0.039 3.594 0.009 2.242 0.014 0.000 0.000 3.559 0.005 12.051 0.042 3.900 2.888 0.013 2.841 0.004 1.407 0.007 0.000 0.000 3.240 0.004 7.137 0.010 4.783 5.457 0.039 3.479 0.008 1.844 0.011 0.000 0.000 3.314 0.006 10.776 0.052 5.833 3.540 0.011 2.900 0.003 1.442 0.011 0.000 0.000 3.133 0.004 7.882 0.011 17.800 5.662 0.027 2.608 0.006 1.343 0.020 0.000 0.000 3.100 0.005 9.613 0.013 23.817 17.892 0.019 3.740 0.020 1.940 0.009 0.000 0.000 3.590 0.011 23.570 0.021 47.817 24.321 0.113 5.134 0.038 3.287 0.007 0.000 0.000 3.894 0.010 32.743 0.152

Table 35: Fluoroprobe data for chlorophyll a concentration with 2.96 x 10⁻² gL-1 hydrogen peroxide addition, repetition 3
Time since addition (h)
Chlorophyta (μgL-1)
Standard Error
Cyanobacteria (μgL-1)
Standard Error
Diatoms (μgL-1)
Standard Error
Cryptophyta (μgL-1)
Standard Error
Yellow Substances (μgL-1)
Standard Error
Total algal (μgL-1)
Standard Error
0.000 14.307 0.099 5.185 0.015 5.774 0.032 0.000 0.000 3.433 0.004 25.265 0.143 0.933 8.730 0.080 4.295 0.013 3.488 0.027 0.000 0.000 3.836 0.007 16.512 0.115 1.883 4.471 0.026 3.303 0.007 2.271 0.011 0.000 0.000 3.352 0.007 10.045 0.038 2.883 3.370 0.017 2.744 0.007 1.703 0.014 0.000 0.000 3.241 0.005 7.818 0.020 3.900 2.373 0.020 2.557 0.004 1.241 0.009 0.000 0.000 2.994 0.003 6.171 0.014 4.817 2.554 0.016 2.507 0.004 1.280 0.008 0.000 0.000 2.975 0.004 6.339 0.016 5.833 2.168 0.015 2.394 0.005 1.120 0.004 0.000 0.000 2.875 0.003 5.683 0.018 17.800 11.901 0.042 5.251 0.024 4.947 0.032 0.028 0.020 3.098 0.009 22.128 0.061 23.800 9.446 0.023 2.959 0.012 2.270 0.010 0.000 0.000 2.873 0.004 14.673 0.037 47.817 20.696 0.074 4.733 0.034 2.449 0.020 0.000 0.000 3.413 0.010 27.878 0.119
Table 36: Fluoroprobe data for chlorophyll a concentration with 1.48 x 10⁻¹ gL-1 hydrogen peroxide addition, repetition 1
Time since addition (h)
Chlorophyta (μgL-1)
Standard Error
Cyanobacteria (μgL-1)
Standard Error
Diatoms (μgL-1)
Standard Error
Cryptophyta (μgL-1)
Standard Error
Yellow Substances (μgL-1)
Standard Error
Total algal (μgL-1)
Standard Error
0.000 16.831 0.139 6.304 0.032 6.905 0.049 0.396 0.092 3.651 0.011 30.435 0.187 1.017 9.787 0.045 5.285 0.007 4.082 0.022 0.000 0.000 4.041 0.011 19.153 0.058 1.933 7.060 0.045 4.114 0.018 3.173 0.023 0.000 0.000 3.691 0.009 14.347 0.071 2.950 4.158 0.044 3.027 0.011 1.898 0.008 0.000 0.000 3.244 0.007 9.087 0.060 3.983 6.406 0.055 3.056 0.020 2.622 0.028 0.000 0.000 3.296 0.005 12.086 0.102 4.867 8.020 0.068 3.384 0.020 2.994 0.017 0.000 0.000 3.037 0.005 14.396 0.100 5.900 8.258 0.028 2.974 0.010 3.233 0.011 0.000 0.000 2.877 0.005 14.464 0.043 17.883 0.000 0.000 1.422 0.004 0.000 0.000 0.000 0.000 2.154 0.002 1.422 0.004 23.900 0.000 0.000 1.101 0.006 0.000 0.000 0.147 0.009 1.958 0.003 1.246 0.008 47.883 0.000 0.000 0.986 0.004 0.000 0.000 0.111 0.004 1.252 0.004 1.097 0.004

Table 37: Fluoroprobe data for chlorophyll a concentration with 1.48 x 10⁻¹ gL-1 hydrogen peroxide addition, repetition 2
Time since addition (h)
Chlorophyta (μgL-1)
Standard Error
Cyanobacteria (μgL-1)
Standard Error
Diatoms (μgL-1)
Standard Error
Cryptophyta (μgL-1)
Standard Error
Yellow Substances (μgL-1)
Standard Error
Total algal (μgL-1)
Standard Error
0.000 18.720 0.080 6.500 0.009 7.413 0.019 0.000 0.000 3.758 0.005 32.632 0.099 1.000 9.288 0.040 5.130 0.015 4.378 0.046 0.106 0.045 3.986 0.013 18.907 0.057 1.917 5.942 0.051 3.813 0.017 3.001 0.018 0.000 0.000 3.826 0.008 12.755 0.058 2.933 5.222 0.053 3.400 0.015 2.346 0.024 0.000 0.000 3.572 0.006 10.968 0.090 3.967 7.023 0.078 3.698 0.027 2.913 0.018 0.000 0.000 3.467 0.010 13.635 0.117 4.850 6.989 0.036 3.105 0.011 2.774 0.020 0.000 0.000 3.297 0.007 12.869 0.057 5.883 8.738 0.026 3.042 0.009 3.227 0.012 0.000 0.000 3.288 0.008 15.007 0.031 17.867 0.806 0.013 1.780 0.003 0.987 0.008 0.000 0.000 2.586 0.003 3.574 0.009 23.883 0.000 0.000 1.318 0.005 0.000 0.000 0.004 0.004 2.287 0.002 1.322 0.004 47.867 0.000 0.000 1.169 0.006 0.000 0.000 0.054 0.011 1.461 0.002 1.224 0.007
Table 38: Fluoroprobe data for chlorophyll a concentration with 1.48 x 10⁻¹ gL-1 hydrogen peroxide addition, repetition 3
Time since addition (h)
Chlorophyta (μgL-1)
Standard Error
Cyanobacteria (μgL-1)
Standard Error
Diatoms (μgL-1)
Standard Error
Cryptophyta (μgL-1)
Standard Error
Yellow Substances (μgL-1)
Standard Error
Total algal (μgL-1)
Standard Error
0.000 17.175 0.070 5.997 0.009 6.794 0.026 0.000 0.000 3.561 0.007 29.966 0.095 0.967 12.667 0.060 5.933 0.012 5.399 0.022 0.000 0.000 4.157 0.011 23.998 0.060 1.883 8.028 0.061 4.338 0.019 3.671 0.019 0.000 0.000 3.698 0.006 16.035 0.062 2.900 6.758 0.074 3.762 0.021 2.780 0.019 0.000 0.000 3.351 0.005 13.300 0.108 3.950 6.729 0.064 3.642 0.008 2.623 0.024 0.000 0.000 3.144 0.011 12.992 0.079 4.817 7.689 0.043 3.319 0.014 3.043 0.018 0.000 0.000 3.098 0.006 14.054 0.069 5.867 8.193 0.025 2.963 0.006 3.355 0.010 0.000 0.000 2.903 0.006 14.510 0.035 17.817 0.000 0.000 1.378 0.005 0.000 0.000 0.041 0.007 2.241 0.002 1.418 0.004 23.850 0.000 0.000 1.104 0.005 0.000 0.000 0.118 0.008 2.008 0.002 1.220 0.005 47.833 0.000 0.000 1.145 0.006 0.000 0.000 0.108 0.007 1.230 0.002 1.252 0.006

Table 39: Fluoroprobe data for chlorophyll a concentration with 2.96 x 10⁻¹ gL-1 hydrogen peroxide addition, repetition 1
Time since addition (h)
Chlorophyta (μgL-1)
Standard Error
Cyanobacteria (μgL-1)
Standard Error
Diatoms (μgL-1)
Standard Error
Cryptophyta (μgL-1)
Standard Error
Yellow Substances (μgL-1)
Standard Error
Total algal (μgL-1)
Standard Error
0.000 63.148 0.316 18.334 0.111 17.094 0.177 8.861 0.258 5.162 0.012 107.436 0.488 1.000 76.419 0.290 20.142 0.032 16.614 0.132 0.118 0.082 7.414 0.044 113.292 0.349 2.017 59.263 0.054 14.580 0.052 13.960 0.038 0.061 0.048 5.041 0.021 87.862 0.083 2.967 64.301 0.287 13.025 0.090 14.950 0.134 2.666 0.215 4.646 0.024 94.943 0.281 4.000 65.052 0.123 11.319 0.033 16.369 0.066 2.700 0.093 3.680 0.028 95.436 0.117 4.967 47.003 0.060 6.393 0.052 11.413 0.108 1.393 0.159 2.470 0.031 66.203 0.048 5.933 53.031 0.144 6.320 0.065 12.981 0.100 1.478 0.137 1.562 0.023 73.809 0.101 17.950 8.117 0.061 1.488 0.017 1.901 0.057 1.401 0.047 2.660 0.007 12.907 0.021 23.967 0.266 0.022 1.621 0.016 0.695 0.044 0.602 0.064 2.497 0.007 3.184 0.022 47.967 0.000 0.000 1.161 0.013 0.063 0.023 0.211 0.040 1.296 0.006 1.431 0.009
Table 40: Fluoroprobe data for chlorophyll a concentration with 2.96 x 10⁻¹ gL-1 hydrogen peroxide addition, repetition 2
Time since addition (h)
Chlorophyta (μgL-1)
Standard Error
Cyanobacteria (μgL-1)
Standard Error
Diatoms (μgL-1)
Standard Error
Cryptophyta (μgL-1)
Standard Error
Yellow Substances (μgL-1)
Standard Error
Total algal (μgL-1)
Standard Error
0.000 60.742 0.469 18.551 0.186 18.954 0.235 4.018 0.155 4.779 0.020 102.263 0.768 0.983 85.771 0.283 22.384 0.046 18.596 0.079 0.086 0.044 8.052 0.039 126.839 0.315 2.000 48.026 0.054 11.490 0.038 10.371 0.022 0.000 0.000 4.717 0.013 69.887 0.092 3.000 45.397 0.054 9.007 0.029 9.997 0.055 0.787 0.099 3.867 0.021 65.191 0.049 3.983 54.717 0.100 9.668 0.053 13.638 0.104 1.046 0.145 3.561 0.019 79.074 0.078 4.950 54.865 0.064 7.476 0.040 13.156 0.095 2.207 0.126 2.726 0.018 77.706 0.071 5.933 43.741 0.125 5.313 0.050 10.998 0.165 0.426 0.137 1.873 0.022 60.478 0.071 17.950 4.333 0.034 1.645 0.017 1.591 0.041 0.488 0.047 2.467 0.003 8.056 0.015 23.950 0.001 0.001 1.938 0.012 0.871 0.013 0.181 0.027 2.574 0.004 2.995 0.007 47.967 0.000 0.000 1.204 0.007 0.001 0.001 0.231 0.009 1.346 0.003 1.433 0.007

Table 41: Fluoroprobe data for chlorophyll a concentration with 2.96 x 10⁻¹ gL-1 hydrogen peroxide addition, repetition 3
Time since addition (h)
Chlorophyta (μgL-1)
Standard Error
Cyanobacteria (μgL-1)
Standard Error
Diatoms (μgL-1)
Standard Error
Cryptophyta (μgL-1)
Standard Error
Yellow Substances (μgL-1)
Standard Error
Total algal (μgL-1)
Standard Error
0.000 46.941 0.726 20.813 0.555 16.255 0.951 5.731 1.700 5.728 0.177 89.738 0.722 0.950 68.110 0.209 17.218 0.019 14.149 0.085 0.000 0.000 6.834 0.017 99.479 0.277 1.983 50.382 0.108 11.861 0.051 11.211 0.046 0.015 0.015 4.620 0.021 73.467 0.125 2.967 40.966 0.050 8.225 0.030 8.879 0.033 0.117 0.047 3.679 0.023 58.185 0.041 3.950 47.384 0.078 7.307 0.040 11.076 0.059 2.177 0.103 3.187 0.009 67.945 0.081 4.917 36.701 0.063 5.067 0.041 8.409 0.069 0.548 0.104 2.611 0.011 50.722 0.064 5.867 23.335 0.062 3.081 0.007 5.345 0.047 0.000 0.000 2.112 0.006 31.762 0.025 17.917 2.990 0.015 1.148 0.011 1.356 0.019 0.722 0.031 2.301 0.008 6.219 0.017 23.933 0.000 0.000 1.670 0.015 0.424 0.024 0.504 0.035 2.473 0.005 2.597 0.008 47.933 0.000 0.000 1.127 0.010 0.023 0.011 0.096 0.022 1.161 0.004 1.246 0.003
Table 42: Fluoroprobe data for chlorophyll a concentration with 7.4 x 10⁻¹ gL-1 hydrogen peroxide addition, repetition 1
Time since addition (h)
Chlorophyta (μgL-1)
Standard Error
Cyanobacteria (μgL-1)
Standard Error
Diatoms (μgL-1)
Standard Error
Cryptophyta (μgL-1)
Standard Error
Yellow Substances (μgL-1)
Standard Error
Total algal (μgL-1)
Standard Error
0.000 62.535 0.255 19.869 0.124 19.349 0.166 5.513 0.295 5.032 0.012 107.265 0.484 0.933 128.184 0.153 18.894 0.062 26.145 0.113 3.121 0.199 6.001 0.039 176.346 0.110 1.967 93.644 0.106 12.982 0.118 19.323 0.216 1.006 0.334 3.648 0.020 126.957 0.158 2.967 52.700 0.046 5.328 0.037 9.054 0.064 0.417 0.110 2.148 0.014 67.497 0.043 3.933 45.233 0.028 3.702 0.034 7.415 0.044 0.694 0.065 1.422 0.009 57.045 0.020 4.900 43.619 0.086 2.920 0.026 7.744 0.070 0.729 0.064 0.759 0.012 55.012 0.046 5.850 35.592 0.100 2.235 0.011 6.578 0.070 0.090 0.033 0.729 0.007 44.494 0.047
17.917 0.409 0.024 2.222 0.019 1.355 0.034 0.531 0.055 3.139 0.009 4.515 0.020 23.933 0.000 0.000 1.591 0.005 0.000 0.000 0.168 0.010 1.993 0.004 1.760 0.007 47.917 0.000 0.000 0.842 0.012 0.066 0.016 0.064 0.026 0.863 0.005 0.973 0.007
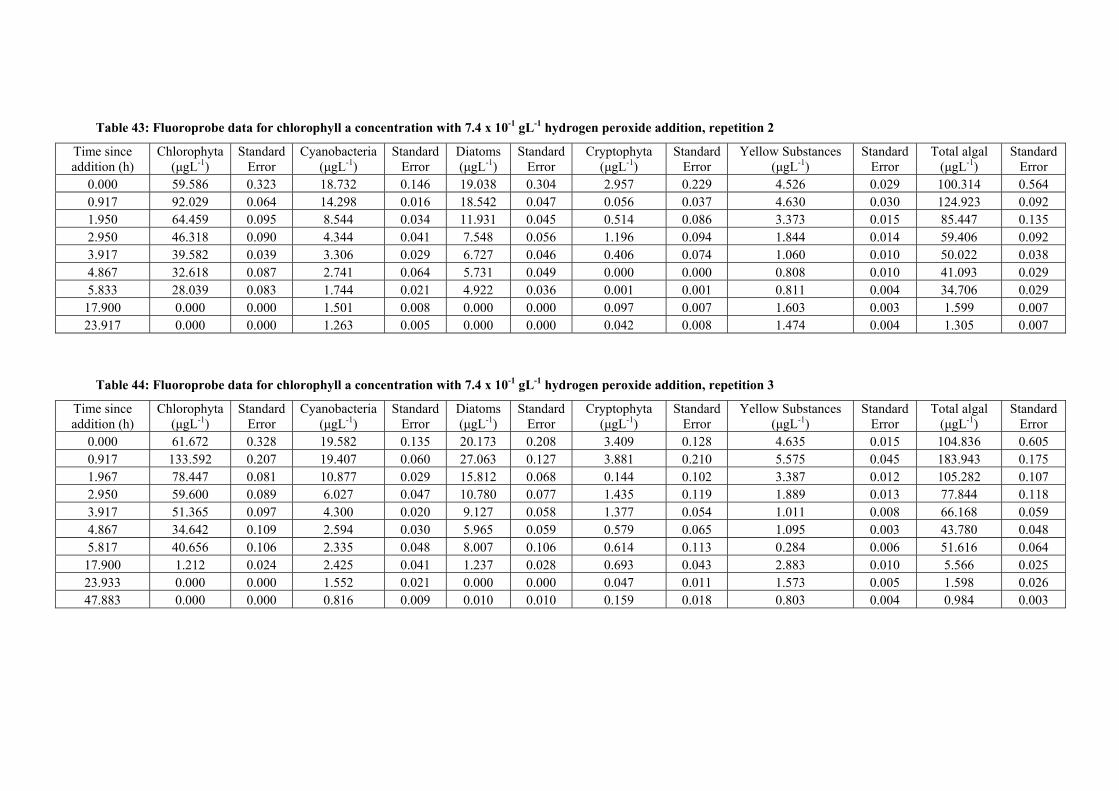
Table 43: Fluoroprobe data for chlorophyll a concentration with 7.4 x 10⁻¹ gL-1 hydrogen peroxide addition, repetition 2
Time since addition (h)
Chlorophyta (μgL-1)
Standard Error
Cyanobacteria (μgL-1)
Standard Error
Diatoms (μgL-1)
Standard Error
Cryptophyta (μgL-1)
Standard Error
Yellow Substances (μgL-1)
Standard Error
Total algal (μgL-1)
Standard Error
0.000 59.586 0.323 18.732 0.146 19.038 0.304 2.957 0.229 4.526 0.029 100.314 0.564 0.917 92.029 0.064 14.298 0.016 18.542 0.047 0.056 0.037 4.630 0.030 124.923 0.092 1.950 64.459 0.095 8.544 0.034 11.931 0.045 0.514 0.086 3.373 0.015 85.447 0.135 2.950 46.318 0.090 4.344 0.041 7.548 0.056 1.196 0.094 1.844 0.014 59.406 0.092 3.917 39.582 0.039 3.306 0.029 6.727 0.046 0.406 0.074 1.060 0.010 50.022 0.038 4.867 32.618 0.087 2.741 0.064 5.731 0.049 0.000 0.000 0.808 0.010 41.093 0.029 5.833 28.039 0.083 1.744 0.021 4.922 0.036 0.001 0.001 0.811 0.004 34.706 0.029
17.900 0.000 0.000 1.501 0.008 0.000 0.000 0.097 0.007 1.603 0.003 1.599 0.007 23.917 0.000 0.000 1.263 0.005 0.000 0.000 0.042 0.008 1.474 0.004 1.305 0.007
Table 44: Fluoroprobe data for chlorophyll a concentration with 7.4 x 10⁻¹ gL-1 hydrogen peroxide addition, repetition 3
Time since addition (h)
Chlorophyta (μgL-1)
Standard Error
Cyanobacteria (μgL-1)
Standard Error
Diatoms (μgL-1)
Standard Error
Cryptophyta (μgL-1)
Standard Error
Yellow Substances (μgL-1)
Standard Error
Total algal (μgL-1)
Standard Error
0.000 61.672 0.328 19.582 0.135 20.173 0.208 3.409 0.128 4.635 0.015 104.836 0.605 0.917 133.592 0.207 19.407 0.060 27.063 0.127 3.881 0.210 5.575 0.045 183.943 0.175 1.967 78.447 0.081 10.877 0.029 15.812 0.068 0.144 0.102 3.387 0.012 105.282 0.107 2.950 59.600 0.089 6.027 0.047 10.780 0.077 1.435 0.119 1.889 0.013 77.844 0.118 3.917 51.365 0.097 4.300 0.020 9.127 0.058 1.377 0.054 1.011 0.008 66.168 0.059 4.867 34.642 0.109 2.594 0.030 5.965 0.059 0.579 0.065 1.095 0.003 43.780 0.048 5.817 40.656 0.106 2.335 0.048 8.007 0.106 0.614 0.113 0.284 0.006 51.616 0.064
17.900 1.212 0.024 2.425 0.041 1.237 0.028 0.693 0.043 2.883 0.010 5.566 0.025 23.933 0.000 0.000 1.552 0.021 0.000 0.000 0.047 0.011 1.573 0.005 1.598 0.026 47.883 0.000 0.000 0.816 0.009 0.010 0.010 0.159 0.018 0.803 0.004 0.984 0.003

Table 45: Fluoroprobe data for chlorophyll a concentration with 1.48 gL-1 hydrogen peroxide addition, repetition 1
Time since addition (h)
Chlorophyta (μgL-1)
Standard Error
Cyanobacteria (μgL-1)
Standard Error
Diatoms (μgL-1)
Standard Error
Cryptophyta (μgL-1)
Standard Error
Yellow Substances (μgL-1)
Standard Error
Total algal (μgL-1)
Standard Error
0.000 18.870 0.112 6.768 0.014 7.641 0.021 0.000 0.000 4.083 0.006 33.278 0.127 1.117 29.161 0.033 5.857 0.011 8.496 0.025 0.000 0.000 4.743 0.011 43.515 0.043 2.033 28.380 0.030 5.264 0.027 7.967 0.055 0.174 0.074 4.150 0.012 41.785 0.032 3.050 17.448 0.040 3.387 0.013 4.747 0.030 0.000 0.000 3.691 0.008 25.580 0.023 4.083 12.206 0.055 2.731 0.011 3.594 0.041 0.000 0.000 3.361 0.009 18.533 0.017 5.000 14.163 0.027 2.330 0.005 3.647 0.014 0.000 0.000 3.003 0.004 20.140 0.033 6.000 9.450 0.030 2.149 0.008 2.704 0.016 0.000 0.000 3.017 0.005 14.304 0.034 18.000 0.000 0.000 2.695 0.027 0.590 0.007 0.000 0.000 2.286 0.005 3.286 0.032 24.000 0.000 0.000 1.487 0.021 0.000 0.000 0.000 0.000 1.866 0.002 1.487 0.021 48.000 0.000 0.000 1.710 0.063 0.145 0.012 0.000 0.000 0.886 0.008 1.856 0.074
Table 46: Fluoroprobe data for chlorophyll a concentration with 1.48 gL-1 hydrogen peroxide addition, repetition 2
Time since addition (h)
Chlorophyta (μgL-1)
Standard Error
Cyanobacteria (μgL-1)
Standard Error
Diatoms (μgL-1)
Standard Error
Cryptophyta (μgL-1)
Standard Error
Yellow Substances (μgL-1)
Standard Error
Total algal (μgL-1)
Standard Error
0.000 17.850 0.152 6.452 0.031 7.415 0.048 0.000 0.000 3.789 0.003 31.718 0.229 1.083 22.472 0.069 4.669 0.011 6.585 0.027 0.000 0.000 4.189 0.012 33.726 0.060 2.017 21.744 0.025 4.257 0.011 6.173 0.020 0.000 0.000 3.570 0.006 32.171 0.037 3.020 21.889 0.067 3.327 0.007 5.830 0.068 0.000 0.000 2.798 0.009 31.045 0.023 4.067 14.575 0.043 2.173 0.011 3.662 0.011 0.000 0.000 2.657 0.009 20.408 0.030 4.967 11.039 0.032 1.951 0.009 2.697 0.012 0.000 0.000 2.459 0.008 15.688 0.028 5.967 8.074 0.016 1.787 0.030 2.154 0.008 0.000 0.000 2.402 0.006 12.015 0.015 17.967 0.000 0.000 1.212 0.011 0.000 0.000 0.003 0.002 1.612 0.001 1.216 0.009 23.967 0.000 0.000 1.192 0.006 0.003 0.003 0.074 0.010 1.270 0.003 1.266 0.005 47.967 0.000 0.000 0.950 0.014 0.082 0.013 0.031 0.021 0.672 0.003 1.062 0.007

Table 47: Fluoroprobe data for chlorophyll a concentration with 1.48 gL-1 hydrogen peroxide addition, repetition 3
Time since addition (h)
Chlorophyta (μgL-1)
Standard Error
Cyanobacteria (μgL-1)
Standard Error
Diatoms (μgL-1)
Standard Error
Cryptophyta (μgL-1)
Standard Error
Yellow Substances (μgL-1)
Standard Error
Total algal (μgL-1)
Standard Error
0.000 17.829 0.089 6.727 0.030 7.277 0.049 0.247 0.053 3.909 0.008 32.079 0.122 1.033 46.091 0.100 7.764 0.042 12.756 0.062 0.416 0.092 4.514 0.014 67.026 0.105 1.967 32.222 0.108 5.471 0.025 8.747 0.035 0.027 0.027 3.725 0.011 46.466 0.072 2.983 25.693 0.093 3.845 0.017 6.794 0.037 0.006 0.006 2.907 0.009 36.337 0.053 4.000 23.239 0.070 2.850 0.018 5.459 0.016 0.000 0.000 2.531 0.008 31.543 0.066 4.917 18.841 0.048 2.253 0.003 4.463 0.015 0.000 0.000 2.355 0.007 25.558 0.041 5.950 17.350 0.037 2.057 0.014 4.090 0.010 0.000 0.000 2.038 0.006 23.495 0.022 17.917 0.761 0.022 1.972 0.037 0.770 0.017 0.000 0.000 2.193 0.005 3.502 0.039 23.933 0.000 0.000 1.501 0.043 0.019 0.006 0.023 0.012 1.627 0.005 1.543 0.039 47.917 0.000 0.000 1.009 0.033 0.027 0.014 0.129 0.023 0.685 0.005 1.165 0.027
Table 48: Fluoroprobe data for chlorophyll a concentration with 2.96 gL-1 hydrogen peroxide addition, repetition 1
Time since addition (h)
Chlorophyta (μgL-1)
Standard Error
Cyanobacteria (μgL-1)
Standard Error
Diatoms (μgL-1)
Standard Error
Cryptophyta (μgL-1)
Standard Error
Yellow Substances (μgL-1)
Standard Error
Total algal (μgL-1)
Standard Error
0.000 45.159 1.034 25.670 0.755 18.626 1.105 6.375 1.662 11.087 0.179 95.828 1.524 0.950 43.805 0.311 12.540 0.331 12.539 0.513 3.596 0.749 9.169 0.066 72.483 0.437 2.083 59.596 0.570 12.572 0.303 16.549 0.285 4.292 0.603 6.095 0.103 93.009 0.752 3.000 58.342 0.655 8.291 0.282 14.146 0.412 4.963 0.534 3.925 0.085 85.744 0.842 3.933 32.794 0.354 4.618 0.188 7.969 0.215 1.381 0.406 3.449 0.053 46.761 0.419 4.950 34.044 0.435 3.466 0.084 8.019 0.101 1.689 0.187 2.592 0.058 47.217 0.460 5.867 33.642 0.313 2.767 0.173 8.020 0.153 1.069 0.344 1.903 0.052 45.498 0.348 17.950 0.000 0.000 1.710 0.042 0.000 0.000 0.370 0.043 1.432 0.012 2.080 0.066 23.917 0.005 0.005 1.243 0.043 0.035 0.020 0.302 0.039 0.715 0.009 1.582 0.061 44.917 0.006 0.004 1.212 0.032 0.202 0.013 0.000 0.000 0.331 0.006 1.419 0.042

Table 49: Fluoroprobe data for chlorophyll a concentration with 2.96 gL-1 hydrogen peroxide addition, repetition 2
Time since addition (h)
Chlorophyta (μgL-1)
Standard Error
Cyanobacteria (μgL-1)
Standard Error
Diatoms (μgL-1)
Standard Error
Cryptophyta (μgL-1)
Standard Error
Yellow Substances (μgL-1)
Standard Error
Total algal (μgL-1)
Standard Error
0.000 46.088 1.427 27.309 0.647 22.281 1.060 11.197 1.669 11.113 0.264 106.873 2.710 0.950 41.635 0.297 12.629 0.267 13.711 0.463 1.351 0.651 9.287 0.078 69.325 0.375 2.083 49.654 0.468 10.348 0.472 13.273 0.699 5.755 1.107 6.807 0.082 79.029 0.492 3.000 41.557 0.515 6.472 0.230 9.116 0.267 4.994 0.430 4.864 0.026 62.139 0.695 3.933 37.276 0.640 4.558 0.249 8.919 0.382 2.980 0.574 3.433 0.036 53.730 0.803 4.950 34.501 0.520 3.773 0.128 9.025 0.193 0.905 0.321 2.763 0.070 48.206 0.561 5.850 30.596 0.259 3.045 0.056 7.461 0.101 0.041 0.028 2.176 0.058 41.143 0.301 17.950 0.000 0.000 2.296 0.062 0.000 0.000 0.187 0.015 1.381 0.006 2.480 0.076 23.917 0.000 0.000 1.175 0.020 0.000 0.000 0.239 0.011 0.867 0.003 1.415 0.022
Table 50: Fluoroprobe data for chlorophyll a concentration with 2.96 gL-1 hydrogen peroxide addition, repetition 3
Time since addition (h)
Chlorophyta (μgL-1)
Standard Error
Cyanobacteria (μgL-1)
Standard Error
Diatoms (μgL-1)
Standard Error
Cryptophyta (μgL-1)
Standard Error
Yellow Substances (μgL-1)
Standard Error
Total algal (μgL-1)
Standard Error
0.000 33.761 1.653 21.054 0.300 16.028 0.676 0.993 0.355 10.382 0.120 71.835 1.480 0.933 55.864 0.667 14.690 0.457 17.341 0.623 5.137 1.140 9.868 0.094 93.031 0.843 2.050 61.327 0.663 12.387 0.367 17.584 0.517 7.142 0.919 6.910 0.138 98.439 0.759 2.983 47.582 0.519 6.892 0.268 10.524 0.441 6.309 0.650 5.214 0.101 71.303 0.717 3.983 38.942 0.446 5.036 0.111 9.948 0.159 2.528 0.316 3.720 0.057 56.456 0.536 4.933 26.038 0.255 3.662 0.073 6.262 0.151 0.760 0.237 3.700 0.039 36.722 0.275 5.833 31.963 0.408 3.066 0.148 7.908 0.118 0.607 0.281 2.653 0.067 43.546 0.443 17.933 0.000 0.000 2.226 0.056 0.000 0.000 0.055 0.014 1.288 0.007 2.283 0.066 23.900 0.009 0.004 2.669 0.083 0.044 0.006 0.000 0.000 0.828 0.007 2.722 0.086

Table 51: Fluoroprobe data for chlorophyll a concentration with 296 gL-1 hydrogen peroxide addition, repetition 1
Time since addition (h)
Chlorophyta (μgL-1)
Standard Error
Cyanobacteria (μgL-1)
Standard Error
Diatoms (μgL-1)
Standard Error
Cryptophyta (μgL-1)
Standard Error
Yellow Substances (μgL-1)
Standard Error
Total algal (μgL-1)
Standard Error
0.000 31.305 0.774 21.063 0.169 16.542 0.459 0.236 0.144 10.360 0.047 69.145 0.710 0.950 29.622 0.418 17.819 0.107 13.531 0.204 0.000 0.000 9.359 0.061 60.975 0.649 2.083 2.489 0.097 9.355 0.087 2.189 0.076 0.000 0.000 10.247 0.017 14.032 0.128 3.000 0.000 0.000 9.728 0.072 0.000 0.000 0.000 0.000 11.569 0.093 9.728 0.072 3.933 0.000 0.000 10.497 0.124 0.000 0.000 0.000 0.000 9.490 0.090 10.497 0.124 4.950 0.000 0.000 9.073 0.086 0.000 0.000 0.000 0.000 12.136 0.155 9.037 0.086 5.867 0.000 0.000 6.211 0.069 0.000 0.000 0.000 0.000 5.848 0.041 6.211 0.069 17.950 0.000 0.000 5.405 0.139 0.000 0.000 1.024 0.016 0.123 0.007 6.428 0.131 23.917 0.136 0.030 6.415 0.082 0.284 0.026 0.000 0.000 0.000 0.000 6.833 0.082
Table 52: Fluoroprobe data for chlorophyll a concentration with 296 gL-1 hydrogen peroxide addition, repetition 2
Time since addition (h)
Chlorophyta (μgL-1)
Standard Error
Cyanobacteria (μgL-1)
Standard Error
Diatoms (μgL-1)
Standard Error
Cryptophyta (μgL-1)
Standard Error
Yellow Substances (μgL-1)
Standard Error
Total algal (μgL-1)
Standard Error
0.000 43.212 0.825 24.704 0.404 17.859 0.749 5.406 1.086 10.310 0.148 91.180 1.289 0.950 22.099 0.109 13.489 0.142 8.219 0.150 0.699 0.283 9.772 0.030 44.508 0.119 2.083 9.182 0.273 12.254 0.045 4.167 0.047 0.000 0.000 12.016 0.032 25.603 0.254 3.000 0.000 0.000 12.382 0.075 0.000 0.000 0.000 0.000 15.619 0.169 12.382 0.075 3.933 0.000 0.000 13.751 0.079 0.000 0.000 0.000 0.000 19.850 0.223 13.751 0.079 4.950 0.000 0.000 10.966 0.053 0.000 0.000 0.000 0.000 13.134 0.158 10.966 0.053 5.850 0.000 0.000 8.388 0.126 0.000 0.000 0.000 0.000 5.987 0.039 8.388 0.126 17.950 0.018 0.009 6.496 0.057 0.191 0.064 0.308 0.103 0.260 0.010 7.014 0.096 23.917 0.212 0.036 7.015 0.056 0.196 0.028 0.000 0.000 0.000 0.000 7.422 0.050

Table 53: Fluoroprobe data for chlorophyll a concentration with 296 gL-1 hydrogen peroxide addition, repetition 3
Time since addition (h)
Chlorophyta (μgL-1)
Standard Error
Cyanobacteria (μgL-1)
Standard Error
Diatoms (μgL-1)
Standard Error
Cryptophyta (μgL-1)
Standard Error
Yellow Substances (μgL-1)
Standard Error
Total algal (μgL-1)
Standard Error
0.000 40.246 1.109 20.396 0.345 11.178 0.745 3.607 1.037 10.620 0.115 75.426 1.355 0.933 21.084 0.342 15.248 0.110 10.276 0.197 0.000 0.000 9.040 0.083 46.609 0.560 2.050 2.138 0.153 9.833 0.076 1.884 0.045 0.000 0.000 10.512 0.027 13.858 0.137 2.983 0.000 0.000 9.698 0.066 0.000 0.000 0.000 0.000 10.869 0.064 9.698 0.066 3.983 0.000 0.000 10.848 0.158 0.000 0.000 0.000 0.000 12.966 0.131 10.848 0.158 4.933 0.000 0.000 7.348 0.052 0.000 0.000 0.000 0.000 9.438 0.109 7.348 0.052 5.833 0.000 0.000 9.153 0.040 0.000 0.000 0.000 0.000 6.541 0.064 9.153 0.040 17.933 0.000 0.000 6.575 0.063 0.301 0.013 0.000 0.000 0.384 0.009 6.877 0.064 23.900 0.344 0.012 6.434 0.082 0.034 0.011 0.000 0.000 0.000 0.000 6.813 0.079