Embed Size (px)
Citation preview

Raymond Delashmitt Application of Fluorometers to Measure Wild Algal Growth In Vivo
2010 - 2011
Page 1 of 36
Application of Fluorometers to Measure Wild Algal Growth In Vivo
Raymond Delashmitt
Abstract
The goal of this project was to characterize the WetLabs FLNTUSB fluorometer and
determine the possibility of using it as an instrument to measure wild algal growth on substrates
in vivo. To do this several aspects were investigated, which include determining the angle
sensitivity of the instruments, if the instruments were able to compared directly to each other, if
the signals recorded demonstrated that the instruments were recording actual fluorescence of
algae, and to correlate the signal recorded to harvest data during the same time period. The
results of this investigation showed that the angle sensitivity depends on whether the angle from
normal is within the beam plane created by the LED and absorption cones, or if it was
perpendicular to the beam plane. In the investigation to determine if the fluorometers were
observing actual fluorescence of chlorophyll in the algae, it was determined that the signal was
from fluorescence due to a photo-inhibition effect and the variance being dependent on the size
of the signal. Finally, there is evidence that the fluorescence observed during the deployments of
this project can be compared to harvest data during the same time period and the relative changes
in both of these data sets appear to match, especially during periods that the substrates the
fluorometers were observing were cleaned and the signal dropped accordingly.
Fluorometer Background
Fluorometers have been widely used since the early 1970’s in marine biology research
applications and it has been proven they can accurately model the level of chlorophyll in the

Raymond Delashmitt Application of Fluorometers to Measure Wild Algal Growth In Vivo
2010 - 2011
Page 2 of 36
water. It has also been shown previously that by detecting the chlorophyll, the fluorometer can
measure a sample’s level of ambient algae in water.1 This technique of measuring algae growth
has become a popular and widely accepted process due to the fact that the measurement can be
done accurately, in real-time, without needing to remove the algae from the environment, and
with a handheld instrument. Previous solutions to measuring algae involved removing the algae
from the water by taking water samples, then measuring the algae populations in a lab with
counting chamber methods2 or High Performance Liquid Chromatography
3.
The fluorometer measures the level of chlorophyll by the amount that the object in the
beam fluoresces. The meter sends out a LED light of wavelength 470 nm, and when it comes in
contact with the chlorophyll a in the algae it is absorbed, exciting it to a higher quantum state
that then emits a photon back out at a wavelength of 695 nm4. This process is shown in figure 1
5
below, with the LED as the transmitter, and the algae represented as the chlorophyll a molecules.
Figure 1
Diagram showing absorption of the LED photon and reemission of a photon to the detector
1(Aberle, September 2006)
2(H Utermoehl, 1958)
3(Schroeder, 1994)
4(Wetlabs, 23 Dec 2009)
5(SCCF Recon, 2010)

Raymond Delashmitt Application of Fluorometers to Measure Wild Algal Growth In Vivo
2010 - 2011
Page 3 of 36
The data from the fluorometer is recorded as a digital count or an analog voltage. The
digital counts range from 50 to 4130, and the analog ranges from .072 V to 4.98 V. This means
that the fluorometers feature a dark count of 50, which is present in all data collected, and in all
the graphs featured, will have this value subtracted to give only the signals received by the
fluorometers.
Additionally, due to the nature of the fluorescence of the chlorophyll, an issue with the
detection is that the photon emitted from the algae is emitted in a random direction. Thus, the
meter is set up to do an average of a set number of samples to decrease the noise in the signal. In
these samples a variance is expected, which should be related to the signal strength by a square
root function. For all of the samples taken during the experiments, the average number of data
values taken before generating a single point was 60, then in the analysis of the data for hourly
and daily averages each of these single points were used.
Lab Experiments
For the controlled lab tests to measure the configuration of the fluorometers, the
experiments were to measure the angle of the local maxima of the signal produced by the
instruments when exposed to a point-like source of fluorescence and to measure the angles of
dispersion of the LED source and the cone of detection. To measure the angles of dispersion of
the LED, a reflective surface was used to allow tracing of the light cone, which resulted in the
following measurements in figure 2. This recorded line was of the sharp edge the beam
dispersed by the LED, with the intensity dropping off substantially outside of the 15 degrees
recorded. This area of light shall be referred to as the maximum LED cone.

Raymond Delashmitt Application of Fluorometers to Measure Wild Algal Growth In Vivo
2010 - 2011
Page 4 of 36
Figure 2
Diagram of the LED and absorption cones
The colored portions of the diagram show the areas that are the maximum LED dispersion or
detector absorption cones. The maximum light dispersion cone was measured, while the cone of
maximum absorption was based off of orientation of the detector with the assumption of it
behaving in reverse to the LED photon dispersion beam. The absorption cone was drawn based
on the symmetry to the light cone and geometry of the detector offset from normal. These cones
are not the only areas that signal is detected by the fluorometer due to the Gaussian decay of the
signal. This decay of the signal allows the tails of the two cones to intersect in front of the face
of the instrument, which accounts for signal recorded by the fluorometer in the angle study
experiment. In the diagram, it shows how when the angle is not in the plane where the beams
cross, the theoretical dispersion is the same, and should result in the least amount of distortion of
the signal. When the angle is measured in the beam plane, the geometry shows the cones of the
LED and detector with an offset of 15 degrees towards each other, and each of the cones having
a 15 degrees spread. This dispersion results in a theoretical range between .5 cm and 1.8 cm

Raymond Delashmitt Application of Fluorometers to Measure Wild Algal Growth In Vivo
2010 - 2011
Page 5 of 36
where the signal is maximum, which is shown in later experiments to result in an oversaturated
signal.
The next experiments were to determine the sensitivity of the fluorometers to a change in
angle when the distance was held constant. The first experiment was to use a point-like source
of 1 cm radius as the source of the fluorescence and to go through the entire range of angles
possible to the fluorometers. The experiment had the change of angle both orthogonal to and
within the plane that the LED and detector cone beams intersect. In this setup, the data was
taken at intervals of 10 degrees while the radial distance of the face of the fluorometer to the
substrate was held constant. The range of angles represented express the range of freedom that
the biowiper and the size of the fluorometers allow, generally 70 degrees from normal in either
direction.
The data for when the angle was perpendicular to the plane resulted with the absolute
maximum at 90 degrees to the substrate with the signal decaying as the angle deviated from this
value. On the closer distances the physical offset of the LED and detector, in the design of the
instrument to account for the biowiper, affected my ability to keep the same distance on either
side from normal. This resulted in the curve being biased towards the angles where the open
biowiper is farthest away from the substrate due to its relative closer proximity to the substrate.
The data from this experiment is featured in figure 3 below with the dark counts accounted for in
the signal.
The next aspect was when the angle was in the beam plane where the data showed signs
from the previous analysis of the local maxima of the signal, but with the maximum directly in
front of the LED beam being much larger than the other maxima present in the signal. The
secondary maximum that was observed in some of the signals was towards the theoretical beam

Raymond Delashmitt Application of Fluorometers to Measure Wild Algal Growth In Vivo
2010 - 2011
Page 6 of 36
that is directly in front of the detector, and is greatest when the distances to the substrate are
smallest. The maximum of the signal shifted as the distances away from the substrate changed.
This shows evidence of an interaction between the LED and detectors cones that pulling of the
maxima towards normal is occurring, due to the decay tails limiting the amount of photons
available to be detected along the previously stated angles. At the smallest distance of 3 cm
away, the maximum was at 20 degrees from normal towards the LED beam side. At the larger
distances of 5, 7, and 8 cm away, the maximum was between 40 and 50 degrees from normal,
towards the LED beam side. The other signals are between the 20 – 50 degrees from normal
towards the LED beam side. This data of this experiment is featured in below in figure 4 and
features the complete dataset with 6 points taken for each angle to show the spread of data for
certain angles and a subtraction of the dark counts.
Figure 3
Angle study with angle perpendicular to beam plane and viewing point source

Raymond Delashmitt Application of Fluorometers to Measure Wild Algal Growth In Vivo
2010 - 2011
Page 7 of 36
Figure 4
Angle study with angle within beam plane and viewing point source
The second aspect of the angle analysis that was done was to repeat the previous test of
the signals vs. angles, but have the fluorometers observing a substrate that would appear to be an
infinite plane of fluorescence. The substrate used was previously shown to be similar to algae
fluorescence at similar distances when tested with the fluorometers normal to the substrate. The
signal curves of the fluorometers were higher than the point tests, and were smoother and more
level than the point tests. This leveling can be explained by the averaging effect of allowing the
instrument to view fluorescent points closer and further away than the point source experiment.
For the test with the angle perpendicular to the beam plane, the signal showed a
decreased decay of the signal at large angles from normal to the substrate, and in comparison the
difference was between 10 and 40 percent of the average for the distance. The curves shown in
figure 5 that appeared were more level than the point source, and mostly just showed the

Raymond Delashmitt Application of Fluorometers to Measure Wild Algal Growth In Vivo
2010 - 2011
Page 8 of 36
decreasing trend from the physical offset on the instrument. This seems to suggest that when the
fluorometer is set up with the angle perpendicular to the beam plane, the signal is fairly constant
with respect to the angle from the substrate, so long as the angle is at or within 45 degrees from
normal.
Additionally, when the angle is taken within the beam plane, the curve once again is
smoother, but retains the maxima seen in the point test. The absolute maximum of the graph
seems to be offset more towards 45 degrees from normal, towards the LED beam side.
Throughout the distances, the absolute maximum ranges from 30 degrees to 50 degrees for
distances of 4 cm and 8 cm respectively. This suggests that if the fluorometer is set up with this
orientation the ideal angle will be around 45 degrees when the substrate is between 4 to 8 cm
directly out from the face of the instrument. This set of data is shown below in figure 6 with an
account for the dark counts in the signal.
Figure 5
Angle study with angle perpendicular to beam plane and viewing infinite plane

Raymond Delashmitt Application of Fluorometers to Measure Wild Algal Growth In Vivo
2010 - 2011
Page 9 of 36
Figure 6
Angle study with angle within beam plane and viewing infinite plane
The results seem to show that for the constrictions of setup on the York River Flume,
having the 45 degrees from normal will be possible when the angle is both in the beam plane and
perpendicular to it. The difference is that when the angle is in the beam plane, and the angle is
towards the LED beam side, the fluorometer will be detecting chlorophyll readings from a more
concentrated area of the substrate. When the angle is perpendicular to the beam plane, then it
should result in an averaging effect of the substrate, with the area of view being larger than the
other setup. Additionally, the data suggests that with the angle perpendicular to the beam plane,
if another angle is desired it should be able to perform at a nearly equal level, while when the

Raymond Delashmitt Application of Fluorometers to Measure Wild Algal Growth In Vivo
2010 - 2011
Page 10 of 36
angle is within the beam plane the peak performance is limited to between 30 and 50 degrees
from normal towards the LED side.
York River Experiments
The first experiment that was done on the York River platform concerning the
fluorometer data was to test whether the fluorometer signals would be comparable when they
were observing the same substrate. To test this, the fluorometers were deployed from November
4-8 as shown in figure 7, with them at 45 degrees to the substrate with the angles perpendicular
to the beam plane, so that the signal readings would be affected least by the angle of deployment.
Additionally, due to space constrictions on the platform, the fluorometers were deployed
observing opposite sides of the same substrate since there was no indication of an algae growth
difference between the different sides.
Figure 7
Diagram showing physical setup of fluorometers for comparison and extended deployments
Raymond Delashmitt Application of Fluorometers to Measure Wild Algal Growth In Vivo
2010 - 2011
Page 11 of 36
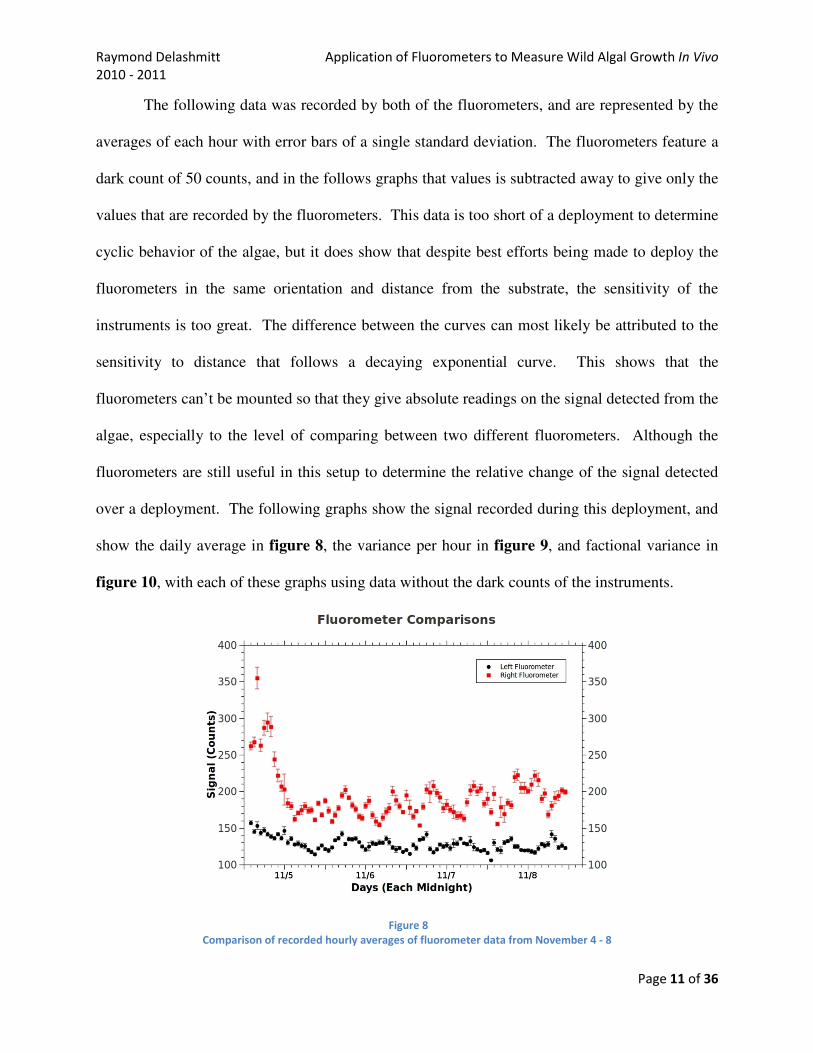
The following data was recorded by both of the fluorometers, and are represented by the
averages of each hour with error bars of a single standard deviation. The fluorometers feature a
dark count of 50 counts, and in the follows graphs that values is subtracted away to give only the
values that are recorded by the fluorometers. This data is too short of a deployment to determine
cyclic behavior of the algae, but it does show that despite best efforts being made to deploy the
fluorometers in the same orientation and distance from the substrate, the sensitivity of the
instruments is too great. The difference between the curves can most likely be attributed to the
sensitivity to distance that follows a decaying exponential curve. This shows that the
fluorometers can’t be mounted so that they give absolute readings on the signal detected from the
algae, especially to the level of comparing between two different fluorometers. Although the
fluorometers are still useful in this setup to determine the relative change of the signal detected
over a deployment. The following graphs show the signal recorded during this deployment, and
show the daily average in figure 8, the variance per hour in figure 9, and factional variance in
figure 10, with each of these graphs using data without the dark counts of the instruments.
Figure 8
Comparison of recorded hourly averages of fluorometer data from November 4 - 8

Raymond Delashmitt Application of Fluorometers to Measure Wild Algal Growth In Vivo
2010 - 2011
Page 12 of 36
In the following figure 9, the data of the variance over an hour for each fluorometer is
shown. The large variance shown during the first day for the right fluorometer corresponds to an
unusually large signal in the comparison, suggesting that the data during that time period was in
the presence of an unrecorded variable. The large variance when compared to the size of the
signal generated also suggests that the variance seen in this sample is due to the photon
collection rather than instrument error, because it varies with the size of the signal. This suggests
that the cause of the large initial spike was from a variable such as algae from farther down the
flume breaking off and impeding the view of the fluorometer. The floating algae would
fluoresce the same as the algae on the substrate and it was floating in the water it would be closer
to the instrument and cause this large appearance of growth. Additionally, since the large
anomaly is present only for a few hours it suggests that the algae passed through the flume.
Figure 9
Comparison of recorded hourly average variance of fluorometer data from November 8 - 22

Raymond Delashmitt Application of Fluorometers to Measure Wild Algal Growth In Vivo
2010 - 2011
Page 13 of 36
In figure 10, the fractional variance of the signal is represented, with it being the standard
deviation divided by the average signal for that hour. This shows how the variance is related to
the signal with the variance mostly within 5 percent of the signal. This suggests that the using
the average of the signals collected each hour is valid, and this is verified by similar results in
later deployments.
Figure 10
Comparison of recorded hourly average fractional variance of fluorometer data from November 8 - 22
The next experiment was an initial extended deployment of the fluorometer, which was
done on November 8 – 22. The deployment retained the setup from the previous comparison
experiment, but with only the left fluorometer used due to complications with the right
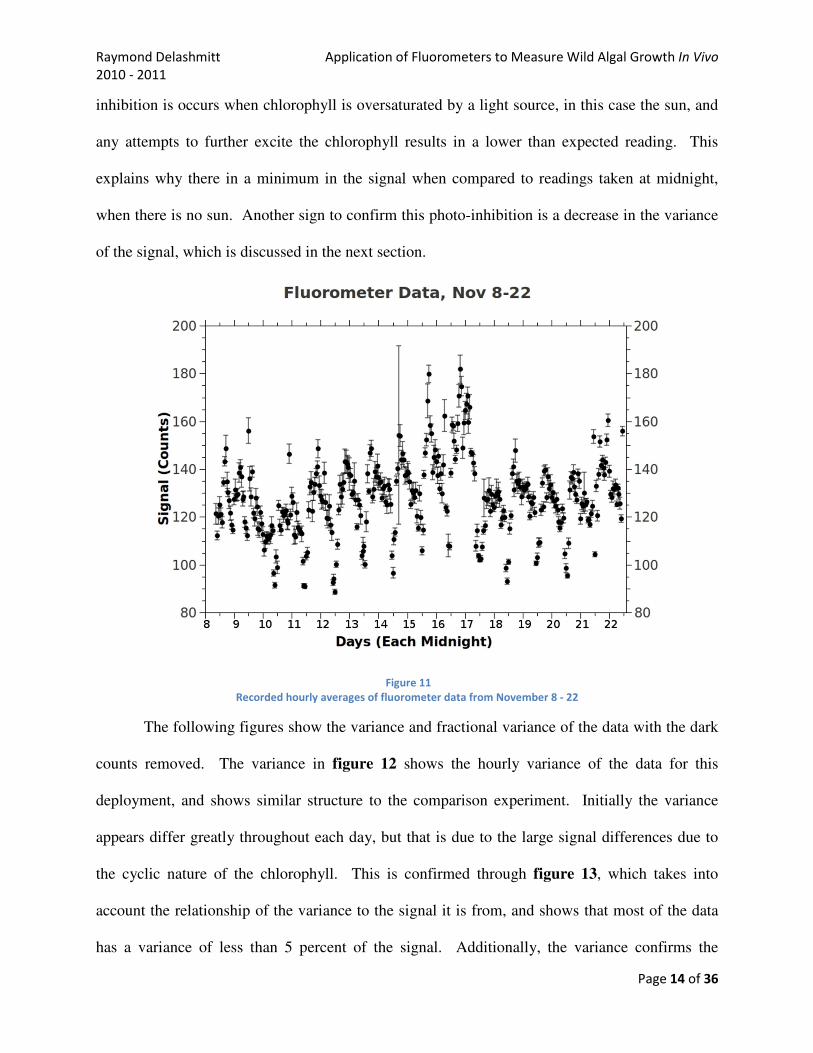
fluorometer. During this deployment, the structure of the signal showed definite signs of cyclical
behavior. This structure is shown in the following figure 11 with the dark counts removed and
follows a 24 cycle, with both the maximum and minimum represented between 11 AM and 2
PM. A strong explanation to this can come from photo-inhibition of the chlorophyll. Photo-
Raymond Delashmitt Application of Fluorometers to Measure Wild Algal Growth In Vivo
2010 - 2011
Page 14 of 36
inhibition is occurs when chlorophyll is oversaturated by a light source, in this case the sun, and
any attempts to further excite the chlorophyll results in a lower than expected reading. This
explains why there in a minimum in the signal when compared to readings taken at midnight,
when there is no sun. Another sign to confirm this photo-inhibition is a decrease in the variance
of the signal, which is discussed in the next section.
Figure 11
Recorded hourly averages of fluorometer data from November 8 - 22
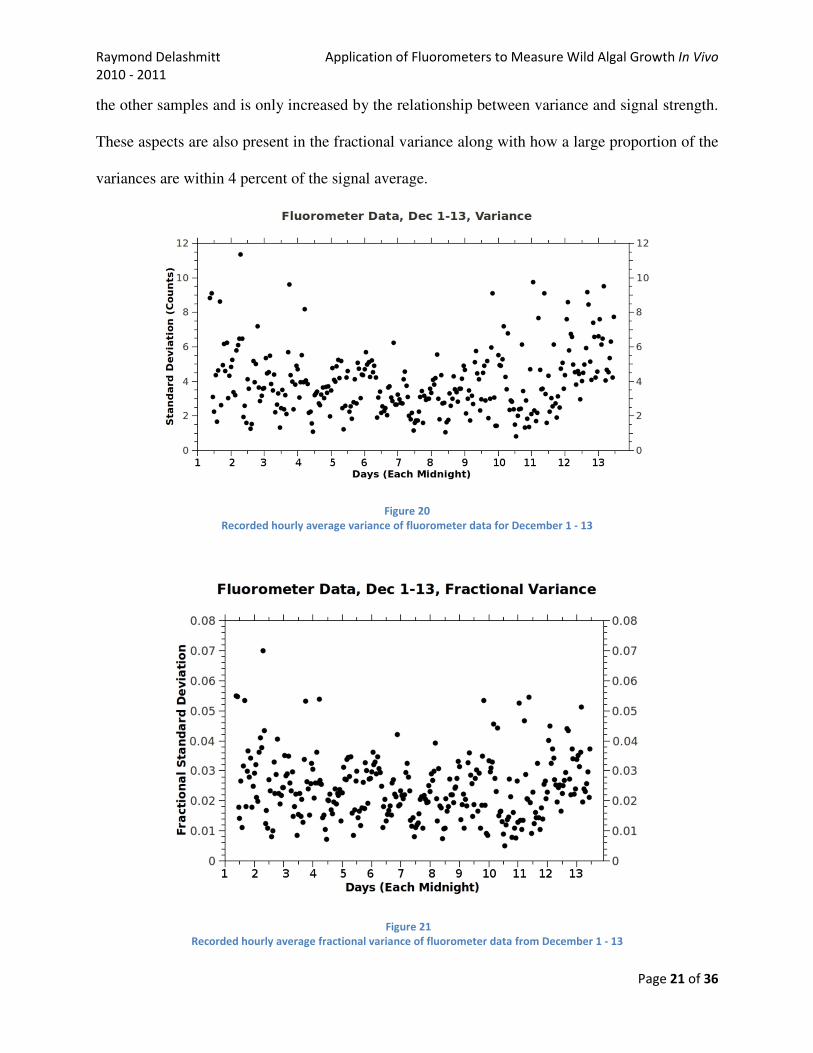
The following figures show the variance and fractional variance of the data with the dark
counts removed. The variance in figure 12 shows the hourly variance of the data for this
deployment, and shows similar structure to the comparison experiment. Initially the variance
appears differ greatly throughout each day, but that is due to the large signal differences due to
the cyclic nature of the chlorophyll. This is confirmed through figure 13, which takes into
account the relationship of the variance to the signal it is from, and shows that most of the data
has a variance of less than 5 percent of the signal. Additionally, the variance confirms the

Raymond Delashmitt Application of Fluorometers to Measure Wild Algal Growth In Vivo
2010 - 2011
Page 15 of 36
previous theory that photo-inhibition occurs due to the low variance during periods of highest
sun activity, around noon. This is shown again in figure 14 with the average variance per hour.
Figure 12
Recorded hourly average variance of fluorometer data from November 8 - 22
Figure 13
Recorded hourly average fractional variance of fluorometer data from November 8 - 22

Raymond Delashmitt Application of Fluorometers to Measure Wild Algal Growth In Vivo
2010 - 2011
Page 16 of 36
In the following graphs the same data is used as above, with the variances averaged for
each hour. By looking at the average variance per hour in figure 14 the trend of lower variance
at high solar activity times is more apparent, shows a drop in the variance, while during the rest
of the day the average variance is fairly constant. The drop in the variance during this period
gives further evidence of photo-inhibition over saturating the chlorophyll, because as the
variance decreases it shows that the chlorophyll’s ability to fluoresce is inhibited by giving a
more constant reading. The fractional variance shown in figure 15 shows flattening similar to
the fluorometer comparison, but the noon drop is still present despite the removal of the factor of
variance related to signal strength.
Figure 14
Recorded variance per hour of fluorometer data from November 8 - 22

Raymond Delashmitt Application of Fluorometers to Measure Wild Algal Growth In Vivo
2010 - 2011
Page 17 of 36
Figure 15
Recorded fractional variance per hour of fluorometer data from November 8 - 22
Another aspect that must be investigated of this deployment is if there is a single value in
the original signal data that correlates with the average of the day, which would allow a single
value to represent the dataset against the harvest yields. The data shows both a large maximum
and minimum between 11AM and 2 PM that is most likely caused by photo-inhibition, and this
gives reason to not use these extremes due to the large jump between them. In order to
compensate for this, taking the recordings at night would give the most consistent signal
readings. In figure 16 the averages for each day are shown in comparison to the hourly averages
and the values that are closest to the averages are the values taken at 2 AM. To show this the
daily average is compared to just the 2 AM hour averages in figure 17. This relationship
between the 2 AM and the daily average is also present in the next deployment done in
December. This combined with the variance data showing that photo-inhibition occurs mostly at
noon, and thus to remove this factor a time would be needed that was opposite this time, which 2
AM fits into.

Raymond Delashmitt Application of Fluorometers to Measure Wild Algal Growth In Vivo
2010 - 2011
Page 18 of 36
Figure 16
Comparison of recorded hourly vs daily averages of fluorometer data from November 8 - 22
Figure 17
Comparison of recorded 2 AM vs daily averages of fluorometer data from November 8 - 22

Raymond Delashmitt Application of Fluorometers to Measure Wild Algal Growth In Vivo
2010 - 2011
Page 19 of 36
This final aspect of the deployment is shown in figure 18 and features the 2 AM hourly
data with dark counts removed and how it relates to harvested data taken from flume. The data
on the harvest was taken from an average of all of the screens that were related to the screen that
the fluorometer was directed towards. The first two points would be expected to match with the
fluorometer signal due to both of them starting with a fresh experiment and harvest. The third
point of harvest though is one of continuous growth throughout the entire period, while the
screen that the fluorometer was harvested and cleaned when the second point was taken. This
data is still useful because the relative growth rates between the days of 18 to 22 and the relative
change in the signal during that same period are similar, with the rates being slower than the rest
of the deployment. Additionally, after the second harvest when the screen the fluorometer was
observing was harvested clean, the fluorometer signal drops accordingly. This drop in the
fluorometer signal is a significant display that the fluorometer is in fact observing the
fluorescence of the algae rather than the fluorescence of the substrate or the reflection of the
original LED beam.
Figure 18
Comparison of recorded 2 AM of fluorometer data against harvest data from November 8 - 22

Raymond Delashmitt Application of Fluorometers to Measure Wild Algal Growth In Vivo
2010 - 2011
Page 20 of 36
The next focus of the experiment was to run another extended trial of the fluorometers in
the same environment of the York River platform. The deployment was from December 1 – 13
and featured the same setup as the first, with the fluorometer set at 45 degrees to the substrate
with the angle perpendicular to the beam plane. In this deployment the following data was
recorded, which shows similar structure to the first deployment with noon having the extremes of
the hourly data. In the following figure 19 the hourly averages are again shown with error bars
of the standard deviation of the hour and the dark counts removed.
Figure 19
Recorded hourly averages of fluorometer data from December 1 - 13
In the next two graphs the hourly variance and fractional variance is featured from this
data without the dark counts. In figure 20 it shows that the hourly variance decreases during the
times of largest solar activity, which suggests again that photo-inhibition is occurring. Due to
unknown causes the averages in this deployment have more outliers, though the variance largely
does not show anomalies. The lack of anomalies suggests that the outliers are due to the
substrate or setup moving, and not due to an instrument error, because the variance is similar to
Raymond Delashmitt Application of Fluorometers to Measure Wild Algal Growth In Vivo
2010 - 2011
Page 21 of 36
the other samples and is only increased by the relationship between variance and signal strength.
These aspects are also present in the fractional variance along with how a large proportion of the
variances are within 4 percent of the signal average.
Figure 20
Recorded hourly average variance of fluorometer data for December 1 - 13
Figure 21
Recorded hourly average fractional variance of fluorometer data from December 1 - 13

Raymond Delashmitt Application of Fluorometers to Measure Wild Algal Growth In Vivo
2010 - 2011
Page 22 of 36
Another display of the data confirming the photo-inhibition comes from the following
figures of the variance and fractional variance per hour in figure 22 and figure 23. The both of
these datasets show at noon the variance decreases where the other hours have fairly constant
values. The variance is not as clean as the November deployment, but that can possibly be
explained due the flume being towed into the boatyard during the first days of the deployment,
and the additional disturbances that the flume would experience due to the closer proximity to
the shore and other working vessels. An interesting aspect is how despite this, the signals
recorded and the variances of the data don’t differ greatly from the previous undisturbed
deployment. This suggests that so long as the substrate and fluorometer are in a fixed position to
each other, the other factors occurring on the flume may be less important than previously
believed.
Figure 22
Recorded variance per hour of fluorometer data from December 1 - 13
Raymond Delashmitt Application of Fluorometers to Measure Wild Algal Growth In Vivo
2010 - 2011
Page 23 of 36
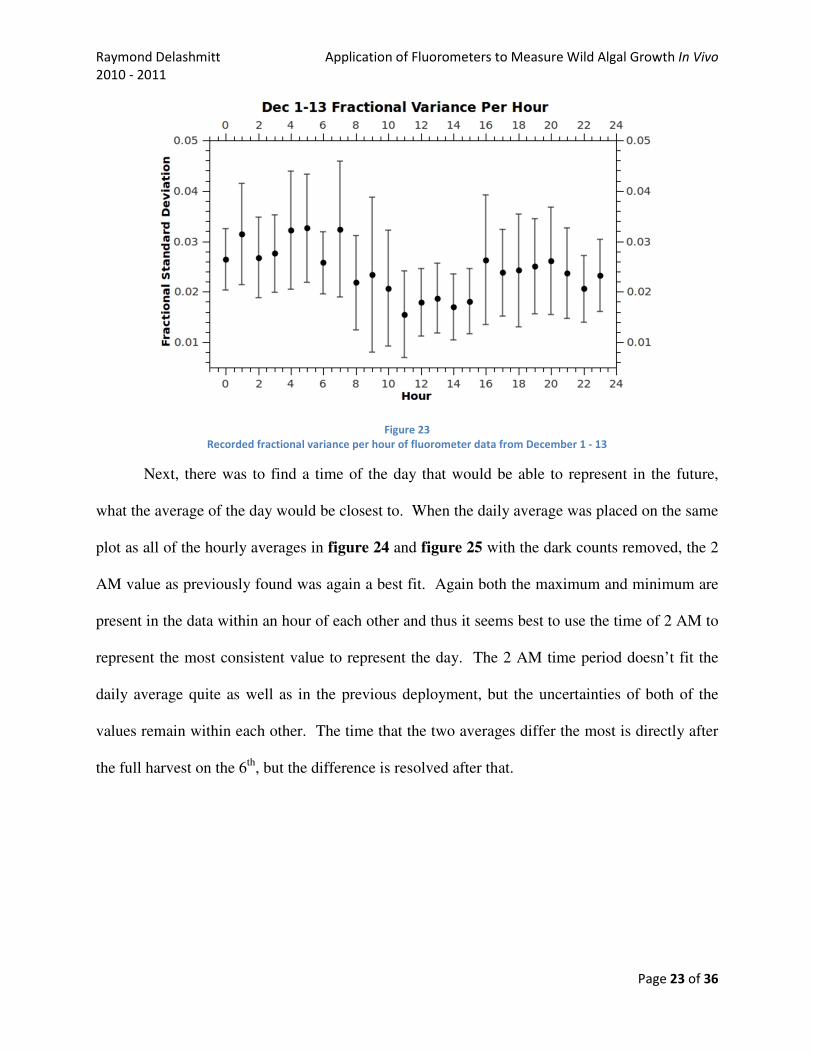
Figure 23
Recorded fractional variance per hour of fluorometer data from December 1 - 13
Next, there was to find a time of the day that would be able to represent in the future,
what the average of the day would be closest to. When the daily average was placed on the same
plot as all of the hourly averages in figure 24 and figure 25 with the dark counts removed, the 2
AM value as previously found was again a best fit. Again both the maximum and minimum are
present in the data within an hour of each other and thus it seems best to use the time of 2 AM to
represent the most consistent value to represent the day. The 2 AM time period doesn’t fit the
daily average quite as well as in the previous deployment, but the uncertainties of both of the
values remain within each other. The time that the two averages differ the most is directly after
the full harvest on the 6th
, but the difference is resolved after that.

Raymond Delashmitt Application of Fluorometers to Measure Wild Algal Growth In Vivo
2010 - 2011
Page 24 of 36
Figure 24
Comparison of recorded hourly vs daily averages of fluorometer data from December 1 - 13
Figure 25
Comparison of recorded 2 AM vs daily averages of fluorometer data from December 1 - 13

Raymond Delashmitt Application of Fluorometers to Measure Wild Algal Growth In Vivo
2010 - 2011
Page 25 of 36
The final aspect of this deployment was to again compare the 2 AM hourly average found
to be able to represent a cleaner form of the deployment data to the harvest data taken of each
substrate that represented the screen the fluorometer was directed towards. In figure 26 the
comparison between the 2 AM without dark counts and harvest data is shown. Unfortunately the
harvest data available during this time period was of growth that was undisturbed growth for
longer than the substrate that the fluorometer was directed towards was able to grow. The
relative growth is still comparable, but not as relevant as during the November deployment for
direct comparison of growth rates. Also this deployment featured a point of December 6th
when
the screen the fluorometer was directed towards was scraped clean to take the substrate back to
an initial state. This shows how the signal decreases immediately during that time similar to the
previous deployment, confirming how the fluorometer was observing fluorescence of algae.
Another interesting aspect of this is if the assumption that the fluorometer was observing the
algal growth, then the growth increased rapidly after the clean harvest, suggesting that the
harvest stimulated more growth of algae that fluoresced than there was previously on the
substrate.

Raymond Delashmitt Application of Fluorometers to Measure Wild Algal Growth In Vivo
2010 - 2011
Page 26 of 36
Figure 26
Comparison of recorded 2 AM of fluorometer data against harvest data from December 1 - 13
Conclusions
During this project I was posed with the objective to characterize the WetLabs
FLNTUSB fluorometer and to determine if it was possible to measure the fluorescence to plot
the growth of wild algae. I determined that there are two setups possible when deploying the
fluorometer, either having the angle of deployment in or perpendicular to the beam plane created
by the LED and Detector absorption cones. If the angle is within the beam plane then the largest
maximum and most stable angle will be around 45 degrees towards the LED beam side. If the
angle is perpendicular to the beam plane the angle sensitivity is decreased from the previous
setup, and the angle is able to handle whatever angle the physical constraints are, though an
angle of more than 45 degrees is not recommended.
Raymond Delashmitt Application of Fluorometers to Measure Wild Algal Growth In Vivo
2010 - 2011
Page 27 of 36
The next aspect was to deploy the fluorometers for extended periods, and through doing
so I determined that the fluorometers are useful to measure relative changes in signal, that can be
correlated to fluorescence of the algae. They are not able to be compared directly to each other
due to the high sensitivity to the instruments based on distance and angle, though once installed
in a fixed position the sensitivity of the fluorometer seems to vary greatly when other variables
are changed in the experiment. The fluorescence of the chlorophyll is dependent on the photo-
inhibition effect, though if the daily measurements are taken around 2 AM the values recorded
are very close to representing the daily average without experiencing the period photo-inhibition.
Finally, there is evidence that the fluorescence observed by the fluorometers can be correlated to
the algae density of the substrate that it is directed towards.

Raymond Delashmitt Application of Fluorometers to Measure Wild Algal Growth In Vivo
2010 - 2011
Page 28 of 36
Data Tables, Lab Experiment - Angle Sensitivity
In Beam Plane With Point Source
3 cm
4 cm
5 cm
6 cm
7 cm
Angle
Signal
(Counts)
Angle
Signal
(Counts)
Angle
Signal
(Counts)
Angle
Signal
(Counts)
Angle
Signal
(Counts)
130 2128
140 934
140 838
140 222
140 310
130 2099
140 962
140 831
140 205
140 314
130 1915
140 965
140 825
140 209
140 318
130 2035
140 959
140 835
140 213
140 320
130 1970
140 954
140 839
140 232
140 321
130 1935
140 965
140 851
140 273
140 315
130 1975
140 965
130 912
130 284
130 259
130 1963
130 1206
130 930
130 289
130 234
130 1965
130 1222
130 943
130 319
130 251
120 1982
130 1221
130 950
130 332
130 275
120 2002
130 1235
130 945
130 331
130 277
120 2113
130 1243
130 951
130 329
130 278
120 2244
120 1176
120 861
120 402
120 250
120 2192
120 1177
120 828
120 412
120 245
120 2114
120 1250
120 848
120 413
120 246
120 1945
120 1305
120 860
120 347
120 243
110 2427
120 1317
120 868
120 372
120 252
110 2470
110 1221
120 876
120 362
120 251
110 2455
110 1229
110 718
110 288
110 236
110 2451
110 1237
110 657
110 320
110 222
110 2457
110 1232
110 655
110 340
110 220
110 2456
110 1238
110 687
110 333
110 220
110 2410
100 1041
110 692
110 332
110 220
100 2353
100 1052
110 696
110 300
110 219
100 2348
100 1054
100 643
100 275
100 205
100 2355
100 1052
100 589
100 287
100 189
100 2367
100 1067
100 587
100 298
100 185
100 2366
90 967
100 584
100 299
100 187
100 2320
90 962
100 586
100 298
100 186
100 2177
90 1016
100 583
100 284
100 185
90 2149
90 1019
90 547
90 274
90 160
90 1999
90 1016
90 506
90 269
90 139
90 1928
80 865
90 490
90 266
90 128
90 1910
80 895
90 488
90 262
90 124
90 1879
80 899
90 489
90 262
90 123

Raymond Delashmitt Application of Fluorometers to Measure Wild Algal Growth In Vivo
2010 - 2011
Page 29 of 36
90 1867
80 898
90 490
90 230
90 127
90 1857
80 902
80 400
80 205
80 123
90 1829
70 815
80 370
80 208
80 112
80 1602
70 815
80 396
80 207
80 112
80 1663
70 815
80 397
80 208
80 113
80 1832
70 813
80 396
80 209
80 115
80 1833
70 812
80 397
80 202
80 120
80 1829
60 688
70 352
70 178
70 110
80 1821
60 681
70 311
70 177
70 100
70 1594
60 681
70 312
70 175
70 107
70 1511
60 679
70 315
70 174
70 107
70 1705
60 676
70 314
70 173
70 107
70 1706
50 507
70 313
70 162
70 107
70 1697
50 490
60 265
60 145
60 92
70 1713
50 488
60 235
60 144
60 88
70 1530
50 477
60 234
60 143
60 89
60 1347
50 468
60 231
60 141
60 90
60 1484
40 325
60 227
60 140
60 89
60 1495
40 332
60 225
60 124
60 89
60 1483
40 341
50 187
50 108
50 83
60 1447
40 340
50 164
50 108
50 77
60 1255
40 337
50 165
50 106
50 77
50 530
40 213
50 166
50 105
50 77
50 796
50 165
50 103
50 76
50 899
50 166
50 87
50 75
50 832
40 142
40 70
40 65
50 845
40 115
40 75
40 69
50 870
40 124
40 76
40 69
50 931
40 129
40 75
40 69
40 129
40 75
40 68
40 130
40 72
40 69

Raymond Delashmitt Application of Fluorometers to Measure Wild Algal Growth In Vivo
2010 - 2011
Page 30 of 36
Perpendicular to Beam Plane With Point Source
3 cm
4 cm
5 cm
6 cm
7 cm
Angle
Signal
(Counts)
Angle
Signal
(Counts)
Angle
Signal
(Counts)
Angle
Signal
(Counts)
Angle
Signal
(Counts)
120 2225
130 913
130 486
140 182
140 112
120 2231
130 933
130 489
140 180
140 111
120 2242
130 935
130 488
140 183
140 111
120 2245
130 952
130 477
140 185
140 113
120 2252
130 963
130 476
140 187
140 126
120 2265
130 1060
130 483
140 218
140 129
110 2320
120 1119
120 487
130 264
130 146
110 2334
120 1120
120 485
130 256
130 145
110 2337
120 1125
120 485
130 246
130 145
110 2339
120 1143
120 483
130 249
130 145
110 2352
120 1152
120 484
130 250
130 145
110 2364
120 1168
120 481
130 254
130 146
100 2392
110 1178
110 482
120 281
120 157
100 2394
110 1182
110 479
120 286
120 158
100 2390
110 1174
110 476
120 288
120 157
100 2387
110 1174
110 477
120 288
120 157
100 2389
110 1177
110 470
120 288
120 158
100 2399
110 1166
110 473
120 290
120 159
90 2406
100 1145
100 475
110 295
110 161
90 2407
100 1144
100 469
110 295
110 162
90 2407
100 1138
100 467
110 294
110 162
90 2407
100 1135
100 467
110 292
110 160
90 2408
100 1136
100 467
110 285
110 160
90 2388
100 1127
100 467
110 282
110 160
80 2321
90 1081
90 443
100 233
100 157
80 2317
90 1052
90 440
100 221
100 156
80 2321
90 1102
90 441
100 245
100 154
80 2319
90 1173
90 441
100 243
100 153
80 2320
90 1173
90 442
100 245
100 153
80 2300
90 1162
90 441
100 245
100 155
70 2187
80 1010
80 393
90 253
90 159
70 2206
80 1007
80 395
90 256
90 158
70 2214
80 1037
80 395
90 261
90 157
70 2225
80 1070
80 397
90 261
90 157
70 2224
80 1075
80 398
90 260
90 158
70 2195
80 1076
80 396
90 258
90 156
60 2065
70 1033
70 348
80 239
80 151

Raymond Delashmitt Application of Fluorometers to Measure Wild Algal Growth In Vivo
2010 - 2011
Page 31 of 36
60 2093
70 1022
70 354
80 235
80 150
60 2086
70 1021
70 362
80 234
80 150
60 2066
70 1031
70 362
80 230
80 149
60 2040
70 1035
70 362
80 227
80 149
60 1859
70 1025
70 357
80 227
80 148
50 1648
60 903
60 259
70 210
70 135
50 1676
60 917
60 283
70 205
70 134
50 1733
60 946
60 285
70 204
70 134
50 1805
60 950
60 282
70 203
70 134
50 1732
60 922
60 281
70 202
70 135
60 907
60 257
70 200
70 133
50 723
50 202
60 180
60 125
50 719
50 198
60 183
60 126
50 729
50 210
60 185
60 124
50 753
50 214
60 186
60 125
50 754
50 216
60 186
60 123
50 748
50 219
60 186
60 122
50 166
50 111
50 163
50 110
50 164
50 110
50 165
50 109
50 166
50 109
50 164
50 108
40 140
40 91
40 137
40 89
40 137
40 89
40 137
40 89
40 138
40 89
40 138
40 89

Raymond Delashmitt Application of Fluorometers to Measure Wild Algal Growth In Vivo
2010 - 2011
Page 32 of 36
In Beam Plane With Infinite Plane Source
3 cm
4 cm
5 cm
6 cm
7 cm
Angle
Signal
(Counts)
Angle
Signal
(Counts)
Angle
Signal
(Counts)
Angle
Signal
(Counts)
Angle
Signal
(Counts)
130 2317
140 1254
150 701
150 474
150 370
130 2318
140 1249
150 779
150 480
150 381
130 2302
140 1177
150 786
150 480
150 380
130 2292
140 1215
150 780
150 478
150 382
130 2286
140 1221
150 783
150 466
150 379
130 2292
140 1229
150 780
150 481
150 361
120 2383
130 1279
140 795
140 488
140 361
120 2454
130 1290
140 796
140 492
140 368
120 2458
130 1285
140 798
140 494
140 376
120 2458
130 1309
140 807
140 500
140 361
120 2467
130 1317
140 792
140 477
140 365
120 2462
130 1319
140 794
140 469
140 362
110 2469
120 1321
130 800
130 471
130 350
110 2491
120 1338
130 814
130 469
130 351
110 2492
120 1333
130 822
130 470
130 353
110 2501
120 1322
130 818
130 472
130 359
110 2500
120 1343
130 822
130 434
130 362
110 2510
120 1327
130 807
130 438
130 356
100 2498
110 1287
120 817
120 445
120 322
100 2495
110 1286
120 813
120 446
120 325
100 2499
110 1293
120 811
120 445
120 327
100 2502
110 1291
120 816
120 448
120 327
100 2502
110 1286
120 820
120 424
120 328
100 2502
110 1268
120 793
120 419
120 328
90 2488
100 1232
110 786
110 423
110 305
90 2472
100 1235
110 771
110 426
110 305
90 2464
100 1235
110 762
110 427
110 305
90 2465
100 1230
110 765
110 428
110 306
90 2464
100 1230
110 766
110 408
110 306
90 2461
100 1199
110 731
110 396
110 307
80 2432
90 1163
100 709
100 397
100 292
80 2380
90 1164
100 711
100 397
100 287
80 2377
90 1163
100 712
100 397
100 280
80 2377
90 1162
100 713
100 397
100 283
80 2377
90 1160
100 713
100 398
100 283
80 2377
90 1122
100 679
100 372
100 276
70 2410
80 1104
90 657
90 363
90 256

Raymond Delashmitt Application of Fluorometers to Measure Wild Algal Growth In Vivo
2010 - 2011
Page 33 of 36
70 2428
80 1104
90 639
90 365
90 255
70 2421
80 1103
90 633
90 364
90 254
70 2418
80 1103
90 639
90 364
90 255
70 2417
80 1102
90 639
90 363
90 255
70 2417
70 1102
90 639
90 348
90 250
70 2507
70 1106
80 607
80 343
80 227
60 2542
70 1116
80 596
80 344
80 228
60 2434
70 1095
80 596
80 345
80 230
60 2429
70 1097
80 594
80 346
80 231
60 2439
70 1097
80 595
80 345
80 230
60 2446
60 1106
80 599
80 346
80 229
60 2554
60 1115
70 577
70 340
70 214
50 2615
60 1117
70 577
70 338
70 213
50 2594
60 1115
70 577
70 338
70 213
50 2589
60 1116
70 578
70 339
70 212
50 2587
60 1084
70 580
70 340
70 212
50 2583
50 957
70 578
70 344
70 210
50 785
60 570
60 345
60 194
50 751
60 568
60 352
60 187
50 688
60 560
60 355
60 186
50 754
60 560
60 356
60 184
50 780
60 561
60 355
60 184
40 669
60 562
60 353
60 183
40 577
50 554
50 335
50 160
40 610
50 530
50 331
50 163
40 644
50 532
50 316
50 162
40 642
50 522
50 318
50 162
40 642
50 521
50 322
50 162
50 524
50 361
50 160
40 499
40 376
40 125
40 491
40 365
40 129
40 478
40 319
40 132
40 477
40 332
40 132
40 478
40 338
40 133
40 482
40 326
40 133
30 421
30 251
30 101
30 377
30 229
30 102
30 370
30 225
30 102
30 367
30 225
30 103
30 361
30 224
30 104

Raymond Delashmitt Application of Fluorometers to Measure Wild Algal Growth In Vivo
2010 - 2011
Page 34 of 36
Perpendicular to Beam Plane With Infinite Plane Source
3 cm
4 cm
5 cm
6 cm
7 cm
Angle
Signal
(Counts)
Angle
Signal
(Counts)
Angle
Signal
(Counts)
Angle
Signal
(Counts)
Angle
Signal
(Counts)
120 2105
130 1155
130 627
130 425
130 268
120 2104
130 1153
130 624
130 423
130 269
120 2107
130 1160
130 595
130 420
130 270
120 2106
130 1155
130 602
130 422
130 271
120 2109
130 1153
130 609
130 422
130 271
120 2111
130 1153
130 611
130 423
130 272
110 2125
120 1183
120 617
120 408
130 273
110 2134
120 1189
120 618
120 410
130 273
110 2142
120 1187
120 618
120 409
120 268
110 2147
120 1189
120 617
120 409
120 268
110 2148
120 1187
120 618
120 409
120 268
110 2152
120 1187
120 618
120 407
120 267
100 2182
110 1197
110 617
110 393
120 268
100 2189
110 1198
110 616
110 392
120 268
100 2194
110 1199
110 617
110 393
120 268
100 2195
110 1194
110 618
110 393
120 266
100 2198
110 1194
110 618
110 393
110 261
100 2201
110 1200
110 617
110 392
110 261
90 2244
100 1198
100 613
100 380
110 261
90 2254
100 1200
100 610
100 380
110 261
90 2259
100 1200
100 612
100 380
110 261
90 2260
100 1199
100 612
100 378
110 261
90 2261
100 1199
100 613
100 378
110 261
90 2260
100 1200
100 612
100 377
110 260
80 2255
90 1196
90 607
90 366
100 254
80 2260
90 1196
90 607
90 367
100 253
80 2258
90 1195
90 607
90 367
100 253
80 2261
90 1194
90 607
90 368
100 252
80 2262
90 1194
90 607
90 368
100 253
80 2262
90 1193
90 607
90 368
100 253
70 2305
80 1186
80 613
80 360
100 253
70 2332
80 1185
80 611
80 359
100 252
70 2331
80 1182
80 608
80 359
90 249
70 2329
80 1179
80 608
80 360
90 249
70 2329
80 1178
80 608
80 360
90 249
70 2329
80 1175
80 609
80 360
90 249
60 2351
70 1161
70 611
70 357
90 249

Raymond Delashmitt Application of Fluorometers to Measure Wild Algal Growth In Vivo
2010 - 2011
Page 35 of 36
60 2355
70 1160
70 607
70 357
90 249
60 2357
70 1160
70 604
70 357
90 249
60 2356
70 1158
70 604
70 356
90 248
60 2350
70 1156
70 603
70 355
80 244
60 2356
70 1154
70 604
70 355
80 243
50 2368
60 1123
60 596
60 343
80 244
50 2350
60 1126
60 596
60 343
80 244
50 2320
60 1123
60 592
60 343
80 243
50 2320
60 1115
60 593
60 344
80 243
50 2316
60 1109
60 594
60 344
80 243
50 2299
60 1096
60 593
60 344
80 243
50 1004
50 587
50 342
70 238
50 999
50 591
50 341
70 238
50 996
50 590
50 339
70 238
50 994
50 589
50 338
70 238
50 996
50 590
50 338
70 238
50 984
50 589
50 336
70 238
70 238
70 236
60 227
60 227
60 228
60 228
60 227
60 227
60 227
60 225
50 218
50 219
50 219
50 219
50 219
50 220
50 219
50 219

Raymond Delashmitt Application of Fluorometers to Measure Wild Algal Growth In Vivo
2010 - 2011
Page 36 of 36
Bibliography Aberle, N. (September 2006). 'Spectral fingerprinting' for specific algal groups on sediments in situ: a
new senso. Stuttgart , 575-592.
H, U. (1958). Zur Vervollkommnung der quantitativen Phytoplankton-Methodik. Mitt. Internat. , 1-38.
SCCF Recon. (2010). Chlorophyll. Retrieved August 1, 2010, from SCCF Recon - Sanibel-Captiva
Conservation Foundation: River, Estuary and Coastal Observing Network:
http://recon.sccf.org/definitions/chlorophyll.shtml
Schroeder, W. &. (1994). Pigment patterns in suspended matter from Elbe and associated waters as
determined using high performance liquid chromatography. Neth. J Aquat. Ecol. , 255-265.
Wetlabs. (May 17, 2010). Characterization Sheet.
Wetlabs. (23 Dec 2009). Combination Fluorometer and Turbidity Sensor.