Embed Size (px)
Citation preview
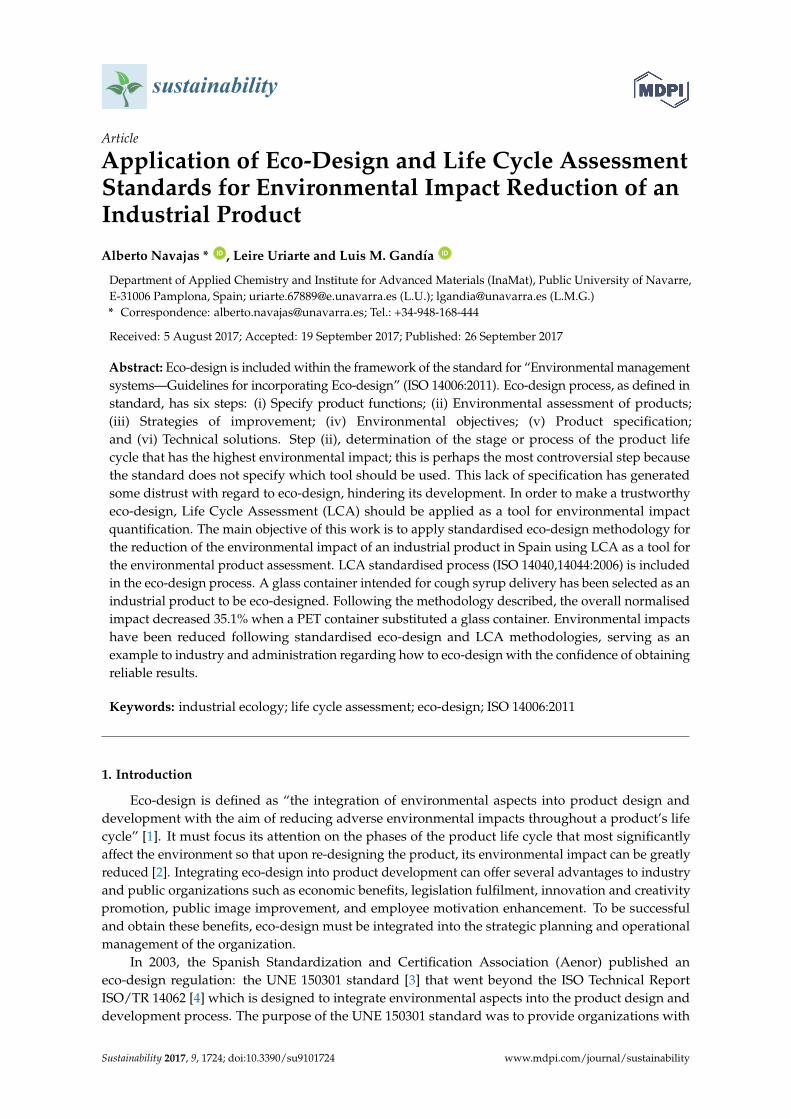
sustainability
Article
Application of Eco-Design and Life Cycle AssessmentStandards for Environmental Impact Reduction of anIndustrial Product
Alberto Navajas * ID , Leire Uriarte and Luis M. Gandía ID
Department of Applied Chemistry and Institute for Advanced Materials (InaMat), Public University of Navarre,E-31006 Pamplona, Spain; [email protected] (L.U.); [email protected] (L.M.G.)* Correspondence: [email protected]; Tel.: +34-948-168-444
Received: 5 August 2017; Accepted: 19 September 2017; Published: 26 September 2017
Abstract: Eco-design is included within the framework of the standard for “Environmental managementsystems—Guidelines for incorporating Eco-design” (ISO 14006:2011). Eco-design process, as defined instandard, has six steps: (i) Specify product functions; (ii) Environmental assessment of products;(iii) Strategies of improvement; (iv) Environmental objectives; (v) Product specification;and (vi) Technical solutions. Step (ii), determination of the stage or process of the product lifecycle that has the highest environmental impact; this is perhaps the most controversial step becausethe standard does not specify which tool should be used. This lack of specification has generatedsome distrust with regard to eco-design, hindering its development. In order to make a trustworthyeco-design, Life Cycle Assessment (LCA) should be applied as a tool for environmental impactquantification. The main objective of this work is to apply standardised eco-design methodology forthe reduction of the environmental impact of an industrial product in Spain using LCA as a tool forthe environmental product assessment. LCA standardised process (ISO 14040,14044:2006) is includedin the eco-design process. A glass container intended for cough syrup delivery has been selected as anindustrial product to be eco-designed. Following the methodology described, the overall normalisedimpact decreased 35.1% when a PET container substituted a glass container. Environmental impactshave been reduced following standardised eco-design and LCA methodologies, serving as anexample to industry and administration regarding how to eco-design with the confidence of obtainingreliable results.
Keywords: industrial ecology; life cycle assessment; eco-design; ISO 14006:2011
1. Introduction
Eco-design is defined as “the integration of environmental aspects into product design anddevelopment with the aim of reducing adverse environmental impacts throughout a product’s lifecycle” [1]. It must focus its attention on the phases of the product life cycle that most significantlyaffect the environment so that upon re-designing the product, its environmental impact can be greatlyreduced [2]. Integrating eco-design into product development can offer several advantages to industryand public organizations such as economic benefits, legislation fulfilment, innovation and creativitypromotion, public image improvement, and employee motivation enhancement. To be successfuland obtain these benefits, eco-design must be integrated into the strategic planning and operationalmanagement of the organization.
In 2003, the Spanish Standardization and Certification Association (Aenor) published aneco-design regulation: the UNE 150301 standard [3] that went beyond the ISO Technical ReportISO/TR 14062 [4] which is designed to integrate environmental aspects into the product design anddevelopment process. The purpose of the UNE 150301 standard was to provide organizations with
Sustainability 2017, 9, 1724; doi:10.3390/su9101724 www.mdpi.com/journal/sustainability
Sustainability 2017, 9, 1724 2 of 16
elements of an Environmental Management System in order for the design and development processinvolving products and/or services to be effective, including from an environmental standpoint [5].The Spanish standard was later used as a basis for creating the ISO 14006:2011 standard for“Environmental management systems—Guidelines for incorporating Eco-design” [6] that replacedthe ISO/TR 14062. This standard plays an important role with regard to the adoption of preventionmeasures that help the companies to reduce their environmental impact; it also helps the companiesanticipate preventive measures for future environmental regulations.
Eco-design has been applied at an early stage in the product development phase and it leads toimproved design specifications [7–10]. In addition, initiatives to implement eco-design in small andmedium-sized enterprises (SMEs) [5,11,12] are underway. For example, some companies adopted theUNE 150301 standard [5,13], and some other Spanish companies in the capital equipment sector haveadopted the ISO 14006:2011 standard [14]. However, due to difficulties in obtaining information fromsuppliers and the companies’ lack of knowledge regarding how to apply eco-design, the standard hasnot been widely applied by industry or public organizations [15]. In addition, the scientific literaturehas provided very few studies following the eco-design process described by ISO 14006:2011 [5] withthe objective of the environmental impact reduction of an industrial product.
The eco-design process is originally divided into six steps in ISO 14006:2011: (i) Specify productfunctions; (ii) Environmental assessment of products; (iii) Strategies of improvement, where a strategy ofproduct improvement is selected according to results of step (ii); (iv) Develop environmental objectivesbased on the improvement strategies; (v) Establish a product specification addressing the environmental objectives;and finally (vi) Develop technical solutions to meet the environmental objectives [6].
After step (i) Specify product functions, step (ii) of the eco-design process, called Environmentalassessment of products, is perhaps the most controversial. In this step, the main objective is to determinewhich stage or process of the product life cycle has the highest environmental impact. The eco-designstandard does not specify which tool should be used for identifying this impact; to date, eco-designershave used qualitative or semi-quantitative methods (e.g., MET [Materials, Energy, and Toxicity] matrix).The questionable adequacy of these tools has generated some distrust with regard to eco-design [13]and is one of the reasons why its development has been hindered. In order to make a trustworthyeco-design, its methodology should include a quantitative as well as the most objective tool availablefor performing environmental impact evaluation.
Life cycle assessment (LCA) is a well-established and widely accepted tool for determining theenvironmental profile of a product. Although the eco-design standard does not make reference to LCA,it is the most objective and frequently used tool for determining the environmental profile of products.In fact, LCA has been widely applied in order to reduce materials and energy and environmentalpollution during product design and manufacturing [16–19]. Since the 1970’s, when scientists beganusing LCA, numerous organizations and standardization companies have been trying to systemizethis type of assessment and make the necessary improvements. Finally, the ISO 14040:2006 and14044:2006 Standards [20,21] established the correct methodological framework to follow for anaccurate LCA study.
Some authors have developed procedures in order to integrate LCA and eco-designmethods [22–24], but none of the methodologies described are the one detailed in the eco-designstandards. Some other authors have used LCA and the eco-design methodology described inthe ISO/TR 14062 standard in their studies [25,26]. In Arana-Landin et al. [5,13], the processof implementing UNE 150310 in some Spanish companies has been described; however, for theenvironmental assessment of the products, they used either MET matrix semi-quantitative tools, or theirdescription of LCA was lacking in terms of methodology and the data used. In addition, LCA wassimplified by the use of Ecoindicators 99. Finally, Landeta et al. [14] described the application of theISO 14006 standard in some companies with LCA, but no description of the eco-design methodologyor the LCA was given.

Sustainability 2017, 9, 1724 3 of 16
The main objective of this work is to show and exemplify the step by step and detailed applicationof the eco-design methodology described in ISO 14006:2011 for reducing the environmental impacts ofindustrial product fabrication; LCA is used as the tool for environmental impact assessment. The aimis to encourage professionals from the industry and administration to consider and implement thisprocedure. One reason why eco-design standardisation has been hindered is the lack of knowledgeon the part of companies in terms of how to use and integrate LCA into their Enterprise ResourcesPlanning [14]. Therefore, special attention should be focused on LCA application and the fourstages [20] of LCA described in ISO 14040 and 14044 and included in stage 2 of the eco-design process(Figure 1) [2,19,27].
Sustainability 2017, 9, 1724 3 of 15
impact assessment. The aim is to encourage professionals from the industry and administration to consider and implement this procedure. One reason why eco-design standardisation has been hindered is the lack of knowledge on the part of companies in terms of how to use and integrate LCA into their Enterprise Resources Planning [14]. Therefore, special attention should be focused on LCA application and the four stages [20] of LCA described in ISO 14040 and 14044 and included in stage 2 of the eco-design process (Figure 1) [2,19,27].
Figure 1. Eco-design Methodology Flowchart.
Considering a possible industrial product fabricated in series in large amounts, in this study the container of a cough syrup has been selected for its simplicity. This allows focusing on the eco-design procedure methodology and offers opportunities for environmental impact reduction. This syrup container is considered primary packaging, defined as “any packaging designed to constitute a sales unit to the final user or consumer at the point of sale” [28]. Commercial software GaBi® 6.0 Pro. (Thinkstep, Leinfelden-Echterdingen, Germany) has been used to model the life cycle of the product. This software has a large database that allows acquiring inventory data with good precision [29].
2. Eco-Design of a Syrup Product Container
2.1. Specify Product Functions
The eco-design process starts with the “Specify product functions” phase (Figure 1). The product in this study was a 200 mL amber glass cough syrup bottle with an aluminium cap. It also had a polypropylene (PP) dispenser and everything was packaged up in a cardboard box, with the patient information leaflet included inside.
The term packaging can be defined as any product made of materials of any nature to be used for containing, protecting, handling, delivering, and presenting goods, from raw materials to finished goods, and from the producer to the user or consumer. Thus, the product function is to provide a safe and inert container for the distribution and use of syrup.
It is important to clearly differentiate between the packaging and the product itself contained in the package. The product itself (and processing aspects) is not normally included in the analysis of the life cycle of a packaging system [28] and in this study, neither product (cough syrup) manufacturing nor its filling process are going to be studied.
Figure 1. Eco-design Methodology Flowchart.
Considering a possible industrial product fabricated in series in large amounts, in this study thecontainer of a cough syrup has been selected for its simplicity. This allows focusing on the eco-designprocedure methodology and offers opportunities for environmental impact reduction. This syrupcontainer is considered primary packaging, defined as “any packaging designed to constitute a salesunit to the final user or consumer at the point of sale” [28]. Commercial software GaBi® 6.0 Pro.(Thinkstep, Leinfelden-Echterdingen, Germany) has been used to model the life cycle of the product.This software has a large database that allows acquiring inventory data with good precision [29].
2. Eco-Design of a Syrup Product Container
2.1. Specify Product Functions
The eco-design process starts with the “Specify product functions” phase (Figure 1). The productin this study was a 200 mL amber glass cough syrup bottle with an aluminium cap. It also had apolypropylene (PP) dispenser and everything was packaged up in a cardboard box, with the patientinformation leaflet included inside.
The term packaging can be defined as any product made of materials of any nature to be usedfor containing, protecting, handling, delivering, and presenting goods, from raw materials to finishedgoods, and from the producer to the user or consumer. Thus, the product function is to provide a safeand inert container for the distribution and use of syrup.
Sustainability 2017, 9, 1724 4 of 16
It is important to clearly differentiate between the packaging and the product itself contained inthe package. The product itself (and processing aspects) is not normally included in the analysis of thelife cycle of a packaging system [28] and in this study, neither product (cough syrup) manufacturingnor its filling process are going to be studied.
2.2. Environmental Assessment
The next stage of the eco-design process is the “Environmental Assessment”. The evaluation ofthe environmental aspects of the package has been carried out using the GaBi® 6.0. Pro. LCA software.LCA was carried out following the methodology specified in ISO 14044:2006 [21]. The recommendationsstated in the Standard CR 12340:1996 “Packaging. Recommendations for conducting life cycle inventoryanalysis of packaging systems” [28] were also followed.
2.2.1. Goal and Scope Definition
Within the first phase of the LCA, the functional unit is defined, as well as the goal and scopeof the study. The objective of this study is to determine which stage or process of the cough syruppackaging life cycle has the highest environmental impact. The basis of the life cycle inventory andLCA is the functional unit. The unit of activity is defined based on the system function; for example,to provide one litre of fresh milk to consumers. Thus, in our case, the functional unit will be a containerto supply the final consumer with 200 mL of syrup.
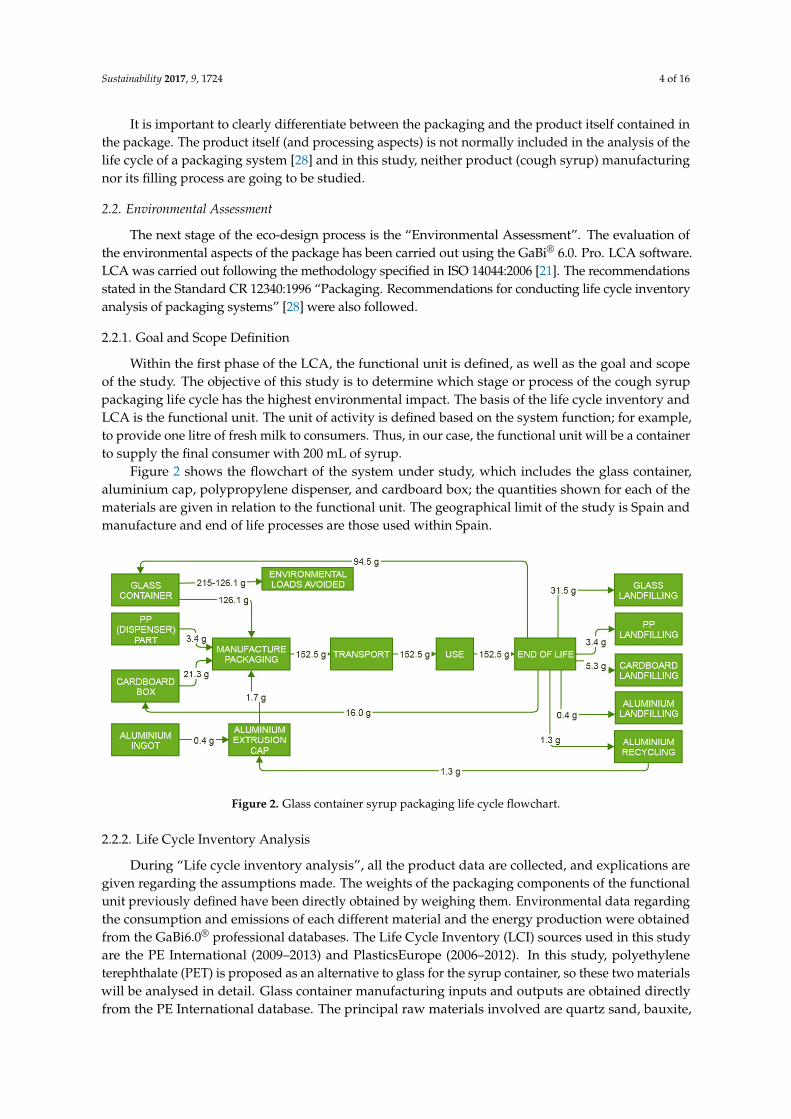
Figure 2 shows the flowchart of the system under study, which includes the glass container,aluminium cap, polypropylene dispenser, and cardboard box; the quantities shown for each of thematerials are given in relation to the functional unit. The geographical limit of the study is Spain andmanufacture and end of life processes are those used within Spain.
Sustainability 2017, 9, 1724 4 of 15
2.2. Environmental Assessment
The next stage of the eco-design process is the “Environmental Assessment”. The evaluation of the environmental aspects of the package has been carried out using the GaBi® 6.0. Pro. LCA software. LCA was carried out following the methodology specified in ISO 14044:2006 [21]. The recommendations stated in the Standard CR 12340:1996 “Packaging. Recommendations for conducting life cycle inventory analysis of packaging systems” [28] were also followed.
2.2.1. Goal and Scope Definition
Within the first phase of the LCA, the functional unit is defined, as well as the goal and scope of the study. The objective of this study is to determine which stage or process of the cough syrup packaging life cycle has the highest environmental impact. The basis of the life cycle inventory and LCA is the functional unit. The unit of activity is defined based on the system function; for example, to provide one litre of fresh milk to consumers. Thus, in our case, the functional unit will be a container to supply the final consumer with 200 mL of syrup.
Figure 2 shows the flowchart of the system under study, which includes the glass container, aluminium cap, polypropylene dispenser, and cardboard box; the quantities shown for each of the materials are given in relation to the functional unit. The geographical limit of the study is Spain and manufacture and end of life processes are those used within Spain.
Figure 2. Glass container syrup packaging life cycle flowchart.
2.2.2. Life Cycle Inventory Analysis
During “Life cycle inventory analysis”, all the product data are collected, and explications are given regarding the assumptions made. The weights of the packaging components of the functional unit previously defined have been directly obtained by weighing them. Environmental data regarding the consumption and emissions of each different material and the energy production were obtained from the GaBi6.0® professional databases. The Life Cycle Inventory (LCI) sources used in this study are the PE International (2009–2013) and PlasticsEurope (2006–2012). In this study, polyethylene terephthalate (PET) is proposed as an alternative to glass for the syrup container, so these two materials will be analysed in detail. Glass container manufacturing inputs and outputs are obtained directly from the PE International database. The principal raw materials involved are quartz sand, bauxite, limestone, sodium chloride, recycled glass, and clay. With regard to fossil fuels, they are natural gas, hard coal, and crude oil. The main outputs are carbon dioxide, calcium salts wastes, and residual chlorine emissions. PET containers were modelled using the PET granules manufacturing process from PlasticsEurope database linked with an injection process from the PE International database. Fossil resources such as natural gas and crude oil are the main raw materials of this process; carbon dioxide and SO2 are the principal emissions. The injection process used
Figure 2. Glass container syrup packaging life cycle flowchart.
2.2.2. Life Cycle Inventory Analysis
During “Life cycle inventory analysis”, all the product data are collected, and explications aregiven regarding the assumptions made. The weights of the packaging components of the functionalunit previously defined have been directly obtained by weighing them. Environmental data regardingthe consumption and emissions of each different material and the energy production were obtainedfrom the GaBi6.0® professional databases. The Life Cycle Inventory (LCI) sources used in this studyare the PE International (2009–2013) and PlasticsEurope (2006–2012). In this study, polyethyleneterephthalate (PET) is proposed as an alternative to glass for the syrup container, so these two materialswill be analysed in detail. Glass container manufacturing inputs and outputs are obtained directlyfrom the PE International database. The principal raw materials involved are quartz sand, bauxite,
Sustainability 2017, 9, 1724 5 of 16
limestone, sodium chloride, recycled glass, and clay. With regard to fossil fuels, they are natural gas,hard coal, and crude oil. The main outputs are carbon dioxide, calcium salts wastes, and residualchlorine emissions. PET containers were modelled using the PET granules manufacturing processfrom PlasticsEurope database linked with an injection process from the PE International database.Fossil resources such as natural gas and crude oil are the main raw materials of this process; carbondioxide and SO2 are the principal emissions. The injection process used electricity from the Spanishelectric mix, mainly composed of natural gas, nuclear energy, as well as hydroelectric and wind energy.
With regard to the uncertainty of the information, some assumptions had to be made andevaluated by sensitivity analysis in the interpretation step. In order to determine the quality ofthe data, a data quality analysis was performed using LCA software; the results obtained were asfollows: 4.0% of the data were measured, 21.9% of the data were calculated, 66.5% were obtained fromliterature, 4.2% were estimated, and 3.4% were obtained by other means.
Assumptions
The main assumptions and simplifications adopted in this study are as follows:
(1) According to the GaBi® 6.0. Pro. software database [30], the production of 1 kg of glass containersinvolves 0.44 kg of recycled glass. The process also takes into account the recycling inputs andoutputs (recovery, transport, classification, and crushing). An amber colour is obtained by theaddition of iron salts that are also included as raw material.
(2) The software also includes a process for fabricating cardboard boxes. In this case, the processuses 0.902 kg of waste paper as raw material to obtain 1 kg of cardboard [31]. The process alsoconsiders the inputs and outputs of the recycling process for cardboard [32].
(3) The weight of the patient information leaflet is very small, so it has been added to the cardboardbox weight.
(4) Transport was carried out by diesel truck for an average distance of 100 km from thepharmaceutical industry to the selling points.
(5) Regarding the end of life, a closed loop allocation procedure has been applied for glass, cardboard,and aluminium recycling. In this case, the need for allocation is avoided because the use ofsecondary material displaces the use of virgin (primary) materials [21]. Although cough syruppackaging is a pharmaceutical material and should be treated as a special recycling material,the syrup itself cannot be considered a toxic compound and these collecting and cleaning specialprocesses have not been considered in this study; recycling glass, aluminium, cardboard, and PETrates are the same as standard commercial rates. Following the recycling rates for these materialsthat currently exist in Spain [33,34], it has been assumed that 75% of the cardboard and glass wastematerials were recycled whereas the rest of these wastes were landfilled. However, LCA softwareonly allows introducing 0.44 kg of recycled glass per kg of glass container produced. If 75% ofthe glass container is recycled (94.5 g in Figure 2), GaBi® Glass Container process will produce215 g of glass container. To avoid the environmental impacts of producing 215 g of glass containerinstead of the 126.1 g that in truth are used, an “Environmental Loads Avoided” process isintroduced. This process subtracts environmental impacts of producing 88.9 g (215–126.1) of glasscontainer. In the case the Corrugated Board production process, these operations are avoidedbecause LCA software allows producing cardboard with almost all the raw materials beingrecycled cardboard.
In the case of the PET bottles, the current recycling rate in Spain for PET wastes is 57% [35].Since there is no PET recycling process in the GaBi® Database, inventory data from two differentPET recycling processes found in the literature were used [36,37]. Data from Arena et al. [37]were used in the study, and sensitivity analysis was performed with Perugini et al. [36] data inorder to analyse their influence on the final results. Tables S1 and S2 in Supplementary Material(SM) include the data that was used.
Sustainability 2017, 9, 1724 6 of 16
(6) Unlike glass containers and cardboard boxes, there is no process for aluminium partsmanufacturing in GaBi® 6.0. Pro. that takes into account the percentage of recycled aluminiumas input. For the aluminium, it was considered that 78% of the aluminium waste would berecycled. However, the software can simulate the procedure for obtaining an aluminium ingotfrom aluminium scraps. This is the process included in Figure 2 as “Recycling Aluminium”.With an input of 1.3 g of aluminium scraps (78% of the aluminium waste generated), this processgenerates 1.26 g of aluminium ingot. This ingot is reintroduced into the system as input in thealuminium extrusion profile manufacturing process.
(7) It is considered that the polypropylene dispenser was sent to the landfill.(8) The environmental impacts, associated to printing ink on the cardboard box and the patient
information leaflet, have not been taking into account because their importance is considered tobe minor.
2.2.3. Life Cycle Impact Assessment (LCIA)
The goal of this phase is to convert inventory results into diverse types of impacts on theenvironment. Once inventory data have been collected, they are transformed and summed up in thevarious environmental impact indicators (EIIs) by characterization factors [38,39]. Since LCA was putinto use, numerous methods for transforming inventory data to EIIs have been developed, makingit difficult for an eco-designer to know which method is the most suitable [40,41]. Differences incharacterization models and their substance coverage for individual impact categories exert influenceon the results of life cycle assessments (LCAs), sometimes capable of changing the conclusionsof comparative LCA studies. This often leads to a different ranking of substances in terms ofmajor contributors to the environmental impact [42–44]. As a result, many LCA practitionersexclude some potentially important impact categories from assessments [45], and they recognizethat LCIA is one of their main limitations [40]. Therefore, with the aim of establishing a more reliableuse of the LCA tool throughout Europe, the Joint Research Centre [46,47] has recently created ahandbook to help eco-designers to make the correct choice for calculating environmental indicators.These recommendations are also helpful when interpreting results because they also determine thereliability of the results [48].
This study has followed these recommendations, and Table S3 in the SM specifies 13 recommendedenvironmental indicators along with the method used for their calculation as specified in the documentof characterization factors of the ILCD [49]. Classification of the methods as I (recommended andsatisfactory), II (recommended but in need of some improvements), and III (recommended but to beapplied with caution) is also included. Table S3 also shows the abbreviations for each EII (e.g., GWPfor Global Warming Potential) that will be used throughout this study. The software GaBi 6.0® Pro.automatically completes the inventory analysis data transformation to EIIs using the characterizationmethods explained.
2.2.4. Life Cycle Interpretation
For a correct interpretation, in Figure 3, raw material extraction and manufacture life cyclestages have been considered together for each material. In this figure cardboard, aluminium, PP,and glass include all the processes for the raw material extraction and fabrication of the cardboard box,aluminium cap, polypropylene dispenser, and glass container, respectively. Transport and end of lifeinclude these life cycle stages for the whole packaging. Figure 3 shows the percentage of contributionof each of these stages to the value of the 13 environmental indicators that have been used in this study.Table S4 in SM shows the values of each indicator for the six stages considered. The product use lifecycle stage has not been taken into account because it does not generate any impact.
It can be observed that the glass container manufacturing process contributes the most to two of thethree recommended indicators classified as level I, to five of the six indicators classified as level II, and toone of the three classified as level II/III. Observing the level I indicators, glass container fabrication

Sustainability 2017, 9, 1724 7 of 16
is the maximum responsible process regarding the GWP and Particulate Matters (PMP) indicators.In the first case, this is due to the fact that it is a high energy demanding process where natural gascombustion is used for maintaining the high temperatures required in the ovens; in the second case, it isdue to raw material processing and fuel combustion. The manufacturing process of the polypropylenedispenser is responsible for its high contribution to the Ozone Depletion Potential (ODP) indicatorvalue due to the halogenated hydrocarbons released during petroleum refining [50]. Looking at levelII EIIs, it can be observed that emissions of SO2 and NO released into the atmosphere during theglass container fabrication are the source of the Acidification Potential (AP) value; the released NOx
emissions are responsible for the marine and terrestrial eutrophication potential, and also for thePhotochemical Ozone Formation (POCP) value. These emissions are related to the natural gas burnedin the glass industry ovens. Bauxite, used as the source of aluminium in the glass container andaluminium cap production, is the main source of the Resource Depletion (RD) indicator. Phosphateemissions to fresh water due to the use of fertilizers during wood production are responsible for thecontribution of the cardboard manufacturing process to the Eutrophication (FEP) value. With regard tothe last group of EIIs catalogued as level II/III and interim, emissions of Hg2+ generated during glassproduction, are the main contributor to the HTCP and HTNCP indicators. Glass container productionalso needs considerable quantities of electric power; the nuclear plants that form part of the Spanishgrid mix are responsible for the C14 emissions that contribute to the value of the Ionising Radiation(IRP) indicator. With regard to toxicity indicators, the cardboard manufacturing process becomesimportant because of the heavy metals emissions, such as Zn2+ to water (Ecotoxicity Freshwater(FWETP)) and to agricultural soil (Human Toxicity Potential, Non Cancer Effects (HTNCP)) fromcardboard industry wastewater [51]. Finally, it can be observed that end of life and transport stagesexert little influence on the final indicator values.
Sustainability 2017, 9, 1724 7 of 15
gas burned in the glass industry ovens. Bauxite, used as the source of aluminium in the glass container and aluminium cap production, is the main source of the Resource Depletion (RD) indicator. Phosphate emissions to fresh water due to the use of fertilizers during wood production are responsible for the contribution of the cardboard manufacturing process to the Eutrophication (FEP) value. With regard to the last group of EIIs catalogued as level II/III and interim, emissions of Hg2+ generated during glass production, are the main contributor to the HTCP and HTNCP indicators. Glass container production also needs considerable quantities of electric power; the nuclear plants that form part of the Spanish grid mix are responsible for the C14 emissions that contribute to the value of the Ionising Radiation (IRP) indicator. With regard to toxicity indicators, the cardboard manufacturing process becomes important because of the heavy metals emissions, such as Zn2+ to water (Ecotoxicity Freshwater (FWETP)) and to agricultural soil (Human Toxicity Potential, Non Cancer Effects (HTNCP)) from cardboard industry wastewater [51]. Finally, it can be observed that end of life and transport stages exert little influence on the final indicator values.
Figure 3. Percentage of contribution of the different stages and manufacturing processes of the syrup glass container life cycle to the overall values of the environmental indicators.
Based on these results, it may be concluded that the glass container manufacturing process has the highest environmental impact because it contributes the most to almost all the EIIs. Nevertheless, cardboard manufacturing or polypropylene production processes are also relevant. In fact, regarding the indicator ODP classified as level I, the polypropylene dispenser manufacturing process has the highest impact, and cardboard has importance with regard to the FEP indicator classified as level II. Therefore, it would be erroneous to conclude that in this case eco-design has to focus on the glass production process as this is not the most important process for all the relevant indicators. For this reason, to elucidate which manufacturing process is the one with higher environmental impacts, an additional normalisation analysis has been performed.
Normalisation
ISO 14044:2006 [21] defines normalisation as “calculation of the magnitude of indicator results relative to reference information”. Normalisation is not a mandatory element of the life cycle interpretation but it helps in decision-making stages of the eco-design process. In this study, normalisation has been carried out to determine which manufacturing process (glass container, cardboard box, or polypropylene dispenser) should be focused on for an effective eco-design. By means of normalisation, EIIs are converted into one equivalent unit following geographic and demographical criteria. The different amounts of resources that are wasted or the emissions released per inhabitant, year, and region are used for this conversion.
Figure 3. Percentage of contribution of the different stages and manufacturing processes of the syrupglass container life cycle to the overall values of the environmental indicators.
Based on these results, it may be concluded that the glass container manufacturing process hasthe highest environmental impact because it contributes the most to almost all the EIIs. Nevertheless,cardboard manufacturing or polypropylene production processes are also relevant. In fact, regardingthe indicator ODP classified as level I, the polypropylene dispenser manufacturing process has thehighest impact, and cardboard has importance with regard to the FEP indicator classified as level II.Therefore, it would be erroneous to conclude that in this case eco-design has to focus on the glassproduction process as this is not the most important process for all the relevant indicators. For this
Sustainability 2017, 9, 1724 8 of 16
reason, to elucidate which manufacturing process is the one with higher environmental impacts,an additional normalisation analysis has been performed.
Normalisation
ISO 14044:2006 [21] defines normalisation as “calculation of the magnitude of indicator resultsrelative to reference information”. Normalisation is not a mandatory element of the life cycleinterpretation but it helps in decision-making stages of the eco-design process. In this study,normalisation has been carried out to determine which manufacturing process (glass container,cardboard box, or polypropylene dispenser) should be focused on for an effective eco-design. By meansof normalisation, EIIs are converted into one equivalent unit following geographic and demographicalcriteria. The different amounts of resources that are wasted or the emissions released per inhabitant,year, and region are used for this conversion.
Normalisation helps to evaluate if the indicators for the product system under study have high orlow contributions relative to the same indicators of the reference system. Indicators with a relativelyhigh contribution can be considered relevant and this can be useful information for the eco-designerbecause it helps when deciding which design option would most reduce the important normalisedindicator. However, normalisation is subjected to uncertainty due to the lack of data for the referencesystem or due to the absence of characterization methods [52]. Eco-design based on normalisationresults could lose reliability if the data used lacked robustness [52–55]. Recently, the EuropeanCommission [47] has released a document titled “Normalisation method and data for EnvironmentalFootprints” in which EU + 27 resources and emission data are compiled, used as reference systems,and recommended for use in normalisation calculations in terms of the robustness of the calculationmethod (resources and emissions data and robustness are presented in Table S5 of the SM).
In order to increase the confidence level of the results, this study carried out normalisation usingthe aforementioned data (Table S5) and recommendations. The method suggested in Klöpffer et al. [56]for calculating the different normalised impacts according to Equation (1) was also followed in orderto consider Spain as geographic limits:
NIj =EIj × FUyear
MEIj /Inhabitansyear(1)
in which NIj is the normalised value of the environmental indicator j; EIj is the value of theenvironmental indicator j; FUyear is the number of manufacturing functional units (syrup packages)wasted in Spain during 2010; and MEIj is the domestic inventory value in Eq. units of each indicatorfor Spain during 2010 which are the most recent data available [47]. FUyear has been calculatedtaking into account the fact that 3% of the municipal solid wastes are pharmaceutical and ofthese, only 14.7% correspond to syrup packaging [57]; MEIj has been calculated considering thatEU + 27 countries consume and emit at the same rate; the population in EU + 27 is 499 million and47 million in Spain in 2010. Table S6 in SM and Figure 4 give the normalised values for each lifecycle stage and manufacturing process. According to these results, the most relevant indicators forthe case under study are GWP, PMP, and AP. Therefore, they are the most important factors to betaken into account for the purpose of eco-designing the syrup package. Figure 4 also shows that theglass container manufacturing process is the one that contributes the most to the main environmentalimpacts. The final conclusion is that if the environmental impacts have to be reduced, we have to focuson the glass container.

Sustainability 2017, 9, 1724 9 of 16
Sustainability 2017, 9, 1724 8 of 15
Normalisation helps to evaluate if the indicators for the product system under study have high or low contributions relative to the same indicators of the reference system. Indicators with a relatively high contribution can be considered relevant and this can be useful information for the eco-designer because it helps when deciding which design option would most reduce the important normalised indicator. However, normalisation is subjected to uncertainty due to the lack of data for the reference system or due to the absence of characterization methods [52]. Eco-design based on normalisation results could lose reliability if the data used lacked robustness [52–55]. Recently, the European Commission [47] has released a document titled “Normalisation method and data for Environmental Footprints” in which EU + 27 resources and emission data are compiled, used as reference systems, and recommended for use in normalisation calculations in terms of the robustness of the calculation method (resources and emissions data and robustness are presented in Table S5 of the SM).
In order to increase the confidence level of the results, this study carried out normalisation using the aforementioned data (Table S5) and recommendations. The method suggested in Klöpffer et al. [56] for calculating the different normalised impacts according to Equation (1) was also followed in order to consider Spain as geographic limits: = ×/ ℎ (1)
in which NIj is the normalised value of the environmental indicator j; EIj is the value of the environmental indicator j; FUyear is the number of manufacturing functional units (syrup packages) wasted in Spain during 2010; and MEIj is the domestic inventory value in Eq. units of each indicator for Spain during 2010 which are the most recent data available [47]. FUyear has been calculated taking into account the fact that 3% of the municipal solid wastes are pharmaceutical and of these, only 14.7% correspond to syrup packaging [57]; MEIj has been calculated considering that EU + 27 countries consume and emit at the same rate; the population in EU + 27 is 499 million and 47 million in Spain in 2010. Table S6 in SM and Figure 4 give the normalised values for each life cycle stage and manufacturing process. According to these results, the most relevant indicators for the case under study are GWP, PMP, and AP. Therefore, they are the most important factors to be taken into account for the purpose of eco-designing the syrup package. Figure 4 also shows that the glass container manufacturing process is the one that contributes the most to the main environmental impacts. The final conclusion is that if the environmental impacts have to be reduced, we have to focus on the glass container.
Figure 4. Normalised values for the glass container syrup packaging. Figure 4. Normalised values for the glass container syrup packaging.
Finally, a sensitivity check of the life cycle assessment has been carried out [20,21]. The objectiveof the sensitivity check is to assess the reliability of the final results and conclusions, determiningwhether they are affected by uncertainties in the data, allocation methods or calculation of categoryindicator results, etc. [20]. Two possible scenarios have been considered: I—the percentage of glassthat is landfilled changes from 25% to 50%; II—the percentage of aluminium that is landfilled and notrecycled changes from 22% to 50%. These scenarios have been selected because recycling percentagesare important data that determine the amount of raw materials used for new glass containers andaluminium taps. These percentages are considered as uncertainties because they could vary if data timeor geographical limits are different. If the conclusions do not vary for the different scenarios it could besaid that the final conclusions are reliable. Under scenario I, normalised values have been recalculatedand increments of 2.9% for GWP, 0.6% for PMP, and 2.3% for AP were obtained. These variations aresmall and therefore, the same conclusions can be drawn as in the original scenario. With regard toscenario II, there were variations of 2.6%, 0.3%, and 2.2% of the normalised values of the GWP, PMP,and AP EIIs. It can be concluded that there are no important variations in this scenario either, and thatthe conclusions are the same: the LCA study is robust and not sensitive to important variations in theratio of recycled material.
2.3. Strategies of Improvement
Once the life cycle stage with the highest environmental impact has been identified, the eco-designprocess continues with the “Strategies of improvement” phase (Figure 1). Eco-design strategies can bebroadly categorized into eight groups [8,58]:
1 reduction of the number of different materials and selection of the most appropriate ones;2 reduction of environmental impact in the production phase;3 optimisation of the distribution phase;4 reduction of environmental impact on the use phase;5 extension of the product’s useful life span;6 simplification of product disassembly (design for disassembly);7 design for reuse;8 design for recycling.
Results obtained in the previous section make strategy 1, “reduction of the number of differentmaterials and selection of the most appropriate ones”, the most effective strategy. In fact, in this case all

Sustainability 2017, 9, 1724 10 of 16
eco-design actions should be directed towards the reduction of the glass content of the functional unitor its complete replacement by an alternative material that can significantly reduce the environmentalimpacts. The reduction of the thickness of the glass container could be a possibility but this introducesserious doubts regarding the adequacy of the new container as being useful for its main function;moreover, safety issues regarding transportation and bottle handling by the consumer would have tobe considered as well. For these reasons, and because the interest of pharmaceutical companies onreducing the use of glass containers, this study proposes the substitution of glass with polyethyleneterephthalate (PET), previously tested by pharmaceutical companies and recognized as an excellentprimary container with similar barrier properties as those of glass.
2.4. Environmental Objectives, Product Specification, and Technical Solutions
With the aim of summarizing, steps (iv), (v), and (vi) are going to be considered all together in thissection. With regard to “Environmental Objectives”, the objective in this study is to determine the EIIspercentage reduction with the strategy of improvement selected, but no specific reduction is targeted.On the other hand, concerning “Product Specification”, Figure 5 shows the life cycle flowchart for thePET syrup packaging and the new PET container weight. The new weight of the PET container is now28.3 g, much less than the glass container weight of 126.1 g. The rest of the components are the same.Obviously, the new eco-designed product has to meet technical, economic, and social requirementsapart from the environmental ones. Throughout the rest of this section, the environmental profile ofthe newly designed product is going to be compared with the initial design; if the new one fulfils the“Environmental Objectives”, it will be included in the “Technical Solutions” final step of the eco-designprocess. In this part of the eco-design process, the environmental profile of the new product designis going to be evaluated again by LCA (step 2 eco-design process (Figure 1)), with the objective ofdecreasing EIIs.
Sustainability 2017, 9, 1724 10 of 15
environmental profile of the newly designed product is going to be compared with the initial design; if the new one fulfils the “Environmental Objectives”, it will be included in the “Technical Solutions” final step of the eco-design process. In this part of the eco-design process, the environmental profile of the new product design is going to be evaluated again by LCA (step 2 eco-design process (Figure 1)), with the objective of decreasing EIIs.
Figure 5. PET container syrup packaging life cycle flowchart.
Table S7 in SM and Figure 6 show LCA results for the package system based on the PET container, including the per cent contribution of each life cycle stage to the environmental indicators. With regard to Level I indicators (GWP, ODP, and PMP), manufacturing the PET container is the process that contributes the most. The CO2 released during PET granules manufacturing and injection is principally responsible for the GWP indicator. With regard to the ODP indicator, methyl bromide, one of the pollutants responsible for the depletion of the ozone layer, is released during PET granules manufacturing [59–61]. The value of the PMP indicator is mainly due to the SO2 and dust released into the atmosphere when electricity is generated for its use in the injection process as well as during PET granules manufacturing. With regard to Level II indicators, the PET container manufacturing process has the highest impact on POCP, AP and, Terrestial Eutrophication (TEP) indicators due to the NOx emissions produced during PET granules manufacturing and to the electricity consumed. During PET synthesis, an antimonite-based (salts of Sb+3) catalyst is used [62], and this is what exerts the most influence on the RD indicator. The phosphate released into the water and the phosphorous released into the groundwater have the greatest impact on the FEP value. Finally, Aquatic Marine Eutrophication (MEP) [1] is the only indicator that is not significantly affected by the PET container fabrication process. In this case, the NO2 released into the atmosphere during cardboard and PP dispenser manufacturing is what has the most influence on this indicator. The values of the toxicity indicators are mainly related to the emissions of heavy metals into the air and water. From these results, it is clear that the PET container fabrication is the most influential process regarding all the EIIs, except for the MEP indicator. Finally, a comparison must be made with the original package based on the glass container in order to determine if the proposed eco-design has been effective. Figure S1 in the SM shows a comparison of the total Level I and Level II EIIs between the glass and the PET containers life cycle. PET container allows reduction of two of the three most relevant indicators for this case (GWP and PMP) but provokes a dramatic increase in the value of the ODP indicator due to the methyl bromide released into the atmosphere during manufacturing of PET granules [59,60]. With regard to Level II indicators, PET container decreases three of the indictors (AP, MEP, and TEP), and maintains the value of the POCP indicator, whereas FEP, and especially RD, increase due to the antimony-based catalyst used during PET production.
Figure 5. PET container syrup packaging life cycle flowchart.
Table S7 in SM and Figure 6 show LCA results for the package system based on the PETcontainer, including the per cent contribution of each life cycle stage to the environmental indicators.With regard to Level I indicators (GWP, ODP, and PMP), manufacturing the PET container is theprocess that contributes the most. The CO2 released during PET granules manufacturing and injectionis principally responsible for the GWP indicator. With regard to the ODP indicator, methyl bromide,one of the pollutants responsible for the depletion of the ozone layer, is released during PET granulesmanufacturing [59–61]. The value of the PMP indicator is mainly due to the SO2 and dust releasedinto the atmosphere when electricity is generated for its use in the injection process as well as during

Sustainability 2017, 9, 1724 11 of 16
PET granules manufacturing. With regard to Level II indicators, the PET container manufacturingprocess has the highest impact on POCP, AP and, Terrestial Eutrophication (TEP) indicators due tothe NOx emissions produced during PET granules manufacturing and to the electricity consumed.During PET synthesis, an antimonite-based (salts of Sb+3) catalyst is used [62], and this is what exertsthe most influence on the RD indicator. The phosphate released into the water and the phosphorousreleased into the groundwater have the greatest impact on the FEP value. Finally, Aquatic MarineEutrophication (MEP) [1] is the only indicator that is not significantly affected by the PET containerfabrication process. In this case, the NO2 released into the atmosphere during cardboard and PPdispenser manufacturing is what has the most influence on this indicator. The values of the toxicityindicators are mainly related to the emissions of heavy metals into the air and water. From theseresults, it is clear that the PET container fabrication is the most influential process regarding all the EIIs,except for the MEP indicator. Finally, a comparison must be made with the original package based onthe glass container in order to determine if the proposed eco-design has been effective. Figure S1 in theSM shows a comparison of the total Level I and Level II EIIs between the glass and the PET containerslife cycle. PET container allows reduction of two of the three most relevant indicators for this case(GWP and PMP) but provokes a dramatic increase in the value of the ODP indicator due to the methylbromide released into the atmosphere during manufacturing of PET granules [59,60]. With regard toLevel II indicators, PET container decreases three of the indictors (AP, MEP, and TEP), and maintainsthe value of the POCP indicator, whereas FEP, and especially RD, increase due to the antimony-basedcatalyst used during PET production.Sustainability 2017, 9, 1724 11 of 15
Figure 6. Percentage contribution of the different stages and manufacturing processes of the PET container life cycle to the overall values of the environmental indicators.
Based on these results, it is not straightforward to make a decision regarding the convenience of substituting the glass container for a PET one. Most of the level I and II EIIs are higher for the glass container system, but there are some sharp increments of the RD and ODP indicators when PET is used. As mentioned before, the normalisation process gives more importance to some indicators, and this can help to take the appropriate decisions. This normalisation step has to be carried out very carefully so as not to draw wrong conclusions. Normalisation of the PET EIIs values has been carried out following the same methodology that was used for the glass container and the results are presented in Table S8 in the SM. Figure 7 shows the overall normalised values of the Level I and II indicators for both packaging systems. It can be observed that the overall impact decreases 35.1% in the case of the PET container (first and second columns in Figure 7). Comparing both systems, it can be observed that the sharp decrease of the normalised value of PMP is largely responsible for the reduction of the overall impact. The method used for the normalisation of PMP indicator is very robust; at the same time, PMP is a Level I indicator, which means that its use is recommended for decision-making processes. Therefore, after the eco-design process has been carried out, it can be confidently concluded that the environmental impact associated to a syrup package can be significantly reduced if the glass used for the container is replaced by PET.
Figure 7. Total Normalised values for the glass (left) and PET container (right) and evolution of normalised values for Level I and Level II indicators.
GLASS PET
Inha
bita
nt/y
ear
GW
P [k
g C
O2
Eq.
]
PM
P [k
g P
M2,
5 E
q.]
AP
[Mol
H+
Eq.
]
OD
P [k
g C
FC-1
1 E
q.]
IRP
[kg
U23
5 E
q.]
PO
CP
[kg
NM
VO
C E
q.]
TE
P [k
g N
Eq.
]
RD
[kg
Sb E
q.]
39,999
25,941
−1,276
−20,723
−2,649 −2,675
2,416776 230
9,842
50,000
40,000
30,000
20,000
10,000
(10,000)
(20,000)
(30,000)
Figure 6. Percentage contribution of the different stages and manufacturing processes of the PETcontainer life cycle to the overall values of the environmental indicators.
Based on these results, it is not straightforward to make a decision regarding the convenienceof substituting the glass container for a PET one. Most of the level I and II EIIs are higher for theglass container system, but there are some sharp increments of the RD and ODP indicators when PETis used. As mentioned before, the normalisation process gives more importance to some indicators,and this can help to take the appropriate decisions. This normalisation step has to be carried out verycarefully so as not to draw wrong conclusions. Normalisation of the PET EIIs values has been carriedout following the same methodology that was used for the glass container and the results are presentedin Table S8 in the SM. Figure 7 shows the overall normalised values of the Level I and II indicators forboth packaging systems. It can be observed that the overall impact decreases 35.1% in the case of the

Sustainability 2017, 9, 1724 12 of 16
PET container (first and second columns in Figure 7). Comparing both systems, it can be observedthat the sharp decrease of the normalised value of PMP is largely responsible for the reduction ofthe overall impact. The method used for the normalisation of PMP indicator is very robust; at thesame time, PMP is a Level I indicator, which means that its use is recommended for decision-makingprocesses. Therefore, after the eco-design process has been carried out, it can be confidently concludedthat the environmental impact associated to a syrup package can be significantly reduced if the glassused for the container is replaced by PET.
Sustainability 2017, 9, 1724 11 of 15
Figure 6. Percentage contribution of the different stages and manufacturing processes of the PET container life cycle to the overall values of the environmental indicators.
Based on these results, it is not straightforward to make a decision regarding the convenience of substituting the glass container for a PET one. Most of the level I and II EIIs are higher for the glass container system, but there are some sharp increments of the RD and ODP indicators when PET is used. As mentioned before, the normalisation process gives more importance to some indicators, and this can help to take the appropriate decisions. This normalisation step has to be carried out very carefully so as not to draw wrong conclusions. Normalisation of the PET EIIs values has been carried out following the same methodology that was used for the glass container and the results are presented in Table S8 in the SM. Figure 7 shows the overall normalised values of the Level I and II indicators for both packaging systems. It can be observed that the overall impact decreases 35.1% in the case of the PET container (first and second columns in Figure 7). Comparing both systems, it can be observed that the sharp decrease of the normalised value of PMP is largely responsible for the reduction of the overall impact. The method used for the normalisation of PMP indicator is very robust; at the same time, PMP is a Level I indicator, which means that its use is recommended for decision-making processes. Therefore, after the eco-design process has been carried out, it can be confidently concluded that the environmental impact associated to a syrup package can be significantly reduced if the glass used for the container is replaced by PET.
Figure 7. Total Normalised values for the glass (left) and PET container (right) and evolution of normalised values for Level I and Level II indicators.
GLASS PET
Inha
bita
nt/y
ear
GW
P [k
g C
O2
Eq.
]
PM
P [k
g P
M2,
5 E
q.]
AP
[Mol
H+
Eq.
]
OD
P [k
g C
FC-1
1 E
q.]
IRP
[kg
U23
5 E
q.]
PO
CP
[kg
NM
VO
C E
q.]
TE
P [k
g N
Eq.
]
RD
[kg
Sb E
q.]
39,999
25,941
−1,276
−20,723
−2,649 −2,675
2,416776 230
9,842
50,000
40,000
30,000
20,000
10,000
(10,000)
(20,000)
(30,000)
Figure 7. Total Normalised values for the glass (left) and PET container (right) and evolution ofnormalised values for Level I and Level II indicators.
Finally, a sensitivity analysis has been carried out in order to determine if PET life cycle assessmentis robust. In this case, a scenario using a different PET recycling method has been proposed because,as mentioned before, two different sources for PET recycling data have been found in the referenceliterature. Data from Arena et al. [37] (Table S2) have been used in this study and data from Peruginiet al. [36] (Table S1) have been used in the new scenario to determine if this assumption has greatinfluence on the final results and conclusions. The data indicate that for Arena et al. [37], 1.76 kgof waste PET are necessary for obtaining 1 kg of recycled PET, while for Perugini et al. [36], 2.36 kgof waste material are needed for obtaining 1 kg of recycled PET. The new scenario is therefore lessfavourable and increases 3.3, 1.1, and 3.2% of GWP, PMP, and AP EIIs, respectively. These variationscan be considered small, but there are also increases of 11.7 and 12.0% for indicators such as RD andODP. If the sum of the Level I and Level II normalised indicators of the new scenario are comparedwith the sum of those of the glass container, a reduction of 30.2% (35.1% of reduction obtained usingArena et al. [37] data) is obtained.
Two more scenarios have been considered for determining the robustness of the obtained results.In this case, the influence of the PET recycling rate has been selected and two scenarios have beencreated: I: 50% PET is recycled and 50% is sent to landfill; II: 40% PET is recycled and 60% is sentto landfill. These percentages have been used because as in the case of glass sensitivity analysis,recycling percentages are important data that determine the amount of raw materials used for newPET containers. In the new scenarios, reductions of the normalised indicators are produced, 32.3 and28.2%, respectively (compared with the 35.1% of reduction obtained with the 57% PET recycling andArena et al. [37] data). With regard to both sensitivity analyses, it can be concluded that the results arerobust and the eco-designer conclusions are reliable.
3. Limitations and Applicability of This Method
The eco-design methodology described in ISO 14006:2011 has been applied to an industrialproduct to illustrate the interest and benefits it provides, leading to the attainment of eco-design
Sustainability 2017, 9, 1724 13 of 16
certification. This methodology can also be applied to other types of products (e.g., furniture, clothes,personal care . . . ) with no modifications. The most important limitations of eco-design standardinclude the difficulty in obtaining the required data for the Life Cycle Inventory step in the LCA study,especially from suppliers, and perhaps a lack of knowledge regarding this methodology on the part ofthe industrial sector. These limitations make widespread application more complicated. In this study,data were obtained directly from a pharmaceutical company and from LCA software database. GaBi®
6.0 Pro.
4. Conclusions
The main objective of this work has been to apply eco-design methodology described in ISO14006:2011 for reducing the environmental impacts of an industrial product using LCA as a tool forthe environmental product assessment. LCA process standardised by ISO 14040,14044:2006 has beenincluded in the eco-design process.
A specific type of syrup packaging has been selected as a product for environmental impactreduction. The overall normalised impact decreases 35.1% when a PET container substituted the glasscontainer. Environmental impacts have been reduced following standardised eco-design and LCAmethodology. This has served as an example for industry and administrations so they can learn howto eco-design with a certain degree of confidence.
Supplementary Materials: The following are available online at www.mdpi.com/2071-1050/9/10/1724/s1,Inputs and outputs for PET recycling processes, recommended environmental indicators, along with the methodused for their calculation, equations and normalised units of each EII for each glass and PET container life cycles,domestic inventory for EU + 27, and overall robustness of the data and normalisation method related to overallvalues of the level I and II EIIs for the life cycles of glass and PET containers life cycle.
Acknowledgments: The authors are grateful to Laura Stokes for having reviewed the English version of thismanuscript. Software and databases for Life Cycle Engineering, PE IN-TERNATIONAL GmbH and LBP Universityof Stuttgart.
Author Contributions: All three authors contributed to the development and completion of this research.Leire Uriarte made LCA simulations and Alberto Navajas and Luis M. Gandía designed eco-design processand wrote the manuscript.
Conflicts of Interest: The authors declare no conflicts of interest.
References
1. Ihobe. Manual Práctico de Ecodiseño. Operativa de Implantación en 7 Pasos; Ihobe: Bilbao, Spain, 2000.2. Poudelet, V.; Chayer, J.; Margni, M.; Pellerin, R.; Samson, R. A Process-Based Approach to Operationalize
Life Cycle Assessment through the Development of an Eco-Design Decision-Support System. J. Clean. Prod.2012, 33, 192–201. [CrossRef]
3. Asociación Española de Normalización y Certificación (AENOR). UNE 150301:2003—Gestión Ambiental delProceso de Diseño y Desarrollo. Ecodiseño; AENOR: Madrid, Spain, 2003.
4. International Organization for Standarization. ISO Technical Report ISO/TR 14062—Environmental Management—Integrating Environmental Aspects into Product Design and Development; International Organization for Standarization:Geneva, Switzerland, 2002.
5. Arana-Landin, G.; Heras-Saizarbitoria, I. Paving the Way for the ISO 14006 Ecodesign Standard: An ExploratoryStudy in Spanish Companies. J. Clean. Prod. 2011, 19, 1007–1015. [CrossRef]
6. International Organization for Standarization. ISO 14006:2011 Environmental Management Systems—Guidelinesfor Incorporating Ecodesign; International Organization for Standarization: Geneva, Switzerland, 2011.
7. Gehin, A.; Zwolinski, P.; Brissaud, D. A Tool to Implement Sustainable End-of-Life Strategies in the ProductDevelopment Phase. J. Clean. Prod. 2008, 16, 566–576. [CrossRef]
8. Cerdan, C.; Gazulla, C.; Raugei, M.; Martinez, E.; Fullana-i-Palmer, P. Proposal for New QuantitativeEco-Design Indicators: A First Case Study. J. Clean. Prod. 2009, 17, 1638–1643. [CrossRef]
9. Vinodh, S.; Rathod, G. Integration of ECQFD and LCA for Sustainable Product Design. J. Clean. Prod. 2010,18, 833–842. [CrossRef]

Sustainability 2017, 9, 1724 14 of 16
10. Lewandowska, A.; Matuszak-Flejszman, A. Eco-Design as a Normative Element of Environmental ManagementSystems—The Context of the Revised ISO 14001:2015. Int. J. Life Cycle Assess. 2014, 19, 1794–1798. [CrossRef]
11. Van Hemel, C.; Cramer, J. Barriers and Stimuli for Ecodesign in SMEs. J. Clean. Prod. 2002, 10, 439–453.[CrossRef]
12. Le Pochat, S.; Bertoluci, G.; Froelich, D. Integrating Ecodesign by Conducting Changes in SMEs. J. Clean. Prod.2007, 15, 671–680. [CrossRef]
13. Arana-Landin, G.; Heras-Saizarbitoria, I.; Cilleruelo-Carrasco, E. A Case Study of the Adoption of a ReferenceStandard for ISO 14006 in the Lift Industry. Clean Technol. Environ. Policy 2012, 14, 641–649. [CrossRef]
14. Landeta, B.; Arana-Landin, G.; De Arbulo, P.R.; Diaz De Basurto, P. A Case Study of the Adoption ofthe ISO 14006 in the Capital Equipment Sector. In Proceedings of the WOBI 2015—2015 InternationalWork Conference on Bio-Inspired Intelligence: Intelligent Systems for Biodiversity Conservation,Donostia-San Sebastián, Spain, 9–12 June 2015; pp. 39–42.
15. Brones, F.; De Carvalho, M.M.; De Senzi Zancul, E. Ecodesign in Project Management: A Missing Link forthe Integration of Sustainability in Product Development? J. Clean. Prod. 2014, 80, 106–118. [CrossRef]
16. Zhang, Y.; Wang, H.-P.; Zhang, C. Green QFD-II: A Life Cycle Approach for Environmentally ConsciousManufacturing by Integrating LCA and LCC into QFD Matrices. Int. J. Prod. Res. 1999, 37, 1075–1091.[CrossRef]
17. Senthil, K.D.; Ong, S.K.; Nee, A.Y.C.; Tan, R.B.H. A Proposed Tool to Integrate Environmental and EconomicalAssessments of Products. Environ. Impact Assess. Rev. 2003, 23, 51–72. [CrossRef]
18. Adhitya, A.; Halim, I.; Srinivasan, R. Decision Support for Green Supply Chain Operations by IntegratingDynamic Simulation and LCA Indicators: Diaper Case Study. Environ. Sci. Technol. 2011, 45, 10178–10185.[CrossRef] [PubMed]
19. Prendeville, S.; Niemczyk, M.; Sanders, C.; Lafond, E.; Elgorriaga, A.; Mayer, S.; Kane, D. Envisioning Ecodesign:Definitions, Case Studies and Best Practice; European Network of Ecodesign Centres (ENEC): Cardiff, UK, 2014.
20. International Organization for Standarization. ISO 14040:2006 Environmental Management-Life Cycle Assessment-Principles and Framework; International Organization for Standarization: Geneva, Switzerland, 2006.
21. International Organization for Standarization. ISO 14044:2006 Environmental Management, Life Cycle Assessment,Requirements and Guidelines; International Organization for Standarization: Geneva, Switzerland, 2006.
22. Bevilacqua, M.; Ciarapica, F.E.; Giacchetta, G. Integration of Design for Environmental Concepts in ProductLife Cycle. In Design for Environment as a Tool for the Development of a Sustainable Supply Chain; Bevilacqua, M.,Ciarapica, F.E., Giacchetta, G., Eds.; Springer: London, UK, 2012.
23. Kobayashi, H. Strategic Evolution of Eco-Products: A Product Life Cycle Planning Methodology. Res. Eng. Des.2005, 16, 1–16. [CrossRef]
24. Bovea, M.D.; Wang, B. Identifying Environmental Improvement Options by Combining Life CycleAssessment and Fuzzy Set Theory. Int. J. Prod. Res. 2003, 41, 593–609. [CrossRef]
25. Lewandowska, A.; Kurczewski, P. ISO 14062 in Theory and Practice-Ecodesign Procedure. Part 1: Structureand Theory. Int. J. Life Cycle Assess 2010, 15, 769–776. [CrossRef]
26. González-García, S.; Salinas-Mafias, L.; Garria-Lozano, R.; Gabarrell, X.; Rieradevall, J.; Feijoo, G.;Moreira, M.T. Application of Ecodesign Methodology in SMEs Run According to Lean Management:The Case of a Furniture Publishing Company. Environ. Eng. Manag. J. 2014, 13, 2977–2988.
27. Hunkeler, D.; Vanakari, E. Ecodesign and LCA: Survey of Current Uses of Environmental Attributes inProduct and Process Development. Int. J. Life Cycle Assess. 2000, 5, 145–151. [CrossRef]
28. European Committee for Standardization. Standard CR 12340:1996 “Packaging. Recommendations forConducting Life-Cycle Inventory Analysis of Packaging Systems”; European Committee for Standardization:Geneva, Switzerland, 1996.
29. Navajas, A.; Bernarte, A.; Arzamendi, G.; Gandía, L.M. Ecodesign of PVC Packing Tape using LifeCycle Assessment. Int. J. Life Cycle Assess. 2014, 19, 218–230. [CrossRef]
30. PE International. Process Data Set: Container Glass; Technology Mix; Production Mix, at Plant. 2013.Available online: http://gabi-documentation-2016.gabi-software.com/xml-data/processes/d7bbec20-f8d8-4a8a-9a99-c7cdafaaa77d.xml (accessed on 12 February 2016).
31. PE International. Process Data Set: Corrugated Board Boxes; Technology Mix; Production Mix, at Plant. 2013.Available online: http://gabi-dataset-documentation.gabi-software.com/xml_data/processes/3fc467e6-280d-4de0-a426-a036b6a30c99_01.00.000.xml (accessed on 12 February 2016).
Sustainability 2017, 9, 1724 15 of 16
32. European Federation of Corrugated Board Manufacturers (FEFCO). European Database for Corrugated BoardLife Cycle Studies 2012; FEFCO: Brussels, Belgium, 2012.
33. ECOEMBES. Reciclaje Envases España. 2014. Available online: https://www.ecoembes.com/es/ciudadanos/envases-y-proceso-reciclaje/reciclaje-en-datos (accessed on 12 February 2016).
34. The European Container Glass Federation. 2013. Available online: http://www.feve.org/index.php?option=com_content&view=article&id=10&Itemid=11 (accessed on 12 February 2016).
35. Asociación Nacional del Envase de PET. PET Y Medio Ambiente. 2014. Available online: http://anep-pet.com/index.php/conociendo-el-pet/pet-y-medio-ambiente (accessed on 12 February 2016).
36. Perugini, F.; Mastellone, M.L.; Arena, U. A Life Cycle Assessment of Mechanical and Feedstock RecyclingOptions for Management of Plastic Packaging Wastes. Environ. Prog. 2005, 24, 137–154. [CrossRef]
37. Arena, U.; Mastellone, M.L.; Perugini, F. Life Cycle Assessment of a Plastic Packaging Recycling System.Int. J. Life Cycle Assess. 2003, 8, 92–98. [CrossRef]
38. Guinée, J. Handbook on Life Cycle Assessment; Kluwer: Alphen aan den Rijn, The Netherlands, 2002.39. Wimmer, W.; Züst, R.; Lee, K.M. Ecodesign Implementation; Springer: Berlin, Germany, 2004.40. Finkbeiner, M. Gap Analysis for the Life Cycle Assessment of Container Packaging; Fédération Européenne du
Verre d’Emballage (FEVE): Brussels, Belgium, 2012.41. Flanigan, L.; Frischknecht, R.; Montalbo, T. An Analysis of Life Cycle Assessment in Packaging for Food
& Beverage Applications; UNEP/SETAC Life Cycle Initiative: Paris, France, 2013.42. Dreyer, L.C.; Niemann, A.L.; Hauschild, M.Z. Comparison of Three Different LCIA Methods: EDIP97,
CML2001 and Eco-Indicator 99: Does it Matter which One You Choose? Int. J. Life Cycle Assess. 2003, 8,191–200. [CrossRef]
43. Owsianiak, M.; Laurent, A.; Bjørn, A.; Hauschild, M.Z. IMPACT 2002+, ReCiPe 2008 and ILCD’s RecommendedPractice for Characterization Modelling in Life Cycle Impact Assessment: A Case Study-Based Comparison.Int. J. Life Cycle Assess. 2014, 19, 1007–1021. [CrossRef]
44. Ferreira, C.; Freire, F.; Ribeiro, J. Life-Cycle Assessment of a Civil Explosive. J. Clean. Prod. 2015, 89, 159–164.[CrossRef]
45. Laurent, A.; Clavreul, J.; Bernstad, A.; Bakas, I.; Niero, M.; Gentil, E.; Christensen, T.H.; Hauschild, M.Z. Reviewof LCA Studies of Solid Waste Management Systems—Part II: Methodological Guidance for a Better Practice.Waste Manag. 2014, 34, 589–606. [CrossRef] [PubMed]
46. European Commission-Joint Research Centre (EC-JRC). Characterization Factors of the ILCD Recommended LifeCycle Impact Assessment Methods; EC-JRC: Brussels, Belgium, 2012.
47. European Commission-Joint Research Centre (EC-JRC). Normalisation Method and Data for Environmental Footprints;EC-JRC: Brussels, Belgium, 2014.
48. Hauschild, M.Z.; Goedkoop, M.; Guinée, J.; Heijungs, R.; Huijbregts, M.; Jolliet, O.; Margni, M.; De Schryver, A.;Humbert, S.; Laurent, A.; et al. Identifying Best Existing Practice for Characterization Modeling in Life CycleImpact Assessment. Int. J. Life Cycle Assess. 2013, 18, 683–697. [CrossRef]
49. European Commission-Joint Research Centre (EC-JRC). Recommendations Based on Existing Environmental ImpactAssessment Models and Factors for Life Cycle Assessment in European Context; EC-JRC: Brussels, Belgium, 2012.
50. Agency for Toxic Substances and Disease Registry (ATSDR). Toxicological Profile for Fluorides, HydrogenFluoride and Fluorine. ATSDR, Public Health Service, US Department of Health and Human Services; Agency forToxic Substances and Disease Registry (ATSDR): Atlanta, GA, USA, 2005.
51. Suthar, S.; Sajwan, P.; Kumar, K. Vermiremediation of Heavy Metals in Wastewater Sludge from Paper andPulp Industry using Earthworm Eisenia Fetida. Ecotoxicol. Environ. Saf. 2014, 109, 177–184. [CrossRef][PubMed]
52. Van Hoof, G.; Vieira, M.; Gausman, M.; Weisbrod, A. Indicator Selection in Life Cycle Assessment to EnableDecision Making: Issues and Solutions. Int. J. Life Cycle Assess. 2013, 18, 1568–1580. [CrossRef]
53. Slapnik, M.; Istenic, D.; Pintar, M.; Udovc, A. Extending Life Cycle Assessment Normalization Factors anduse of Machine Learning—A Slovenian Case Study. Ecol. Ind. 2015, 50, 161–172. [CrossRef]
54. Seppälä, J.; Posch, M.; Johansson, M.; Hettelingh, J.-P. Country-Dependent Characterisation Factorsfor Acidification and Terrestrial Eutrophication Based on Accumulated Exceedance as an ImpactCategory Indicator. Int. J. Life Cycle Assess. 2006, 11, 403–416. [CrossRef]
Sustainability 2017, 9, 1724 16 of 16
55. Myllyviita, T.; Leskinen, P.; Seppälä, J. Impact of Normalisation, Elicitation Technique and BackgroundInformation on Panel Weighting Results in Life Cycle Assessment. Int. J. Life Cycle Assess. 2014, 19, 377–386.[CrossRef]
56. Klöpffer, W.; Grahl, B. Life Cycle Assessment. A Guide to Best Practice; Wiley: Hoboken, NJ, USA, 2014.57. SIGRE. Iniciativas del Sector Farmaceutico en la Prevencios de Residuos de Envases; SIGRE: Madrid, Spain, 2013.58. United Nations Environment Programme. Design for Sustainability. A Step-by-Step Approach; United Nations
Environment Prgramme: Nairobi, Kenya, 2009.59. Tomás, R.A.F.; Bordado, J.C.M.; Gomes, J.F.P. P-Xylene Oxidation to Terephthalic Acid: A Literature Review
Oriented Toward Process Optimization and Development. Chem. Rev. 2013, 113, 7421–7469.60. Poly-Ethyleneterephthalate (PET). Bottle Grade. 2008. Available online: http://www.plasticseurope.org/
Documents/Document/20100312112214-FINAL_EPD_PET_BottleGrade_270409-20081215-016-EN-v1.pdf(accessed on 12 February 2016).
61. Linic, S.; Christopher, P.; Ingram, D.B. Plasmonic-Metal Nanostructures for Efficient Conversion of Solar toChemical Energy. Nat. Mater. 2011, 10, 911–921. [CrossRef] [PubMed]
62. Westerhoff, P.; Prapaipong, P.; Shock, E.; Hillaireau, A. Antimony Leaching from Polyethylene Terephthalate(PET) Plastic used for Bottled Drinking Water. Water Res. 2008, 42, 551–556. [CrossRef] [PubMed]
© 2017 by the authors. Licensee MDPI, Basel, Switzerland. This article is an open accessarticle distributed under the terms and conditions of the Creative Commons Attribution(CC BY) license (http://creativecommons.org/licenses/by/4.0/).