Embed Size (px)
Citation preview

SynerScope B.V., 15 January 2015 Application of Data Visualization Page 1
Application of Data Visualization Lunteren Conference
Landelijk Netwerk Mathematische Besliskunde (LNMB)
January 15 2015, Lunteren
dr.ir. Danny Holten
Lead Visualization Scientist & Co-Founder
+31 (0)6 5202 1711
SynerScope B.V.

SynerScope B.V., 15 January 2015 Application of Data Visualization Page 2
Overview • Background SynerScope & Danny
• “Big Data”
• Making sense of Big Data
– Analytics & visualization visual analytics
• Offering a solution – Technology, users, domains
• Demo, questions, ...
SynerScope B.V., 15 January 2015 Application of Data Visualization Page 3
Danny • MSc, PhD Comp. Sci., Eindhoven University of Technology (TU/e)
– “Visualization of Graphs and Trees for Program Understanding”
– Help SW engineers understand source code using interactive and insightful visual overviews of the SW architecture
• Information Visualization (InfoVis) – “The study of interactive visual representations
of abstract data to reinforce human cognition”
• Now – Lead Visualization Scientist & co-founder at SynerScope B.V.
SynerScope B.V., 15 January 2015 Application of Data Visualization Page 4
SynerScope B.V., 15 January 2015 Application of Data Visualization Page 5
SynerScope B.V. • Came in contact with Jan-Kees Buenen (CEO) in 2008
– 1959, MBA Chicago Booth University
• Can we apply this to industrial/commercial data? – “Big Data visual analytics software that allows domain
experts and analysts to make sense of their data”
– Initially for source code, now for generic Big Data
• Spin-off of InfoVis PhD research at TU/e – Founded in 2011, 16 people, TU/e campus Helvoirt

SynerScope B.V., 15 January 2015 Application of Data Visualization Page 6
“As a telescope or microscope extend human vision...
...SynerScope extends human analytic capability.”

SynerScope B.V., 15 January 2015 Application of Data Visualization Page 7
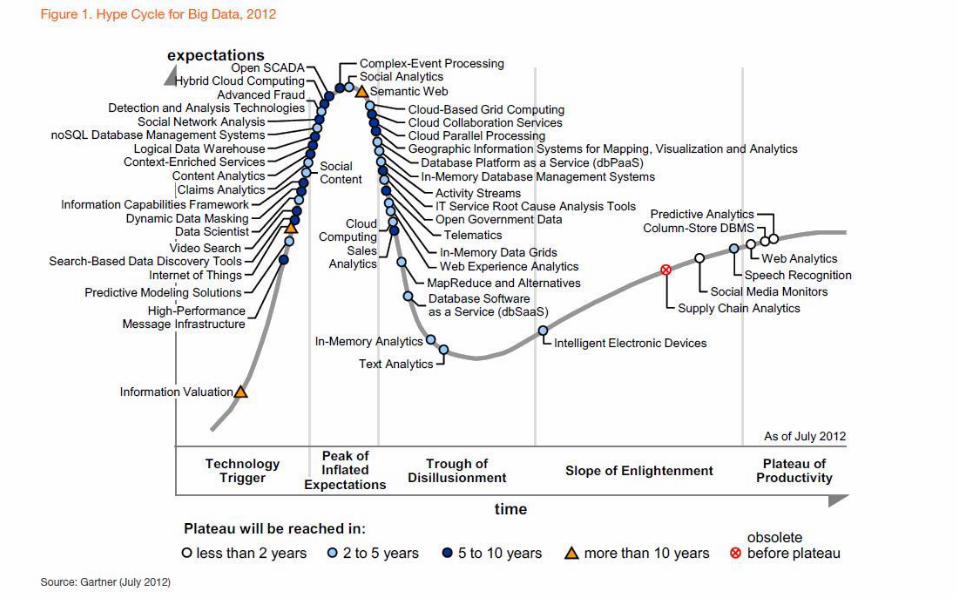
Big Data (BD) “All-encompassing term for data so large and complex that it
becomes difficult to process using traditional processing applications.
Challenges include analysis, capture, curation, search, sharing,
storage, transfer, visualization, and privacy violations”

SynerScope B.V., 15 January 2015 Application of Data Visualization Page 8
Big Data (BD) • “The Four V’s”
– Volume, Variety, Velocity, Variability
– Storage, Multivariate, Streaming, Inconsistent (structure)
• Get value / make sense / get “insight”! – Value from large (often already available) data from various sources
by combining them and ontaining new, actionable insights
• As an industry “Software AG, Oracle, IBM, FICO, Microsoft, SAP, EMC, HP, and Dell spent >$15B on firms specializing in data management and analytics. In 2010, the BD industry was worth >$100B and growing at 10% / year; twice as fast as the software business as a whole” – [The Economist]

SynerScope B.V., 15 January 2015 Application of Data Visualization Page 10
Analytics • Statistical / mathematical techniques
– Simple summary statistics, regression, model fitting, PCA/MDS, ...
• Machine learning / AI – Clustering, classification, prediction, ...
– Decision trees/forests, Bayesian networks, neural networks, SVMs, ...
• Rule-based engines – Flagging, pre-filtering, aggregation, sampling, ...
• Available as libraries / code for “easy” use
• So... Problem(s) solved?

SynerScope B.V., 15 January 2015 Application of Data Visualization Page 11
Analytics • Not a complete solution
– Data scientist (“data janitor”) needed
– Users are domain experts, (business) analysts
– Domain knowledge hard to capture keep “human in the loop”!
– What to look/code for? “get insights/overview”
• Enter Visualization... – Analyze interactively and explore Active Discovery (AD), not just presentation!
– Visual system evolved to detect anomalies/trends excels at fuzzy pattern recognition in noisy data

SynerScope B.V., 15 January 2015 Application of Data Visualization Page 12
Visualization (cont.) • Fast interactive AD / ideation cycle
– hypothesize, test, repeat (offload IT)
• “Confirm the expected, detect the unexpected” – Discover new rules, automate
• “Overview first, zoom and filter, then details-on-demand” – Use Gestalt principles and pre-attentive processing
• Complementary to data mining & machine learning – Combine both into visual analytics

SynerScope B.V., 15 January 2015 Application of Data Visualization Page 13
InfoVis != dashboards, infographics
• Aggregated KPIs (monitoring)
• Limited drill-down, interaction
• Discrete and chunked who, what, when, why, how?
• One-off, manual
• Non-interactive, no analysis
• Storytelling

SynerScope B.V., 15 January 2015 Application of Data Visualization Page 14

SynerScope B.V., 15 January 2015 Application of Data Visualization Page 15

SynerScope B.V., 15 January 2015 Application of Data Visualization Page 16

SynerScope B.V., 15 January 2015 Application of Data Visualization Page 17
SynerScope B.V., 15 January 2015 Application of Data Visualization Page 18
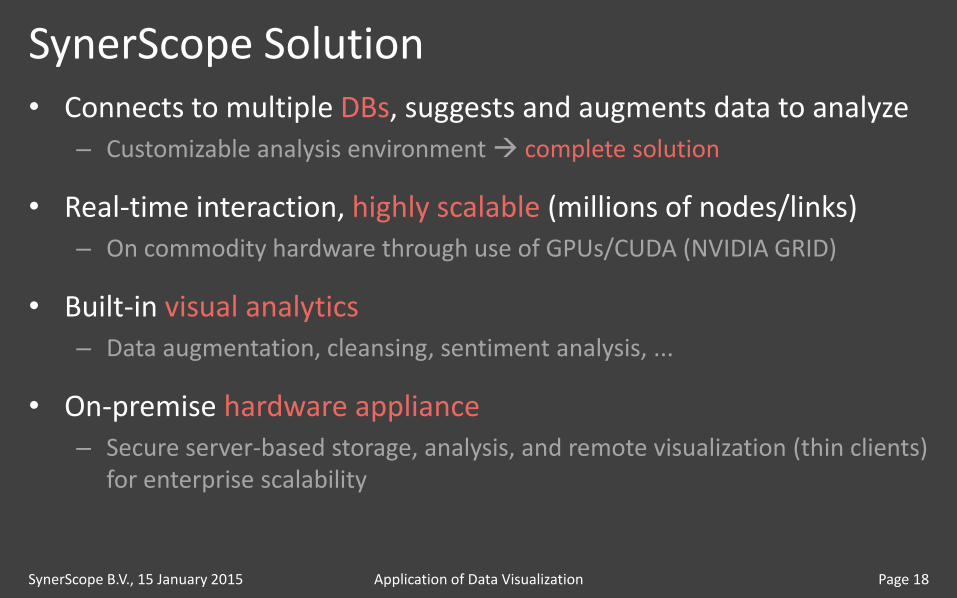
SynerScope Solution • Connects to multiple DBs, suggests and augments data to analyze
– Customizable analysis environment complete solution
• Real-time interaction, highly scalable (millions of nodes/links) – On commodity hardware through use of GPUs/CUDA (NVIDIA GRID)
• Built-in visual analytics – Data augmentation, cleansing, sentiment analysis, ...
• On-premise hardware appliance – Secure server-based storage, analysis, and remote visualization (thin clients)
for enterprise scalability
SynerScope B.V., 15 January 2015 Application of Data Visualization Page 19
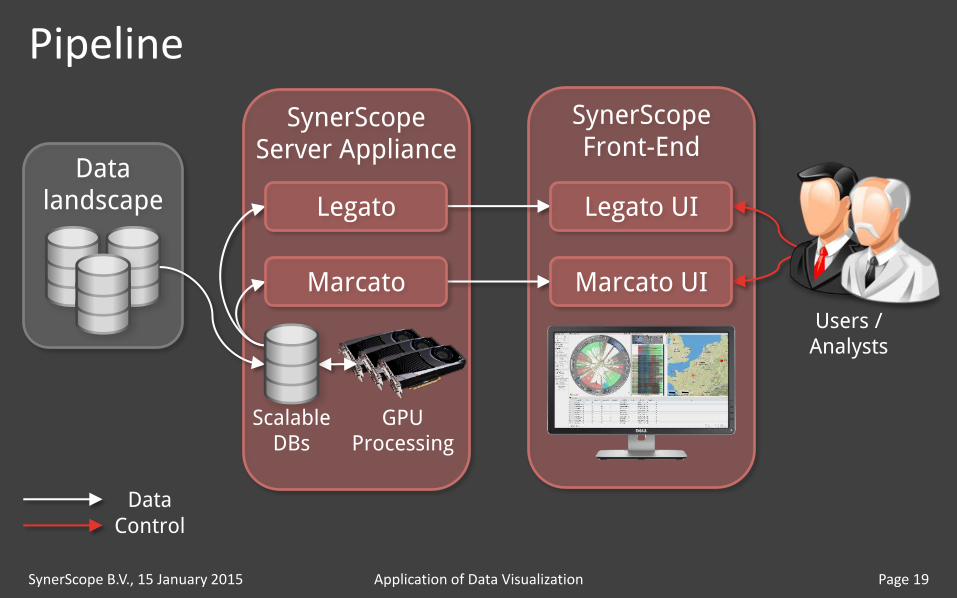
Pipeline
Data Control
SynerScope Server Appliance
SynerScope Front-End
Data landscape
Scalable DBs
GPU Processing
Users / Analysts
Marcato
Legato
Marcato UI
Legato UI
SynerScope B.V., 15 January 2015 Application of Data Visualization Page 20
Legato and Marcato
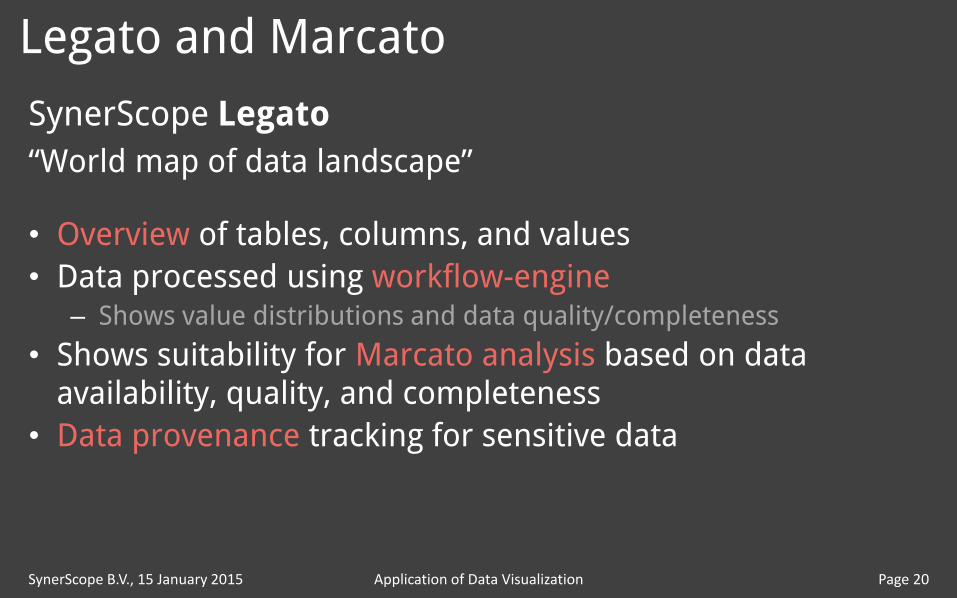
SynerScope Legato
“World map of data landscape”
• Overview of tables, columns, and values
• Data processed using workflow-engine – Shows value distributions and data quality/completeness
• Shows suitability for Marcato analysis based on data availability, quality, and completeness
• Data provenance tracking for sensitive data

SynerScope B.V., 15 January 2015 Application of Data Visualization Page 21
Legato and Marcato
SynerScope Marcato
Visual analytics environment
• Domain experts and analysts explore and analyze their data – “Zero programming” if desired
• Multiple Coordinate View (MCV) framework spanning multiple screens
• Extensive collection of predefined visualizations and view-configurable UI
• Add new visualizations using HTML5 (Canvas/SVG/WebGL)
SynerScope B.V., 15 January 2015 Application of Data Visualization Page 22
Insurance Claim Analysis
• Find networks of interconnected people and organizations/companies
• Detect deviating connectivity possible fraud ring(s)
• Explore claim-handling process discover trends, patterns, combinations, anomalies
• Quickly switch task perspectives with minimal IT burden domain expert in control

SynerScope B.V., 15 January 2015 Application of Data Visualization Page 23
But also...
• Financial transactions
• Communication analysis (SNA, e-mail, social media)
• Software dependencies
• Citation analysis
• Case-law networks
• E-commerce data (buy together)
• Drug interactions
• Any kind (?) of multivariate data

SynerScope B.V., 15 January 2015 Application of Data Visualization Page 24
Demo