Embed Size (px)
Citation preview

Title Application of Data-Logging Technology in Secondary SchoolScience Classrooms: A case Study
Author(s) Fielder Kwok, HSY
Citation CITE Research Symposium 2002 (IT in Education : Research intoPractice), Hong Kong, China, 6 July 2002
Issued Date 2002
URL http://hdl.handle.net/10722/44070
Rights This work is licensed under a Creative Commons Attribution-NonCommercial-NoDerivatives 4.0 International License.
Application of Data-Logging Technology in Secondary
School Science Classrooms: A case Study
BYFielder Kwok Suet Yu Heather

Issues to be addressed in this study
1. What teaching strategy can be adopted when data logging is used as a tool to demonstrate experiments?
2. Can the adoption of the teaching strategy and the integration of data logging result in:(a) promoting high order thinking(b) rectifying misconception

Issues to be addressed in this study
3. What are the pattern of interaction between teacher, students and technology?
4. What challenges may emerge upon the implementation of data logging in science teaching and learning?
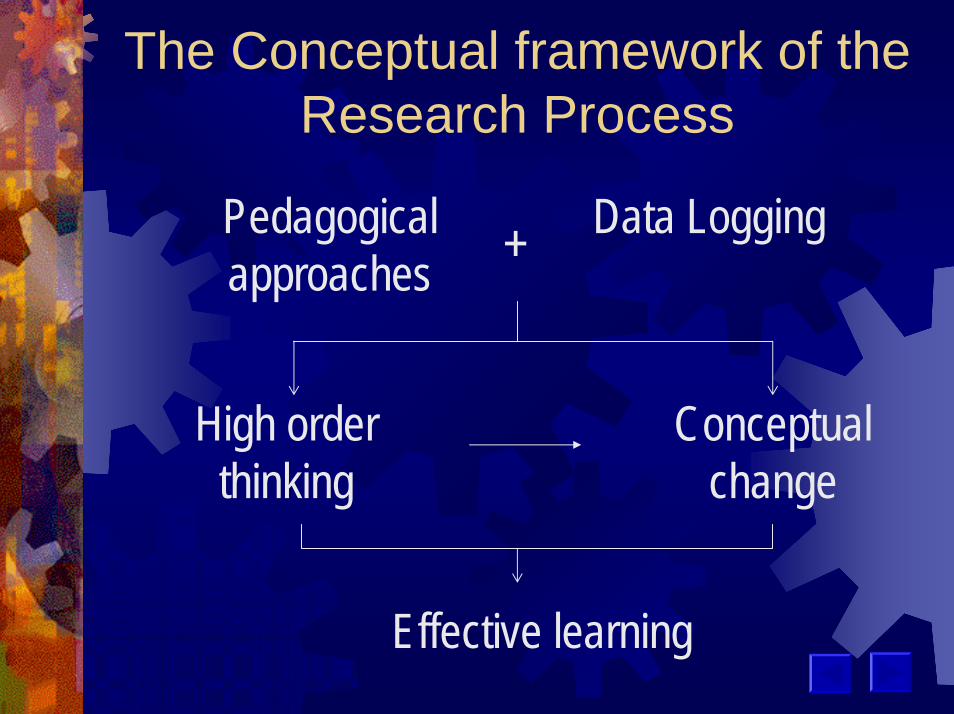
The Conceptual framework of the Research Process
Pedagogical approaches + Data Logging
High order thinking
Conceptual change
Effective learning
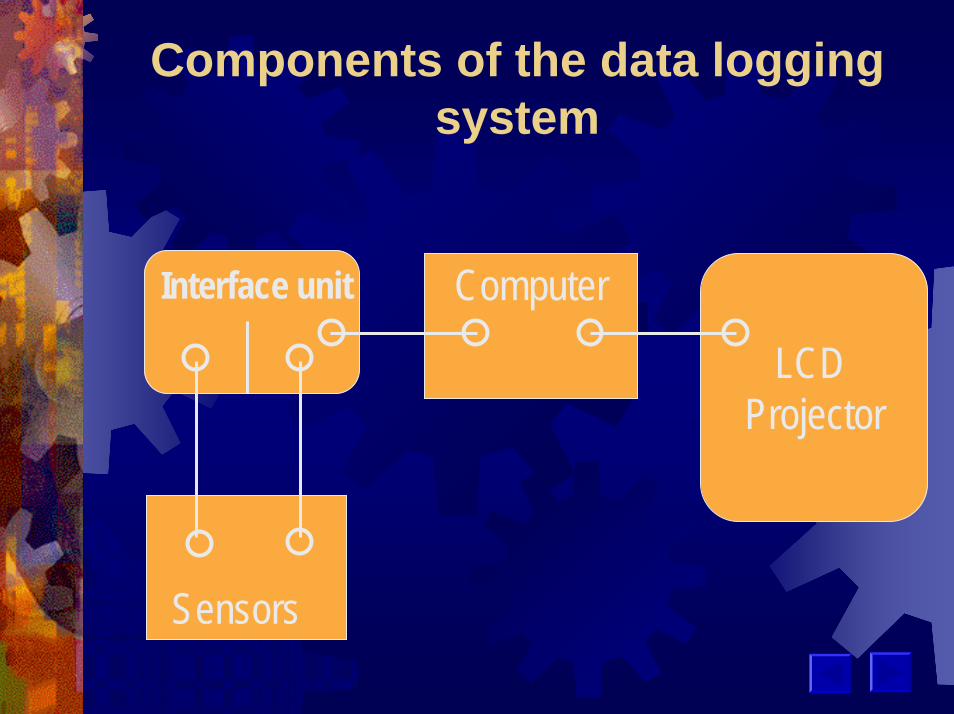
Components of the data logging system
Interface unit
Sensors
Computer
LCD Projector

Data collection
By video recording the science lessons conducted in the
laboratory

Topic selectionYear Class Topic Objectives
S1 1C Evaporation To show the relationship between evaporation and cooling.To find out the factors which affect the rate of evaporation. (Frost, 1998 P.94-97)
S2 2C2B
Acids and alkalis
To find out that the amount of acid required to neutralize an alkali depends on the amount of the alkali dissolved, and not the volume of water added. (Frost, 1998 p.89)
S3 3D Digestion To find out how temperature and amount affect the activity of enzyme (amylase). (Frost, 1998 P.117)

Data AnalysisFrom the perspective of pedagogical
approach, the analysis involves the following aspects:
1. Identifying the activities performed by teacher and students
2. Defining the objectives of the activities3. Evaluating the effects as a result of
the activities.

Pathways of interaction
Physical apparatus
Data logger
Computer representation
AB
CDStudents
1
2 1 2 Teacher

Effect of evaporation on temperature
Temperature vs Time (Evaporation)
0
10
20
30
40
0 100 200 300
Time (s)
Tem
pera
ture
(C)

Effect of wind on the rate of evaporation
Temperature vs Time (w ind)
0
10
20
30
0 200 400 600
Time (s)
Tem
pera
ture
(C)
Temperature,ChA, Run #1
Temperature,ChB, Run #1

Effect of area exposure on the rate of evaporation
Temperature vs Time (Exposure)
05
1015202530
0 200 400 600
Time (s)
Tem
pera
ture
(C)
Temperature,ChA, Run #3
Temperature,ChB, Run #3

Titration curve
pH vs volume of acid (2B)
0
2
4
68
10
12
14
0 5 10 15 20 25 30
volume of acid (cm3)
pH
pH, ChA vs Volume, Run #3pH, ChA (pH)
pH, ChA vs Volume, Run #4
pH, ChA vs Volume, Run #1
pH, ChA vs Volume, Run #2

Effect of temperature on the activity of enzyme
Absorbance vs Time (s)
0
0.5
1
1.5
0 200 400
Time (s)
Abs
orba
nce Absorbance,
ChB, Run #4
Absorbance(no units)

Effect of concentration of amylase on its action
Absorbance vs Time (Concentration)
0
0.5
1
1.5
0 100 200 300 400
Time (S)
Abs
orba
nce

Findings1. Using data logging as the tool to
demonstrate experiment, inductive/discovery pedagogical approach is adopted by teacher who has posed structured questions to help students analyze data and formulate concepts.
2. Students are stimulated and engaged in high order thinking that subsequently leads to conceptual change.
3. The computer representations can enter the interaction network via multiple ways due to the disparity in the employment of the representations by teacher and students as their roles are different in the discourse.

Conclusion1. The instantaneously data presented
on the screen has provided a shared focus on which discussion can take place.
2. In order to guide students through the process of formulating conceptions, inductive /discovery pedagogical approach is adopted.

Conclusion3. Students are guided into a framework of
analysis which involves high order thinking that is characterized as depicting uncertainty, effortful thinking, making judgments , interpretation and decision.
4. The representations generated by the data logging play the role to enhance the collaborative interactions between teacher and students as well as between student and student.

Challenges1. Overcoming obstacles to
implementation2. Implementation of innovation3. Planning activities using data logging4. Defining learning objectives5. Adopting appropriate pedagogical
paradigm.