Embed Size (px)
Citation preview
Instructions for use
Title Application of contrast-enhanced ultrasonography of the hepatic vein for the differentiation of canine diffuse liverdisease
Author(s) 森下, 啓太郎
Citation 北海道大学. 博士(獣医学) 乙第7026号
Issue Date 2017-06-30
DOI 10.14943/doctoral.r7026
Doc URL http://hdl.handle.net/2115/66528
Type theses (doctoral)
File Information Keitaro_Morishita.pdf
Hokkaido University Collection of Scholarly and Academic Papers : HUSCAP
Application of contrast-enhanced
ultrasonography of the hepatic vein for the
differentiation of canine diffuse liver disease
犬のびまん性肝疾患の鑑別における
肝静脈造影超音波検査の応用
Keitaro Morishita

GENERAL ABBREVIATIONS
ALP
ALT
AST
AUROC
CBC
CEUS
CT
cPSS
CV
CVC
GGT
HV
HVAT
IV
MAPSS
Alkaline phosphatase
Alanine aminotransferase
Aspartate aminotransferase
Area under the receiver operating characteristic curve
Complete blood count
Contrast-enhanced ultrasonography
Computed tomography
Congenital portosystemic shunt
Coefficient of variation
Caudal vena cava
-glutamyltranspeptidase
Hepatic vein
Hepatic vein arrival time
Intravenous
Multiple acquired portosystemic shunts

PHPV
PI
PV
PVP
ROC
ROI
TBA
TIC
TTP
TTPP
WR
Primary hypoplasia of the portal vein
Peak intensity
Portal vein
Portal vein pressure
Receiver operating characteristic
Region of interest
Total bile acid
Time-intensity curve
Time to peak
Time to peak phase
Washout ratio

i
TABLE OF CONTENTS
GENERAL INTRODUCTION…………………………………………………………………1
CHAPTER 1
CONTRAST-ENHANCED ULTRASONOGRAPHY OF THE HEPATIC VEIN IN
NORMAL DOGS………………………………………………………………………...………5
1. INTRODUCTION…………………………………………………………………….………..6
2. MATERIALS AND METHODS……………………………………………………………….7
2.1 Animals…………………………………………………………………………….……….7
2.2 CEUS………………………………………………………………………………………..7
2.3 Quantitative analysis………………………………………………………………………..8
2.4 Statistical analysis…………………………………………………………………………..9
3. RESULTS……………………………………………………………………………………..10
3.1 CEUS findings………………………………………………...…………………………..10
3.2 Statistical analysis…………………………………………………………………………10
4. DISCUSSION…………………………………………………………………………………15

ii
5. SUMMARY…………………………………………………………………………………...19
CHAPTER 2
ASSESSMENT OF CONTRAST-ENHANCED ULTRASONOGRAPHY OF THE
HEPATIC VEIN FOR DETECTION OF HEMODYNAMIC CHANGES ASSOCIATED
WITH EXPERIMENTALLY INDUCED PORTAL HYPETENSION IN DOGS…………20
1. INTRODUCTION…………………………………………………………………….………21
2. MATERIALS AND METHODS……………………………………………………………...22
2.1 Animals………………………………………………………...……………………….…22
2.2 Establishment of portal hypertension………………….…………………………………..22
2.3 CEUS……………………………………………………………….……………………..24
2.4 Quantitative analysis…………………………………………….….……………………..25
2.5 Statistical analysis……………………………………………………..…………………..25
3. RESULTS……………………………………………………………………………………..26
3.1 Establishment of portal hypertension……………………………………….……………..26
3.2 CEUS findings………………………………………………….…………………………27
3.3 Correlation between PVP and CEUS parameters…………………………………………27
4. DISCUSSION…………………………………………………………………………………35

iii
5. SUMMARY…………………………………………………………………………………...39
CHAPTER 3
WASHOUT RATIO IN THE HEPATIC VEIN MEASURED BY CONTRAST-
ENHANCED ULTRASONOGRAPHY TO DISTINGUISH BETWEEN
INFLAMMATORY AND NONINFLAMMATORY HEPATIC DISORDERS IN
DOGS……………………………………………………………………………………………40
1. INTRODUCTION…………………………………………………………………….………41
2. MATERIALS AND METHODS……………………………………………………………...42
2.1 Animals……………………………………………………………………………………42
2.2 CEUS…………………………………………………………………….………………..43
2.3 Quantitative analysis…………………………………………..…………………………..43
2.4 Statistical analysis…………………………………………………..……………………..44
3. RESULTS……………………………………………………………………………………..45
3.1 Study dogs……………………………………………………………………….………..45
3.2 Differences in clinical parameters among groups…………………………………………45
3.3 Differences in CEUS parameters among groups……………………………..……………47
3.4 ROC analysis………………………………………………………………………………47

iv
4. DISCUSSION…………………………………………………………………………………54
5. SUMMARY…………………………………………………………………………………...59
GENERAL CONCLUSION…………………………………………..…………………..……60
JAPANESE SUMMARY …………………………………………...………………………….63
REFFERENCES………………………………………………………………………..………67
ACKNOWLEDGEMENTS……………………………………………….………..…………75

1
GENERAL INTRODUCTION
In dogs, chronic liver disease is more common than acute disease, and chronic parenchymal
disease such as chronic hepatitis is much more common than in cats; it almost invariably leads to
progressive fibrosis and cirrhosis.1 The cause of chronic hepatitis in dogs is usually unknown,
with a few notable exceptions, and treatment focuses on attempting to slow progression of the
disease.1 Dogs with chronic hepatitis usually have no clinical signs until late in the disease
process, when more than 75% of liver function has been lost.1 By this stage, there is already
extensive destruction of liver mass and treatment will be less effective than it would have been
earlier in the disease. Therefore, early detection of canine chronic hepatitis is essential to
improve the long-term prognosis.
Most dogs with chronic hepatitis show consistently high blood hepatic enzyme levels, but this
can also be found in other primary and secondary hepatopathies. For example, 79.3% of dogs
with pancreatitis show elevated liver enzyme levels.2 Since the liver disease cannot be fully
assessed from blood tests alone, diagnostic imaging, especially ultrasonography, plays a major
role in the differential diagnosis.
Conventional B-mode ultrasonography is useful for assessing the hepatic architecture and
detecting focal hepatic abnormalities, such as hepatic tumors. Moreover, contrast-enhanced
ultrasonography (CEUS) can visualize the microcirculation of tissue but not conventional color
Doppler imaging. Sonazoid®, a second-generation contrast agent that consists of perflubutane
microbubbles encapsulated by a lipid shell, is highly stable in vivo.3 In addition to the facilitation
of vascular imaging, this agent is phagocytized by Kupffer cells,4,5
allowing for long-lasting

2
parenchymal contrast enhancement of the liver.6 Parenchymal imaging has facilitated detection
of certain liver tumors as hypoechoic defects because hepatic malignancies generally do not
involve Kupffer cells,7 and CEUS using Sonazoid
® has been applied in dogs for the
differentiation of hepatic malignant tumors and benign nodules.8,9
Together with the applications
of CEUS in the diagnosis of focal liver lesions, diagnostic accuracy has been greatly developed
in recent years. However, ultrasonography is less valuable for recognizing and differentiating
diffuse liver disease.10
Therefore, a liver biopsy is almost always required for an accurate
diagnosis and to evaluate the severity of hepatic fibrosis.
In human medicine, assessing the severity of hepatic fibrosis provides important information
that predicts patient prognosis and supports clinical management.11,12 Although a liver biopsy
remains the gold standard for evaluating the grade of hepatic fibrosis,13
its application is
sometimes controversial because of the invasiveness in patients with impaired coagulation and
the possibility of sampling error in a liver with heterogeneously distributed fibrosis.14,15
The long
term clinical course of the patient may require a repeatedly available noninvasive method that
can be used in clinical practice.
One of potential candidates is ultrasonic elasticity imaging, which measures the propagation
velocity of shear waves.16
Since the velocity of tissue correlates with its elasticity, hepatic
stiffness measurements have been widely investigated in human medicine. The other method is
CEUS. It has been reported that microbubbles injected peripherally arrived in the hepatic vein
(HV) much earlier in cirrhotic patients,17
and this transit time negatively correlated with the
severity of liver fibrosis and the degree of portal hypertension.18–20
The liver receives a dual
blood supply; approximately 70–80% from the portal vein (PV) and 20–30% from the hepatic
artery.21
Hepatic histological changes such as fibrosis and cirrhosis, or increased portal pressure,

3
decrease the portal blood supply. Because this reduction in the total hepatic blood supply is
compensated with increased arterial blood flow,21–24
these hemodynamic changes contribute to
the early hepatic vein arrival time (HVAT). Some studies have measured additional parameters
to improve the diagnostic accuracy, including the transit time between the hepatic artery and vein
and the slope gradient of each hepatic artery, PV, and HV.17,25,26
In veterinary medicine, CEUS is used mainly to characterize the vascularity of focal liver
lesions,9,10
but CEUS also has been used on other organs such as the spleen,27
pancreas,28
and
kidneys.29
However, with regard to the assessment of hemodynamic changes associated with
chronic hepatitis, the author is aware of only 2 reports in which CEUS using SonoVue®
(the
most widely used second-generation contrast agent in the world) was performed to evaluate the
intensity of the hepatic parenchyma30
and HV31
in dogs with experimentally induced liver
fibrosis. The assessment of canine hepatic perfusion using Sonazoid® has never been reported in
dogs. Therefore, fundamental data are lacking before CEUS can be used clinically.
With the above background, this study was performed in 3 stages to determine the feasibility
of CEUS in the diagnosis of chronic hepatitis in dogs. In the first stage, we have characterized
image enhancement of the normal canine HV using Sonazoid® and established quantitative
parameters from a time-intensity curve (TIC) both in conscious and sedated dogs. The results
from this stage established the reference for evaluating intrahepatic hemodynamic changes
associated with canine chronic hepatic disease. In the second stage, we have investigated the
feasibility for the use of CEUS to detect hemodynamic changes associated with portal
hypertension in dogs with experimentally induced portal hypertension and to evaluate the
correlation between CEUS parameters derived for the HV and portal pressure. The results from
this stage revealed the change in CEUS parameters associated with the portal hypertension. In

4
the third stage, we have performed CEUS in dogs with various hepatic disorders, and
investigated whether CEUS is a useful diagnostic aid to detect chronic hepatitis and cirrhosis in
clinical settings.

5
CHAPTER 1
CONTRAST-ENHANCED ULTRASONOGRAPHY OF THE
HEPATIC VEIN IN NORMAL DOGS

6
1. INTRODUCTION
CEUS using microbubbles as a contrast agent, which enables real-time noninvasive
assessment of intrahepatic perfusion. Albrecht et al. first reported that microbubbles injected
peripherally arrived at the HV much earlier in cirrhotic patients than in normal volunteers.17
Sugimoto et al. reported that the earlier arrival time in patients with cirrhosis was due to
intrahepatic hemodynamic changes, such as arterialization of the liver and the development of
intrahepatic shunts. The arrival time of the microbubbles to the PV and hepatic artery was not
significantly different among control subjects, non-cirrhotic patients and cirrhotic patients.25
Thus far, several studies have suggested that the severity of hepatic fibrosis in patients with
chronic liver disease is strongly correlated with early HVAT assessed by CEUS.18,19
In veterinary medicine, CEUS has been used mainly to characterize the vascularity of focal
liver lesions, which can lead to another set of differential diagnoses. Sonazoid®, a second-
generation contrast agent, is suitable for parenchymal imaging, because it is phagocytized by
Kupffer cells.5,6,32
However, the assessment of canine hepatic perfusion using Sonazoid® has
never been reported in dogs.
Thus, the aim of chapter 1 was to characterize image enhancement of the normal canine HV
using Sonazoid® and to establish quantitative parameters from a TIC both in conscious and
sedated dogs. Additionally, the repeatability of this examination was also evaluated.

7
2. MATERIALS AND METHODS
2.1 Animals
Twelve adult beagle dogs, 1–10 years old and weighing 9.5–15.8 kg, were used in this study.
Dogs were divided into a conscious group (n=6) and a sedated group (n=6). All dogs were
healthy based on physical examination and normal Complete blood count (CBC) and serum
biochemistry including alanine aminotransferase (ALT), aspartate aminotransferase (AST),
alkaline phosphatase (ALP), -glutamyltranspeptidase (GGT), ammonia, and fasting and post-
prandial total bile acid (TBA) levels. Prior to the CEUS study, B-mode ultrasonography was
performed on all dogs, and no focal or diffuse hepatic abnormalities were noted. All procedures
were approved by Hokkaido University Animal Care and Use Committee (No. 15-0090).
2.2 CEUS
2.2.1 Settings
An ultrasound scanner (Aplio XG, Toshiba Medical Systems, Tochigi, Japan) with a 5–11
MHz broadband linear probe (PLT-704 AT, Toshiba Medical Systems, Tochigi, Japan) suitable
for pulse subtracting imaging was used for CEUS. Imaging was performed with a low
mechanical index of 0.21 and a frame rate of 23 frames per second. The contrast imaging gain
was set at 80 dB, and the focus was set at a depth of 4 cm.
2.2.2 Scanning

8
Scanning in the conscious group was performed with only manual restraint. Scanning in the
sedated group was performed under anesthesia with intravenous (IV) administration of propofol
(Propofol Mylan, Mylan Inc., Canonsburg, Pa, U.S.A.) at an induction dosage of 6 mg/kg and a
maintenance rate of 0.4–0.6 mg/kg/min.33
The dogs were positioned in left lateral recumbency,
and the right HV was identified using an intercostal approach (Figure 1A). The right HV was
imaged to maintain clear visualization of the confluence with the caudal vena cava as much as
possible. Perfusion of the HV was evaluated after IV bolus injection of microbubble contrast
agent (Sonazoid®, Daiichi Sankyo, Tokyo, Japan). According to our previous report,
34 0.01
ml/kg Sonazoid® was administered through a 21-gauge butterfly catheter attached to a 22-gauge
IV catheter placed in the cephalic vein, flushed by 2 ml of heparinized saline. Immediately after
bolus injection, continuous scanning of the right HV was performed for 2 minutes. The images
were recorded in 40-seconds cine-loops to a hard disk for further off-line analysis. CEUS
examinations were performed three times in each dog by using the same scanning plan, with a
period of more than 48 hours between examinations.
2.3 Quantitative analysis
The quantitative analysis of the CEUS images was performed by using an off-line image
analysis system (ImageJ, US National Institutes of Health, Bethesda, MD, U.S.A.). This system
measures intensity using a gray-scale level ranging from 0 to 255 mean pixel value. One image
per second for the first 60 seconds followed by 1 image at an interval of every 5 seconds until
120 seconds from the start of microbubble contrast agent infusion was analyzed. The region of
interest (ROI) was drawn in the right HV within a 1.5-cm distance from the confluence with the
caudal vena cava as large as possible without including adjacent structures (Figure 1B), and a
TIC was generated for each injection. Four perfusion parameters were measured from each TIC

9
(Figure 2). The HVAT was the time from contrast agent injection to 20% of peak intensity (PI).
Time to peak (TTP) was the time taken from 20% of PI to PI. Time to peak phase (TTPP) was
the time taken from 20% to 90% of PI, which reflects the initial upslope of TIC better than TTP.
Washout ratio (WR) was defined as the attenuation rate from PI to the intensity at the end of a
CEUS study.
2.4 Statistical analysis
All data were expressed as the median and range. Statistical comparisons and calculations of
coefficient of variation (CV) of each parameter were performed using computer software (JMP
Pro, version 11, SAS Institute Inc, Cary, NC, U.S.A.). Normal distribution of the data was
assessed using the Shapiro-Wilk test. When distribution approached normality, measured
parameters from the conscious and sedated groups were compared using Student’s t-test. Non-
normally distributed data were compared using the Wilcoxon rank sum test. Values of P<0.05
were accepted as significant.

10
3. RESULTS
3.1 CEUS findings
The examinations were successfully performed, and the TIC of the HV could be measured
clearly in both groups. No adverse events were noted during or after injection of the microbubble
contrast agent. After contrast agent administration, the microbubbles first reached the hepatic
artery and then the PV. The HV was not enhanced during this period (Figure 1B). The
microbubbles reached the HV after a delay of several seconds. The contrast effect of the HV
developed more gradually than that of the PV; it took over 10 seconds to reach PI. During the PI
phase, the HV was enhanced similar to the liver parenchyma (Figure 1C) and was followed by a
gradual washout of the contrast agent with gradual loss of enhancement (Figure 1D). The
intensity of the contrast agent in the HV dropped to almost 20% of PI at the end of the
examination, while the contrast agent in the PV retained its intensity.
The TICs derived from the median pixel intensity in the HV were similar in the two groups,
but PI was higher in the conscious group (Figure 3A and 3B).
3.2 Statistical analysis
The measured parameters and CVs for each parameter were summarized in Table 1. Not all
parameters were significantly different between the two groups. CVs were <20% (range, 11.8–
14.8%) for all parameters in the sedated group. On the other hand, CVs for HVAT, TTP and
TTPP in the conscious group were >20% (range, 25.3–29.7%) and were higher than sedated
group with the exception of WR (7.6%).

11
Figure 1. Color Doppler and CEUS images of the right hepatic vein (HV) obtained using a right
intercostal approach. (A) The right HV displayed in blue with color Doppler flowed into the
caudal vena cava (CVC). The operator visualized this transverse image before the CEUS study.
(B) The HV (outlined by a dashed line) was not enhanced at 8 seconds, although surrounding
liver parenchyma was slightly enhanced. ROI was manually placed in the HV (circle) to measure
the tissue intensity. (C) HV reached its PI, which was similar in intensity to the liver parenchyma
(shown here 23 seconds after bolus injection of contrast agent). (D) At the end of the
examination (120 seconds), the contrast agent in the HV appeared washedout and hypoechoic
compared to the liver parenchyma.

12
Figure 2. Schematic illustration of the time-intensity curve (TIC) and measured parameters.
Hepatic vein arrival time (HVAT) was the time from contrast agent injection to 20% of peak
intensity (PI, □2 ). Time to peak (TTP) and time to peak phase (TTPP) were defined as the times
to reach PI and 90% PI, respectively. Washout ratio (WR) was defined as (PI - the intensity at
the end of the study;□1 ) / □2 . WR reflects the attenuation rate from the PI to the intensity at the
end of the study on the TIC. MPV, mean pixel value.

13
Figure 3. Time-intensity curve of the pixel intensity in the HV. (A) Conscious group (●, n=6).
(B) Sedated group (□, n=6). Values reported are median and rage. The line graphs in the two
groups were nearly identical, but the peak intensity was higher in the conscious group. MPV,
mean pixel value.

14
Table 1. Median values and CVs of the characteristic parameters of the time-intensity curve in six healthy dogs.
Parameters Conscious group
Sedated group
P -value Median range CV (%) Median range CV (%)
HVAT
(seconds) 13.5 (9–22) 25.3
12 (8–17) 11.8
0.242
TTP
(seconds)
12.5 (6–24) 29.7
12.5 (9–17) 14.8
0.854
TTPP
(seconds)
8 (6–13) 27.1
9 (7–13) 12.4
0.377
WR
(%)
78.0 (60.7–91.7) 7.6 84.1 (63.0–94.4) 12.3 0.689
HVAT, hepatic vein arrival time; TTP, time to peak; TTPP, time to peak phase; WR, washout ratio; CV, coefficient of variation.

15
4. DISCUSSION
In this study, the CEUS findings of the HV in normal dogs were characterized, and the
repeatability of this examination was evaluated. The right HV was chose for analysis, because it
can be imaged constantly while using an intercostal approach without compressing the upper
abdomen which can affect the hepatic hemodynamics.
The contrast agent first arrived at the hepatic artery followed by the PV. There was a delay of
several seconds between these two vessels, and the TIC of the HV rose gradually. This delayed
and gradual enhancement of the HV was similar to that observed in the previous human
study.17,20,25
Because the hepatic artery carries a small amount of microbubbles, the HV is
enhanced only after the microbubbles reach the sinusoid from the PV (which has more blood
flow than the hepatic artery). Since the Sonazoid® used in this study is phagocytosed by Kupffer
cells when it passes through the sinusoid, it takes longer for the HV to reach the PI, due to the
escape of microbubbles via phagocytosis. After the PI, there is a gradual washout of the contrast
agent in the HV, while the contrast effect in the PV is still present at the end of the examination.
The number of microbubbles that re-enter the sinusoid through the general circulation decreases
as time goes on due to phagocytosis by Kupffer cells, which could contribute to the gradual loss
of enhancement of the HV.
We established reference values both in conscious and sedated dogs, and also evaluated the
repeatability of this examination. Although there was no statistically significant difference in
each parameter between the two groups, median value of HVAT was slightly longer in the
conscious group. Nyman et al. reported that the time to peak enhancement of the hepatic

16
parenchyma, calculated from the time of injection, was significantly shorter in dogs anesthetized
with propofol, as compared to that in non-anesthetized dogs.35
Propofol has been found to
increase hepatic arterial blood flow despite having no effect on portal venous flow,36
and the
authors speculated that shortened time to peak enhancement was related to the effect of propofol
on the vascular system. Although this was observed in the hepatic parenchyma, it is possible that
using propofol also affected the HVAT results in the current study. However, statistical
differences were not detected between the two groups, possibly because of the relatively low
repeatability in the conscious group (CV; 25.3%). Obtaining stable images was slightly difficult
in the conscious group compared with the sedated group, and this could have led to the low
repeatability. In addition, changes in cardiac output and blood pressure related to the dog’s
excitation level may have affected the hepatic circulation.
Recent research demonstrated shortening of the HVAT with the development of liver fibrosis
in a CCl4-induced canine liver fibrosis model.31
However, the HVAT was much shorter in the
current study compared with that of the baseline value (18.22 ± 0.82 sec) reported in the CCl4-
induced canine liver fibrosis model.31
The difference between our value and the previously
reported value is speculated due to differences in contrast agent, the volume of saline flush
and/or how rapidly it was administered, and the method used for quantitative analysis. Therefore,
the reference values should be applied cautiously, and the methods used to obtain these values
should be considered.
TTP and TTPP, which also showed low repeatability in conscious dogs, were not different
between the two groups. Even if propofol increases arterial blood flow, the main blood supply
associated with the initial upslope is presumably portal blood flow. In addition, because these
parameters reflect only the intrahepatic circulation, they may be less vulnerable than the HVAT
17
to extra hepatic factors. Although these parameters are not as common as HVAT in human
medicine, Sugimoto et al. reported that the HV rising rates in cirrhotic patients were significantly
higher than those in the control group and in non-cirrhotic patients.25
Therefore, the TTP and
TTPP, as a reflection of the HV rising rates, could be useful to assess the arterialization of the
HV in dogs.
In contrast to the HVAT, TTP and TTPP, WR showed favorable repeatability in both groups.
WR can be measured with only two values (the PI and the intensity at the end of the
examination), and this simple calculation could contribute to good repeatability. WR may also be
less affected by systemic hemodynamic changes, because it is not a time-dependent parameter,
which might have contributed to the lack of difference in this parameter between the two groups.
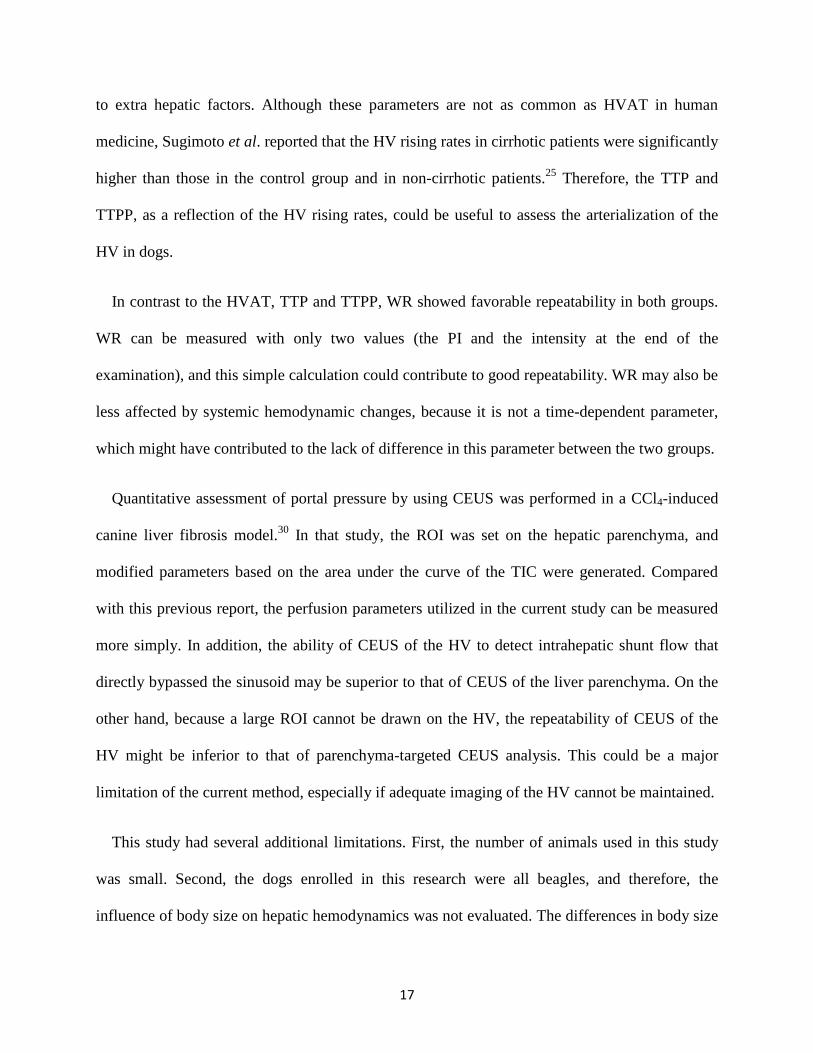
Quantitative assessment of portal pressure by using CEUS was performed in a CCl4-induced
canine liver fibrosis model.30
In that study, the ROI was set on the hepatic parenchyma, and
modified parameters based on the area under the curve of the TIC were generated. Compared
with this previous report, the perfusion parameters utilized in the current study can be measured
more simply. In addition, the ability of CEUS of the HV to detect intrahepatic shunt flow that
directly bypassed the sinusoid may be superior to that of CEUS of the liver parenchyma. On the
other hand, because a large ROI cannot be drawn on the HV, the repeatability of CEUS of the
HV might be inferior to that of parenchyma-targeted CEUS analysis. This could be a major
limitation of the current method, especially if adequate imaging of the HV cannot be maintained.
This study had several additional limitations. First, the number of animals used in this study
was small. Second, the dogs enrolled in this research were all beagles, and therefore, the
influence of body size on hepatic hemodynamics was not evaluated. The differences in body size
18
may affect the repeatability of each measured parameter, because ROI depends on the diameter
of the HV, which is associated with the size of dogs. Finally, Sonazoid®
was used in this study,
because it is the only second-generation contrast agent available in Japan. However, other
vascular-specific contrast agent might be better for assessing time-dependent parameters,
because they would purely reflect hemodynamic changes related to liver disease.
In conclusion, this study characterized image enhancement of the normal canine HV using
Sonazoid®. Established quantitative parameters will be used as a reference in chapter 3.

19
5. SUMMARY
In this chapter, we have characterized CEUS findings of the HV in normal dogs and assessed
the repeatability of this method both in a conscious group and a sedated group. Four perfusion
parameters were measured for quantitative analysis: HVAT, TTP, TTPP and WR. The contrast
effect of the HV developed gradually; it took over 10 seconds to reach PI. After PI, it showed a
gradual loss of enhancement. The intensity dropped to almost 20% of PI at the end of the
examination. In regard to the perfusion parameters, there were no statistically significant
differences between the 2 groups, but CVs for HVAT, TTP and TTPP in the conscious group
were >20% and were higher than sedated group with the exception of WR.
20
CHAPTER 2
ASSESSMENT OF CONTRAST-ENHANCED
ULTRASONOGRAPHY OF THE HEPATIC VEIN FOR
DETECTION OF HEMODYNAMIC CHANGES ASSOCIATED
WITH EXPERIMENTALLY INDUCED PORTAL
HYPERTENSION IN DOGS

21
1. INTRODUCTION
Portal hypertension is a severe complication of chronic liver disease. Clinical consequences
include development of multiple acquired portosystemic shunts (MAPSS), ascites, hepatic
encephalopathy, or a combination of these, which cause substantial morbidity and fatalities.37
Therefore, assessment of portal pressure before the onset of such late-stage clinical conditions
provides valuable information to improve the prognosis. However, direct or indirect
measurement of portal pressure is seldom performed in veterinary medicine because of its
invasiveness. Therefore, an alternative noninvasive method is needed.
CEUS is a potential candidate for the assessment of portal hypertension. There are several
intrahepatic and extrahepatic hemodynamic changes in patients with cirrhosis, such as
arterialization of the liver, intrahepatic shunts, pulmonary arteriovenous shunts, and a
hyperdynamic circulatory state.38–41
These hemodynamic changes contribute to the early HVAT
measured by use of CEUS, and it was reported that HVAT is negatively correlated with portal
pressure.17,20
Thus, CEUS has been evaluated as an alternative noninvasive method for assessing
the severity of portal hypertension in humans. However, in veterinary medicine, there was only
one report in which CEUS was used for the assessment of portal pressure in dogs with
experimentally induced liver fibrosis.30
Thus, the objectives of chapter 2 were to determine the feasibility for the use of CEUS to
detect hemodynamic changes associated with portal hypertension in dogs with experimentally
induced portal hypertension and to evaluate the correlation between CEUS parameters derived
for the HV and portal pressure.
22
2. MATERIALS AND METHODS
2.1 Animals
Six adult Beagles (3 males and 3 females) that were part of a research colony owned by our
laboratory were used in this prospective study. Age of dogs ranged from 1–3 years, and body
weight ranged from 9.2–12.0 kg. All dogs were considered healthy on the basis of results of a
baseline physical examination, CBC, and serum biochemical analysis that included ALT, AST,
ALP, and GGT activities and total protein, albumin, total bilirubin, ammonia, and fasting and
postprandial TBA concentrations. In addition, B-mode ultrasonography was performed on all
dogs, and no focal or diffuse hepatic abnormalities were detected. All procedures were approved
by the Hokkaido University Animal Care and Use Committee (No. 15-0090).
2.2 Establishment of portal hypertension
2.2.1 Surgical placement of an implantable port device
Food was withheld from each dog for 12 hours. Dogs then were premedicated by IV
administration of midazolam (0.1 mg/kg; Dormicum Injection, Astellas Pharma Inc., Tokyo,
Japan) and butorphanol tartrate (0.05 mg/kg; Vetorphale, Meiji Seika Pharma Co. ltd., Tokyo,
Japan). Anesthesia was induced with IV administration of propofol (Propofol Mylan, Mylan Inc.,
Canonsburg, Pa, U.S.A.) at an induction dosage of 6 mg/kg, and maintained with 1.5%
isoflurane (Isoflu; DS Pharma Animal Health Co. ltd., Osaka, Japan) in oxygen. A midline
abdominal incision was made, and the right pancreatic lobe was identified. An implantable port
device (MRI port, C. R. Bard, Inc., Murray Hill, NJ, U.S.A.) was surgically inserted in the PV,

23
and the catheter tip of the device was inserted into the main trunk of the PV via the
pancreaticoduodenal vein. The port was affixed to the subcutaneous tissues of the right
abdominal wall. After surgery, buprenorphine (0.01 mg/kg, intramuscularly, q 12 hours; Lepetan
Injection, Otsuka Pharma Co. ltd., Tokyo, Japan) was used as needed for analgesia, and
cephalexin (20 mg/kg, per os, q 12 hours for 3 days; Sencephalin Capsules, Takeda Pharma Co,
ltd., Osaka, Japan) was administered to prevent secondary bacterial infection. A liver specimen
was obtained during the catheterization procedure and used for histologic examination.
2.2.2 Microsphere injection
One week after the catheter was surgically placed, intraportal injections (as described
elsewhere42
) were initiated. Dogs were anesthetized with IV administration of propofol
(induction dose, 6 mg/kg; maintenance rate, 0.4 to 0.6 mg/kg/min33
) for each intraportal injection.
Microspheres (Sephadex G-50 medium, GE Healthcare UK Ltd., Buckinghamshire, UK), 10
mg/kg, were administered at 5-day intervals to the first 2 dogs. However, portal hypertension
was not adequately induced after 6 injections. Thereafter, the dose was increased to 15 mg/kg,
which led to a gradual increase in portal pressure. The remaining 4 dogs were administered all
injections of microspheres at a dose of 15 mg/kg. Injections of microspheres were continued
until portal hypertension was successfully established. Establishment of portal hypertension was
confirmed by formation of MAPSS as observed by use of B-mode ultrasonography and
computed tomography (CT).
2.2.3 Measurement of portal pressure
The portal vein pressure (PVP) was determined by measuring intraport pressure with a
disposable blood pressure monitoring kit (Disposable blood pressure monitoring kit, Nihon

24
Kohden Co., Tokyo, Japan) in accordance with the manufacturer’s directions. Briefly,
anesthetized dogs were placed in dorsal recumbency, and a 20-gauge coreless needle (Coreless
needle, Nipro Co., Osaka, Japan) connected to the transducer was inserted into the port. Each
PVP measurement was obtained immediately before every microsphere injection. The PVP
obtained before the first microsphere injection was defined as a baseline value.
2.2.4 Computed tomography
CT was performed before the first microsphere injection (defined as a baseline value) and was
repeated at 30-day intervals or after MAPSS formation was suspected during ultrasonographic
evaluation. Anesthetized dogs were positioned in dorsal recumbency as described previously.
For CT angiography, iodinated contrast medium (Omnipaque, Daiichi Sankyo, Tokyo, Japan) at
a dose of 600 mg of I/kg was injected IV over a 30-second period, and the entire abdominal
cavity was scanned with a 16-slice helical CT scanner (Aquilion 16, Toshiba Medical Systems,
Tochigi, Japan).
2.2.5 Necropsy
After establishment of MAPSS was confirmed via CT, dogs were euthanized (anesthetized
with IV administration of thiopental [20 mg/kg; Rabonal, Mitsubishi Tanabe Pharma Co, Osaka,
Japan] and then administered an IV injection of potassium chloride [KCL Corrective Injection,
Otsuka Pharma Co. ltd., Tokyo, Japan]). Necropsy was performed to enable investigators to
examine gross changes of intra-abdominal organs and to enable investigators to collect liver and
lung specimens. Specimens were fixed in neutral-buffered 10% formalin, embedded in paraffin,
stained with Hematoxylin & Eosin stain, and examined by use of light microscopy.
2.3 CEUS
25
2.3.1 Scanning and anesthetic protocols
CEUS was performed before the first microsphere injection (defined as a baseline value) and
after MAPSS was confirmed via CT. Scanning was performed on dogs anesthetized by
administration of propofol in the same manner as for microsphere injection. Anesthetized dogs
were positioned in left lateral recumbency, and the right HV was identified by use of an
intercostal approach. CEUS was performed as descried in chapter 1. Perfusion of the HV was
evaluated by scanning the HV for 2 minutes.
2.3.2 Settings
CEUS settings are as detailed in chapter 1.
2.4 Quantitative analysis
Quantitative analysis of CEUS images was performed as described in chapter 1.
2.5 Statistical analysis
Statistical analysis was performed with commercially available software (JMP Pro, version 11,
SAS Institute Inc., Cary, NC, U.S.A.). Normal distribution of data was confirmed by use of the
Shapiro-Wilk test. Body weight, blood biochemical variables, PVP, diameter of the left gonadal
vein measured by CT, and 4 CEUS parameters were compared before and after induction of
portal hypertension by use of a paired t test for parametric data and Wilcoxon rank sum test for
nonparametric data. Significance was set at values of P < 0.05. For blood biochemical variables
and CEUS parameters, simple regression analyses were performed to investigate correlations
with PVP.

26
3. RESULTS
3.1 Establishment of portal hypertension
Dogs remained apparently healthy throughout the experimental period. Portal hypertension
was induced successfully in all dogs. Median total dose of microspheres was 170 mg/kg (range,
105–285 mg/kg). Body weight at the time of portal hypertension was not significantly different
from baseline values. Two dogs had bacterial infection in the subcutaneous tissues around the
port device, which resolved after administration of a course of cephalexin.
Results for blood biochemical analyses were summarized in Table 2. ALT, ALP, and GGT
activities and total bilirubin concentration increased significantly, compared with baseline values.
Significant increases in both fasting and postprandial TBA concentrations were also detected,
whereas there were no significant changes in ammonia concentrations.
The PVP after induction of portal hypertension could not be measured accurately in 2 dogs
because of thrombi formation immediately cranial to the catheter tips. These dogs were excluded
from the analysis of PVP after portal hypertension. Median baseline PVP was 6.5 mm Hg (range,
2–8 mm Hg [n = 6]), which increased significantly to 12.5 mm Hg (range, 9–15 mm Hg [n = 4])
after MAPSS formation.
Small amounts of ascitic fluid were detected ultrasonographically in all dogs. Imaging with
CT revealed multiple small tortuous vessels located caudal to the left kidney. Anastomoses
between the left colic vein and left gonadal vein were visible in 4 dogs. In addition to this
collateral circulation, a left splenogonadal shunt was present in 2 dogs. Median diameter of the

27
left gonadal vein after induction of portal hypertension was 3.6 mm (range, 3.0–4.2 mm), which
was significantly (P = 0.01) larger than the baseline value (1.9 mm; range, 1.5–2.0 mm).
Necropsy revealed multiple small tortuous collateral vessels in the left perirenal area in all
dogs (Figure 4). These vessels were consistent with CT findings. Portal veins were markedly
enlarged and tortuous. The liver had no apparent abnormalities with a smooth serosal surface.
Small amounts of ascitic fluid were classified as transudates in all dogs. Histologic examination
of the liver specimens revealed only slight atrophy and vacuolar degeneration of hepatocytes.
The interlobular veins were dilated with microspheres. Proliferations of abundant epithelioid
cells, macrophages, and multinucleated giant cells surrounding the microspheres were evident.
Aggregation of macrophages was detected in the interlobular connective tissue, especially
around the interlobular veins. Moreover, microspheres were also present in the pulmonary
arteries; these microspheres were surrounded by a foreign body granuloma.
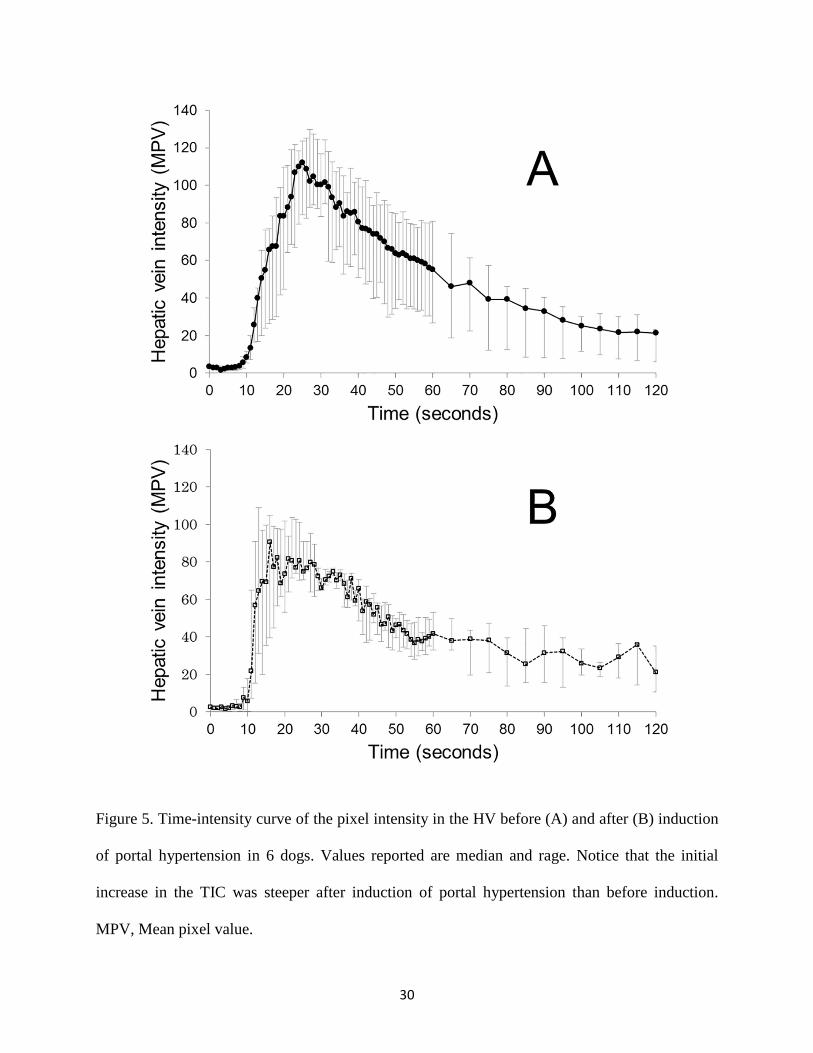
3.2 CEUS findings
The enhancement pattern of the HV changed after the induction of portal hypertension.
Subjectively, the HV had a rapid increase in echogenicity, which was represented as a rapid
increase in the TIC (Figure 5). Results for each parameter were summarized in Table 3. Among
the 4 CEUS parameters, TTP and TTPP were significantly shorter after induction of portal
hypertension, which corresponded with the visual observations.
3.3 Correlation between PVP and CEUS parameters
Results for 2 dogs were excluded from the analysis. Therefore, correlation between PVP and
CEUS parameters were tested by use of 6 baseline values and 4 post-induction values. Simple
regression analysis revealed a significant negative correlation between TTPP and PVP (R2 =

28
0.548; P = 0.014; Figure 6). This correlation was weaker than that for both fasting and
postprandial TBA concentrations and PVP (Table 4).

29
Figure 4. Photograph of the left perirenal area of a dog with experimentally induced portal
hypertension. Notice the multiple small tortuous collateral vessels (arrows).
30
Figure 5. Time-intensity curve of the pixel intensity in the HV before (A) and after (B) induction
of portal hypertension in 6 dogs. Values reported are median and rage. Notice that the initial
increase in the TIC was steeper after induction of portal hypertension than before induction.
MPV, Mean pixel value.

31
Figure 6. Graph of the relationship between TTPP and PVP obtained for dogs before (circles; n =
6) and after induction of portal hypertension (crosses; 4). The PVP could not be measured
accurately in 2 dogs after induction of portal hypertension. Notice that there was a significant
negative correlation between TTPP and PVP.

32
Table 2. Median (range) values for blood biochemical variables before and after induction of
portal hypertension in 6 dogs.
Variable Before induction After induction P - value*
Total protein (g/dl) 5.7 (5.2–6.2) 6.0 (5.7–7.2) 0.094
Albumin (g/dl) 3.1 (2.6–3.2) 2.8 (2.5–3.1) 0.210
ALT (IU/l) 34 (19–68) 223 (54–488) 0.014
AST (IU/l) 36 (24–44) 40 (23–86) 0.147
ALP (IU/l) 149 (78–381) 602 (435–838) 0.004
GGT (IU/l) 5.5 (1.3–8.0) 8.0 (4.0–10.0) 0.045
Total bilirubin (mg/dl) 0.1 (0.1–0.2) 0.3 (0.1–0.3) 0.020
Ammonia (μmol/dl) 39 (38–45) 59.5 (18–93) 0.199
Fasting TBA (μmol/dl) 2.3 (1.0–11.8) 17.4 (12.5–98.8) 0.008
Postprandial TBA (μmol/dl) 8.4 (2.9–16.0) 107.7 (73.5–186.2) <0.001
*Values were considered significant at P < 0.05.
ALT, Alanine aminotransferase; AST, Aspartate aminotransferase; ALP, Alkaline phosphatase;
GGT, -glutamyltranspeptidase; TBA, Total bile acid.

33
Table 3. Mean ± SD values for CEUS perfusion parameters before and after induction of portal
hypertension in 6 dogs.
Parameter Before induction After induction P - value*
HVAT (seconds) 11.2 ± 1.9 11.7 ± 2.8 0.386
TTP (seconds) 15.0 ± 1.8 9.3 ± 4.9 0.008
TTPP (seconds) 10.8 ± 1.8 5.5 ± 3.8 0.003
WR (%) 79.5 ± 6.8 71.7 ± 13.7 0.082
*Values were considered significant at P < 0.05.
HVAT, hepatic vein arrival time; TTP, time to peak; TTPP, time to peak phase; WR, washout
ratio.

34
Table 4. Results of simple regression analyses to determine the correlation between PVP and
CEUS parameters or blood biochemical variables determined for 6 dogs before and after
induction of portal hypertension.
Variable R2 AICc P - value*
Postprandial TBA 0.675 53.4 0.004
Fasting TBA 0.584 55.9 0.010
TTPP 0.548 56.7 0.014
ALP 0.468 58.3 0.029
TTP 0.375 60.0 0.060
ALT 0.269 61.5 0.125
Total bilirubin 0.216 62.2 0.176
GGT 0.070 63.9 0.461
Six values before and 4 values after induction of portal hypertension were used for analyses
because PVP could not be measured accurately in 2 dogs after induction of portal hypertension.
AICc, Akaike information criterion correction; ALT, Alanine aminotransferase; ALP, Alkaline
phosphatase; GGT, -glutamyltranspeptidase; TBA, Total bile acid; TTP, time to peak; TTPP,
time to peak phase.

35
4. DISCUSSION
In this study, changes in hepatic hemodynamics of dogs with experimentally induced portal
hypertension were evaluated by use of CEUS. The enhancement pattern of the HV changed
dynamically and was represented by shorter TTP and TTPP values.
Shorter time-dependent parameters indicated that the initial increase in the TIC became
steeper, compared with the increase for the baseline TIC, which probably was related to the
development of intrahepatic shunts between branches of the PV or hepatic artery (or both) and
HV. Intrahepatic shunts have been detected in rats with portal hypertension induced by
intraportal injection of microspheres,43,44
which is a method similar to the one used in the present
study. The development of intrahepatic shunts can contribute to the shorter TTP and TTPP
because the microbubbles passing through them can reach the HV directly without passing into
the sinusoids. A similar rapid increase in the TIC was also reported for cirrhotic patients in
clinical studies.17,25,45
The TTPP had a significant negative correlation with PVP. However, this correlation was
weaker than that for both fasting and postprandial TBA concentrations and PVP. Although TBA
is helpful for determining the presence of clinically relevant hepatobiliary disease in dogs, many
other pathological states can also increase its value.1,46
Because MAPSS formation induced by
portal hypertension is one of the factors that can contribute to an increase in TBA
concentration,46
monitoring of TBA concentrations would not be suitable for assessing the
severity of portal hypertension in clinical cases. On the other hand, hemodynamic analysis by use
of CEUS has been evaluated mainly for use in assessing the severity of portal hypertension or

36
degree of hepatic fibrosis.17,18,20,25,47,48
However, many patients with metastases to the liver also
have a left shift of the TIC similar to that seen for patients with cirrhosis.49
Consequently, TTPP
should be evaluated with caution and considering the underlying disorders. Further studies are
warranted to evaluate the clinical use of TTPP for dogs with portal hypertension.
In addition, HVAT, another time-dependent parameter, did not change significantly from
before to after the establishment of portal hypertension. This was an unexpected finding because
it has been reported in several studies17,20,25
that HVAT is shorter in cirrhotic patients than in
clinically normal volunteers and is negatively correlated with portal pressure. Furthermore, it has
recently been reported31
that there is a similar shorter HVAT with the development of liver
fibrosis in dogs with experimentally induced liver fibrosis. The difference between the
experimentally induced portal hypertension in this study and patients with hepatic cirrhosis or
experimentally induced liver fibrosis might be related to differences in the pathological condition.
Hepatic cirrhosis and experimentally induced liver fibrosis mainly induce sinusoidal portal
hypertension, which involves intrahepatic and extrahepatic hemodynamic changes that contribute
to a shorter HVAT. In contrast, the study reported here represented presinusoidal portal
hypertension that involved only slight periportal inflammation with no fibrosis. The
characterization of ascites also substantiated the presinusoidal portal hypertension. In idiopathic
portal hypertension, which is the most common cause of presinusoidal portal hypertension in
humans, increased and dilated hepatic arterial branches that compensate for the reduced portal
blood supply (such as that observed in patients with a cirrhotic liver) are not seen.50
In the same
manner as for idiopathic portal hypertension, it is possible that the method described for the
study reported here might not induce the same hemodynamic changes as those seen in patients
with cirrhosis.

37
This study is only the second that has described portal hypertension experimentally induced in
dogs by intraportal administration of microspheres. As with the previous study,42
abundant
MAPSS that resulted from increased portal venous resistance could be induced in all dogs.
Formation of MAPSS was obvious during diagnostic imaging and necropsy. Microspheres in the
pulmonary beds, which presumably reached the lungs through MAPSS, were also confirmed
histologically. In view of these results, this could be a useful method to induce presinusoidal
portal hypertension in dogs without clinically serious adverse events. However, several factors in
the present study differed from those in previous studies. First, an adequate increase in portal
pressure could not be induced by administration of microspheres at 10 mg/kg. Second, the
increase in portal pressure was relatively milder in the present study (median PVP after induction
of portal hypertension was 12.5 mm Hg). Investigators in previous study42
reported that
administration of microspheres at 10 mg/kg at 5-day intervals (total of 6 injections) could induce
portal hypertension, and the PVP increased to 24.3 mm Hg after 1 month. Although the reason
for these differences is not clear, individual variability might be the most likely explanation
because the total dose of microspheres injected into each dog was also widely variable in the
present study.
In the study reported here, there was a significant increase in the fasting TBA concentration,
but not in the ammonia concentration. We speculated that ammonia concentrations did not
increase because other tissues, including the kidneys, muscles, brain, and intestines, could
detoxify ammonia that escaped hepatic metabolism via MAPSS.51
In addition, because normal
hepatocytes have a remarkable functional reserve for detoxifying ammonia,52
even ammonia that
passed through the intrahepatic shunts might have been cleared effectively.

38
The present study had some limitations. First, the number of dogs used was small. In addition,
it would be more appropriate to compare CEUS parameters between preinfusion and
postinfusion values as well as values for a control group infused with saline solution (rather than
microspheres). However, the method used required a surgical procedure to catheterize the PV;
therefore, such a control group was not included on the basis of guidelines for use of laboratory
animals.53
Second, PVP after portal hypertension could not be measured in 2 dogs, which
lowered the statistical power of the study.
The study reported here revealed that CEUS can be used for detecting hemodynamic changes
induced by presinusoidal portal hypertension in dogs. The TTPP, a quantitative parameter
measured from the TIC, was negatively correlated with PVP and can provide useful
complementary information with regard to the presence of portal hypertension. These
fundamental data derived by use of an experimentally induced condition may be valuable for
conducting clinical trials.

39
5. SUMMARY
In this chapter, we have assessed the use of CEUS of the HV for the detection of
hemodynamic changes associated with experimentally induced portal hypertension in dogs.
Portal hypertension was induced by intraportal injection of microspheres (10 to 15 mg/kg) at 5-
day intervals via the catheter which was surgically placed in the PV. Microsphere injections were
continued until MAPSS were created. CEUS was performed before and after establishment of
hypertension. TICs were generated from the ROI in the HV. Perfusion parameters measured for
statistical analysis were HVAT, TTP, TTPP, and WR. The correlation between CEUS
parameters and PVP was assessed by use of simple regression analysis. Portal hypertension was
induced successfully in all dogs. Median total dose of microspheres was 170 mg/kg (range, 105–
285 mg/kg). TTP and TTPP were significantly shorter after induction of portal hypertension.
Simple regression analysis revealed a significant negative correlation between TTPP and PVP
(R2 = 0.548; P = 0.014).

40
CHAPTER 3
WASHOUT RATIO IN THE HEPATIC VEIN MEASURED BY
CONTRAST-ENHANCED ULTRASONOGRAPHY TO
DISTINGUISH BETWEEN INFLAMMATORY AND
NONINFLAMMATORY HEPATIC DISORDERS IN DOGS

41
1. INTRODUCTION
In the previous chapter, we have evaluated the clinical feasibility of CEUS of the HV using
normal dogs and dogs with experimentally-induced portal hypertension.54,55
Concurrently with
these fundamental research, we have performed CEUS in dogs with various hepatic disorders in
clinical settings. Through the accumulation of clinical data, we found that dogs with hepatitis
tended to maintain the contrast effect of the HV when compared to the dogs with
noninflammatory hepatic disorders. This finding was represented as lower WR values in the dogs
with hepatitis.
In this chapter, we performed CEUS of the HV in dogs with various hepatic disorders, and
prospectively evaluated whether the WR is a useful diagnostic aid for the differentiation of
inflammatory and noninflammatory hepatic diseases in clinical settings. Concurrently, other
time-dependent parameters including HVAT, TTP, and TTPP were also evaluated.

42
2. MATERIALS AND METHODS
2.1 Animals
2.1.1 Patients
Client-owned dogs presented to Hokkaido University Veterinary Teaching Hospital, with
persistently high hepatic enzyme activity in blood samples between November 2012 and May
2016 were prospectively enrolled. Informed owner consent was obtained in all cases. Dogs
presenting with acute signs (i.e., those characteristic of conditions such as acute hepatitis,
common bile duct obstruction, or rupture of the gallbladder) or having apparent hepatic tumors
detected using B-mode ultrasonography were excluded.
On the basis of the clinical findings including laboratory test results, diagnostic imaging
findings, and histopathological results, dogs were divided into 4 groups: hepatitis, primary
hypoplasia of the portal vein (PHPV), congenital portosystemic shunt (cPSS), and other
hepatopathy. The diagnostic criterion for the hepatitis group was the presence of chronic
inflammatory changes in a liver sample obtained using a Tru-cut biopsy, laparoscopy, or
laparotomy procedure. PHPV was diagnosed according to the following criteria: (1) increased
serum TBA or blood ammonia level and (2) histopathological findings consistent with PHPV
without the presence of cPSS. cPSS was diagnosed if a single shunt vessel was identified on CT
with morphological characteristics consistent with an extrahepatic cPSS56
and not an acquired
shunt.57
Dogs with glycogen accumulation or other noninflammatory changes observed on
histopathological examination of the liver were included in the other hepatopathy group. In

43
addition, dogs with hyperadrenocorticism with characteristic clinical signs and confirmed by
adrenocorticotropic hormone stimulation test or low-dose dexamethasone suppression test were
included in the other hepatopathy group, regardless of the presence or absence of
histopathological examination.
2.1.2 Control dogs
Six dogs were evaluated as healthy controls. The data from these dogs were established in
chapter 1.54
2.2 CEUS
2.2.1 Scanning
Preliminary B-mode ultrasonography was used to determine the CEUS imaging site in which
the size of the HV was largest. If the HV on the right, draining form the right lateral lobe or
caudate lobe, was suitable for CEUS, then the dog was positioned in left lateral recumbency with
manual restraint, and the HV was identified using an intercostal approach. If the HV on the left,
composed of the middle HV and left HV, was suitable, then the dog was positioned in dorsal
recumbency, and the transducer placed in the subcostal area on the left upper abdomen. CEUS
was performed as descried in chapter 1. Perfusion of the HV was evaluated by scanning the HV
for 2 minutes.
2.2.2 Settings
CEUS settings are as detailed in chapter 1.
2.3 Quantitative analysis

44
Quantitative analysis of CEUS images was performed as described in chapter 1.
2.4 Statistical analysis
Data were expressed as median values with ranges. Statistical analysis was performed with
commercially available computer software (JMP Pro, version 11, SAS Institute Inc, Cary, NC,
U.S.A.). The overall difference among groups was determined using the Kruskal–Wallis test, and
then post-hoc multiple comparisons were made using the Steel-Dwass test. A receiver operating
characteristic (ROC) curve was generated and the area under the ROC curve (AUROC)
calculated to assess the performance of WR in predicting hepatitis. Sensitivity and specificity
were calculated at various cutoff values. The optimal cutoff value was determined by the value
with the highest Youden’s index. For all analyses, P values of <0.05 were considered statistically
significant.

45
3. RESULTS
3.1 Study dogs
CEUS was performed in 54 dogs. No adverse effects were noted in any of the dogs. Five dogs
were excluded because histopathological examination disclosed no apparent abnormalities (4
dogs with Tru-cut biopsy samples and 1 dog with laparotomy samples). Two dogs were excluded
because they could not be classified adequately into any group (1 dog suspected of ductal plate
malformation and the other with concomitant cholangiohepatitis and glycogen accumulation).
Six dogs were excluded because quantitative analyses could not be performed because of poor
image quality. Finally, a total of 41 dogs, including 14 in the hepatitis group, 7 in the PHPV
group, 9 in the cPSS group, and 11 in the other hepatopathy group, were enrolled in this study.
3.2 Differences in clinical parameters among groups
Diagnostic samples were obtained by Tru-cut biopsy, laparotomy, and laparoscopy procedures
in 6, 4, and, 4 dogs, respectively, in the hepatitis group, and in 3, 2, and 2 dogs, respectively, in
the PHPV group. In the other hepatopathy group, the 3 dogs without hyperadrenocorticism were
diagnosed using samples obtained during laparoscopy.
The signalments of the dogs in each group were summarized in Table 5. The dogs in the other
hepatopathy group were significantly older than those in the cPSS (Steel-Dwass; P = 0.027),
PHPV (P = 0.028), and normal (P = 0.011) groups. The dogs in the hepatitis group were
significantly older than those in the normal group (P = 0.028). The normal dogs were
significantly heavier than those with hepatitis (Steel-Dwass; P = 0.028) or cPSS (P = 0.015). In

46
the hepatitis group, 8 dogs were considered to have portal hypertension because of the presence
of multiple tortuous vessels consistent with the morphology of acquired shunts57
or ascites.
Seven dogs in the hepatitis group had histological evidence of fibrosis in their liver samples,
evaluated as mild fibrosis in 1 dog, moderate fibrosis in 2 dogs, and marked fibrosis in 4 dogs. In
the PHPV group, 3 dogs were considered to have portal hypertension. The dogs in the other
groups had no clinical findings consistent with portal hypertension.
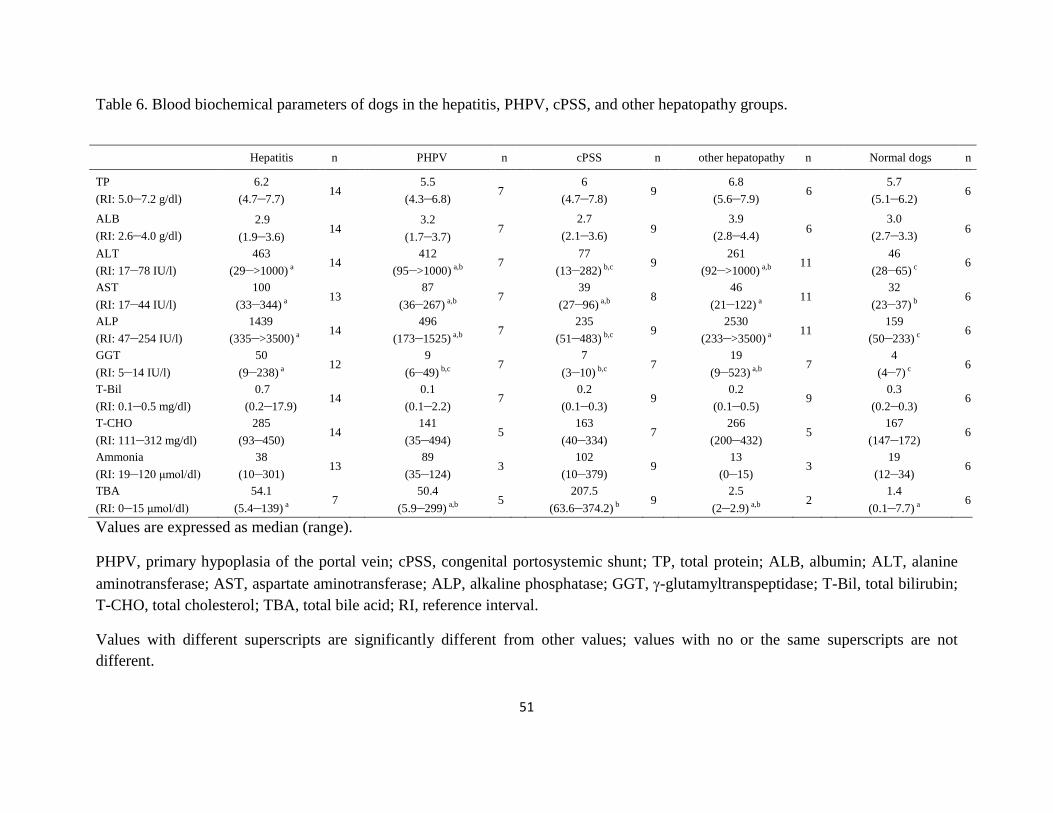
Blood biochemistry results obtained from the medical records were summarized in Table 6.
ALT levels in the hepatitis, PHPV, and other hepatopathy groups were significantly higher than
that in the normal group (Steel-Dwass; P = 0.021, 0.028, and 0.010, respectively), and ALT level
in the hepatitis group was higher than that in the cPSS group (P = 0.047). AST levels in the
hepatitis and PHPV groups were significantly higher than that in the normal group (Steel-Dwass;
P = 0.014 and 0.043, respectively). ALP levels in the hepatitis, PHPV, and the other hepatopathy
groups were significantly higher than that in the normal group (Steel-Dwass; P = 0.005, 0.043,
and 0.011, respectively), and ALP levels in the hepatitis and the other hepatopathy groups were
higher than that in the cPSS group (P = 0.008 and 0.025, respectively). GGT level in the hepatitis
group was significantly higher than the levels in the PHPV, cPSS, and the normal groups (Steel-
Dwass; P = 0.042, 0.007, and 0.07, respectively), and GGT in the other hepatopathy group was
significantly higher than that in the normal group (P = 0.025). The fasting TBA concentration in
the cPSS group was significantly higher than the concentrations in the hepatitis and normal
groups (Steel-Dwass; P = 0.037 and 0.020, respectively).

47
3.3 Differences in CEUS parameters among groups
The TICs for each group including the normal group were shown in Figure 7. The pixel
intensity at the end of the CEUS study was highest in the hepatitis group, followed by the PHPV,
cPSS, other hepatopathy, and normal groups. In particular, the hepatitis group showed little
attenuation from PI.
Results of CEUS parameters in each group were summarized in Table 7. WR in the hepatitis
group was significantly lower than that in the other groups (Steel-Dwass; vs. PHPV, P = 0.027;
vs. cPSS, P = 0.002; vs. other hepatopathy, P < 0.001; vs. normal dogs, P = 0.006). The data
distribution of WR in each group is shown in Figure 8. Most hepatitis patients showed a WR
value of <30%. The PHPV and cPSS groups showed a similar broad distribution, whereas the
distribution in the other hepatopathy group was similar to that in the normal group.
The HVAT in the hepatitis, cPSS, and other hepatopathy groups was significantly shorter than
that in the normal group (Steel-Dwass; P = 0.043, 0.049, and 0.024, respectively). On the other
hand, no significant difference was detected between the PHPV and the normal dogs. TTP and
TTPP were not different among the groups.
3.4 ROC analysis
When the ROC curve was constructed to assess the diagnostic accuracy of WR for hepatitis,
the AUROC was 0.960, with a 95% confidence interval of 0.853–0.990. Table 8 shows the
results of ROC analysis with various cutoff values, which were determined using ROC curves. A
WR of ≤37.1% showed the highest Youden’s index, and resulted in a sensitivity of 100% (95%
confidence intervals, 78.5–100%) and specificity of 85.2% (95% confidence intervals, 67.5–
94.1%) for the prediction of hepatitis.

48
Figure 7. Time-intensity curves showing the mean pixel intensity values for each group. The
pixel intensity at 120 seconds was the greatest in the hepatitis group (solid line), followed by the
primary hypoplasia of the portal vein (PHPV, dotted line), congenital portosystemic shunt (cPSS,
long dash line), other hepatopathy (long dash double-dotted line), and normal (dash line) groups.
MPV, mean pixel value.

49
Figure 8. Plots of washout ratio (WR) in each group. Medians are indicated with horizontal lines.
Horizontal bars indicate statistically significant comparisons and their P values. WR in the
hepatitis group was significantly lower than that of the other groups. PHPV, primary hypoplasia
of the portal vein; cPSS, congenital portosystemic shunt.

50
Table 5. Signalments of dogs in the hepatitis, PHPV, cPSS, and other hepatopathy groups.
Hepatitis (n=14) PHPV (n=7) cPSS (n=9) other hepatopathy (n=11) Normal dogs (n=6)
Age (years)* 10 (0-12) a,b
2 (1-10) b,c
5 (0-11) b,c
11 (3-17) a 2 (2-5)
c
Weight (kg) * 6.8 (3.3-11.1)
a 3.2 (1.7-11.4)
a,b 4.4 (2.2-8.4)
a 6.4 (2.2-27)
a,b 11.1 (9.7-12.5)
b
Sex male (n=2), female (3),
castrated male (4), spayed
female (5)
male (n=5), spayed
female (2)
male (n=3), female (1),
castrated male (3),
spayed female (2)
female (n=4), castrated
male (3), spayed female
(4)
male (n=3), female (3)
Breed Miniature dachshund
(n=3), Border collie (2),
American cocker spaniel
(1), Cavalier king charles
spaniel (1), Chihuahua (1),
English cocker spaniel (1),
Miniature pinscher (1),
Papillon (1), Shiba (1),
Toy poodle (1), West
Highland white terrier (1)
Miniature schnauzer
(n=2), Belgian Griffon
(1), Chihuahua (1), Toy
poodle (1), Yorkshire
terrier (1), Mix (1)
Miniature schnauzer
(n=2), Yorkshire terrier
(2), Mix (2), Chihuahua
(1), Miniature dachshund
(1), Pekinese (1)
Miniature dachshund
(n=5), Beagle (1),
Chihuahua (1),
Doberman (1), Papillon
(1), Toy poodle (1),
Yorkshire terrier (1)
Beagle (n=6)
Classification chronic hepatitis (n=6),
chronic cholangiohepatitis
(6), lobular dissecting
hepatitis (1), copper-
associated chronic
hepatitis (1)
splenophrenic (n=6),
splenoazygous (2), right
gastric-caval (1)
PDH (n=6), AT (2),
glycogen accumulation
(2), copper accumulation
(1)
*Values are expressed as median (range).
PHPV, primary hypoplasia of the portal vein; cPSS, congenital portosystemic shunt; PDH, pituitary-dependent hyperadrenocorticism;
AT, adrenal tumor.
Values with different superscripts are significantly different from other values, values with the same superscripts are not different.
51
Table 6. Blood biochemical parameters of dogs in the hepatitis, PHPV, cPSS, and other hepatopathy groups.
Hepatitis n PHPV n cPSS n other hepatopathy n Normal dogs n
TP
(RI: 5.0–7.2 g/dl)
6.2
(4.7–7.7) 14
5.5
(4.3–6.8) 7
6
(4.7–7.8) 9
6.8
(5.6–7.9) 6
5.7
(5.1–6.2) 6
ALB
(RI: 2.6–4.0 g/dl)
2.9
(1.9–3.6) 14
3.2
(1.7–3.7) 7
2.7
(2.1–3.6) 9
3.9
(2.8–4.4) 6
3.0
(2.7–3.3) 6
ALT
(RI: 17–78 IU/l)
463
(29–>1000) a 14
412
(95–>1000) a,b 7
77
(13–282) b,c 9
261
(92–>1000) a,b 11
46
(28–65) c 6
AST
(RI: 17–44 IU/l)
100
(33–344) a 13
87
(36–267) a,b 7
39
(27–96) a,b 8
46
(21–122) a 11 32
(23–37) b 6
ALP
(RI: 47–254 IU/l)
1439
(335–>3500) a 14
496
(173–1525) a,b 7
235
(51–483) b,c 9
2530
(233–>3500) a 11
159
(50–233) c 6
GGT
(RI: 5–14 IU/l)
50
(9–238) a 12
9
(6–49) b,c 7
7
(3–10) b,c 7
19
(9–523) a,b 7
4
(4–7) c 6
T-Bil
(RI: 0.1–0.5 mg/dl)
0.7
(0.2–17.9) 14
0.1
(0.1–2.2) 7
0.2
(0.1–0.3) 9
0.2
(0.1–0.5) 9
0.3
(0.2–0.3) 6
T-CHO
(RI: 111–312 mg/dl)
285
(93–450) 14
141
(35–494) 5
163
(40–334) 7
266
(200–432) 5
167
(147–172) 6
Ammonia
(RI: 19–120 μmol/dl)
38
(10–301) 13
89
(35–124) 3
102
(10–379) 9
13
(0–15) 3
19
(12–34) 6
TBA
(RI: 0–15 μmol/dl)
54.1
(5.4–139) a 7
50.4
(5.9–299) a,b 5
207.5
(63.6–374.2) b 9
2.5
(2–2.9) a,b 2
1.4
(0.1–7.7) a 6
Values are expressed as median (range).
PHPV, primary hypoplasia of the portal vein; cPSS, congenital portosystemic shunt; TP, total protein; ALB, albumin; ALT, alanine
aminotransferase; AST, aspartate aminotransferase; ALP, alkaline phosphatase; GGT, -glutamyltranspeptidase; T-Bil, total bilirubin;
T-CHO, total cholesterol; TBA, total bile acid; RI, reference interval.
Values with different superscripts are significantly different from other values; values with no or the same superscripts are not
different.

52
Table 7. CEUS perfusion parameters of dogs in the hepatitis, PHPV, cPSS, other hepatopathy group, and normal groups.
Hepatitis
(n=14)
PHPV
(n=7)
cPSS
(n=9)
other hepatopathy
(n=11)
Normal dogs
(n=6)
HVAT (seconds) 7 (5–16)a
10 (7–15)
a,b
7 (4–15)
a
9 (5–14)
a
13.5 (9–22)
b
TTP (seconds) 12 (6–19)
9 (5–13)
11 (3–26)
12 (3–23)
12.5 (6–24)
TTPP (seconds) 6 (3–18)
4 (3–11)
5 (2–20)
10 (3–17)
8 (6–13)
WR (%) 18.0 (2.0–37.0)a 52.2 (11.5–86.3)
b 60.0 (28.6–77.4)
b 70.5 (26.6–88.4)
b 78.0 (60.7–91.7)
b
Values are expressed as median (range).
PHPV, primary hypoplasia of the portal vein; cPSS, congenital portosystemic shunt; HVAT, hepatic vein arrival time; TTP, time to
peak; TTPP, time to peak phase; WR, washout ratio.
Values with different superscripts are significantly different from other values; values with no or the same superscripts are not
different.

53
Table 8. Diagnostic accuracy of the WR with various cutoff values for the diagnosis of hepatitis.
Cutoff Value
(%)
% Sensitivity
(95% confidence intervals)
% Specificity
(95% confidence intervals) Youden’s index
≦37.1 100 (78.5–100) 85.2 (67.5–94.1) 0.852
≦29.2 92.9 (68.5–98.7) 88.9 (71.9–96.1) 0.818
≦26.8 85.7 (60.1–96.0) 92.6 (76.6–97.9) 0.783
≦25.4 78.6 (52.4–94.4) 96.3 (81.7–99.3) 0.749
WR, washout ratio.

54
4. DISCUSSION
In this chapter, we evaluated the differences in CEUS parameters among dogs with various
hepatic disorders. As a result, we found that the WR was significantly lower in the hepatitis
group than in the other groups, and may be a useful marker to distinguish between inflammatory
and noninflammatory hepatic diseases. To the best of our knowledge, WR of the HV has not
been assessed previously either in human or veterinary medicine.
The disposition of perflubutane in rats after IV injection of Sonazoid® has been reported.
58
They found that the total amount of perflubutane recovered in the analyzed tissues at 5 minutes
after injection was 69.2% of the injected dose and 50.7% of the injected dose was recovered in
the liver.58
This result indicates that metabolism by the liver largely contributes to the decrease in
blood concentrations of perflubutane during the early phase. Because Sonazoid® is phagocytized
effectively by Kupffer cells when it passes through the sinusoids,4 we considered that decreased
Kupffer cell phagocytosis in the hepatitis group was the most likely reason for the lower WR
results in this group.
Decreased uptake of microbubbles by Kupffer cells may be due to : (1) decreased number of
Kupffer cells, (2) disrupted hepatic microcirculation, and (3) impaired phagocytic function of the
Kupffer cells. The number of Kupffer cells may be decreased in patients with microhepatia or in
patients with chronic hepatitis if the inflammation is severe enough to induce hepatocellular
necrosis or fibrosis.59
The hepatic microcirculation of the contrast agent may be interrupted
because of narrowed sinusoids or portal branches. Moreover, intrahepatic shunts may be
established in response to increased portal resistance. Intrahepatic shunts originated at zone I and

55
diverted up to 70% of the portal venous blood from zone III regions in the rat liver after
intraportal microsphere injections.44
Therefore, intrahepatic shunts may cause some of the
microbubbles to bypass the hepatocytes and Kupffer cells, and bypassed Sonazoid® could be
removed by exhalation or uptake in other tissues, such as the spleen, kidney, and lung.58
However, the distribution proportion of Sonazoid® in the liver is more than half, and bypassed
Sonazoid® recirculated into the liver may result in a prolonged contrast effect in the HV.
Impaired phagocytic function of Kupffer cells may occur in various hepatic disorders. The
accumulation of the hepatic parenchyma-specific contrast agent, Levovist®, was decreased
remarkably in nonalcoholic steatohepatitis patients compared with nonalcoholic fatty liver
disease patients and healthy volunteers.60
Recent reports indicated that this low accumulation of
contrast agent is caused mainly by decreased phagocytic capacity, and not number of Kupffer
cells in animal disease models.31,32
Kupffer cell dysfunction has been studied mainly in relation
to nonalcoholic steatohepatitis in humans, but similar imaging findings have been reported in
patients with cirrhosis resulting from chronic viral hepatitis.61,62
Although canine Kupffer cell
dysfunction in relation to hepatic disorders has never been reported, impaired phagocytic
function of Kupffer cells may have contributed to lower WR in the hepatitis group in the current
study.
The aforementioned factors are not specific to hepatitis cases. For example, disturbed hepatic
microcirculation followed by the establishment of intrahepatic shunts is generally present in
PHPV, and an extrahepatic shunt in cPSS can cause some of the microbubbles to bypass the liver,
similar to intrahepatic shunts. In addition, microhepatia can be present in both PHPV and cPSS.
Moreover, extrahepatic factors that can decrease intrahepatic circulation, such as hypotension,
congestion of the HV, and blood hyperviscosity, might impair the uptake of microbubbles by

56
Kupffer cells. Thus, although several factors can lead to reduced WR values, the significantly
low WR in the hepatitis group in the present study suggest that hepatitis is most likely to involve
these intrahepatic and extrahepatic factors, followed by PHPV, cPSS, and other hepatopathy.
Because approximately half of the hepatitis dogs in this study had likely portal hypertension or
hepatic fibrosis, the presence of acquired shunts or fibrosis might have substantially contributed
to decreased WR in this group.
The reason WR has not been assessed previously might be related to the background of the
CEUS study. HVAT was the first and most investigated CEUS parameter for assessing the
severity of liver fibrosis.18,19
Some studies have measured additional parameters to improve
diagnostic accuracy, including transit time between the hepatic artery and vein and the slope
gradient of the hepatic artery, PV, and HV.17,25,26
However, most studies have focused on the
initial upslope of the TIC, not on the attenuation of its intensity. Moreover, the difference in
contrast agents could be another reason. It was reported that 99% of Sonazoid® and 47% of
Levovist® were phagocytosed by Kupffer cells in vitro, whereas only 7.3% of SonoVue
® was
phagocytosed.4 Current study was based on the speculation that differences in Kupffer cell
phagocytosis among the various hepatic disorders would result in different WR values, and this
analysis using one of the abovementioned contrast agents would not have provided the same
results.
ROC analysis showed that WR has good diagnostic accuracy for the diagnosis of hepatitis
(Table 8). We speculate that not only the differences in WR values among the groups but also the
favorable repeatability of WR itself, which was demonstrated in chapter 1,54
might have
contributed to this finding. When the cutoff value of WR based on the ROC analysis was set at
37.1% (Table 8), 4 dogs (including 1 in the PHPV group, 2 in the cPSS group, and 1 in the other

57
hepatopathy group) would have had false-positive diagnoses of inflammatory liver disorders.
Among them, the PHPV dog showed a considerably lower WR (11.5%) than that of the other
PHPV dogs. This dog was clinically ill with hyperbilirubinemia and portal hypertension, and
died 36 days after the CEUS examination. The owner refused a post mortem examination.
Considering that the prognosis of this dog was apparently worse than that of the other PHPV
dogs and that the dog exhibited clinical evidence of hepatic dysfunction and portal hypertension,
its hepatic function and microcirculation might have been severely impaired, which could
explain the low WR value. Alternatively, coexistence of another hepatic disease could not be
excluded in this dog because one of the major limitations of hepatic biopsy procedures is
sampling error in unevenly distributed lesions51
and a post mortem examination could not be
performed. The dog in the other hepatopathy group also showed a lower WR value (26.6%) than
did the other dogs. This dog was clinically ill with remarkably high hepatic enzyme levels (ALT,
>1000 IU/L). Before the first admission, the dog had been treated with prednisolone by the
referring veterinarian, but the clinical signs associated with the administration of prednisolone
included only polyuria and polydipsia. The histopathological diagnosis was glycogen
accumulation. As the dose of prednisolone was tapered, the dog gradually recovered and its
hepatic enzyme levels also decreased. The relationship between the hepatic histopathology and
clinical illness could not be determined. These findings suggest that glycogen accumulation can
result in decreased WR.
Time-dependent CEUS parameters including HVAT, TTP, and TTPP were also evaluated in
the present study. Recent research indicated shortening of the HVAT with the development of
liver fibrosis in a CCl4-induced canine liver fibrosis model.31
The HVAT, not only in the
hepatitis group, but also in the cPSS and other hepatopathy groups, was significantly shorter than

58
that in normal dogs. This finding suggests that hemodynamic changes associated with decreased
portal supply might occur in various hepatic disorders in dogs. In chapter 2, we found that TTP
and TTPP were shortened significantly in experimentally induced presinusoidal portal
hypertension in dogs and that TTPP had significant negative correlation with the portal
pressure.55
Although PHPV can also induce presinusoidal portal hypertension, no statistical
difference was detected between the PHPV and the normal dogs. A possible reason for this
finding is that not all dogs in the PHPV group were considered to have portal hypertension.
Therefore, time-dependent parameters should be used to monitor the severity of disease, not for
differential diagnosis.
There are some limitations in the present study. First, the number of dogs used was relatively
small. Second, because liver biopsy samples were not obtained from the dogs with
hyperadrenocorticism, the coexistence of other hepatic diseases in these dogs could not be ruled
out. Third, the operators were not blinded to each dog’s clinical findings. Further blinded study
by other institutions is warranted.
In conclusion, this study showed that CEUS of the HV using Sonazoid®
can provide useful
information in differentiating non-neoplastic hepatic diseases in dogs. WR can distinguish
hepatitis from noninflammatory disorders with high accuracy. Although hepatic biopsy remains
the gold standard for definitive diagnosis, this method may be a useful alternative to investigate
the presence or absence of hepatitis.

59
5. SUMMARY
In this chapter, we have investigated whether the WR in the HV measured using CEUS can
distinguish between inflammatory and noninflammatory hepatic disorders in dogs. Forty-one
client-owned dogs with hepatic disorders including 14 with hepatitis, 7 with PHPV, 9 with cPSS,
and 11 with other hepatopathy, were prospectively enrolled. Six dogs without having any hepatic
disease were also evaluated as healthy controls. WR in the hepatitis group (median, 18.0%; range,
2.0–37.0%) was significantly lower than that of the PHPV (median, 52.2%; range, 11.5–86.3%),
cPSS (median, 60.0%; range, 28.6–77.4%), other hepatopathy (median, 70.5%; range, 26.6–
88.4%), and normal (median, 78.0%; range, 60.7–91.7%) groups. The AUROC for hepatitis was
0.960, with a 95% confidence interval of 0.853–0.990. WR ≤ 37.1% resulted in a sensitivity of
100% (95% confidence interval, 78.5–100%) and specificity of 85.2% (95% confidence interval,
67.5–94.1%) for the prediction of hepatitis. WR can distinguish hepatitis from the other
noninflammatory disorders with high accuracy. This result might reflect the impaired Kupffer
cell phagocytosis in dogs with hepatitis.
60
GENERAL CONCLUSION
The goal of this study was to determine the feasibility of CEUS in the diagnosis of canine
diffuse liver disease. The findings of the present study suggest that the CEUS of the HV can be
used to predict inflammatory hepatic disorders, such as chronic hepatitis and cirrhosis.
Furthermore, it can provide complementary information for predicting portal hypertension.
In chapter 1, we have characterized CEUS findings of the HV in normal dogs and assessed the
repeatability of this method both in a conscious group and a sedated group. The contrast effect of
the HV developed gradually to reach PI, followed by gradual loss of enhancement. The intensity
dropped to almost 20% of PI at the end of the examination. In regard to the perfusion parameters,
there were no statistically significant differences between the 2 groups, but CVs for HVAT, TTP
and TTPP in the conscious group were higher than sedated group with the exception of WR.
In chapter 2, we have assessed the use of CEUS of the HV for the detection of hemodynamic
changes associated with experimentally induced portal hypertension in dogs. Briefly, the
implantable port devise was surgically inserted in the PV in 6 dogs, and portal hypertension was
induced by intraportal injection of microspheres at 5-day intervals via the catheter. As a result,
the contrast enhancement of the HV changed dynamically after induction of portal hypertension,
which was characterized by a rapid increase in the intensity. TTP and TTPP were significantly
shortened. Furthermore, TTPP was negatively correlated with PVP. Thus, the TTPP, a
quantitative parameter measured from the TIC, can provide useful complementary information
for predicting portal hypertension.

61
In chapter 3, we have investigated the diagnostic value of CEUS for the differentiation of
canine diffuse liber disease. Forty-one client-owned dogs that were presented to Hokkaido
University Veterinary Teaching Hospital between November 2012 and May 2016 were
prospectively enrolled. These dogs included 14 with hepatitis, 7 with PHPV, 9 with cPSS, and 11
with other hepatopathy. The reference value established in chapter 1 was used as healthy control.
As a result, WR in the hepatitis group was significantly lower than that of the PHPV, cPSS, other
hepatopathy, and normal groups. The AUROC for hepatitis was 0.960. WR ≤ 37.1% resulted in a
sensitivity of 100% and specificity of 85.2% for the prediction of hepatitis. These results
indicated that WR can distinguish hepatitis from the other noninflammatory disorders with high
accuracy in clinical settings.
There were several limitations about this examination. First, this method requires clear
visualization of the HV. Thus, this factor could be a major limitation in dogs with microhepatia,
excessively obese dogs, and in uncooperative dogs. In case of failure to obtain adequate images
of the HV, analysis of the liver parenchyma may have an advantage over the method used in the
present study. Second, although this method has the potential to detect the inflammatory hepatic
disorders, it cannot provide further information such as that yielded by the histologic
examination of hepatic biopsy samples. For example, the dog with hepatic copper accumulation
might have required specific therapy, and this condition could only have been identified after
examination of hepatic biopsy samples and copper analysis. However, CEUS is a less invasive
method compared with hepatic biopsy, and may be useful in combination with blood tests and
conventional B-mode ultrasonography in providing additional information regarding the cause of
hepatic disorders in cases in which the owner does not consent to liver biopsy.

62
In conclusion, through this study we are able to characterize the CEUS findings of the HV in
dogs. WR, a quantitative parameter measured from the TIC, can distinguish hepatitis from
noninflammatory disorders with high accuracy. Furthermore, CEUS may also be potentially
useful in monitoring the portal pressure. Future study plans should include a bigger population,
with multiple institution involvement for validation of this method.
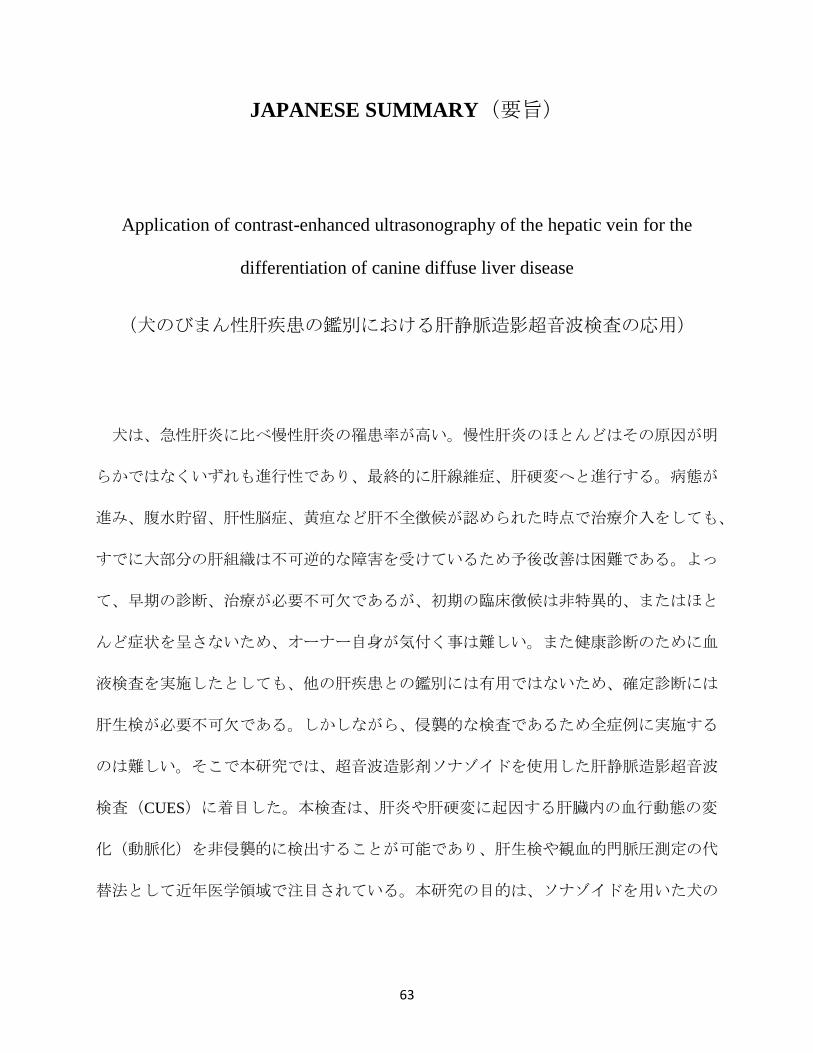
63
JAPANESE SUMMARY(要旨)
Application of contrast-enhanced ultrasonography of the hepatic vein for the
differentiation of canine diffuse liver disease
(犬のびまん性肝疾患の鑑別における肝静脈造影超音波検査の応用)
犬は、急性肝炎に比べ慢性肝炎の罹患率が高い。慢性肝炎のほとんどはその原因が明
らかではなくいずれも進行性であり、最終的に肝線維症、肝硬変へと進行する。病態が
進み、腹水貯留、肝性脳症、黄疸など肝不全徴候が認められた時点で治療介入をしても、
すでに大部分の肝組織は不可逆的な障害を受けているため予後改善は困難である。よっ
て、早期の診断、治療が必要不可欠であるが、初期の臨床徴候は非特異的、またはほと
んど症状を呈さないため、オーナー自身が気付く事は難しい。また健康診断のために血
液検査を実施したとしても、他の肝疾患との鑑別には有用ではないため、確定診断には
肝生検が必要不可欠である。しかしながら、侵襲的な検査であるため全症例に実施する
のは難しい。そこで本研究では、超音波造影剤ソナゾイドを使用した肝静脈造影超音波
検査(CUES)に着目した。本検査は、肝炎や肝硬変に起因する肝臓内の血行動態の変
化(動脈化)を非侵襲的に検出することが可能であり、肝生検や観血的門脈圧測定の代
替法として近年医学領域で注目されている。本研究の目的は、ソナゾイドを用いた犬の

64
肝静脈 CEUS の手法を確立し、犬のびまん性肝炎、特に慢性肝炎や肝硬変の診断に寄
与することである。
本研究は、①正常犬を用いた基準値の確立と検査の再現性評価、②実験的に作出した
犬の前類洞性門脈高血圧モデルにおける CEUS 測定値の変動解析、③臨床例 41 頭を対
象にした慢性肝炎の検出における CEUSの有用性の検討、の 3段階で実施した。
肝静脈 CEUS は、ソナゾイド 0.01 mL/kg を静脈内投与後から 2 分まで行い、画像解
析ソフト ImageJ を用いて肝静脈内のエコー輝度の経時的変化を解析した。Time-
intensity curve(TIC)を作成し、TIC 上に肝静脈到達時間(HVAT)、最高点到達時間
(TTP)、最高相到達時間(TTPP)、減衰率(WR)の 4つの測定項目を設定した。
実験 1 では、健康なビーグル犬 12 頭に対し各 3 回 CEUS を行った。プロポフォール
の持続点滴によって不動化を実施した鎮静群(n=6)と、用手保定のみで CEUS を実施
した覚醒群(n=6)の 2 群についてそれぞれ測定項目の基準値を確立し、さらに検査の
再現性を評価するため変動係数(CV)を算出した。ソナゾイド投与後、肝内血管は肝
動脈、門脈、肝静脈の順に造影増強効果を受け、肝静脈のエコー輝度は他の血管に比べ
緩徐に上昇し、造影効果が最大値に達するまで約 10 秒を要した。造影効果はその後
徐々に減衰していき、検査終了時のエコー輝度は最大値の約 20%であった。両群の測
定項目に有意差は認められなかった。鎮静群の測定項目の CVは 11.8–14.8%であり良好
な再現性を示したが、覚醒群の CVは WR(7.6%)以外は 25.3–29.7%であり鎮静群と比
較し高い傾向であった。
実験 2では、ビーグル犬 6頭に門脈高血圧を誘導し、その前後で CEUSの測定項目が
どのように変化するかを検討した。開腹手術下で膵十二指腸静脈から挿入したカテーテ

65
ルの先端を肝門部の門脈本幹で固定し、対側のポート部を右上腹部の皮下に縫合した。
直径 105–310 μm のマイクロビーズ 10–15 mg/kg を 5 日間隔でポート部より投与し、肝
内門脈を徐々に塞栓させることで門脈圧を上昇させた。全ての犬で門脈高血圧を誘導す
ることが可能であり、必要なビーズ量の中央値は 170 mg/kg(範囲:105–285 mg/kg)で
あった。肝静脈は門脈高血圧を誘導する前と比較し急速に造影増強され、TIC の上昇率
が増加していた。4 つの測定項目のうち、TTP、TTPP の有意な短縮が認められた。単
回帰分析の結果、TTPP と門脈圧との間に負の相関が認められた(R2 = 0.548; P =
0.014)。以上の結果から、門脈高血圧によって TTPP が短縮することが明らかとなり、
これは門脈高血圧に伴う肝臓の動脈化を反映していると考えられた。
実験 3 では、2012 年 11 月から 2016 年 5 月に北海道大学大学院獣医学研究科附属動
物病院に来院し、びまん性肝疾患と診断された犬 41 頭を対象に肝静脈 CEUS を行った。
肝生検や臨床病理検査結果をもとに、対象犬を肝炎群、原発性門脈低形成群、先天性門
脈体循環シャント群、その他の肝疾患群に分類し、実験1で確立した正常犬のデータを
合わせて各群の測定項目の差異を検討した。その結果、肝炎群における WR(中央値
18.0%、範囲 2.0–37.0%、n=14)は、原発性門脈低形成群(中央値 52.2%、範囲 11.5–
86.3%、n=7)、先天性門脈体循環シャント群(中央値 60.0%、範囲 28.6–77.4%、n=9)、
その他の肝疾患群(中央値 70.5%、範囲 26.6–88.4%、n=11)、および正常犬(中央値
78.0%、60.7–91.7%、n=6)に比べ有意に低値であった。ROC 解析の結果、WR を≦
37.1%とした場合の慢性肝炎の診断精度は、AUROC 0.960、感度 100%、特異度 85.2%
であった。以上の結果から、WR は実際の臨床例において慢性肝炎とその他の肝疾患を
鑑別できる可能性が示唆された。

66
本研究によって、ソナゾイドを用いた犬の肝静脈 CEUSの手法が確立され、TIC上に
設定した測定項目のうち、WR は犬の慢性肝炎の診断に有用である可能性が示唆された。
超音波造影剤ソナゾイドは肝臓の Kupffer 細胞によって貪食される性質を有する。従っ
て WR が低下する要因として、炎症による Kupffer 細胞の貪食能の低下、組織構造の破
壊や小肝症による Kupffer 細胞数の減少が挙げられた。さらに類洞の狭小化によって有
効類洞血流量が減少し、貪食される造影剤の量が減少した可能性も考えられた。WR は
他の測定項目と比較し良好な再現性を有することから、今後の臨床応用も期待できる。
一方、実験 2の結果から、門脈圧の上昇に伴い TTPPが短縮することが示された。よ
って同一個体内の TTPP の経時的変化を追うことによって、門脈圧の上昇を予測できる
可能性が示唆された。

67
REFERENCES
1. Watson PJ. Hepatobiliary and exocrine pancreatic disorders. In: Nelson RW, Couto CG, eds.
Small animal internal medicine. 5th ed. St Lois: Elsevier Mosby, 2014;501–628.
2. Hess RS, Saunders HM, Van Winkle TJ, et al. Clinical, clinicopathologic, radiographic, and
ultrasonographic abnormalities in dogs with fatal acute pancreatitis: 70 cases (1986-1995). J
Am Vet Med Assoc 1998;213:665–670.
3. Sontum PC. Physicochemical characteristeics of Sonazoid, a new contrast agent for
ultrasound imaging. Ultrasound Med Biol 2008;34:824–833.
4. Yanagisawa K, Moriyasu F, Miyahara T, et al. Phagocytosis of ultrasound contrast agent
microbubbles by Kupffer cells. Ultrasound Med Biol 2007;33:318–325.
5. Watanabe R, Matsumura M, Munemasa T, et al. Mechanism of hepatic parenchyma-specific
contrast of microbubble-based contrast agent for ultrasonography: Microscopic studies in rat
liver. Invest Radiol 2007;42:643–651.
6. Watanabe R, Matsumura M, Chen CJ, et al. Gray-scale liver enhancement with Sonazoid
(NC100100), a novel ultrasound contrast agent; detection of hepatic tumors in a rabbit
model. Biol Pharm Bull 2003;26:1272–1277.
7. Hatanaka K, Kudo M, Minami Y, et al. Sonazoid-enhanced ultrasonography for diagnosis of
hepatic malignancies: comparison with contrast-enhanced CT. Oncology 2008;75:42–47.

68
8. Kanemoto H, Ohno K, Nakashima K, et al. Characterization of canine focal liver lesions
with contrast-enhanced ultrasound using a novel contrast agent-sonazoid. Vet Radiol
Ultrasound 2009;50:188–194.
9. Nakamura K, Takagi S, Sasaki N, et al. Contrast-enhanced ultrasonography for
characterization of canine focal liver lesions. Vet Radiol Ultrasound 2010;51:79–85.
10. Feeney DA, Anderson KL, Ziegler LE, et al. Statistical relevance of ultrasonographic
criteria in the assessment of diffuse liver disease in dogs and cats. Am J Vet Res 2008;69:
212–221.
11. Desmet VJ, Gerber M, Hoofnagle JH, et al. Classification of chronic hepatitis: diagnosis,
grading and staging. Hepatology;1994;19:1513–1520.
12. Poynard T, Ratziu V, Benmanov Y, et al. Fibrosis in patients with chronic hepatitis C:
detection and significance. Semin Liver Dis 2000;20:47–55.
13. Bravo AA, Sheth SG, Chopra S. Liver biopsy. N Engl J Med 2001;344:495–500.
14. Regev A, Berho M, Jeffers LJ, et al. Sampling error and intraobserver variation in liver
biopsy in patients with chronic HCV infection. Am J Gastroenterol 2002;97:2614–2618.
15. Bedossa P, Dargere D, Paradis V. Sampling variability of liver fibrosis in chronic hepatitis C.
Hepatology 2003;38:1449–1457.
16. Sarvazyan A, Hall TJ, Urban MW, et al. An overview of elastography −An emerging branch
of medical imaging. Curr Med Imaging Rev 2011;7:255–282.
69
17. Albrecht T, Blomley MJ, Cosgrove DO, et al. Non-invasive diagnosis of hepatic cirrhosis by
transit-time analysis of an ultrasound contrast agent. Lancet 1999;353:1579–1583.
18. Blomley MJ, Lim AK, Harvey CJ, et al. Liver microbubble transit time compared with
histology and Child-Pugh score in diffuse liver disease: a cross sectional study. Gut
2003;52:1188–1193.
19. Lim AK, Taylor-Robinson SD, Patel N, et al. Hepatic vein transit times using a microbubble
agent can predict disease severity non-invasively in patients with hepatitis C. Gut
2005;54:128–133.
20. Kim MY, Suk KT, Baik SK, et al. Hepatic vein arrival time as assessed by contrast
enhanced ultrasonography is useful for the assessment of portal hypertension in
compensated cirrhosis. Hepatology 2012;56:1053–1062.
21. Kleber G, Steudel N, Behrmann C, et al. Hepatic arterial flow volume and reserve in patients
with cirrhosis: use of intra-arterial Doppler and adenosine infusion. Gastroenterology
1999;423 116:906–914.
22. Rocheleau B, Ethier C, Houle R, et al. Hepatic artery buffer response following left portal
vein ligation: its role in liver tissue homeostasis. Am J Physiol 1999;277:G1000–G1007.
23. Leen E, Goldberg JA, Anderson J, et al. Hepatic perfusion changes in patients 427 with liver
metastases: comparison with those patients with cirrhosis. Gut 1993;34:554–557.
24. Lautt WW. Mechanism and role of intrinsic regulation of hepatic arterial blood flow: hepatic
arterial buffer response. Am J Physiol 1985;249:G549–G556.

70
25. Sugimoto H, Kaneko T, Hirota M, et al. Earlier hepatic vein transit-time measured by
contrast ultrasonography reflects intrahepatic hemodynamic changes accompanying cirrhosis.
J Hepatol 2002;37:578–583.
26. Goto Y, Okuda K, Akasu G, et al. Noninvasive diagnosis of compensated cirrhosis using an
analysis of the time intensity curve portal vein slope gradient on contrast-enhanced
ultrasonography. Surg Today 2014;44:1496–1505.
27. Nakamura K, Sasaki N, Murakami M, et al. Contrast-enhanced ultrasonography for
characterization of focal splenic lesions in dogs. J Vet Intern Med 2010;24:1290–1297.
28. Lim SY, Nakamura K, Morishita K, et al. Quantitative contrast-enhanced ultrasonographic
assessment of naturally occurring pancreatitis in dogs. J Vet Intern Med 2015;29:71–78.
29. Choi SY, Jeong WC, Lee YW, et al. Contrast enhanced ultrasonography of kidney in
conscious and anesthetized Beagle dogs. J Vet Med Sci 2016;78:239–244.
30. Zhai L, Qiu LY, Zu Y, et al. Contrast-enhanced ultrasound for quantitative assessment of
portal pressure in canine liver fibrosis. World J Gastroenterol 2015;21:4509–4516.
31. Liu H, Liu J, Zhang Y, et al. Contrast-enhanced ultrasound and computerized tomography
perfusion imaging of a liver fibrosis-early cirrhosis in dogs. J Gastroenterol Hepatol
2016;31:1604-1610.
32. Watanabe R, Matsumura M, Chen CJ, et al. Characterization of tumor imaging with
microbubble-based ultrasound contrast agent, sonazoid, in rabbit liver. Biol Pharm Bull
2005;28:972–977.
71
33. Ilkiw JE. Other potentially useful new injectable anesthetic agents. Vet Clin North Am
Small Anim Pract 1992;22:281–289.
34. Lim SY, Nakamura K, Morishita K, et al. Qualitative and quantitative contrast enhanced
ultrasonography of the pancreas using bolus injection and continuous infusion methods in
normal dogs. J Vet Med Sci 2013;75:1601–1607.
35. Nyman HT, Kristensen AT, Kjelgaard-Hansen M, et al. Contrast-enhanced ultrasonography
in normal canine liver. Evaluation of imaging and safety parameters. Vet Radiol Ultrasound
2005;46:243–250.
36. Wouters PF, Van de Velde MA, Marcus MA, et al. Hemodynamic changes during induction
of anesthesia with eltanolone and propofol in dogs. Anesth Analg 1995;81:125–131.
37. Buob S, Johnston AN, Webster CR. Portal hypertension: pathophysiology, diagnosis, and
treatment. J Vet Intern Med 2011;25:169–186.
38. Zoli M, Magalotti D, Bianchi G, et al. Functional hepatic flow and Doppler-assessed total
hepatic flow in control subjects and in patients with cirrhosis. J Hepatol 1995;23:129–134.
39. Ohnishi K, Chin N, Saito M, et al. Portographic opacification of hepatic veins and
anomalous anastomoses between the portal and hepatic veins in cirrhosis—indication of
extensive intrahepatic shunts. Am J Gastroenterol 1986;81:975–978.
40. Agusti AGN, Rosa J, Bosch J, et al. The lung in patients with cirrhosis. J Hepatol
1990;10:251–257.
41. Kontos HA, Shapiro W, Mauck HP, et al. General and regional circulatory alterations in
cirrhosis of the liver. Am J Med 1964;37:526–535.

72
42. Jin W, Deng L, Zhang Q, et al. A canine portal hypertension model induced by intra-portal
administration of Sephadex microsphere. J Gastroenterol Hepatol 2010;25:778–785.
43. Jaffe V, Alexander B, Mathie RT. Intrahepatic portal occlusion by microspheres: a new
model of portal hypertension in the rat. Gut 1994;35:815–818.
44. Li X, Benjamin IS, Naftalin R, et al. Location and function of intrahepatic shunts in
anaesthetised rats. Gut 2003;52:1339–1346.
45. Ridolfi F, Abbattista T, Busilacchi P, et al. Contrast-enhanced ultrasound evaluation of
hepatic microvascular changes in liver diseases. World J Gastroenterol 2012;18:5225–5230.
46. Stockham SL, Scott MA. Liver function. In: Stockham SL, Scott MA eds. Fundamentals of
veterinary clinical pathology. 2nd ed. Ames, Iowa: Blackwell Publishing, 2008;675–706.
47. Ishibashi H, Maruyama H, Takahashi M, et al. Assessment of hepatic fibrosis by analysis of
the dynamic behaviour of microbubbles during contrast ultrasonography. Liver Int
2010;30:1355–1363.
48. Tang A, Kim TK, Heathcote J, et al. Does hepatic vein transit time performed with contrast-
enhanced ultrasound predict the severity of hepatic fibrosis? Ultrasound Med Biol
2011;37:1963–1969.
49. Blomley MJK, Albrecht T, Cosgrove DO, et al. Liver vascular transit time analysed with
dynamic hepatic venography with bolus injections of an US contrast agent: early experience
in seven patients with metastases. Radiology 1998;209:862–866.

73
50. Tsuneyama K, Ohba K, Zen Y, et al. A comparative histological and morphometric study of
vascular changes in idiopathic portal hypertension and alcohol fibrosis/cirrhosis.
Histopathology 2003;43:55–61.
51. Webster CRL. Clinical signs, and physical findings in hepatobiliary disease. In: Ettinger SJ,
Feldman EC, eds. Textbook of veterinary internal medicine. 7th ed. St Louis: Saunders
Elsevier, 2010;1612–1625.
52. Adeva MM, Souto G, Blanco N, et al. Ammonium metabolism in humans. Metabolism
2012;209:1495–1511.
53. Council for International Organizations of Medical Sciences/ International Council for
Laboratory Animal Science (CIOMS/ ICLAS) website. International guiding principles for
biomedical research involving animals. Available at: www.cioms.ch/index.php/12-
newsflash/326-cioms-and-iclas-release-the-new-international-guiding-principles-for-
biomedical-research-involving-animals. Accessed Mar 3, 2015.
54. Morishita K, Hiramoto A, Osuga T, et al. Contrast-enhanced ultrasonography of the hepatic
vein in normal dogs. J Vet Med Sci 2016;78:1753–1758.
55. Morishita K, Hiramoto A, Osuga T, et al. Preliminary assessment of contrast-enhanced
ultrasonography of the hepatic vein for detection of hemodynamic changes associated with
experimentally induced portal hypertension in dogs. Am J Vet Res (in press).
56. Kraun MB, Nelson LL, Hauptman JG, et al. Analysis of the relationship of extrahepatic
portosystemic shunt morphology with clinical variables in dogs: 53 cases (2009-2012). J Am
Vet Med Assoc 2014;245:540–549.

74
57. Bertolini G. Acquired portal collateral circulation in the dog and cat. Vet Radiol Ultrasound
2010;51:25–33.
58. Toft KG, Hustvedt SO, Hals PA, et al. Disposition of perfluorobutane in rats after
intravenous injection of Sonazoid. Ultrasound Med Biol 2006;32:107–114.
59. Liu GJ, Ji Q, Moriyasu F, et al. Value of contrast-enhanced ultrasound using perflubutane
microbubbles for diagnosing liver fibrosis and cirrhosis in rats. Ultrasound Med Biol
2013;39:2158–2165.
60. Iijima H, Moriyasu F, Tsuchiya K, et al. Decrease in accumulation of ultrasound contrast
microbubbles in non-alcoholic steatohepatitis. Hepatol Res 2007;37:722–730.
61. Yoshikawa S, Iijima H, Saito M, et al. Crucial role of impaired Kupffer cell phagocytosis on
the decreased Sonazoid-enhanced echogenicity in a liver of a nonalchoholic steatohepatitis
rat model. Hepatol Res 2010;40:823–831.
62. Tsujimoto T, Kawaratani H, Kitazawa T, et al. Decreased phagocytic activity of Kupffer
cells in a rat nonalcoholic steatohepatitis model. World J Gastroenterol 2008;14:6036–6043.

75
ACKNOWLEDGEMENTS
The PhD study is not one that can be achieved alone. Along the way, countless people have
supported and encouraged me.
First, I would like to show my greatest appreciation to my supervisor, Dr. Mitsuyoshi
Takiguchi (Graduate School of Veterinary Medicine, Hokkaido University) for giving me the
opportunities to achieve my goals and aspirations, and for his constant encouragement, support,
and guidance.
I wish to also thank Drs. Mutsumi Inaba (Graduate School of Veterinary Medicine, Hokkaido
University), Satoshi Takagi (Graduate School of Veterinary Medicine, Hokkaido University),
and Hiroshi Ohta (Graduate School of Veterinary Medicine, Hokkaido University) for their time
and effort to provide priceless advice and critical comments into making this thesis a better one.
I am also greatly indebted to my senior, Dr. Kensuke Nakamura (Graduate School of
Veterinary Medicine, Hokkaido University) for his insightful comments and supports. Without
his guidance and persistent help, this thesis would not have been possible.
I also wish to thank Drs. Masahiro Yamasaki (Faculty of Agriculture, Iwate University), Yuki
Hoshino (Graduate School of Veterinary Medicine, Hokkaido University), Takaharu Itami
(Graduate School of Veterinary Medicine, Hokkaido University), Kiwamu Hanazono (Graduate
School of Veterinary Medicine, Hokkaido University), and Noboru Sasaki (Graduate School of
Veterinary Medicine, Hokkaido University) for their constant support and assistant. My gratitude

76
also extends to my students and interns, especially Akira Hiramoto, Asuka Michishita, Tastuyuki
Osuga, and Lim Sue Yee for their great help.
I would like to express my gratitude to all sweet dogs; Gabu, Pero, Yuzu, Kosho, Iyo, Natsu,
Uzura, Mayuge, and Vera for their contributions to my PhD study.
My utmost gratitude goes to my family and to my steady who always pray for my success.
Last but not least, to Tetsuya Shimoda (Sanyo Animal Medical Center), who always believe in
my potential.