Embed Size (px)
Citation preview
This article was downloaded by: [Monash University Library]On: 07 December 2014, At: 03:19Publisher: Taylor & FrancisInforma Ltd Registered in England and Wales Registered Number: 1072954 Registeredoffice: Mortimer House, 37-41 Mortimer Street, London W1T 3JH, UK
Journal of Liquid Chromatography &Related TechnologiesPublication details, including instructions for authors andsubscription information:http://www.tandfonline.com/loi/ljlc20
APPLICATION OF CHEMOMETRICMETHODS IN EXAMINING OFTHE RETENTION BEHAVIOR ANDLIPOPHILICITY OF NEWLY SYNTHESIZEDCYANOACETAMIDE DERIVATIVESGyöngyi Vastag a , Suzana Apostolov a , Jelena Nakomčić a & Borko
Matijević aa Department of Chemistry, Biochemistry and EnvironmentalProtection, Faculty of Sciences , University of Novi Sad , Novi Sad ,SerbiaAccepted author version posted online: 21 Nov 2013.Publishedonline: 20 May 2014.
To cite this article: Gyöngyi Vastag , Suzana Apostolov , Jelena Nakomčić & Borko Matijević(2014) APPLICATION OF CHEMOMETRIC METHODS IN EXAMINING OF THE RETENTION BEHAVIORAND LIPOPHILICITY OF NEWLY SYNTHESIZED CYANOACETAMIDE DERIVATIVES, Journal of LiquidChromatography & Related Technologies, 37:17, 2529-2545, DOI: 10.1080/10826076.2013.850723
To link to this article: http://dx.doi.org/10.1080/10826076.2013.850723
PLEASE SCROLL DOWN FOR ARTICLE
Taylor & Francis makes every effort to ensure the accuracy of all the information (the“Content”) contained in the publications on our platform. However, Taylor & Francis,our agents, and our licensors make no representations or warranties whatsoever as tothe accuracy, completeness, or suitability for any purpose of the Content. Any opinionsand views expressed in this publication are the opinions and views of the authors,and are not the views of or endorsed by Taylor & Francis. The accuracy of the Contentshould not be relied upon and should be independently verified with primary sourcesof information. Taylor and Francis shall not be liable for any losses, actions, claims,proceedings, demands, costs, expenses, damages, and other liabilities whatsoever orhowsoever caused arising directly or indirectly in connection with, in relation to or arisingout of the use of the Content.
This article may be used for research, teaching, and private study purposes. Anysubstantial or systematic reproduction, redistribution, reselling, loan, sub-licensing,

systematic supply, or distribution in any form to anyone is expressly forbidden. Terms &Conditions of access and use can be found at http://www.tandfonline.com/page/terms-and-conditions
Dow
nloa
ded
by [
Mon
ash
Uni
vers
ity L
ibra
ry]
at 0
3:19
07
Dec
embe
r 20
14
APPLICATION OF CHEMOMETRIC METHODS IN EXAMINING OFTHE RETENTION BEHAVIOR AND LIPOPHILICITY OF NEWLYSYNTHESIZED CYANOACETAMIDE DERIVATIVES
Gyongyi Vastag, Suzana Apostolov, Jelena Nakomcic, andBorko Matijevic
Department of Chemistry, Biochemistry and Environmental Protection,Faculty of Sciences, University of Novi Sad, Novi Sad, Serbia
& Lipophilicity, as an important molecule’s property, was analyzed on a series of newlysynthesized N-(4-phenylmonosubstituted) cyanoacetamides, by applying the reversed phase thin-layer chromatography (RP-TLC), RP TLC18, in the presence of different organic modifiers in vari-ous concentrations (ethanol, n-propanol, acetone and tetrahydrofuran) and by mathematicalmethod, using different software packages. The effect of the chemical structure as well as influenceof the applied organic solvents on retention behavior of investigated derivatives was studied. Usingdifferent chemometric methods as linear regression analysis, principal component analysis and sumof ranking differences, experimentally determined lipophilicity of investigated compounds (chroma-tographic retention constant RM
0) was correlated with partition coefficients, log P, as a standardmeasure of lipophilicity, calculated by applying different computational techniques. The obtainedresults indicate that all used methods gave approximately similar grouping of the studied lipophilicparameters and demonstrated that the chromatographic retention data are in a good agreementwith standard measure of lipophilicity. This fact confirm that chromatographic retention parameterof the investigated N-(4-phenylmonosubstituted) cyanoacetamides obtained by RP-TLC could beused for the description of their lipophilicity.
Keywords lipophilicity, log P, N-(4-phenylmonosubstituted) cyanoacetamides, principalcomponent analysis, ranking, RP-TLC
INTRODUCTION
In the contemporary science, a large number of compounds have beensynthesized, among which many show different biological activity. Deriva-tives of amides have become a very interesting group of molecules becauseof a broad spectrum of their biological and pharmacological activities.
Address correspondence to Gyongyi Vastag, Department of Chemistry, Biochemistry andEnvironmental Protection, Faculty of Sciences, University of Novi Sad, Trg D. Obradovica 3, 21000 NoviSad, Serbia. E-mail: [email protected]
Journal of Liquid Chromatography & Related Technologies, 37:2529–2545, 2014Copyright # Taylor & Francis Group, LLCISSN: 1082-6076 print/1520-572X onlineDOI: 10.1080/10826076.2013.850723
Journal of Liquid Chromatography & Related Technologies, 37:2529–2545, 2014Copyright # Taylor & Francis Group, LLCISSN: 1082-6076 print/1520-572X onlineDOI: 10.1080/10826076.2013.850723
Dow
nloa
ded
by [
Mon
ash
Uni
vers
ity L
ibra
ry]
at 0
3:19
07
Dec
embe
r 20
14
Acetanilide was the first-known derivative of phenylacetamide which hadantipyretic and analgesic properties, and soon began to be used in medi-cine under the name Antifebrin.[1] Many derivatives of acetamides evinceantimicrobial activity[2–5] and fungicidal activity.[6–10] Also, recent resear-ches have shown their potential analgesic[11,12] and antileishmanialactivity.[13] Big attention in researches appeared in confirming antitumorproperties of some substituted derivatives of acetamides,[14] and it has beenproved that, some derivatives of benzylsulfonyl-N-phenylacetamide slow thereproduction of cancerous cells and cause decreasing of tumor mass.[15]
Also, some derivatives of phenylacetamide successfully applied as anticon-vulsants,[16] antipsychotics[17] and antituberculotics.[18] For some, it wasconfirmed that they were acting as a neuro-protectors,[19] and some canbe used as medicaments for treatment of cardiac arrhythmias.[20] It was dis-covered recently that acetamide derivative acts as a potent inhibitor ofmeasles virus,[21] and the other shows inotropic effect.[22] One of themedical innovation in the design of drugs which is examined exhaustivelyand comprehensively is that [carbonyl-11C]2-(2-benzoylphenoxy)-N-phenylacetamide belongs to a class of new anti-HIV drugs that do not showstrong toxicity.[23] In most of the cases, type of activities of phenylamides(biological activity) and intensity of their activity depending significantlyon the nature of substituents attached to the basic molecule.[24]
In the modern design of drugs, knowing relationship between activity,structure and physicochemical properties of a potential active compoundprovides the ability to identify potential biological active substances. Poten-tial biological activity of these molecules is reflected in characteristics suchas their absorption, distribution, effects on target cells, metabolism, excre-tion, and toxicity. Quantitative structure–activity relationship (QSAR),quantitative structure–property relationship (QSPR) and quantitativestructure–retention relationship (QSRR) models can answer on this req-uest. These models reduce experimental work by facilitating the selectionof structural parameters which are important for the behavior of thepossible drug.
One of the most important physicochemical parameter of molecule,which ordered the activity of bioactive compounds, is lipophilicity. Lipophi-licity of molecule determines its transport through a biological system. Itcan affect the interaction between compound and receptor or biomacro-molecule. Usually, the lipophilicity can be quantitatively characterized aslog P (the logarithm of the ratio of the concentrations of solute in a satu-rated 1-octanol-water system).[25] This parameter is often used as descriptorin structure–activity relationship studies.[26] In addition, lipophilicity ofmolecules can be determined applying reversed-phase thin-layer chro-matography (RP-TLC).[27–29] Experimentally obtained values ofchromatographic retention parameter, R0
M, by RP-TLC are widely used as
2530 G. Vastag et al.
Dow
nloa
ded
by [
Mon
ash
Uni
vers
ity L
ibra
ry]
at 0
3:19
07
Dec
embe
r 20
14

measure of lipophilicity, instead of reference lipophilicity parameter,log P.[30]
Aim of this study was analyzing the chromatographic behavior of newlysynthesized components using RP-TLC and determining influence of vari-ous factors (used organic modifier and effect of substituents of tested com-pounds) on their retention. In order to examine and visualize similaritiesand differences among the molecules and between chromatographicallyand mathematically obtained lipophilicity, principal component analysis(PCA) and sum of ranking difference (SRD) were used.
EXPERIMENTAL METHOD
Chemicals and Substances
The structures of the investigated compounds are presented in Table 1.Synthesis of these compounds is previously published in the literature.[31]
LC grade organic modifiers (J.T. Baker, Deventer, the Netherlands) andfiltered bi-distilled water were used as mobile phase mixtures in thin-layerchromatography (TLC) analysis.
Chromatographic Condition
In TLC measurements, RP-TLC C18=UV254 plates (Macherey-Nagel,Duren, Germany) were used. Solutions for chromatographic investigations
TABLE 1 Structures of the Investigated N-(4-Phenylmonosubstituted) Cyanoacetamides
Compound –R Molecular Weight
1. �H 160.172. �CH3 174.203. �I 286.074. �Br 239.075. �NO2 205.176. �OH 176.177. �COOH 204.188. �COCH3 202.219. �C2H5 188.23
Application of Chemometric Methods 2531
Dow
nloa
ded
by [
Mon
ash
Uni
vers
ity L
ibra
ry]
at 0
3:19
07
Dec
embe
r 20
14

were prepared by dissolving 2 mg mL�1 of compounds in ethanol. On theplates were spotted aliquots of 0.2mL of freshly prepared solutions. Theplates were developed in normal unsaturated chambers at room tempera-ture by ascending technique with aqueous solutions of four organicmodifiers: methanol (u¼ 0.34–0.56, v=v), ethanol (u¼ 0.32–0.50, v=v),acetone (u¼ 0.36–0.52, v=v), tetrahydrofuran (u¼ 0.40–0.56, v=v). Afterdevelopment and drying, plates were examined under a UV light atk¼ 254 nm as dark spots. At least three chromatograms were developed foreach combination of solvent–solute and the average Rf values were calculated.
Software Calculation and Analysis of Results
The obtained experimental data were processed by a computer softwareorigin. version 6.1. Standard lipophilicity values, log P, were calculatedusing virtual Computational Chemistry Laboratory, VCCLAB.[32] The PCAprocedures were performed by Statistica v.12 software (StatSoft Inc., Tulsa,OK, USA). After applying PCA, the data were treated using SRD.[33]
RESULTS AND DISCUSSION
Retention Behavior of the Investigated CyanoacetamideDerivatives
A group of newly synthesized N-(4-phenylmonosubstituted) cyanoaceta-mides was subjected to chemical examination of their retention behaviorand evaluation of their lipophilicity and thus the potential biologicalactivity. Retention behavior is investigated in four different organic modi-fiers. Two protic solvents (methanol and ethanol) and two aprotic solvents(acetone and tetrahydrofuran) were used. The chromatographic retentionbehavior of the investigated cyanoacetamides is presented in Table 2.
Based on the retention data (Table 2), it can be concluded that the nat-ure of the substituent –R in position 4 has a much greater influence thanselected organic solvent on the retention behavior of the compounds.The compounds, which differ by the type of substituent, have differentretention in the same solvent and this could be explained by the influenceof the substituent –R in position 4 on the possibility of molecule to formintermolecular interactions. The obtained results are typical for chromato-graphic retention behavior in reversed phase investigations. Increase non-polarity of substituent –R (�CH3<�C2H5) leads to the greater retentioncompared to non-substituted molecule (compound 1). Also, the presenceof halogen substituents generally increases hydrophobicity of moleculesand thereby intensifies retention in the following sequence: �Br<�I. Thisphenomenon is probably a consequence of the differences in the London
2532 G. Vastag et al.
Dow
nloa
ded
by [
Mon
ash
Uni
vers
ity L
ibra
ry]
at 0
3:19
07
Dec
embe
r 20
14
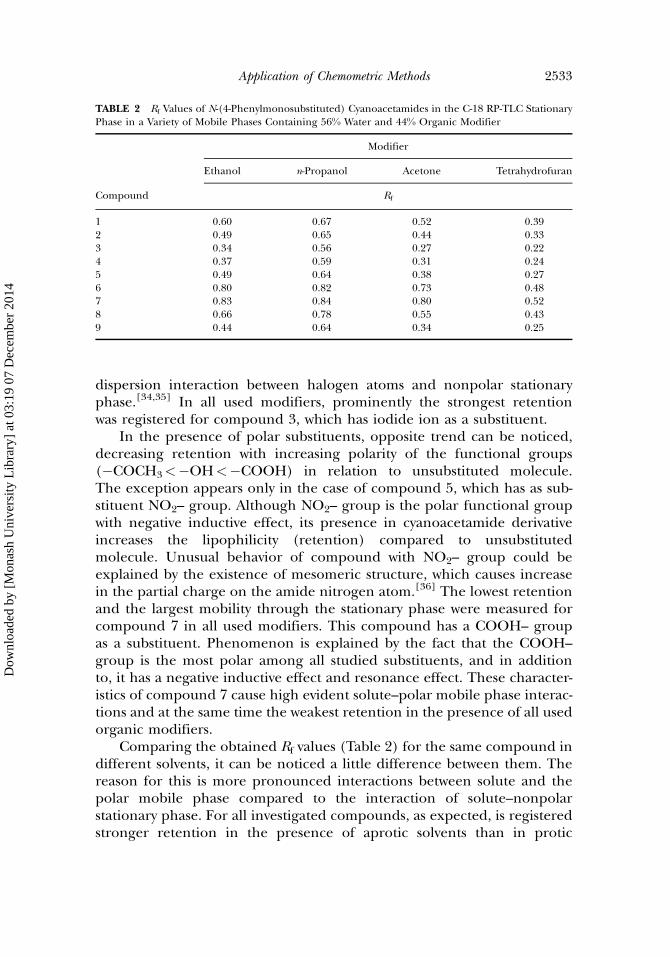
dispersion interaction between halogen atoms and nonpolar stationaryphase.[34,35] In all used modifiers, prominently the strongest retentionwas registered for compound 3, which has iodide ion as a substituent.
In the presence of polar substituents, opposite trend can be noticed,decreasing retention with increasing polarity of the functional groups(�COCH3<�OH<�COOH) in relation to unsubstituted molecule.The exception appears only in the case of compound 5, which has as sub-stituent NO2– group. Although NO2– group is the polar functional groupwith negative inductive effect, its presence in cyanoacetamide derivativeincreases the lipophilicity (retention) compared to unsubstitutedmolecule. Unusual behavior of compound with NO2– group could beexplained by the existence of mesomeric structure, which causes increasein the partial charge on the amide nitrogen atom.[36] The lowest retentionand the largest mobility through the stationary phase were measured forcompound 7 in all used modifiers. This compound has a COOH– groupas a substituent. Phenomenon is explained by the fact that the COOH–group is the most polar among all studied substituents, and in additionto, it has a negative inductive effect and resonance effect. These character-istics of compound 7 cause high evident solute–polar mobile phase interac-tions and at the same time the weakest retention in the presence of all usedorganic modifiers.
Comparing the obtained Rf values (Table 2) for the same compound indifferent solvents, it can be noticed a little difference between them. Thereason for this is more pronounced interactions between solute and thepolar mobile phase compared to the interaction of solute–nonpolarstationary phase. For all investigated compounds, as expected, is registeredstronger retention in the presence of aprotic solvents than in protic
TABLE 2 Rf Values of N-(4-Phenylmonosubstituted) Cyanoacetamides in the C-18 RP-TLC StationaryPhase in a Variety of Mobile Phases Containing 56% Water and 44% Organic Modifier
Compound
Modifier
Ethanol n-Propanol Acetone Tetrahydrofuran
Rf
1 0.60 0.67 0.52 0.392 0.49 0.65 0.44 0.333 0.34 0.56 0.27 0.224 0.37 0.59 0.31 0.245 0.49 0.64 0.38 0.276 0.80 0.82 0.73 0.487 0.83 0.84 0.80 0.528 0.66 0.78 0.55 0.439 0.44 0.64 0.34 0.25
Application of Chemometric Methods 2533
Dow
nloa
ded
by [
Mon
ash
Uni
vers
ity L
ibra
ry]
at 0
3:19
07
Dec
embe
r 20
14
solvents. In aprotic solvents, a stronger retention was registered in tetrahy-drofuran compared to the more polar acetone, while in the case of proticmodifier stronger retention was measured in the presence of ethanol thanin less polar n-propanol.
The influence of the mobile phase on the chromatographic retentionbehavior of newly synthesized derivatives was examined by changing theamount of organic modifier in the mobile phase.
From the experimental Rf values, retention values, RM, were calculatedusing the following equation:
RM ¼ log 1=Rf � 1� �
ð1Þ
Chromatographic retention constants, R0M, of cyanoacetamides were calcu-
lated by extrapolation the obtained RM values to zero concentration oforganic modifier using the following equation:
RM ¼ R0M þ m � u ð2Þ
where u is the volume fraction of the organic solvent in the mobile phase,m is a slope of TLC equation and the retention constant R0
M is the intercept.The value of m corresponds to the specific hydrophobic surface of the stud-ied substance and also can be applied as a measure of lipophilicity.[37]
These equations were applied separately for each modifier and eachcompound. The linear relationships were obtained between retention para-meter and the volume fraction of organic modifier. High values of theregression coefficients, r, confirm that the linear dependences are validin the chosen field of work for all the tested organic modifiers.
Data from Table 3 show that the values of the retention constants, R0M,
although reflecting the retention behavior of the compounds in pure water,however depend on the applied organic solvents.[38] Despite the differ-ences in the values, it can be established a linear relationship betweenthem. Figure 1 shows the relationships between R0
M values obtained inacetone as a solvent and R0
M values for the other used modifiers.Equations of linear dependences between R0
M in acetone and R0M in
other used solvents are presented in Table 4.
Log P Values Calculations
The log P values of investigated compounds were calculated usingvirtual Computational Chemistry Laboratory VCCLAB.[32]
Data presented in Table 5 show that the values of partition coefficient,log P, as a standard measure of lipophilicity of the investigated compounds
2534 G. Vastag et al.
Dow
nloa
ded
by [
Mon
ash
Uni
vers
ity L
ibra
ry]
at 0
3:19
07
Dec
embe
r 20
14
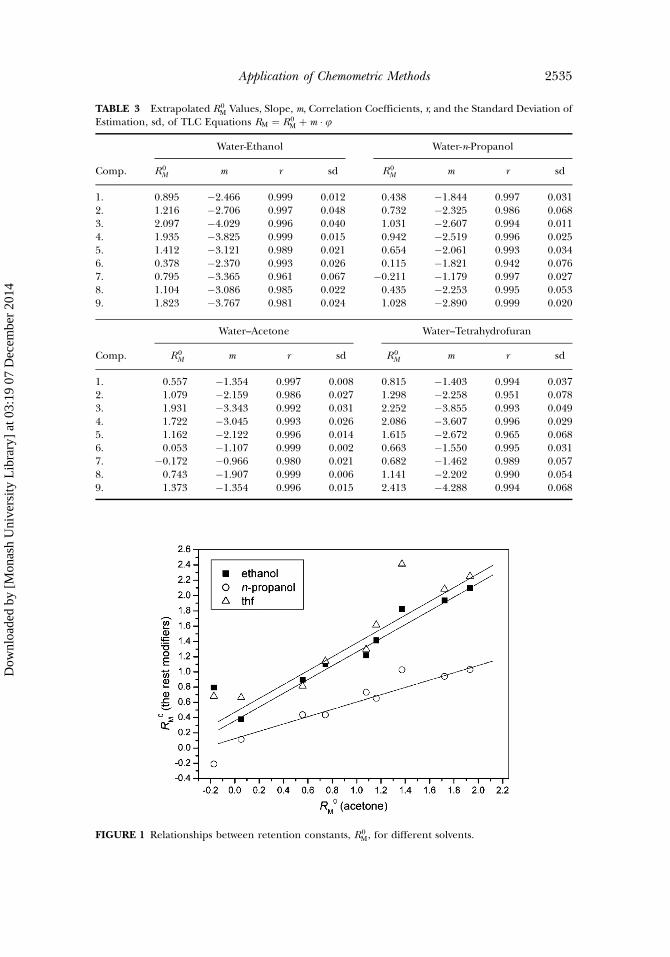
TABLE 3 Extrapolated R0M Values, Slope, m, Correlation Coefficients, r, and the Standard Deviation of
Estimation, sd, of TLC Equations RM ¼ R0M þ m � u
Comp.
Water-Ethanol Water-n-Propanol
R0M m r sd R0
M m r sd
1. 0.895 �2.466 0.999 0.012 0.438 �1.844 0.997 0.0312. 1.216 �2.706 0.997 0.048 0.732 �2.325 0.986 0.0683. 2.097 �4.029 0.996 0.040 1.031 �2.607 0.994 0.0114. 1.935 �3.825 0.999 0.015 0.942 �2.519 0.996 0.0255. 1.412 �3.121 0.989 0.021 0.654 �2.061 0.993 0.0346. 0.378 �2.370 0.993 0.026 0.115 �1.821 0.942 0.0767. 0.795 �3.365 0.961 0.067 �0.211 �1.179 0.997 0.0278. 1.104 �3.086 0.985 0.022 0.435 �2.253 0.995 0.0539. 1.823 �3.767 0.981 0.024 1.028 �2.890 0.999 0.020
Comp.
Water–Acetone Water–Tetrahydrofuran
R0M m r sd R0
M m r sd
1. 0.557 �1.354 0.997 0.008 0.815 �1.403 0.994 0.0372. 1.079 �2.159 0.986 0.027 1.298 �2.258 0.951 0.0783. 1.931 �3.343 0.992 0.031 2.252 �3.855 0.993 0.0494. 1.722 �3.045 0.993 0.026 2.086 �3.607 0.996 0.0295. 1.162 �2.122 0.996 0.014 1.615 �2.672 0.965 0.0686. 0.053 �1.107 0.999 0.002 0.663 �1.550 0.995 0.0317. �0.172 �0.966 0.980 0.021 0.682 �1.462 0.989 0.0578. 0.743 �1.907 0.999 0.006 1.141 �2.202 0.990 0.0549. 1.373 �1.354 0.996 0.015 2.413 �4.288 0.994 0.068
FIGURE 1 Relationships between retention constants, R0M, for different solvents.
Application of Chemometric Methods 2535
Dow
nloa
ded
by [
Mon
ash
Uni
vers
ity L
ibra
ry]
at 0
3:19
07
Dec
embe
r 20
14
differ from each other. This was no surprise, because different algorithmswere used for calculating this parameter.
Correlation Between Retention Constant, RM0, and Standard
Measure of Lipophilicity, log P
Considering that retention constants, R0M, describe total effect of
intermolecular interactions compound–stationary phase and compound–mobile phase, it has been confirmed that this chromatographic parametercan be used to express and determine lipophilicity.[39,40] Based on this,experimentally measured chromatographic retention constant, R0
M, as ameasure of lipophilicity was compared with partition coefficient, log P, asa standard measure of lipophilicity, using classic linear regression analysisand chemometric methods. The chemometric approach has been oftenapplied for obtaining the values of lipophilicity from the chromatographicretention data.[41–45] Among the mathematical models that are used for therecognition and classification of the obtained experimental data and forthe determination of the relationships between them, PCA has a specialsignificance.[46–48]
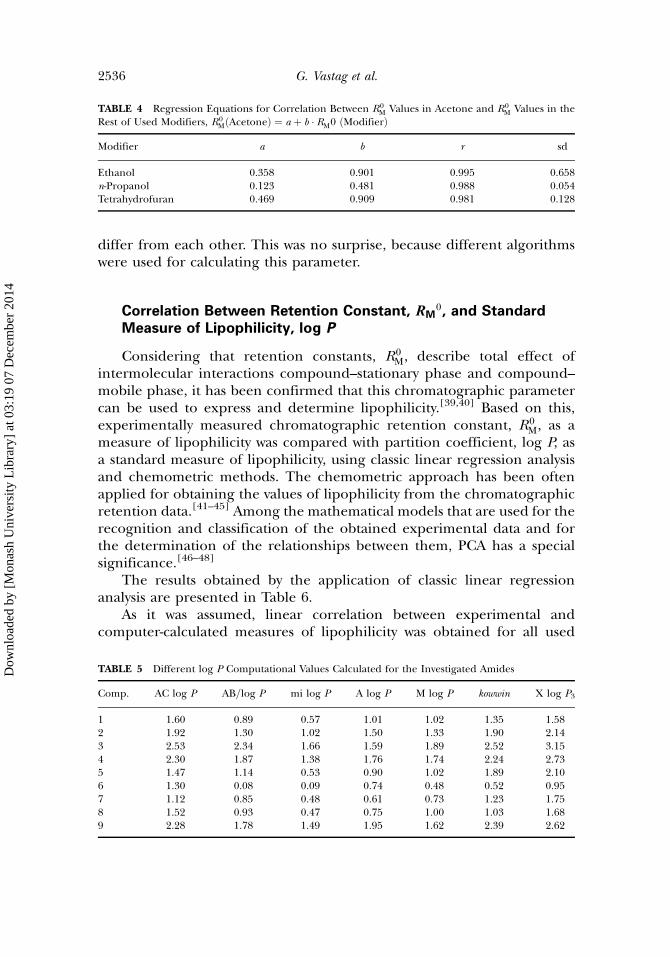
The results obtained by the application of classic linear regressionanalysis are presented in Table 6.
As it was assumed, linear correlation between experimental andcomputer-calculated measures of lipophilicity was obtained for all used
TABLE 5 Different log P Computational Values Calculated for the Investigated Amides
Comp. AC log P AB=log P mi log P A log P M log P kowwin X log P3
1 1.60 0.89 0.57 1.01 1.02 1.35 1.582 1.92 1.30 1.02 1.50 1.33 1.90 2.143 2.53 2.34 1.66 1.59 1.89 2.52 3.154 2.30 1.87 1.38 1.76 1.74 2.24 2.735 1.47 1.14 0.53 0.90 1.02 1.89 2.106 1.30 0.08 0.09 0.74 0.48 0.52 0.957 1.12 0.85 0.48 0.61 0.73 1.23 1.758 1.52 0.93 0.47 0.75 1.00 1.03 1.689 2.28 1.78 1.49 1.95 1.62 2.39 2.62
TABLE 4 Regression Equations for Correlation Between R0M Values in Acetone and R0
M Values in theRest of Used Modifiers, R0
MðAcetoneÞ ¼ a þ b � RM0 ðModifierÞ
Modifier a b r sd
Ethanol 0.358 0.901 0.995 0.658n-Propanol 0.123 0.481 0.988 0.054Tetrahydrofuran 0.469 0.909 0.981 0.128
2536 G. Vastag et al.
Dow
nloa
ded
by [
Mon
ash
Uni
vers
ity L
ibra
ry]
at 0
3:19
07
Dec
embe
r 20
14
organic modifiers. Comparing agreement between retention constant, R0M,
and all software calculated log P values, in all applied modifiers, it can beconcluded that the best correlation was found in n-propanol and the weak-est in a tetrahydrofuran as modifier (Table 6). On the other hand, amongthe all calculated log P values, correlations X log P3 with R0
M have the highestvalue of regression parameter for each used solvent and A log P the least.
Besides classical correlation of these two lipophilicity parameters, theyare compared using two chemometric methods, PCA and SRD.
The data matrix performed in PCA consisted of rows (cases) thatcorrespond to the cyanoacetamide derivatives and columns (variables) corre-spond to the lipophilicity calculated in different ways. PCA was applying afterstandardization. In standardization, all values of selected variables arereplaced by standardized values, which are computed as follows: the differ-ence between the raw score and the mean is divided with standard deviationof each column. The PCA decomposes the original retention data matrix intoseveral products of multiplication into loading (retention data) and score(investigated compounds) vectors,[49] whereby new variables the so-calledprincipal components, PC, are obtained. The first principal component(PC1) should account for a maximum of the total variance, the second PCshould be uncorrelated with the first one and should account for a maximumof residual variance, and so on until the total variance is accounted for. PCAprovides reduction of the dimensionality and elimination of the redundancyfrom the data by recognizing the basic components.
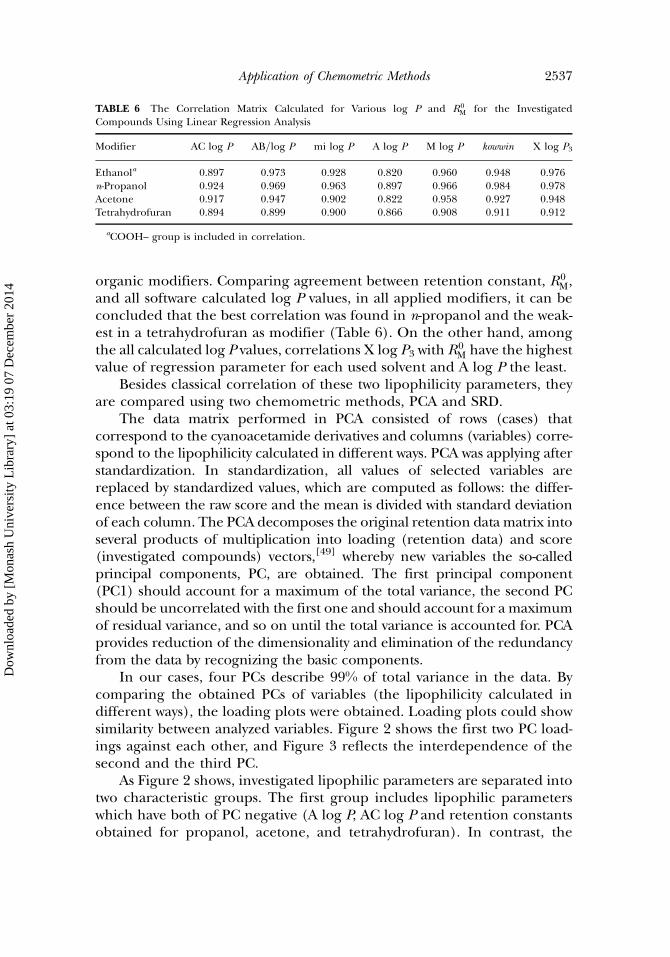
In our cases, four PCs describe 99% of total variance in the data. Bycomparing the obtained PCs of variables (the lipophilicity calculated indifferent ways), the loading plots were obtained. Loading plots could showsimilarity between analyzed variables. Figure 2 shows the first two PC load-ings against each other, and Figure 3 reflects the interdependence of thesecond and the third PC.
As Figure 2 shows, investigated lipophilic parameters are separated intotwo characteristic groups. The first group includes lipophilic parameterswhich have both of PC negative (A log P, AC log P and retention constantsobtained for propanol, acetone, and tetrahydrofuran). In contrast, the
TABLE 6 The Correlation Matrix Calculated for Various log P and R0M for the Investigated
Compounds Using Linear Regression Analysis
Modifier AC log P AB=log P mi log P A log P M log P kowwin X log P3
Ethanola 0.897 0.973 0.928 0.820 0.960 0.948 0.976n-Propanol 0.924 0.969 0.963 0.897 0.966 0.984 0.978Acetone 0.917 0.947 0.902 0.822 0.958 0.927 0.948Tetrahydrofuran 0.894 0.899 0.900 0.866 0.908 0.911 0.912
aCOOH– group is included in correlation.
Application of Chemometric Methods 2537
Dow
nloa
ded
by [
Mon
ash
Uni
vers
ity L
ibra
ry]
at 0
3:19
07
Dec
embe
r 20
14
second group is characterized by the negative values of PC1 and positivevalues of PC2. The second group contains most of the log P values (Mlog P, X log P3, mi log P, AB log P, and kowwin) and retention constantsobtained for ethanol. This fact, that retention constants and partitioncoefficients have similar PC1 indicates that these parameters of lipophilicityare indeed similar to each other regardless they are determined by twocompletely different methods. If only experimental data are compared,ethanol appears as outliners.
FIGURE 3 Loading plots as a result of PC2 versus PC3.
FIGURE 2 Loading plots as a result of PC1 versus PC2.
2538 G. Vastag et al.
Dow
nloa
ded
by [
Mon
ash
Uni
vers
ity L
ibra
ry]
at 0
3:19
07
Dec
embe
r 20
14
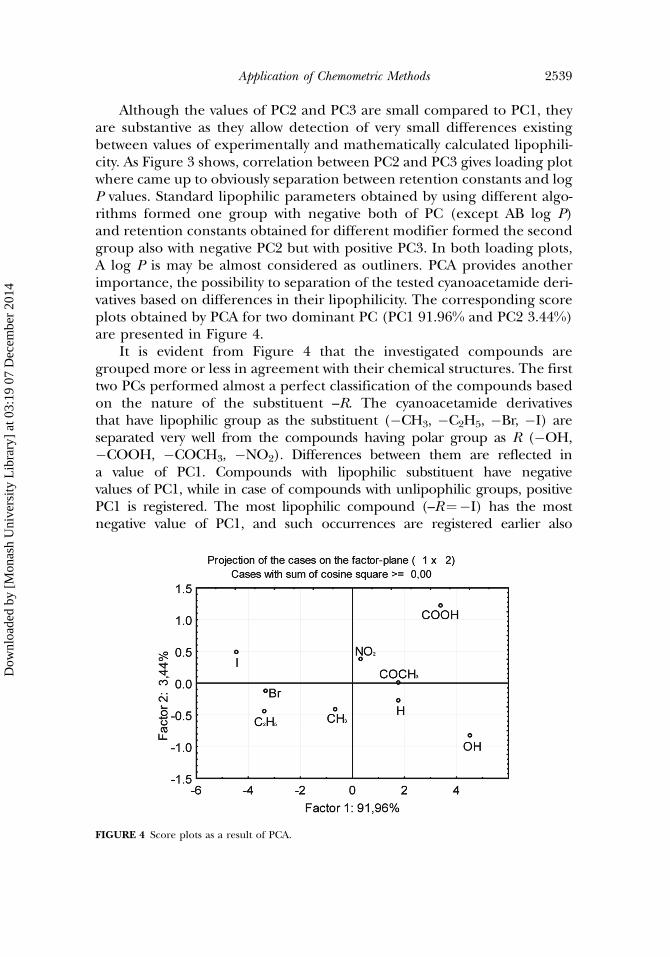
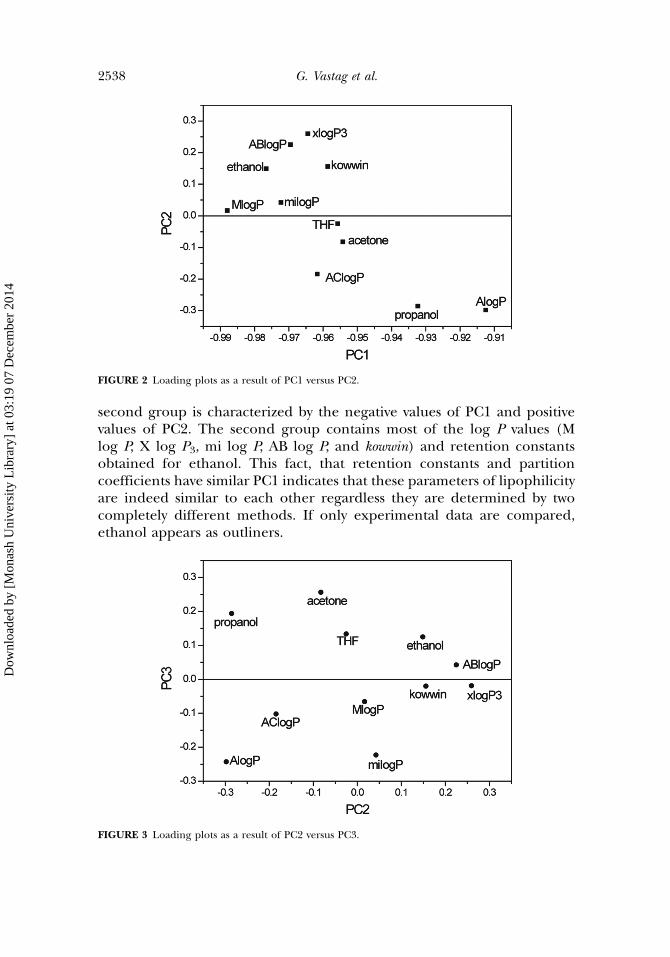
Although the values of PC2 and PC3 are small compared to PC1, theyare substantive as they allow detection of very small differences existingbetween values of experimentally and mathematically calculated lipophili-city. As Figure 3 shows, correlation between PC2 and PC3 gives loading plotwhere came up to obviously separation between retention constants and logP values. Standard lipophilic parameters obtained by using different algo-rithms formed one group with negative both of PC (except AB log P)and retention constants obtained for different modifier formed the secondgroup also with negative PC2 but with positive PC3. In both loading plots,A log P is may be almost considered as outliners. PCA provides anotherimportance, the possibility to separation of the tested cyanoacetamide deri-vatives based on differences in their lipophilicity. The corresponding scoreplots obtained by PCA for two dominant PC (PC1 91.96% and PC2 3.44%)are presented in Figure 4.
It is evident from Figure 4 that the investigated compounds aregrouped more or less in agreement with their chemical structures. The firsttwo PCs performed almost a perfect classification of the compounds basedon the nature of the substituent –R. The cyanoacetamide derivativesthat have lipophilic group as the substituent (�CH3, �C2H5, �Br, �I) areseparated very well from the compounds having polar group as R (�OH,�COOH, �COCH3, �NO2). Differences between them are reflected ina value of PC1. Compounds with lipophilic substituent have negativevalues of PC1, while in case of compounds with unlipophilic groups, positivePC1 is registered. The most lipophilic compound (–R¼�I) has the mostnegative value of PC1, and such occurrences are registered earlier also
FIGURE 4 Score plots as a result of PCA.
Application of Chemometric Methods 2539
Dow
nloa
ded
by [
Mon
ash
Uni
vers
ity L
ibra
ry]
at 0
3:19
07
Dec
embe
r 20
14
in case of phenylacetamide derivatives.[50] The most positive PC1 wascalculated in case of compound 6 (–R¼�OH).
It can be noticed that by using PCA analysis, better separation ofcyanoacetamides was achieved compared to the method which was carriedout on the basis of Rf values that did not differ polar NO2– group.
Because of the small number of the investigated compounds, it cannotbe registered subtler separation between them.
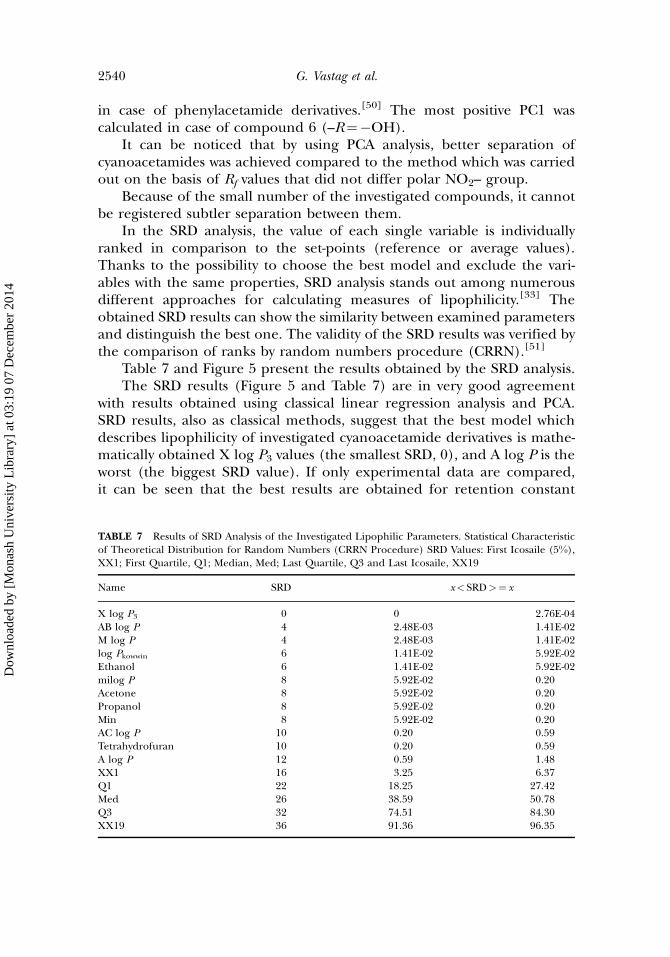
In the SRD analysis, the value of each single variable is individuallyranked in comparison to the set-points (reference or average values).Thanks to the possibility to choose the best model and exclude the vari-ables with the same properties, SRD analysis stands out among numerousdifferent approaches for calculating measures of lipophilicity.[33] Theobtained SRD results can show the similarity between examined parametersand distinguish the best one. The validity of the SRD results was verified bythe comparison of ranks by random numbers procedure (CRRN).[51]
Table 7 and Figure 5 present the results obtained by the SRD analysis.The SRD results (Figure 5 and Table 7) are in very good agreement
with results obtained using classical linear regression analysis and PCA.SRD results, also as classical methods, suggest that the best model whichdescribes lipophilicity of investigated cyanoacetamide derivatives is mathe-matically obtained X log P3 values (the smallest SRD, 0), and A log P is theworst (the biggest SRD value). If only experimental data are compared,it can be seen that the best results are obtained for retention constant
TABLE 7 Results of SRD Analysis of the Investigated Lipophilic Parameters. Statistical Characteristicof Theoretical Distribution for Random Numbers (CRRN Procedure) SRD Values: First Icosaile (5%),XX1; First Quartile, Q1; Median, Med; Last Quartile, Q3 and Last Icosaile, XX19
Name SRD x< SRD>¼ x
X log P3 0 0 2.76E-04AB log P 4 2.48E-03 1.41E-02M log P 4 2.48E-03 1.41E-02log Pkowwin 6 1.41E-02 5.92E-02Ethanol 6 1.41E-02 5.92E-02milog P 8 5.92E-02 0.20Acetone 8 5.92E-02 0.20Propanol 8 5.92E-02 0.20Min 8 5.92E-02 0.20AC log P 10 0.20 0.59Tetrahydrofuran 10 0.20 0.59A log P 12 0.59 1.48XX1 16 3.25 6.37Q1 22 18.25 27.42Med 26 38.59 50.78Q3 32 74.51 84.30XX19 36 91.36 96.35
2540 G. Vastag et al.
Dow
nloa
ded
by [
Mon
ash
Uni
vers
ity L
ibra
ry]
at 0
3:19
07
Dec
embe
r 20
14
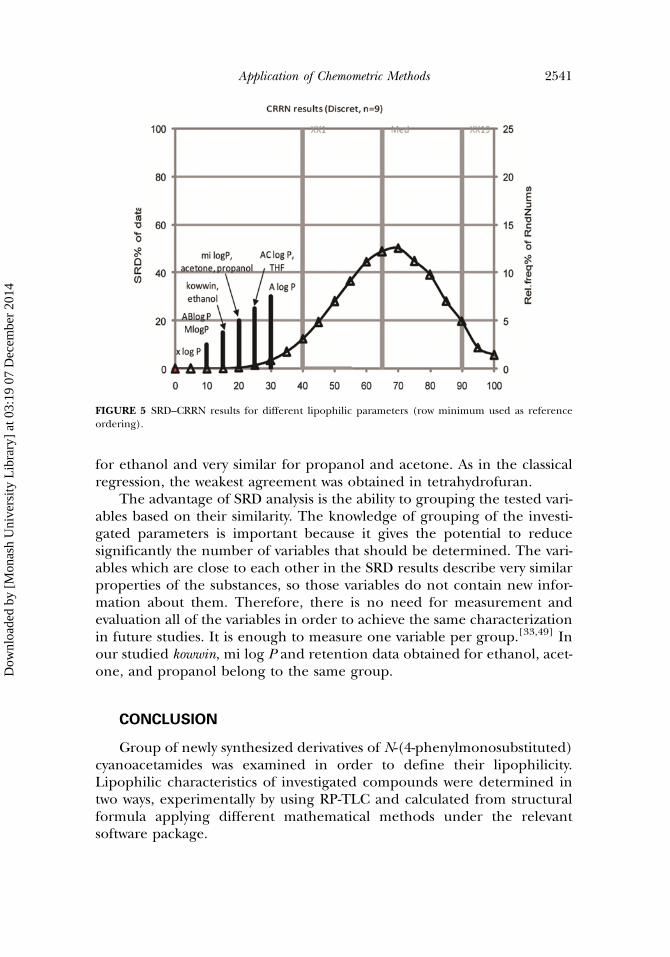
for ethanol and very similar for propanol and acetone. As in the classicalregression, the weakest agreement was obtained in tetrahydrofuran.
The advantage of SRD analysis is the ability to grouping the tested vari-ables based on their similarity. The knowledge of grouping of the investi-gated parameters is important because it gives the potential to reducesignificantly the number of variables that should be determined. The vari-ables which are close to each other in the SRD results describe very similarproperties of the substances, so those variables do not contain new infor-mation about them. Therefore, there is no need for measurement andevaluation all of the variables in order to achieve the same characterizationin future studies. It is enough to measure one variable per group.[33,49] Inour studied kowwin, mi log P and retention data obtained for ethanol, acet-one, and propanol belong to the same group.
CONCLUSION
Group of newly synthesized derivatives of N-(4-phenylmonosubstituted)cyanoacetamides was examined in order to define their lipophilicity.Lipophilic characteristics of investigated compounds were determined intwo ways, experimentally by using RP-TLC and calculated from structuralformula applying different mathematical methods under the relevantsoftware package.
FIGURE 5 SRD–CRRN results for different lipophilic parameters (row minimum used as referenceordering).
Application of Chemometric Methods 2541
Dow
nloa
ded
by [
Mon
ash
Uni
vers
ity L
ibra
ry]
at 0
3:19
07
Dec
embe
r 20
14
Obtained results indicate that used modifier as well as a nature of sub-stituent in position 4 has influence on retention behavior of investigatedcyanoacetamides. Experimentally obtained R0
M as a measure of lipophilicitywas compared with partition coefficient, log P, as a standard measure oflipophilicity using classic linear regression analysis and chemometric meth-ods, PCA and SRD. Results show that all applied methods afforded thepossibility of comparing the chromatographic retention data and lipophilicparameters of the investigated cyanoacetamide derivatives and all of themgave approximately similar grouping of the studied lipophilic parameters.The knowledge of grouping of the tested variables is important becauseit offers the possibility of a significant reduction in the number of para-meters to be determined.
This fact indicates that chromatographic retention constants, R0M,
obtained by simple and inexpensive RP-TLC method are similar to stan-dard measure of lipophilicity, log P, what makes this method appropriatefor predicting lipophilicity. Used chemometric methods have proved asvery helpful in research, because they are able to reduce the dimensionalityand create a connection between a large numbers of data obtained indifferent ways.
FUNDING
The presented results are part of the Project No. 172013 supported bythe Ministry of Education, Science and Technological Development of theRepublic of Serbia.
REFERENCES
1. Cahn, A.; Hepp, P. Das Antifebrin, ein Neues Fiebermittel. Zentralbl. Klin. Med. 1886, 7, 561–564.2. Akı-Sener, E.; Bingol, K. K.; Temiz-Arpaci, O.; Yalcin, I.; Altanlar, N. Synthesis and Microbiological
Activity of Some N-(2-Hydroxy-4-Substitutedphenyl)Benzamides, Phenylacetamides and Furamidesas the Possible Metabolites of Antimicrobial Active Benzoxazoles. Il Farmaco 2002, 57 (6), 451–456.
3. Zhuravel, I. O.; Kovalenko, S. M.; Ivachtchenko, A. V.; Balakin, K. V.; Kazmirchuk, V. V. Synthesis andAntimicrobial Activity of 5-Hydroxymethyl-8-Methyl-2-(N-Arylimino)-Pyrano [2,3-c] Pyridine-3-(N-aryl)-Carboxamides. Bioorg. Med. Chem. Lett. 2005, 15 (24), 5483–5487.
4. Ertan, T.; Yildiz, I.; Ozkan, S.; Temiz-Arpaci, O.; Kaynak, F.; Yalcin, I.; Aki-Sener, E.; Abbasoglu, U.Synthesis and Biological Evaluation of New N-(2-Hydroxy-4(or 5)-Nitro=Aminophenyl) Benzamidesand Phenylacetamides as Antimicrobial Agents. Bioorga. Med. Chem. 2007, 15 (5), 2032–2044.
5. Gabr, I. M. Synthesis, Characterization, Thermal Studies, and Antimicrobial Activity of 2-(2-(3,4-Dihydronaphthalenylidene)-Hydrazinyl)-2-Oxo-N-Phenylacetamide (H2NHPA) and Its TransitionMetal Complexes. J. Coord. Chem. 2009, 62 (19), 3206–3216.
6. Li, H. Y.; Matsunaga, S.; Fusetani, N. Simple Antifungal Metabolites from a Marine Sponge,Halichondria sp. Comp. Biochem. Physiol. Biochem. Mol. Biol. 1994, 107 (2), 261–264.
7. Manabe, A.; Maeda, K.; Enomoto, M.; Takano, H.; Katon, T.; Yamada, Y.; Oguri, Y. Synthesisand Fungicidal Activity of a-Cyanoacetamide Derivatives: Discovery of a New Rice Blast Fungicide,Diclocymet (S-2900). J. Pestic. Sci. 2002, 27 (3), 257–266.
2542 G. Vastag et al.
Dow
nloa
ded
by [
Mon
ash
Uni
vers
ity L
ibra
ry]
at 0
3:19
07
Dec
embe
r 20
14

8. Ichiba, T.; Murashi, T.; Suzuki, S.; Ohtsuka, T.; Masuko, M. Fungicidal Activities of 2-Methoxy-2-[2-(Benzylideneaminooxymethyl)Phenyl]-N-Methylacetamide Derivatives. J. Pestic. Sci. 2002, 27 (3),223–228.
9. Haramoto, M.; Yamanaka, H.; Sano, H.; Sano, S.; Otani, H. Fungicidal Activities of CyflufenamidAgainst Various Plant-Pathogenic Fungi. J. Pestic. Sci. 2006, 31 (2), 95–101.
10. Li, H. H.; Wang, Z. J.; Wang, L. Z.; Li, Z. M.; Zhao, W. G. Syntheses and Biological Activities ofa-Substitued Phenylethyl Amide Compounds. Chem. J. Chin. Univ. 2011, 32 (1), 79–83.
11. Abou Oauf, A. A.; Eldawy, M. A.; Farag, H. H. New Compounds: Synthesis of Certainp-Alkoxyphenylacetamide Derivatives as Potential Analgesic Agents. J. Pharm. Sci. 1971, 60 (1),158–159.
12. Ozkay, D. U.; Ozkay, Y.; Can, O. D. Synthesis and Analgesic Effects of 2-(2-carboxyphenylsulfanyl)-N-(4-Substitutedphenyl) Acetamide Derivatives. Med. Chem. Res. 2011, 20 (2), 152–157.
13. Sahu, N. P.; Pal, C.; Mandal, N. B.; Banerjee, S.; Raha, M.; Kundu, A. P.; Basu, A.; Ghosh, M.; Roy,K.; Bandyopadhyay, S. Synthesis of a Novel Quinoline Derivative, 2-(2-Methylquinolin-4-Ylamino)-N-Phenylacetamide—a Potential Antileishmanial Agent. Bioorg. Med. Chem. 2002,10 (6), 1687–1693.
14. Kovalenko, S. I.; Nosulenko, I. S.; Voskoboynik, A. Y.; Berest, G. G.; Antypenko, L. N.; Antypenko,A. N.; Katsev, A. M. Substituted 2-[(2-Oxo-2H-[1, 2, 4]triazino [2,3-c]Quinazolin-6-yl)thio]Acetamides with Thiazole and Thiadiazole Fragments: Synthesis, Physicochemical Properties,Cytotoxicity, and Anticancer Activity. Sci. Pharm. 2012, 80 (4), 837–865.
15. Chahrour, O.; Abdalla, A.; Lam, F.; Midgley, C.; Wang, S. Synthesis and Biological Evaluation ofBenzyl Styrylsulfonyl Derivatives as Potent Anticancer Mitotic Inhibitors. Bioorg. Med. Chem. Lett.2011, 21 (10), 3066–3069.
16. Kadadevar, D.; Chaluvaraju, K. C.; Niranjan, M. S.; Sultanpur, C.; Madinur, S. K.; Nagaraj, H. M.;Smitha, M.; Chakraborty, K. Synthesis of N-(Substituted Phenyl)-2[5-Phenyl-2H-1, 2, 4-triazol-3ylamino] Acetamide as Anticonvulsant. Int. J. ChemTech Res. 2011, 3 (3), 1064–1069.
17. Kumar, S.; Wahi, A.; Singh, R. Synthesis and Preliminary Pharmacological Evaluation of 2-[4-(Arylsubstituted)piperazin-1-yl]-N-phenylacetamides: Potential Antipsychotics. Trop. J. Pharm. Res. 2011,10 (3), 265–272.
18. Ang, W.; Lin, Y. N.; Yang, T.; Yang, J. Z.; Pi, W. Y.; Yang, Y. H.; Luo, Y. F.; Deng, Y.; Wei, Y. Q. Synthesisand Biological Evaluation of 2-(3-Fluoro-4-Nitro Phenoxy)-N-Phenylacetamide Derivatives as NovelPotential Affordable Antitubercular Agents. Molecules 2012, 17 (2), 2248–2258.
19. Roufos, I.; Hays, S. J.; Dooley, D. J.; Schwarz, R. D.; Campbell, G. W.; Probert Jr., A. W. Synthesisand Pharmacological Evaluation of Phenylacetamides as Sodium-Channel Blockers. J. Med. Chem.1994, 37 (2), 268–274.
20. Khairullina, V. R.; Tarasov, G. P.; Gerchikov, A. Ya.; Zarydiy, F. S.; Tyurina, L. A. Study ‘‘structure-anti-arrhythmic activity’’ relationship of N-Phenyl acetamide Derivatives and Amides of AromaticCarbonic Acids. Biomed. Khim. 2010, 56 (4), 471–479.
21. Singethan, K.; Hiltensperger, G.; Kendl, S.; Wohlfahrt, J.; Plattet, P. C.; Holzgrabe, U.; Schneider-Schaulies, J. N-(3-Cyanophenyl)-2-phenylacetamide, an Effective Inhibitor of Morbillivirus-InducedMembrane Fusion with Low Cytotoxicity. J. Gen. Virol. 2010, 91 (11), 2762–2772.
22. Zhang, T.; Sun, L.; Liu, X.; Cui, X.; Piao, H. Synthesis of 2-(4-Substitutedbenzylpiperazin-1-yl)-N-(2-oxo-2,3-Dihydrobenzooxazol-6-yl)Acetamides as Inotropic Agents. Med. Chem. 2012, 8 (6),1093–1098.
23. Nader, M. W.; Oberdorfer, F. Syntheses of [carbonyl-11C]2-(2-Benzoylphenoxy)-N-Phenylacetamidefrom [11C]carbon Monoxide by the Suzuki and the Stille Reactions. Appl. Radiat. Isot. 2002, 57 (5),681–685.
24. Modi, N. R.; Shah, R. J.; Patel, M. J.; Suthar, M.; Chauhan, B. F.; Patel, L. J. Design, Synthesis, andQSAR Study of Novel 2-(2,3-Dioxo-2,3- Dihydro-1H-Indol-1-yl)-N-Phenylacetamide Derivatives asCytotoxic Agents. Med. Chem. Res. 2011, 20 (5), 615–625.
25. Leo, A.; Hansch, C.; Elkins, D. Partition Coefficients and Their Uses. Chem. Rev. 1971, 71 (6), 525–616.26. Kaliszan, R. Advances in Chromatography, Marcel Dekker: New York, 1993.27. Gocan, S.; Irimie, F.; Cimpan, G. Prediction of the Lipophilicity of Some Plant Growth-Stimulating
Amido Esters of Ethanolamine Using Reversed-Phase Thin-Layer Chromatography. J. Chromatogr. A1994, 675 (1–2), 282–285.
Application of Chemometric Methods 2543
Dow
nloa
ded
by [
Mon
ash
Uni
vers
ity L
ibra
ry]
at 0
3:19
07
Dec
embe
r 20
14
28. Peri�ssic-Janjic, N.; Vastag, Gy.; Tomic, J.; Petrovic, S. Effect of the Physicochemical Properties ofN,N-Disubstituted-2-Phenylacetamide Derivatives on their Retention Behavior in RP-TLC. J. PlanarChromatogr. Mod. TLC 2007, 20 (5), 353–359.
29. Va�sstag, D. J.; Peri�ssic-Janjic, N.; Tomic, J.; Petrovic, S. Evaluation of the Lipophilicity and Predictionof Biological Activity of Some N-cyclohexyl-N-Substituted-2-Phenylacetamide Derivatives UsingRP-TLC. J. Planar Chromatogr. Mod. TLC 2011, 24 (5), 435–440.
30. Kaliszan, R.; Haber, P.; Baczek, T.; Siluk, D. Gradient HPLC in the Determination of DrugLipophilicity and Acidity (Conference Paper). Pure Appl. Chem. 2001, 73 (9), 1465–1475.
31. Marinkovic, A. D.; Brkic, D.; Martinovic, J. S.; Mijin, D. Z.; Milcic, M.; Petrovic, S. D. SubstituentEffect on IR, 1H and 13C NMR Spectral Data in N-(Substituted Phenyl)-2-Cyanoacetamides:A Correlation Study. Chem. Ind. Chem. Eng. Q 2013, 19 (1), 67–78.
32. http://www.vcclab.org (accessed May 2011).33. Heberger, K. Sum of Ranking Differences Compares Methods or Models Fairly. Trends Anal. Chem.
2010, 29 (1), 101–109.34. Petrovic, S.; Loncar, E.; Peri�ssic-Janjic, N.; Lazarevic, M. Normal and Reversed-Phase Thin-Layer
Chromatography of Thiourea Derivatives. J. Planar Chromatogr. Mod. TLC 1997, 10 (1), 26–30.35. Ionita, G.; Constantinescu, T.; Ionita, P. Normal and Reversed-Phase TLC of Some Hydrazine
Derivatives. J. Planar Chromatogr. Mod. TLC 1998, 11 (2), 141–144.36. Ðakovic-Sekulic, T. L. J.; Peri�ssic-Janjic, N. U.; Petrovic, S. D. Normal- and Reversed-Phase Chroma-
tography of Para-Substituted Propanoic Acid Amides. J. Planar Chromatogr. Mod. TLC 2002, 15 (4),274–279.
37. Kaliszan, R. QSRR: Quantitative Structure-(Chromatographic) Retention Relationships. Chem. Rev.2007, 107 (7), 3212–3246.
38. Tan, L. C.; Carr, P. W. Study of Retention in Reversed-Phase Liquid Chromatography Using LinearSolvation Energy Relationships II. The Mobile Phase. J. Chromatogr. A 1998, 799 (1–2), 1–19.
39. Djakovic-Sekulic, T.; Peri�ssic-Janjic, N.; Sarbu, C.; Lozanov-Crvenkovic, Z. Partial Least-Squares Studyof the Effects of Organic Modifier and Physicochemical Properties on the Retention of SomeThiazoles. J. Planar Chromatogr. Mod. TLC 2007, 20 (4), 251–257.
40. Perisic-Janjic, N.; Kaliszan, R.; Wiczling, P.; Milosevic, N.; Uscumlic, G.; Banjac, N. Reversed-PhaseTLC and HPLC Retention Data in Correlation Studies with In Silico Molecular Descriptors andDruglikeness Properties of Newly Synthesized Anticonvulsant Succinimide Derivatives. Mol. Pharm.2011, 8 (2), 555–563.
41. Sarbu, C.; Todor, S. Evaluation of Lipophilicity by Principal Components Analysis. J. Planar Chroma-togr. Mod. TLC 1998, 11 (2), 123–126.
42. Sarbu, C.; Kuhajda, K.; Kevresan, S. Evaluation of the Lipophilicity of Bile Acids and TheirDerivatives by Thin-Layer Chromatography and Principal Component Analysis. J. Chromatogr. A 2001,917 (1–2), 361–366.
43. Sarbu, C.; Djakovic-Sekulic, T.; Peri�ssic-Janjic, N. Evaluation of Lipophilicity of SomeBenzimidazole and Benztriazole Derivatives by RP HPTLC and PCA. J. Pharm. Biomed. Anal. 2002,30 (3), 739–745.
44. Komsta, L.; Skibinski, R.; Berecka, A.; Gumieniczek, A.; Radkiewicz, B.; Radon, M. RevisitingThin-Layer Chromatography as a Lipophilicity Determination tool-A Comparative Study on SeveralTechniques with a Model Solute Set. J. Pharm. Biomed. Anal. 2010, 53 (4), 911–918.
45. Tache, F.; Nascu-Briciu, R. D.; Sarbu, C.; Micale, F.; Medvedovici, A. Estimation of the LipophilicCharacter of Flavonoids from the Retention Behavior in Reversed Phase Liquid Chromatographyon Different Stationary Phases: A Comparative Study. J. Pharm. Biomed. Anal. 2012, 57 (1),82–93.
46. Heberger, K. Evaluation of Polarity Indicators and Stationary Phases by Principal Component analy-sis in Gas-Liquid Chromatography. Chemom. Intell. Lab. Syst. 1999, 47 (1), 41–49.
47. Dallos, A.; Ngo, H. S.; Kresz, R.; Heberger, K. Cluster and Principal Component Analysis for Kovats’Retention Indices on Apolar and Polar Stationary Phases in Gas Chromatography. J. Chromatogr. A2008, 1177 (1), 175–182.
48. Djakovic-Sekulic, T.; Smolinski, A.; Peri�ssic-Janjic, N.; Janicka, M. Chemometric Characterization of(Chromatographic) Lipophilicity Parameters of Newly Synthesized s-Triazine Derivatives. J. Chemom.2008, 22 (3–4), 195–202.
2544 G. Vastag et al.
Dow
nloa
ded
by [
Mon
ash
Uni
vers
ity L
ibra
ry]
at 0
3:19
07
Dec
embe
r 20
14
49. Csomos, E.; Heberger, K.; Simon-Sarkadi, L. Principal Component Analysis of Biogenic Amines andPolyphenols in Hungarian Wines. J. Agric. Food Chem. 2002, 50 (13), 3768–3774.
50. Vastag, G. Y.; Apostolov, S.; Peri�ssic-Janjic, N.; Matijevic, B. Multivariate Analysis of ChromatographicRetention Data and Lipophilicity of Phenylacetamide Derivatives. Anal. Chim. Acta 2013, 767 (1),44–49.
51. Heberger, K.; Kollar-Hunek, K. Sum of Ranking Differences for Method Discrimination and ITSValidation: Comparison of Ranks with Random Numbers. J. Chemom. 2011, 25 (4), 151–158.
Application of Chemometric Methods 2545
Dow
nloa
ded
by [
Mon
ash
Uni
vers
ity L
ibra
ry]
at 0
3:19
07
Dec
embe
r 20
14