Embed Size (px)
Citation preview
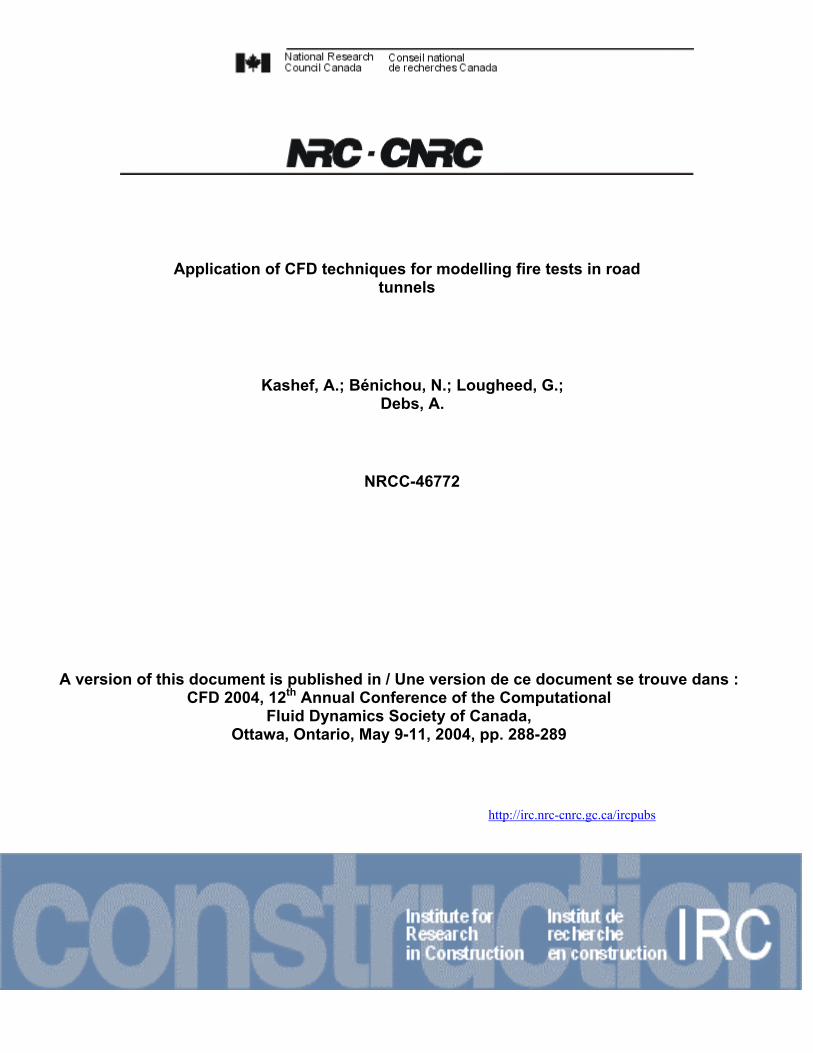
Application of CFD techniques for modelling fire tests in road tunnels
Kashef, A.; Bénichou, N.; Lougheed, G.; Debs, A.
NRCC-46772
A version of this document is published in / Une version de ce document se trouve dans : CFD 2004, 12th Annual Conference of the Computational
Fluid Dynamics Society of Canada, Ottawa, Ontario, May 9-11, 2004, pp. 288-289
http://irc.nrc-cnrc.gc.ca/ircpubs

APPLICATION OF CFD TECHNIQUES FOR MODEL-LING FIRE TESTS IN ROAD TUNNELS
Ahmed Kashef1, Noureddine Benichou1, Gary Lougheed2, and Alexandre Debs3
1Research Officer, 2Senior Research Officer at the National Research Council of Canada, Ottawa, Ontario, 3 Ministère des Transports du Québec, Montreal, Québec.
Email: [email protected]
ABSTRACT
A research project is being conducted at the Na-tional Research Council of Canada (NRC) to evaluate the effectiveness of current emergency ventilation strategies to control smoke spread in the event of a fire in two road tunnels. The re-search study includes numerical and experimen-tal phases. The numerical phase uses CFD mod-els to study smoke ventilation in the tunnels. The experimental phase is used to calibrate and to partially validate the chosen CFD models and provide the necessary initial and boundary condi-tions.
Solvent, a CFD model was used to model two ventilation scenarios using existing data. The current paper presents the efforts to validate the CFD model against onsite fire test measurements conducted in a 1.8 km road tunnel. The CFD model includes aerodynamically significant physical features of the tunnel and is customized to provide general roughness replicating the ac-tual roughness in the tunnel.
1. INTRODUCTION Fires in tunnels pose major safety issues and challenges to the designer, especially with the increase in the number of tunnels, their length, and number of people using them. The main fire safety issues include [1, 2]: safe evacuation of people inside the tunnel, safe rescue operations, minimal effects on the environment due to the release of combustion gases, and minimal loss of property.
The safety of tunnel users and rescuers is the main objective for the emergency ventilation system (EVS). Life can be threatened in a num-ber of ways: asphyxiation by the inhalation of smoke and fumes, poisoning by the inhalation of
combustion products such as carbon monoxide and carbon dioxide, generation of high tempera-tures and heat fluxes. Evacuation can be signifi-cantly affected by poor visibility, power failure, blocked exits due to traffic jams or crashed vehi-cles, or obstruction resulting from a collapse or explosion in the tunnel. Temperatures up to 1350oC and heat fluxes in excess of 300 kW/m2 can be generated within a few minutes of igni-tion in certain types of fires. For safe evacua-tion, acceptable visibility and air quality must be maintained in the tunnel.
From the beginning of a fire, the airflow in a tunnel is modified and becomes highly transient. The modifications are due to the fire itself, the operation of the emergency ventilation system, and the change in the traffic flow in the tunnel. The smoke progress and its degree of stratifica-tion depend mainly on the airflow in the tunnel. With no airflow in the fire zone, the smoke moves symmetrically on both sides of the fire [3]. The smoke remains stratified until it cools down due to the combined effects of the convec-tive heat exchange with the tunnel walls and the mixing between the smoke and the fresh air lay-er. The other parameters that affect the smoke flow [3] and stratification are: fire heat release rate, tunnel slope, and traffic flow.
In the event of a fire, the EVS must provide tun-nel users with a safe egress route that is free of smoke and hot gases. Tunnel operators must implement a plan of smoke clearing, which con-sists of selecting a sequence of fan operation with the objective of keeping the road upstream of the accident smoke free. This is done by lim-iting the upstream smoke flow and either venting it using fans or letting it escape through the downstream portal. When the fire department arrives on the fire scene, the operator must coop-erate and modify, as needed, the fan operation in order to facilitate access to the site.

Establishing airflow requirements for the road-way tunnel and consequently the capacity of the ventilation system is challenging due to the diffi-culty of controlling many variables. This in-cludes changes in traffic patterns and situations during the lifetime of the facility. Methods of controlling air contaminants and smoke from a fire in a tunnel using EVS include longitudinal airflow, smoke extraction and smoke dilution.
To evaluate the effectiveness of the emergency ventilation strategies in the event of a fire in two tunnels in Montreal, Quebec, the NRC has un-dertaken a research project with the Ministry of Transportation of Quebec.
The first two stages of the project have been completed. An extensive literature review on vehicle tunnel ventilation for fire safety has been completed and provided a rational basis for choosing two CFD numerical models for the initial evaluation: namely, Solvent [4] and Fire Dynamic Simulator (FDS) [5]. Based on com-parisons with field test data, a model will be se-lected for use in the remainder of the project.
1.1 Experimental Work Airflow measurements and fire tests were con-ducted in one of the two tunnels. The initial air-flow measurements [6, 7] were used to establish the ventilation scenarios for the fire tests and to provide input data for the CFD models.
One of the tunnels studied in the project is a 1.8 km in length (Figure 1) and travels underwa-ter in a North-South direction with three lanes, in each direction, inside two concrete tubes. A cen-ter section separates the two tubes. Two ventila-tion towers are located at the ends of the under-water section. Four exhaust fans for each road-way are located in the ventilation towers. The air supply for the tunnel is provided via openings distributed along the walls. These openings have adjustable dampers to ensure uniform air distri-bution.
1.1.1 Fire Tests Two fire tests were conducted in the North Roadway of the tunnel (Figure 2): one in the middle of the tunnel and one close to the exhaust fans at the north end of the tunnel. Two different EVS scenarios were activated for the two tests. Test 1 EVS scenario used the two fans VE151 and VE153 in the exhaust mode and the two fans VA103 and VA201 in the supply mode (Figure 2a). In Test 2, a similar EVS was activated ex-
cept for fan VA103, which was used in the ex-haust mode (Figure 2b).
A clean-burning propane system that produces minimal smoke was developed for the in-situ fire tests. This system is a compact, portable and convenient heat source that is capable of produc-ing up to 5 MW of heat output simulating a small car fire. The heat output for fire tests was lim-ited to 2 MW. The objective was to limit the temperature at the tunnel ceiling below 100°C.
Figure 2 Fire tests
Artificial smoke was used for visualization pur-poses with four smoke bombs added every 1 min interval. Temperature and optical smoke density measurements were conducted. These measure-
12.8m 12.8m3.4m 3.4m
4.9m
N o r th D ir e c t io nN o r th D ir e c t io n S o u th D ir e c t io nS o u th D ir e c t io n
u p p e r v e n t su p p e r v e n t s
lo w e r v e n t slo w e r v e n t s
S e r v ic e c o r r id o r s S e r v ic e c o r r id o r s o f v e n t i la t io n a n d o f v e n t i la t io n a n d e v a c u a t io ne v a c u a t io n
Figure 1 General layout of the tunnel
(a) Test 1
(b) Test 2

ments were taken at 60 locations downstream of the fire and 20 locations upstream of the fire. Also, the air speed was measured at the two por-tals, mid-tunnel, exhaust fan locations, and in-side the evacuation paths located between the two roadways.
The two fire tests were conducted in 7 h. This time included 4 hours for preparation and set-up; 1.5 h for running the two tests and 1.5 h for cleaning up after the tests. Each test was run for 15 min from the time of ignition. Measurements commenced after 3 to 4 min from the ignition to ensure the stability of the readings.
A thermocouple tree was constructed at each fire location to measure the centreline plume and ceiling temperatures. The thermocouple tree included 11 thermocouples, distributed vertically along the tunnel height and horizontally at the ceiling spanning 6 m upstream and downstream from the fire.
Smoke optical density (SOD) indicates the level of smoke obscuration. The higher the value of SOD, the higher the smoke obscuration and the lower the visibility.
1.1.2 Measurements The maximum ceiling temperature was approxi-mately 50°C for Test 1 and 21°C for Test 2. The vertical temperature profiles at the fire locations were similar for the two tests. The maximum temperature was about 60oC measured at 0.4 m above the ground.
For both tests, the values of SOD were quite low upstream of the fire and the temperatures were at ambient temperature (about 20oC). These obser-vations indicate that the EVS scenarios used in the tests created an airflow such that the hot smoke moves in the desired direction. That is, it moves from the South to the North in the traf-fic’s direction.
In general, close to the fire location high SOD values were measured and as a result, visibility was reduced. A few meters from the fire, the SOD decreased and the visibility was in the range of 12 m and higher. However, at locations further away from the fire, the overall values of SOD increased and the visibility was reduced especially during Test 2. Moreover, the reduced level of visibility extended, in the case of Test 2, further downstream of the fire Location.
For Test 1, the smoke was pulled towards the ceiling (at the exhaust fans VE151 and VE153)
and therefore lower values of the SOD were ob-served and good visibility was maintained up to the 3.0 m elevation.
It is interesting to observe the difference in the behavior of cold flow tests conducted in the tun-nel [6, 7] and hot smoke in the current set of tests. During cold smoke tests, it was reported that when the smoke source was located close to the exhaust fans (similar to Test 1), the rate of smoke removal was higher with almost no side dispersion of smoke. However, with hot smoke tests, smoke was dispersed laterally and the rate of smoke clearance was lower. This confirms that only hot smoke tests should be used to qual-ify performance of ventilation systems.
It was concluded from the measured values for Test 2 that the ventilation system helped to con-trol the temperatures and produce a high airflow velocity in the middle of the tunnel. However, since most of the smoke was extracted through the sidewall vents, the hot smoke created a haz-ardous situation in which visibility was reduced downstream of the fire up to a distance of about 300 m. In addition, a dense layer of smoke was observed in the evacuation path preventing its use in this scenario. Moreover, it was observed that the smoke extracted through the side vents was recirculated into other evacuation paths downstream of the exhaust fans.
The results of the fire tests are being used to ver-ify the results of the CFD models. These models will then be used to investigate the effectiveness of the tunnel ventilation strategies for other fire scenarios.
1.2 CFD Model SOLVENT was developed as a tunnel ventilation model that can simulate the interactive effects of a tunnel fire and the ventilation system to deter-mine unsafe regions in the tunnel. The model is applicable to different ventilation modes, includ-ing longitudinal ventilation using jet fans, trans-verse ventilation, and natural ventilation.
SOLVENT is based on the general-purpose CFD code COMPACT-3D [8]. It employs the buoy-ancy-augmented k-ε model [9] to represent the turbulent transport and includes component models for jet fans, ventilation ducts, fire, radia-tion heat transfer, and smoke. The SIMPLER algorithm is used to calculate the pressure field. The algebraic equations are solved using the line-by-line TriDiagonal-Matrix Algorithm supplemented by a block-correction procedure.

The wall boundary is treated using the wall func-tion approach. The fire is represented as a source of heat and mass. The model does not simulate the combustion process. Instead, the heat release rate, due to combustion, is pre-scribed as a volumetric heat source in a postu-lated fire region.
The boundary conditions at the tunnel portals can be specified as inflow/outflow boundaries or as "free" boundaries with known values of pres-sure, depending on the physical situation being modelled. At an inflow boundary, values of all variables are specified. At an outflow boundary, the diffusion flux is assumed to be zero and the normal velocity components are adjusted to en-sure the overall conservation of mass. The model also has provisions for the introduction of entrance loss and differential pressures at the portals to represent wind effects.
2. NUMERICAL SIMULATIONS
2.1 Geometry and Boundary Condi-tions
Only the North Roadway of the tunnel and its service corridors (Figure 3) were simulated with a mesh consisting of 465,696 control volumes (539 x 36 x 24). The mesh was refined around the vents, exhaust fans, fire source, and tunnel portals. Two simulations were conducted to rep-resent the ventilation scenarios used for both fire tests. The two simulations were conducted as a steady state heat release variable density simula-tion. Smoke is assumed to represent the prod-ucts of combustion. Smoke production rate is calculated from the fuel consumption rate, and the stiochiometric air/fuel ratio, as follows:
)s1(mmfusmoke
+= && Eq. 1
Where: smoke
m& = smoke production rate
fu
m& = fuel consumption rate
s = the stiochiometric ratio
The fire was represented as a fluid region where mass, energy, and smoke sources were intro-duced. The model did not simulate the combus-tion process in the fire. A propane source 3.0 m long, 2.0 m wide and 0.7 m high was used to simulate the experimental fire source. The fire source with a heat output of 2 MW was placed at a distance of 335 m and 687 m from the North portal for Tests 1 and 2, respectively.
Fans VA103 and VA201 were simulated as mass sources or sinks depending on the ventilation scenario. For Test 1, both fans were introduced as mass sources. In the ventilation scenario of Test 2, fan VA103 was represented as a mass sink. Free boundaries with the pressure equal to the static ambient pressure were assumed at the north and south portals. A wall roughness of 0.003 was assumed for the concrete wall surface.
2.2 Test 1 Ventilation Scenario The behaviour of the airflow in the tunnel plays a major role in determining the longitudinal air velocity and consequently the ability of a ventila-tion configuration to clear the smoke and com-bustion products. Figure 4 shows the airflow pattern associated with ventilation scenario for Test 1. Fresh air was supplied by fans VA101 and VA201 in the escape paths and entered the tunnel roadway through the side vents. Smoke and hot gases were exhausted through ceiling fans VE151 and VE153. Fresh air was also drawn through the North and South portals.
The air supplied through the lower and upper side vents created regions of turbulent flows.
Figure 3 CFD model
Figure 4 Test 1 airflow pattern
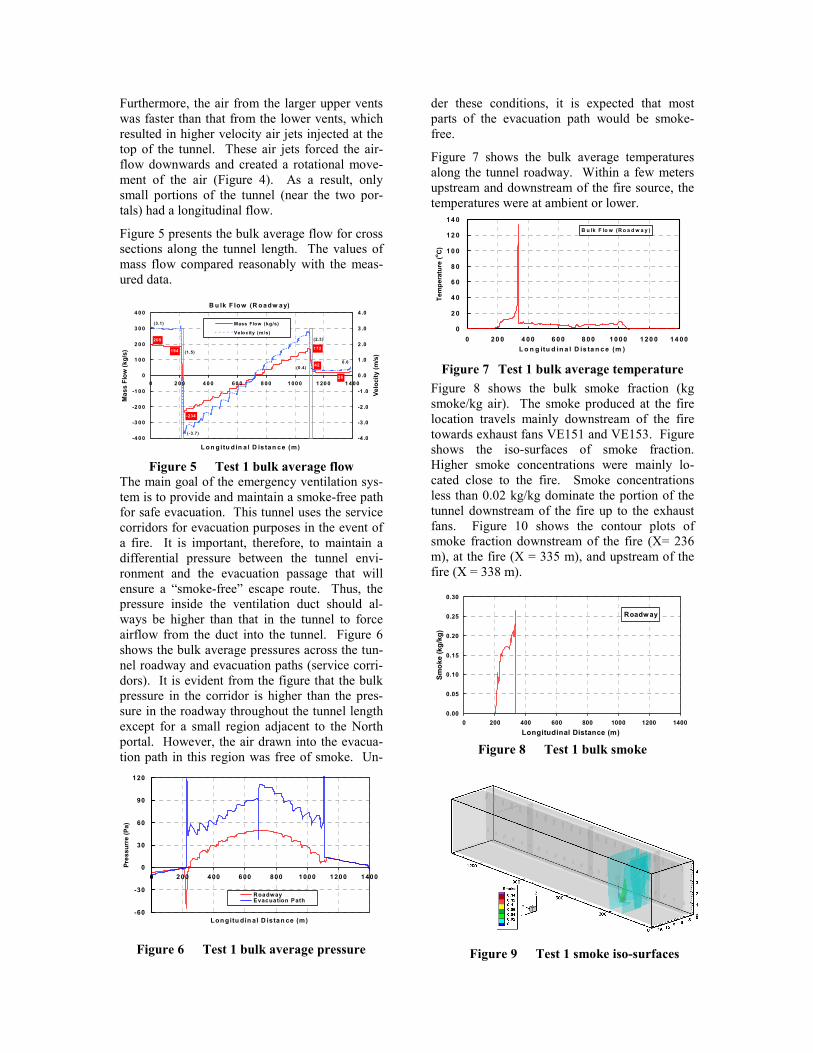
Furthermore, the air from the larger upper vents was faster than that from the lower vents, which resulted in higher velocity air jets injected at the top of the tunnel. These air jets forced the air-flow downwards and created a rotational move-ment of the air (Figure 4). As a result, only small portions of the tunnel (near the two por-tals) had a longitudinal flow.
Figure 5 presents the bulk average flow for cross sections along the tunnel length. The values of mass flow compared reasonably with the meas-ured data.
The main goal of the emergency ventilation sys-tem is to provide and maintain a smoke-free path for safe evacuation. This tunnel uses the service corridors for evacuation purposes in the event of a fire. It is important, therefore, to maintain a differential pressure between the tunnel envi-ronment and the evacuation passage that will ensure a “smoke-free” escape route. Thus, the pressure inside the ventilation duct should al-ways be higher than that in the tunnel to force airflow from the duct into the tunnel. Figure 6 shows the bulk average pressures across the tun-nel roadway and evacuation paths (service corri-dors). It is evident from the figure that the bulk pressure in the corridor is higher than the pres-sure in the roadway throughout the tunnel length except for a small region adjacent to the North portal. However, the air drawn into the evacua-tion path in this region was free of smoke. Un-
der these conditions, it is expected that most parts of the evacuation path would be smoke-free.
Figure 7 shows the bulk average temperatures along the tunnel roadway. Within a few meters upstream and downstream of the fire source, the temperatures were at ambient or lower.
Figure 8 shows the bulk smoke fraction (kg smoke/kg air). The smoke produced at the fire location travels mainly downstream of the fire towards exhaust fans VE151 and VE153. Figure shows the iso-surfaces of smoke fraction. Higher smoke concentrations were mainly lo-cated close to the fire. Smoke concentrations less than 0.02 kg/kg dominate the portion of the tunnel downstream of the fire up to the exhaust fans. Figure 10 shows the contour plots of smoke fraction downstream of the fire (X= 236 m), at the fire (X = 335 m), and upstream of the fire (X = 338 m).
B u lk F low (R oadw ay)
26
194
205
-234
172
420.6
(0.4)
(1.5)
(3.1)
(-3.7)
(2.3 )
-4 0 0
-3 0 0
-2 0 0
-1 0 0
0
1 0 0
2 0 0
3 0 0
4 0 0
0 2 0 0 4 0 0 60 0 8 00 1 00 0 1 20 0 1 4 00
L on gi tu d in a l D is tan ce (m)
Mas
s Fl
ow (k
g/s)
-4 .0
-3 .0
-2 .0
-1 .0
0 .0
1 .0
2 .0
3 .0
4 .0
Velo
city
(m/s
)
Mass Flow (kg/s)
Velocity (m/s)
Figure 5 Test 1 bulk average flow
-60
-30
0
30
60
90
120
0 200 400 600 800 1000 1200 1400
Lon gitu din al D istan ce (m)
Pres
surr
e (P
a)
RoadwayEvacuation Path
Figure 6 Test 1 bulk average pressure Figure 9 Test 1 smoke iso-surfaces
B u lk F lo w (R o a d w a y )
0
2 0
4 0
6 0
8 0
1 0 0
1 2 0
1 4 0
0 2 0 0 4 0 0 6 0 0 8 0 0 1 0 0 0 1 2 0 0 1 4 0 0L o n g itu d in a l D is ta n c e (m )
Tem
pera
ture
(o C)
Figure 7 Test 1 bulk average temperature
Roadway
0.00
0.05
0.10
0.15
0.20
0.25
0.30
0 200 400 600 800 1000 1200 1400Longitudinal Distance (m)
Smok
e (k
g/kg
)
Figure 8 Test 1 bulk smoke

Figure 10 Test 1 smoke contour plots
2.3 Test 2 Ventilation Scenario Figure 11 shows the airflow pattern under the Test 2 ventilation scenario, with the activation of ventilation fan VA-103 in exhaust mode. It is clear from the figure that the turbulent behaviour of the flow in the tunnel is still the dominant mode of smoke transport.
Figure 11 Test 2 airflow pattern
The bulk flow shown in Figure 12 indicates a greatly modified flow field compared with Test 1. The air speeds at mid-tunnel increased from almost zero (corresponding to Test 1) to more than 5.0 m/s.
From Figure 13 it is evident that most of the smoke was extracted through the service corridor of fan VA103. Therefore in this scenario, the VA103 service corridor could not be used for evacuation purposes. The result also indicates that the smoke mainly moved downstream of the fire leaving half of the tunnel upstream of the fire “smoke-free”.
The strong turbulent nature of the airflow ad-versely affected the rate of smoke clearance as can be seen from Figure 14 where the smoke iso-surfaces covered half of the tunnel downstream of the fire. However, the bulk smoke values for Test 2 were less than those in Test 1.
Figure 15 shows the contour plots of smoke frac-tion at three locations downstream of the fire (at X= 544 m), at the fire (at X = 687 m), and up-stream of the fire (at X = 774 m).
Bulk Flow (Roadw ay)
-171-165-125
-332
-125
310321
(-2.7)(-2.6)(-2.3)
(-5.3)
(-2.0)
(4.8)(4.8)
-400
-300
-200
-100
0
100
200
300
400
0 200 400 600 800 1000 1200 1400
Longitudinal Distance (m)
Mas
s Fl
ow (k
g/s)
-6.0
-4.5
-3.0
-1.5
0.0
1.5
3.0
4.5
6.0
Velo
city
(m/s
)
Mass Flow (kg/s)
Velocity (m/s)
Figure 12 Test 2 bulk average flow
0.00
0.04
0.08
0.12
0.16
0.20
0 200 400 600 800 1000 1200 1400
Longitudinal Distance (m)
Smok
e (k
g/kg
)
RoadWay
Escape
Figure 13 Test 2 bulk smoke

The turbulent effects, together with the higher airflow speeds, resulted in lower bulk tempera-tures, which were almost half the values ob-served in Test 1 at the fire location (Figure 16). This is in agreement with the measurements data in the field tests.
Figure 17 shows the bulk average pressures across the tunnel roadway and evacuation paths (service corridors). It is evident from the figure that the bulk pressure in the corridor upstream of the fire is larger than the pressure in the roadway indicating that these evacuation paths would be smoke-free.
On the other hand, in the corridor for ventilation fan VA103, the pressure was about ten times lower than the pressure in the roadway causing most of the smoke to be exhausted by fan VA103. However, at a distance approximately 200 m, the pressure in the corridor was higher than that in the adjacent roadway causing the smoke in the corridor to re-enter the tunnel road-way.
3. CONCLUSIONS The numerical simulations agree with the
field measurements. They indicated that the current ventilation strategies for the two fire scenarios, close to the exhaust fans and at the middle of the tunnel, are efficient in clearing hot smoke and fire products from the tunnel.
No smoke was observed within the service corridors of ventilation fans VA103 and VA201 during Test 1. The numerical simu-lation confirmed this observation by exam-ining the pressure differences between the tunnel and services corridors.
Figure 14 Test 2 smoke iso-surfaces
Figure 15 Test 2 smoke contour plots
B u lk F lo w (R o a d w a y )
0
1 0
2 0
3 0
4 0
5 0
6 0
7 0
0 20 0 4 00 60 0 8 0 0 1 0 00 1 2 0 0 1 4 00L o n g itu d in a l D is ta n c e (m )
Tem
pera
ture
(o C)
Figure 16 Test 2 bulk average temperature
-250
-200
-150
-100
-50
0
50
100
150
200
250
0 200 400 600 800 1000 1200 1400
Longitudinal Distance (m)
Pres
surr
e (P
a)
T unnelEvacuation Path
Figure 17 Test 2 bulk average pressure

The ventilation scenario associated with Test 2 involved the activation of fan VA103 in exhaust mode. This increased signifi-cantly the mid-tunnel velocity. However, in this case the VA103 service corridor could not be used as an escape route as the evacu-ees would be exposed to high temperatures and smoke. Moreover, it was observed dur-ing the field measurements that the smoke extracted through the side vents into the ser-vice corridors of fan VA103 was recircu-lated into the other service corridor down-stream of exhaust fans VE151 and VE153 preventing its use as an evacuation path.
The air velocity in the evacuation passage was 14 m/s with VA103 at maximum capac-ity. It might be difficult to walk against such a high airflow during evacuation. Lower ve-locities should be used to facilitate move-ment in the evacuation passage (11 m/s [10]).
It should be noted that the rate of smoke production for the field tests and the nu-merical simulation may differ. In the nu-merical simulations, the rate of smoke pro-duction was a function of the fuel consump-tion and the stoichiometric ratio (Eq. 1). Whereas, an extra source of smoke was in-troduced during the tests (four smoke bombs/min) for better visualization. For more meaningful quantitative comparisons between the numerical and experimental data, the extra quantity of smoke produced by the smoke bombs should be included in the simulations. However, the current quali-tative comparisons are favorable.
4. REFERENCES 1. NFPA 502, “Standard for Road Tunnels,
Bridges, and Other Limited Access High-ways”, 2001 Edition, NFPA, 1 Batterymarch Park, PO Box 9101, Quincy, MA 02269-9101, USA.
2. Lacroix D., “The New PIARC Report on Fire and Smoke Control in Road Tunnels”, Third International Conference on Safety in Road and Rail Tunnels, Nice, France, p. 185-97, 1998.
3. Heselden, A J M. "Studies of fire and smoke behaviour relevant to tunnels". In: Proc. Sec-ond International Symposium on the Aerody-
namics and Ventilation of Vehicle Tunnels, Cambridge, BHRA, paper J1, 1976.
4. Innovative Research, Inc./Parsons Brinker-hoff, Inc., “Solvent Version 1.0”, Innovative Research, Inc./Parsons Brinkerhoff, Inc., 2000.
5. McGrattan, K.B., Baum, H.R. Rehm, R.G., Hamins, A. and Forney, G.P, “Fire Dynamics Simulator – Technical Reference Guide”, NISTIR 6467, National Institute of Standards and Technology, Gaithersburg, MD, 2000.
6. Kashef, A.; Bénichou, N.; Lougheed, G.D.; Debs, A. "Numerical modelling of air move-ment in road tunnels," 1, CFD 2003, the Eleventh Annual Conference of the Compu-tational Fluid Dynamics, Society of Canada (Vancouver, B.C. 2003-05-28), pp. 23-30, May, 2003.
7. Kashef, A.; Bénichou, N.; Lougheed, G.D.; Debs, A. "CFD simulation of in-situ airflow measurements in road tunnels," 5th Interna-tional Conference Safety in Road and Rail Tunnels (Marseilles, France, 2003-10-06), pp. 609-618.
8. Innovative Research, “Reference Manual for COMPACT-3D”, Innovative Research, Inc., Minneapolis, 1998.
9. Wilcox, D.C., Turbulence Modeling of CFD, DCW Industries, Inc., California 91011, 1993.
10. Cheung, Emil, Chan, Wilson, and Man, Richard, “Ventilation Scheme using Saccardo Nozzles”, Tunnel Management International, 5th International Conference, Safety in Road and Rail Tunnels, Volume 6, Number 1, 2003.