Embed Size (px)
Citation preview

APPLICATION OF AUGMENTED REALITY TO
DIMENSIONAL AND GEOMETRIC INSPECTION
by
Kyung H. Chung
Dissertation submitted to the Faculty of the Virginia Polytechnic Institute and State University
in partial fulfillment of the requirements for the degree of
Doctor of Philosophy
in
Industrial and Systems Engineering
APPROVED:
____________________________ ____________________________
Robert C. Williges, Chair Brian M. Kleiner
____________________________ ____________________________
John P. Shewchuk Deborah Hix
____________________________
Jose A. Pesante-Santana
February 2002 Blacksburg, Virginia
Keywords: Virtual Environment, Augmented reality, Variable Inspection, Dimensional and Geometric Inspection

ii
Application of Augmented Reality to Dimensional and Geometric inspection
Kyung H. Chung
ABSTRACT
Ensuring inspection performance is not a trivial design problem, because
inspection is a complex and difficult task that tends to be error-prone, whether performed
by human or by automated machines. Due to economical or technological reasons,
human inspectors are responsible for inspection functions in many cases. Humans,
however, are rarely perfect. A system of manual inspection was found to be
approximately 80-90% effective, thus allowing non-confirming parts to be processed
(Harris & Chaney, 1969; Drury, 1975). As the attributes of interest or the variety of
products increases, the complexity of an inspection task increases. The inspection system
becomes less effective because of the sensory and cognitive limitations of human
inspectors. Any means that can support or aid the human inspectors is necessary to
compensate for inspection difficulty.
Augmented reality offers a new approach in designing an inspection system as a
means to augment the cognitive capability of inspectors. To realize the potential benefits
of AR, however the design of AR-aided inspection requires a through understanding of
the inspection process as well as AR technology. The cognitive demands of inspection
and the capabilities of AR to aid inspectors need to be evaluated to decide when and how
to use AR for a dimensional inspection.
The objectives of this study are to improve the performance of a dimensional
inspection task by using AR and to develop guidelines in designing an AR-aided
inspection system. The performance of four inspection methods (i.e., manual, 2D-aided,
3D-aided, and AR-aided inspections) was compared in terms of inspection time and
measurement accuracy. The results suggest that AR might be an effective tool that
reduces inspection time. However, the measuring accuracy was basically the same across
all inspection methods. The questionnaire results showed that the AR and 3D-aided
inspection conditions are preferred over the manual and 2D-aided inspection. Based on
the results, four design guidelines were formed in using AR technology for a dimensional
inspection.

iii
Dedicated to my wife, Young Sun

iv
ACKNOWLEDGMENTS
I would like to thank my committee members for their help and advice through
the process of completing this dissertation. Without them, especially Dr. Williges and
Dr. Shewchuk who encouraged me to work for several publications and shared valuable
experiences in research with me, this study could not have been successful. I wish to
thank Kelcie Bower and Jeff Snider of the Industrial and Systems Engineering
Department of Virginia Tech for manufacturing the parts used in this experiment. I also
wish to thank Brian Walters and Chuck Perala who helped me with the proof reading of
this dissertation. Finally, I owe a debt of gratitude to my wife Young, who always has
believed in me more than I have. Without her, my research career would not have been
possible.

v
TABLE OF CONTENTS CHAPTER 1. INTRODUCTION ..................................................................................... 1
OUTLINE OF RESEARCH--------------------------------------------------------------------- 3
CHAPTER 2. BACKGROUND LITERATURE.............................................................. 6
VISUAL INSPECTION ------------------------------------------------------------------------- 6 Performance Measures ............................................................................................... 8 Taxonomy of Visual Inspection ................................................................................... 9 Visual Inspection Model............................................................................................ 10
DIMENSIONAL AND GEOMETRIC INSPECTION------------------------------------- 21 Taxonomy of Dimensional and Geometric Inspection .............................................. 27 Automated Inspection................................................................................................ 31 Intervention Techniques ............................................................................................ 34
VIRTUAL ENVIRONMENTS FOR MANUFACTURING TASKS-------------------- 35 Taxonomy for Virtual Environments ......................................................................... 36 Virtual Environment Methods ................................................................................... 38 Potential Benefits of AR ............................................................................................ 41 Limitation of AR Technology..................................................................................... 43
CHAPTER 3. DEVELOPMENT OF AN AUGMENTED REALITY-AIDED
DIMENSIONAL INSPECTION....................................................................................... 46
SYSTEM GOAL--------------------------------------------------------------------------------- 46 TASK ANALYSIS ------------------------------------------------------------------------------ 47 FUNCTION ALLOCATION ------------------------------------------------------------------ 50 RESEARCH OBJECTIVES-------------------------------------------------------------------- 53
CHAPTER 4. EXPERIMENTAL METHOD................................................................ 54
SUBJECTS---------------------------------------------------------------------------------------- 54 EXPERIMENTAL DESIGN ------------------------------------------------------------------- 55
Independent Variables............................................................................................... 55 Dependent Variables ................................................................................................. 56
EQUIPMENT ------------------------------------------------------------------------------------ 57 Augmented Reality Equipment .................................................................................. 57 Inspection parts ......................................................................................................... 58 Measuring Instruments.............................................................................................. 61
EXPERIMENTAL PROCEDURE ------------------------------------------------------------ 62 Manual Inspection..................................................................................................... 63 2D-aided and 3D-aided Inspections ......................................................................... 65 AR-aided Inspection .................................................................................................. 69

vi
CHAPTER 5. RESULTS ................................................................................................ 72
INSPECTION TIME ---------------------------------------------------------------------------- 72 MEASUREMENT ACCURACY ------------------------------------------------------------- 78 INSPECTION STRATEGY DIFFERENCES BETWEEN GROUPS ------------------- 81 ANALYSIS OF THE QUESTIONNAIRE--------------------------------------------------- 84
Body Part Discomfort................................................................................................ 84 Mental Workload....................................................................................................... 86
CHAPTER 6. DISCUSSION AND FUTURE RESEARCH......................................... 89
CHAPTER 7. CONCLUSIONS...................................................................................... 99
REFERENCES................................................................................................................ 102
APPENDIX A: INFORMED CONSENT FORM ......................................................... 113
APPENDIX B: INSTRUCTION KIT ............................................................................ 117
APPENDIX C: QUESTIONNAIRES............................................................................ 134
APPENDIX D: INSPECTION REPORT & ENGINEERING DRAWINGS................ 141

vii
LIST OF FIGURES
Figure 1. First-fault inspection model ............................................................................... 7
Figure 2. Search time distribution ................................................................................... 15
Figure 3. Dimensional and geometric inspection model.................................................. 23
Figure 4. Inspection parts used in this experiment........................................................... 59
Figure 5. Manual inspection process................................................................................ 64
Figure 6. 2D-aided and 3D-aided inspection processes. .................................................. 66
Figure 7. 2D perspective of parts: 2D-aided inspections. ................................................ 67
Figure 8. Isometric perspective of parts: 3D-aided and AR-aided inspections................ 68
Figure 9. AR-aided inspection scenes .............................................................................. 70
Figure 10. AR-aided inspection processes. ...................................................................... 71
Figure 11. Average inspection time of each inspection method. ..................................... 74
Figure 12. Average inspection time of each part shape. .................................................. 76
Figure 13. Average inspection measurement deviation. .................................................. 79
Figure 14. Trade-off between inspection time and measuring accuracy.......................... 83

viii
LIST OF TABLES
TABLE 1. Taxonomies of Visual Inspection Tasks. ......................................................... 9
TABLE 2. Inspection Function and Required Human Skills........................................... 10
TABLE 3. Three Levels of Cognitive Skills for Inspection Functions............................ 11
TABLE 4. Inspection Functions and Common Errors .................................................... 12
TABLE 5. Attributes and Probability of Inspection Outcomes ...................................... 18
TABLE 6. Relationship Between Automated and Human Functions............................... 27
TABLE 7. Functions, Required Skills and Logical Errors of Dimensional Inspection. .. 29
TABLE 8. Suggested Taxonomies for Virtual Environments. ........................................ 37
TABLE 9. VE Methods for Manufacturing Tasks .......................................................... 40
TABLE 10. Criteria to Decide the Applicability of VE to Manufacturing Task ............ 43
TABLE 11. Dimensional and Geometric Attributes and Required Information Form.... 48
TABLE 12. Part Shape and Typical Dimensional Attributes. ......................................... 49
TABLE 13. Treatment Conditions for the Mixed-factors Design. ................................... 55
TABLE 14. Head-Mounted Display (i-glasses) Specifications. ...................................... 57
TABLE 15. Inspection Parts and Dimensional Attributes of Interest.............................. 60
TABLE 16. Measuring Devices and Attributes. .............................................................. 61
TABLE 17. ANOVA Summary Table of Inspection Time. ............................................ 72
TABLE 18. Paired Comparisons of Inspection Methods................................................. 73
TABLE 19. Paired Comparisons of Attributes ............................................................... 73
TABLE 20. Unconfounded Comparisons of Two-Way Interaction: Method × Attribute.
................................................................................................................................... 75
TABLE 21. Unconfounded Comparisons of Two-Way Interactions: Part × Attribute. .. 77
TABLE 22. ANOVA Summary Table of Measurement Accuracy. ................................ 78
TABLE 23. Paired Comparisons of Attributes. ............................................................... 79
TABLE 24. Unconfounded Comparisons of Two-Way Interactions: Part × Attribute. .. 80
TABLE 25. Body Part Physical Stress Difference Among Inspection Methods. ............ 84
TABLE 26. Individual Differences of Body Part Discomforts........................................ 85
TABLE 27. Mental Workloads Difference Among Inspection Methods. ....................... 87

ix
TABLE 28. Paired Comparisons of Preference ............................................................... 88
TABLE 29. Individual Difference of Mental Workloads. ............................................... 88
TABLE 30. Difference of Required Skills and Capability among Inspection Methods.. 90
TABLE 31. The Observed Inspection Error Types.......................................................... 92
TABLE 32. The Average Inspection Time for Prismatic and Rotation Parts ................. 94

1
CHAPTER 1. INTRODUCTION
The dimensional and geometric inspection designates the processes to measure
the linear, angular magnitudes, or geometric characteristics of parts. The purpose of
these measurements is to confirm and determine the compliance of parts with the design
specifications. Examples of such attributes include length, height, depth, angle, flatness,
roundness, etc. Dimensional and geometric inspection, particularly in the metalworking
industry, constitutes a dominant portion of total inspection work (Farago & Curtis, 1994).
Traditional manual methods for information acquisition are often time-consuming
and error-prone. The inspection tasks consist of a set of operations: studying part
drawings, marking, measurements, recording values, decision, and disposition. Each
operation needs different information to accomplish the inspection task. Such
information can include setup instructions, tool and equipment lists, inspection
procedures, measurement locations and sequence, quality standards, and disposition
instructions.
Augmented reality offers a new approach to design an inspection system in which
AR is used as a supplementary means or aid to support inspectors: a means to augment
the cognitive capability of inspectors, a means to improve the time-shared performance,
and a means to direct inspectors’ attention. The spatial proximity, or closeness in space,
should facilitate parallel processing between different channels (i.e., inspection parts,
engineering drawings, routing sheets, etc.). It provides the potential of an effective
inspection method for inspectors who conduct visual inspection to measure the
dimensional properties of products. Inspectors could determine the measuring points
without referring to the engineering drawings, since AR overlays the drawing onto the
product to be inspected. An additional advantage is that AR allows a higher possibility of
acceptance from workers, since it can be used to support workers rather than to replace
them. The inspectors are able to have a freedom in using AR as a supplementary means
or aid at any point in an inspection. Inspectors perform the integral part of the inspection
task and AR is only used to aid the inspectors when cognitive demand is high.

2
Augmented Reality (AR) is a growing area in virtual environment (VE) research.
A visible difference from an immersive virtual reality (VR) is that AR augments the real
world scene, necessitating a user to maintain a sense of presence in the environment.
Therefore, AR supplements reality, rather than completely replacing it. This
characteristic of AR provides users with new possibilities unlike those of immersive VR.
Because AR can help users interact with a real world environment, it has a great potential
to support a wider range of tasks in manufacturing processes that transform the physical
forms and properties of raw materials to value added products. Despite the potential of
AR technology, little research has been performed to investigate the use of AR in
manufacturing and/or inspection. The potential of AR will not be realized until several
technical challenges are overcome (Azuma, 1997). Early work with AR focused on
military applications. For many years, AR technology has been used for head-up
displays (HUDs) and helmet mounted sights (HMS) in military aircraft and helicopters to
superimpose vector graphics over the pilot’s view of the real world. Recently, AR has
been recognized as a promising technology for information transfer in many fields and
subsequently, several frontier applications are currently being investigated. Medical,
manufacturing, entertainment, and military industries have been the most popular
application areas of AR technology. Bajura et al. (1992) used AR technology to
superimpose an ultrasound image on the image of the patient. Physicians could apply AR
for visualization and surgical training. Feiner et al. (1993) built a laser printer
maintenance application, where the application was designed to show a repairman how to
open the cover and remove the paper tray. In the manufacturing arena, the European
Computer-Industry Research Center (ECRC) developed a visual model of an automobile
engine to annotate its parts.
However, most AR research has focused on the potential applications of AR.
Few studies have attempted to determine the actual performance gains possible via the
use of AR technology. One AR project that investigated performance issues was
Boeing’s “wiring jet set” (Sims, 1994). Using a crude AR prototype, workers were able
to complete a wiring task in significantly less time than with previous methods. This
resulted primarily from the fact that they no longer had to look at parts lists. Despite the
encouraging results, the researchers noted that the project was exploratory in nature and

3
that it has not yet been determined how the results could translate into overall cost
savings on jetliner construction.
The possibility of an AR-aided inspection was investigated by Chung, Shewchuk,
& Williges (1999). They developed the AR-aided inspection that conveys measurement
location and sequence data to inspectors performing thickness inspection using height
measurements. The AR was used to show the inspector exactly what and where
measurements must be taken on a part. The AR-aided inspection was compared with the
manual inspection and the computer-aided inspections based upon two performance
criteria: inspection speed and accuracy. It was found that the AR-aided inspection could
reduce inspection time about 45-65 % with the same accuracy. The greatest time savings
were achieved by the elimination of marking and cleaning functions. Though an AR-aid
showed a very promising result, the potential benefits of AR to the dimensional
inspection has not yet been fully explored. The selected task for the case study was a
specific case of a thickness inspection task not requiring the manipulation of the part
orientation, since all measurement points were placed on a single surface of the part to be
inspected. A typical dimensional inspection task that includes multiple geometric and
dimensional attributes needs to be explored to evaluate the benefits of AR technology.
OUTLINE OF RESEARCH
The design of any system should be systematic in order to optimize the
performance. The benefit of the systematic approach is that it can help system designers
understand what steps and functions are required to achieve the target system or goals.
Practicing with this tool greatly increases the probability that the final application
provides the acceptable level of quality (Drury, 1992).
The systematic design procedure consists of task analysis, function allocation, and
the evaluation of system performance. The dimensional inspection task can be divided
into component functions (i.e., operations) with the task analysis of visual inspection
found in the literature. Information needed to support each function can then be
4
analyzed. The possible design change of the inspection system can be evaluated by
considering the cognitive demands of each function and the capability of humans.
In order to assess the effectiveness of AR technology for a dimensional and
geometric inspection task, the performance differences between the manual, 2D-aided,
3D-aided, and AR-aided inspection were compared. The results obtained from these
comparisons provided a discussion on which dimensional attributes are beneficial from
AR as well as the overall performance change of the inspection system.
Work areas conducted to meet the research goals were as follows:
Background Literature [Chapter 2]
• The visual inspection studies were reviewed to identify the genetic functions and
design problems of inspection systems. The models and theories related to the search
and decision functions that decide the performance of inspection were reviewed in
detail.
• The functional elements of dimensional and geometric inspection were identified
based on the visual inspection studies. Task analysis was performed to determine
task demands and the typical errors of each function.
Development of an AR-Aided Dimensional Inspection System [Chapter 3]
• An AR-aided inspection system was designed by using the systematic design
procedure. Possible changes to support each inspection function were examined by
considering when and where AR would be effective.
• Augmented reality was used as a supplementary means to aid inspectors rather than
as a replacement of any function. It was expected that an AR-aided inspection would
improve the reliability of the inspection function and reduce inspection time.

5
Experimental Method [Chapter 4]
• A 4×2×4 mixed factors design was used to evaluate the effectiveness of AR
technology for dimensional and geometric inspection. Inspection Method (manual,
2D, 3D, and AR-aided inspections) was the between-subject factor, while Part Shape
(prismatic and rotational parts) and Measuring Attribute (point, exact point, line,
surface) were within-subjects factors.
Results and Discussion [Chapter 5 and 6]
• The overall performance differences among the manual, 2D, 3D, AR-aided
inspections were compared to validate the viability of AR technology with ANOVA.
Then, the differential affects of AR for part shapes and dimensional attribute were
discussed. It was also discussed how AR affected the inspection functions and
reduced inspection time.
• The trade-off between time and measurement accuracy was analyzed to understand
the inspection strategy of the four inspection conditions. The individual differences
within the same inspection conditions as well as the group differences between the
different inspection methods were discussed.
• In addition, the body part discomfort and mental workload of the four inspection
methods were analyzed with questionnaires. Users’ preference of the inspection
method was discussed based on the questionnaire results.
Conclusion [Chapter 7]
• Four design guidelines to design an effective AR-aided inspection system were
developed based on the experiment results. It was intended to provide the system
designers with the design guidelines of when AR is an appropriate tool to improve the
performance of a dimensional and geometric inspection.

6
CHAPTER 2. BACKGROUND LITERATURE
Inspection can be classified into attribute and variable inspection according to the
nature of the information that can be gathered by the inspectors. The attributes inspection
is a measurement on nominal and ordinal scales of whether the inspected products
possess the attributes or not, for example, a missing capacitor of PCB or a classification
of apples according to their grades (Sinclair, 1979). Variable inspection is a
measurement on interval or ratio scales where values correspond to the magnitude of
measurements, for example, a length in millimeters as in dimensional inspection.
In the context of inspection, most research was done with the attribute inspection
commonly called visual inspection. Studies of variable inspection appear less often in the
literature. Many studies assumed that variable inspection is an obvious candidate for
automation, since machines can take complex measurements and calculate the values of
interest rapidly with higher accuracy (Drury, 1992).
With the present lack of research related to variable inspection, the visual
inspection studies were reviewed to identify the generic functions of an inspection
system. Though there is a basic difference in the type of information of interest between
the attribute and variable inspections, visual inspection studies are useful to understand
the design problems of the dimensional and geometric inspection, since the nature of the
task is the same.
VISUAL INSPECTION
Visual inspection is the process by which an inspector examines parts to
determine whether or not the parts possess the attributes of interest. The magnitudes of
flaws on the parts are measured and judged cognitively by inspectors. Parts which pass
inspection can move on to subsequent operations, while parts that fail inspection must be

7
reworked, scrapped, or dealt with accordingly. A binary classification of attributes is
useful for most cases of visual inspection. Items arriving at the inspection system have
two outcomes, either they are conforming or nonconforming. Different industries use
different names for these outcomes such as accept/reject, fitness/unfitness, good/faults,
effective/defective, etc.
Part
Inspector
Fixate Area
Reject Accept
Physical
Organizational
Personnel
Flaw
Reject Flaw? Time Left?
No Flaw
Yes
No
No
Yes
Figure 1. First-fault inspection model (Drury, 1992).
The most common type of visual inspection in manufacturing is ‘first fault
inspection’. Figure 1 shows a block diagram of the first fault inspection model. The first
fault inspection is the process where an inspector detects any nonconformity of parts that
are prevented from further processing. Only accepted parts are processed, while defected

8
parts are scrapped or reworked. After a part is presented to the inspectors, it is searched
for flaws. If a flaw is found, the part is rejected if it is judged to be outside specifications.
Parts are accepted if the inspectors do not find any flaws within a certain time.
Performance Measures
Performance measurement is one of the fundamental elements of any inspection
system. The ability to make sound decisions in designing an inspection system is directly
related to the availability of adequate measures to determine the effectiveness of various
alternatives.
Drury (1992) suggested that the inspection function must fulfill four essential
characteristics: accuracy, speed, flexibility, and stability. Accuracy and speed are two
essential criteria to determine the effectiveness of the inspection system. In many
studies, the primary goals are the minimization of inspection time and inspection errors.
Flexibility and stability are rarely used to evaluate the performance of an inspection
system because they deal with the qualitative aspects of the system. However, they are
also important criteria in determining the effectiveness of an inspection system. An
inspection function should be flexible in detecting multiple defect types, since there
might be more than a single nonconforming condition and the defect types of current
interest can be changed. Finally, the inspection system should be stable and must not be
changed with time. The inspection device should not require frequent recalibration and
humans who are inside the inspection system should not be subjected to stress. These
criteria are useful to assess the effectiveness of alternative inspection systems.

9
Taxonomy of Visual Inspection
Functions or activities of the inspection can be defined by considering the task
demands in the system. The generic functions in the inspection task found in the
literature are shown in Table 1.
TABLE 1. Taxonomies of the Visual Inspection Task.
Harris & Chaney (1969)
Drury (1992) Hou, Lin, & Drury (1993)
Drury & Prabhu (1994)
Monitoring
Scanning
Measurement
Present
Search
Decision
Action
Present
Search
Decision
Action
Recording
Setup
Present
Search
Decision
Response
Drury (1992) suggested four distinctive functions for a generic visual inspection.
Those four functions are present, search, decision, and action. Each function can be
assigned to either a human or an automated machine, since each component can be
designed independently of each other. The central elements of the four functions are
search and decision-making. Search and decision functions are subject to errors with
either human or automatic inspection devices (Drury, 1992). The remaining functions are
largely mechanical in nature and are highly reliable. As seen in Table 1, other authors
have similar lists or equivalent components that contain the same central element: search
and decision.
Sinclair (1984) and Wang & Drury (1989) developed an expanded functional list
with the human skills required for inspection as shown in Table 2. Their functional list is
useful to relate these generic functions to the given inspection problem. Different skills
and cognitive abilities are related to different inspection functions. For instance, search

10
and decision functions depend mainly on the mental abilities of inspectors, but other
functions depend on manual skills.
TABLE 2. Inspection Function and Required Human Skills (from Wang & Drury, 1989).
Function Major Type of Skill Mental Attributes Required
Orient the item Manual
Search the item Perceptual Attention, perception, memory
Detect a flaw Perceptual Detection, recognition, memory
Recognize/classify Perceptual Recognition, classification, memory
Describe status of the item Perceptual Judgment, classification, memory
Dispatch item Manual
Record of information about the item
Manual and perceptual Memory
Visual Inspection Model
Drury and Prabhu (1994) conceptualized the inspection system as a sequential
progression of inspection functions along with skill/rule/knowledge-based behaviors.
The inspection model suggests a linear sequence of inspection functions, though there
might be some branches or re-entries in practice.
As shown in Table 3, an inspector functions as low-level and high-level cognitive
components in the inspection system. Skill-based behavior represents a psychomotor
behavior that consists of an automated routine without conscious control. Information for
skill-based behavior is the signal that may activate the automated behavior routines of
humans (Rasmussen, 1983). Rule-based behavior represents a conscious goal-oriented
behavior guided by rules and procedures for action. The information for rule-based

11
behaviors is a sign that depicts situations or environments. Knowledge-based behavior
represents goal-oriented, problem-solving behavior in unfamiliar situations. It requires a
functional understanding of the system, analysis of the current state, and advance
reasoning while using feedback control for error correction. During knowledge-based
behavior, the human perceives information as a symbol that can be used for reasoning.
TABLE 3. Three Levels of Cognitive Skills for Inspection Functions (modified from Drury & Prabhu, 1994).
Setup Present Search
Present to inspector
Change setup rules fordevice
RuleLevel
Decision Response
Follow routine procedureSkillLevel
Know-ledgeLevel
Adjust to setup tocurrent conditions
Successively fixateareas
Decide on search plan
Optimize search plan
Immediate decision
Follow rules onmeasurement and
classification
Optimize rule for currentsituation
Take action on item andprocess
Reason (1990) identifies errors associated with these behaviors as skill-based
slips, rule-based mistakes, and knowledge-based mistakes. Slips are the failure to
implement the intended action correctly, while mistakes are the failure to form correct
intentions. Table 4 shows common errors that could occur at each function. Reducing
inspection errors at each function by using human factors’ techniques has been the
primary objective of many studies.

12
TABLE 4. Inspection Functions and Common Errors (from Drury and Prabhu, 1994).
Function Functional Goal Errors Types
Setup Calibrate inspection system Incorrect equipment
Non-working equipment
Incorrect calibration
Incorrect system knowledge
Present Present item to inspection system
Wrong item presented
Item miss-presented
Item damaged by presentation
Search Detect and locate all possible non conformities
Indication missed
False indication detected
Indication miss-located
Indication forgotten before decision
Decision Measure and classify all indications located by search
Indication incorrectly measured
Indication incorrectly classified
Wrong outcome decision
Indication not processed
Respond Act correctly specified by decision
Non-conforming action taken on conforming item
Conforming action taken on non-conforming item
The inspection model suggested by Drury and Prabhu (1994) provides a useful
framework in understanding the required cognitive skills and logical errors of the five
inspection functions.

13
Setup
During setup, the measurement devices, decision aids, and recording devices are
prepared, checked, and calibrated. At the skill-based level, a sequence of psychomotor
skills is used to check the inspection system according to a predetermined procedure.
Possible errors at the skill-based level are repetition, reverse, and omission (Hollnagel,
1989). Checklists are useful as job aids to prevent errors at the skill-based level.
Rule-based behavior is a change of setup according to different products or
process conditions. The setup of the inspection system is adjusted to accommodate the
current situation. Errors occur when an inspector misapplies rules within multiple
conditions.
Knowledge-based reasoning is rarely required at a setup. However, it can occur if
new products are introduced, the current inspection system is changed, or a diagnosis of
the inspection device is required. Errors occur if an inspector fails to understand the new
inspection product, process, or device. This type of error is common in the process
control (Moray, Lootseen, & Pajak, 1986).
Present
Though the present is typically a machine function, it can be manually given to
the inspector if automation is not practical. It requires psychomotor skills for picking up,
orientation, placing, and disposing. The reliability of this function is high, with errors
due to either misperception of the orientation, or slips in the manual-handling (Holding,
1981). A standardization of inspection tasks and training in manual skills can improve
the reliability of this function (Salvendy & Seymore, 1973; Kleiner & Drury, 1993).
Search
Visual search is a cognitive behavior driven by the selective attentions with which
humans seek information and search targets (Wickens & Hollands, 1999). Visual search
is a sequential process that proceeds as a series of fixations linked by eye movements,
terminating upon successful detection of a target in the visual field (Drury, 1992). In the
inspectors’ field of view, a target is only visible within a small region of the visual field,
which perceives the detail.

14
The amount of information that can be extracted over time is determined by a
useful field of view (UFOV) and a dwell time. A UFOV is the circular area around the
fixation point from which information is extracted (Mackworth, 1976). Dwell time is
how long the eye is fixated on the location. The difficulty of information extraction
affects the dwell time. Dwell time increases while reading unfamiliar words or a more
difficult context (McConkie, 1983). Displays that are less legible or contain denser
information require a longer dwell time (Mackworth, 1976). Harris & Christhif (1980)
found that pilots fixated longer on critical instruments than subsidiary instruments. In a
target search task, Kundel & Nodine (1978) found that an inspector used a shorter survey
dwell to locate targets, and a longer examination dwell for a detailed examination of
targets.
One of the main interests of many studies was to develop a visual search model
that determines the time to detect targets and the probability of detecting targets in a
given period of time. Drury (1992) investigated the visual search model that assumes a
random search to predict the time it takes to detect a flaw in the sheet metal inspection.
According to the model, the probability of detection (pt) is the function of mean
inspection time, as shown in the following equation:
apnAtt
ttpt
0
exp1
=
−−=
Where t : Mean search time
t0: Average time for one fixation
A: Area of object searched
a: Area of the UFOV
p: Probability that the target is detected if it is fixated
n: Number of targets on the part

15
Figure 2. Search time distribution (Drury & Prabhu, 1994).
The relationship between the probability of detection and time can be seen in
Figure 2. The model predicts that the probability of locating targets increases with more
search time. The probability of locating targets increases at a diminishing rate because a
target may be fixated upon more than once without being detected, and search strategies
do not cover the whole field even though enough time is given. The model implies that
the inspection time can be determined by the cost of the time and the cost of misses.
With the search model, Drury (1992) could determine the optimal inspection time with
the given probability of fault ratio and desired overall accuracy. Industrial applications of
the model showed that search time varies according to the difficulty of the search. The
average search time varied from 0.7 to 2.5 sec. for easy flaws, and 1.5 to 8.5 sec for
difficult flaws (Drury, 1992). This result implies that search time can be shortened if the
conspicuity of a target is increased against the background. Conspicuity is defined as the
amount of parts searched in a unit time.
A search pattern is assumed by either a fixed systematic process or a random
process (Morawski, Drury, & Karwan, 1980). A target search is described as a free field
search in which an inspector locates a target randomly. On the other hand, a systematic
0 10 20
0.0
0.5
1.0
Time (sec)
Prob
abilit
y of
Det
ectio
n
Systematic search
Random search

16
search in which an inspector scans the whole inspection area in a systematic manner
could reduce inspection time, as shown in Figure 2. Each fixation is only placed in
unsearched areas in a systematic search. The eye movement study showed that the search
pattern depends on tasks. For example, a random search is used for the circuit board
inspection, while the combination of a systematic search and a random search is used for
the knitwear inspection (Megaw, 1979).
To a large extent, a visual search is a skill-based behavior. Experienced
inspectors perform a visual search automatically without any cognitive effort (Drury
Prabhu, 1994). Errors at the skill-based level are failures to detect a target or detection of
a non-target as a target. As shown in the search model, the size of UFOV influences both
the probability of detection and the search time. It was found that several factors have
influences on the UFOV: lighting conditions (Blackwell, 1970), conspicuity of the target
against the background (Chaney & Teel, 1967), the size of the flaw, the distance between
the flaw and the eyes of the inspector (Overington, 1973), aging (Ball, Beard, Roenker,
Miller, & Griggs, 1988; Scialfa, Kline, & Lyman, 1987), training (Ball et al., 1988), and
task demand in the fovea region (Williams, 1989). Often the simple positioning of lights
or the changing of viewing angles can enhance the detectibility of a particular flaw.
Colored lights have proven to be helpful in the color matching inspection (Kantowitz &
Sorkin, 1983). The elderly take smaller UFOV from the scene and scan samples slower
than the young, but training can enlarge UFOV and all age groups can benefit from
training. Also, adequate time breaks or rest time prevents the decrease of the sensitivity
of the system.
Errors at the rule-based level occur if an inspector uses a search plan that does not
lead to the target. Knowledge-based behavior is related to the search strategy which
determines the search plan and search time (Schoonhard, Gould, & Miller, 1973). Errors
at this level consist of: neglecting target areas and stopping a search too early. Humans
do not search an entire area in exhaustive fashion and can miss targets within the UFOV
(Abernethy, 1988; Kundel & Nodine, 1978). A target search is driven by the expectancy
of where a target is likely to be found (Wickens & Hollands, 1999). For instance, an
inspector often searches a certain location first based on prior experience concerning the
likelihood of a target being there. This cognitive characteristic of visual scanning

17
behaviors has been used to account for differences between novices and experts. The
expert examines first and more closely those areas where targets are likely to appear,
while the novice tends to search whole area evenly (Kundel & Lafollette, 1972).
Decision
The decision component of various inspection tasks was examined by many
studies (Adam, 1975; Craig & Colquhoun, 1975; Drury, 1975; Drury & Prabhu, 1994;
Hou et al., 1993). These studies modeled the decision function, which has four outcomes
associated with probabilities. Correct decisions are correct accept (accept a conforming
item) and hit (reject a nonconforming item), while errors are miss (accept a
nonconforming item) and false alarm (reject a conforming item). These two errors are
often called type II and type I errors, respectively. The probability of these four
outcomes are defined as follows:
p1: Probability of accepting a conforming item
p2: Probability of rejecting a nonconforming item
1-p1: Probability of accepting a nonconforming item (Type II error)
1-p2: Probability of rejecting a conforming item (Type I error)
p′: Actual defect rate of an item
Average values of p1 are around 0.90 to 0.99, while average values of p2 are
around 0.80 to 0.90 depending on industries (Sinclair, 1984). A useful measure to
evaluate the inspection performance is the effective fraction nonconforming ( ep′ ) that is
the probability of total rejected parts. If the inspection system is perfect, ep′ is equal to
the actual defect rate of the item ( p′ ).
)1()1( 211 pppppe −−′−−=′

18
These measures can be used to evaluate and diagnose the inspection system.
Also, they can be used to evaluate the system design process to ensure that a new design
fulfills its objectives.
TABLE 5. Attributes and Probability of Inspection Outcomes (from Drury, 1992).
True State of Item Inspection Decision
Conforming Nonconforming
Total
Accept Correct accept
p1(1-p′) a
Miss
(1-p2)p′ -b
p1+p′(1-p1-p2)′
Reject False alarm
(1-p1)(1-p′) -c
Hit
p2p′ d
(1-p1)-p′(1-p1-p2)
Total 1-p′ p′ 1
As the four outcomes can be associated with the probabilities, these outcomes can
also be associated with costs (–b, -c) and rewards (a, d). Table 5 includes a payoff matrix
which shows the cost and reward structure of inspection.
Signal detection theory (SDT) is useful in understanding the decision process and
optimization of the expected payoff. In SDT, inspectors may be described in terms of
their response bias. Risky responders detect most nonconforming items (i.e., hits) but
produce many false alarms, while conservative responders make few false alarms but
miss many of the non-conforming items. Signal detection theory is able to prescribe how
to determine the optimal response bias in a given condition as related to the probability
and payoff matrix of the four outcomes (Green & Swets, 1988; Swets & Pickett, 1982).
The decision can be optimized by controlling p1 and p2 which an inspector adjusts
according to the payoff matrix.
The signal detection theory explains that p1 and p2 vary in two ways. If the
inspector and the task are kept constant, the inspector shifts the response bias so that the
probability of accepting a conforming item (p1) increases while the probability of

19
rejecting a nonconforming item (p2) decreases. The balance between p1 and p2 depends
on payoffs and a nonconforming rate (p′ ). The changes to the inspectors or tasks
increase both p1 and p2 by influencing the inspectors’ discriminability between
conforming and nonconforming items (Drury & Prabhu, 1994).
Signal detection theory explains that inspectors’ perception of the costs of making
an error is important in adjusting the decision criterion to an appropriate level. The actual
value of the decision criterion (β) can be computed from the probabilities of hits and false
alarms. Laboratory (Chi, 1990) and field studies (Drury & Addison, 1973) showed that
inspectors modified their decision criterion toward the optimal level. However, another
laboratory study suggested that the adjustment of a decision criterion is less than the
optimal level (Wickens & Hollands, 1999). The sluggish beta (β) is more pronounced
when beta is manipulated by probabilities than by payoffs (Green & Swets, 1988). The
sluggish beta phenomenon has been demonstrated clearly in the laboratory, where precise
probabilities and the payoff matrix can be specified to inspectors. The sluggish beta
phenomenon in the field study was reported by Harris & Chaney (1969). They reported
that inspectors failed to lower beta when the defect rate fell below 5% in a Kodak plant.
This sluggishness is explained by the humans’ misperception of probability. People tend
to overestimate the probability of very rare events, while underestimating the probability
of very frequent events (Sheridan & Ferrell, 1974).
Several studies tried to apply incentive schemes to inspection, because early
studies found that the reward structure was a determining factor of the balance between
type I and type II errors. In laboratory experiments, the reward structure based on type I
and II errors changed the performance as expected. However, there is little evidence
from industry that incentives based on the type I and II errors are effective (Drury, 1992).
Incentive schemes provide rewards for inspectors as well as feedback on performance. It
was found that the rapid feedback of inspectors’ performance reduced type I and type II
errors (Drury & Addison, 1973; Wiener, 1984; Micalizzi & Goldburg, 1989). These
studies suggest that the feedback may be the most effective way to control inspection
performance.
Feedforward information, detailed information about incoming material minute-
by-minute, can influence the response bias. In the laboratory experiment, inspectors

20
could control p1 and p2 according to the true defect rates (Wiener, 1984). Feedforward
information was also effective for a multi-defects inspection task (Drury, 1990).
Signal detection theory makes a conceptual distinction between the response bias
and the inspectors’ sensitivity, the resolution of the detection mechanism. For most
situations, sensitivity varies between 0.5 and 2.0 (Swets, 1964). A departure from the
optimal level results from the inspector’s forgetfulness of the precise characteristics of
the target. When memory aids are provided to remind the inspector what the targets are,
sensitivity approaches optimal level (Wickens & Hollands, 1999). Decision errors can be
reduced by providing standards for inspectors in complex inspection tasks. Given the
limit standards, the decision task can be changed from absolute judgment to a more
accurate comparative judgment. Photographs of typical defects can reduce inconsistency
between inspectors and prevent a drift of decision criteria over time. Limit standards
could act as memory aids which remind the inspector of what the defects are (Harris &
Chaney, 1969; Kelley, 1955).
The decision function can be an automatic process in the case of severity or the
absence of any defects, because the decision becomes trivial and skill based. For
instance, missing components in assembly will automatically trigger a rejection response.
Errors for rule-based behaviors are slip errors, since misses and false alarms are failures
to implement the intended action correctly. In general, however, a decision is mainly
rule-based behavior. Inspectors make a decision based on rules which are passed on by
job experience from senior inspectors or written documents. Errors can be due to
misapplying the rules. Drury & Sinclair (1983) provided a typical example in roller
bearing inspection tasks where inspectors misapplied rules because of the confusion of
defect names. Rule-based decisions can be improved by training and job aids for
complex rules (Kleiner & Drury, 1993).
Knowledge-based decisions can be improved if inspectors have accurate
information about the costs of false alarms and misses. Inspectors can form an optimal
strategy that maximizes the expected values across the decision outcomes (McNichol,
1990). Knowledge about defect types and their probable occurrence rate (Sheehan and
Drury, 1973) and performance feedback (Drury and Addison, 1973) can improve the
reliability of decision.

21
Respond
When a defective item is removed from the production system, the inspector
needs to record the data related to the action taken. Only skill-level behaviors are
required for response, and errors are slips rather than mistakes. To improve the reliability
of the respond function, human factors principles can be applied to workplace design.
Within the three-dimensional envelope of a workplace, specific design decisions need to
be made by considering the inspection task. The horizontal work surface areas to be used
by seated or sit-stand inspectors should provide for manual activities to be within a
convenient arm’s reach (Barnes, 1963). Enough space should be left for rejected items to
be stored, so as not to discourage a rejection response because of a tiring action. Data
recordings might be more reliable if the automated data capture is achieved.
DIMENSIONAL AND GEOMETRIC INSPECTION
Dimensional and geometric inspection is closely related to visual inspection. The
nature of the task and the function in the manufacturing system are almost identical.
However, the dimensional and geometric inspection can be differentiated from the visual
inspection in three aspects.
First, dimensional and geometric inspection is interested in the variable, the real
number representing the measurement. Since the dimensional and geometric inspection
uses quantitative data, the decision function becomes highly reliable with a computer. In
terms of function allocation, the decision function is an obvious candidate for automation.
Second, the existence and location of targets (i.e. flaws) are not known in visual
inspection, while the existence and location of targets (i.e., measuring dimensions) are
known in the dimensional and geometric inspection.
Third, dimensional and geometric inspection has no time limit. Inspection is
continued until all the dimensions of interest are measured. Inspection time is the
criterion that determines the performance level of the inspection system rather than
constraints. On the other hand, Drury’s first-fault model (1992) includes time

22
constraints. If a critical flaw is not found in the given time, it is assumed the part is
conforming.
The inspection process of a generic dimensional and geometric inspection can be
depicted as shown in Figure 3. Though the inspection process is different from visual
inspection to determine defects, the inspection process can be conceptualized from a first-
fault model where any nonconformity (e.g., out of tolerance) of a part prevents that part
from being processed further. The part is removed from the inspection system as soon as
any nonconformity is found without any more effort to find another nonconformity. If
any attribute is out of tolerance, the parts will be scraped or sent back for rework. This
diagram model will be used as the basis to design an AR-aided dimensional inspection
system.
In the case of variable inspection, measurement variation often becomes one of
the most important criteria in determining the performance of the inspection system along
with inspection time. It was known that distributions of measurement variation are often
approximated by normal distribution. The true distribution can be compromised by bias
and imprecision (Mei, Case, & Schmidt, 1975). If the inspection error is independent of
the value of the product measurement, the average measurement variation is determined
by the average bias and average imprecision. The measurement of bias and imprecision
is rarely reported in the inspection literature because the results depend on the
characteristics of products measured and the measuring instrument (Drury, 1982). With
the improvement of precision in the measuring instrument, the reliability of the
measurement function can be improved.

23
Setup
Item Present
Study Drawing
Marking
Measurement
Within tolerance?
Yes
Need marking?
Yes
No
Another marking?
No
Another measure?
Yes
No
Yes
Another attribute?
No
Yes Recording
Repeatmeasurement?
Yes
No
Calculation
Disposition
Cleaning
No
Figure 3. Dimensional and geometric inspection model.
24
Structured Search
There are two different types of visual sampling behaviors in the literature: visual
sampling of unknown targets and of known targets. The visual sampling behavior of
unknown targets has been studied in the context of the visual inspection of flaws, such as
a flaw on a piece of sheet metal. Inspectors scan the intended areas or objects to detect
the target of which the existence and location are unknown. The search is driven by
cognitive factors related to the expectancy of where a target is, and the visual search
pattern becomes less structured than that of known targets. The visual search model of
unknown targets proposed by Drury (1975) is often called free field search or visual
search.
The search model of known targets in which the visual sampling is guided by the
expected events among different channels is called structured search (Wickens &
Hollands, 1999). The search pattern of the dimensional inspection is very similar to the
structured search, where inspectors determine the measuring dimensions according to
engineering drawings in the dimensional and geometric inspection. Unfortunately,
however, research on the search model of dimensional and geometric inspection (i.e.,
study drawing: selecting a dimension of interest on engineering drawings by referring to
inspection reports) is not found in the literature.
The visual sampling behavior of known targets has been studied in supervisory
control. The operator scans the various displays and allocates attention to them through
the structured visual sampling. The probability of missing an event is directly related to
event frequency and uncertainty. Frequent events are more likely to be missed, as they
are not sampled, or the timing of events is uncertain. According to Wickens & Hollands
(1999), humans use a mental model of the statistic properties of the events (how
frequently and when the event will occur) to guide a visual sampling. However, the
sampling rate is not adjusted enough for frequent and rare events as much as it should be
as seen in the sluggish beta phenomenon. This imperfect sampling is explained by
imperfect memory: humans tend to oversample the rare events because of forgetfulness.
The general findings of the visual sampling studies are well summarized by Moray
(1986).

25
Structured visual sampling behaviors have also been applied to the design of
computer-based menu systems (Somberg, 1987). The basic concept is to structure the
menu in such a way that the target can be found in the minimum time. The linear visual
search model (Neisser, 1963) was used to determine the search time. These studies could
provide a useful understanding of the structured search, though they could not succeed in
developing a model that can predict the exact search time.
Since information or cueing can be used to guide in the structured search, it is
possible to direct an inspector’s attention to appropriate areas. It appears that cues can
direct the spotlight of attentions and the correct cueing reduces errors. Cueing increases
the sensitivity to a target location and results in fewer errors (Kinchla, 1992; Downing,
1988).
Augmented reality can influence the structured visual sampling behaviors via
directing attention and spatial proximity. The effectiveness of intelligent cueing which
directs the users’ attention to a certain target in the see-through HMDs is investigated by
Yeh, Wickens, & Seagull (1998). The finding was that cueing reduces target detection
time for expected targets, but increases detection time and the number of errors for
unexpected targets. When the cue was unreliable, it directed attention to unwanted
objects (Downing, 1988). These results imply that intelligent cueing can be effective for
various tasks, but that humans might depend too heavily on the cues.
The benefits of spatial proximity have also been proven in driving and aviation
applications using head-up displays (HUDs). Goesch (1990) found that an automobile
HUD could facilitate the parallel processing between two channels by superimposing a
view of a speedometer on a view of a road. Sojourner & Antin (1990) compared driver
performance between HUDs and head-down displays to find that HUDs have an
advantage for detecting cues presented in the road sign. In aviation applications, a HUD
could improve the control of positioning during landing when the view and runway were
obscured by clouds (Wickens & Long, 1995). Martin-Emerson & Wickens (1977) also
reported that the alignment of the display object to the real object helped the human
divide attention and reduce the tracking error. However, some experimental data
suggests that spatial proximity will not always guarantee parallel processing (Becklen &
Cervone, 1983; Neisser & Becklen, 1975). Neisser & Becklen (1975) conducted

26
experiments on whether or not subjects can detect the critical events on the two games in
which one is superimposed over the other. They found that subjects had difficulty when
detecting events in the two games at once, and failed to see unusual events in one game
while monitoring the other game. Similar results were observed in aviation (Goesch,
1990; Steenblik, 1989). When a HUD was used to facilitate the simultaneous processing
of inside and outside information in the cockpit, a pilot might treat the two distances as
different attention channels. The pilot’s cognition became occupied in processing
information on the HUD while ignoring critical cues from outside the aircraft. Also,
Wickens & Long (1995) reported that an unexpected obstacle was more poorly detected
with the HUD than without it. The HUD facilitates the parallel processing of scenes and
symbology when the pilot expects the stimulus.
Another factor affecting the spatial proximity is the conformal nature of
symbology, the correspondence between objects and the position of the objects as related
to the real world (Wickens & Long, 1995). It was found that the alignment of the display
object to the real object helped the pilot divide attention between the display and the
scene of the world, and thus reduce tracking error (Martin-Emerson & Wickens, 1977).
In AR studies, this is often called a registration problem of virtual objects.
Although spatial proximity may allow parallel processing, it also imposes the
potential for confusion between the scenes momentarily wanted and those momentarily
unwanted. Several studies have found that subjects failed to focus attention because of
this confusion (Wickens & Andre, 1990; Holahan, Culler, & Wilcox, 1978). The critical
variable in predicting performance is the degree of spatial separation of irrelevant items
in the field of view. Separation might be defined by not only the difference of the visual
location, but also by the nature of the perceived activity. If two perceptual channels are
close together, they will both be processed, even if only one is desired. If the implication
for action is incompatible, intrusion/distraction would increase. On the other hand, if
both have common implications for action, perceptual competition would be minimized
between the two channels. Many failures occur when divided attention is mandatory
rather than optional. Parallel processing will help a task performance only if the task
requires parallel processing.

27
Taxonomy of Dimensional and Geometric Inspection
In the context of dimensional and geometric inspection, the taxonomy of
inspection has not been differentiated from that of visual inspection in the literature.
However, a useful list of dimensional inspection functions is found in a coordinate
measuring machine (CMM) and an automated visual inspection system (AVIS). The
functions of the automated inspection system provide useful insight in identifying the
functional list of dimensional and geometric inspection, since automated inspection must
logically fulfill all of the inspection functions (Farago & Curtis, 1994). Though the
functions do not represent the natural breakdown for dimensional inspection, a
compatible functional list of CMM, AVIS, and visual inspection are useful in identifying
the functions of dimensional inspections, as seen in Table 6.
TABLE 6. Relationship Between Automated and Human Functions.
CMM AVIS Visual Inspection Dimensional Inspection
Object Handling Object Handling Present Present
Probing Scanning Search Study Drawing
Signal Processing Measurement
Calculation
Computer
Computer
Decision
Decision
Object Handling Object Handling Response Response
Human functions found in the inspection literature are still valid for the automated
inspection (Harlow, Henderson, Rayfield, Johnston, & Dwyer, 1975) and the dimensional
and geometric inspection. However, there are basic differences between visual
inspection and dimensional inspection in search and decision functions.
For dimensional and geometric inspection, search corresponds to study drawing,
while decision function needs to be classified into measurement, calculation and decision

28
since each one requires different cognitive and motor skills in order to complete the
inspection task. In the flaw inspection, the magnitude of flaws is measured and judged
cognitively by inspectors, and the cognitive measurement is included in the part of
decision function. On the other hand, dimensional inspection requires an actual
measurement of the magnitude with measuring devices. After the measurements, an
average value of the measured dimensions needs to be calculated to decide the
disposition of parts. Measurement and calculation become distinctive components of
decision in dimensional inspection. Marking and cleaning are supportive functions for
measurement. Not every dimensional inspection necessarily includes all of these
functions. Marking and cleaning functions are not required when the exact measuring
point is not critical in the measurements of the attribute.
As a result, eight functions can be identified, as shown in Table 7. The eight
functions include present, study drawing, marking, measurement, recording, decision,
cleaning, and disposition. It is necessary that the designers should understand how AR
influences the performances of various inspection functions to realize the potential of
AR. The usefulness of AR can be determined by considering if AR is an effective tool to
support the cognitive demands for each function. Table 7 shows required physical skills
and cognitive resources to perform each function. The list of logical errors is also very
useful, since system designers determine which errors occur and when they occur.
Reducing inspection errors at each function should be one of the primary objectives of
this study through the systematic design process. The compensation of the inspection
error results in a redesign of the inspection system by considering the capability of human
inspectors and the required cognitive abilities of each function.

29
TABLE 7. Functions, Required Skills and Logical Errors of Dimensional Inspection.
Function Required Resources Logical Errors AR Aids
Present Manual Wrong item presented
Item miss-presented
Item damaged by presentation
Perception
Attention
Confusion on measuring attributes
Miss attributes of interest ×
×
Study Drawing
Memory Forget measuring attributes
Forget measuring locations ×
×
Manual Incorrect marking ×
Attention Miss marking ×
Marking
Memory Forget marking locations ×
Manual Incorrect measurement
Attention Wrong read out instruments
Measurement
Memory Forget the measured values
Incorrect instrument knowledge
×
Manual Incorrect recording Recording
Memory Incorrect calculation ×
Decision Attention Select wrong values ×
Memory Fail to recall the recorded values
Decision not processed ×
Cleaning Manual Forget to clean marked spots ×
Disposition Manual Wrong action for disposition
Present, recording, and disposition are mechanical functions. Psychomotor skills,
such as, setting up measuring devices, placing an item, and writing the measured value,
determine the performance of these functions. Since these functions depend mainly on
manual skills, AR does not support these functions.
The search pattern follows a structured or focused search (Wickens & Hollands,
1999) in which inspectors search the known target (i.e., measuring dimension) from

30
engineering drawings. Then the inspectors locate the measuring points on the parts by
referring to temporarily stored information, and measure the dimension of interest. The
performance of study drawing depends largely on selective attention. For proper
dimensioning, inspectors refer to engineering drawings and select only the relevant
information for the current measures. Errors can be caused because of a discrepancy
between the three-dimensional real parts and two-dimensional representation of the real
parts. Another logical error is that inspectors might miss or become confused by the
current measuring variable due to multiple measurements on various dimensions. AR
can be used to highlight or direct inspector attention in determining the measuring
variable. It is useful in reducing inspection time and slip errors.
Decision function performs the same role as in visual inspections for flaws. The
disposition value is compared with design specifications to see if it is acceptable or not.
Decision performance depends mainly on attention and memory. Errors occur when
inspectors forget what the measured value was, or make mistakes in calculation. The
reliability of a decision can be improved with AR aids since errors are mainly caused by
forgetfulness. By providing the spatial proximity between the measured and the
compared value, errors can be reduced. However, the decision is made with ratio scale
data (e.g., cm, mm) rather than with nominal scale data. The decision is relatively easier
than the decision-making with the nominal scale data, since it uses quantitative data. The
decision functions can benefit from automation, since the decision-making algorithm can
be highly reliable with the quantitative data. Since a computer is a component of the AR
system, it can support data storing and mathematical calculation though those capabilities
are rarely used for AR applications.
Note that marking and cleaning are not needed anymore in the AR-aided
inspection system. By superimposing the measuring information over the real parts,
these functions can be eliminated from the inspection task. The pilot study (Chung et al,
1999) showed that the greatest time saving was achieved by the elimination of these two
operations.

31
Automated Inspection
With advances in sensors and computers, automated inspections are one of the
logical solutions to improve the performance of inspection systems. Even in a fully
automated system, humans are still required for supervisory control and monitoring in an
outer loop. Inspectors are responsible for setup, calibration, and supervisory control,
while machines are responsible for complex measurements and calculations in an
automated inspection.
The performance of an automated inspection system can be measured with the
same criteria that are used for the manual inspection. Accuracy and speed are important
measures to compare the effectiveness, though the cost must be included to compare the
cost-benefits of the two methods (Drury & Prabhu, 1994). Accuracy can be measured by
the probability of accepting a conforming item and the probability of rejecting a
nonconforming item. In the case of variable inspection, the measurement accuracy is
often used to measure the performance of an inspection system. Often studies evaluate
the accuracy of the inspection system by its capability to detect small defects (Hara,
Okamoto, Hamada, & Akyama, 1980)
There is a scattered body of literature on AVIS. Automated visual inspection
systems typically use sensors to capture images of the inspection components, image
processing systems to take measurements, and objects handling systems to transport
parts. However, many AVIS has failed because of the stability of environments. Several
factors such as illumination levels, types of illumination, reflectivity, and contrast affect
the performance of the inspection system. For instance, cloth brightness can be changed
due to ambient illumination (Takatoo, Takagi, & Mori, 1989). Lighting intensity should
be sufficient to nullify the interference from ambient sources.
Currently, the automated inspection of flaw detection has not provided fruitful
results. The performance difference between experienced inspectors and an optical
inspection device was compared with high-precision metal parts (Drury & Sinclair,
1983). Both the humans and the machines conducted search and decision on four
different types of faults. It was found that human inspection was better than automated
inspection in terms of false alarm and hit rates. The main finding was that the automated
system was better at locating the defect (i.e., search), while the human was better at

32
decision making. With these findings, they concluded that there is a good possibility of
using machines for the searching function, while leaving the decision function to the
human. In automated inspection, the relation between detection effectiveness and false
alarm is not well understood. An automated inspection system can detect very small
defects by increasing gain that reduces a detection threshold, but most detection devices
and algorithms of the automated visual inspection system suffer from high false alarm
rates (West, 1984). Defects on simple visual fields are relatively easy to detect. Difficult
products to inspect are those that contain complex visual patterns such as a printed wiring
board and photomasks for integrated circuits and hybrid circuits (Drury & Prabhu, 1994).
Because the finding of the automated inspection studies show that neither the human nor
the automated system achieved satisfactory results, inspection studies in the literature
tried to optimize inspection performance by allocating inspection functions properly
between humans and machines. The ground rule was to assign tasks to the human that
humans excel at and assign tasks to the machine that machines excel at by considering
the capabilities and limitations of each subsystem. Hou et al. (1993) designed five
different inspection systems for an automotive electronic company: human inspection,
computer-search human-decision, human-computer decision-sharing, and automated
inspection. They designed two different hybrid inspection systems by changing the
degree of function allocation between humans and machines. In a computer-search
human-decision, if the computer detects defects, it shows the defects to inspectors who
decide about the status of the defects. In a human-computer decision sharing, the
computer performs both search and decision, but the inspector takes over the decision if
the confidence level is low. The false alarm rates and hit rates were used to compare the
overall system performance among these inspection systems. The result showed that the
two hybrid inspection systems have a better performance than the automated inspection.
The human inspection was also significantly better than the automated inspection, a result
consistent with the finding of Drury & Sinclair (1983). There was no significant
performance difference between the human inspection and the hybrid inspection.
However, the computer-search human-decision system (0.9460) had the marginally
higher sensitivity value than the human inspection (0.9457) and the human-computer
decision-sharing system (0.9071).

33
On the other hand, an automation of variable inspection such as dimensional
inspection achieved visible progresses. Two types of automated inspections have been
explored in the literature of variable inspection. Bosch (1987) suggested the advantage of
the CMM and electro-optic technologies in the dimensional inspection system, though the
performance of these systems was not reported. One of the common industrial 3D
geometric inspection methods involves tactile sensing, using CMM. The part is initially
fixed in a given position in the CMM, and the location of certain points is measured. The
CMM can provide a high degree of measuring accuracy. However, the CMM are slow in
operation because a single touch probe is used to take many individual readings from the
surface of the inspected object and inspectors have to guide the tactile probe to these
measuring points. Such a machine requires detailed programming for each of the
different objects. Thus, especially when small quantities of certain parts need to be
inspected, the CMM becomes very time consuming and inefficient.
Some AVIS applications found in the literature are a 3D machine vision for the
inspection of the surface form of cylindrical parts (Reid & Rixon, 1985) and a visual
gauging system for the inspection of the dimensional location of automobile parts
(Mahdvieh, 1987). Skaggs & Meyer (1985) developed an optical metrology system
which can inspect various dimensions of parts, such as length, hole diameter, width, and
the angle of two lines. They reported that the average inspection time for each dimension
was 0.8-3.6 seconds and the measurement variation was less than 0.0003 inch. Lim,
Swaminathan, Woo, Chan, & Wonh (1997) developed the automated inspection and
dimensional measurement for optoelectronic components. They reported that the system
was capable of measuring the dimension with an accuracy of 30 µm by using CCD
cameras. However, most of AVIS can solve the limited class of dimensional inspections.
Most successful applications are found in measurements that can be measured with 2D
perspectives, for instance PCB, and sheet metal inspections. Because of technological
limitations, many 3D vision systems often suffer from measurement accuracy (Martin,
1992). Another disadvantage of AVISs is that AVISs only can check visible features.
Any feature that cannot be seen by the cameras cannot be measured.

34
In cases where automation is not economically viable or desirable, measurements
must be done manually. In custom job shops, a manufacturing system needs high
flexibility under the condition in which there are various products with a small amount of
quantity. Workstations are arranged without emphasis on any particular routings, making
them equally able to handle various products with different routings. With the rapidly
changing characteristics of orders, highly skilled workers perform machine setup,
fabrication, assembly, material handling maintenance, and inspection tasks. Between
these tasks and/or during the last step, inspections are conducted to check if all
dimensional and geometric attributes of the products conform to design specification.
Accordingly, an inspection system needs a high degree of flexibility to deal with various
products, and automation does not become a practical solution. An inspection is
conducted with generic types of inspection instruments (e.g., vernier caliper) rather than
with automated instruments for specific products.
Intervention Techniques
Various intervention techniques are found in the literature. Though the
effectiveness of the intervention techniques was mainly tested in visual inspection, these
techniques are also applicable for the dimensional inspection.
Drury (1992) suggested that the three possible design changes to improve the
inspection performance are product, process, and person. Process change means the
redesign of the inspection process, work place, job, etc. Procedure changes include
lighting (Faulkner & Murphy, 1975), standards (Kleiner & Drury, 1993), visual or
ergonomic aids (Kleiner, 1983), search strategy (Bloomfield, 1975), feedback (Drury &
Addison, 1973), speed (Drury, 1979), and job enrichment (Maher, Overbach, Plamer, &
Piersol, 1970).
Inspector changes are done to make the inspector fit well to the inspection system
by training (Czaja & Drury, 1981; Gramophdhye, Bhagwar, Kimbler, & Greenstein,
1998) and selection (Tiffin & Roger, 1941). Training is effective and necessary, while
selection is not. A major problem related to selection is that it has been difficult to devise
selection or placement procedures for inspections. Several inspection tests were

35
suggested, but the validity of these tests was not determined (Wiener, 1975). On the
other hand, good standard training has proven very effective to bring novices to an
experienced work standard. Studies showed that not only can a visual search be
improved with the controlled practice, but also decision making and discriminability can
be trained (Embrey, 1979). Kleiner & Drury (1993) showed that training could provide a
performance improvement for experienced inspectors, too. Inspectors who had a job
experience for 2 to 14 years could achieve a better performance with a two day training
program which contains seven sections: naming of parts, naming of flaws, handling,
standards, search, decision-making, and process interface.
Product change means the change of the inspected items. However, no study was
found in the visual inspection literature, though examples are available in other
manufacturing tasks.
The most commonly used intervention approaches were training, lighting, and
visual/ergonomic aids and these approaches were very successful in various inspections.
Some studies applied several intervention approaches together (Chaney & Teel, 1967;
Kleiner & Drury, 1993), and their results were usually better than using any single one.
All of these intervention techniques are useful for the dimensional and geometric
inspection, but the selection of intervention techniques is decided by considering
application domains, tasks, parts inspected, etc.
VIRTUAL ENVIRONMENTS FOR MANUFACTURING TASKS
Virtual environment (VE) technology has been recognized as having a potential
that has a wide range of applications, and there are increasing discussions of its feasibility
in industrial applications. Many pioneering studies have focused on the development of
brand new applications to prove the technological possibility of VE. Applications of VE
technology in manufacturing are just beginning to emerge. The manufacturing industry
has assessed VEs as an affordable technology that has a potentially wide range of
applications (Wilson, Brown, Cobb, D'cruz, & Eastgate, 1995). Several studies showed
that VE technology is a powerful means of information provision for a wide variety of

36
manufacturing tasks (Dai, 1998; Wilson et al., 1995; Wilson, Cobb, D'Cruz, & Eastgate,
1996). These applications are directed toward using VE technology as a means of
improving performance for a wide variety of manufacturing tasks involving inspection.
Although relatively few manufacturing applications of VE and even fewer empirical
studies that evaluate these applications exist, the potential for using VE in manufacturing
is greatly based on current VE demonstrations.
Taxonomy for Virtual Environments
To discuss VEs in manufacturing in an organized manner, some type of taxonomy
is required to classify the VEs. Various classification schemes of VEs have been
suggested in the literature as shown in Table 8. These authors classified the taxonomy of
VE according to the fidelity (Zeltzer, 1992), presence (Sheridan, 1992), and experience
(Naimark, 1992; Robinett, 1992) associated with VEs. Even though they suggested quite
different dimensions to classify VEs from each other, all of them tried to quantify the
degree of users’ perception and experience in VEs.
Zeltzer (1992) proposed the taxonomy of VEs, based on three components:
autonomy, interaction, and presence. He suggested that the AIP cube can be used as a
useful tool to contrast VEs, as well as graphic simulation systems. Similarly, Sheridan
(1992) proposed three principle determinants of a sense of presence which are an extent
of sensory information, a control of the relation of sensors environments, and the ability
to modify the physical environment. He suggested that these dimensions can be
represented as three orthogonal axes to determine the perceived presence in VEs.
Zeltzer (1992) and Sheridan (1992) tried to classify the VEs according to the users’
perception, while Naimark (1992) and Robinett (1992) tried to classify the VEs according
to the physical properties of the system.

37
TABLE 8. Suggested Taxonomies for Virtual Environments.
Investigator Dimension of Taxonomy Viewpoint
Zeltzer (1992) Autonomy
Interaction
Presence
Measure of fidelity
Sheridan (1992) Extent of sensory information
Control of relation of sensors environments
Ability to modify physical environment
Operational measure of presence
Naimark (1991) Monoscopic imaging
Stereoscopic imaging
Panoramics
Surrogate travel
Real-time imaging
Recording and reproducing visual experience
Robinett (1992) Causality
Model source
Time
Space
Superposition
Display type
Sensor type
Action measurement type
Actuator type
Synthetic experience associated with HMD based systems
Milgram and Drascic (1997) suggested a taxonomy for VE representations, in
which the degree of reality and virtuality is described on a reality-virtuality continuum.
The four major components of this continuum include reality, augmented-reality,
augmented-virtuality, and virtuality. Reality defines the environment as consisting solely
of real objects observed via a video display such as telepresence using video cameras.
Augmented reality is an augmented environment where computer-generated images are
added to the real environment. Most augmented-reality systems are coupled with see-

38
through head-mounted displays (HMDs) and head trackers. Task-related or analog
information is provided from the computer to support the operators who are executing
tasks in the real environment. The success of AR applications depends mainly on the
way information is transmitted to the operators rather than the immersive feeling or
fidelity in the VE. This class of applications can support tasks requiring the physical
manipulation of real objects. The concept of augmented virtuality is almost the same as
augmented-reality except the primary virtual environment is enhanced through some
additional real world image. Augmented virtuality provides a partially immersive
environment where real physical objects interact in a virtual world. An example of
augmented virtuality is where a user reaches forward in the virtual world and grasps a
virtual object on a VE workbench that provides a large projection screen, or in a Cave
Automated Virtual Environment (CAVE) that provides a VE room. Virtuality is a
completely immersed environment and is commonly referred to as virtual reality. Many
applications are implemented using a HMD to provide complete immersion. The main
uses of virtuality are training and applications requiring simulation that do not allow the
operator to interact with real objects. The success of these applications depends on the
level of immersive feeling and the degree of fidelity of the VE.
These taxonomies provide a qualitative tool for contrasting VEs, but there is no
agreed classification scheme among them. The problem with using the current
taxonomies is that these taxonomies are independent of one another and are very difficult
to apply to the manufacturing domain.
Virtual Environment Methods
Chung, Shewchuk, & Williges (submitted) classified four VE methods for
manufacturing by considering the way of information provision. The four VE methods
are visualization, simulation, information provision, and telerobotics.
Visualization occurs when users navigate in a VE. Although visualization
requires a 3D representation of objects in the VE, the difference between visualization
and traditional 3D computer-aided design (CAD) is that visualization concentrates on the
high degree of perception rather than on the pure quality of the graphic (Wilson et al.,

39
1996). Visualization can be employed for almost all types of manufacturing tasks but is
particularly well-suited for the design of manufacturing facilities and the product as well
as for the planning. The process of designing and validating products via a real-time
graphics system that allows the user to be immersed in and to interact with the product, is
known as virtual prototyping (Dai & Göbel, 1994; Flaig & Thrainsson, 1996).
Simulation is applicable when users need to control the virtual objects and change
their state in the same way as they do in the real world. Virtual objects act like real
objects in response to unscripted user actions. The critical component of the VE
simulation is the interaction between users and virtual objects. It requires more than
realistic visualization; it also requires realistic physical behavior on the part of the virtual
objects. Therefore, most VE simulations employ multi-modal displays to support
realistic interaction between users and the VE. Simulation holds particular promise for
training operators to execute manufacturing activities and to evaluate the design of
equipment, systems, and tasks that either do not exist in the real world or for which actual
usage would be impractical or cost-prohibitive.
Virtual environments can be used to guide and support users to complete their
work more efficiently by means of information provision. Task-related information, such
as instructions and data, can be conveyed to the users both when and where needed via
VEs. Augmented reality is a useful tool for providing information for the execution of
real-world tasks, because it provides the composite view of virtual and real scenes.
Information-provision is particularly well-suited for aiding in controlling & monitoring.
The performance enhancement can be achieved by reducing operators’ workload and
facilitating parallel processing.
Telerobotics is used when the user interacts with virtual or real objects in an
unscripted manner. The remote environment is reconstructed by using VE to provide a
sense of telepresence for operators. Virtual environment supports operators to conduct
real tasks via a robot or some other electromechanical device. It is typically useful in
helping to remove an operator from a hazardous environment. Telerobotics is employed
for the physical processing in manufacturing.
The choice among different VE methods for a given task depends on the
information requirements of the task. The manufacturing process consists of various

40
tasks that are determined by the nature of the products to be made. Every manufacturing
process, however, is comprised of planning, physical process, and control and
monitoring. Six major manufacturing tasks can be identified based on functional and
implementation views over the life cycle of a manufacturing process (Shewchuk, Chung,
& Williges, 2002). These six major tasks are design of manufacturing tasks, design of
manufacturing facilities, training, control and monitoring, planning, and physical
processing activities. Since each of the six types has different information requirements,
the suitable VE method for each will also differ.
Chung et al. (2002) grouped the various VE applications found in the literature
according to the manufacturing task and VE methods, as shown in Table 9. This
classification is useful in deciding whether a certain method is appropriate or not for a
certain task in the systematic manner. Table 9 shows that there is a certain relationship
between manufacturing tasks and VE methods: a certain VE method might be superior
over other methods for a certain task. For example, visualization is a useful method for
all types of manufacturing tasks except the physical processing task. On the other hand,
information provision and telerobotics are useful for the physical processing tasks which
require physical interaction with real objects.
TABLE 9. VE Methods for Manufacturing Tasks (from Chung et al., 2002).
VE Methods
Manufacturing Tasks Visualization Simulation Information Provision
Telerobotics
Design of Manufacturing Tasks 4
Design of Manufacturing Facilities 2
Training for Manufacturing Tasks 2 4
Planning 19 4
Control and Monitoring 3 2
Physical Processing 10 8
Total 30 8 12 8

41
Based on this framework, it was found that the information provision method is
suitable for an inspection task which is included in control and monitoring tasks. Virtual
environment, especially AR, is an effective means to transfer the task information for
inspectors, because it allows inspectors to see both virtual and real objects together. It
can help reduce operator workload and facilitate multitasking.
Chung et al. (1999) found that AR technology could enhance a visual inspection
performance via directing attention and spatial proximity. They developed an AR-aided
height inspection system that could provide spatial proximity between real parts and
engineering drawing. Since the measuring information was superimposed on parts with
AR, all the measurements can be taken without marking. The AR-aided inspection took
significantly less time than the manual or computer-aided inspection in the case of a
height inspection task. They compared the inspection times for three different parts
which are flat, convex, and stepped parts, and found that the flat part took significantly
less time than the convex or stepped parts, whereas inspection times for the convex and
stepped parts were not significantly different from each other. An interesting find was
that the AR-aided inspection was not influenced by the part shapes: inspection times were
nearly identical over all part shapes. On the other hand, inspection times with manual
and computer-aided inspections were significantly increased as part shapes become more
complex. With these observations, they concluded that AR was very promising for
inspection tasks, where tasks are more involved and parts much more complex.
The potential of AR has not been fully proven yet. The previous test showed the
possibility only for a specific case of thickness inspection not requiring the manipulation
of the part. The typical inspection task, which includes multiple dimensional attributes,
should be evaluated to determine the benefits of AR.
Potential Benefits of AR
In the context of inspection, some special methods of improving search efficiency
include overlays and blinking inspection. Overlays are special patterns with which the
difference between the pattern and parts is enhanced by projecting the overlays over the

42
part. Overlays were very effective for the printed circuit board (PCB) inspection task
(Teel, Springer, & Sadler, 1968). Blinking inspection uses a similar method, but the
difference appears to flash on and off by the rapid alternation of a perfect part and a part
to be inspected. Blink inspection uses a temporal alternating of an item with a known
perfect item, both items being registered on the same visual field. A difference between
the two items will appear to blink, while the rest remains steady (Liuzzo & Drury, 1980).
They reported a 30% reduction in error and a 60% increase in throughput using video
blinking, but also negative effects such as stress and eyestrain among inspectors. These
applications could achieve the performance improvement by increasing the conspicuity of
targets against the background. The inspectors’ sensitivity, the resolution of the
detection, could be improved with a separation between the noise and the signal.
The concept of using AR is somewhat different from that of the blinking
inspection and overlays. Augmented reality offers a new perspective, a supplementary
aiding, in designing a visual inspection system. Three distinctive characteristics of AR
are useful to improve the performance of the manufacturing and inspection systems. First, AR can be used to augment the senses and cognitive abilities of operators.
In many manufacturing applications, AR can be used as an intelligence amplification
(Brooks, 1996) to make a task easier to perform. Augmented reality is presented to
enhance users’ perception by transferring information that the users cannot directly detect
with their own senses.
Second, AR can improve the time-shared performance of two concurrent tasks by
providing a spatial proximity of two information channels. For instance, AR is
applicable when an inspector has to pay attention to the engineering drawings and the
inspection part simultaneously. The same scenario can easily be applicable to the
assembly, monitoring, and supervisory control tasks.
Finally, AR can be used to direct inspectors’ attentions. It can guide the
inspectors during the inspection task by providing task information according to the task
sequence. For instance, studying a drawing requires the selective attention which decides
the appropriate cues among various aspects of the parts’ information. Because AR can
provide the information that is only related to the current subtask, inspectors can focus on
the useful cues easily without being distracted by inappropriate cues that stand out.

43
When inspectors need to refer to an inspection manual, tolerances, or standards, AR can
provide the required information. Through the use of AR, operators can acquire task
specific information in a more efficient, timely, and accurate manner.
Limitation of AR Technology
The usefulness of AR technology depends on the nature of the tasks and the
required information. As seen in Table 10, the criteria that can be used in deciding the
applicability of VE to manufacturing tasks were suggested by Chung et al. (submitted).
If the task demands attention for two spatially separated channels, AR has a high
potential for the task. On the other hand, skilled-based tasks with which users need little
task information gain no great benefits from AR. The task requiring fine work might not
be a good candidate for an AR application. The visual pixel resolution of the-state-of-
the-art HMDs is about 3.75-5 minutes of arc per pixel with 120°×60° field-of-view
(FOV) (Ellis, 1995), while the human eye can perceive 1 min of arc (Kroemer, Kroemer,
& Kroemer-Elbert, 1994) with wider FOV. Since commercially available HMDs have
far less resolution with a narrow FOV, tasks requiring a high degree of visual accuracy
are not appropriate.
TABLE 10. Criteria to Decide the Applicability of VE to Manufacturing Tasks (from Chung et al., 2002).
Attributes Criteria Consideration
Type of skill The degree of requiring a high level of skill (mental ability vs. physical skill)
Fineness of task The degree accuracy (e.g., resolution) required to perform a task
Interaction The degree of requiring interaction with real objects
Task
Task interference Possibility of task interference caused by VE systems
Modality Type of human sensory domains employed such as visual, auditory, haptic senses, or a combination of these
Information Type Analog, prepositional, or distributed representation
Information
Volume Amount of information associated with the VE application

44
The benefits of interactivity to performance are often reported in the literature, but
the conclusions are not yet decisive (Burdea & Coiiffet, 1994; Kalawsky, 1993; Stanney ,
Ronald, & Kenny, 1998). While many researchers assumed the benefits of interactivity,
interactivity has a differential effect depending on the task workload. Interactivity
improves users’ navigation performance under normal workload conditions, while it
affects negatively under high workload conditions (Williams, Wickens, & Huchinson,
1994). Since interactivity increases the workload demands, user performances could
suffer from a very high interactive system. The interactivity is beneficial to the extent
that it is maintained within human information processing limitations (Card, Moran, &
Newell, 1983). The types and levels of interactivity should be matched to the given task
profiles. Virtual environment applications, which have achieved successful results until
now, can be characterized by a low degree of interaction between users and the system.
Much of the fruitful results were achieved in the architectural walkthrough, or
information visualization which requires a low degree of interaction. Some of those
examples are virtual wind tunnel (Bryson, 1997), virtual data visualization (Robertson,
Card, & Mackinlay, 1993; Risch, May, Thomas, & Dowson, 1996), scientific exploration
(Dede, Salzman, & Loftin, 1996) and virtual prototyping (Finger et al., 1997; Flaig &
Thrainsson, 1996). Research using a high degree of interaction is underway, but these
more complex applications have not yet shown great results (Bowman & Hodge, 1998).
Many interactively complex applications of immersive VEs have suffered from the
usability problems. Only some visible success has been achieved in less immersive VE
applications such as desk-top VEs (Wilson, Brown, Cobb, D'cruz, & Eastgate, 1995;
Wilson, Cobb, D'Cruz, & Eastgate, 1996). Chung et al. (1999) demonstrated an AR-
aided inspection in which subjects use a keyboard to interact with the VE. The users
need to memorize several command keys to manipulate the virtual objects and number
keys to input the data. Even though they used a typical keyboard, they could develop a
very useful and usable application with a small number of wisely selected commands and
functions.
A dominant element of VEs is visual displays. Though auditory and haptic
displays are often used, they are used as a supplementary means to a visual sense.
Therefore, the tasks associated mainly with visual and spatial senses (e.g., layout,

45
maintenance) have a higher feasibility than the tasks associated with psychomotor skills
or haptic sense (e.g., fabrication). Among different types of visual information, analog
(e.g., graphic) information has generally more promising results than alphanumeric data
or texts. The efficacy of the AR representations depends on the type of information they
are intended to provide. Preece et al. (1994) discriminated three types of representation to
represent knowledge: analogical representation, prepositional representation, and
distributed representation. Analog representations are picture-like images or 3D graphic
images. Prepositional representations are abstract and language like statements that make
assertions. Distributed representations are networks of nodes where knowledge is
implicit in the connections between nodes. Augmented reality could be beneficial for the
system that requires the analog information, but less useful for the system that requires
prepositional and distributed information.
The volume of information is also critical, because it is one of the main factors of
feedback lag. Human operators will suffer control difficulty if time lag is greater than
250 ms (Ellis, 1995). Rendering time, tracking and other computation like collision
detection are major factors for the feedback lag of VE applications (Zachmann, 1998).
The technological limitations of AR should be reviewed carefully, since they
confine the ways of presenting information. Even with the state of the art technology, it
is not possible to build a fully implemented VE system (Furness & Barfield, 1995). The
proper alignment and registration of virtual objects to the real world is difficult to satisfy
with existing equipment. Since even tiny errors in registration are easily detectable by
the human visual system, most applications assume a static viewpoint (Azuma, 1997).
Also, AR equipment, such as HMDs, wires, etc., can interfere with users’ tasks. With the
development of non-intrusive equipment, however, these problems will be minimized.
Any application using AR technology should avoid these technological limitations to
design an effective inspection system. The number of the AR or VE elements needs to be
reduced and, then the remaining elements need to be optimized for the task at hand with a
systematic design approach.

46
CHAPTER 3. DEVELOPMENT OF AN AUGMENTED REALITY-AIDED DIMENSIONAL INSPECTION
The typical approach to analyze the inspection is to view the inspection as a
system. Drury (1992) suggested using the system design concept for the design of any
system in order to avoid sub-optimization of the system. The steps for a systems
approach are: system goals are written, the logical system functions to achieve the goals
are deduced, each function is allocated to a human or machine and each function is
designed in detail, and then, the system is tested and evaluated before manufacturing and
delivery.
SYSTEM GOAL
The system goal is the overall performance (i.e., speed and measurement
accuracy) improvement of a dimensional inspection task. It is intended to reduce the
cognitive demands of the task and to support inspectors with AR aids.
To determine the geometric dimensioning of a part, inspectors should know what
needs to be measured and where the measures are to be taken. Since two channels, real
and virtual scenes, provide supplementary information to complete the task, the AR will
be used to facilitate a parallel processing. Parallel processing will improve the inspection
performance in high demand environments, but it also causes the failure of focused
attention. The need to maintain a spatial proximity of the two channels might interfere
with the inspection performance. Design challenge is how to minimize the confusion
between two channels and the cognitive demands to perform the task.

47
TASK ANALYSIS
The dimensional attribute defines the linear and angular magnitudes of the parts,
while the geometric property defines the forms or features of the parts. Table 11 shows
that these attributes can commonly be found in any dimensional and geometric
measurements (Farago and Curtis, 1994).
The geometric shape of parts can be classified into prismatic and rotational
shapes. Commonly, the prismatic shape has two bases, and three or more lateral
polygons (Giesecke, Mitchell, Spencer, Hill, & Dygdon, 1986). The rotational shape
includes cylinders, cones, and spheres. The typical dimensional attributes of each
geometric shape are useful to understand the difference between two part shapes in
inspection. The geometric and dimensional properties of prismatic parts include length,
height, thickness, angle, flatness, squareness, parallelism, etc. On the other hand, the
geometric and dimensional properties of rotational parts include length, thickness,
diameter, contour, roundness, etc. The same attributes can appear in both the prismatic
and rotational parts. Often, a part can have both geometric and dimensional properties of
the prismatic and rotational shapes, if it consists of the combination of two shapes.

48
TABLE 11. Dimensional and Geometric Attributes and Required Information Form.
Property Dimension Related Dimension Measuring Instrument
Dimension Length Width
Height
Rules, Tapes
Vernier caliper
Micrometer
Go-no go gage
Thickness Height Vernier caliper
Height gage
Ultrasonic thickness gage
Depth Length Vernier depth gage
Depth micrometer
Diameter Vernier caliper
Go-no go gage
Angle Universal bevel protractor
Geometric Form
Flatness Straightness Dial indicator with base
Perpendicularity Squareness Height gage stand with guideways
Steel squares
Profile Contour Dial indicator with base
Contour gage
Optical comparator
Parallelism Dial bench gage
Roundness Circularity
Concentricity
Coaxiality
Form regularity
Dial indicator, V-blocks, mandrel
Location Coordinate location
Vernier caliper
Coordinate measuring machine (CMM)

49
As seen in Table 12, every attribute can be measured by any of four types of
measurements: point, exact point, line, and surface measurements.
Point measurement is used to measure the length, width, diameter, etc., since they
are measurements of the shortest distance between two corresponding surfaces on the
part. When the measured part has a flat bottom, often height, depth, and thickness can be
measured at a point.
TABLE 12. Part Shape and Typical Dimensional Attributes.
Part Shape Property Dimensional Attribute
Point Length, Width, Height, Depth, Thickness, etc.
Exact point Height, Thickness
Line Angle
Prismatic
Surface Flatness, Parallelism, Squareness, Straightness, Perpendicularity, etc.
Point Length, Height, Wall thickness, Diameter, etc.
Exact point Height, Thickness
Line Angle
Rotational
Surface Roundness, Circularity, Concentricity, Coaxiality, Form regularity, Straightness, Parallelism, etc.
Exact point measurement is the special case of the point measurement. There are
two methods in placing measuring instruments: proximal and exact device placing. In
proximal device placing, the measurement can be taken at any two points on the surfaces.
For example, length is not sensitive to the measuring location, as long as two surfaces are
parallel. In exact device placing, a measuring device should be placed on the specific
point. Note that the marking function is needed for only the exact placing of the
measuring device.
The angle is a line measurement that is formed by two intersecting lines. Surface
measurement is used for the geometric property which defines the geometric forms and
interrelationships of surfaces defined by such concepts as straightness, perpendicularity,

50
parallelism, roundness, etc. The surface measurement requires the movement or the
rotation of the measuring devices or the measured parts to determine values.
FUNCTION ALLOCATION
The functions of dimensional inspection were identified by the task analysis. An
inspection system must perform all of these inspection functions, whether performed by
humans or machines, or by the combination of these two. In the system design sense,
each function can be assigned to either human or machine components.
Fitts list was the first analytical attempt used to allocate functions between
humans and machines. The rule for functional allocation was that functions in which
humans perform better were assigned to humans and functions that favored machines
were assigned to machines. He viewed humans and machines as two competitive
subsystems to perform various functions within the system. However, the Fitts list had
little impact on the engineering design practice, because of a lack of good allocation
algorithms.
An alternative technique is to allocate as many functions as possible to machines
(Chapanis, 1970). This approach could improve the overall system performance, but
leftover functions became an unreasonable set of tasks or an underload task set for
humans. The operators fail to build an appropriate mental model, when the functions left
over for the humans do not form a coherent set of tasks. A designing strategy assigning
the maximum number of functions to machines is likely to produce an underload for
humans. Stress is created when task demands do not match human capabilities.
Bailey (1982) suggested a balanced approach in which allocation can be classified
into categories because of the practical design situation: allocation to machines by
management, allocation to humans and machines by requirements, allocation by
systematic procedure, and an inability to allocate. A balanced approach captures a favor
of designers at work, but does not offer any quantitative guidelines to allocate functions.
Many visual inspection studies tried to improve the performance of an inspection
system through the Fitts approach (i.e., hybrid inspection) or Chapanis’s approach (i.e.,
automated inspection). However, the automated inspection and hybrid inspections have

51
not provided fully satisfied results, though the hybrid inspection showed a possibility of
performance improvement, as seen in the literature.
A more promising design approach for an inspection system might be a
complementary approach. Jordan (1963) set forth the premise that humans and machines
should be considered not comparable, but rather complementary. Activities to perform a
function should be shared by a man and machine without separation. Function allocation
should be determined on how to provide affective and cognitive supports for the human
in the system (Sanders & McCormick, 1993). Affective support refers to the emotional
part of humans, such as job satisfaction and motivation. Cognitive support refers to
design considerations that promote the development of an adequate mental model, and
that ensure an appropriate level of involvement in the task.
Augmented reality technology can be used for augmenting or assisting functions
when inspectors show cognitive limitations. Using AR technology is intended not as a
replacement of a certain function but as an aid to support the function necessary to
complete an inspection task. The inspectors perform the integral part of inspection tasks,
and AR technology can support the functions when cognitive demand is high. With the
supplementary approach, AR can allow a dynamic function allocation in which the
system can be designed to allow workers to make allocation decisions at any given point
in time during the system performance (Kantowitz & Sorkin, 1983). Augmented reality
can provide the freedom for inspectors whether they deploy AR or not. Since AR can be
used as a supplementary means, an inspector can override an AR system anytime, if it is
desirable. This property might make AR more attractive and acceptable to workers.
Another advantage of AR is flexibility. The flexibility of an inspection system is
also one of the important performance criteria, even it is rarely measured because of the
lack of appropriate measures. It is rare that an inspection system has a single
nonconforming condition. More often, an inspection system deals with multiple defect
types, and changes the strategy to detect particular defect types of interest. Since AR is a
very flexible medium to modify the information by reprogramming, the inspection
system can accommodate any change (e.g., change in products, defects types) easily.
One of the foreseeable drawbacks of AR is the wearing of HMDs for a long
period of time, yet no one reported any discomfort during the pretest experiment.

52
However, the effects of prolonged exposure to AR need to be identified for real
applications in the work place. The subjects experienced only about 30 to 45 minutes in
the pretest experiment; this short one-shot experience for users might not be enough to
judge the negative effects of AR. To prevent this problem, AR aids need to be designed
in a less intrusive way so that the weight of HMDs is supported by a stand. The similar
examples are a watch repairman using a magnifier to repair a watch, or an inspector
inspecting a small cylinder with a magnifier (Kleiner, 1983).
Possible changes to support each inspection function were reviewed by
considering the cognitive demands of each function and the capabilities of AR to support
these demands. Four inspection methods that were designed by the systematic design
were manual, 2D-aided, 3D-aided, and AR-aided inspections. The manual inspection
uses the typical dimensional inspection method that includes engineering drawings and
inspection reports. The 2D-aided inspection uses a computer to transfer the inspection
information rather than engineering drawings. The graphic information on the computer
screen was the same as that of the engineering drawing, but measuring attributes
appeared one-by-one according to the inspection sequences. Inspectors could conduct
inspection without spending time for a search with this sequential delivery of measuring
information. Also, the calculation for mean value and the decision processes were
automated with the computer. The 3D-aided inspection was the same as the 2D-aided
inspection except for the graphic representation of parts. All the parts and measuring
information were drawn with isometric perspectives. The AR-aided inspection used the
same graphic representation of the 3D-aided for parts. However, all the information was
delivered to inspectors using HMDs. The composite view of the parts and measuring
attributes should enable parallel processing between the two channels.
It was expected that the AR-aided inspection would improve inspection
performance by increasing the reliabilities of the search and decision functions and by
eliminating the marking and cleaning functions. The AR-aided inspection helps reduce
inspection time and errors. To test the suggested hypotheses, the experiment was
designed to assess the performance differences of these four inspection methods.

53
RESEARCH OBJECTIVES
The main objective of this study is to improve the performance of dimensional
inspection that includes various dimensional and geometric attributes by using AR aids.
The secondary objective is the development of guidelines in designing an AR-aided
inspection system. These design guidelines can help the system designers understand
ways in which information is presented with AR. It is expected that the design guidelines
can be applicable for various manufacturing tasks, though the scope of this study is
limited to the dimensional inspection.
To achieve these objectives, the performance data of the AR-aided inspection and
other comparable technological alternatives need to be obtained with regard to their
effects on inspection time, measurement accuracy, and the user’s preference.
Research Hypotheses
Research hypotheses that can be used to evaluated the validity of the AR-aided
inspection and to form design guidelines were established. The research hypotheses
being tested by this study are:
Hypothesis 1: AR-aided inspection improves inspection performance. Augmented reality
helps decrease inspection time and improve measurement accuracy.
Hypothesis 2: The benefit of AR is dependent on part shapes. The performance
improvement of prismatic parts with AR is different from that of rotational
parts.
Hypothesis 3: The benefit of AR is dependent on measurement attributes. The
performance improvement of point measurement with AR is different from
that of exact point, line, or surface measurement.
Hypothesis 4: The subjects who use the AR-aided inspection have a higher preference to
their inspection method than the subjects who use the manual inspection.

54
CHAPTER 4. EXPERIMENTAL METHOD SUBJECTS
All subjects were recruited from the students who have taken or are taking the
Manufacturing Processes Laboratory (ISE 2214) course of Industrial and Systems
Engineering Department at Virginia Polytechnic and State University in the Fall of 2001.
Twenty-four subjects with 20/20 visual acuity and normal color vision were selected by
using a vision tester (BAUSH & LOMB).
Then, since the inspection task requires a visual search and cognitive ability to
understand how the 2D figures turn into 3D objects, cognitive capability tests were given
to all subjects before the experiment. The visualization test was given to measure the
ability to manipulate or transform the image of spatial patterns into other forms. The
visualization scores ranged from 10 to 20 with an average of 15.4. According to the
related study (Ekstrom, French, & Harmon, 1976), no subject had a serious problem in
visualization capability.
To minimize the variation of inspection skills among subjects, the experiment was
performed after each subject completed the inspection of a pulley and a base plate in the
class. Inspection practice consisted of inspecting various dimensional and geometric
attributes with measuring instruments, recording the required information on a part
inspection report, and determining the acceptance of the attribute. Also, prior to
performing the experiment, each subject was given about an hour of instruction and
practice, under controlled conditions. Since all subjects have enough knowledge to
understand the complex engineering drawings and dimensional inspection processes, the
training time could be minimized.

55
EXPERIMENTAL DESIGN
A 4×2×4 mixed factors design was used to evaluate the effectiveness of AR aids
for dimensional inspection tasks
Independent Variables
Inspection Method with four levels (manual, 2D-aided, 3D-aided, and AR-aided
inspections) was the between-subjects factor, while Part Shape with two levels (prismatic
and rotational parts) and Property with four levels (point, exact point, line, and surface
measurements) were the within-subjects factors. As shown in Table 13, twenty-four
subjects were randomly assigned into four different inspection methods: six subjects for
each of the manual, 2D-aided, 3D-aided, and AR-aided inspection methods.
TABLE 13. Treatment Conditions for the Mixed-factors Design.
Inspection Method Part Shape Property
Manual 2D 3D AR
Point S1-S6 S7-S12 S13-S18 S19-S24
Exact Point S1-S6 S7-S12 S13-S18 S19-S24
Line S1-S6 S7-S12 S13-S18 S19-S24
Prismatic
Surface S1-S6 S7-S12 S13-S18 S19-S24
Point S1-S6 S7-S12 S13-S18 S19-S24
Exact Point S1-S6 S7-S12 S13-S18 S19-S24
Line S1-S6 S7-S12 S13-S18 S19-S24
Rotational
Surface S1-S6 S7-S12 S13-S18 S19-S24

56
Dependent Variables
The two dependent variables are average inspection time and measurement
accuracy. Also, a subjective questionnaire was used to evaluate the physical stress and
user satisfaction of the four inspection methods. Inspection time is the average time to
complete the inspection of each dimensional property. The measurement accuracy is
defined as the deviation from the true dimensional value. The subjects were instructed to
measure each attribute one by one: to measure the next attribute, they must complete all
the required processes of the current attribute. This experiment condition gave a
conservative result in terms of the inspection time. Often, inspectors can take measures
in a more efficient way in the real inspection situation for all four inspection methods.
They can determine multiple measuring points together or take multiple measures
together regardless of the attributes. Since the subjects measure attributes in turn, the
given task might include some additional manipulations of parts: the different attributes
which appear on the same surface could not be measured at once.
The physical and mental workloads of the four inspection methods were measured
with Likert-type scaled subjective questionnaires at the end of the experiment. The body
part discomfort diagram (Wilson, 1998) was used to measure the physical workloads,
while the modified NASA task loading index (TLX) was used for the mental workload.
The NASA TLX (Hart & Staveland, 1988) and Subjective Workload Assessment
Technique (SWAT) (Reid & Nygren, 1988) permit the operator to rate the task on the
basis of multiple dimensions. The subscale of NASA TLX are mental demand, physical
demand, temporal demand, performance, effort, and frustration level, while the subscale
of SWAT are time load, mental effort load, and psychological stress load. The original
TLX takes into account the individual differences of these subscales by asking each
subject to indicate the subscale which affects the workload the most. The weighted
average of each subscale is obtained by a pair-wise comparison of subscales. The SWAT
uses a similar process to determine the relative effects by rating subscales with a three-
points scale. However, (Nygren, 1991) reported that there was no psychometric basis for
calculating the weighted average for TLX. Also, other studies suggested that either the
weighted average or the derived SWAT score is not superior to the average of subscales
(Christ et al., 1993)

57
EQUIPMENT
The augmented reality equipment, inspection parts, and measuring instruments
that were used in this experiment are as follows:
Augmented Reality Equipment
The HMD employed was Virtual i-glasses (Virtual i.O, Inc.), a binocular HMD
system equipped with a head tracker. The unit employs a liquid-crystal display (LCD)
with 640x480 VGA resolution, a 60 HZ refresh rate, and a 30° field-of-view (FOV) for
each eye. A complete set of technical specifications for the unit was presented in Table
14.
TABLE 14. Head-Mounted Display (i-glasses) Specifications.
Parameter Performance
Field of view 30° horiz.×22.5°vert. with full overlap
Resolution VGA (640×480)
Convergence 25 feet from viewer
Focal distance 12 feet from viewer
Maximum brightness 10 foot-lamberts
Maximum contrast ration 100:1
Vertical scan rate 60 or 70 Hz
Weight 8 Ounces
For this experiment, however, the unit was used in a monocular mode and the
head tracker was not employed. The pilot study showed that binocular vision made the
computer images appear to “float” in front of, rather than merge with, real objects. This
made it difficult to use the images to “mark” the part surfaces, as required by the
inspection task. To avoid this problem, the non-dominant eye was blocked by a filter in
the eyepiece, resulting in monocular vision. With both eyes open, subjects were asked to

58
make an alignment between a 1-foot-long black vertical line about 10 feet away and their
thumb. Then, each eye was blocked individually to check when the alignment was
broken. For example, if the alignment was broken when the right one was blocked, the
right eye was dominant.
The head tracking capability of the unit was found to be inadequate for the precise
alignment requirements of this study, and thus was not used. Instead, the inspectors
simply control the position of the AR display as necessary to align the image with the real
object. The default eye-to-part distance of a computer-generated wire-frame is about
35.5 cm, which corresponds to a normal reading distance. To ensure that the image had
the same orientation as the real object with respect to the viewer, the ability to rotate the
image via keyboards was incorporated into the application program. The application
program was developed using WorldToolKit by Sense8 and executed on an Intergraph
TDZ-310 workstation.
Inspection parts
A total of six parts, three prismatic parts and three rotational parts, were used in
this experiment, as seen in Figure 4. The dimension of all parts ranges less than 5×5×5
inches. Six parts which include the dimensional properties and attributes of interest were
selected from various machining tools. The three prismatic parts were the safety key, the
finger guide, and the tool holders, while the three rotational parts were the step pulley, the
holder, and the roller stud (Giesecke et al., 1986). These parts included the various
measuring attributes that are typical for the prismatic and rotational part of interests. The
dimensional and geometric attributes, and the tolerances of each part are shown in the
engineering drawings (see Appendix D).
Since the properties are embedded in the parts, the measurable properties depend
on the part. Each part includes little difference in measuring attributes, as seen in Table
15. For example, length, width, and height appear more often on the prismatic parts,
while diameter, roundness, and concentricity appear more often on the rotational parts.
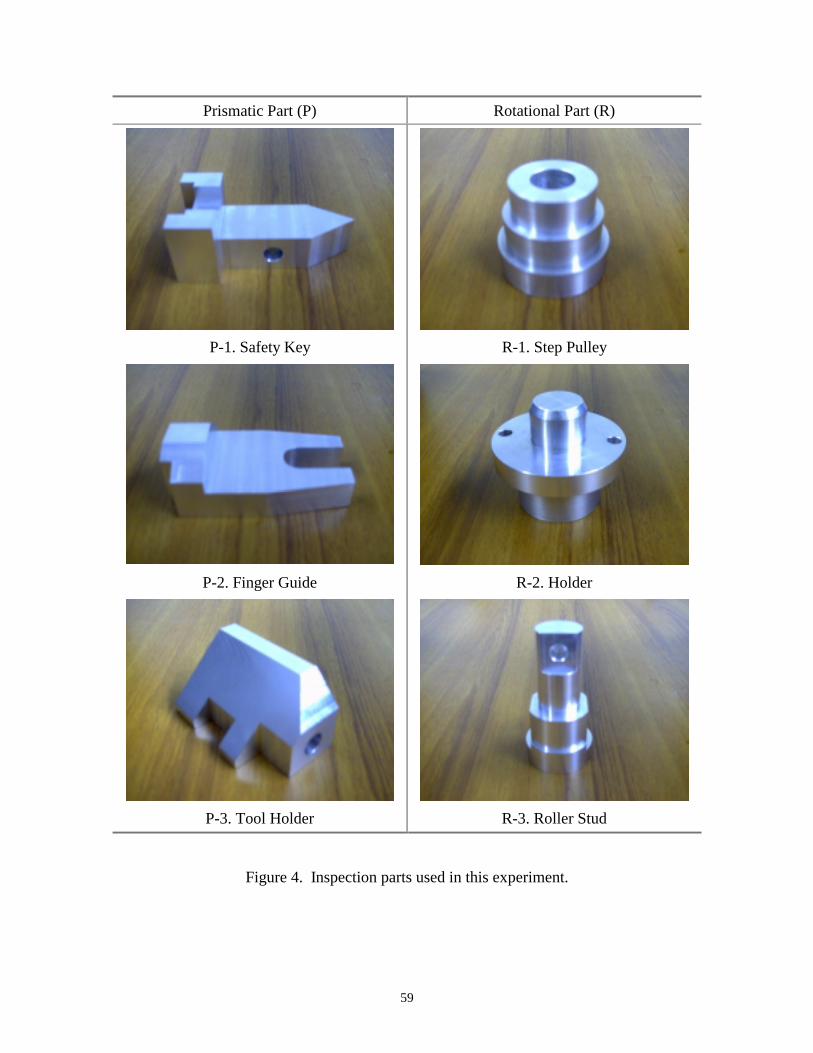
59
Prismatic Part (P) Rotational Part (R)
P-1. Safety Key R-1. Step Pulley
P-2. Finger Guide R-2. Holder
P-3. Tool Holder R-3. Roller Stud
Figure 4. Inspection parts used in this experiment.

60
TABLE 15. Inspection Parts and Dimensional Attributes of Interest.
Part Shape Parts Property Attributes
Point Length, Width, Diameter, Depth
Exact Point Height
Line Angle
Safety key
Surface Flatness
Point Length, Width
Exact Point Thickness
Line Angle
Finger guide
Surface Parallelism
Point Length, Width, Diameter
Exact Point Height
Line Angle
Prismatic
Tool holder
Surface Flatness
Point Length, Width, Diameter
Exact Point Not available
Line Not available
Step Pulley
Surface Flatness, Roundness
Point Length, Width, Diameter
Exact Point Height
Line Angle
Holder
Surface Roundness
Point Length, Width, Diameter
Exact Point Not available
Line Not available
Rotational
Roller Stud
Surface Concentricity

61
Measuring Instruments
The selection of measuring instruments depends on the inspected parts’ shape,
size, volume, the tolerance rate, etc. Table 16 shows the measuring devices for the
dimensional attributes that were used for this experiment. The general types of devices
which are commonly used to measure each dimensional attribute were used for the
experiment.
TABLE 16. Measuring Devices and Attributes.
Device Model Attribute
Dial caliper Mitutoyo 505-644-50 Length, Width, Height, and Diameter, Hole Diameter, Depth
Height gage Mitutoyo 509-313 Thickness and Height
Bevel protractor Mahr 106 Angle
Dial gage with base and surface plate
Peacock SPI 20-3333 Flatness, Parallelism, Roundness, and Concentricity
The attributes that share common properties can often be measured with the same
measuring instruments, though the effectiveness of the instruments for each attribute
might be different according to the measuring situations. A vernier caliper is commonly
used for all kinds of point measurements. Often, however, each attribute can be
measured with a certain measuring instrument which is designated to measure a certain
attribute depending on the parts. A height gage is useful for surface plate work as a
layout tool, for marking off vertical distances and for measuring height differences
between various steps. Sometimes, specialized devices, for example a go no-go gage,
can be used for a certain case if only the nominal scale (e.g., go no-go) is of interest
rather than the ration scale (e.g., inch, or mm).
The selection of measuring devices was decided by considering how each
attribute is measured in a real situation. A dial caliper was used for the measurement of
length, width, and inner/outer diameter. A height gage was used to measure the
height/thickness in the center of the part. A depth gage was used to measure the depth.
The universal protractor was useful for an angle, and the dial gage was useful for other
surface measurements (e.g., flatness, roundness, etc.).

62
EXPERIMENTAL PROCEDURE
In the training session, the experimenter explained and demonstrated how to use
different measuring devices. The training session continued until their performance
satisfied the standard values (inspection time:15 min., inspection error: 0). If any
inspection error was found, subjects were asked to measure that attribute again at the end
of the practice.
Normally, a complete counterbalancing or Balanced Latin Square is used to order
experimental conditions. Unfortunately, the order of property cannot be controlled by the
experimenter, because the property is embedded on the part. Six parts were randomly
presented one-by-one to subjects to eliminate the order effect of within-subject factors.
At the beginning of the experiment, subjects were instructed to conduct the
inspection task accurately and quickly with the standardized operation (see Appendix B).
Each attribute was measured one to six times at different measurement points on the part
with the corresponding measuring instruments. The measuring resolution of all
instruments was 0.001 inches except the universal bevel protractor (5 min.). The
acceptable bounds of each attribute are called tolerances. The two types of tolerances,
dimensional and geometric tolerances (Shewchuk, 2001), are related to these attributes.
Dimensional tolerances are used to specify the bounds on the nominal dimension.
Thickness, depth, diameter, and length belong to this category. The bilateral tolerance
that includes the magnitude along with an upper and lower bound was used for this
experiment. Geometric tolerances are used to specify the bounds on the geometric
features of a part. Two types of geometric tolerances are form tolerance and location
tolerance. Form tolerances bound on geometric attributes, while location tolerances
bound on the position of features. The limit dimensions that define only the bounds were
used for the tolerance of the surface measurement.
At the end of the experiment, the subject was asked to fill out the subjective
questionnaire. The total experiment time, including instruction, inspection, and
answering the questionnaire, took about 3 hrs.
The four inspection methods that were used in this experiment are as follows:

63
Manual Inspection
The engineering drawings and the inspection report forms (see Appendix D)
along with test parts were given to a subject. The inspection for each part consisted of a
set of steps, which were the study of drawing, marking, measurement, decision for
conformation, and data recording, as shown in Figure 5. The subjects measured all
attributes on the part exhaustively, and recorded the readings on the inspection reports,
along with any required calculations. The average value of each attribute was calculated.
Then, the subjects compared their disposition values to the engineering drawing to decide
whether the attribute was acceptable or not.
The inspection sequence of the manual inspection is as follows:
1. Place the current part on the inspection station and set up the measuring devices.
2. Study the engineering drawings and the part inspection reports to decide the
measuring attributes on the part.
3. Decide if the marking is required to measure the current dimensional or geometric
attribute of interest: only the exact point measurement (e.g., height measurement
in this experiment) needs marking. Then, mark measurement points on the part
surface with a pencil according to the engineering drawings.
4. Measure the attribute of interest, record the value, and calculate the average
values.
5. Compare the disposition value with the given geometric dimensioning tolerance
on the engineering drawing. Then, record the rejection or acceptance of the
current attribute on the inspection report form.
6. Repeat steps 4 to 5, until all measurements have been taken and recorded.
7. Remove all markings from the part surface, if the part was marked.
8. Place the next part and repeat steps 1 to 7.
.

64
Attribute
Study Drawing
Marking
Measurement
Within tolerance?
Yes
Need marking?
Yes
No
Another marking?
No
Another attribute?
Yes
No
Yes
Cleaning
No
No
Record (Reject)Record (Accept)
Termination
Data Recording
Calculation
Repeatmeasurement?
Yes
No
Part
Yes
Another part?
Figure 5. Manual inspection process.

65
2D-aided and 3D-aided Inspections
The contents of information were the same as that of the manual inspection, but
only the selected information which was directly related to the measurement of interest
was provided by a computer. The subjects measured attributes on the part according to
the information on the screen and keyed readings. Then, the computer decided the
disposition of the part by comparing the calculated average value with the specification.
The study of drawing and calculation among the inspection processes were no longer
needed for the 2D-aided and 3D-aided inspection conditions, since the computer provides
the measuring information one-by-one with average values for the decision as shown in
Figure 6.
The 2D-aided and 3D-aided inspections were basically identical. The only
difference was the way in which information is presented. The 2D-aided inspection used
2D perspective figures (e.g.. engineering drawing) as seen in Figure 7, while the 3D-
aided inspection used isometric perspectives as seen in Figure 8. For the 2D-aided
inspection, the function that could be used to change the projection of parts was included.
Each part could be viewed in at least two of three views: top, front, and side. In the case
of the 3D-aided inspection, the wire-frame model of a part could be rotated around two
mutually orthogonal axes so that subjects changed the viewpoint of the part according to
their needs.
As a result, the performance difference between the 2D and 3D-aided inspections
should be caused by the difference in understanding the 2D and 3D figures mentally.
The inspection sequence of the 2D and 3D-aided inspections is as follows:
1. Place the current part on the inspection station and set up the measuring devices.
2. Select (2D) or rotate (3D) the viewpoint of the part as needed.
3. Decide if the marking is required to measure the current dimensional or geometric
attribute of interest: only the exact point measurement (e.g., height measurement
in this experiment) needs marking. Then, mark measurement points on the part
surface according to the information on the computer screen.
4. Measure the attribute of interest. Then enter the reading via the keyboard.
5. Repeat steps 3 to 4 until all the attributes have been taken and recorded.
6. Remove all markings from the part surface, if the part was marked.

66
7. Place the next part and repeat steps 1 to 5.
Attribute
Study Drawing
Marking
Measurement
Within tolerance?
Yes
Need marking?
Yes
No
Another marking?
No
Another attribute?
Yes
No
Yes
Cleaning
No
No
Record (Reject)Record (Accept)
Termination
Data Recording
Calculation
Repeatmeasurement?
Yes
No
Part
Yes
Another part?
Eliminated processes from manual inspection are colored in gray
Figure 6. 2D-aided and 3D-aided inspection processes.

67
Prismatic Part (P) Rotational Part (R)
P-1. Safety Key R-1. Step Pulley
P-2. Finger Guide R-2. Holder
P-3. Tool Holder R-3. Roller Stud
Figure 7. 2D perspective of parts: 2D-aided inspections.

68
Prismatic Part (P) Rotational Part (R)
P-1. Safety Key R-1. Step Pulley
P-2. Finger Guide R-2. Holder
P-3. Tool Holder R-3. Roller Stud
Figure 8. Isometric perspective of parts: 3D-aided and AR-aided inspections.

69
AR-aided Inspection
The AR-aided inspection used the same graphics as the 3D-aided inspection. The
contents and formats of information were identical to the 3D-aided inspection.
The only difference from the 3D-aided inspection was that the subject used a see-
through head-mounted display (HMD), which integrates two information channels
together: the computer screen and the part as seen in Figure 9. The wire-frame model
was superimposed over the actual part along with the measuring information. This
allowed the subject to see the measurement locations on the part directly, as if the part
itself had measuring information. The view of a part along with its’ measuring attributes
could be rotated with keys so that subjects can make an alignment between a part and the
wire-frame model, or examine the parts according to their needs.
The subjects measured attributes on the part and recorded the readings by using a
keyboard. Then, the computer decided the disposition of the part by comparing the
calculated average value with the specification. The processes of the AR-aided
inspection can be seen in Figure 10. Some steps that were required for the other
inspection methods such as study drawing, marking, calculation, and cleaning are no
longer needed for the AR-aided inspection condition.
The inspection sequence of the AR-aided inspection is as follows:
1. Place the current part on the inspection station and set up the measuring devices.
2. Rotate (3D) the viewpoint of the part as needed.
3. Control the HMD as required to ensure that the wire-frame image of the part is
correctly superimposed over the edge of the part.
4. Measure the current attribute according to the information on the screen. Then
enter the reading via the keyboard.
5. Repeat steps 3 to 4 until all the attributes have been taken and recorded.
6. Place the next part and repeat steps 1 to 5.

70
(a) An inspector performs an inspection with AR displays
(b) Scene through the AR display
Figure 9. AR-aided inspection scenes

71
Attribute
Study Drawing
Marking
Measurement
Within tolerance?
Yes
Need marking?
Yes
No
Another marking?
No
Another attribute?
Yes
No
Yes
Cleaning
No
No
Record (Reject)Record (Accept)
Termination
Data Recording
Calculation
Repeatmeasurement?
Yes
No
Part
Yes
Eliminated processes from manual inspection are colored in gray
Another part?
Figure 10. AR-aided inspection processes.

72
CHAPTER 5. RESULTS
An analysis of variance (ANOVA) was conducted on each of the two
performance measures: inspection time and measurement accuracy. The inspection time
was the average time (i.e. seconds) spent inspecting the dimensional attribute of interest,
while the measurement accuracy was the measurement deviation that was defined as the
ratio (i.e., percent) between the deviation and the specification value.
INSPECTION TIME
The ANOVA results show that the Inspection Method significantly affects the
inspection time as shown in Table 17
TABLE 17. ANOVA Summary Table of Inspection Time.
Source df SS MS F p-value
Between Subject
Method (M) 3 136647.1 45549.0 13.36 0.000*
Subjects (S/M) 20 68182.1 3409.1
Within Subject
Part Shape (P) 1 441.0 441.0 1.86 0.1880
M×P 3 538.6 179.5 0.76 0.5317
P×S/M 20 4748.2 237.4
Attribute (A) 3 456272.0 152090.1 149.80 0.000*
M×A 9 86367.2 9596.4 9.45 0.000*
A×S/M 60 60916.5 1015.3
P×A 3 2265.5 755.2 3.58 0.0189*
M×P×A 9 2051.8 228.0 1.08 0.3901
M×P×A×S/M 60 12655.4 210.9
Total 191 907403.5

73
The Bonferroni t-test shows that the AR-aided inspection takes significantly less
time than the 3D and manual inspections (p < 0.05), as seen in Table 18. The 2D-aided
inspection takes significantly less time than the manual inspection. However, there are
no significant differences between the AR-aided and 2D-aided inspections, between the
2D-aided and 3D-aided inspections, and between the 3D-aided and manual inspections.
TABLE 18. Paired Comparisons of Inspection Methods (CDB=34.886, p < 0.05).
Inspection Method
Means
AR
92.000
2D
117.417
3D
131.875
Manual
165.813
AR
2D
3D
Manual
- 25.417
-
39.875*
14.458
-
73.813*
48.396*
33.938
-
The effect of the Part Shape on inspection time is not significant. There is no
significant difference between the mean inspection times of the prismatic part (mean:
125.260 sec.) and that of the rotation part (mean: 129.295 sec.).
The effect of the Attribute on inspection time is significant. The inspection time
of each attribute is significantly different from each other except between the line and
surface measurements, as seen in Table 19. The point measurement takes the shortest
time whereas the exact point measurement takes the longest time.
TABLE 19. Paired Comparisons of Attributes (CDB= 17.747, p < 0.05).
Inspection Method
Means (Seconds)
Point
63.833
Surface
113.875
Line
129.333
Exact Point
200.063
Point
Surface
Line
Exact Point
- 50.042*
-
65.500*
15.458
-
136.230*
86.188*
70.730*
-

74
The ANOVA results show that the two-way interaction of Method and Attribute
is significant. Figure 11 shows that the AR-aided inspection is always fastest regardless
of the measuring attributes. The adjusted Bonferroni t-test indicates that for the point and
surface measurements, the Inspection Method has no significant effect on the inspection
time, as seen in Table 20. However, for the exact point measurement, Inspection Method
has a significant effect on the inspection time. The manual inspection takes longer than
the 2D-aided and 3D-aided inspections, and the 2D-aided and 3D-aided inspections take
longer than the AR-aided inspection. For the line measurement, the manual inspection
method takes longer than the other three inspection methods. The inspection time of the
three methods for line measurement is not significantly different from each other.
Two-Way Interaction: Method x Attribute
0
50
100
150
200
250
300
Tim
e (S
ec.)
Manual 77.42 272.67 179.17 134
2D-aided 64 196.08 107.92 101.67
3D-adied 61.33 222 124.92 119.25
AR-aided 52.58 109.5 105.55 100.58
Point Exact Point Line Surface
Figure 11. Average inspection time of each inspection method.

75
TABLE 20. Unconfounded Comparisons of Two-Way Interaction: Method × Attribute.
Method Point (A1) Exact Point (A2) Line (A3) Surface (A4)
Manual (M1) 929 3272 2150 1608
2D-aided (M2) 768 2353 1295 1220
3D-aided (M3) 736 2664 1499 1431
AR-aided (M4) 631 1314 1264 1207
(M1A1)-(M1A2) (M1A1)-(M1A3) (M1A1)-(M1A4) (M1A2)-(M1A3) (M1A2)-(M1A4) (M1A3)-(M1A4) (M2A1)-(M2A2) (M2A1)-(M2A3) (M2A1)-(M2A4) (M2A2)-(M2A3) (M2A2)-(M2A4) (M2A3)-(M2A4) (M3A1)-(M3A2) (M3A1)-(M3A3) (M3A1)-(M3A4) (M3A2)-(M3A3) (M3A2)-(M3A4) (M3A3)-(M3A4) (M4A1)-(M4A2) (M4A1)-(M4A3) (M4A1)-(M4A4) (M4A2)-(M4A3) (M4A2)-(M4A4) (M4A3)-(M4A4)
2343* 1221* 679* 1122* 1664* 542
1585* 527 452
1058* 1133* 75
1928* 763* 695* 1165* 1233* 68
683* 633* 576* 50 107 57
(M1A1)-(M2A1) (M1A1)-(M3A1) (M1A1)-(M4A1) (M2A1)-(M3A1) (M2A1)-(M4A1) (M3A1)-(M4A1) (M1A2)-(M2A2) (M1A2)-(M3A2) (M1A2)-(M4A2) (M2A2)-(M3A2) (M2A2)-(M4A2) (M3A2)-(M4A2) (M1A3)-(M2A3) (M1A3)-(M3A3) (M1A3)-(M4A3) (M2A3)-(M3A3) (M2A3)-(M4A3) (M3A3)-(M4A3) (M1A4)-(M2A4) (M1A4)-(M3A4) (M1A4)-(M4A4) (M2A4)-(M3A4) (M2A4)-(M4A4) (M3A4)-(M4A4)
161 193 298 32 137 105
919* 608* 1958* 311
1039* 1350* 855* 651* 886* 204 31 235 388 177 401 211 13 224
( )[ ] ( )[ ] ( )[ ][ ] 94.54427.1015*12*260,482, =′=′= tMSndfctCD errorerrorB

76
The Part Shape × Attribute interaction is shown in Figure 12. The adjusted
Bonferroni t-test indicates that the Part Shape has no effect on the inspection time for the
point, exact point, and line measurements, as shown in Table 21. Regardless of the part
shapes, the inspection time of the same attribute is the same. On the other hand, for the
surface measurement, the rotational parts take a longer inspection time than the prismatic
parts.
Two-Way Interaction: Part x Attribute
0
50
100
150
200
250
Tim
e (S
ec.)
Prismatic 65 200.17 129.42 106.46
Rotational 62.27 199.96 129.25 121.29
Point Exact Point Line Surface
Figure 12. Average inspection time of each part shape.

77
TABLE 21. Unconfounded Comparisons of Two-Way Interactions: Part × Attribute.
Part Shape Point (A1) Exact Point (A2) Line (A3) Surface (A4)
Prismatic (P1)
Rotational (P2)
1560
1494
4804
4798
3106
3102
2554
2910
(P1A1)-(P1A2)
(P1A1)-(P1A3)
(P1A1)-(P1A4)
(P1A2)-(P1A3)
(P1A2)-(P1A4)
(P1A3)-(P1A4)
(P2A1)-(P2A2)
(P2A1)-(P2A3)
(P2A1)-(P2A4)
(P2A2)-(P2A3)
(P2A2)-(P2A4)
(P2A3)-(P2A4)
3244*
1546*
994*
1698*
2250*
552*
3304*
1608*
1416*
1696*
1888*
192
(P1A1)-(P2A1)
(P1A2)-(P2A2)
(P1A3)-(P2A3)
(P1A4)-(P2A4)
66
6
4
356*
( )[ ] ( )[ ] ( )[ ][ ] 57.31792.210*24*260,162, =′=′= tMSndfctCD errorerrorB

78
MEASUREMENT ACCURACY
The ANOVA results of Table 22 show that the Inspection Method does not affect
the measurement accuracy. Measurement accuracy is equal across all four inspection
methods (p < 0.05). Conversely, two other main effects, Part shape and Attribute,
significantly affect measurement accuracy. The prismatic parts (0.39%) include higher
measurement variations than the rotational parts (0.30%). The Bonferroni t-test results
show that the measurement accuracy of the point and surface measurements is higher
than that of the exact point and line measurements (Table 23). The point and surface
measurements show less measurement deviation than the exact point and line
measurements.
TABLE 22. ANOVA Summary Table of Measurement Accuracy.
Source df SS MS F p-value
Between Subject
Method (M) 3 0.055559 0.018519 0.32 0.812
Subjects (S/M) 20 1.165477 0.058273
Within Subject
Part Shape (P) 1 0.364854 0.364854 9.36 0.006*
M×P 3 0.019979 0.006659 0.17 0.915
P×S/M 20 0.779359 0.038967
Attribute (A) 3 3.441051 1.147017 34.22 0.000*
M×A 9 0.610134 0.067793 2.02 0.051
A×S/M 60 2.011062 0.033517
P×A 3 1.837534 0.612511 29.79 0.000*
M×P×A 9 0.929223 0.103247 5.02 0.000*
M×P×A×S/M 60 1.233732 0.020562
Total 191 12.34797

79
TABLE 23. Paired Comparisons of Attributes (CDB= 0.10197, p < 0.05).
Inspection Method
Means Variation (%)
Surface
0.19767
Point
0.22569
Exact Point
0.47379
Line
0.48343
Surface
Point
Exact Point
Line
- 0.02802
-
0.27612*
0.24810*
-
0.28576*
0.25774*
0.00964
-
Figure 13 shows the two-way interaction of the Part Shape and Attribute. The
adjusted Bonferroni-t test indicates that for the point and surface measurements, the
rotation parts include less deviation, as shown in Table 24. For the exact point and line
measurements, the prismatic parts include less deviation.
Two-Way Interaction: Part x Attribute
0
0.1
0.2
0.3
0.4
0.5
0.6
0.7
0.8
0.9
Erro
r Pe
rcen
t (%
)
Prismatic 0.214 0.6175 0.6018 0.3666
Rotational 0.0802 0.7281 0.8333 0.074
Point Excat Point Line Surface
Figure 13. Average inspection measurement deviation.

80
TABLE 24. Unconfounded Comparisons of Two-Way Interactions: Part × Attribute.
Part Shape Point (A1) Exact Point (A2) Line (A3) Surface (A4)
Prismatic (P1)
Rotational (P2)
5.1360
1.9248
14.8200
17.4744
14.4432
19.9992
8.7984
1.7760
(P1A1)-(P1A2)
(P1A1)-(P1A3)
(P1A1)-(P1A4)
(P1A2)-(P1A3)
(P1A2)-(P1A4)
(P1A3)-(P1A4)
(P2A1)-(P2A2)
(P2A1)-(P2A3)
(P2A1)-(P2A4)
(P2A2)-(P2A3)
(P2A2)-(P2A4)
(P2A3)-(P2A4)
9.6840*
9.3072*
3.6624*
0.3768
6.0216*
5.6448*
15.5496*
18.0744*
0.1488
2.5248
15.6984*
18.2232*
(P1A1)-(P2A1)
(P1A2)-(P2A2)
(P1A3)-(P2A3)
(P1A4)-(P2A4)
3.2112*
2.6554
5.5560*
7.0224*
( )[ ] ( )[ ] ( )[ ][ ] 1355.30201562.0*24*260,162, =′=′= tMSndfctCD errorerrorB

81
INSPECTION STRATEGY DIFFERENCES BETWEEN GROUPS
To understand the inspection strategy of the four inspection methods, the trade-off
between time and measurement accuracy was analyzed. Each subject’s inspection time
and measurement deviation from the real value is plotted in Figure 14. The dashed lines
represent the mean values of these two dependent variables. The more observations of
the method that appear on the lower left area, the better the performance of that method
becomes evident.
Figure 14 shows the inspection strategy difference among the four inspection
conditions. A visible difference is that the observations of the exact point and surface
measurements are scattered along with x and y-axes. It means that there is a big
difference in the individual inspection strategy within the same inspection condition as
well as among the four inspection conditions for the exact point and surface
measurement. On the other hand, there is no big different for the point and surface
measurement. Subjects used a similar inspection strategy for point and surface
measurements.
In the case of point measurement, the AR-aided and 3D-aided inspection methods
show a small amount of differences within the group. The 2D-aided inspection also
shows a distribution similar to the AR-aided inspection except for one subject who spent
almost twice as much time. The manual inspection often appears at the top right part. It
implies that subjects spent more time with a large measurement deviation in the manual
inspection condition. Subjects need to study engineering drawings to find the current
attribute of interest and calculate the disposition value in the manual inspection condition.
In the case of exact point measurement, the inspection time difference among
inspection methods is eminent. The AR-aided inspection is plotted on the left hand side,
the 2D and 3D-aided inspections are plotted in the middle, and then the manual
inspection condition is plotted on the right hand side. Subjects spent less time in the AR-
aided inspection condition. Undoubtedly, the major sources of the difference between the
AR-aided inspection and the 2D and 3D-aided inspection are the marking and cleaning
processes that are required for the exact point measurement. Since AR could eliminate
these two steps in the inspection processes, subjects could spend less time in the AR-
82
aided inspection condition. On the other hand, the differences between the 2D and 3D-
aided inspections and the manual inspection are the automated calculation and decision
functions. An interesting finding is that there is a great amount of individual difference
regardless of inspection methods. Even in the same inspection condition, each subject
uses a quite different inspection strategy. Observed data are scattered in the wide range
along with x and y-axes.
In the case of line measurement, the plotted data show that each subject uses a
different strategy within the same inspection condition. However, there is a difference
between the manual inspection and the other inspection methods. The manual inspection
is plotted at the lower right hand part. It means that subjects spent more time with a
small amount of deviation in the manual inspection condition, while less time was spent
with a large measurement deviation in the other inspection conditions.
In the case of surface measurement, all subjects except one spent the same amount
of time with the same amount of deviation regardless of the inspection methods. No
individual difference is found within and between the four inspection methods.

83
Point Measurement
0
0 .2
0 .4
0 .6
0 .8
1
0 50 10 0 150 2 00 250 3 00 350 4 00T ime (sec.)
Dev
iatio
n (%
)
Manual2D-Aided3D-AidedAR-Aided
Exact Point Measurement
0
0 .2
0 .4
0 .6
0 .8
1
0 5 0 1 00 15 0 200 2 50 30 0 350 4 00
T ime (sec.)
Dev
iatio
n (%
)
Manual2D-Aided3D-AidedAR-Aided
Line Measurement
0
0 .2
0 .4
0 .6
0 .8
1
0 50 100 150 20 0 250 3 00 35 0 400T ime (sec.)
Dev
iatio
n (%
)
Manual2 D-Aided3 D-AidedAR-Aided
Surface Measurement
0
0 .2
0 .4
0 .6
0 .8
1
0 5 0 100 15 0 200 250 3 00 350 400
T ime (sec.)
Dev
iatio
n (%
)
Manual2 D-Aided3 D-AidedAR-Aided
Figure 14. Trade-off between inspection time and measuring accuracy.

84
ANALYSIS OF THE QUESTIONNAIRE
The analysis results of the questionnaire which consisted of body part discomfort
and mental workload are as follows;
Body Part Discomfort
The MANOVA shows that there is no difference among the four inspection
methods for questions relating to physical stress, as shown in Table 25. The
questionnaire is anchored from 1 to 9; a small value represents a high agreement with the
given statement.
The average values of all four inspection conditions are lower than 5.0 (neutral)
with the exception of three mean values higher than 5.0. These results suggest that there
is no discomfort related to any of the four inspection methods.
TABLE 25. Body Part Physical Stress Difference Among Inspection Methods.
Mean Question
M 2D 3D AR
p
I have experienced no discomfort at all during and
after the experiment
1. Head
2. Eye
3. Neck
4. Shoulder
5. Upper Arm
6. Elbows
7. Lower Arm and Hands
8. Upper Back
9. Lower Back
10. Hip and Thigh
11. Knees
12. Ankles/Feet
3.67
4.33
3.83
3.33
3.17
3.50
3.17
3.50
4.83
3.50
3.50
3.50
3.00
2.50
4.50
3.33
3.50
4.67
4.00
5.50
4.17
3.00
2.83
3.50
1.67
3.42
3.08
3.58
2.08
1.25
3.08
5.08
5.75
1.58
1.08
1.08
2.50
3.00
3.83
2.83
2.17
2.17
2.83
4.67
4.50
2.00
2.33
1.08
0.38
0.60
0.82
0.95
0.43
0.06
0.86
0.63
0.79
0.37
0.19
0.10

85
To identify the individual differences, the number of subjects who had
experienced any discomfort (more than 7 in Likert Scale) was counted with the
questionnaire, as seen in Table 26. The upper and lower back discomforts were most
frequently reported regardless of the inspection methods. On the average, no discomfort
was found, though nine subjects did report physical discomforts. Among inspection
conditions, subjects who used the AR-aided inspection reported the minimum number of
physical discomfort. On the other hand, subjects who used the 2D-aided inspection
reported the highest number of physical discomfort.
TABLE 26. Individual Differences of Body Part Discomforts.
Mean Question
M 2D 3D AR
Total
I have experienced no discomfort at all during and
after the experiment
1. Head
2. Eye
3. Neck
4. Shoulder
5. Upper Arm
6. Elbows 7. Lower Arm and Hands
8. Upper Back
9. Lower Back
10. Hip and Thigh
11. Knees
12. Ankles/Feet
1
1
1
1
1
2
1
1
1
1
2
1
1
2 2
3
2
1
1
1
1
1
3
3
1
2
2
1
2
4
3
1
3 3
9
9
1
2
2
Total 10 16 9 5 40

86
Mental Workload
The MANOVA results of Table 27 indicate that there is no difference among the
four inspection methods for questions relating to mental workload except for their
inspection method preference. The mean values for the mental workload across each
group are less than or equal to 5.0. The results suggest that all four groups not only were
satisfied with their performance but also perceived that the mental workloads of the given
inspection were not high.
A significant difference among the groups is found for the user preference of the
inspection method. The Bonferroni t-test shows that the subjects who used AR-aided and
3D-aided inspection methods show a higher preference for their inspection method than
subjects who used the manual and 2D-aided inspection methods. However, there is no
significant difference between the users who used manual inspection and those who used
2D-aided inspection, and between the users who used the 3D-aided inspection and those
who used the AR-aided inspection.

87
TABLE 27. Mental Workloads Difference Among Inspection Methods.
Mean Question
M 2D 3D AR
p
Mental Demand: how much mental activity (e.g., thinking, remembering, calculation, and decision) was required?
1. The inspection task was easy to perform mentally.
Physical Demand: How much physical activity (e.g., manipulating, controlling, and handling, etc.) was required?
1. The task was easy to perform physically.
Temporal Demand: How much time pressure did you feel due to the pace at which the task or task elements occur?
2. The work pace was slow and leisurely.
Performance: How successful do you think you were in accomplishing the task set by the experimenter?
3. I was satisfied with my performance in accomplishing the task.
Effort: How hard did you have to work (mentally and physically) to accomplish your level of performance?
4. I could finish the inspection task with a minimum level of effort.
Frustration Level: How insecure, discouraged, limited, stressed and annoyed did you feel during the task?
5. I felt secure and interested while performing the inspection tasks.
User Acceptance: How did you feel about the inspection method that you did?
6. I prefer the inspection method that I used in this experiment to what I did in class.
3.50 2.67 4.17 3.17 4.17 3.33 5.00
3.17 3.17 3.83 2.67 2.50 3.67 4.67
2.92 3.42 4.08 2.58 3.58 3.08 1.33
2.50 2.50 3.83 2.83 3.00 3.17 2.33
0.704 0.727 0.990 0.691 0.112 0.922 0.001*

88
TABLE 28. Paired Comparisons of Preference (CDB= 1.7725, p < 0.05).
Inspection Method
Error Means
Manual
5.00
2D-aided
4.67
AR-aided
2.33
3D-aided
1.33
Manual
2D-aided
AR-aided
3D-aided
- 0.33
-
2.67*
2.34*
-
3.67*
3.34*
1.00
-
To identify the individual differences in mental workloads, the number of subjects
who had experienced higher mental workloads (i.e., more than 7 in Likert Scale) was
counted with the questionnaire, as seen in Table 28. Though two subjects reported high
workloads for mental and temporal demands, most subjects reported that the mental
workloads were not high. Among inspection conditions, four subjects who used the
manual or 2D-aided inspections reported that mental or temporal demands were high.
TABLE 29. Individual Difference of Mental Workloads.
Mean Question
M 2D 3D AR
Total
1. Mental Demand
2. Physical Demand
3. Temporal Demand:
4. Performance
5. Effort
6. Frustration Level
1
1
1
1
2
2
Total 2 2 4

89
CHAPTER 6. DISCUSSION AND FUTURE RESEARCH
In this study, the effectiveness of AR for a dimensional inspection task was
explored. The inspection task consisted of measuring various dimensional attributes of
rotational and prismatic parts with four different types of inspection aids: manual, 2D,
3D, and AR. The results of this experiment strongly suggest that inspection performance
can be improved by using AR technology in the design of a dimensional inspection
system.
Hypothesis 1: AR-aided inspection improves inspection performance. Augmented reality
helps decrease inspection time and improve measurement accuracy.
Hypothesis 1 was partly supported. Hypothesis 1 addresses the overall
performance differences among the four inspection methods. Inspection time and
measurement accuracy are two performance criteria in determining the effectiveness of
the inspection methods.
The ANOVA results support that the AR-aided inspection provides the best
performance among the four inspection methods by having the shortest inspection time.
The 2D-aided inspection was faster than the 3D-aided inspection, and manual inspection
was the slowest. The AR-aided inspection showed a great advantage for the exact point
measurement, since the AR-aided inspection does not require marking and cleaning for
exact point measurement as shown in the thickness inspection study (Chung et al. 1999).
The advantages of the AR-aided inspection for the other dimensional measurements were
also shown by the results, though the difference was not as large as for the exact point
measurement.
The difference of required skills, capability, and inspection functions for the four
inspection methods are summarized in Table 30. Table 30 highlights a different set of

90
functions in the whole inspection task, since the other functions are identical, regardless
of the inspection methods.
TABLE 30. Difference of Required Skills and Capability among Inspection Methods.
Function Skill Type Manual 2D 3D AR
Study Drawing Perception ×
Divided attention Perception × × ×
Visualization Cognition × ×
Marking Motor × × ×
Superimposing Perception and Manual
×
Recording Motor × × × × Calculation Cognition ×
Decision Cognition ×
Cleaning Motor × × ×
In the manual inspection, the visual search pattern of the dimensional inspection
follows a focused search. Subjects determine the dimension of interest among the cluster
of multiple attributes on engineering drawings. In contrast to the manual inspection, the
other inspection methods do not require this search process, because a computer provides
information for the measuring attribute one-by-one. Manual, 2D, and 3D inspections
require divided attention, since the subjects must attend two different channels for either
parts and engineering drawings, or for parts and the computer screen. It was observed
that subjects moved their head from the engineering drawings to the inspection part or
from the computer screen to the parts to decide the measuring method and location.
However, the AR-aided inspection can provide spatial proximity between the two
channels by superimposing a view of the computer screen over the real part.
Visualization is the ability to reconstruct the figures mentally into components for
manipulation while the figure is manipulated in spatial orientation (Ekstrom et al., 1979).
Since the manual and 2D-aided inspection use 2D figures, subjects need to reconstruct

91
2D perspective figures into 3D objects mentally. Marking, cleaning, and superimposing
are necessary only for the exact point measurement. Marking is always coupled with
cleaning, and cleaning is required only if marking is done. The manual, 2D-aided, and
3D-aided inspections require marking and cleaning for the exact point measurement,
while the AR-aided inspection uses superimposing to determine the measuring point. All
four inspection methods require some type of data keeping; writing, or keying.
Calculation and decision are additional processes for the manual inspection, and are
included in the automated routine in the other inspection methods.
Table 30 provides a basis for interpretations of the difference among inspection
methods. It is useful to understand the components of inspection time and the sources of
inspection errors for each inspection method. The performance differences among the
four inspection methods could be caused by the combination of these components. If the
processes are performed in series, each with some possibility of an inspection error,
fewer processes will take less time with fewer errors. The experimental results support
these implications. The manual inspection includes most of these processes and takes
longer than the other inspection methods. According to the observed data, subjects spent
about 10-30 sec for searching and an additional 10-30 sec for recoding, calculation and
the decision process. On the other hand, the AR-aided inspection that only includes the
superimposing process and recording, has the shortest inspection times. The advantage
of 3D perspective in representing dimensional attributes is not supported in terms of
inspection time. According to Table 30, the 3D-aided inspection should take a shorter
time than the 2D-aided inspection, but the results of the experiment were opposite from
the expectation. A possible explanation is that the part features are relatively simple to
understand so that no additional time was required to visualize 2D information into 3D
objects. All these processes are not necessarily sequential, and a parallel processing
might be possible between some of these processes. An interesting finding is that
subjects preferred the 3D representation to 2D representations for the inspection part
according to the analysis of the questionnaire results though the 3D-aided inspection
takes longer than the 2D-aided inspection.
Six types of inspection errors were identified based on the inspection reports and
the experimenter’s observation, as seen in Table 31. Among the six categories, the

92
reading, measurement, and typing errors were included in the same type, because they
could not be discriminated from each other. Since each subject inspected only six parts,
not enough errors were observed for a statistical analysis. However, the observation
results provide an insightful understanding of the differences of inspection errors between
the four inspection methods.
TABLE 31. The Observed Inspection Error Types.
Error Types Manual 2D 3D AR
Taking Wrong Dimensions
Omission of Measurement
Omission of Cleaning
Wrong Equipment
Reading/Measurement/Typing Error
Calculation/Decision Error
6
1
-
1
4
4
2
1
2
-
4
-
2
-
2
-
3
-
1
-
-
-
4
-
Total 16 9 7 5
Inspection errors increase as the number of processes of inspection methods
increases. The manual inspection includes most of these processes, and provided the
highest number of inspection errors. The AR-aided inspection showed the least number
of total errors, since it includes the least number of processes. Table 31 shows that
inspectors take a wrong dimension more often with the manual and 2D-aided inspections.
The higher rate of taking wrong dimensions during the manual inspection suggests that
subjects were more often confused by attributes of interest because of the clustered
information. Some marginal amount of errors might be caused by the misperception of
2D figures. Since these two methods use 2D figures, subjects might fail to translate that
information into 3D objects correctly.
The number of reading, measurement, and typing errors was almost the same
across the four inspection methods. It means that the reliability of the data recoding
function (i.e., writing) of the manual inspection is almost the same as that of the other

93
inspection methods (i.e., data keying). The calculation and decision errors were only
found in the manual inspection. The results suggest that the reliability of decision
function can be improved by the automation, since the difference between manual and
other inspections comes from mainly the automated routine of calculation and decision
functions with a computer.
The measuring accuracy was basically the same across all inspection methods.
Since all inspection methods use the same measuring instruments, the sources of
measuring errors (e.g., deviation between real value and measured value) should be the
same. The difference of the source of measurement deviation among the inspection
methods exists in the exact point measurement. Some portion of the deviation in the AR-
aided inspection was undoubtedly introduced by superimposing, while the marking
caused the deviation in the other methods. However, the degree of deviation caused by
either process is indifferent according to the experimental results.
Hypothesis 2: The benefit of AR is dependent on part shapes. The performance
improvement of prismatic parts with AR is different from that of rotational
parts.
Hypothesis 2 is not supported. Hypothesis 2 addresses the relative advantage of
AR between prismatic and rotational parts. The ANOVA results of the inspection time
support that the benefit of AR is the same between the prismatic and rotational parts, as
shown in Table 32. The AR-aided inspection provided the best performance. The 2D-
aided inspection was faster than the 3D-aided inspection, and manual inspection was the
slowest regardless of the part shape. The ANOVA results of measurement accuracy
suggest that the affect of AR is indifferent between the prismatic and the rotational parts.
These findings suggest that AR aids provide a great advantage in reducing the inspection
time regardless of the part shape.

94
TABLE 32. The Average Inspection Time for Prismatic and Rotation Parts (unit: sec.).
Part Shape Manual 2D-aided 3D-aided AR-aided
Prismatic 162.8 114.4 133.0 90.8
Rotational 168.8 120.4 130.8 93.2
The probable explanation of this result is that the characteristic dimensional and
geometric inspection depends on the dimensional attribute rather than the part shape. The
same attribute is always measured the same way with the same measuring instruments
regardless of the part shape.
Hypothesis 3: The benefit of AR is dependent on measurement attributes. The
performance improvement of point measurement with AR is different from
that of exact point, line, or surface measurement.
Hypothesis 3 was supported. Hypothesis 3 addresses the relative advantage of
AR among the four types of dimensional attributes. The ANOVA results of the
inspection time suggest that the benefit of AR is different among the dimensional
attributes. Augmented reality provided the greatest advantage for the exact point
measurement, whereas the benefit of AR was not significantly different from those of the
2D and 3D-aided inspections for the other dimensional attributes.
For the exact point measurement, the major difference between the AR-aided
inspection and the 2D and 3D-aided inspection are that the AR-aided inspection does not
need marking and cleaning processes. Since the AR-aided inspection could eliminate the
most time-consuming processes in the dimensional and geometric inspection, AR could
provide a great advantage.
For line measurement, the AR-aided inspections could reduce the significant
amount of inspection time with automated calculation and decision processes. Another
advantage of AR might be that AR was very useful for subjects to understand which

95
attributes need to be measured. By superimposing the measuring attribute over the real
part, subjects could determine the measuring attribute quickly.
For point and line measurements, the AR-aided inspection could not provide a
significant amount of time saving, though AR might be helpful to reduce the average
inspection time with the automated calculation and decision processes. A possible
explanation might be that the calculation of an average value and the decision processes
might be relatively easy.
The ANOVA results of measurement accuracy suggest that the affect of AR is
indifferent among the four dimensional attributes.
These findings support that AR aids are a good solution to reduce the inspection
time, especially for the dimensional attributes which require the marking function, though
they may not be a solution for improving measurement accuracy. In addition to this, AR
can be useful to eliminate certain types of inspection errors (see Table 30): for instance,
taking measures on wrong dimensions, omission, and applying wrong instruments.
Hypothesis 4: The subjects who use the AR-aided inspection have a higher preference to
their inspection method than the subjects who use the manual inspection.
Hypothesis 4 was supported. One of the big concerns in designing the AR-aided
inspection system for this study was the user’s acceptance of the AR-aided inspection.
Though the overall inspection performance is the most important criterion in deciding the
effectiveness of the designed system, the user’s preference of AR-aided inspection cannot
be ignored.
The results of the questionnaire suggest that there was no physical stress on any
body part across all the inspection methods. All the average values were lower than 5.0
(i.e. neutral) except the upper and lower backs for the 2D, and 3D-aided inspections.
Even though there were no indications of body part discomforts in the overall
level (average is lower than 5), nine subjects reported upper and lower back discomforts.
Since subjects spent about 2-3 hours in a bent posture, they should experience some
discomforts on their back. This result suggests that considerations for individual

96
inspectors are required for all four inspection conditions. Any possible discomfort can be
minimized with ergonomic design considerations such as using a height-adjustable
inspection table.
An unexpected finding was that subjects who used the AR-aided inspections
reported the minimum number of body part discomforts. Since the AR-aided inspection
uses AR displays, it was expected that subjects in the AR-aided condition would report
the highest number of body part discomforts, especially eye and head discomforts.
Surprisingly, no subject who used the AR-aided method reported eye or head
discomforts. Three factors might be related to the result. First, since subjects in the AR-
aid inspection condition could finish the tasks quickly, they had less chance of
experiencing body part discomforts. The subjects spent about 22-43% less time in the
AR-aided inspection condition. Second, subjects could minimize the head movements
from the parts to the computer screens or to the engineering drawings with AR displays.
Third, because the AR displays were supported by a stand, the physical burden of
wearing AR displays might be minimized (Figure 9). These positive aspects of AR might
outweigh the negative aspects of using AR displays.
The questionnaire related to mental workload suggests that the mental workload is
not high for the four inspection methods. Apparently, using an AR technology does not
increase the mental workload of users. The subjects using the 3D perspective, however,
show a higher preference to their inspection method than those using the 2D perspective.
The possible explanation of this result is that subjects prefer the 3D representation for
real objects. Since the parts are 3D, inspection methods that preserve that characteristic
are easier to understand than a 2D representation. With the manual and computer-aided
inspection, subjects need to project the measuring locations onto 3D parts from 2D
drawings. A similar kind of display-cognitive compatibility could be explained in part by
the proximal compatibility principle (Wickens & Carswell, 1995).
On the other hand, subjects do not show preferences for the one-by-one
information of the computer screen to the clustered information of the engineering
drawing. Subjects show indifference in their preference between the manual inspection
and the 2D-aided computer inspection.

97
Based on these results, it can be inferred that all groups are satisfied with the
given inspection method. Though the physical body stress and mental workloads caused
by the four inspection methods are indifferent, the AR-aided and 3D-aided inspections
are preferred over the manual and 2D-aided inspections.
Future Research Implication
Though this research showed very promising results with AR in designing a
dimensional inspection system, several research issues need to be studied.
Further research to evaluate the effects of AR on inspection errors is necessary.
In this study, the performance criteria to evaluate the designed system were inspection
time and measurement accuracy (e.g., measurement deviation from the real value). Not
enough inspector errors were collected for the statistical analysis because of the limited
number of subjects and parts. Though the observed samples agree with the intuitive
expectation that AR aids can eliminate the errors related to certain functions and reduce
the total amount of inspection errors with the minimum number of functions to complete
the inspection task, a larger sample size is needed to support the assumption.
An AR technology can offer an innovative technological solution to the
manufacturing processes. To realize such an innovation, however, AR technology should
be further developed. Some of the key technological improvements necessary include a
faster rendering of 3D graphics, a wider FOV with high resolution, an effective
stereoscopic vision system, and an accurate registration with low expense. To avoid the
current technological constraints, the registration task was performed by the subjects
rather than using head trackers in this experiment. The AR-aided inspection task should
have been designed more efficiently, if the current technological limitations were to be
resolved.
Finally, it should be noted that all of the findings reported in this research may
apply only to a relatively short span of time with students. The cumulative effects of day
work need to be considered for a real application in the workplace with real inspectors.
Since the level of experiences and skills of real inspectors should be different from those
of students who only spent several hours in the class, research investigating the prolonged

98
effects of using AR over 8 hr. for a day of work needs to be conducted with real
inspectors.

99
CHAPTER 7. CONCLUSIONS
The experimental result supports that the AR-aided inspection achieved 22-43%
more time saving than the other inspection methods. The advantage of AR was eminent
for an inspection task that includes exact measurements. Since this type of measurement
was the most time consuming during the whole inspection task, the benefits of AR
increased as the portion of the exact measurement increased. On the other hand, AR aids
could not help improve the measurement accuracy. The measurement accuracy was the
same regardless of the inspection methods used. Another most encouraging finding was
that users favored the AR-aided inspection according to the results of the questionnaire.
The user’s satisfaction of AR aids should provide a positive environment in adopting AR
in the workplace.
In this study, experiments were performed to evaluate the effectiveness of AR for
a dimensional inspection task. The inspection tasks were typical types of dimensional
inspection tasks that include various dimensional attributes. Despite the limitations of the
laboratory study with a limited number of subjects, the findings of this research are
beneficial in designing a dimensional inspection system using AR technology.
Design Guidelines
With regard to the research hypotheses tested in this experiment, four design
guidelines can be formed:
1. Use AR aids when a design objective is to reduce the inspection time and when the
current measurement accuracy of the inspection system is acceptable.
The results of the experiment strongly suggest that AR aids are an effective tool to
reduce the inspection time, while AR may not provide any performance improvement
for measurement accuracy. Since AR aids do not affect the measurement instrument
or the measurement method, there was no change in the measurement function. As a

100
result, the measurement accuracy remains the same in the inspection system. If the
critical issue in the design of a dimensional inspection system is measurement
accuracy rather than inspection time, another approach which can change the
measurement function needs to be used.
2. Use AR aids when the portion of exact measurements is high in total measurement.
The AR aids show a great amount of time saving in this experiment, but the degree of
benefits from AR varied among attributes. Undoubtedly, the great portion of time
saving was because of the exact measurement. The relative advantage of AR aids for
the other measuring attributes was not eminent, though the AR-aided inspection
showed some marginal benefits over the 2D-aided and 3D-aided inspections for the
point, line, and surface measurements. Because of its associated costs, AR might not
be an economical solution with such a small difference in marginal benefits. If the
exact measurement is not required, the 2D-aided or 3D-aided inspections can be an
economical solution rather than the AR-aided inspection.
3. Provide the measuring information of interest one-by-one.
The questionnaire results showed that the subjects are indifferent in their preference
between manual (clustered information) and the 2D-aided inspection (one-by-one).
However, the experimental results showed a higher rate of taking a wrong dimension
in the manual inspection. When too much information appears together, there is a
possibility of choosing an inappropriate segment of information, or of a longer search
time. By providing the selected information which is only related to the current
interest, the inspectors attention can be directed to the immediate action with fewer
errors.

101
4. Automate the decision function by using a computer.
Because the dimensional and geometric inspection is a measurement of quantitative
variables, the decision function can be highly reliable with a computer.
In the context of flaw detection, the automated inspection system could not provide a
satisfactory result because of the lack of a reliable decision algorithm (Drury 1992).
However, for the dimensional and geometric inspection, the decision with
quantitative value is an obvious candidate for automation. As seen in Table 31, the
automation decision process might be useful to eliminate decision errors. In addition,
it might reduce the workloads of human inspectors.

102
REFERENCES Abernethy, B. (1988). Visual search in sports and ergonomics: Its relationship to
selective attention and performer expertise. Human Performance, 1, 205-235.
Adam, S. K. (1975). Decision making in quality control: some perceptual and behavioral
considerations. In C. G. Drury & J. G. Fox (Eds.), Human Reliability in Quality
Control (pp. 55-69). London: Taylor and Francis.
Azuma, R. T. (1997). A survey of augmented reality. Presence: Teleoperators and Virtual
Environments, 6(4), 355-385.
Bailey, R. (1982). Human performance engineering. Englewood Cliff, NJ: Prentice Hall.
Bajura, M., Fuchs, H., & Ohbuchi, R. (1992). Merging virtual objects with the real world:
Seeing ultrasound imaginary within the patient, Computer Graphics ACM
SIGGRAPH, 203-210.
Ball, K. K., Beard, B. L., Roenker, D. L., Miller, R. L., & Griggs, D. S. (1988). Age and
visual search: Expanding the useful field of view. Journal of Optical Society of
America, A(5), 2210-2219.
Barnes, R. M. (1963). Motion and time study. New York, NY: Wiley.
Becklen, R., & Cervone, D. (1983). Selective looking and noticing of unexpected events.
Memory & Cognition, 11(6), 601-608.
Blackwell, H. R. (1970). Development of procedures and instruction for visual task
evaluation. Illuminating Engineering, 65, 267-291.
Bloomfield, J. R. (1975). Studies on visual search. In C. G. Drury & J. G. Fox (Eds.),
Reliability in quality control (pp. 31-43). London: Taylor & Francis.
Bosch, J. A. (1987). Automatic dimensional inspection. In The 8th International
Conference on Automated Inspection and Product Control (pp. 157-166).
Bedford, UK: Cotswold Press.
Bowman, D. A., & Hodge, L. F. (1998). The virtual venue: Use-computer interaction in
information-rich virtual environment. Presence: Teleoperators and Virtual
Environments, 7(5), 478-493.

103
Brooks, F. P., Jr. (1996). Computer science as toolsmith II. Communications of the
ACM, 39(3), 61-69.
Bryson, S. (1997). The virtual windtunnel on the virtual workbench. IEEE Computer
Graphics and Applications, 17(4), 15.
Burdea, C., & Coiiffet, P. (1994). Virtual reality technology. New York, NY: Wiley.
Card, S. K., Moran, T. P., & Newell, A. (1983). The psychology of human-computer
interaction. Hillsdale, NJ: Lawrence Erlbaum Associates.
Chaney, F. B., & Teel, K. S. (1967). Improving inspection performance through training,
and visual aids. Journal of Applied Psychology, 51, 311-315.
Chapanis, A. (1970). Human factors in system engineering. In K. DeGreen, B, (Ed.),
System Psychology . New York, NY: McGraw Hill.
Chi, C. F. (1990). The human as an optimizer in inspection. Unpublished , State
University of New York, Buffalo.
Christ, R. E., Hill, S. G., Ayers, J. C., Iavecchia, H. M., Zaklad, A. L., & Bittner, A. C.
(1993). Application and validation of workload assessment techniques (Technical
Report 974). Alexandria, VA: U.S. Army Research Institute for the Behavioral
and Social Science.
Chung, K. H., Shewchuk, J. P., & Williges, R. C. (1999). An application of augmented
reality to thickness inspection. Human Factors and Ergonomics in Manufacturing,
9(4), 331-342.
Chung, K. H., Shewchuk, J. P., & Williges, R. C. (2002). An analysis framework for
applying virtual environment technology to manufacturing tasks. Human Factors
and Ergonomics in Manufacturing, 9.
Craig, A., & Colquhoun. (1975). Vigilance: a review. In C. G. Drury & J. G. Fox (Eds.),
Human Reliability in Quality Control (pp. 71-87). London: Taylor and Francis.
Czaja, S. J., & Drury, C. G. (1981). Training programs for inspection. Human Factors,
23(4), 473-484.
Dai, F. (1998). Virtual reality for industrial application. NY, New York: Springer.
Dai, F., & Göbel, M. (1994). Virtual prototyping-An approach using VR-techniques. In
Proceedings of Computers in Engineering (pp. 311-316) ASME.

104
Dede, C., Salzman, M., & Loftin, R. (1996). ScienceSpace: Virtual reality for learning
complex and abstract scientific concepts. In Virtual Reality Annual International
Symposium '96 IEEE Computer Society.
Downing, C. J. (1988). Expectancy and visual-spatial attention: Effects on perceptual
quality. Journal of Experimental Psychology: Human Perception & Performance,
14, 344-347.
Drury, C. G. (1975). Improving Human decision making in quality control. In C. G.
Drury & J. G. Fox (Eds.), Human Reliability in Quality Control (pp. 45-53).
London: Taylor and Francis.
Drury, C. G. (1979). The effect of speed of working on industrial inspection accuracy.
Applied Ergonomics, 4, 2-7.
Drury, C. G. (1982). Improving Inspection performance. In G. Salvendy (Ed.), Handbook
of Industrial Engineering (pp. 2282-2314). New York: John Wiley & Sons.
Drury, C. G. (1990). The information environment in inspection. In FAA (Ed.), Human
Factors Issues in Aircraft Maintenance and Inspection: Information exchange &
communication (pp. 98-109). Washington D.C.: FAA.
Drury, C. G. (1992). Inspection performance. In G. Salvendy (Ed.), Handbook of
Industrial Engineering (pp. 2282-2314). New York: John Wiley & Sons.
Drury, C. G., & Addison, J. L. (1973). An industrial study of the effects of feedback and
fault density on inspection performance. Ergonomics,, 16, 59-169.
Drury, C. G., & Prabhu, P. V. (1994). Human factors in test and inspection. In G.
Salvendy & W. Karwowski (Eds.), Design of work and development of personnel
in advanced manufacturing (pp. 355-401). New York: John Wiley and Sons.
Drury, C. G., & Sinclair, M. A. (1983). Human and machine performance in an
inspection task. Human Factors, 25(4), 391-399.
Ekstrom, R. B., French, J. W., & Harmon, H. H. (1976). Manual for kit of factor-
referenced cognitive tests. Princeton: ETS.
Ellis, S. R. (1995). Origins and elements of virtual environments. In W. Barfield & T. A.
I. Furness (Eds.), Virtual Environments and Advanced Interface Design (pp. 14-
57). New York, NY: Oxford University Press.

105
Embrey, D. E. (1979). Approaches to training for industrial inspection. Applied
Ergonomics, 10, 135-144.
Farago, F. T., & Curtis, M. A. (1994). Handbook of dimensional measurement. New
York, NY: Industrial Press.
Faulkner, T. W., & Murphy, T. J. (1975). Lighting for difficulty visual tasks. In D. C. G.
& F. J. G (Eds.), Human reliability in quality control. London: Taylor & Francis.
Feiner, S., MacIntyre, B., & Seligmann, D. (1993). Knowledge-based augmented reality,
Communication of the ACM, 36(7), 52-62.
Finger, S., Baraff, D., Siewiorek, D. P., Weiss, L., Witkin, A., Sundararajan, V., Wright,
P., Cutkosky, M., & Prinz, M. C. (1997). Rapid design: Integrating virtual and
physical prototypes. In 1997 NSF Design and Manufacturing Grantees
Conference (pp. 41-42)NSF.
Flaig, T., & Thrainsson, M. T. (1996). Virtual prototyping-New information techniques
in product design. In 1996 ASME Design Engineering Technical Conferences and
Computers in Engineering Conference (pp. 96-DETC/DFM-1417)ASME.
Furness, T. A., & Barfield, W. (1995). Introduction to virtual environments and advanced
interface design. In T. A. Furness III & W. Barfield (Eds.), Virtual environments
and advanced interface design (pp. 3-13). New York, NY: Oxford University
Press.
Giesecke, F. E., Mitchell, A., Spencer, H. C., Hill, I. L., & Dygdon, J. T. (1986).
Technical Drawing. New York, NY: Macmillan Publishing Company.
Gillan, D. J., & Richman, E. H. (1994). Minimalism and syntax of graphs. Human
Factors, 36, 619-644.
Goesch, T. (1990). Head up displays hit the road. Information display, 7(8), 10-13.
Gramophdhye, A., Bhagwar, S., Kimbler, D., & Greenstein, J. (1998). The use of
advanced technology for visual inspection training. Applied Ergonomics, 29(5),
361-375.
Green, D. M., & Swets, J. A. (1988). Signal detection theory and psychophysics. New
York, NY: Wiley.

106
Hara, Y., Okamoto, T., Hamada, N., & Akyama, N. (1980). Automatic visual inspection
of LSI photomasks. In Proceedings of 5th International Joint Conference of
Pattern Recognition (pp. 273-279).
Harlow, C. A., Henderson, S. E., Rayfield, D. A., Johnston, R. J., & Dwyer III, S. J.
(1975). Automated inspection of electronic assemblies. Computer, 4, 130-137.
Harris, D. H., & Chaney, F. B. (1969). Human factors in quality assurance. New York:
Wiley.
Harris, R. L., & Christhif, D. M. (1980). What do pilots see in displays? In Proceedings
of the 24th Annual Meeting of Human Factors Society Human Factors Society.
Hart, S. G., & Staveland, L. E. (1988). Development of NASA-TLX (Task Load Index):
Results of experimental and theoretical research. In P. A. Hancock & N. Meshkati
(Eds.), Human Mental Workload (pp. 139-183). Amsterdam: North Holland.
Holahan, C. J., Culler, R. E., & Wilcox, B. L. (1978). Effects of visual distraction on
reaction time in a simulated traffic environment. Human Factors, 20(4), 409-413.
Holding, D. H. (1981). Human skills. New York, NY: Wiley.
Hollnagel, E. (1989). The phenotype of erroneous actions: Implication for HCI design. In
C. R. S. Weir & J. L. Alty (Eds.), Human-Computer Interaction and Complex
System . London: Academic Press.
Hou, T. H., Lin, L., & G., D. C. (1993). An empirical study of hybrid inspection systems
and allocation of inspection functions. International Journal of Human Factors in
Manufacturing, 3(4), 351-367.
Jordan, N. (1963). Allocation of functions between man and machines in automated
system. Journal of Applied Psychology, 47, 161-165.
Kalawsky, R. S. (1993). The science of virtual reality and virtual environment. Reading,
MA: Addison-Wesley.
Kantowitz, B. H., & Sorkin, R. D. (1983). Human factors: Understanding people-system
relationship. New York: John Wiley and Sons.
Kelley, M. L. (1955). A study of industrial inspection by the methods of paired
comparison. Psychological Monograph, 69.9(399), 1-16.
Kinchla, R. A. (1992). Attention. Annual Review of Psychology, 43, 711-742.

107
Kleiner, B. K. (1983). Ergonomic/Economic design of visual inspection workplace. In
Proceedings of Human Factors Society 27th Annual Meeting (pp. 307-
309)Human Factors Society.
Kleiner, B. K., & Drury, C. G. (1993). Design and evaluation of an inspection training
program. Applied Ergonomics, 24(2), 75-82.
Kroemer, K., Kroemer, H., & Kroemer-Elbert, K. K. (1994). Ergonomics: How to design
for ease & efficiency. England Cliff, NJ: Prentice Hall.
Kundel, H. L., & Nodine, C. F. (1978). Studies of eye movements and visual search in
radiology. In J. W. Senders, D. E. Fisher, & R. A. Monty (Eds.), Eye Movements
and The Higher Psychological Functions (pp. 317-328). Hillsdale, NJ: Erlbaum.
Kundel, H. S., & Lafollette, B. S. (1972). Visual search patterns and experience with
radiological images. Radiology, 103, 523-528.
Lim, T. K., Swaminathan, S., Woo, C. K., Chan, C. N., & Wonh, Y. K. (1997).
Automated inspection and dimensional measurement of optoelectronic
components. In Automatic Inspection and Novel Instrumentation (pp. 32-49).
Bellingham, WA: SPIE.
Liuzzo, J. G., & Drury, C. G. (1980). An evaluation of blink inspection. Human Factors,
20(5), 561-572.
Mackworth, N. H. (1976). Ways of recording line of sight. In R. A. Monty & J. W.
Senders (Eds.), Eye Movements and Psychological Processing (pp. 173-178).
Hillsdale. NJ: Erlbaum.
Mahdvieh, Y. (1987). The development of an on-line non-contact visual gauging system.
In The 8th International Conference on Automated Inspection and Product
Control (pp. 109-119). Bedford, UK: Cotswold Press.
Maher, J., Overbach, W., Plamer, G., & Piersol, D. (1970). Enriched jobs improve
inspection performance. Work Study and Management Services, October, 821-
824.
Martin, M. (1992). Computer vision, model and inspection. River edge, NJ: World
Scientific.
Martin-Emerson, R., & Wickens, C. D. (1977). Superimposing, symbology, visual
attention, and the head-up display. Human Factors(39), 581-601.

108
McConkie, G. W. (1983). Eye movements and perception between auditory and visual
perception. In K. Raynor (Ed.), Eye Movement in Reading . New York, NY:
Academic Press.
McNichol, D. (1990). A primer of signal detection theory. London: Allen and Unwin.
Megaw, E. D. (1979). Factors affecting visual inspection accuracy. Applied Ergonomics,
10, 27-32.
Mei, W-H., Case, K. E., Schmidt, J. W. (1975). Bias and imprecision in variable
acceptance sampling: effects and compensation. International Journal of
Production Research, 13(4), 327-340.
Micalizzi, J., & Goldburg, J. H. (1989). Knowledge of results in visual inspection:
Implications for training. International Journal of Industrial Ergonomics, 4, 225-
235.
Milgram, P., & Drascic, D. (1997). Perceptual effects in alignment virtual and real
objects in augmented reality displays. In Human Factors and Ergonomics Society
Annual Meeting (pp. 1239-1243).
Morawski, T., Drury, C. G., & Karwan, M. H. (1980). Predicting search performance for
multiple targets. Radiology, 103, 707-718.
Moray, N., Lootseen, P., & Pajak, J. (1986). The acquisition of process control skills.
IEEE Transactions, SME-16, 497-505.
Naimark, M. (1992). Element of real space imaging: a proposed taxonomy. In Proceeding
of SPI (pp. 14-17)Electronic Imaging.
Neisser, U. (1963). Decision time without reaction time. American Journal of
Psychology, 76, 376-385.
Neisser, U., & Becklen, R. (1975). Selective looking: Attention to visually specified
events. Cognitive psychology, 7, 480-494.
Nygren, T. E. (1991). Psychometric properties of subjective workload measurement
techniques: Implications for their use in the assessment of perceived mental
workloads. Human Factors, 33, 17-31.
Overington, I. (1973). Visions and acquisitions. London: Pentech Press.
Preece, J., Rogers, Y., Sharp, H., Benyon, D., Holland, S., & Carey, T. (1994). Human-
computer interaction. New York, NY: Addison-Wesley.

109
Rasmussen, J. (1983). Skills, rules, and knowledge; signals, signs, and symbols, and other
distinction in human performance models. IEEE Transactions on Systems, Man
and Cybernetics, SMC-13, 257-266.
Reason, J. (1990). Human error. Cambridge, UK: Cambridge University Press.
Reid, G. B., & Nygren, T. E. (1988). The subjective workload assessment technique: A
scaling procedure for measuring mental workload. In P. A. Hancock & N.
Meshkati (Eds.), Human Mental Workload (Vol. 185-218, ). Amsterdam: North
Holland.
Reid, G. T., & Rixon, R. C. (1985). 3-D machine vision for automatic measurements of
complex shape. In The 7th International Conference on Automated Inspection and
Product Control (pp. 129-138). Bedford, UK: Cotswold Press.
Risch, J., May, R., Thomas, J., & Dowson, S. (1996). Interactive information
visualization for exploratory intelligence data analysis. In Virtual Reality Annual
International Symposium '96 (pp. 230-238)IEEE Society.
Robertson, G., Card, S., & Mackinlay, J. (1993). Information visualization using 3D
interactive animation. Communication of ACM, 36(4), 57-71.
Robinett, W. (1992). Synthetic experience: a proposed taxonomy. Presence:
Teleoperators and Environments, 1(2), 229-249.
Salvendy, G., & Seymore, J. W. D. (1973). Prediction and development industrial work
performance. New York, NY: Wiley.
Sanders, M. S., & McCormick, E. J. (1993). Human factors in engineering and design.
(Seventh ed.). New York: McGraw-Hill.
Schoonhard, J. W., Gould, J. D., & Miller, L. A. (1973). Studies of visual inspection.
Ergonomics, 16, 365-379.
Scialfa, C. T., Kline, D. W., & Lyman, B. J. (1987). Age differences in target
identification as a function of retina location and noise level: Examination of the
useful field of view. Psychology and Aging, 2, 14-19.
Sheehan, J. J., & Drury, C. G. (1973). The analysis of industrial inspection. Applied
Ergonomics, 2(2), 74-78.
Sheridan, T. B. (1992). Musings on telepresence and virtual presence. Presence:
Teleoperators and Virtual Environment, 1(120-125).

110
Sheridan, T. B., & Ferrell, W. A. (1974). Man-machine system: Information, control, and
decision models of human performance. Cambridge, MA: MIT Press.
Shewchuk, J. P. (2001). ISE 2214 Course Pack: Manufacturing Process Laboratory .
Blacksburg, VA: Virginia Polytechnic Institute and State University.
Shewchuk, J. P., Chung, K. H., & Williges, R. C. (2002). Virtual environment in
manufacturing (pp. 1119-1142). In K. Stanney (Ed.), Handbook of Virtual
Environments. NJ: Lawrence Erlbaum.
Sims, D. (1994). New reality in aircraft design and manufacturing, IEEE Computer
Graphics and Application, 14(2), 91.
Sinclair, M. A. (1979). The use of performance measures on industrial examiners in
inspection schemes. Applied Ergonomics, 10, 17-25.
Sinclair, M. A. (1984). Ergonomic quality control. Workshop document. In International
Conference on Occupational Ergonomics .
Skaggs, F., & Meyer, R. (1985). Vision computer based parts measurement system. In
The 7th International Conference on Automated Inspection and Product Control
(pp. 99-110). Bedford, UK: Cotswold Press.
Sojourner, R. J., & Antin, J. F. (1990). The effects of a simulated head-up display
speedometer on perceptual task performance. Human Factors, 32, 329-339.
Somberg, B. L. (1987). A comparison of rule-based and positionally constant
arrangements of computer menu items. In Proceedings of CHI & GI '87
Conference of Human Factors in Computing Systems Association of Computer
Machinery.
Stanney, K. M., Ronald, R. M., & Kennedy, R. S. (1998). Human factors issues in virtual
environments: A review of the literature. Presence, 7(4), 327-351.
Steenblik, J. W. (1989). Alaska Airlines' HGS. Air line pilot, December, 10-14.
Swets, J. A., & Pickett, R. M. (1982). Evaluation of diagnostic systems. New York, NY:
Academic Press.
Takatoo, M., Takagi, Y., & Mori, T. (1989). Automated fabric inspection system using
image processing techniques. In Automated Inspection and High Speed Vision
Architectures II (pp. 151-158)SPIE.

111
Teel, U. S., Springer, R. M., & Sadler, E. E. (1968). Assembly and inspection in micro
electric system. Human Factors, 10, 217-244.
Tiffin, J., & Roger, H. B. (1941). The selection and training of inspectors. Personnel, 18,
14-37.
Wang, M. J. & Drury, C.G. (1989). A method of evaluating inspector's performance
differences and job requirement. Applied Ergonomics, 20(3), 181-190.
West, G. A. W. (1984). System for automated visual inspection of bare printed circuit
boards. IEEE Transactions on Systems, Man and Cybernetics, SMC-14(5), 767-
773.
Wickens, C. D., & Andre, A. D. (1990). Proximity compatibility and information display:
Effects of color, space, and objectiveness of information integration. Human
Factors, 32, 61-77.
Wickens, C. D., & Carswell, C. M. (1995). The proximity compatibility principle: Its
psychological foundation and relevance to display design. Human Factors, 37,
473-494.
Wickens, C. D., & Hollands, J. G. (1999). Engineering psychology and human
performance. (2nd ed.). New York, NY: Harper Collins Publishers.
Wickens, C. D., & Long, J. (1995). Object versus space-based models of visual attention:
Implications for the design of head-up displays. Journal of Experimental
Psychology, 1, 179-193.
Wiener, E. L. (1984). Vigilance and inspection. In J. S. Waren (Ed.), Sustained attention
in human performance (pp. 207-245). New York, NY: Wiley.
Williams, H. P., Wickens, C. D., & Huchinson, S. (1994). Fidelity and interactivity in
navigation training: A comparison of three methods. In Human Factors Society
38th Annual Meeting (pp. 1163-1167)Human Factors Society.
Williams, L. J. (1989). Foveal load affects the functional field of view. Human
Performance, 2, 1-28.
Wilson, J. (1998). Task analysis and work design. In V. Martino & N. Corlett (Eds.),
Work Organization and Ergonomics (pp.13-48). Geneva: International Labor
Office.

112
Wilson, J. R., Brown, D. J., Cobb, S. V., D'cruz, M. M., & Eastgate, R. M. (1995).
Manufacturing operations in virtual environments (MOVE). Presence:
Teleoperators and Virtual Environments, 4(3), 306-317.
Wilson, J. R., Cobb, S., D'Cruz, M., & Eastgate, R. (1996). Virtual reality for industrial
application: Opportunities and limitations. Nottingham: Nottingham University
Press.
Yeh, M., Wickens, C. D., & Seagull, F. J. (1998). Conformity and target cueing:
Presentation of symbology in augmented reality. In Proceedings of the 42th
Annual Meeting of the Human Factors and Ergonomics Society (pp. 1526-
1530)Human Factors and Ergonomics Society.
Zachmann, G. (1998). VR-technology for industrial applications. In F. Dai (Ed.), Virtual
Reality for Industrial Application (pp. 13-27). New York, NY: Springer.
Zeltzer, D. (1992). Autonomy, interaction, and presence. Presence: Teleoperators and
Virtual Environment, 1, 127-132.

113
APPENDIX A: INFORMED CONSENT FORM

114
VIRGINIA POLYTECHNIC INSTITUTE AND STATE UNIVERSITY Informed Consent for Participants
in Research Projects Involving Human Subjects
Title of Project Application of Augmented Reality to Dimensional Inspection Task Investigator(s) Kyung Ho Chung, Robert C. Williges (Chair) .
I. Purpose of this Research/Project Augmented reality (AR) technology is expected to provide enhancements for the manufacturing process. Specifically, AR technology offers great promise over conventional technology for product design, development, manufacturing, assembly, and quality control. The purpose of this experiment is to evaluate the usefulness of AR technology to improve the performance of a dimensional inspection task by providing task specific information. II. Procedures In this study you will be asked to conduct an inspection task to determine the conformity of six metal parts. Your task is to take measures of various dimensional attributes to determine their quality with five measuring devices. Four different experimental conditions will be used to compare the performance differences as a function of information transmission modes including manual, 2D-aided, 3D-aided and AR-aided inspections. You will take measures of dimensional attributes by using only one of the three inspection methods. The task completion time and measurement accuracy are recorded to evaluate performance differences among the three modes. This experiment will take approximately three hours including an hour of practice. III. Risks There are no risks associated with this study outside of those encountered from using a computer or a see-through display. However, it is known that some people can be susceptible to motion sickness during virtual reality simulation. At anytime, you can withdraw from the participation of this research without penalty, if you feel any discomfort or don’t want to continue.

115
IV. Benefits of the Project No direct benefits accrue to the participant. However, the results of this research are expected to provide a great knowledge to understand the potential of AR and its applicability to various manufacturing process tasks. No promise or guarantee of benefits has been made to encourage you to participate. V. Extent of Anonymity and Confidentiality The data gathered in this experiment will be treated with confidentiality. Your name will not appear on any of the data collected. A random number will replace your name on all documents. You have the right to see your data and withdraw from the study if you so desire. The data will be stored and locked within the Human-Computer Interaction Laboratory (530C Whittemore) and be disposed of after analysis in approximately two months. VI. Compensation You will be paid eight dollars per hour for the time actually spent in the experiment. If you do not work in whole hour increments, you will be given an additional two dollars for every fifteen minutes. VII. Freedom to Withdraw You are free to withdraw from participation in this research program without penalty. No one will try to make you continue if you do not want to continue, and you will be paid in full for the amount of time you participated. VIII. Approval of Research This research project has been approved, as required, by the Institutional Review Board for Research Involving Human Subjects at Virginia Polytechnic Institute and State University, and by the Department of Industrial and Systems Engineering. _____________________________ _____________________________ IRB Approval Date Approval Expiration Date

116
IX. Subject's Responsibilities I voluntarily agree to participate in this study. I have the following responsibilities: I should not volunteer for participation, if I now know I will not be able to complete this experiment. After completion of this study, I will not discuss my experiences with any other individual for a period of two months. This will ensure that everyone will begin the study with the same level of knowledge and expectations.
X. Subject's Permission I have read and understand the Informed Consent and conditions of this project. I have had all my questions answered. I hereby acknowledge the above and give my voluntary consent for participation in this project. If I participate, I may withdraw at any time without penalty. I agree to abide by the rules of this project. ____________________________________ __________________________ Signature Date Should I have any pertinent questions about this research or its conduct, and research subjects' rights, and whom to contact in the event of a research-related injury to the subject, I may contact: Kyung H. Chung_______________________ _231-3193/ [email protected] Investigator(s) Telephone/e-mail Robert C. Williges______________________ _231-6270/[email protected]_ Faculty Advisor Telephone/e-mail _Robert, J. Beaton_______________________ _231-5931/[email protected]___ Departmental Reviewer/Department Head Telephone/e-mail
David M. Moore 540-231-4991/[email protected] Chair, IRB Telephone/e-mail
Office of Research Compliance Research & Graduate Studies This Informed Consent is valid from ________ to ________.

117
APPENDIX B: INSTRUCTION KIT

118
INSTRUCTIONS
This instruction kit includes the inspection task that you are going to perform
along with measuring devices, and practice material. You must follow the standardized
sequence and measuring methods that are provided by this instruction. At anytime during
this session, feel free to ask questions if something is not clear.
TASK DESCRIPTION
This study looks at dimensional inspection performance differences by using three
different ways of presenting information. You will conduct dimensional inspection tasks
by using one of the three following inspection methods: manual, computer-aided, or AR-
aided inspections. Your task is to measure the dimensional properties on six metal parts
with five measuring devices: dial caliper, height gage, depth gage, protractor, and dial
indicator. You should try to finish your task as soon as possible without sacrificing the
correctness of your measurement.
MEASURING ATTRIBUTES AND DEVICES
Each device is designated to measure certain dimensional attributes. The dial
caliper is used to measure length, width, and diameter. The height gage is used for height
and thickness. The depth gage is used for the depth of holes or the bottom of features.
The protractor is used to measure the angular dimensions. Finally, the dial indicator is
used to determine flatness or roundness. A certain dimensional attribute can often be
measured by more than one device. For instance, when the bottom of a part is flat, it can
be measured either with the dial caliper, or with the height gage. However, you must to
use the predetermined device that is designated for a certain dimensional attribute of
interest by the instructor. Each attribute is coded to match a particular measuring device.
The following codes are used for this experiment:

119
TABLE 1. Dimensional Attribute and Matching Measuring Devices
Code Attribute Description of Attribute Devices
L Length Horizontal distance between two points
W Width Lateral distance between two points
D Diameter Inside/outside diameter of circle
Dial Caliper
H Height Vertical distance between two points Height Gage
DT Depth Depth of features or holes Depth Gage
A Angle Angular magnitude resulting from intersection of two straight lines
Protractor
F Flatness Flatness of surface related to a perfect plane
P Parallelism Parallelism between two surfaces
R Roundness Uniformity, or deviation from the ideal form
Dial Indicator
Suppose the code of measuring dimension is D1, it is the measurement of the first
diameter on a part. It is supposed to be measured with a “Dial Caliper” as shown in
Table 1.
MEASUREMENT
You must measure each dimension 3 times. The average value of your
measurements will be used to decide the conformity of the dimensions of interest
according to the given tolerance bounds. Be sure to take three readings with equally
paced distances: for instance, one at the center, one about 0.25 in from each end. Rotate
the part about 60 degrees, when you measure the attributes of the rotational parts. You
must conduct measurements until all attributes of interest are exhausted, even if any
nonconformity is found.

120
DATA RECORDING
The general measuring sensitivity of all devices except the protractor is 0.001
inch with plain reference marks. The measuring sensitivity of a protractor is 5 min (e.g.,
1/12°).
All dimensional values should be written in the standardized way. All readings
and the averages need to be written in 4 digit numbers, for example 0.340, 1.345, etc.
Angular dimensions should be written 45.05, 90.15, etc.
DIMENSIONAL AND GEOMETRIC TOLERANCES
Dimensional tolerances are used to specify bounds on nominal dimensions such
as length, width, height, diameter, and angle. All nominal dimensions will be given
along with an upper and lower bound. If the deviation of any dimension is within ±
0.015, the dimension of a part is within acceptable bounds. The tolerance bound of an
angle is ± 1 min (0.05 degree).
Geometric tolerance is used to specify the bounds on the geometry of a part’s
feature. Four geometric features, flatness, parallelism, roundness and concentricity, will
be measured in this experiment. The deviation of a surface must be at the correct height
(nominal dimension + tolerance). The tolerance for geometric tolerance is 0.010.

121
MANUAL INSPECTION
You will use a pencil, ruler, eraser, calculator and six engineering drawings that
show the dimensional attributes of parts along with five measuring devices. You must
take readings, record values, calculate averages, and mark on an inspection report
whether the dimensional attribute is acceptable or not according to the given tolerance
limits.
Inspection Sequence
The following is the standardized inspection sequence for the manual inspection;
1. Place a part on the inspection station and set up the measuring devices.
2. Determine the current measuring dimension according to the inspection report and the
engineering drawing.
3. Be sure to determine the measuring locations before taking a reading. Use a pencil to
determine the exact points of measurement if it is necessary. All attributes except
height can be measured without markings.
4. Use the matching measuring device for each dimension according to the code of the
dimension of interest.
5. Record the three readings and calculate the average value to decide whether the
dimension is within the tolerance limit.
6. Repeat steps 1 through 4 until all dimensions of interest are exhausted.
7. Erase all marks on the part.
8. Tell the experimenter that you have finished your inspection of the part.

122
COMPUTER-AIDED INSPECTION
You will use a pencil, ruler, and eraser along with five measuring devices. A
computer will show the information related to each dimension on the screen during an
inspection task. The computer shows which device is to be used, measuring sequence,
tolerance limit, and other information related to the inspection task.
Inspection Sequence
The following is the standardized inspection sequence for the computer-aided
inspection;
1. Place a part on the inspection station and set up the measuring devices.
2. The current measuring dimension will appear one by one on the computer screen.
Use the measuring device that is highlighted in white.
3. Be sure to determine the measuring locations before taking a reading. Use a pencil to
determine the exact points of measurement if it is necessary. All attributes except
height can be measured without markings.
4. Take a reading of the current measure and enter the data by using the keyboard.
• Enter the value in 4 digits and hit the “space bar”. Please locate the measuring
device as suggested on the screen.
• All dimensions should be measured 3 times. Then the target will go to the next
measurement dimension
• If you want to change the previous input data, press “p” key and repeat the
previous step.
5. Repeat steps 2 through 4 for all dimensional attributes of interest.
6. When all dimensional attributes are measured, there will be no more “red marks”
which represent the measuring locations.
7. Erase all marks on the part, if you made any.
8. Tell the experimenter that you have finished your inspection of the part.

123
AR-AIDED INSPECTION
You will use a see-through display so that you can see computer-generated
images and a real part superimposed together. When you superimpose the green wire-
frame exactly over the part, the red target shows the position of the current measurement.
However, you do not need to locate the device on the same measuring location that
appeared on the display, if the placement of the device does not affect the accuracy of the
measurement. The only placement sensitive measurement in this experiment is the height
measurement. You must make an alignment between the part and the wire-frame model
that represents the physical part.
How to use the see-through display
When you use the see-through display, you can see both the computer-generated
image and the real image simultaneously through the goggles. The green wire image on
the screen is the replicate of the physical part.
Tips for Superimposing:
• Make the length of the virtual image and the real object the same by controlling
the position of the display.
• If the width of the two objects is not identical, rotate the virtual image by using
“up” key or “down” key on the keyboard.
• Remember only the height measurement needs the good alignment to take a
reading. Other measurements can be taken without perfect alignment.

124
Inspection Sequence
The following is the standardized inspection sequence for the AR-aided inspection;
1. Place a part on the inspection station and set up the measuring devices.
2. The current measuring dimension will appear one by one on the screen. Select the
measuring device that is highlighted in white.
3. Make an alignment of the wire-frame over the physical part for height measurement.
4. Take a reading of the current measurement and enter the data by using the keyboard.
• Enter the value in 4 digits and hit the “space bar”. Please locate the measuring
device as suggested on the screen.
• All dimensions should be measured 3 times. The target will then go to the next
measurement dimension
• If you want to change the previous input data, press “p” and repeat the previous
step.
5. Repeat steps 2 through 4 for all dimensional attributes of interest.
6. When all dimensional attributes are measured, there will be no more “red marks”
which represent the measuring locations.
7. Tell the experimenter that you have finished your inspection of the part

125
MESURING DEVICES Note: The instruction materials were made from the Handbook of Dimensional Measurement (Fargo & Curtis, 1995), Technical Drawing (Geisecke et al, 1986), and ISE 2214 Lab. manual (Shewchuk, 2001).
Dial Caliper
A dial caliper consists of a scale and two jaws, one movable and one fixed. The
part to be measured is placed inside the jaws, the jaws are tightened, and the
measurement is taken. The measurement is established by reading the scale (each
division = 0.1 inch) and adding on the value read in the dial (each division = 0.001 inch).
A dial caliper can be used to measure internal and external features. Dial calipers are
very commonly used for measuring length and diameter. They can also be used for
measuring the size and depth of internal features, such as holes and pockets.
Figure 1. Dial caliper components (from Shewchuk, 2001)
Height Gage
The basic design of the height gage is same as that of the dial caliper. The
primary use of height gages in the surface plate work is as a layout tool for marking off
vertical distances and for measuring height and thickness difference between steps at
various levels. Height gages differ from dial calipers in that they have a single jaw. The
height gages are made with wide bases, with bars of cross section, and with dials.

126
Figure 2. Dial height gage (from www.mitutoyo.com)
Dial Indicator
Dial indicators are simple mechanical devices which convert linear movement to
rotation of an indicator needle on a circular dial. The indicator is first zeroed (i.e., the
indicator needle is made to point to zero on the scale) with respect to some reference
surface, then the part is brought into contact with the contact point. The measurement is
read directly from the circular dial. Dial indicators are used with various holding fixtures
for measuring thickness, height, straightness, parallelism, roundness, flatness, and runout.
The fixture must be located on a solid, flat surface for such measurements to be taken.

127
Figure 3. Dial indicator component (from Farago & Curtis, 1994)
Depth Micrometer
A depth micrometer consists of a threaded spindle inside a T-shaped frame. A
graduated thimble and sleeve are located at the end of the spindle: rotating the thimble
causes the spindle to move down and protrude from the bottom of the frame. The
micrometer base is placed over the feature to be measured, and the spindle turned until it
contacts the bottom of the feature.
Figure 4. Depth micrometer and rods (from www.mitutoyo.com)

128
Bevel Protractor
Universal bevel protractors are equipped with a full circular scale graduated into
360 degrees and complemented by a vernier scale applied to a segment. The segment has
12 graduation lines with special spacing in either directing to permit the subdivision of
each one degree interval on the main scale into 12 equal parts corresponding to 1/12th part
of a degree; that is, 5 minutes. Figure 5 shows how to use the bevel protractor to
measure parts which have different shapes.
(a)
(b) (c)
Figure 5. Bevel protractor and its usage (from Farago & Curtis, 1994) (a) Universal bevel protractor with thumb nut for fine adjustment (b) The measurement of a part having a acute angle (c) The angle being measured is related to that common reference plate

129
PRACTICE: PULLEY INSPECTION
1. Overall Length (L1) Equipment: Dial Caliper
a. Take three equally-spaced readings of the pulley length: rotate pulley about 60° after each measurement b. Record each measurement, and calculate and record the average (as disposition
value), on the part inspection report.
2. Pulley Length (L2) Equipment: Dial Caliper
a. Take three equally-spaced readings of the pulley length: rotate pulley about 60° after each measurement b. Record each measurement, and calculate and record the average (as disposition
value), on the part inspection report. 3. Concentricity (C1) and Roundness (R1, R2) Equipment: Dial Indicator, 2 V-blocks, tapered mandrel
a. Place the pulley on a mandrel b. Place the mandrel on V-blocks as shown in below:
c. Raise the dial indicator contact point above the part height, then locate the contact point at point ‘a’ on the hub. Zero the indicator, using the bezel.
d. Rotate the mandrel with the pulley and note the range of the dial indicator movement. This is known as T.I.R. (Total Indicator Reading). Record this value (R1) on the inspection report.
e. Repeat steps c-d using point ‘b’ on the boss. Record this value (R2) on the inspection report.
f. Calculate the concentricity of boss with hub, C, as follows:
2|......| 21 RR RITRITC −
=

130
4. Hole Diameter (D1) Equipment: Dial Caliper (Inside Measuring)
a. Take three equally-spaced readings of the pulley length: rotate pulley about 60° after each measurement b. Record each measurement, and calculate and record the average (as disposition
value), on the part inspection report. 5. Hub Diameter: Outside Diameter (D2) Equipment: Dial Caliper (Outside Measuring)
a. Take three equally-spaced readings of the pulley length: rotate pulley about 60° after each measurement b. Record each measurement, and calculate and record the average (as disposition
value), on the part inspection report. 6. Height (H1) Equipment: Height Gage
a. Determine the measuring location by referring to the coordinates on the drawing. Mark the measuring point to decide the correct placement of the height gage.
b. Record each measurement, and calculate and record the average (as disposition value) on the part inspection report.
7. Angle (A1) Equipment: Universal Bevel Protractor
a. Embrace two bounding elements of the angle with a protractor. b. Record each measurement, and calculate and record the average (as disposition
value) on the part inspection report.

131
8. Parallelism (P1), or Flatness (F1) Equipment: Dial Indicator
a. Place the pulley top face up on the table. b. Position the dial indicator contact point so that it is about 1/8 inch above the part
surface, then move it to a position about ¼ inch from the right end of the pulley. c. Move the dial down, by moving the arm, until the contact point just touches the
pulley, then move down about 1/16 inch more. d. Zero the dial by turning the bezel. e. Slide the pulley longitudinally until the contact point is at the opposite end.
Watch the indicator while moving the pulley and note T.I.R. Record the value on the form.
f. Rotate the pulley about 60° and repeat step a through e three times g. Record the average value of the three readings as the disposition value on the
inspection report.

132
Part Inspection Report Part Type: Training Part Item No: Training Part Name: Pulley
Inspector #: Date:
Results Attribute
1st 2nd 3rd
Mean Accept Reject
1. Overall length (L1)
2. Length of pulley (L2)
3. Roundness (R1)
4. Angle (A1)
5. Hole Diameter (D1)
6. Outside Diameter (D2)
7. Height (H1)
8. Angle (A1)
9. Flatness (F1)


134
APPENDIX C: QUESTIONNAIRES

135
Subjective Questionnaires
This questionnaire consists of two parts: subjective judgment of body part discomfort and mental workloads related to the inspection task. Please answer every question by marking an appropriate scale by considering how you personally feel about you work experience with the task. Part1: Body Part Discomfort Please use the following picture to map the approximate position of the part of the body referred to in the questionnaire.
1. Head: I have experienced no discomfort at all during and after the experiment
1Strongly Agree
3Agree
5Neutral
7Disagree
9Strongly Disagree
2 4 6 8
2. Eye:
1Strongly Agree
3Agree
5Neutral
7Disagree
9Strongly Disagree
2 4 6 8

136
3. Neck:
1Strongly Agree
3Agree
5Neutral
7Disagree
9Strongly Disagree
2 4 6 8
4. Shoulder:
1Strongly Agree
3Agree
5Neutral
7Disagree
9Strongly Disagree
2 4 6 8
5. Upper Arm:
1Strongly Agree
3Agree
5Neutral
7Disagree
9Strongly Disagree
2 4 6 8
6. Elbows:
1Strongly Agree
3Agree
5Neutral
7Disagree
9Strongly Disagree
2 4 6 8
7. Lower Arm and Hands:
1Strongly Agree
3Agree
5Neutral
7Disagree
9Strongly Disagree
2 4 6 8
8. Upper Back:
1Strongly Agree
3Agree
5Neutral
7Disagree
9Strongly Disagree
2 4 6 8
9. Lower Back:
1Strongly Agree
3Agree
5Neutral
7Disagree
9Strongly Disagree
2 4 6 8
10. Hip and Thigh
1Strongly Agree
3Agree
5Neutral
7Disagree
9Strongly Disagree
2 4 6 8
11. Knees:
1Strongly Agree
3Agree
5Neutral
7Disagree
9Strongly Disagree
2 4 6 8
12. Ankles/Feet:
1Strongly Agree
3Agree
5Neutral
7Disagree
9Strongly Disagree
2 4 6 8

137
Part 2: Mental workloads
Please indicate how you personally feel about your work experience with the task by
marking how much you agree with each statement.
Mental Demand: How much mental activity (e.g., thinking, remembering, calculation, and decision) was
required?
2.1 The inspection task was easy to perform mentally.
1Strongly Agree
3Agree
5Neutral
7Disagree
9Strongly Disagree
2 4 6 8
Physical Demand: How much physical activity (e.g., manipulating, controlling, and handling, etc.) was
required?
2.2 The task was easy to perform physically.
1Strongly Agree
3Agree
5Neutral
7Disagree
9Strongly Disagree
2 4 6 8
Temporal Demand: How much time pressure did you feel due to the pace at which the task or task elements
occur?
2.3 The work pace was slow and leisurely.
1Strongly Agree
3Agree
5Neutral
7Disagree
9Strongly Disagree
2 4 6 8
Performance: How successful do you think you were in accomplishing the task set by the experimenter?
2.4 I was satisfied with my performance in accomplishing the task.
1Strongly Agree
3Agree
5Neutral
7Disagree
9Strongly Disagree
2 4 6 8
Effort: How hard did you have to work (mentally and physically) to accomplish your level of performance?
2.5 I could finish the inspection task with a minimum level of efforts.
1Strongly Agree
3Agree
5Neutral
7Disagree
9Strongly Disagree
2 4 6 8

138
Frustration Level: How insecure, discouraged, limited, stressed and annoyed did you feel during the task?
2.6 I felt secure and interested while performing the inspection tasks.
1Strongly Agree
3Agree
5Neutral
7Disagree
9Strongly Disagree
2 4 6 8
User Acceptance: How did you feel about the inspection method that you did?
2.7 I prefer the inspection method that I used in this experiment to what I did in class.
1Strongly Agree
3Agree
5Neutral
7Disagree
9Strongly Disagree
2 4 6 8
2.8 I recognized that I have seen the virtual image with one eye during the inspection task (Answer only if
you conducted the AR-aided inspection).
Yes/No
Please tell us if you have suggestions or comment related to this experiment.

139
Questionnaire Results
1. Body Part Discomfort Rating
Subject Method Q1 Q2 Q3 Q4 Q5 Q6 Q7 Q8 Q9 Q10 Q12 P12 1 1 2 6 5 3 3 3 4 3 6 1 4 4 2 1 6 6 7 7 6 3 5 7 7 6 3 3 3 1 6 8 2 4 4 9 4 3 8 8 8 8 4 1 5 3 6 3 3 3 3 3 5 3 3 3 5 1 2 2 2 2 2 2 2 4 2 2 2 2 6 1 1 1 1 1 1 1 1 1 1 1 1 1 1 2 7 4 3 4 6 7 7 3 4 6 8 8 2 2 1 3 6 3 1 6 1 6 3 1 1 1 3 2 5 3 9 8 7 8 9 9 9 6 3 5 4 2 3 3 7 3 5 5 5 7 7 3 3 5 5 2 1 1 1 1 1 1 1 1 1 1 1 1 6 2 1 1 1 1 1 1 1 7 1 1 1 1 1 3 3 3.5 3.5 1.5 2.5 1.5 1.5 3.5 2.5 1.5 1.5 1.5 2 3 2 1 2 6 3 2 3 8 5 1 1 1 3 3 1 1 3 4 3 1 1 4 7 4 1 1 4 3 1 9 6 7 1 1 5 7 8 1 1 1 5 3 2 5 2 2 2 1 7 7 5 1 1 1 6 3 1 1 2 1 1 1 1 1 7 1 1 1 1 4 1 6 7 6 2 2 3 5 2 1 3 1 2 4 6 3 1 3 3 3 3 9 9 3 3 1 3 4 3 4 6 3 3 3 6 5 7 3 3 3 4 4 1 1 1 1 1 1 1 1 1 1 1 1 5 4 3 3 5 3 3 3 3 7 3 3 3 3 6 4 1 1 3 1 1 1 1 1 5 1 1 1

140
2. Mental Workloads Rating Subject Method Q1 Q2 Q3 Q4 Q5 Q6 Q7
1 1 3 1 6 3 4 4 5 2 1 3 2 5 3 5 3 5 3 1 4 4 4 4 4 4 5 4 1 7 5 7 5 6 5 5 5 1 2 1 2 2 2 2 5 6 1 2 3 1 2 4 2 5 1 2 2 2 8 4 3 5 4 2 2 3 4 3 3 3 4 5 3 2 7 6 5 2 4 6 4 4 2 3 5 5 3 3 5 3 5 2 3 1 1 3 1 1 5 6 2 1 1 1 1 1 1 7 1 3 3.5 4.5 6.5 2.5 3.5 3.5 2 2 3 2 3 1 2 4 2 1 3 3 3 3 2 2 3 1 2 4 3 4 3 3 3 4 6 1 5 3 3 4 6 3 4 3 1 6 3 2 3 6 3 3 3 1 1 4 3 2 4 2 2 3 3 2 4 1 5 3 2 1 3 1 3 4 3 3 3 4 3 2 2 4 4 3 1 5 3 5 3 2 5 4 3 3 3 3 3 3 5 6 4 2 1 5 3 4 5 1

141
APPENDIX D: INSPECTION REPORT & ENGINEERING DRAWINGS

142
Part Inspection Report Part Type: Prismatic Item No: P-1 Part Name: Safety Key
Inspector #: Date:
Results Attribute
1st 2nd 3rd
Mean Accept Reject
1. Overall length (L1)
2. Width of middle (W1)
3. Length of left (L2)
4. Hole diameter (D1)
5. Left inside length (L3)
6. Overall height (H1)
7. Height of middle (H2)
8. Angle (A1)
9. Flatness (F1)
10. Overall width (W2)
11. Width of right (W3)
12. Top right width (W4)
13. Inner width (W5)
14. Top inside width (W6)
15. Depth (DT1)

143
Part Inspection Report Part Type: Prismatic Item No: P-2 Part Name: Finger Guide
Inspector #: Date:
Results Attribute
1st 2nd 3rd
Mean Accept Reject
1. Overall length (L1)
2. Length of left end (L2)
3. Length of center (L3)
4. Inside width (W1)
5. Overall height (H1)
6. Height of middle (H2)
7. Flatness (F1)
8. Overall width (W2)
9. Rear inside width (W3)
10. Right slop angle (A1)
11. Left slop angle (A2)
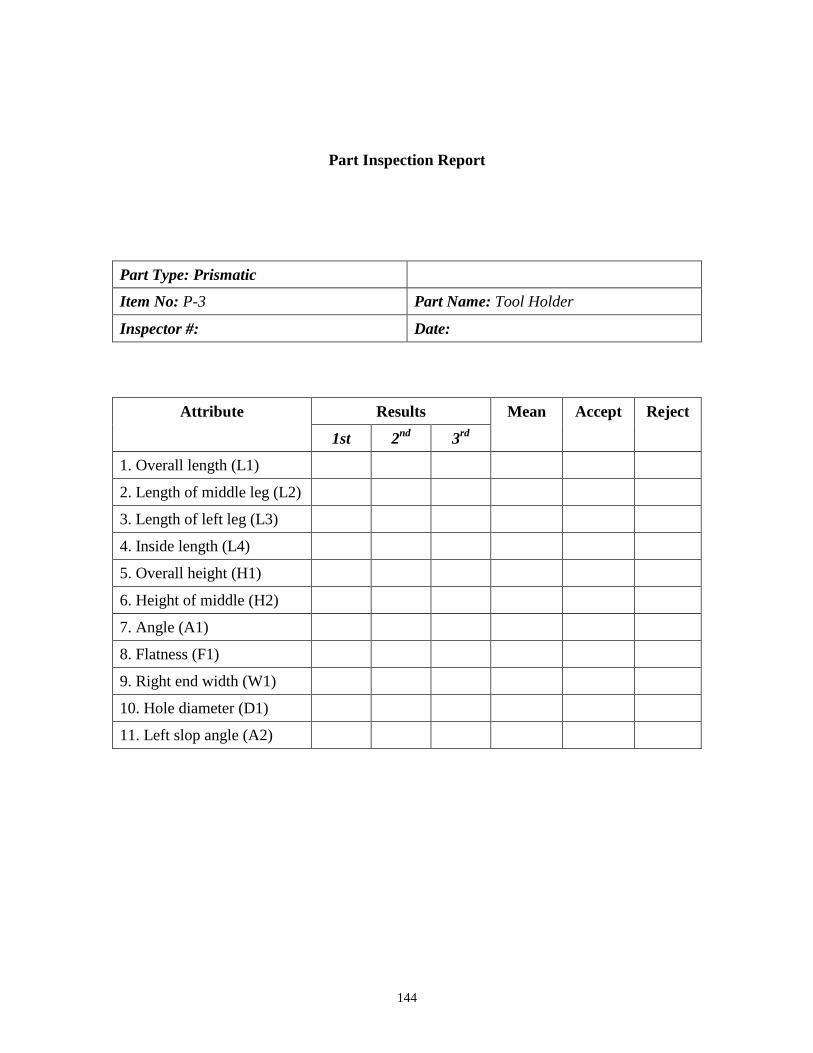
144
Part Inspection Report
Part Type: Prismatic Item No: P-3 Part Name: Tool Holder
Inspector #: Date:
Results Attribute
1st 2nd 3rd
Mean Accept Reject
1. Overall length (L1)
2. Length of middle leg (L2)
3. Length of left leg (L3)
4. Inside length (L4)
5. Overall height (H1)
6. Height of middle (H2)
7. Angle (A1)
8. Flatness (F1)
9. Right end width (W1)
10. Hole diameter (D1)
11. Left slop angle (A2)

145
Part Inspection Report
Part Type: Rotational Item No: R-1 Part Name: Step Pulley
Inspector #: Date:
Results Attribute
1st 2nd 3rd
Mean Accept Reject
1. Overall length (L1)
2. Length to 2nd step (L2)
3. Length of 1st step (L3)
4. Diameter of right (D1)
5. Diameter of middle (D2)
6. Diameter of left (D3)
7. Roundness of right (R1)
8. Roundness of middle (R2)
9. Roundness of left (R3)
10. Hole diameter (D4)

146
Part Inspection Report
Part Type: Rotational Item No: R-2 Part Name: Holder
Inspector #: Date:
Results Attribute
1st 2nd 3rd
Mean Accept Reject
1. Overall length (L1)
2. Length to shoulder (L2)
3. Shoulder length (L3)
4. Base diameter (D1)
5. Top diameter (D2)
6. Angle (A1)
7. Shoulder diameter (D3)
8. Right hole diameter (D4)
9. Left hole diameter (D5)
10. Shoulder height (H1)

147
Part Inspection Report
Part Type: Rotational Item No: R-3 Part Name: Roller Stud
Inspector #: Date:
Results Attribute
1st 2nd 3rd
Mean Accept Reject
1. Overall length (L1)
2. Length to upper cut (L2)
3. Length to lower cut (L3)
4. Length to 2nd step (L4)
5. Length to 1st step (L5)
6. Diameter of right (D1)
7. Diameter of left (D2)
8. Hole diameter (D3)
9. Width of middle (W1)
Concentricity
10. Roundness of right (R1)
11. Roundness of left (R1)
Difference 10 and 11


154
VITA
Kyung H. Chung
Education M.S. B.S.
1985 1983
Seoul National University, Seoul, Korea Major: Industrial Engineering/Human Factors Hanyang University, Seoul, Korea Major: Industrial Engineering
Academic and Professional Experience 1996 - Present 1994 - 1996 1992 - 1994 1986 - 1992
Enrolled as a graduate students at Virginia Polytechnic and State University, Blacksburg, Virginia Tech Project Manager Department of Techno-Economic Analysis Electronics and Telecommunication Research Institute (ETRI) Taejon, Korea Senior Researcher Department of Techno-Economic Analysis Electronics and Telecommunication Research Institute (ETRI) Taejon, Korea Researcher Department of Techno-Economic Analysis Electronics and Telecommunication Research Institute (ETRI) Taejon, Korea