Embed Size (px)
Citation preview

Application of adaptive non-linear 2D and 3D
postprocessing filters for reduced dose
abdominal CT
Lars Borgen, Mannudeep K Kalra, Frode Laerum, Isabelle W Hachette, Carina H Fredriksson,
Michael Sandborg and Örjan Smedby
Linköping University Post Print
N.B.: When citing this work, cite the original article.
This is the final draft, after peer-review, of a manuscript published in RSM journals:
www.rsmpress.com.
Lars Borgen, Mannudeep K Kalra, Frode Laerum, Isabelle W Hachette, Carina H Fredriksson,
Michael Sandborg and Örjan Smedby, Application of adaptive non-linear 2D and 3D
postprocessing filters for reduced dose abdominal CT, 2012, Acta Radiologica, (53), 3, 335-
342.
which has been published in final form at:
http://dx.doi.org/10.1258/ar.2011.110563
Copyright: Informa Healthcare / Wiley-Blackwell / Royal Society of Medicine Press
http://www.rsmjournals.com/
Postprint available at: Linköping University Electronic Press
http://urn.kb.se/resolve?urn=urn:nbn:se:liu:diva-77733

1
Application of adaptive nonlinear 2D and 3D post-processing filters for reduced dose abdominal CT
Abstract
Background: Abdominal computed tomography (CT) is a frequently performed imaging
procedure, resulting in considerable radiation doses to the patient population. Post-
processing filters are one of several dose reduction measures that might help to reduce
radiation doses without loss of image quality.
Purpose: To assess and compare the effect of two and three-dimensional (2D, 3D) non-linear
adaptive filters on reduced dose abdominal CT images.
Material and Methods: Two baseline abdominal CT image series with a volume computer
tomography dose index (CTDI vol) of 12 mGy and 6 mGy were acquired for 12 patients.
Reduced dose images were post-processed with 2D and 3D filters. Six radiologists performed
blinded randomized, side-by-side image quality assessments. Objective noise was
measured. Data were analyzed using visual grading regression and mixed linear models.
Results: All image quality criteria were rated as superior for 3D filtered images compared to
reduced dose baseline and 2D filtered images (p< 0.01). Standard dose images had better
image quality than reduced dose 3D filtered images (p<0.01), but similar image noise. For
patients with body mass index (BMI) < 30 kg/m2 however, 3D filtered images were rated
significantly better than normal dose images for two image criteria (p<0.05), while no
significant difference was found for the remaining three image criteria (p>0.05). There were
no significant variations of objective noise between standard dose and 2D or 3D filtered
images.

2
Conclusions: The quality of 3D filtered reduced dose abdominal CT images is superior
compared to reduced dose unfiltered and 2D filtered images. For patients with BMI < 30
kg/m2, 3D filtered images are comparable to standard dose images.
Keywords:
Abdomen/GI, CT, Pancreas, Adults, Computer Applications, Radiation Safety
3
Concerns over a potential increase in the risk of radiation-induced carcinogenesis due to the
increasing use of CT scanning have increased the interest of radiologists, medical imaging
physicists and CT vendors in radiation dose reduction (1-3).
When examining organs or structures with low contrast lesions, such as the liver or
pancreas, increased image noise in lower dose CT can adversely affect image quality and
diagnostic confidence. Recently, some CT vendors have made available iterative
reconstruction techniques to reduce noise in reduced dose CT images acquired on their
higher end or latest equipment. Another way of reducing patient doses is through the
application of image post-processing filters on lower dose CT, which reduces image noise to
enable CT scanning with a lower dose without losing clinical information. Image post-
processing filters can operate in an image plane (2D filters) or within a volume including the
z-direction (3D filters). Prior studies have evaluated the use of 2D (4-6) or 3D (7,8) filters,
but to the best of our knowledge, no direct comparisons of 2D and 3D filters for enabling
radiation dose reduction have been published at the time of preparation of this manuscript.
Therefore, the purpose of our study was to assess and compare the effects of 2D and 3D
non-linear adaptive filters on reduced dose abdominal CT images.
4
Material and Methods
Patients
Our Medical Research Ethics Committee approved this prospective human study. Written
informed consent was obtained from all 12 participating patients (10 female, two male,
mean age 73.3 years ± 8.6 years; age range 62.0-90.0 years) and BMI was calculated. The
study was performed between January 2010 and May 2010.
The inclusion was in principle consecutive, but some selection was made to include six
patients with a BMI ≤ 30 kg/m2 and six patients with a BMI >30 kg/m2, for later stratified
filter performance analysis according to BMI. Out of 15 eligible patients meeting the
inclusion criteria of the study, three patients declined to participate. The inclusion criteria
were outpatient status, age above 60 years due to the reduced radiation sensitivity to the
additional radiation burden of the study acquisitions compared to younger patients, ability
to give written informed consent, referral for a standard contrast-enhanced abdominal CT,
absence of known gross pathology in the pancreatic region, and absence of history of known
contrast reactions.
Clinical indications for abdominal CT examinations were abdominal pain or metastatic work-
up of a known malignancy.
Scanning Technique
All studies were performed according to an established research scanning protocol on a 16-
channel multi-detector-row CT scanner (Philips 16-slice Mx8000IDT; Philips Medical Systems,
Best, The Netherlands) scanner at Drammen Hospital, Norway.
The participating patients were positioned in the scanner gantry isocenter for their standard
of care abdominal portal venous phase CT scan. This was carried out with a scan delay of 60

5
seconds following administration of 100 ml of intravenous iodinated contrast medium
(Iomeron 350; Bracco Imaging, Milan, Italy) injected at a rate of 4 ml/second.
After the acquisition of standard of care CT images, a second (12 mGy / 180 mAs, standard
dose) and a third (6 mGy / 90 mAs, reduced dose) research image series were acquired in
the pancreatic region over an identical scan length of 10 cm. Scanning in the pancreatic
region ensured at least partial inclusion of the liver and pancreas to assess the effect of low
radiation dose CT and image post-processing filters on low contrast structures of the
abdomen. The scanning location for research series acquisitions was determined from the
localizer radiograph (L.B., eight years of experience). No additional contrast medium was
administered for acquisition of the two research image series
The order of acquisition of 12 mGy and 6 mGy research image series was randomized to
avoid bias from the differential phase of contrast enhancement or washout in the two
acquisitions. The two image series were acquired after the standard of care abdominal CT
(contrast delay of 60 seconds), at 81-86 seconds (earlier phase of contrast enhancement)
and at 94-97 seconds (later phase) following injection of the contrast.
Except for the different mAs values, all remaining scanning parameters were kept constant
at 120 kVp, helical acquisition mode at 0.938:1 pitch, 30 mm table feed per second, 0.75-
second gantry rotation time and 16 x 1.5 mm detector geometry. For both research image
series, 2 mm reconstructed section thickness images were obtained with a 1 mm inter-
section interval using a standard soft tissue reconstruction kernel (Standard C, Philips
Medical Systems).
Automatic exposure control (AEC) techniques were not used for acquisition of research
images as we wanted to assess 2D and 3D adaptive filters at fixed 50% tube current
reduction, as described in prior studies with noise reduction filters and adaptive statistical
6
iterative reconstruction (ASiR, GE Healthcare, Waukesha, WI, USA) (4,9,10). Dose reduction
or mA modulation with AEC is not linear at different specified reference levels, and depends
on the patient size (or regional attenuation). Consequently, the use of AEC techniques would
have provided a differential dose reduction (in smaller or average size patients) or an
increment (in large size patients), thus we chose to use the fixed tube current to obtain a
predictable dose reduction for our study.
Both research DICOM image series were de-identified and exported offline for post-
processing of the reduced dose images with 2D and 3D adaptive non-linear filters
(ContextVision Inc., Linköping, Sweden). After post-processing (see Appendix), all four image
series (baseline standard and reduced dose image series, reduced dose 2D and 3D filtered
image series,(Fig. 1) were imported into our picture archiving and communication system
(PACS) (Carestream Health, ver. 5.2.1; Rochester, NY, USA) for image evaluation. In our study
we chose a more aggressive 3D noise reduction for patients weighing more than 90 kg than
for patients smaller than 90 kg, to match the higher noise level in the larger patients. These
settings were selected based on preliminary image evaluation by the two co-authors (L.B.
and Ö.S.) who did not take part in the formal image quality assessment of the 2D and 3D
filters.
7
a b
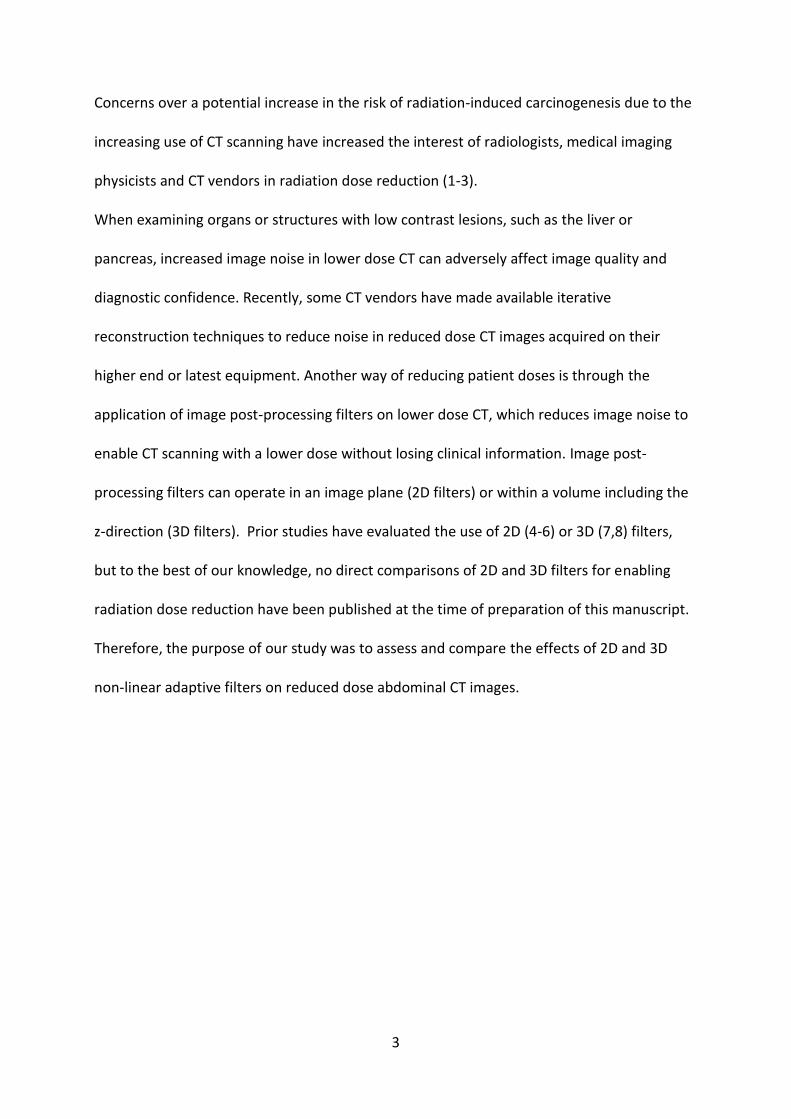
c d Fig. 1 (a) Axial images of the upper abdomen, 180 mAs and CTDIvol=12 mGy. (b) Axial images
of the upper abdomen, 90 mAs and CTDIvol=6 mGy. (c) Axial images of the upper abdomen,
2D filtered 90 mAs CTDIvol=6 mGy. (d) Axial images of the upper abdomen, 3D filtered 90
mAs CTDIvol=6 mGy
Subjective image quality
Six experienced radiologists (two abdominal and four general radiologists, average
experience of 12 years in reading abdominal CTs) performed a blinded randomized

8
assessment of the images on a DICOM-calibrated 3 megapixel PACS monitor. Image
evaluation was performed with no constraints on interpretation time, window width or level
settings or use of image zoom or pan functions. Before formal image evaluation, all
radiologists were trained on different aspects of image grading using five pairs of image
series.
Each radiologist independently performed a blinded side-by-side comparison of two image
series at a time for a total of six comparisons in random order for each of the 12 patients (n=
six comparisons 12 patients six radiologists = 432 total comparisons): reduced dose 3D
filtered vs. standard dose baseline, reduced dose 3D filtered vs. reduced dose 2D filtered,
reduced dose 3D filtered vs. reduced dose baseline, reduced dose 2D filtered vs. standard
dose baseline, reduced dose 2D filtered vs. reduced dose baseline, and standard dose
baseline vs. reduced dose baseline images.
All radiologists evaluated five criteria, including delineation of pancreatic contours in relation
to surrounding intra-abdominal fat, stomach, duodenum and neighboring veins; delineation
of intrahepatic portal and hepatic veins; delineation of the common bile duct; subjective
image noise; and overall diagnostic acceptability. Overall diagnostic acceptability was
defined as the quality of normal anatomy reproduction and suspected ability to visualize
pathology. Each criterion was rated on a five point scale (–2: left side images certainly better
than right side images, –1: left side images probably better than right side images, 0: image
stacks equivalent, +1: right side images probably better than left side images and +2: right
side images certainly better than left side images). To enhance blinded randomization for
image evaluation, the order of the image series displayed on the right and left sides was also
randomized.

9
Objective Image Quality
CT numbers (Hounsfield value (HU)) and objective noise in terms of standard deviation (SD)
of the HU were measured with two uniform circular regions of interest (ROIs) with a
diameter of 10-20 mm for the abdominal aortic lumen and 20-30 mm in a homogeneous
part of the right hepatic lobe (L.B.).
Height and weight of all patients were measured prior to the CT examinations. We recorded
the volume CTDI and Dose length Product (DLP) for both 90 and 180 mAs image series from
the dose information page. Estimated effective doses for the two image series were
determined using the International Commission for Radiation Protection (ICRP) 103 tissue
weighting factors (11) and CT-expo v2.0 (12).
Statistical Analysis
Subjective image quality was analyzed using visual grading regression (ordinal logistic
regression), which is suitable for the ordinal scoring system (13). Visual grading regression
allows for simultaneous evaluation of effects and interactions of different independent
variables, such as imaging equipment, types of post-processing techniques, variations in
patient size and contrast enhancement phases as well as differences between patients and
between observers. In our statistical model, subjective image quality scores for the reduced
dose 3D-filtered images were compared to each of the other image series. Objective image
quality parameters were assessed using a mixed linear model with type of image (exposure
and filtering) and contrast enhanced phase as two fixed effects, and patient identity as a
random effect. Pair-wise comparisons between types of images were made with the Tukey
HSD test. Computations were performed with JMP 9.0.0 (SAS, Cary, NC, USA).

10
Results The mean BMI of the 12 patients included in our study was 27.7 kg/m2 (standard deviation,
SD= 5.9; range = 17.8 - 36.6 kg/m2).
Objective Image quality
Objective image quality metrics, mean HU-number and their SD in the liver and abdominal
aorta are summarized in Table 1. The image noise expressed as SD of the HU-number in the
aorta and the liver was significantly lower in the 3D filtered images than in the unfiltered
reduced dose images, but no significant differences were seen between 2D and 3D filtered
images or between any filtered reduced dose images and normal dose images. When
analyzing normal dose and 50% reduced tube current images according to contrast phase,
there was no significant difference in image noise between the early and delayed phase.
When the analysis was restricted to the subpopulation defined by BMI above 30 kg/m2, the
same pattern was found, except that the image noise in the aorta was now significantly
higher in 2D filtered than in normal dose images. For patients with BMI below 30 kg/m2,
however, both the 3D filtered and the 2D filtered reduced dose images had significantly
lower noise than the normal dose images in the aorta, and the noise was significantly lower
in 3D filtered than in 2D filtered images, whereas no significant difference was found in the
liver between 2D filtered, 3D filtered or normal dose images.
As shown in Table 1, there were no significant changes in mean HU values in the aorta and
liver parenchyma when comparing unfiltered, 2D filtered and 3D filtered images, while the
mean HU in the liver parenchyma decreased significantly from the early to delayed contrast
phase.

11
Table 1 Results of objective measurements analyzed with mixed linear model. Mean HU and
mean noise (SD of the HU-number) ±1 SD. Dose levels and filtering methods are compared
to the 3D-filtered reduced dose images; early contrast phase is compared to late contrast
phase
*) p<0.05; °) not significant
Radiation doses
The CTDIvol and DLP for the standard and reduced dose image series were 12 mGy,
169 mGy.cm and 6 mGy, 85 mGy.cm, respectively. Corresponding estimated effective doses
for these extra image series (average for male and female, standard sized human phantoms)
were 3.2 mSv and 1.7 mSv.
Subjective image quality
Subjective image quality data from the pair wise evaluation of all six readers are summarized
in Fig. 2a-e. Overall analysis showed significant differences between image noise, overall
diagnostic acceptability and delineation of the pancreas, hepatic veins and common bile duct
in baseline standard and reduced dose images (p<0.001). All these parameters were also
rated as significantly superior in 2D and 3D filtered reduced dose images as compared to the
baseline reduced dose images (p<0.001). Compared to the 3D filtered (Table 2) reduced dose
Image parameter Normal dose
Reduced dose unfiltered
Reduced dose
2D-filtered
Reduced dose
3D-filtered
Early contrast
phase
Late contrast
phase
Mean HU number in aorta
117.1±16.1* 119.8±15.4° 119.9±15.1° 121.0±15.3 120.6±17.7° 118.2±12.2
SD of HU number in aorta
35.0±12.9° 50.2±20.4* 39.4±20.7° 35.8±17.9 40.3±21.3° 39.9±16.1
Mean HU number in liver
96.5±17.7° 96.9±17.5° 96.8±16.9° 97.0±17.2 97.7±19.3* 95.9±14.1
SD of HU number in liver
25.6±9.8° 39.1±18.5* 28.5±17.2° 26.1±15.6 29.4±18.2° 30.2±14.1

12
CT images, 2D filtered reduced dose images had higher subjective noise and lower diagnostic
acceptability (p<0.001) in addition to inferior delineation of the pancreas, hepatic veins and
common bile duct (p<0.001, p<0.001 and p<0.01, respectively). Subjective image noise did
not differ significantly between baseline standard dose and 3D filtered reduced dose images
(p>0.05), but there were differences in the delineation of the pancreas, hepatic veins and
common bile duct, which were all significantly better in the standard dose images (p<0.001,
p<0.001 and p<0.01, respectively).
BMI-stratified analysis (Tables 3 and 4) revealed no significant difference between
delineation of the hepatic veins, pancreas and diagnostic acceptability in 3D filtered reduced
dose images and standard dose baseline images (p>0.05) in patients with BMI below 30
kg/m2. In these subjects, subjective image noise and delineation of the common bile duct in
3D filtered reduced dose images were deemed to be superior to the standard dose baseline
images (p<0.05 and p<0.001, respectively). In patients with BMI above 30 kg/m2, on the
other hand, 3D filtered reduced dose images were deemed inferior to baseline standard
dose images for all image quality parameters. Both the reduced dose unfiltered and 2D
filtered reduced dose images were deemed inferior to the standard dose baseline images,
regardless of patient size.
No significant differences were noted between the early and delayed phase CT image series
for any of the subjective image quality metrics (p> 0.05), except for delineation of the
hepatic veins, which was rated as significantly better in early phase images as compared to
the delayed phase images (p<0.01) (Fig 2b).
13
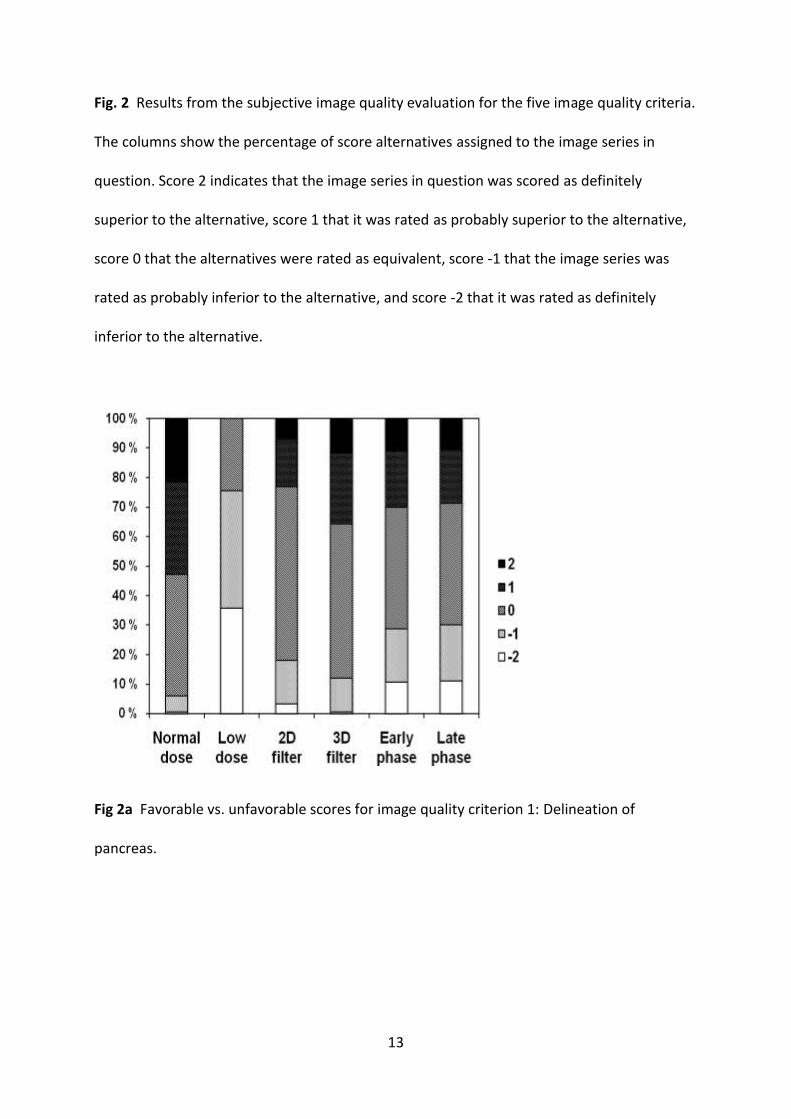
Fig. 2 Results from the subjective image quality evaluation for the five image quality criteria.
The columns show the percentage of score alternatives assigned to the image series in
question. Score 2 indicates that the image series in question was scored as definitely
superior to the alternative, score 1 that it was rated as probably superior to the alternative,
score 0 that the alternatives were rated as equivalent, score -1 that the image series was
rated as probably inferior to the alternative, and score -2 that it was rated as definitely
inferior to the alternative.
Fig 2a Favorable vs. unfavorable scores for image quality criterion 1: Delineation of
pancreas.

14
Fig 2b Favorable vs. unfavorable scores for image quality criterion 2: Delineation of veins in
liver.
Fig 2c Favorable vs. unfavorable scores for image quality criterion 3: Delineation of the
common bile duct.
15
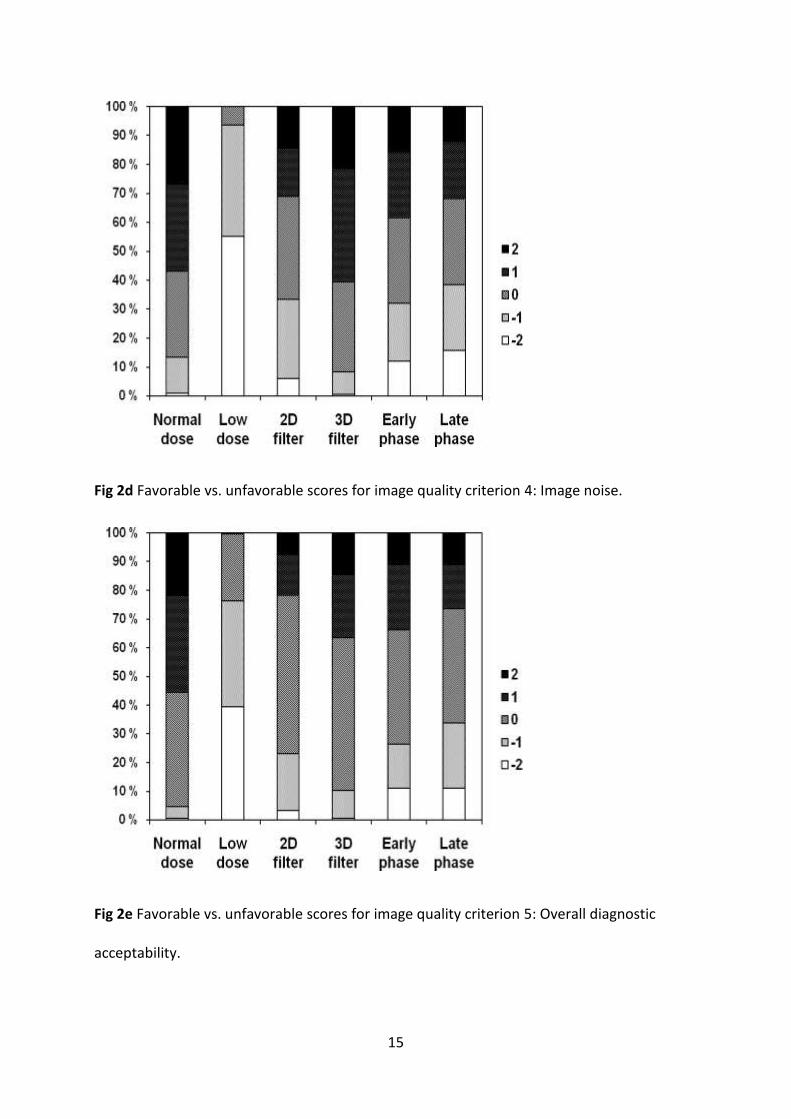
Fig 2d Favorable vs. unfavorable scores for image quality criterion 4: Image noise.
Fig 2e Favorable vs. unfavorable scores for image quality criterion 5: Overall diagnostic
acceptability.

16
Table 2 Results of subjective image quality evaluation of all patients, analyzed by Visual
Grading Regression. Positive values denote the increased probability of higher scoring values
compared to the 3D-filtered reduced dose images (for the first three columns) or compared
to the late contrast phase (for the last column)
*) p<0.05; **) p<0.01; ***) p<0.001; °) not significant
Image quality criterion Normal dose
Reduced dose unfiltered
Reduced dose 2D-filtered
Early contrast phase
1: Delineation of pancreas 0.785*** –3.284*** –0.487** –0.011°
2: Delineation of veins in liver 0.725*** –3.325*** –0.980*** 0.583***
3: Delineation of the common bile duct 0.595** –2.714*** –0.532** –0.051°
4: Image noise –0.136° –4.905*** –1.244*** 0.204°
5: Overall diagnostic acceptability 0.784*** –3.607*** –0.860*** 0.193°
17
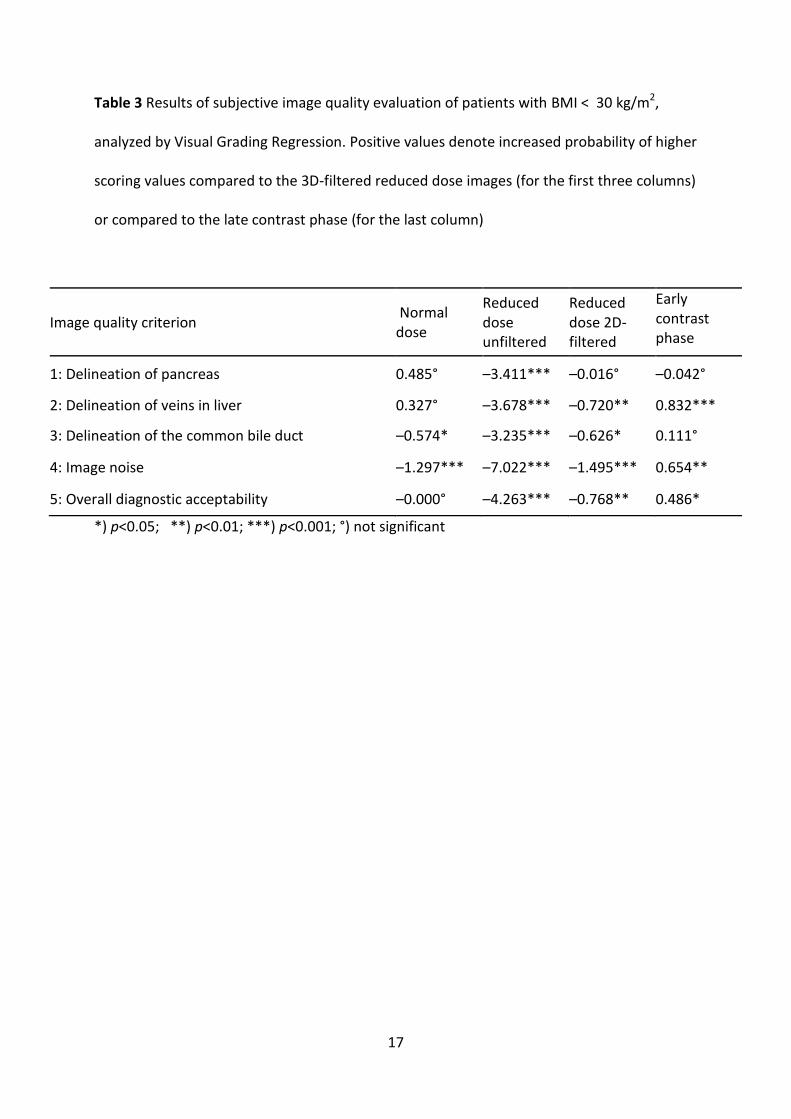
Table 3 Results of subjective image quality evaluation of patients with BMI < 30 kg/m2,
analyzed by Visual Grading Regression. Positive values denote increased probability of higher
scoring values compared to the 3D-filtered reduced dose images (for the first three columns)
or compared to the late contrast phase (for the last column)
Image quality criterion Normal dose
Reduced dose unfiltered
Reduced dose 2D-filtered
Early contrast phase
1: Delineation of pancreas 0.485° –3.411*** –0.016° –0.042°
2: Delineation of veins in liver 0.327° –3.678*** –0.720** 0.832***
3: Delineation of the common bile duct –0.574* –3.235*** –0.626* 0.111°
4: Image noise –1.297*** –7.022*** –1.495*** 0.654**
5: Overall diagnostic acceptability –0.000° –4.263*** –0.768** 0.486*
*) p<0.05; **) p<0.01; ***) p<0.001; °) not significant
18
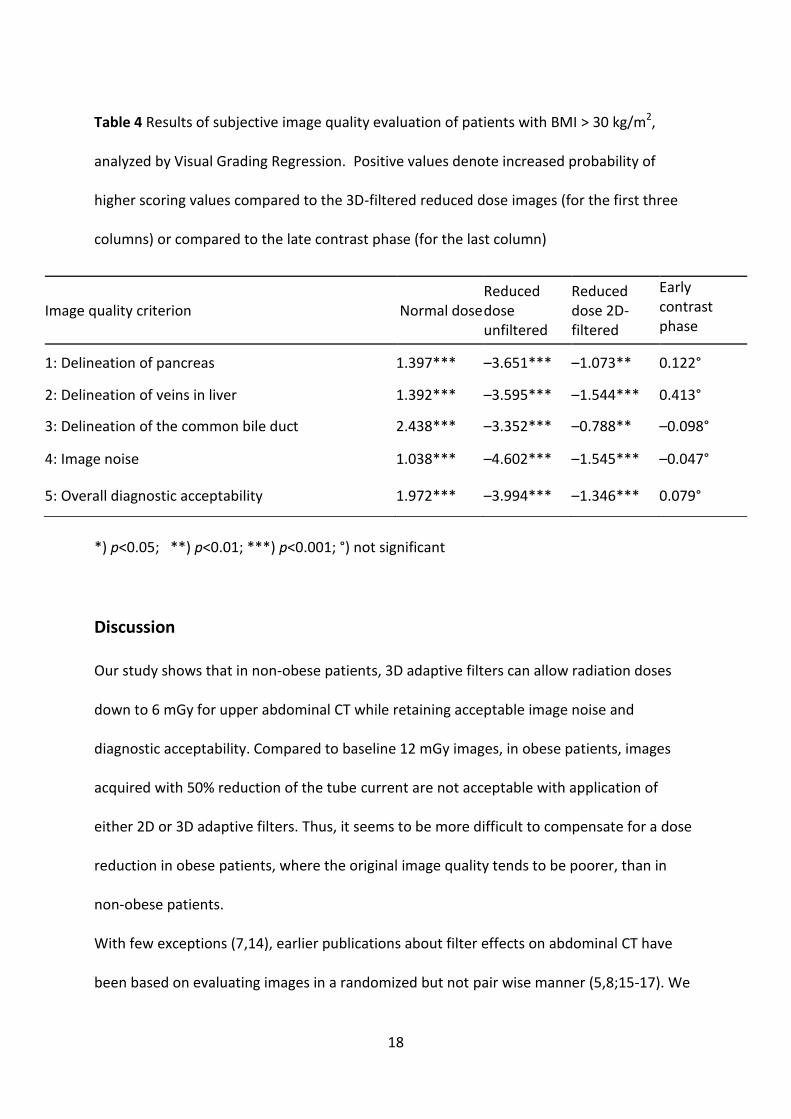
Table 4 Results of subjective image quality evaluation of patients with BMI > 30 kg/m2,
analyzed by Visual Grading Regression. Positive values denote increased probability of
higher scoring values compared to the 3D-filtered reduced dose images (for the first three
columns) or compared to the late contrast phase (for the last column)
*) p<0.05; **) p<0.01; ***) p<0.001; °) not significant
Discussion
Our study shows that in non-obese patients, 3D adaptive filters can allow radiation doses
down to 6 mGy for upper abdominal CT while retaining acceptable image noise and
diagnostic acceptability. Compared to baseline 12 mGy images, in obese patients, images
acquired with 50% reduction of the tube current are not acceptable with application of
either 2D or 3D adaptive filters. Thus, it seems to be more difficult to compensate for a dose
reduction in obese patients, where the original image quality tends to be poorer, than in
non-obese patients.
With few exceptions (7,14), earlier publications about filter effects on abdominal CT have
been based on evaluating images in a randomized but not pair wise manner (5,8;15-17). We
Image quality criterion Normal dose Reduced dose unfiltered
Reduced dose 2D-filtered
Early contrast phase
1: Delineation of pancreas 1.397*** –3.651*** –1.073** 0.122°
2: Delineation of veins in liver 1.392*** –3.595*** –1.544*** 0.413°
3: Delineation of the common bile duct 2.438*** –3.352*** –0.788** –0.098°
4: Image noise 1.038*** –4.602*** –1.545*** –0.047°
5: Overall diagnostic acceptability 1.972*** –3.994*** –1.346*** 0.079°

19
believe that a relative and simultaneous comparison of two image series, rather than an
absolute evaluation of one image series at a time, is a more sensitive method to detect
subtle image quality differences.
When imaging the pancreas region, thin slices are preferable. In our study, image evaluation
was based on a slice thickness of 2 mm with a 1mm interval. Except for a few publications
(8,18), most other works on abdominal CT and filter effects have been based on thicker
slices (5,7;14-17).
Keeping HU values unchanged through the filtering process is an important issue, since
absolute HU values are measured to evaluate, for instance, fluid collection and contrast
enhancement. There were no significant changes in mean HU values in the aorta and liver
parenchyma after 2D and 3D filtering. The significant decrease in mean HU of the liver
parenchyma from the early to late contrast phase was due to contrast washout.
Image noise is inversely related to the square root of the current time product. Even though
the study patients varied in BMI, this effect was demonstrated in the mean SD of the HU
values of the aorta, where the SD was 50.2 HU for 90 mAs unfiltered images and 35.8 HU
for the images acquired with a double dose of 180mAs (50.2 x 1/ =35.5).
In general, our results are consistent with previously published phantom and patient studies,
with non-linear 2D or 3D filters, on noise and radiation dose reduction for abdominal CT
(5,7,8,14,16,19,20). For example, Rizzo et al. (7) documented successful use of 3D filters to
improve image noise while retaining lesion conspicuity and image contrast in abdominal CT
examinations, albeit at much higher mAs of 120 or 160 mAs than used in our study. Wessling
et al. (8) also reported the potential for a 50% dose reduction for liver lesion evaluation with
application of their projection space 3D noise reduction filter on abdominal CT.

20
Normal dose images were deemed significantly superior to 2D filtered images according to
subjective image quality. Our findings are consistent with the work of Kalra et al., who
documented a loss of image contrast and lesion conspicuity with application of DICOM
image-based 2D noise reduction filters to 50% reduced dose abdominal CT (14).
Some recent CT radiation dose reduction studies using hybrid iterative reconstruction
techniques have demonstrated up to 50-75% dose reduction for abdominal examinations
(9). While these iterative reconstruction techniques promise higher dose reduction
compared to noise reduction filters such as the one used in our study, it is important to note
that most iterative reconstruction techniques are quite expensive and are only available with
the most advanced multi-detector-row CTs. In contrast, noise reduction filters involve lower
costs and can be applied to less sophisticated CT scanners with 16 detectors or less, which is
the type of CT equipment most commonly used at most facilities. Therefore, we believe that
until such time that iterative reconstruction techniques can be applied to older, low-end CT
scanners, noise reduction filters can be used to reduce image noise in reduced dose CT
images in selected patients.
Our study has some limitations. The study is based on a sample size of only 12 patients. This
small number was mainly due to the ethical considerations of exposing patients to additional
radiation doses, and is to some extent compensated by using six observers, compared to one
to three readers in most earlier studies (4,5,7,14,16,18,21,22). As described above, the
chosen sample size was clearly adequate for obtaining significant results for most of the
criteria evaluated in our study. Also, when evaluating image quality based on normal
anatomy, the inter-patient variation mostly lies in the patient size, which should be covered
in our study (BMI ranging from 17.8 – 36.6 kg/m2). However, a larger sample size in terms of
more patients would be important for further studies on lesion evaluation.
21
Objective image noise was evaluated in terms of the SD of the CT-number within a ROI.
However, noise properties (such as noise frequency and amplitude) and how they influence
the image quality can vary between two differently post-processed image series that have
an identical SD of the CT-number within a given ROI. The finding of a significant difference in
perceived noise between 3D and 2D filtered images in the qualitative image assessment, but
not in the quantitative assessment, could be due to such issues and to image texture
differences. Otherwise, qualitative and quantitative noise scoring correlated in our study,
indicating that the SD alone can be a valid indicator of noise and thus filter performance.
Another limitation of our study is lack of lesion detection or evaluation. Given the small
sample size of our study and the limited 10 cm scan length, we did not expect to find a
sufficient number of lesions for evaluation of pathology. The visualization of normal
anatomic structures at CT is an established image quality indicator, for instance in the
European Union image quality criteria (23), and we believe that our study yields valid
preliminary information about the potential clinical value of the post processing filters. In
conclusion, the quality of 3D filtered reduced dose abdominal CT images is superior,
compared to reduced dose unfiltered and 2D filtered images.
For patients with BMI ≤ 30 kg/m2, 3D filtered 50% reduced dose images are comparable to
standard dose images.

22
Declaration of interest:
L.B. received research funding from the Norwegian Radiological Society. I.W.H. and C.F. are
employees of ContextVision Inc., Linkoping, Sweden. M.K. has received research grants from
the Radiological Society of North America and GE Healthcare. The remaining authors, Ö.S.,
M.S. and F.L. have no pertinent disclosures and had complete access to the study data and
the manuscript.

23
References
1. Fazel R, Krumholz HM, Wang Y, et al. Exposure to low-dose ionizing radiation from
medical imaging procedures. N Engl J Med 2009;61:849-57
2. Lauer MS. Elements of danger--the case of medical imaging. N Engl J Med 2009;361:841-3
3. Mahesh M, Hevezi JM. Slice wars vs. dose wars in multiple-row detector CT. J Am Coll Radiol 2009;6:201-2
4. Kalra MK, Maher MM, Sahani DV, et al. Low-dose CT of the abdomen: evaluation of image improvement with use of noise reduction filters pilot study. Radiology 2003;228:251-6.
5. Leander P, Soderberg M, Falt T, et al. Post-processing image filtration enabling dose reduction in standard abdominal CT. Radiat Prot Dosimetry 2010;139:180-5.
6. Ledenius K, Stalhammar F, Wiklund LM, et al. Evaluation of image-enhanced paediatric computed tomography brain examinations. Radiat Prot Dosimetry 2010;139:287-92.
7. Rizzo SM, Kalra MK, Schmidt B, et al. CT images of abdomen and pelvis: effect of nonlinear three-dimensional optimized reconstruction algorithm on image quality and lesion characteristics. Radiology 2005;237:309-15.
8. Wessling J, Esseling R, Raupach R, et al. The effect of dose reduction and feasibility of edge-preserving noise reduction on the detection of liver lesions using MSCT. Eur Radiol 2007;17:1885-91.
9. Singh S, Kalra MK, Hsieh J, et al. Abdominal CT: comparison of adaptive statistical iterative and filtered back projection reconstruction techniques. Radiology 2010;257:373-83.
10. Kalra MK, Wittram C, Maher MM, et al. Can noise reduction filters improve low-radiation-dose chest CT images? Pilot study. Radiology 2003;228:257-64.
11. The 2007 Recommendations of the International Commission on Radiological Protection. ICRP publication 103. Ann ICRP 2007;37:1-332.
12. Stamm G, Nagel HD. [CT-expo--a novel program for dose evaluation in CT]. Rofo 2002;174:1570-6.
13. Smedby O, Fredrikson M. Visual grading regression: analysing data from visual grading experiments with regression models. Br J Radiol 2010;83:67-75

24
14. Kalra MK, Maher MM, Blake MA, et al. Detection and characterization of lesions on low-radiation-dose abdominal CT images postprocessed with noise reduction filters. Radiology 2004;232:791-7.
15. Funama Y, Awai K, Miyazaki O, et al. Improvement of low-contrast detectability in low-dose hepatic multidetector computed tomography using a novel adaptive filter: evaluation with a computer-simulated liver including tumors. Invest Radiol 2006;41:1-7.
16. Funama Y, Awai K, Miyazaki O, et al. Radiation dose reduction in hepatic multidetector computed tomography with a novel adaptive noise reduction filter. Radiat Med 2008;26:171-7.
17. Kropil P, Lanzman RS, Walther C, et al. [Dose reduction and image quality in MDCT of the upper abdomen: potential of an adaptive post-processing filter]. Rofo 2010;182:248-53.
18. Baum U, Noemayr A, Reissig A, et al. [Improvement of the image quality of MSCT of the pelvis with a raw data-based, multidimensional filter]. Rofo 2003;175:1572-6.
19. Bai M, Chen J, Raupach R, et al. Effect of nonlinear three-dimensional optimized reconstruction algorithm filter on image quality and radiation dose: validation on phantoms. Med Phys 2009;36:95-7.
20. Martinsen AC, Saether HK, Olsen DR, et al. Reduction in dose from CT examinations of liver lesions with a new postprocessing filter: a ROC phantom study. Acta Radiol 2008;49:303-9.
21. Mendrik AM, Vonken EJ, Rutten A, et al. Noise reduction in computed tomography scans using 3-d anisotropic hybrid diffusion with continuous switch. IEEE Trans Med Imaging 2009;28:1585-94.
22. Kubo T, Nishino M, Kino A, Yoshimura N, et al. 3-dimensional adaptive raw-data filter: evaluation in low dose chest multidetector-row computed tomography. J Comput Assist Tomogr 2006;30:933-8.
23. Bongartz G, Golding SJ, Jurik AG, et al. European Guidelines for Multislice Computed Tomography. European Community. http://www.msct.eu/CT Quality Criteria.htm. Published March 2004, Accessed August 15, 2011
24. Svensson B. A. Multidimensional Filtering Framework with Applications to Local
Structure Analysis and Image Enhancement (doctoral dissertation). Linköping: Linköping University, 2008
25. Granlund GH. In Search of a General Picture Processing Operator. Computer Graphics and Image Processing 1978;8:155-73.

25
Appendix
The 3D non-linear adaptive enhancement filter (Contextvision AB, Linköping, Sweden) used
in our study is based on the GOP®
technology of Contextvision, which uses a hierarchical
approach to identify image features at different abstraction levels (25). Each pixel is analyzed
in relation to its surroundings by local features that are estimated by using a set of filters
(Fig. 3). The technique estimates a number of simple, complex and hyper-complex context
features. The compiled set of these features forms the contextual information for every
location in the image. This information is used to generate a specific filter which adapts to
the image signal in every location and individually optimizes each enhanced voxel (volume
element). In the CT volumes, the enhancement filter adapts and reduces the amount of
noise, giving an increase in the SNR. It preserves the mean HU numbers for each region.
With the 3D filter, structures oriented in all directions in space are enhanced according to
their natural orientation in the 3D space (x, y and z-axes), compared to the 2D filtering which
only works with structures in the 2D plane (in the x and y axes but not in the z-direction).
The 3D filter uses the same filter design as the established 2D enhancement. At the time of
writing of this manuscript, the 2D filter is a commercially available product (GOPView®
CT,
ContextVision, Inc) but the 3D filter technology still remains a work in progress.
26
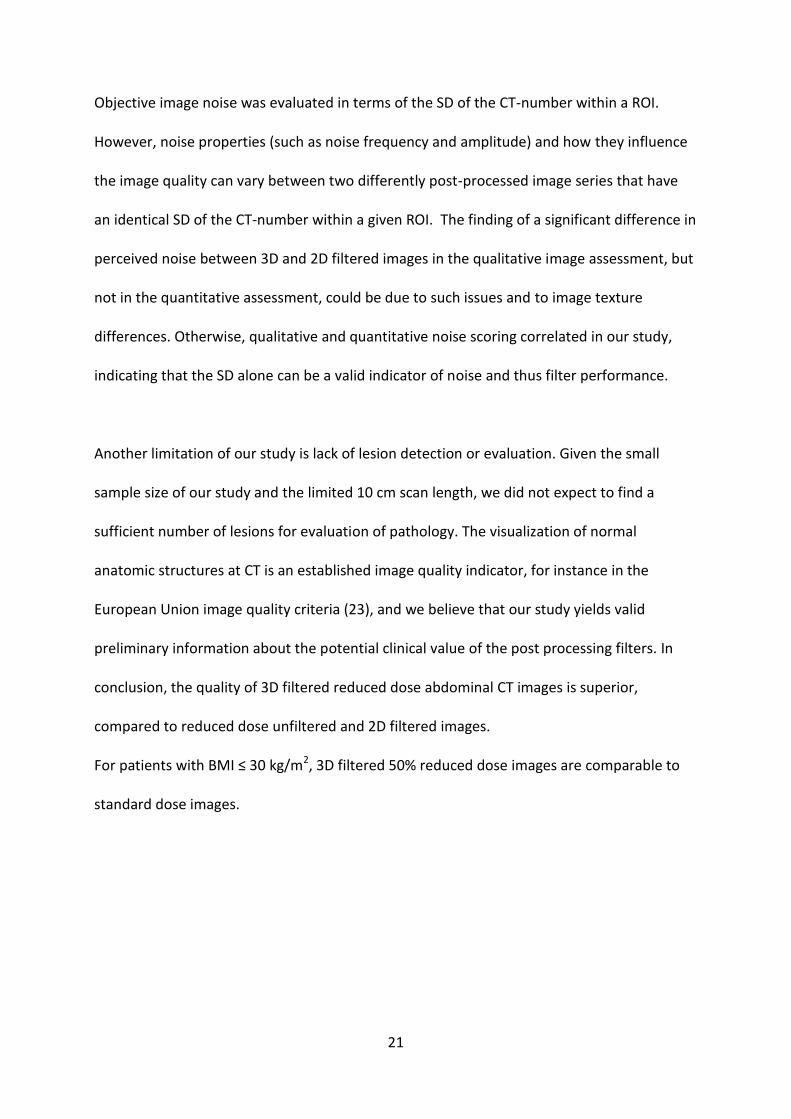
Fig. 3: Principle of adaptive filtering. Each pixel neighborhood is described by computing
features such as local orientation, local variance or local phase. Several versions of smoothed
or sharpened images are constructed. These versions are combined in each pixel, according
to the local features and parameter settings that can be chosen by a competent user in a
tuning phase (24).


![[ShaderX5] 8 1 Postprocessing Effects In Design](https://img.dokumen.tips/doc/110x75/559611961a28abad448b458a/shaderx5-8-1-postprocessing-effects-in-design.jpg)

