Embed Size (px)
Citation preview

Princeton Applied Research, 801 S. Illinois Avenue, Oak Ridge, TN 37830.
Tel: (865) 425-1289 Fax: (865) 481-2410 Web: www.princetonappliedresearch.com
Application Note E-4
Subject: A Review of Techniques for Electrochemical Analysis
INTRODUCTION Electrochemistry is the study of the chemical response of a system to an electrical stimulation. The scientist using electrochemistry studies the loss of electrons (oxidation) or gain of electrons (reduction) that a material undergoes during the electrical stimulation. These reduction and oxidation reactions are commonly known as redox reactions and can provide information about the concentration, kinetics, reaction mechanisms, chemical status and other behavior of a species in solution. Similar information can be obtained concerning the electrode surface. Electrochemical techniques can be used to investigate many things – from neurotransmitter behavior in biological situations to brightener concentrations in plating baths to initiator behavior in polymerizations to the speciation of cadmium ions in natural waters. To the researcher studying chemical systems, electrochemistry offers a different perspective than spectroscopy or other techniques. This is because electrochemical techniques examine different phenomena than those studied with techniques such as spectroscopy. This difference should encourage the researcher to learn and use electrochemistry, since it can often solve research problems that the other approaches cannot. In an electrochemical experiment, you can measure one or more of four parameters – potential (E), current (i), charge (Q) and time (t) (see the side bar). The response of a system depends on which parameter is used as the excitation signal. By plotting different parameters in different ways, the researcher can derive a wealth of information. In most electrochemical techniques, there are three electrodes – the working electrode, the reference electrode and the counter (or auxiliary) electrode. The three electrodes are connected to a potentiostat, an instrument which controls the potential of the working
electrode and measures the resulting current. In one typical electrochemical experiment, a potential is applied to the working electrode and the resulting current measured then plotted versus time. In another, the potential is varied and the resulting current is plotted versus the applied potential. The different combinations of parameters and working electrode types make for a long list of techniques, including voltammetry, polarography, cyclic voltammetry, linear sweep techniques, chronoamperometry, chronopotentiometry, pulsed techniques and others. (For more information on pulsed techniques please see PAR Application Note P-2.) Many researchers are uncomfortable with electrochemical techniques because of this seemingly endless list. In fact, since only four parameters are measured, electrochemical techniques are relatively simple and most can be done with one instrument. The remainder of this application note will introduce and define the more commonly used techniques.
EXPERIMENTAL PARAMETERS Potential (E) is the amount of electrical force or energy in a system. As the potential increases, more force is available to make a reaction happen. The base unit for potential is the volt (V). Current (I) is the magnitude of the electron flow in a system. Its base unit is amperes (A) (often shortened to amps), but most electrochemical experiments measure currents on the microamp (10-6 A) or nanoamp (10-9 A) scale. Cathodic i is due to a reduction. Anodic i is due to an oxidation. Charge (Q) is a measure of the number of electrons used per equivalent. Its base unit is the coulomb (C). You can measure charge directly or calculate it by multiplying the current and the time.

Princeton Applied Research, 801 S. Illinois Avenue, Oak Ridge, TN 37830.
Tel: (865) 425-1289 Fax: (865) 481-2410 Web: www.princetonappliedresearch.com
LINEAR SWEEP VOMTAMMETRY (LSV) In linear sweep voltammetry (LSV), the electrode potential is varied at a constant rate throughout the scan and the resulting current is measured. Figure 1 illustrates an LSV measurement made at a mercury drop electrode in unstirred, deaerated 0.1M HCl. In most electrochemical experiments, the studied species must be in a conductive supporting electrolyte, the supporting electrolyte must be purged of oxygen and the supporting electrolyte must not be stirred. Notice that the applied potential is plotted on the x-axis and the resulting current on the y-axis. All potentials are specified in relation to the reference electrode. FIGURE 1: Linear sweep voltammogram of 0.1M HCl. Scan rate: 100 mV/s, Working electrode: HMDE. For potentials from 0 to -1 V, the current is small and constant. This small current is due to the electron flow necessary to maintain a charged double layer at the electrode surface. This current is often called the charging current. As you vary the potential beyond -1 V, an electrochemical reaction occurs at the surface of the electrode – that is, electrons transfer from the electrode
surface to the hydrogen ions in solution, causing a reduction of H+ to H2 and a rapid increase in current. Notice that with Cd2+ added to the HCl solution (Figure 2), the current does not remain constant form 0 to -1 V. As the potential goes more negative, the reductive power of the system increases. Thus, at potentials where Cd2+ is reduced, the current increases. As the scan continues in a negative direction, cadmium continues to reduce and the current continues to increase. FIGURE 2: Linear sweep voltammogram of cadmium in 0.1M HCl. Conditions are the same as figure 1. The current measured is a function of the concentration of the Cd2+ at the surface of the electrode. The current peaks and starts to decrease when the concentration of Cd2+ ions in the diffusion layer (the area close to the electrode) starts to decrease. Beginning at that point, the cadmium must diffuse to the electrode from increasingly greater distances. The measured current then becomes a function of the diffusion of the cadmium ions to the electrode – not simply the reduction of the cadmium ions already in the diffusion layer. The system becomes limited by the mass transport of the ion to the electrode surface or is said to be diffusion controlled. So the current peak (or maximum) occurs because the initial concentration of Cd2+ ions at the surface of the electrode is higher than the steady state concentration.
Time (t) is a measure of duration. Its base unit is the second (s). Electrochemical experiments may require times as short as microseconds or as long as days.
0
1
2
3
4
-1.3-1.2-1.1-1.0-0.9-0.8-0.7-0.6-0.5-0.4-0.3-0.2-0.10.0
Cur
rent
(uA
)
Potential (V)
I vs E
0
1
2
3
4
-1.1-1.0-0.9-0.8-0.7-0.6-0.5-0.4-0.3-0.2-0.10.0
Cur
rent
(uA
)
Potential (V)
I vs E

Princeton Applied Research, 801 S. Illinois Avenue, Oak Ridge, TN 37830.
Tel: (865) 425-1289 Fax: (865) 481-2410 Web: www.princetonappliedresearch.com
Figure 3 illustrates how the addition of a second electroactive species to the solution (in this case cadmium and lead) produces multiple peaks. Each peak occurs at a potential characteristic of the reacting species, the type of supporting electrolyte and the working electrode type. Note that the lead ion continues to reduce at the potential where the cadmium ion starts to reduce. The resulting peak is additive and represents the reduction of both cadmium and lead. You can use LSV for quantitative electrochemical analysis.
FIGURE 3: Linear sweep voltammogram of cadmium and lead in 0.1M HCl. Conditions are the same as figure 1. CYCLIC VOLTAMMETRY (CV) Overview Cyclic voltammetry (CV), one of the more commonly used electroanalytical techniques, is an excellent methods development tool, but is not usually a good technique for quantitative analysis. Its main advantage in electroanalysis is its ability to characterize an electrochemical system. A single CV experiment only hints at the events that constitute the electrochemical reaction at the electrode. However, multiple CV experiments can be used for a variety of applications, including: • the determination of Nernstian (reversible) or non-
Nernstian (irreversible) behavior of a redox couple • the number of electrons transferred in an oxidation or
reduction • formal potentials • rate constants • formation constants • reaction mechanisms • diffusion coefficients
ELECTRODES It is important to note that the working electrode is a critical variable in an electrochemical experiment. The working electrode is where the reactions of interest take place and is usually constructed of an inert material. The potential of the working electrode is measured versus the reference electrode. A typical reference electrode is the familiar saturated calomel electrode commonly used in pH measurement. By design, the reference electrode is always at a known potential. Since potential is a measurement of the voltage difference between two points, the fixed value of the reference electrode provides a way to measure the working electrode potential. In an electrochemical measurement system, current flows in the solution between the working and the counter electrodes. The counter electrode is typically a wire constructed of platinum or other inert material.
0
1
2
3
4
-1.1-1.0-0.9-0.8-0.7-0.6-0.5-0.4-0.3-0.2-0.10.0
Cur
rent
(uA
)
Potential (V)
I vs E

Princeton Applied Research, 801 S. Illinois Avenue, Oak Ridge, TN 37830.
Tel: (865) 425-1289 Fax: (865) 481-2410 Web: www.princetonappliedresearch.com
Definition In a CV experiment, the potentiostat applies a potential ramp to the working electrode to gradually change potential and then reverses the scan, returning to the initial potential (see the triangular waveform in Figure 4). FIGURE 4: Typical excitation waveform for analog cyclic voltammetry. During the potential sweep, the potentiostat measures the current resulting from the applied potential. These values are then used to plot the CV graph of current versus the applied potential. You can run single-cycle or multi-cycle CV experiments. The repetition of the potential waveform allows the system to come to a steady-state or allows the buildup of reaction products at the electrode surface. Data Interpretation Figure 5, a typical CV plot, shows the four important pieces of information obtained from a CV experiment – the cathodic peak height (Ipc), the anodic peak height (Ipa), the cathodic peak potential (Epc) and the anodic peak potential (Epa). Note that Figure 5 uses the American convention for plotting electrochemical data – that is, negative potential to the right and cathodic (reductive) current positive (upward).
FIGURE 5: Theoretical cyclic voltammogram for a reversible case. Single CVs A single CV is useful for determining whether or not a species is electroactive. A peak current response within a given potential range indicates whether a material has been involved in a reaction. However, from a single CV plot, you can draw only limited conclusions about the reversibility of a redox couple. One criterion for reversibility is that the Ipc should equal the Ipa, so it may seem that if a single CV shows Ipc equal to the Ipa, the system is reversible. However, if the scan rate is increased the Ipc may no longer equal the Ipa and the system would appear irreversible. The same can be true of other variables in the experiment. A change of concentration or electrolyte could also affect the results of the experiment. Thus a single CV is only useful to define reversibility for a very specific set of experimental conditions. A single CV is also useful in determining the number of electrons transferred in a reaction. If you assume the reaction is reversible (i.e., follows the Nernst equation) you can calculate the number of electrons transferred during the oxidation/reduction. The current maximum for each peak should be 28.5 mV from the formal potential; the potential difference between Epa and Epc should be 57 mV.1 These values are good for a one electron transfer. In general the peak separation is expressed by the equation:
TIME
POTENTIAL ∆E
ipa
Epa
ipc
Epc
Red
i = 0
Ox

Princeton Applied Research, 801 S. Illinois Avenue, Oak Ridge, TN 37830.
Tel: (865) 425-1289 Fax: (865) 481-2410 Web: www.princetonappliedresearch.com
n is the number of electrons transferred. Multiple CVs Many researchers often find it useful to run multiple CV experiments. This allows the researcher to see chemical changes with time or allows a system to reach equilibrium before measurements are made. In fact, the diagnostic information explained above for a single CV is more appropriately used after two or three cycles of the CV are run. Multiple CV experiments also allow the researcher to observe reaction products formed at the surface of an electrode that may not be stable. CV Studies Although the previous examples show that a single CV experiment can yield useful information, you should run a series of CV experiments to fully investigate an electrochemical problem. In a typical CV study, you run a series of experiments in which you selectively vary the potential scan rate, the experiment temperature, the species concentration or the ionic strength of the supporting electrolyte. You can vary the scan rate in a series of experiments to determine the diffusion coefficient of a species. In this approach, you plot the Ipc versus the square root of the scan rate (see Figure 6). For a reversible system, the peak height will increase linearly with the square root of the scan rate. The slope of the resulting line will be proportional to the diffusion coefficient, as shown in the Randles-Sevcik equation.2
ip = 269n3/2AD1/2v1/2Cb ip = peak height (amp) n = number of electrons A = area (cm2) D = diffusion coefficient (cm2/sec) v = scan rate (V/sec) Cb = bulk concentration of solution (M)
FIGURE 6: Plot of peak height for cadmium reduction at various scan rates. Another application would be to determine the deviation from reversible behavior of a species in a given environment. Figure 7 represents the data obtained from the same CV experiments as above, but here we have plotted the product of the peak potential difference and the number of electrons transferred versus 1/square root of the scan rate. As Figure 7 shows, at high scan rates (where 1/v1/2 is small) the cadmium redox couple exhibits irreversible behavior. At the more typical scan rates of a few hundred mV/sec, the couple exhibits the more familiar reversible behavior. FIGURE 7: Plot of peak separation at various scan rates for cadmium.
n ∆E = (57-63) mV Experimental
0
10
20
30
40
50
60
70
80
90
0 5 10 15 20 25 30 35
Scan Rate-1/2
Pk H
t
0
50
100
150
200
250
0 0.5 1 1.5 2 2.5 3 3.5
1/V1/2
Peak
Sep
arat
ion
(mV)

Princeton Applied Research, 801 S. Illinois Avenue, Oak Ridge, TN 37830.
Tel: (865) 425-1289 Fax: (865) 481-2410 Web: www.princetonappliedresearch.com
The deviation from reversible behavior may be due to coupled chemical reactions, or in this case it may be due to the speed of the charge transfer. The exchange of electrons between an electrode and a species does not happen instantly. You can calculate this charge transfer rate constant (ks) by using the same plot as above. A discussion of the theory of this method and the calculations can be found in a paper by Nicholson.3 Analog vs. Digital Measurements Nicholson and Shain have written many important papers concerning the theory of stationary electrodes.4-9 Their work extended CV theory and single-sweep voltammetry from the reversible case to the more complicated cases of
irreversible reactions and electrochemical reactions coupled with chemical reactions. Nicholson and Shain derived their equations using an analog ramp as the potential waveform in their experiments. However, most modern instruments use computer-generated digital waveforms. Unlike the smoothly changing analog waveform, the digital waveform is made up of small, discrete steps (see Figure 8). FIGURE 8: A digital or staircase excitation waveform. When a digitally generated waveform is used for cyclic voltammetry, the technique is properly called staircase cyclic voltammetry. Many electrochemists were concerned that the theory developed by Nicholson and Shain would not apply to this non-classical excitation waveform. However, both Perone’s empirical work10 and Osteryoung’s rigorous work11 showed that if you sample the current at appropriate points during the step, you can expect your results to agree with the Nicholson and Shain theory. As Figure 9 shows, you can sample the current at 25%, 50%, 75% or 100% of the step time (the time potential the potential remains the same). Oysteryoung11 has shown that for Abelian (reversible systems), sampling at 25% of the step time gives results corresponding to those obtained using an analog waveform. However, this is true only if the step height is equal to or less than 8 mV.
Advantage of Staircase Cyclic Voltammetry The advantage of using a digitally generated waveform for cyclic voltammetry is the improved signal to noise ratio at fast scan rates. With linear scan cyclic voltammetry, the charging current (noise) at the electrode is proportional to the scan rate. At high scan rates, charging current may hide important information. With a staircase waveform and digital sampling, you can choose to take the current reading some time after the potential step. The sampling of the current later in the step allows the charging current to decrease before the measurement is made. As the figure below indicates, this sampling technique produces better, more usable data.
-800
-600
-400
-200
0
200
400
600
800
-100 0 100 200 300 400 500 600 700 800 900 1000
Cur
rent
(uA
)
Potential (V)
I vs E
Analog
Digital
TIME
POTENTIAL

Princeton Applied Research, 801 S. Illinois Avenue, Oak Ridge, TN 37830.
Tel: (865) 425-1289 Fax: (865) 481-2410 Web: www.princetonappliedresearch.com
FIGURE 9: Sampling points along a step time of the excitation staircase. The non-Abelian (irreversible) systems best fit the analog theory if you sample the current at 50% of the step time. Figure 10 shows the difference in the voltammograms for Cd at a Hg drop sampled at 25% and 100%. Figure 11 shows the voltammograms for a irreversible system (nickel at a Hg drop) which has been sampled at 50% and 100%. FIGURE 10: Comparison of results when sampling at 25% and 100% of the step time for a reversible case. Note the peak height differences and peak separation.
FIGURE 11: Comparison of results when sampling at 50% and 100% of the step time for an irreversible case. Note that there is little difference. CHRONOAMPEROMETRY Overview Chronoamperometry (CA), another commonly used electroanalytical technique, is a useful tool for determining diffusion coefficients and for investigating kinetics and mechanisms. Unlike the CV technique, CA can yield this information in a single experiment. Moreover, you can run multiple experiments to further characterize the system. Definition When a potential step large enough to cause an electrochemical reaction is applied to an electrode, the current changes with time. The study of this current response as a function of time is called Chronoamperometry (CA). Data Interpretation Figure 12 shows a typical potential excitation waveform and the resulting current response. This response requires semi-infinite linear diffusion (that is, an unstirred solution, linear diffusion to the electrode surface, a planar electrode and a supporting electrolyte to insure the absence of ion migration) and no other reactions. When
100% 75% 50% 25%
Sampling Points
-2.0E+00
-1.0E+00
0.0E+00
1.0E+00
2.0E+00
3.0E+00
-0.8-0.7-0.6-0.5-0.4-0.3
Cur
rent
(uA
)
Potential (V)
I vs E
100%
25%
0.0
1.0
2.0
3.0
-0.4 -0.3 -0.2 -0.1 0.0 0.1 0.2 0.3 0.4 0.5 0.6 0.7 0.8 0.9 1.0 1.1 1.2 1.3
Cur
rent
(uA
)
Potential (V)
I vs E

Princeton Applied Research, 801 S. Illinois Avenue, Oak Ridge, TN 37830.
Tel: (865) 425-1289 Fax: (865) 481-2410 Web: www.princetonappliedresearch.com
these factors govern the system, you can predict the current versus time response using the Cottrell equation: n = number of electrons F = Faraday’s constant D = diffusion coefficient Cb = bulk concentration A = area FIGURE 12: Typical chronoamperogram. Inset is excitation waveform. Simply stated, the Cottrell equation shows that the current is proportional to 1/t1/2 and that a plot it1/2 versus time yields a horizontal line (see Figure 13). Of more interest to the electrochemist, these plots revel whether or not an electrochemical system deviates from the assumptions of the Cottrell equation. Using the Cottrell equation, the diffusion coefficient can be calculated by simply rearranging the equation, providing the number of electrons obtained from the CV experiment and providing values for the other variables. Another useful parameter to calculate is the “true” area of the electrode. In many cases the geometric area of an electrode is not the same as the electrochemically active area. Geometric area calculations assume a smooth surface, but any surface roughness actually increases the available area of the electrode.
FIGURE 13: A plot of it1/2 versus time for a Cottrellian system. Single CA In a single experiment, if the measured current does not correspond to that predicted by the Cottrell equation, you can assume either a slow heterogeneous electron transfer or some other slow step in the reaction. Multiple CAs By performing multiple CA experiments, you can tell whether the deviation from the Cottrell equation is caused by slow electron transfer or by a preceding slow chemical reaction. The slow heterogeneous electron transfer will exhibit a strong dependence on the size of the potential step. That is, the shape of the current versus time curve will change with the size of the potential step. In contrast, the preceding chemical reaction will show no dependence on the size of the potential step. However, you should infer a preceding slow chemical reaction only if the potential is stepped to a potential point on the current voltage curve where the reaction is diffusion controlled. All systems will show a potential step dependency if the potential is stepped only to the foot of the peak or only part way up the rising portion of the curve (see Figure 14).
i = nFAD1/2Cb (πt)1/2
TIME
POTENTIAL
CURRENT
TIME
TIME
it1/2

Princeton Applied Research, 801 S. Illinois Avenue, Oak Ridge, TN 37830.
Tel: (865) 425-1289 Fax: (865) 481-2410 Web: www.princetonappliedresearch.com
FIGURE 14: In a CA experiment, potential should be stepped to point C, stepping to either A or B will show a potential dependence for all systems. Other Applications The CA technique is also useful for determining the rate constant of the slow step in a reaction. An example is the ECE mechanism, a reaction in which the first step is an electrochemical reaction (E), the intermediate step is a chemical reaction (C) that forms an electrochemically active species and the final step is the electrochemical reaction (E) of that species. Alberts and Shain12 have shown that for the ECE mechanism, the apparent value of n can be calculated from the Cottrell equation: and that from a simple working curve, values of the rate constant k can be calculated. Many researchers have used this approach to help determine reaction mechanisms and kinetic constants.13-14 CHRONOCOULOMETRY (CC) Overview Chronocoulometry (CC) is an outgrowth of the chronoamperometric technique. Although the CC technique is used for many of the same reasons as CA, it has two advantages. First, you can more accurately
determine a kinetic rate constant. Second, you can more easily detect adsorption of a species on an electrode surface. Definition In a CC experiment, the charge used in an oxidation or reduction is measured and then plotted with respect to time. The excitation waveform is the same as that used for CA, but the resulting curve shows an increase of charge with time, rather than the decrease of current with time seen in CA. Data Interpretation Like the CA response curve, the CC curve shows that in most reactions, the diffusion of the reacting species to the electrode takes some time (see the theoretical curve in Figure 15). This implies that at the start of the experiment (time zero) the only charge measured is due to the charging of the double layer of the electrode. In cases where a species is adsorbed on the surface of the electrode, the reaction of this material can take place at time zero. This reaction gives rise to current and to a larger value of charge at the initial point than would be expected for a non-absorbed species (see Figure 15). Many experimenters have used the value of the charge due to adsorption to calculate adsorption layer thickness. FIGURE 15: Typical chronocoulogram. A is for a blank solution, B for a system exhibiting redox response and C for a system exhibiting adsorption effects.
0
1
2
3
4
-1.1-1.0-0.9-0.8-0.7-0.6-0.5-0.4-0.3-0.2-0.10.0
Cur
rent
(uA
)
Potential (V)
I vs E
A
B
C
FAD1/2Cb napparent = i(πt)1/2
TIME
Q
C
B
A

Princeton Applied Research, 801 S. Illinois Avenue, Oak Ridge, TN 37830.
Tel: (865) 425-1289 Fax: (865) 481-2410 Web: www.princetonappliedresearch.com
Measuring Charge Since CC is based on the same assumptions as CA, the charge at any time can be calculated by simply integrating the Cottrell equation and adding corrections for the charge due to the double layer and any interfacial interactions (for example, adsorption). The resulting equation is: Q = charge n = number of electrons in the reaction F = Faraday’s constant A = electrode area Cb = bulk concentration D = diffusion coefficient Qd1 = charge due to double layer Q1 = charge due to interfacial interaction If Q is plotted versus t1/2 the result is the Anson plot shown in Figure 16. If we assume that no adsorption occurs, the slope of the line is: and the intercept is the double layer charge. If adsorption does occur, the line in Figure 16 would be offset by the charge due to this interfacial phenomenon. It is easy to differentiate between the charge due to the double layer and that due to adsorption. You merely run the same experiment on an electrolyte blank. The blank will not exhibit the adsorption effect but will exhibit the double layer charging current (see Figure 16). FIGURE 16: Theoretical Anson plots for a blank (A), a redox system (B) and a system showing adsorption (C).
CHRONOPOTENTIOMETRY (CP) Overview Some experimenters use chronopotentiometry for analytical purposes.15 Its major advantage over the more common polarographic/voltammetric methods is its ability to measure higher concentrations. Typical accuracies for the method are 4-5%. Definition Chronopotentiometry (CP) is a technique in which a constant current, or a current step, is applied to the electrode and the resulting potential change is plotted versus time.
Data Interpretation A typical chronopotentiogram is shown in Figure 17. You can understand the curve by considering the events at the electrode surface. In order for current to flow at the electrode, a reaction must take place. The electrode potential is the minimum required to drive a reaction that will support the constant current. If a species is present which is oxidized or reduced more easily than the solvent, the electrode will be driven to the potential appropriate for that reaction. As the concentration of that species at the electrode surface moves toward zero, the potential of the electrode moves toward the next stable potential of the system. FIGURE 17: Theoretical chronopotentiogram. The chronopotentiogram in Figure 17 is for a single species in an acid solution. The electrode assumes an initial potential required to reduce metal ion M++ to metal
Q = + Qd1 + Qi π1/2 2nFACbD1/2t1/2
2nFACbD1/2 π1/2
B
TIME
A
Q
C
0 Time
.3
0
3 τ
6
9
Potential

Princeton Applied Research, 801 S. Illinois Avenue, Oak Ridge, TN 37830.
Tel: (865) 425-1289 Fax: (865) 481-2410 Web: www.princetonappliedresearch.com
ion M+. As the concentration of M++ at the electrode surface decreases, the potential of the electrode gradually moves more negative until the metal ion concentration is depleted at the electrode surface. As soon as no more metal ion exists at the surface, the electrode potential shifts to the potential needed to support a reaction that will give rise to the desired current. In this case, that is the reduction of H+ to H2 and a potential of -0.3 V versus SCE. Transition time is the time between cell turn on and the rapid change in potential. This quantity is related by the Sand equation to the diffusion constant, the areas of the electrode, the bulk concentration and the number of electrons involved in the reaction: i = current τ = transition time F = Faraday’s constant A = area D = diffusion constant of species Cb = concentration of species Examination of the Sand equation shows that the transition time is proportional to the concentration since all other values are constant for a given experiment. Multiple CPs In a series of CP experiments, you might vary either the concentration of the species or the applied constant current. If you vary the current, you might want to plot it1/2 versus i. For a Nernstian system under diffusion control, this plot should be a horizontal line (see Figure 18). If the system is non-Nernstian, the Sand equation does not apply and you will see deviations from the horizontal line.
FIGURE 18: Diagnostic plot of a series of chronopotentiometry experiments. A – Adsorption, B – Preceding reaction. A positive (upward) deviation is usually due to adsorption effects. The transition time is longer than under diffusion control because of the adsorbed species. As the current is increased, the transition time does not decrease proportionally. It is always larger due to the adsorbed species. At very large currents the adsorbed species makes a more pronounced contribution to the transition time (see Figure 18). A negative (downward) deviation is usually due to a preceding reaction. This is because the transition time value will be smaller if a preceding reaction limits the concentration of the species at the electrode. The reaction is kinetically controlled and not diffusion controlled. If the concentration of the species is lower it will take less time than the Sand equation predicts for the transition to a different potential. At higher currents, the deviation becomes greater as the difference in time required to produce the electroactive species remains the same. SQUARE WAVE VOLTAMMETRY (SWV) Overview Square wave voltammetry (SWV), pioneered by Barker16 in the 1950s, is one of the recent techniques used by electrochemists for analytical, kinetic and mechanistic work. However, the form of SWV most electrochemists use today, called Osteryoung square wave17, is based on work done by Ramaley and Krause in 1969.18,19
τ1/2 = π1/2nFAD1/2
2i
A
B
τ1/2
i
Princeton Applied Research, 801 S. Illinois Avenue, Oak Ridge, TN 37830.
Tel: (865) 425-1289 Fax: (865) 481-2410 Web: www.princetonappliedresearch.com
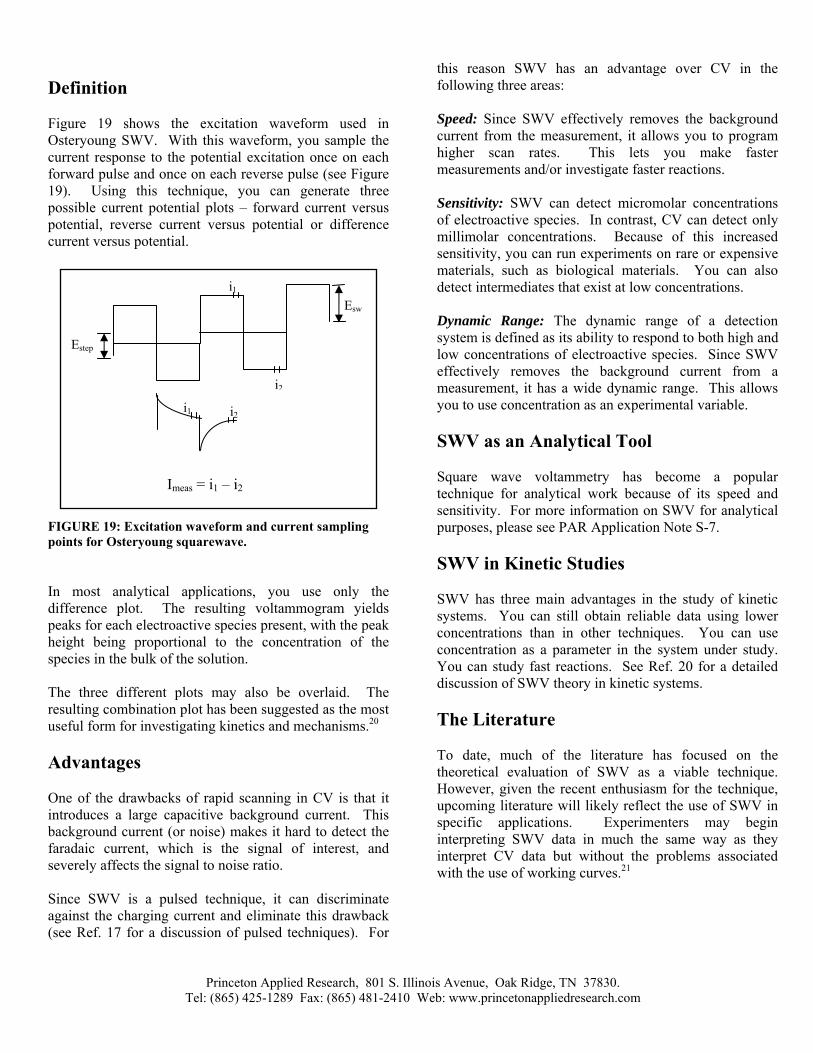
Definition Figure 19 shows the excitation waveform used in Osteryoung SWV. With this waveform, you sample the current response to the potential excitation once on each forward pulse and once on each reverse pulse (see Figure 19). Using this technique, you can generate three possible current potential plots – forward current versus potential, reverse current versus potential or difference current versus potential. FIGURE 19: Excitation waveform and current sampling points for Osteryoung squarewave. In most analytical applications, you use only the difference plot. The resulting voltammogram yields peaks for each electroactive species present, with the peak height being proportional to the concentration of the species in the bulk of the solution. The three different plots may also be overlaid. The resulting combination plot has been suggested as the most useful form for investigating kinetics and mechanisms.20 Advantages One of the drawbacks of rapid scanning in CV is that it introduces a large capacitive background current. This background current (or noise) makes it hard to detect the faradaic current, which is the signal of interest, and severely affects the signal to noise ratio. Since SWV is a pulsed technique, it can discriminate against the charging current and eliminate this drawback (see Ref. 17 for a discussion of pulsed techniques). For
this reason SWV has an advantage over CV in the following three areas: Speed: Since SWV effectively removes the background current from the measurement, it allows you to program higher scan rates. This lets you make faster measurements and/or investigate faster reactions. Sensitivity: SWV can detect micromolar concentrations of electroactive species. In contrast, CV can detect only millimolar concentrations. Because of this increased sensitivity, you can run experiments on rare or expensive materials, such as biological materials. You can also detect intermediates that exist at low concentrations. Dynamic Range: The dynamic range of a detection system is defined as its ability to respond to both high and low concentrations of electroactive species. Since SWV effectively removes the background current from a measurement, it has a wide dynamic range. This allows you to use concentration as an experimental variable. SWV as an Analytical Tool Square wave voltammetry has become a popular technique for analytical work because of its speed and sensitivity. For more information on SWV for analytical purposes, please see PAR Application Note S-7. SWV in Kinetic Studies SWV has three main advantages in the study of kinetic systems. You can still obtain reliable data using lower concentrations than in other techniques. You can use concentration as a parameter in the system under study. You can study fast reactions. See Ref. 20 for a detailed discussion of SWV theory in kinetic systems. The Literature To date, much of the literature has focused on the theoretical evaluation of SWV as a viable technique. However, given the recent enthusiasm for the technique, upcoming literature will likely reflect the use of SWV in specific applications. Experimenters may begin interpreting SWV data in much the same way as they interpret CV data but without the problems associated with the use of working curves.21
i1 i2
Esw
Estep
i1
i2
Imeas = i1 – i2

Princeton Applied Research, 801 S. Illinois Avenue, Oak Ridge, TN 37830.
Tel: (865) 425-1289 Fax: (865) 481-2410 Web: www.princetonappliedresearch.com
GENERAL REFERENCES A number of good general references for electrochemistry are: R. N. Adams, Electrochemistry at Solid Electrodes, Marcel Dekker, New York, 1969. F. C. Anson, Electroanalytical Chemistry, ACS Audio Course, American Chemical Society, Washington, D.C., 1976. A. J. Bard, editor, Electroanalytical Chemistry, vol. 1-14, Marcel Dekker, New York. A. J. Bard and L. R. Faulkner, Electrochemical Methods, John Wiley & Sons, New York, 1980. P. Delahay and C. N. Reilley, New Instrumental Methods in Electrochemistry, Interscience Publishers, New York, 1954. P. T. Kissinger and W. R. Heineman, Laboratory Techniques in Electroanalytical Chemistry, Marcel Dekker, New York, 1984. D. T. Sawyer and J. L. Roberts, Jr., Experimental Electrochemistry for Chemists, John Wiley & Sons, New York, 1974. REFERENCES IN TEXT 1. R. S. Nicholson and I. Shain, Anal. Chem., 36:706
(1964). 2. F. C. Anson, Electroanalytical Chemistry, p. 55, ACS
Audio Course Manual, American Chemical Society, Washington, D. C., 1976.
3. R. S. Nicholson, Anal. Chem., 37:1351 (1965). 4. Anal. Chem., 37:178 (1965). 5. Anal. Chem., 37:190 (1965). 6. M. L. Olmstead and R. S. Nicholson, Anal. Chem.,
38:150 (1966). 7. D. S. Polcyn and I. Shain, Anal. Chem., 38:370
(1966). 8. Anal. Chem., 38:376 (1966) 9. R. S. Nicholson, Anal. Chem., 38:1406 (1966). 10. S. P. Perone and J. J. Zipper, Anal. Chem., 45:452
(1973) 11. J. G. Osteryoung, J. Electroanal. Chem., 222:69
(1987). 12. G. S. Alberts and I. Shain, Anal. Chem., 35:1859
(1963).
13. M. Kodama and R. W. Murray, Anal. Chem., 37:1638 (1965).
14. A. J. Bard, Anal. Chem., 35:2210 (1963). 15. D. G. Davis in Electroanalytical Chemistry vol. 1, A.
J. Bard, Ed., Marcel Dekker, New York, 1966. 16. G. C. Barker and I. L. Jenkins, Analyst, 77:685
(1952). 17. J. Osteryoung and J. J. O’Dea in Electroanalytical
Chemistry vol 14, p. 212, A. J. Bard, Ed., Marcel Dekker, New York, 1986.
18. L. Ramaley and M. S. Krause, Jr., Anal. Chem., 41:1362 (1969).
19. Anal. Chem. 41:1365 (1969). 20. J. J. O’Dea, Anal. Chem., 53:695 (1981). 21. J. J. O’Dea, J. Phys. Chem., 90:2761 (1986).

Princeton Applied Research, 801 S. Illinois Avenue, Oak Ridge, TN 37830.
Tel: (865) 425-1289 Fax: (865) 481-2410 Web: www.princetonappliedresearch.com
GLOSSARY applied potential – The potential the potentiostat is forcing the working electrode to assume. charge transfer rate constant – The speed at which an electron is transferred from one material to another. charging current – The amount of current needed to charge the double layer of the working electrode. It is not due to a redox reaction but is present on all electrochemical measurements. It is typically thought of as noise. Cottrell equation – The mathematical equation which predicts the current measured at any time after a potential step is applied assuming the system under study is governed by semi-infinite linear diffusion. counter electrode – The electrode which provides the current path in an electrochemical cell. It is typically platinum but any inert conductor can be used. In some experiments it should be isolated from the bulk solution. diffusion coefficient – A measure of how fast an ion migrates in solution using only diffusion as the mode of migration. It is represented by the letter D and its units are cm2/sec. diffusion layer – The area immediately adjacent to the working electrode where the mode of ion transport is governed by diffusion. double layer – The interface between the working electrode and the solution. It is well accepted that this layer behaves as a capacitor would in an electrical circuit. However, the capacitance of this layer changes with potential and this is not typical capacitor behavior. ECE mechanism – A three step reaction mechanism which involves an electrochemical reaction (E) followed by a chemical reaction (C) followed by an electrochemical reaction (E). electron transfer – The movement of an electron from the surface of the working electrode to a species in solution or vice versa. faradaic current – The current in an electrochemical reaction due to an oxidation or reduction.
formal potential – The potential at which a given reaction will occur as predicted by thermodynamic equations. initial potential – The starting potential of an experiment. ionic strength – The ionic concentration of a solution as defined by the equation ½(m1z1 + m2z2 + m3z3…) where m is the molar concentration of each ion and z is the charge. mass transport – The physical movement of an ion or molecule through a solution. Nicholson and Shain Theory – A set of diagnostic criteria used to categorize reactions based on cyclic voltammetry data. The original work was done by Nicholson and Shain in 1964. peak separation (∆P) – The difference in potential between the forward and reverse peaks. potential ramp – A change in potential at a constant rate. Potential may be ramped up or down. potentiostat – An electrochemical instrument which controls the potential applied to the working electrode. purge – To pass an inert gas through a solution in order to remove oxygen or other unwanted dissolved gases. Randles-Sevcik Equation – A mathematical equation that predicts the current peak height measured for a reversible reaction when a potential ramp is applied to the working electrode. reference electrode – The electrode against which the potential of the working electrode is measured. It is a well-behaved, stable electrochemical half-cell. Typical reference electrodes are Silver/Silver Chloride (Ag/AgCl) and saturated calomel (SCE). reversibility – In electrochemistry, the ability for a species to be oxidized (or reduced) to a new species and for that new species to be reduced (or oxidized) back to the original species. Sand equation – A mathematical equation that predicts that transition time of a chronopotentiometry experiment. scan rate – The speed at which the potential is being changed. It is expressed in SI units as V/sec.

Princeton Applied Research, 801 S. Illinois Avenue, Oak Ridge, TN 37830.
Tel: (865) 425-1289 Fax: (865) 481-2410 Web: www.princetonappliedresearch.com
supporting electrolyte – A conductive solution in which the electrochemical reactions of interest take place. Although usually an aqueous solution of a salt, acid or base, it can be an organic solvent, molten salt or other conductive media. working electrodes – The electrode where the reaction of interest takes place. It is typically made of an inert material such as Hg, Pt, Ag, Au or carbon.