Embed Size (px)
Citation preview
Application for Process Automation
Control Performance Monitoring (CPM) for monitoring Control Loops
Application Note

Warranty, Liability and Support
Control Performance Monitoring (CPM) 32486166
Version V1.0 13.11.2008 2/34
Cop
yrig
ht ©
Sie
men
s A
G 2
008
All
right
s re
serv
ed
Note The application examples are not binding and do not claim to be com-plete regarding the circuits shown, equipment and possibilities. The soft-ware samples do not represent a customer-specific solution. They only serve as a support for typical applications. You are responsible for ensur-ing that the described products are used correctly. These application ex-amples do not release you from your own responsibility regarding profes-sional usage, installation, operation and maintenance of the plant. When using these application examples, you acknowledge that Siemens cannot be made liable for any damage/claims beyond the scope described in the liability clause. We reserve the right to make changes to these applica-tion examples at any time without prior notice. If there are any deviations between the recommendations provided in these application examples and other Siemens publications – e.g. catalogs – then the contents of the other documents have priority.
Warranty, Liability and Support We accept no liability for information contained in this document.
Any claims against us – based on whatever legal reason – resulting from the use of the examples, information, programs, engineering and perform-ance data etc., described in this application example shall be excluded Such an exclusion shall not apply in the case of mandatory liability, e.g. un-der the German Product Liability Act (“Produkthaftungsgesetz”), in case of intent, gross negligence, or injury of life, body or health, guarantee for the quality of a product, fraudulent concealment of a deficiency or breach of a condition which goes to the root of the contract (“wesentliche Ver-tragspflichten”). The damages for a breach of a substantial contractual obli-gation are, however, limited to the foreseeable damage, typical for the type of contract, except in the event of intent or gross negligence or injury to life, body or health. The above provisions do not imply a change in the burden of proof to the detriment of the orderer.
Copyright© 2008 Siemens A&D. These application examples or ex-tracts from them must not be transferred or copied without the ap-proval of Siemens A&D. For questions about this document please use the following e-mail address:
mailto:[email protected]

Preface
Control Performance Monitoring (CPM) 32486166
Version V1.0 13.11.2008 3/34
Cop
yrig
ht ©
Sie
men
s A
G 2
008
All
right
s re
serv
ed
Preface
Objective of the application Control Performance Monitoring (CPM) as a function of SIMATIC PCS 7 Advanced Process Control (APC) enables the permanent automatic moni-toring of the performance of control loops of a plant. This gives the plant operator the opportunity to counteract reduced performance with specific measures at an early stage.
The configuration example on hand shows the integration of the CPM func-tionality into a PCS 7 project and the operator view in process mode.
Main contents of this application The following main points are discussed in this application:
• Configuring the CPM block
• Initialization
• Monitoring and interpretation of the results
Validity … valid for PCS 7 V7.0 SP1
Reference to the Automation and Drives Service & Support This article is from the Internet application portal of the Automation and Drives Service & Support. Clicking the link below directly displays the download page of this document.
http://support.automation.siemens.com/WW/view/de/32486166
Table of Contents
Control Performance Monitoring (CPM) 32486166
Version V1.0 13.11.2008 4/34
Cop
yrig
ht ©
Sie
men
s A
G 2
008
All
right
s re
serv
ed
Table of Contents
Table of Contents ......................................................................................................... 4
1 Control Performance Monitoring (CPM) ....................................................... 5 1.1 CPM in SIMATIC PCS 7 ................................................................................... 5 1.2 What is the purpose of CPM?........................................................................... 7 1.3 Functionality...................................................................................................... 9
2 Implementing the Monitoring Function ...................................................... 10 2.1 Installing.......................................................................................................... 10 2.2 Configuration .................................................................................................. 10 2.2.1 CFC configuration........................................................................................... 10 2.2.2 OS configuration ............................................................................................. 13
3 Startup and Evaluation................................................................................. 14 3.1 Activate the monitoring function...................................................................... 17 3.1.1 Setting an operating point............................................................................... 17 3.1.2 Initializing the CPM ......................................................................................... 19 3.2 Mode of operation........................................................................................... 21 3.2.1 Setpoint modification ...................................................................................... 21 3.2.2 Deterioration of the control performance ........................................................ 24 3.3 Evaluation of monitoring parameters .............................................................. 27 3.3.1 Remaining control deviation ........................................................................... 27 3.3.2 Changing or reducing the CPI ........................................................................ 27 3.3.3 Changing the process gain ............................................................................. 27 3.3.4 Overshoot too large ........................................................................................ 28 3.3.5 Settling ratio too small .................................................................................... 28 3.3.6 Scatter plot...................................................................................................... 29 3.4 Benefits for the plant operator ........................................................................ 30
4 Control Loop Monitoring for meshed Control Loop Structures............... 31 4.1 Cascaded control............................................................................................ 31 4.2 Split range control........................................................................................... 31 4.3 PID controller with gain scheduler .................................................................. 31 4.4 Override control .............................................................................................. 32 4.5 Feedforward control........................................................................................ 32 4.6 Smith predictor................................................................................................ 32 4.7 Ratio control.................................................................................................... 32 4.8 Multi-variable control....................................................................................... 32
5 History ........................................................................................................... 34
Control Performance Monitoring (CPM)
Control Performance Monitoring (CPM) 32486166
Version V1.0 13.11.2008 5/34
Cop
yrig
ht ©
Sie
men
s A
G 2
008
All
right
s re
serv
ed
1 Control Performance Monitoring (CPM)
Note A general overview on CPM as a function of SIMATIC PCS 7 APC (Ad-vanced Process Control) is provided by the White Paper “SIMATIC PCS 7 APC Portfolio”
http://pcs.khe.siemens.com/efiles/pcs7/support/marktstudien/WP_PCS7_APC_EN.pdf
1.1 CPM in SIMATIC PCS 7
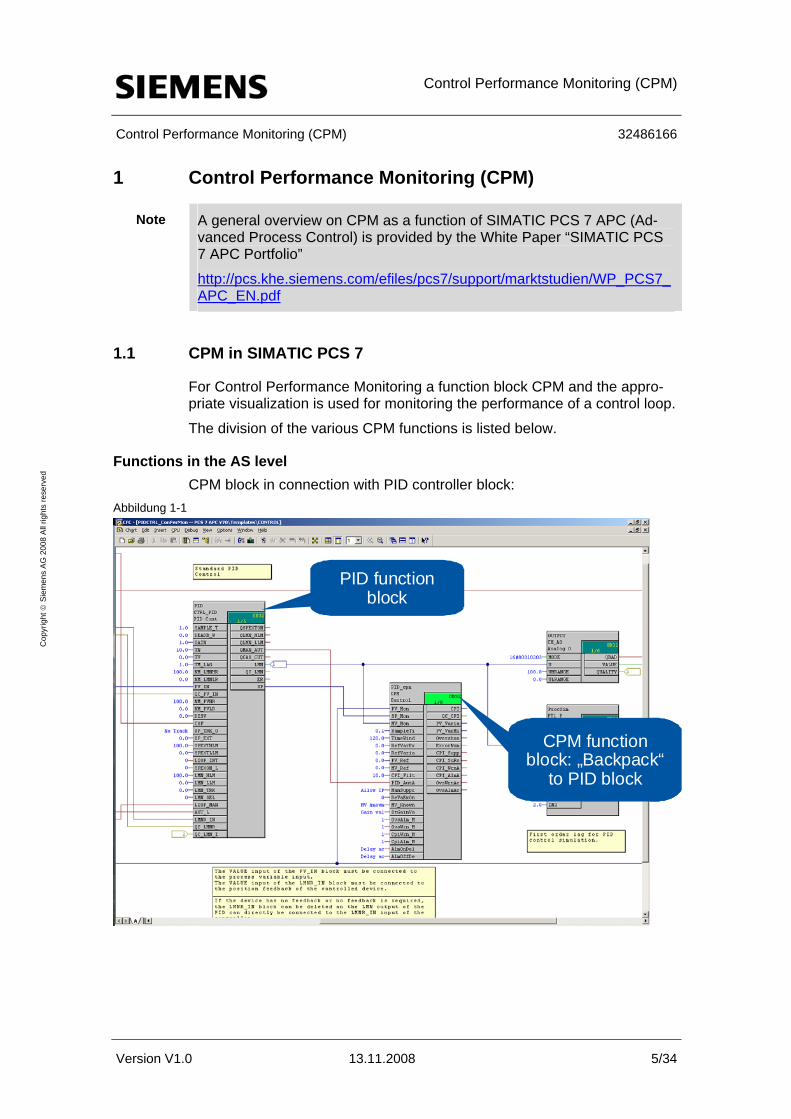
For Control Performance Monitoring a function block CPM and the appro-priate visualization is used for monitoring the performance of a control loop.
The division of the various CPM functions is listed below.
Functions in the AS level CPM block in connection with PID controller block:
Abbildung 1-1
PID function block
CPM function block: „Backpack“
to PID block
PID function block
CPM function block: „Backpack“
to PID block

Control Performance Monitoring (CPM)
Control Performance Monitoring (CPM) 32486166
Version V1.0 13.11.2008 6/34
Cop
yrig
ht ©
Sie
men
s A
G 2
008
All
right
s re
serv
ed
The CPM block fulfills the following tasks:
• Short term statistics
• CPI calculation (Control Performance Index)
• Alarm signalling
Functions in the OS level • CTRL_PID-Faceplate with a Link to the CPM-Faceplate:
Abbildung 1-2
• CPM-Faceplate: Figure 1-3
Contol Performance Status
Contol Performance Index
Standard deviation of controlled variable
Mean value of control error
Mean value of manipulated va-riable Estimated stationary process gain
Opening the CPM-Faceplates via the CTRL_PID-Faceplate

Control Performance Monitoring (CPM)
Control Performance Monitoring (CPM) 32486166
Version V1.0 13.11.2008 7/34
Cop
yrig
ht ©
Sie
men
s A
G 2
008
All
right
s re
serv
ed
• Overview display of all control loops of a plant possible by copying the block icons of the CPM blocks together on an OS page.
• Statistics on archive data and data export
• Simple predefined graphical analysis
• Configurable alarm limits for standard deviation and overshoot (> pre-ventive maintenance)
Additional Offline evaluation • Graphic evaluation in MS-Excel:
– Histogram
– Scatter plot
– etc.
• Analysis of alarm archives
• Numeric analysis (e.g. in Matlab):
– Minimal variance
– Harris index
– Disturbance models
– Fourier transformation
1.2 What is the purpose of CPM?
The basic principle of the combined approach realized in the CPM block is using stochastic as well as deterministic characteristics for the control per-formance, i.e. the suitable characteristics depending on the operating mode.
Monitoring of controlled variables CPM offers a permanent monitoring of the performance of control loops.
The CPM block calculates:
• Stochastic characteristics of the control performance in stationary oper-ating modes of the process
– Mean value of the controlled variable, variance and standard devia-tion of the controlled variable
– Average of the manipulated variable und control deviation
– Control performance index
– Estimated stationary process gain
• Deterministic characteristics of control performance for setpoint steps

Control Performance Monitoring (CPM)
Control Performance Monitoring (CPM) 32486166
Version V1.0 13.11.2008 8/34
Cop
yrig
ht ©
Sie
men
s A
G 2
008
All
right
s re
serv
ed
– Response and settling time as well as the settling ratio
– Overshoot absolute and relating to the jump height.
Further statistic and graphic evaluation of the signals in the control loop over longer, randomly selectable periods of time are offered in the picture module of the CPM block.
Localization of problems Using an overview representation of a plant or plant unit enables a quick overview of the state of all control loops by means of the CPM block icons (traffic-light function).
It is the aim to recognize approaching errors early on and to focus the at-tention of the user on those control loops of a plant which are not working properly anymore.
Control Performance Monitoring (CPM)
Control Performance Monitoring (CPM) 32486166
Version V1.0 13.11.2008 9/34
Cop
yrig
ht ©
Sie
men
s A
G 2
008
All
right
s re
serv
ed
For example, in a main plant with several hundreds of control loops:
• Which area deserves a closer look?
• Which control loops have errors approaching?
• Which control loops should be optimized with the highest priority?
1.3 Functionality
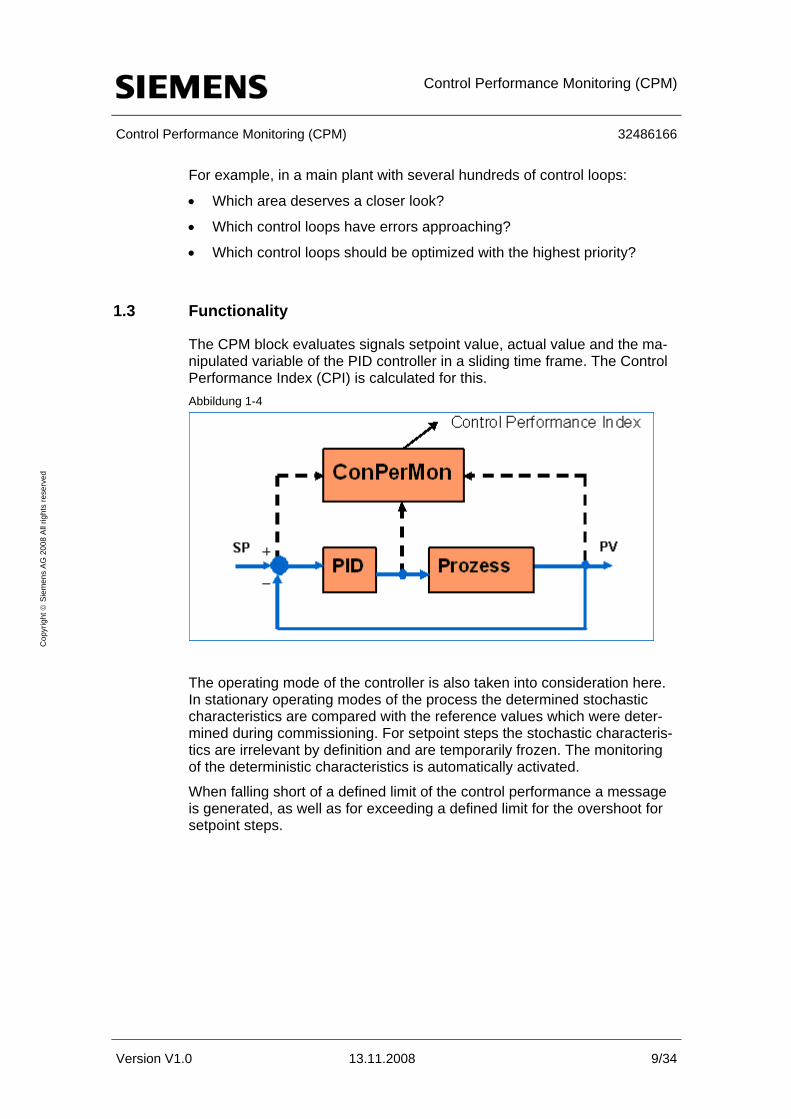
The CPM block evaluates signals setpoint value, actual value and the ma-nipulated variable of the PID controller in a sliding time frame. The Control Performance Index (CPI) is calculated for this. Abbildung 1-4
The operating mode of the controller is also taken into consideration here. In stationary operating modes of the process the determined stochastic characteristics are compared with the reference values which were deter-mined during commissioning. For setpoint steps the stochastic characteris-tics are irrelevant by definition and are temporarily frozen. The monitoring of the deterministic characteristics is automatically activated.
When falling short of a defined limit of the control performance a message is generated, as well as for exceeding a defined limit for the overshoot for setpoint steps.

Implementing the Monitoring Function
Control Performance Monitoring (CPM) 32486166
Version V1.0 13.11.2008 10/34
Cop
yrig
ht ©
Sie
men
s A
G 2
008
All
right
s re
serv
ed
2 Implementing the Monitoring Function
2.1 Installing
The installation of the PCS 7 APC Library V70 occurs via the PCS 7 frame setup. For the individual installation of the PCS 7 APC Library V70 it is re-quired that the PCS 7 Library V70 SP1 has already been installed on the Engineering System.
2.2 Configuration
For a PID controller an assigned CPM block is installed into the same CFC plan and interconnected with the controller. The CPM block is connected with the assigned controller block via a name convention: The name of the CPM instance corresponds entirely to the name of the controller instance plus the ending "_cpm".
Note As an example, the configuration occurs directly in the CFC plan of the S7 program. If in practice all controllers of a type shall be monitored, it is appropriate to make the expansions at the respective process tag type hence to update the plans in the program. As a sample solution for this a process tag type PIDCTRL_ConPerMon is offered in the APC Library. It corresponds to the previous process tag type PIDCTRL, expanded by the control loop monitoring as well as a logic for treatment of measured value .
2.2.1 CFC configuration
To configure the CPM block, proceed as follows: Table 2-1
Instruction Notes / Screenshot 1. Open the plan with the
CTRL_PID in the CFC editor.
2. Declare the CTRL_PID as the predecessor for installing the next block. To do this click with the right mouse-button and select "Prede-cessor for Insertion Position" from the submenu.
Implementing the Monitoring Function
Control Performance Monitoring (CPM) 32486166
Version V1.0 13.11.2008 11/34
Cop
yrig
ht ©
Sie
men
s A
G 2
008
All
right
s re
serv
ed
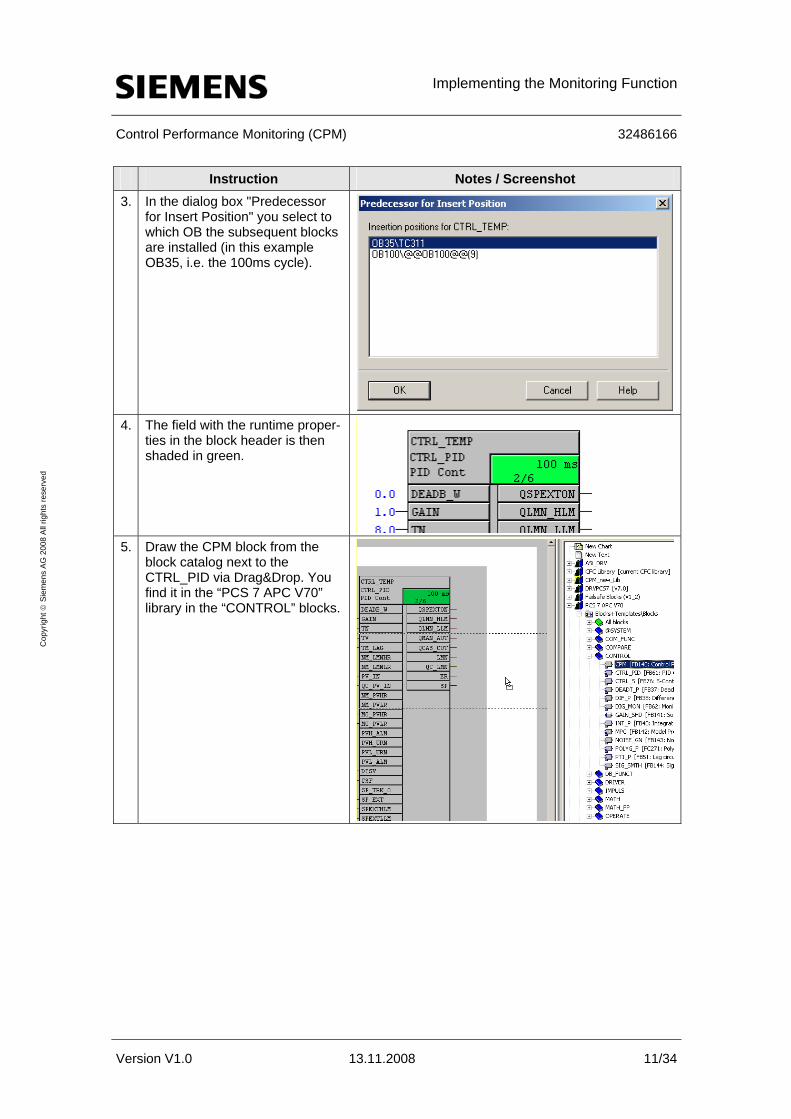
Instruction Notes / Screenshot 3. In the dialog box "Predecessor
for Insert Position" you select to which OB the subsequent blocks are installed (in this example OB35, i.e. the 100ms cycle).
4. The field with the runtime proper-ties in the block header is then shaded in green.
5. Draw the CPM block from the
block catalog next to the CTRL_PID via Drag&Drop. You find it in the “PCS 7 APC V70” library in the “CONTROL” blocks.
Implementing the Monitoring Function
Control Performance Monitoring (CPM) 32486166
Version V1.0 13.11.2008 12/34
Cop
yrig
ht ©
Sie
men
s A
G 2
008
All
right
s re
serv
ed
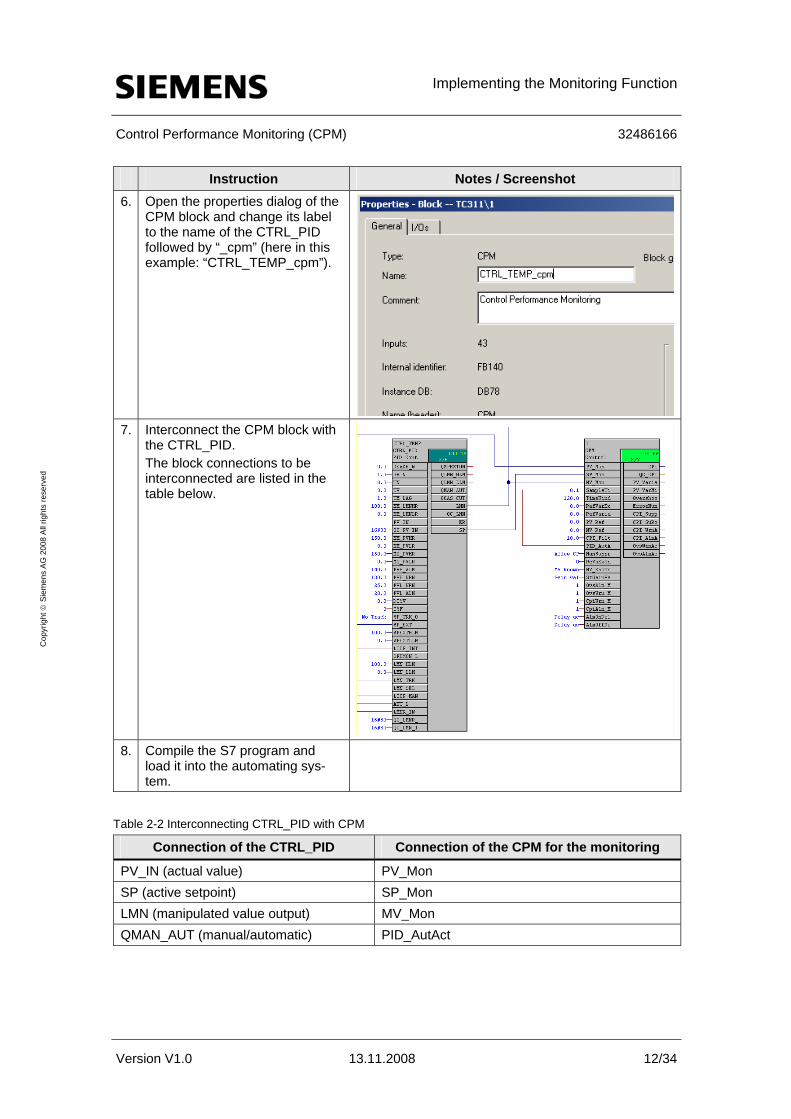
Instruction Notes / Screenshot 6. Open the properties dialog of the
CPM block and change its label to the name of the CTRL_PID followed by “_cpm” (here in this example: “CTRL_TEMP_cpm”).
7. Interconnect the CPM block with the CTRL_PID. The block connections to be interconnected are listed in the table below.
8. Compile the S7 program and
load it into the automating sys-tem.
Table 2-2 Interconnecting CTRL_PID with CPM
Connection of the CTRL_PID Connection of the CPM for the monitoring
PV_IN (actual value) PV_Mon SP (active setpoint) SP_Mon LMN (manipulated value output) MV_Mon QMAN_AUT (manual/automatic) PID_AutAct
Implementing the Monitoring Function
Control Performance Monitoring (CPM) 32486166
Version V1.0 13.11.2008 13/34
Cop
yrig
ht ©
Sie
men
s A
G 2
008
All
right
s re
serv
ed
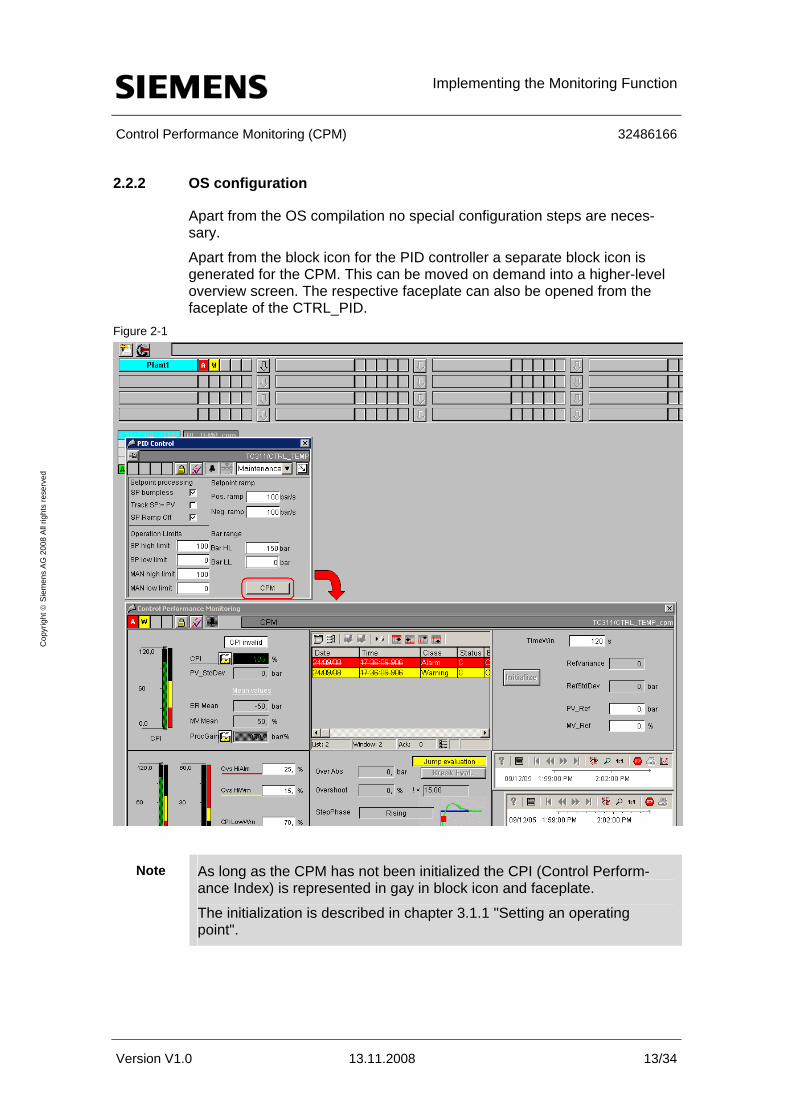
2.2.2 OS configuration
Apart from the OS compilation no special configuration steps are neces-sary.
Apart from the block icon for the PID controller a separate block icon is generated for the CPM. This can be moved on demand into a higher-level overview screen. The respective faceplate can also be opened from the faceplate of the CTRL_PID.
Figure 2-1
Note As long as the CPM has not been initialized the CPI (Control Perform-ance Index) is represented in gay in block icon and faceplate.
The initialization is described in chapter 3.1.1 "Setting an operating point".
Startup and Evaluation
Control Performance Monitoring (CPM) 32486166
Version V1.0 13.11.2008 14/34
Cop
yrig
ht ©
Sie
men
s A
G 2
008
All
right
s re
serv
ed
3 Startup and Evaluation
Mainly after commissioning and optimizing the PID controller to be moni-tored, the CPM block is initialized in a stationary operating mode of the process. Thereby it saves the appropriate parameters as reference values.
This chapter describes the handling of the CPM functionalities via the face-plate.
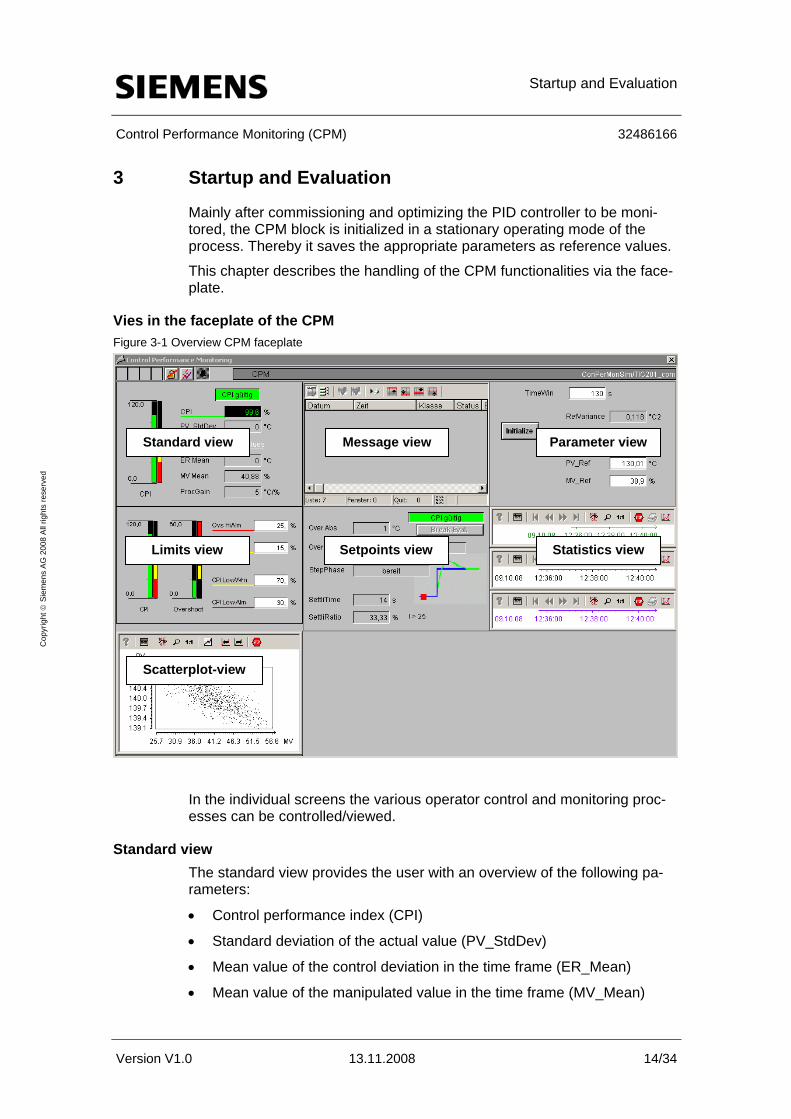
Vies in the faceplate of the CPM Figure 3-1 Overview CPM faceplate
In the individual screens the various operator control and monitoring proc-esses can be controlled/viewed.
Standard view The standard view provides the user with an overview of the following pa-rameters:
• Control performance index (CPI)
• Standard deviation of the actual value (PV_StdDev)
• Mean value of the control deviation in the time frame (ER_Mean)
• Mean value of the manipulated value in the time frame (MV_Mean)
Standard view Message view Parameter view
Statistics view Setpoints view Limits view
Scatterplot-view
Startup and Evaluation
Control Performance Monitoring (CPM) 32486166
Version V1.0 13.11.2008 15/34
Cop
yrig
ht ©
Sie
men
s A
G 2
008
All
right
s re
serv
ed
• Stationary process gain (StatGain)
Message view Here the warning and alarm messages or notes generated by the process appear. They can be acknowledged by the user.
Parameter overview In the parameter overview the following parameter values can be viewed:
• Reference of the variance of the process value (RefVariance)
• Reference of the standard deviation of the actual value (RefStdDev)
Furthermore, requirements can be specified for the following parameters:
• Reference of the actual value (PV_Ref)
• Reference of the manipulated value (MV_Ref)
The user can initialize the CPM via the "Initialize" button.
Limits view Here the warning and alarm limits can be defined for the process.
Visualizing the views:
• Control performance index (CPI)
• Value for measured overshoot
• Limit values for warnings and alarms
Setpoint view In the setpoint view the evaluation of the step response is a striking feature for the user. The "StepPhase" field informs of the current phase of the step response:
• Phase 0 > ready
• Phase 1 > rising
• Phase 2 > overshoot
• Phase 3 > steady state
The setpoint view illustrates the following parameters:
• Absolute overshoot of the step response (OverAbs)
• Relative overshoot of the step response (Overshoot)
• Phase of the step response (StepPhase)
• Settling time of the step response (SettliTime)
• Settling ratio of the step response (SettlRatio)
• Status display for the evaluation of the step response

Startup and Evaluation
Control Performance Monitoring (CPM) 32486166
Version V1.0 13.11.2008 16/34
Cop
yrig
ht ©
Sie
men
s A
G 2
008
All
right
s re
serv
ed
In the normal case the transition from phase 3 to phase 0 occurs automati-cally. In order to shorten the process, this transition can also be forced on demand by pressing the "Break Eval." button.
Statistic view In this statistic view of the picture module the most important measured values of the monitored control loop are represented, which are automati-cally saved in the process value archive:
• Setpoint value
• Actual value with 3σ tolerance band
• Manipulated variable
• CPI
• Automatic mode (binary)
• Upper or lower manipulated variable limit active (binary)
Scatter plot view A scatter plot is a two-dimensional representation of all measured value pairs actual value (PV) over manipulated value (MV).
For well set control loops the data points should form an elliptical cloud.
Note Further information on the individual views is available in the online help at "APC Faceplates > Picture modules > CPM > ...".

Startup and Evaluation
Control Performance Monitoring (CPM) 32486166
Version V1.0 13.11.2008 17/34
Cop
yrig
ht ©
Sie
men
s A
G 2
008
All
right
s re
serv
ed
3.1 Activate the monitoring function
Note For this instruction the PCS 7 example project was used for Advanced Process Control. It is contained in the PCS 7 Installation and can be opened in the SIMATIC Manager via "File > Open > Example Projects > APC_ExaSP".
3.1.1 Setting an operating point
Prior to initializing the CPM the controller in manual mode is set to a sensi-ble operating point.
Note The actual value can also settle to a new operating mode in automatic mode via setpoint change at the controller.
Reading and calculating stochastic data (e.g. variance) is not necessary yet.
Setting the operating point in manual mode Table 3-1 PID standard view
Procedure Screenshot 1. Open the faceplate of the PID
controller in Runtime. Set the operating mode to manual via the operating faceplate of the PID controller. Select the mode from the drop-down menu for the operating mode by activating "Manual". Press the "Ausf" button.

Startup and Evaluation
Control Performance Monitoring (CPM) 32486166
Version V1.0 13.11.2008 18/34
Cop
yrig
ht ©
Sie
men
s A
G 2
008
All
right
s re
serv
ed
Procedure Screenshot 2. The controlled variable (e.g. tem-
perature) shall be set to a de-sired operating point. To do this you enter a manipu-lated value via the "MAN" con-nection of e.g. "15%" (in this example relatively small in order to provide a relatively large oper-ating area around the operating point for the later following set-point step). Then you wait until the actual value has reached a stationary state.
Switching over to automatic mode The PID controller to be monitored is taken in automatic mode and the set-point is set to a new operating point.
Table 3-2 PID standard view
Procedure Screenshot 1. Set the operating mode via the
drop-down menu. Select the "Auto" option.
Startup and Evaluation
Control Performance Monitoring (CPM) 32486166
Version V1.0 13.11.2008 19/34
Cop
yrig
ht ©
Sie
men
s A
G 2
008
All
right
s re
serv
ed
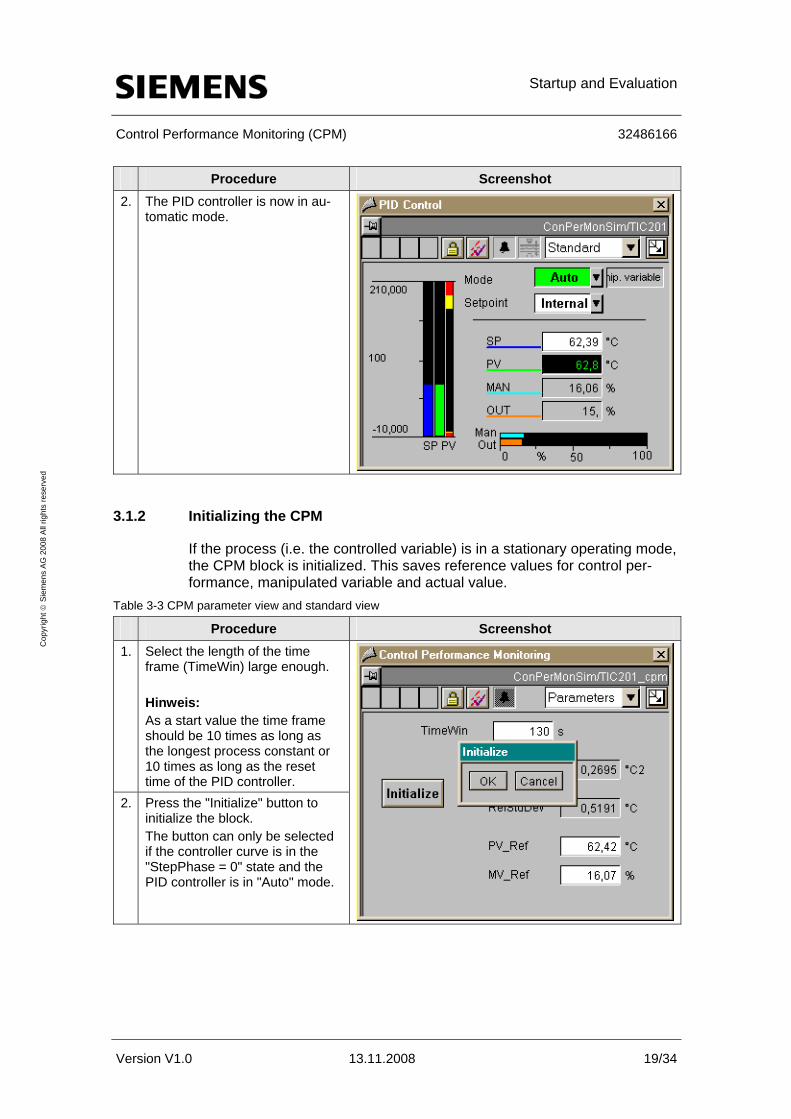
Procedure Screenshot 2. The PID controller is now in au-
tomatic mode.
3.1.2 Initializing the CPM
If the process (i.e. the controlled variable) is in a stationary operating mode, the CPM block is initialized. This saves reference values for control per-formance, manipulated variable and actual value.
Table 3-3 CPM parameter view and standard view
Procedure Screenshot 1. Select the length of the time
frame (TimeWin) large enough. Hinweis: As a start value the time frame should be 10 times as long as the longest process constant or 10 times as long as the reset time of the PID controller.
2. Press the "Initialize" button to initialize the block. The button can only be selected if the controller curve is in the "StepPhase = 0" state and the PID controller is in "Auto" mode.
Startup and Evaluation
Control Performance Monitoring (CPM) 32486166
Version V1.0 13.11.2008 20/34
Cop
yrig
ht ©
Sie
men
s A
G 2
008
All
right
s re
serv
ed
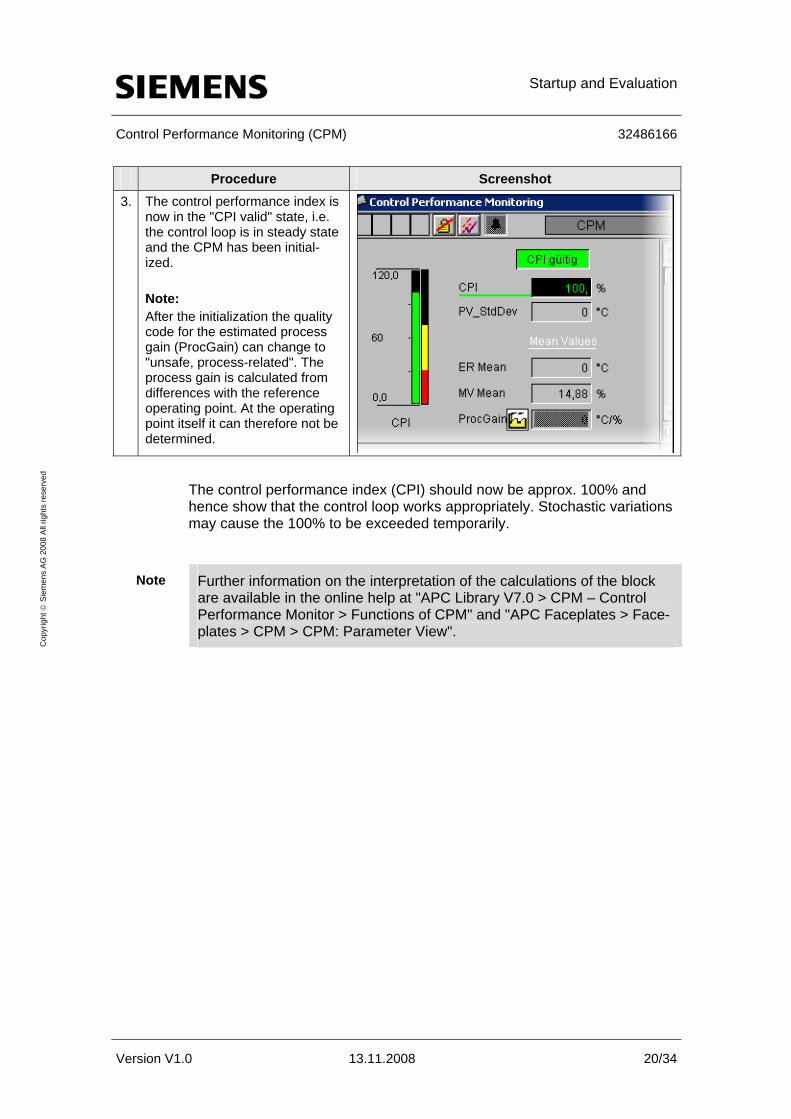
Procedure Screenshot 3. The control performance index is
now in the "CPI valid" state, i.e. the control loop is in steady state and the CPM has been initial-ized. Note: After the initialization the quality code for the estimated process gain (ProcGain) can change to "unsafe, process-related". The process gain is calculated from differences with the reference operating point. At the operating point itself it can therefore not be determined.
The control performance index (CPI) should now be approx. 100% and hence show that the control loop works appropriately. Stochastic variations may cause the 100% to be exceeded temporarily.
Note Further information on the interpretation of the calculations of the block are available in the online help at "APC Library V7.0 > CPM – Control Performance Monitor > Functions of CPM" and "APC Faceplates > Face-plates > CPM > CPM: Parameter View".

Startup and Evaluation
Control Performance Monitoring (CPM) 32486166
Version V1.0 13.11.2008 21/34
Cop
yrig
ht ©
Sie
men
s A
G 2
008
All
right
s re
serv
ed
3.2 Mode of operation
The following section describes the monitoring of the stochastic and deter-ministic characteristics of the control loop.
3.2.1 Setpoint modification
After changing he setpoint the PID controller starts adjusting the actual value to the new sepoint. It determines a manipulated variable from the control deviation which affects the control process in such a way that the control deviation amounts to only a minimum in the steady state.
Setpoint step Table 3-4 PID standard view and trend view
Procedure Screenshot 1. Changing the setpoint by select-
ing the input field "SP" and there you enter the value "150".
2. Directly after changing the set-point the step response is visible in the curve diagram. The curve is composed of the following phases:
• 0 - ready
• 1 - rising
• 2 - overshoot
• 3 – steady state
Startup and Evaluation
Control Performance Monitoring (CPM) 32486166
Version V1.0 13.11.2008 22/34
Cop
yrig
ht ©
Sie
men
s A
G 2
008
All
right
s re
serv
ed
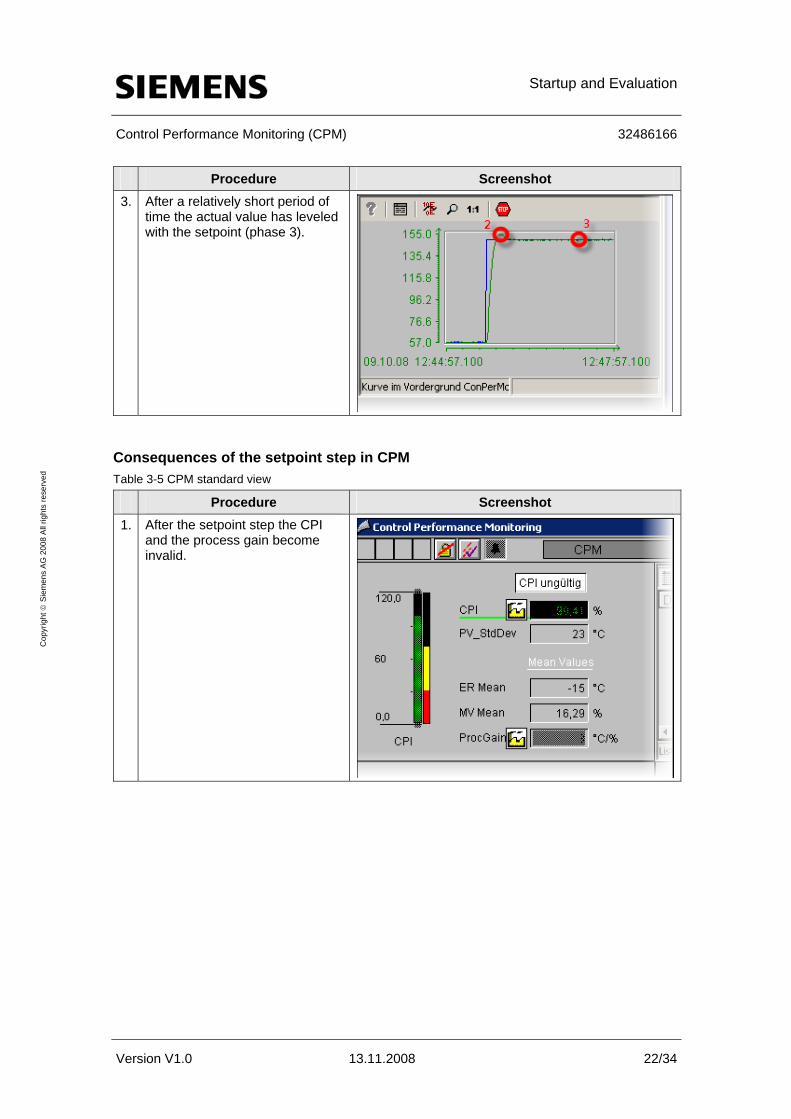
Procedure Screenshot 3. After a relatively short period of
time the actual value has leveled with the setpoint (phase 3).
Consequences of the setpoint step in CPM Table 3-5 CPM standard view
Procedure Screenshot 1. After the setpoint step the CPI
and the process gain become invalid.

Startup and Evaluation
Control Performance Monitoring (CPM) 32486166
Version V1.0 13.11.2008 23/34
Cop
yrig
ht ©
Sie
men
s A
G 2
008
All
right
s re
serv
ed
Procedure Screenshot 2. If the PID controller has adjusted
the actual value accordingly, the CPI changes back to "CPI valid". It moves around 100%.
Note Further information on the setpoint change are available in the online help at "APC Library V7.0 > CPM – Control Performance Monitor > Func-tions of CPM > Monitoring deterministic characteristics of the control per-formance" and "APC Faceplates > Faceplates > CPM > CPM: Setpoint view".

Startup and Evaluation
Control Performance Monitoring (CPM) 32486166
Version V1.0 13.11.2008 24/34
Cop
yrig
ht ©
Sie
men
s A
G 2
008
All
right
s re
serv
ed
3.2.2 Deterioration of the control performance
If the control performance deteriorates slowly during runtime, this may be an indication that controller setting and control process behavior do not harmonize anymore.
ProcTimeLag Faceplate In the APC example project this behavior is modeled by extending the process time constant after operating the simulation block ProcTimeLag .
Table 3-6 ProcTimeLag faceplate: Process time constant
Procedure Screenshot 1. In the runtime you select the
picture module "ProcTime" which opens the faceplate.
2. In the input field you enter the value "8", for example, for the new time constant and acknowl-edge the "Ausf" button.

Startup and Evaluation
Control Performance Monitoring (CPM) 32486166
Version V1.0 13.11.2008 25/34
Cop
yrig
ht ©
Sie
men
s A
G 2
008
All
right
s re
serv
ed
Effects in the CPM Table 3-7 CPM faceplate standard view
Procedure Screenshot 1. After changing the time constant
it can be observed that the CPI slowly drops and hence displays a deterioration of the control performance.
At an appropriate parameterization the drop of the CPI causes the trigger-ing of a message.
Startup and Evaluation
Control Performance Monitoring (CPM) 32486166
Version V1.0 13.11.2008 26/34
Cop
yrig
ht ©
Sie
men
s A
G 2
008
All
right
s re
serv
ed
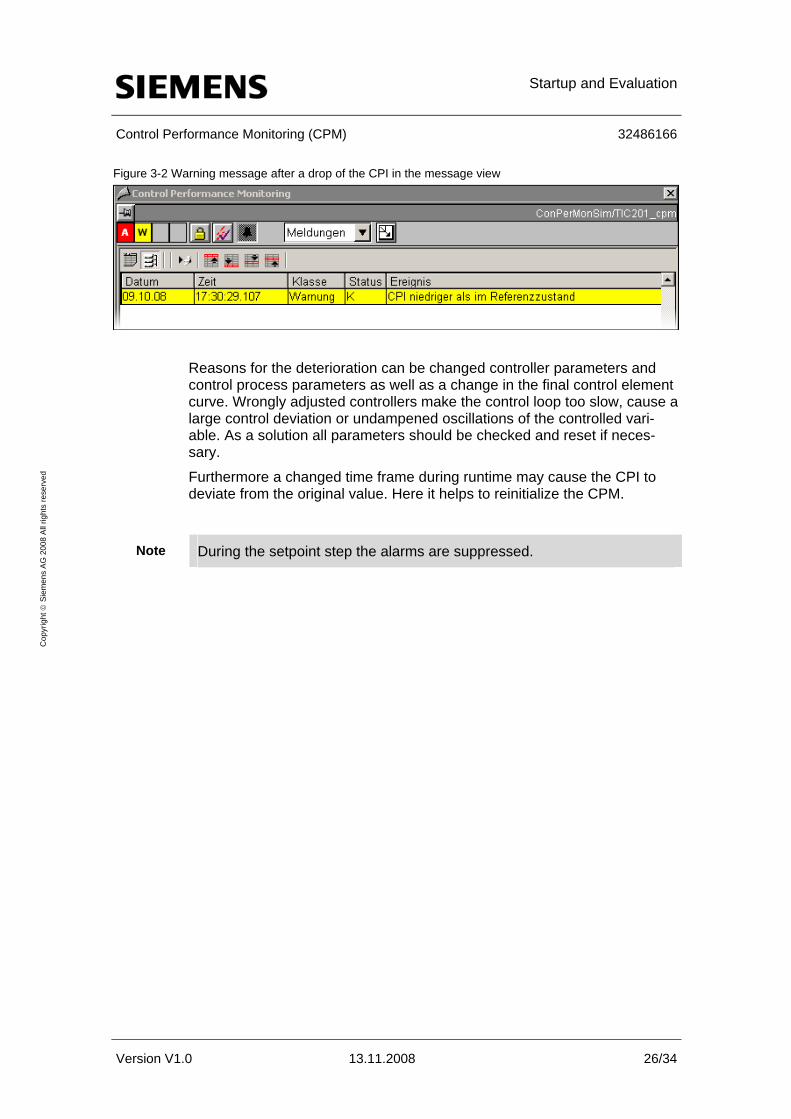
Figure 3-2 Warning message after a drop of the CPI in the message view
Reasons for the deterioration can be changed controller parameters and control process parameters as well as a change in the final control element curve. Wrongly adjusted controllers make the control loop too slow, cause a large control deviation or undampened oscillations of the controlled vari-able. As a solution all parameters should be checked and reset if neces-sary.
Furthermore a changed time frame during runtime may cause the CPI to deviate from the original value. Here it helps to reinitialize the CPM.
Note During the setpoint step the alarms are suppressed.
Startup and Evaluation
Control Performance Monitoring (CPM) 32486166
Version V1.0 13.11.2008 27/34
Cop
yrig
ht ©
Sie
men
s A
G 2
008
All
right
s re
serv
ed
3.3 Evaluation of monitoring parameters
3.3.1 Remaining control deviation
The mean value of the control deviation in the sliding time frame is dis-played in the standard view of the CPM faceplate. For a controller with I-part (PI or PID controller) is should be almost equal zero. If not the follow-ing problem causes are possible:
• The performance of the final control element is insufficient. As a result the controller keeps going to the limit with its actuating signal. This may be due to unfavorably dimensioned final control elements, changed op-erating conditions or also due to wear.
• The manipulated variable required by the controller will not be effective in the process as the final control element is defective or the communi-cation is disconnected, for example.
3.3.2 Changing or reducing the CPI
• Deterioration of the control performance due to changed control pa-rameters, changed final control element curve or changed control proc-ess parameters
• Stochastic fluctuations may lead to a temporary exceeding of the 100% mark. This however is unproblematic.
In the following cases the CPI changes naturally without causing any prob-lems in the control loop:
• The time frame length was changed.
• The distorted CPI signal was smoothed
3.3.3 Changing the process gain
• Signs of wear in the process lead to a gradual change in process gain. In many cases this affects the control performance.
• Sudden and temporary change indicates an external disturbance im-pact. Such disturbances can be avoided by improved controller settings. Should they occur more often, it may pay off to search for the causes.

Startup and Evaluation
Control Performance Monitoring (CPM) 32486166
Version V1.0 13.11.2008 28/34
Cop
yrig
ht ©
Sie
men
s A
G 2
008
All
right
s re
serv
ed
3.3.4 Overshoot too large
An important parameter for monitoring the control performance is the over-shoot. Too large overshoots of the step response are due to a wrong gain setting of the controller or changed control process. If the overshoot is too large, it helps in many cases to reduce the gain of the controller.
3.3.5 Settling ratio too small
The settling ration, quotient of rise time and settling time, must be larger than 25%. If this is not the case, the reset time at the PID controller is set too slow, which causes a slow leveling of the actual value with the setpoint value.
Figure 3-3 Rise and settling time after a setpoint step
0 20 40 60 80 100 120 140 160 180 200 0
0.5
1
1.5
2
2.5
3
SettlingTime
RiseTime
OverAbso PV_TolMax
PV_TolMin
StepHeight
PV
SP

Startup and Evaluation
Control Performance Monitoring (CPM) 32486166
Version V1.0 13.11.2008 29/34
Cop
yrig
ht ©
Sie
men
s A
G 2
008
All
right
s re
serv
ed
3.3.6 Scatter plot
For well set control loops the data points in the scatter plot should form an elliptical cloud.
Figure 3-4 Scatter plot for a well set control loop
Non-linearities such as friction losses in valves (which cause a parallelo-gram-type distorted contour), but also quantization effects and other un-usual statistical distributions can be recognized.
Figure 3-5 Scatter plot for a valve with adhesion problems
Startup and Evaluation
Control Performance Monitoring (CPM) 32486166
Version V1.0 13.11.2008 30/34
Cop
yrig
ht ©
Sie
men
s A
G 2
008
All
right
s re
serv
ed
3.4 Benefits for the plant operator
Main advantages • Simple configuration and automatic initialization of the CPM functional-
ities
• Permanent, automatic monitoring of the control loops of the plant
• Possibility of counteracting reduced performance early on with directed measures.
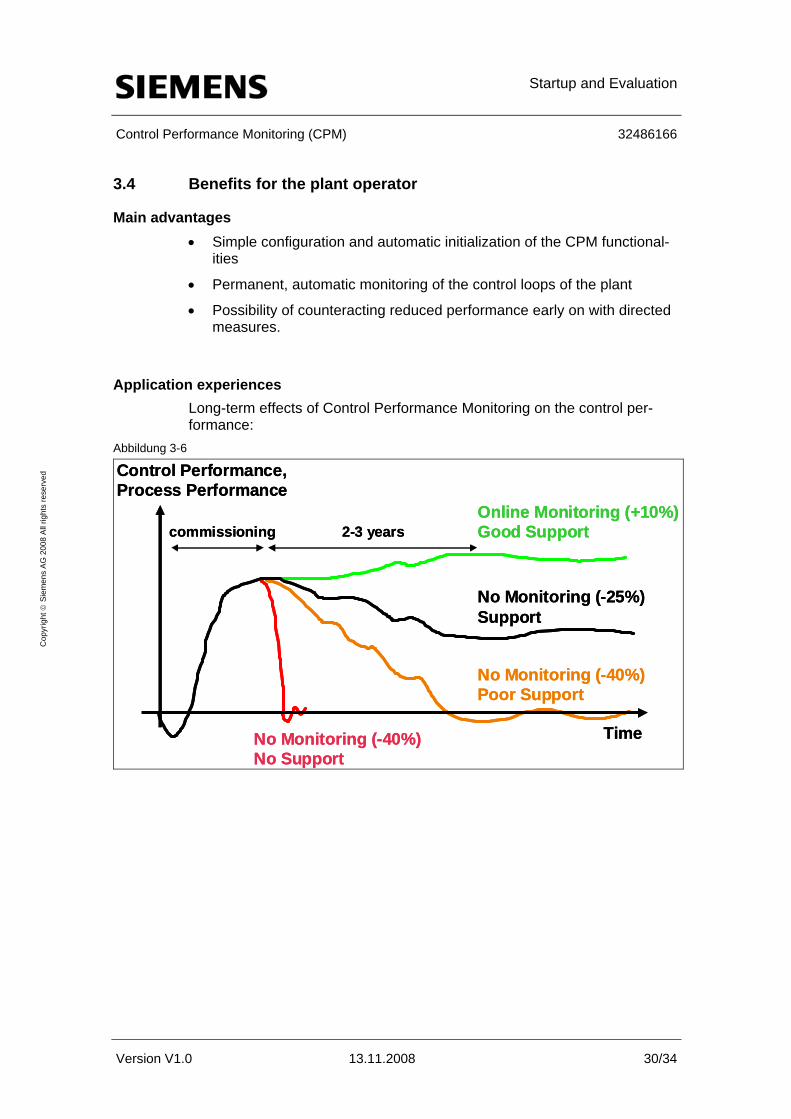
Application experiences Long-term effects of Control Performance Monitoring on the control per-formance:
Abbildung 3-6
Control Performance, Process Performance
Online Monitoring (+10%)Good Support
No Monitoring (-25%)Support
No Monitoring (-40%)Poor Support
No Monitoring (-40%)No Support
Time
2-3 yearscommissioning
Control Performance, Process Performance
Online Monitoring (+10%)Good Support
No Monitoring (-25%)Support
No Monitoring (-40%)Poor Support
No Monitoring (-40%)No Support
Time
2-3 yearscommissioning
Control Loop Monitoring for meshed Control Loop
Structures
Control Performance Monitoring (CPM) 32486166
Version V1.0 13.11.2008 31/34
Cop
yrig
ht ©
Sie
men
s A
G 2
008
All
right
s re
serv
ed
4 Control Loop Monitoring for meshed Control Loop Structures
4.1 Cascaded control
For a cascaded control you should only apply the CPM block to the master control but not to the slave control. The CPM block cannot make any sensi-ble statements on the control performance of the slave control loop, since:
• … the variance of the actual value in the slave control loop depends on the variance of the setpoint which is given as manipulated value by the master control.
• … there are neither operating phases with constant setpoint, neither de-fined setpoint steps.
Furthermore, from a process point of view, the mater control loop is natu-rally the one whose control performance should be monitored while the control performance of the auxiliary loop (slave loop) is of secondary sig-nificance. Nevertheless, it is advised to set the slave loop carefully before starting the optimization and monitoring of the master controller, since a bad behavior of the slave controller cannot be compensated by the master controller.
4.2 Split range control
The split range function block contains two individual (static) curves for both actuators. If both actuators have clear differences in their performance ca-pability (can be interpreted as different process gain for heating/cooling) this should be compensated by different inclinations of both curve branches, so the controller finds a process behavior as linear as possible (i.e. in dependent of positive or negative sign). If this is not possible, the control performance will be slightly different in both areas. The initialization of the CPM block should then be performed in the worse area in order to avoid false alarms.
4.3 PID controller with gain scheduler
The objective of gain scheduling is to reach a uniform control performance over the entire operating range. If this is not successful the initialization of the CPM block must be performed in an operating point with worse control performance in order to avoid false alarms. It is recommended to widen the alarm boundaries at the CPM block: admit smaller CPIs and larger over-shoots.
Control Loop Monitoring for meshed Control Loop
Structures
Control Performance Monitoring (CPM) 32486166
Version V1.0 13.11.2008 32/34
Cop
yrig
ht ©
Sie
men
s A
G 2
008
All
right
s re
serv
ed
4.4 Override control
Depending on the process state, various controls are active for override control whose control performance varies naturally. It is recommended to only apply the control loop monitoring to the main controller and to sup-press it via the input parameter ManSuprCPI if the limiting controller be-comes active.
4.5 Feedforward control
The task of the feedforward control is to avoid or at least reduce deteriora-tion of the control performance due to changes at a measurable distur-bance variable. Principally the control loop monitoring can therefore be used as for the single control loop. If the disturbance variable is temporarily vary calm and temporarily very agitated, according fluctuations of the con-trol performance cannot be excluded, since the feedforward control repre-sents a model-based intervention, and a model is never a perfect represen-tation of reality.
4.6 Smith predictor
For processes with dead times the smith predictor enables a higher control performance than a simple PI controller. Principally the control loop moni-toring can therefore be used as for the single control loop. If the dead time changes during runtime, deterioration of the control quality must be ex-pected.
4.7 Ratio control
For a ratio control the control loop monitoring can only be applied to the main control loop, if the sepoints for added components are determined from the actual value of the main component, since then permanent set-point value changes can be expected in the control loops for the added components similar as for the slave control loop of a cascade. If the set-points for added components are determined from the setpoint of the main component the subordinate control loops can also be monitored.
4.8 Multi-variable control
The mathematical concept of the CPM block has been designed for single-variable control loops. If an increased variance is detected in a control loop, the block cannot determine whether the actual cause is within this control loop or whether other influences through interactions were brought in from the field. If you observe a strong interconnection between various control loops of your plant, or even employ multi-variable controllers, the state-ments of the CPM block must be viewed with caution.
Nevertheless it is sensible to equip a multi-variable controller such as the ModPreCon block with a control loop monitoring in order to determine

Control Loop Monitoring for meshed Control Loop
Structures
Control Performance Monitoring (CPM) 32486166
Version V1.0 13.11.2008 33/34
Cop
yrig
ht ©
Sie
men
s A
G 2
008
All
right
s re
serv
ed
whether the control performance that was achieved during commissioning of the controller is maintained during runtime. In this case each control channel of the multi-variable controller receives a separate CPM block. It is necessary to configure some additional logic functions prior to the input pa-rameter "ManSuprCPI":
• If one or several other channels of the multi-variable controller are in an non-stationary state (e.g. setpoint step) indicated by the output parame-ter "CPI_SupRoot = 1", then the temporarily increased variance cannot be avoided in this control channel and should not cause a CPU mes-sage.
• If one or several other channels of the multi-variable controller show in-creased variances (bad control performance), indicated by the respec-tive output "CPI_WrnAct = 1", then these variances cause an increased variance in this control channel via the interconnection, which cannot be prevented and hence should not lead to a CPI warning. In this way it may be possible to detect the actual disturbance cause in a multi-variable system: The channel which first detects an increased variance sets the alarm while follow-up alarms in neighboring channels are sup-pressed.
Note In the multi-variable case the process gains estimated from the single-variable consideration are irrelevant. Setting the input parameter "StGainValid = 0" this is also displayed accordingly in the operator screen as status "unsafe, process-related"

History
Control Performance Monitoring (CPM) 32486166
Version V1.0 13.11.2008 34/34
Cop
yrig
ht ©
Sie
men
s A
G 2
008
All
right
s re
serv
ed
5 History Table 5-1 History
Version Date Modification
V1.0 13.11.2008 First issue