Embed Size (px)
Citation preview

Application ForPrevention of Significant Deterioration Permit
For the Desert Rock Energy Facility
Prepared for:
Steag Power, LLCHouston, TX
Prepared by:
ENSR Corporation
May 2004Document Number 09417-360-250R1

Desert Rock Energy Facility
Application for
Prevention of Significant Deterioration Permit
Submitted to
U. S. Environmental Protection Agency
Air Division
San Francisco, California
Prepared for
Steag Power, LLC
Three Riverway Suite 1100
Houston, TX 77056
Prepared by
ENSR International
1220 Avenida Acaso
Camarillo, CA 93012
09417-360-0250R1
May 7, 2004


09417-360-250R1 i May, 2004
TABLE OF CONTENTS
1.0 INTRODUCTION ..................................................................................................................... 1-1
1.1 Project Overview............................................................................................................. 1-11.2 Facility Classification....................................................................................................... 1-2
1.2.1 Standard Industrial Classification (SIC) Code........................................................ 1-2
1.2.2 Air Quality Source Designation............................................................................. 1-21.3 Document Organization................................................................................................... 1-31.4 Applicant Information ...................................................................................................... 1-3
2.0 PROPOSED PROJECT........................................................................................................... 2-1
2.1 Project Location .............................................................................................................. 2-12.2 Desert Rock Energy Facility Combustion Technology Selection ....................................... 2-22.3 Desert Rock Energy Facility Diagrams ............................................................................. 2-52.4 Process Equipment Description....................................................................................... 2-5
2.4.1 Coal Handling ...................................................................................................... 2-5
2.4.2 Pulverized Coal-fired Boilers ................................................................................ 2-9
2.4.3 Cooling Towers.................................................................................................. 2-10
2.4.4 Auxiliary Boilers ................................................................................................. 2-10
2.4.5 Emergency Diesel Generators and Firewater Pumps .......................................... 2-11
2.4.6 Fuel Oil Supply .................................................................................................. 2-11
2.4.7 Limestone Supply .............................................................................................. 2-11
2.4.8 Hydrated Lime and Activated Carbon Supply...................................................... 2-11
2.4.9 Anhydrous Ammonia Supply .............................................................................. 2-11
2.4.10 Ash Handling ..................................................................................................... 2-11
3.0 REGULATORY SETTING........................................................................................................ 3-1
3.1 Ambient Air Quality Standards and Current Attainment Status.......................................... 3-13.2 Prevention of Significant Deterioration (PSD) Requirements............................................. 3-3
3.2.1 Best Available Control Technology ....................................................................... 3-4
3.2.2 Air Quality Monitoring Requirements..................................................................... 3-4
3.2.3 Air Quality Impact Analysis................................................................................... 3-5
3.2.4 Additional Impacts Analyses................................................................................. 3-6
3.2.5 PSD Class I Area Analysis ................................................................................... 3-73.3 Good Engineering Practice Stack Height Analysis............................................................ 3-73.4 New Source Performance Standards............................................................................... 3-7
3.4.1 Subpart A - General Provisions ............................................................................ 3-7
3.4.2 Subpart Da - Standards Of Performance For Electric Utility Steam GeneratingUnits .................................................................................................................... 3-8

09417-360-250R1 ii May, 2004
3.4.3 Subpart Dc - Standards Of Performance For Small Industrial-Commercial-Institutional Steam Generating Units................................................................... 3-10
3.4.4 Subpart Y – Coal Preparation Plant .................................................................... 3-11
3.4.5 Subpart OOO – Nonmetallic Mineral Processing Plant........................................ 3-11
3.4.6 Subpart Kb – Volatile Organic Liquid Storage Vessels ........................................ 3-113.5 National Emissions Standards for Hazardous Air Pollutants ........................................... 3-123.6 Title V – Major Source Operating Permit........................................................................ 3-123.7 Compliance Assurance Monitoring ................................................................................ 3-123.8 Acid Rain Provisions ..................................................................................................... 3-133.9 Risk Management Program........................................................................................... 3-13
4.0 CONTROL TECHNOLOGY EVALUATION .............................................................................. 4-1
4.1 Control Technology Overview.......................................................................................... 4-14.1.1 Lowest Achievable Emission Rate........................................................................ 4-1
4.1.2 Top-Down BACT.................................................................................................. 4-2
4.1.3 Previous BACT/LAER Determinations for Pulverized Coal-fired Boilers ................. 4-24.2 BACT for Nitrogen Oxides (NOx) ..................................................................................... 4-3
4.2.1 Pulverized Coal-fired Boilers ................................................................................ 4-3
4.2.2 Auxiliary Boilers ................................................................................................... 4-9
4.2.3 Emergency Diesel Engines .................................................................................. 4-94.3 BACT for Sulfur Dioxide ................................................................................................ 4-10
4.3.1 Pulverized Coal-fired Boilers .............................................................................. 4-10
4.3.2 Auxiliary Boilers ................................................................................................. 4-13
4.3.3 Emergency Diesel Engines ................................................................................ 4-134.4 BACT for Carbon Monoxide .......................................................................................... 4-13
4.4.1 Pulverized Coal-fired Boilers .............................................................................. 4-13
4.4.2 Auxiliary Boilers ................................................................................................. 4-16
4.4.3 Emergency Diesel Engines ................................................................................ 4-164.5 BACT for VOC.............................................................................................................. 4-17
4.5.1 Pulverized Coal-fired Boilers .............................................................................. 4-17
4.5.2 Auxiliary Boilers ................................................................................................. 4-18
4.5.3 Emergency Diesel Engines ................................................................................ 4-184.6 BACT for Particulate Matter........................................................................................... 4-19
4.6.1 Pulverized Coal-fired Boilers .............................................................................. 4-19
4.6.2 Auxiliary Boilers ................................................................................................. 4-21
4.6.3 Emergency Diesel Engines ................................................................................ 4-21
4.6.4 Material Handling Sources ................................................................................. 4-224.7 BACT for Sulfuric Acid Mist ........................................................................................... 4-22
4.7.1 Pulverized Coal-fired Boilers .............................................................................. 4-22
4.7.2 Auxiliary Boilers and Diesel Generators .............................................................. 4-23

09417-360-250R1 iii May, 2004
4.8 BACT for Hydrogen Fluoride ......................................................................................... 4-234.9 BACT for Lead.............................................................................................................. 4-234.10Summary of BACT Emission Levels .............................................................................. 4-234.11Maximum Achievable Control Technology (MACT) ........................................................ 4-25
5.0 PROJECT EMISSIONS ........................................................................................................... 5-1
5.1 Criteria Pollutant Emissions............................................................................................. 5-15.2 Startup and Shutdown Emissions .................................................................................... 5-15.3 Hazardous Air Pollutant Emissions .................................................................................. 5-3
6.0 AIR QUALITY IMPACT ANALYSIS ......................................................................................... 6-1
6.1 Overview......................................................................................................................... 6-16.2 Modeling Procedures ...................................................................................................... 6-1
6.2.1 Meteorological Data ............................................................................................. 6-2
6.2.2 Stack Characteristics and Emissions .................................................................... 6-2
6.2.3 Significance Criteria and PSD Increments............................................................. 6-6
6.2.4 Background Source Inventory .............................................................................. 6-66.3 Near-field PSD Class II Modeling Analyses...................................................................... 6-8
6.3.1 Source and Receptor Locations............................................................................ 6-8
6.3.2 Near-field Project Only Class II Modeling Results................................................ 6-15
6.3.3 Near-field Cumulative Class II Modeling Results ................................................. 6-166.4 Distant Class II Area Assessment.................................................................................. 6-286.5 PSD Class I Modeling Analysis...................................................................................... 6-33
6.5.1 Modeling Domain and Receptors........................................................................ 6-33
6.5.2 Project Only PSD Class I Increment Modeling Results ........................................ 6-33
6.5.3 Cumulative Class I Increment Modeling Results.................................................. 6-36
6.5.4 Regional Haze Impacts ...................................................................................... 6-41
6.5.5 Sulfur and Nitrogen Deposition Analysis ............................................................. 6-44
6.5.6 Lake Acid Neutralizing Capacity Analysis............................................................ 6-456.6 Additional Impact Analyses ........................................................................................... 6-46
6.6.1 Growth Analysis................................................................................................. 6-47
6.6.2 Impacts on Soils and Vegetation ........................................................................ 6-49
6.6.3 Impacts on Ozone Concentrations...................................................................... 6-50
6.6.4 Endangered Species and National Historic Preservation Acts ............................. 6-516.7 Summary of Air Quality Modeling Results ...................................................................... 6-51
6.7.1 PSD Class II results ........................................................................................... 6-51
6.7.2 PSD Class I Results........................................................................................... 6-52
7.0 REFERENCES ........................................................................................................................ 7-1

09417-360-250R1 iv May, 2004
ATTACHMENTS
1 ALTERNATIVE COMBUSTION TECHNOLOGIES
2 SUPPLEMENTAL BACT INFORMATION
3 PERFORMANCE DATA AND EMISSIONS CALCULATIONS
4 MODELING PROTOCOL
5 SUPPLEMENTAL MODELING RESULTS AND CD
6 CUMULATIVE MODELING INVENTORY DOCUMENTATION
7 REFINEMENTS TO FLAG FOR DETERMINING REGIONAL HAZE IMPACTS
8 THREATENED AND ENDANGERED SPECIES ANALYSIS
9 HISTORIC PRESERVATION ACT ANALYSIS
LIST OF TABLES
Table 2-1 Range of Emissions Control from Coal Combustion Technologies.................................. 2-5Table 2-2 Fuel Data for Main Boilers ............................................................................................. 2-9Table 3-1 Ambient Air Quality Standards....................................................................................... 3-2Table 3-2 New Mexico Ambient Air Quality Standards ................................................................... 3-3Table 3-3 Comparison of Desert Rock Energy Facility Annual PTE to the PSD Thresholds............. 3-4Table 3-4 PSD De Minimus Monitoring Concentrations.................................................................. 3-5Table 3-5 Allowable PSD Increments and Significant Impact Levels (µg/m3)................................... 3-6Table 3-6 Summary of Regulatory Requirements of NSPS Subpart A – General Provisions ........... 3-8Table 3-7 Summary of Regulatory Requirements of NSPS Subpart Da .......................................... 3-9Table 4-1 Ranking of NOx Control Technologies for Pulverized Coal Boilers................................... 4-4Table 4-2 Ranking of Sulfur Dioxide Technologies for Pulverized Coal Boilers.............................. 4-11Table 4-3 Ranking of CO Control Technology Options for Pulverized Coal-fired Boilers................ 4-14Table 4-4 Ranking of VOC Control Technology Options for Pulverized Coal-fired Boilers ............. 4-17Table 4-5 Ranking of Particulate Control Technology Options for Pulverized Coal-fired Boilers..... 4-20Table 4-6 Summary of Proposed BACT Emission Limits for PC and Auxiliary Boilers ................... 4-24Table 4-7 Summary of Proposed BACT Emission Limits for Other Sources .................................. 4-25Table 5-1 Summary of Criteria Pollutant Maximum Potential Emissions ......................................... 5-2Table 5-2 HAP Emissions Summary.............................................................................................. 5-4Table 6-1 Emission Rates and Stack Parameters for Each of the Main Boilers ............................... 6-3Table 6-2 Emission Rates and Stack Parameters for Each Auxiliary Steam Generator ................... 6-4Table 6-3 Emission Rates and Stack Parameters for Each Emergency Diesel Generator ............... 6-4Table 6-4 Emission Rates and Stack Parameters for Each Diesel Fire Water Pump ....................... 6-5Table 6-5 Adjustment Factor for 100% Load Heat Input Rate ......................................................... 6-5Table 6-6 Significant Impact Levels and PSD Increments .............................................................. 6-6Table 6-7 Regional Background Concentrations for NAAQS Analysis ............................................ 6-7Table 6-8a Maximum Predicted Air Quality Impacts from the Proposed Project: Navajo Nation..... 6-15

09417-360-250R1 v May, 2004
Table 6-8b Maximum Predicted Air Quality Impacts from the Proposed Project: New Mexico........ 6-16Table 6-9 Class II SO2 Inventory ............................................................................................... 6-17Table 6-10 Class II PM10 Inventory.............................................................................................. 6-23Table 6-11a Cumulative PSD Class II Modeling Results ............................................................... 6-27Table 6-11b Cumulative NAAQS Modeling Results....................................................................... 6-27Table 6-12 Highest Modeled PSD Increment Concentrations, Distant Class II Areas .................... 6-30Table 6-13 CALPUFF PSD Class II Regional Haze Impact Analysis, Distant PSD Class II Areas.. 6-31Table 6-14 Maximum Total Deposition, Distant PSD Class II Areas.............................................. 6-32Table 6-15 Highest Modeled PSD Class I Increment Concentrations............................................ 6-36Table 6-16 PSD Class I SO2 Inventory ........................................................................................ 6-37Table 6-17a PSD Class I SO2 Cumulative Modeling Results (FCPP Expansion Only) ................... 6-40Table 6-17b PSD Class I SO2 Cumulative Modeling Results (FCPP and SJGS Expansion)........... 6-40Table 6-18a FLAG Results Without Refinements.......................................................................... 6-42Table 6-18b FLAG Results With Refinements............................................................................... 6-43Table 6-19 Annual Average Salt Concentrations in PSD Class I Areas (from IMPROVE Data)...... 6-44Table 6-20 Maximum Total Nitrogen Deposition Over Three Years (2001-2003)........................... 6-45Table 6-21 Baseline Acid Neutralizing Capacity and Potential Changes for Lakes Within the
Modeling Domain ..................................................................................................... 6-46Table 6-22 Screening Concentrations for Soils and Vegetation .................................................... 6-50
LIST OF FIGURES
Figure 2-1 General View – Farmington Region........................................................................... 2-1Figure 2-2 Location of the Desert Rock Energy Facility in Relation to Other Generating
Stations in the Area................................................................................................. 2-3Figure 2-3 Local Terrain in the Power Plant Site Area................................................................. 2-4Figure 2-4 Facility Side View of a Boiler Unit at the Proposed Desert Rock Energy Facility .......... 2-6Figure 2-5 Detailed Plot Plan of Boiler Units............................................................................... 2-7Figure 2-6 Process Flow Diagram............................................................................................... 2-8Figure 6-1 Class II CALPUFF Modeling Domain......................................................................... 6-9Figure 6-2 Class II Receptor Grid............................................................................................. 6-10Figure 6-3 Near-Field Receptor Grid ........................................................................................ 6-11Figure 6-4 GEP Analysis Building Heights and Locations ......................................................... 6-13Figure 6-5 GEP Analysis Stack Heights and Locations............................................................. 6-14Figure 6-6 Cumulative Modeling SO2 Source Locations............................................................ 6-21Figure 6-7 Cumulative Modeling PM10 Source Locations .......................................................... 6-22Figure 6-8 Receptors for Cumulative SO2 Modeling.................................................................. 6-25Figure 6-9 Receptors for Cumulative PM10 Modeling ................................................................ 6-26Figure 6-10 Distant Sensitive PSD Class II Areas Considered in the Modeling Analysis .............. 6-29Figure 6-11 PSD Class I Areas Considered in the Modeling Analysis.......................................... 6-34Figure 6-12 PSD Class I CALPUFF Modeling Domain................................................................ 6-35Figure 6-13 PSD Class I SO2 Source Locations ......................................................................... 6-39

09417-360-250R1 vi May, 2004
This page intentionally left blank

09417-360-250R1 1-1 May, 2004
1.0 INTRODUCTION
1.1 Project Overview
Diné Power Authority (DPA), a Navajo Nation Enterprise, has contracted with Steag Power, LLC(Steag) to develop an electric power generation facility on Navajo Nation trust land. The Desert RockEnergy Facility, the “Project”, will further support the Navajo Nation by utilizing the Navajo Nation coalreserves from the nearby mine operated by BHP Billiton. Steag and DPA have a shared vision todevelop an environmentally friendly project that efficiently uses the Navajo resources and bringssubstantial benefits to the Navajo Nation and surrounding communities.
Steag has taken a holistic approach to the development and design of this facility to incorporate highefficiency with effective emission controls. Steag proposes to use their German experience andproprietary knowledge to design and build a state-of-the-art, mine-mouth coal-fired power plant, and atthe same time improve environmental protection, efficiency and reliability of large coal-fired powerplants. The Project will consist of a green-field power plant that will use two supercritical pulverizedcoal boilers, paired with steam turbines, and will be designed for a total generation capacity of 1,500MW (gross). The facility will also include three auxiliary boilers, two emergency diesel generators, twodiesel firewater pumps and all of the auxiliary equipment necessary to support the green-field powerfacility. As will be shown in this application, this equipment will generate substantial power withefficient use of the Navajo Nation coal resource and a minimum of air quality impacts.
The Project will include two dry natural draft Heller cooling tower systems to preserve the critical waterresources in the region. Water for plant maintenance will be supplied by the Navajo Nation under awater rights permit. This facility has been designed to optimize the use of water for power generationand to maximize efficiency of the plant operations.
Steag is scheduled to start construction on the first unit in 2005 in order to achieve commercialoperation of the first unit in 2008. The construction of the second unit is scheduled to follow the firstwith less than a one-year lag.
The plant will employ over 200 permanent workers and up to a peak of 3,000 workers during the threeyears of construction. Workers are expected to come from within rural areas of the Navajo Nation(~10%), most will commute from Farmington or Shiprock (~60%), and the remainder from Gallup andWindow Rock (~30%). The Navajo Nation requires preferred employment of local people, thusautomatically limiting growth in the area and reducing unemployment.
Since the proposed facility will be a “major source” of criteria air pollutants, Steag is applying for aPrevention of Significant Deterioration (PSD) permit. Because this project will be located on theNavajo Nation, and since the Navajo Nation does not yet have PSD delegation, this application isbeing submitted to the U. S. Environmental Protection Agency (EPA), in Region IX. Steag and DPAcontinue to work closely with the Navajo Nation Environmental Protection Agency concerning theProject and this application.

09417-360-250R1 1-2 May, 2004
1.2 Facility Classification
There are two major classification criteria for the proposed facility, one related to its industrial characterand the other to its potential to emit air contaminants. The designation of the facility under each ofthese is reviewed below.
1.2.1 Standard Industrial Classification (SIC) Code
The United States government has devised a method for grouping all business activities according totheir participation in the national commerce system. The system is based on classifying activities into"major groups" defined by the general character of a business operation. For example, electric, gas,and sanitary services, which include power production, are defined as a major group. Each majorgroup is given a unique two-digit number for identification. Power production activities have beenassigned a major group code “49”.
To provide more detailed identification of a particular operation, an additional two-digit code isappended to the major group code. In the case of power generation facilities the two digit code is “11”in order to define the type of production involved. Thus, the Desert Rock Energy Facility is classifiedunder the SIC code system as:
• “Major Group” 49 – “Electric, Gas, and Sanitary Services”
• Electric Services – 4911
The SIC Code system will eventually be replaced by North American Industrial Classification System(NAICS). This system's organization is similar to the SIC codes. Under this system, this facility wouldbe classified under 221112, Fossil Fuel Electric Power Generation.
1.2.2 Air Quality Source Designation
With respect to air quality, new and existing industrial sources are classified as either major or minorsources based on their potential-to-emit (PTE) air contaminants. This classification is also affected inpart by whether the area in which the source is located has attained the National Ambient Air QualityStandards (NAAQS)1 An area is classified as attainment if the ambient air quality concentration for aspecific pollutant as measured by a monitor is below the standard concentration level for a setaveraging period. The area in which the project is proposed to be located is designated as attainmentfor all the NAAQS.
1 Criteria pollutants are those for which EPA has established NAAQS and consist of particulate matter witha nominal aerodynamic diameter of 10 microns or less and 2.5 microns or less, carbon monoxide,nitrogen dioxide, sulfur dioxide, lead and ozone, which is formed through the photochemical reaction ofvolatile organic compounds and oxides of nitrogen in the atmosphere.

09417-360-250R1 1-3 May, 2004
For most activities, a major source is defined as one that has the potential-to-emit 250 tons per year(tpy) of any regulated air contaminant. For a special group of 28 industrial categories, the EPA hasdefined the major source emission threshold to be 100 tpy. Steam-Electric Power Generation is one ofthese special categories. As will be shown in Section 5.0, potential emissions from the proposedfacility will exceed the major source thresholds for Oxides of Nitrogen (NOx), Carbon Monoxide (CO),Particulates (PM/PM10), Volatile Organic Compounds (VOC), Sulfur Dioxide (SO2), and Hazardous AirPollutants (HAP). Therefore, the project will be classified as a “major stationary source” of airemissions.
1.3 Document Organization
This application addresses the permitting requirements of the federally mandated program for PSDreview (40 CFR 52.21) for a new major source. Section 2.0 provides an overview of the proposedproject and the processes covered by this application. Section 3.0 discusses the regulatory setting forthe project. Section 4.0 provides the control technology evaluation for those pollutants subject to PSDreview. Section 5.0 presents the emissions anticipated from the operation of the facility. Section 6.0presents a detailed discussion of the dispersion modeling methodology and applicable standards towhich the predicted impacts, including from a cumulative source assessment, are compared. FinallySection 7.0 references the regulatory and technical citations used in the document.
Attached to this application are:
1) a description of alternative combustion technologies,
2) supplemental information to the BACT analysis,
3) performance data and emissions calculations,
4) the modeling protocol
5) modeling files on a CD, and supplementary modeling results;
6) documentation of source information used for the cumulative analysis
7) a description of refinements used for determining regional haze impacts;
8) a threatened and endangered species analysis for the power generation site, and
9) a historical preservation act analysis for the site.
1.4 Applicant Information
Listed below are the applicant's primary points of contact and the address and phone number wherethey can be reached. This PSD application has been prepared by a third party under the direction ofSteag Power, LLC and contacts have been included for the permitting consultant as well.

09417-360-250R1 1-4 May, 2004
Applicant’s address
Corporate Office Steag Power, LLCThree Riverway, Suite 1100Houston, Texas 77056
Desert Rock Energy Facility Site Central San Juan County, New MexicoNavajo Nation Territory
Applicant’s Contact
Corporate Environmental Contact Gus Eghneim, Ph.D., P.E.Director, Environmental [email protected] (713) 499-1132FAX (713) 499-1167
Consultant’s Contacts
Permitting Consultant William Campbell, III, P.E.Project ManagerENSR International4600 Park Road, Suite 300Charlotte, NC [email protected] (704) 529-1755FAX (704) 529-1756
Permitting Consultant Sara HeadAir Permitting ManagerENSR International1220 Avenida AcasoCamarillo, CA [email protected] (805) 388-3775 x227FAX (805) 388-3577

09417-360-250R1 2-1 May, 2004
2.0 PROPOSED PROJECT
Steag, under a development agreement with the Navajo Nation’s Diné Power Authority, is proposing todevelop a technologically advanced, mine-mouth coal-fired power plant. The power plant will beerected in the Northwestern Area of New Mexico adjacent to Navajo Nation coal reserves at aoperating mine of BHP Billiton, one of the largest domestic suppliers of low-sulfur coal. The powerplant will be a supercritical pulverized coal type and is designed for a total nominal generation capacityof 1,500 MW (gross), composed of two units of 750 MW (gross) and 683 MW (net) each. Use of aonce through, supercritical steam cycle and other design features will enable this plant of be one of themost efficient dry cooled steam electric plants ever built in the United States with a net efficiencygreater than 40% based on the lower heating value of the fuel. State-of-the-art emission controls willbe used to minimize emissions of potential air pollutants. Water consumption will be minimized byusing a Heller system, dry natural draft cooling tower. Solid wastes produced by combustion of thecoal and the air pollution control system will be returned to the mine.
2.1 Project Location
The Desert Rock Energy Facility will be located on a ~580 acre site close to the Navajo Nation coalreserves leased to BHP Billiton in Northwest New Mexico. The site location is ~25 miles Southwest ofFarmington, San Juan County, New Mexico in the Navajo Indian Reservation as shown in Figure 2-1.The site can be accessed via Highway 249 from Shiprock, NM and further on Indian Service Routes tobe improved for transportation purposes by grading, drainage and paving. No transportation iscurrently available by railway.
Figure 2-1 General View – Farmington Region

09417-360-250R1 2-2 May, 2004
Figure 2-2 shows the location of the transmission line routes for the Desert Rock Energy Facility, aswell as other power plants in the area. Figure 2-3 provides an impression of the project site. Theproject site can be characterized by open flat prairie. Chaco River is a slow creek with extendedwetlands, which may fall dry during summer season.
2.2 Desert Rock Energy Facility Combustion Technology Selection
Four technologies may be considered for a new large coal fueled power plant as listed below:
• Pulverized Coal Combustion (sub-critical steam production)
• Pulverized Coal Combustion (supercritical steam production)
• Circulating Fluidized Bed (CFB) Combustion
• Integrated Gasification Combined Cycle (IGCC)
These four technologies are discussed further in Attachment 1. The choice of technology for a specificproject is affected by many variables including, but not limited to, project location, the size of theproject, fuel cost and source or sources, land or space availability, the developer’s experience with atechnology, electricity markets and many other factors. These variables affect the capital cost,operating cost, technological risks, and environmental impacts in different ways for each specificproject. Key factors that affected the decision to select a pulverized coal-fired supercritical boiler forthe Desert Rock Energy Facility are highlighted in this section.
Steag, under a development agreement with DPA, is proposing a green-field, stand alone 1,500 MWgross power plant at a mine-mouth site in New Mexico using two large, high efficiency, supercriticalpulverized coal-fired boilers. Economies of scale are favorable for these large units and the fuel toelectricity efficiency of above 40%, including dry cooling, is very high. The plant will have a singlesource of fuel, the adjacent mine, so fuel flexibility is not critical. Air pollutant emissions can becontrolled to very low levels using state-of-the-art emission controls. Solid wastes generated bycombustion of the coal and the air pollution control system can be returned to the mine.
Sub-critical pulverized coal-fired boilers would be similar to the planned supercritical pulverized coal-fired boilers except that the fuel to electricity efficiency would be significantly lower. At a typicalefficiency of about 30 to 35% a sub-critical pulverized coal-fired boiler would burn 15 to 20% more fuelthan a supercritical boiler to produce the same amount of electricity. It would also produce 15 to 20%more ash for the same output. Steag’s evaluation favored a supercritical boiler, in part, due to the highefficiency and lower emissions associated with burning less fuel. Therefore, the option to install a sub-critical boiler was rejected.

09417-360-250R1 2-3 May, 2004
Figure 2-2 Location of the Desert Rock Energy Facility in Relation to Other Generating Stations in the Area

09417-360-250R1 2-4 May, 2004
Figure 2-3 Local Terrain in the Power Plant Site Area
CFBs are not currently operating in supercritical steam cycles so efficiencies are similar to sub-criticalpulverized coal-fired boilers. Although a possible advantage of a CFB is fuel flexibility, this is not afactor for the planned mine mouth power project. Limitations on the size of a CFB boiler would require4 to 6 CFB boilers instead of the planned 2 PC boilers. For the planned project, two supercritical PCboilers are favored over the CFB option.
IGCC is a developing technology that may offer high thermal efficiencies. The three projects built todate in the U.S. have been demonstration projects partially funded by the Department of Energy. Nocoal based IGCC plants have been built in the U.S. without government funding. Steag EncotecGmbH, a 100% owned subsidiary of Steag AG, has designed, built and operated IGCC systems inEurope with limited success. Steag AG, the parent company of both Steag Power (the developmentarm in the U.S.) and Steag Encotec (the engineering arm in Germany), is believed to have operatedthe very first IGCC unit. Steag AG operated this 170 MW IGCC plant in Europe in the 1970s toexperiment with the long-term reliability and availability of the unit. They found the IGCC technology tobe a very complex and capital intensive technology that is subject to availability problems. AlthoughIGCC is cost competitive in many worldwide locations when using petroleum residual feed stocks, it isnot economically competitive when using coal. IGCC is not a pollution free technology. Instead,emissions from an IGCC plant are well controlled by a complex and expensive array of gas cleaningsystems that are required to clean the syngas in order to protect the gas turbine. IGCC is not currentlyan available or commercially viable technology for a 1,500 MW commercial coal-fired power plant.Therefore, the IGCC option was rejected for the planned project.
Table 2-1 presents a comparison of the performance data for the four coal combustion technologiesidentified above. Pulverized Coal combustion and IGCC have virtually no inherent emission controland must rely solely on back end add-on pollution control equipment. Circulating fluidized beds areinherently lower emitting combustion processes, and this technology actually prevents SO2 and NOx
from being emitted from the process in the first place. The control of SO2 for CFB includes adsorbent

09417-360-250R1 2-5 May, 2004
injection, which is also necessary to burn the coal in suspension – it is therefore inherent to theprocess itself. Similarly, staged combustion, low temperature combustion and ammonia injectiondirectly into the solids separation stage of the CFB prevents NOx from being emitted prior to the airpollution control train, and is also inherent to the technology. In order to permit a new coal-firedgeneration facility using any coal combustion technology will require best available emission controllevels that are as low or lower than the current state-of-the-art – hence, “Clean Coal Technology”.
Table 2-1Range of Emissions Control from Coal Combustion Technologies
Coal Technology Efficiency (%) %NOx Controlled %SO2 Removed
Sub-critical PC 34 to 37 90% (add-on) 92-96% (add-on)
Supercritical PC 39 to 45 90% (add-on) 92-96% (add-on)
CFB 1 34 to 37 50 to 80% 75 to 92%
IGCC 38 to 45 2 70 to 90% 90 to 99.9%1. Dependent on sorbent activity and injection rate.2. Currently operating plants do not achieve 45% efficiency.Source: World Bank.
2.3 Desert Rock Energy Facility Diagrams
A plot plan for the facility is shown in Figure 2-4, a side view is shown in Figure 2-5, and a process flowdiagram is shown in Figure 2-6.
2.4 Process Equipment Description
This section describes the major equipment and components of the Desert Rock Energy Facility.
2.4.1 Coal Handling
Low sulfur blended coal from Navajo Nation at the BHP Billiton New Mexico Coal mine will bedelivered to the project site by conveyor. A passive or inactive coal pile will be built on the site foremergency purposes. Normal preparation, blending (if necessary), and storage will be handled bythe mine on their property. The conveyor from the BHP Billiton mine will move coal through aseries of enclosed transfer houses where the coal will drop onto conveyors for transport tobunkers provided for each boiler. From the bunkers, coal is fed through pulverizers to the boilers.

09417-360-250 May, 20042-6
Figure 2-4 Facility Side View of a Boiler Unit at the Proposed Desert Rock Energy Facility

09417-360-250 May, 20042-7
Figure 2-5 Detailed Plot Plan of Boiler Units

09417-360-250R1 May, 2004
2-8
Figure 2-6 Process Flow Diagram

09417-360-250R1 May, 2004
2-9
This on-site coal pile will be covered or sealed to prevent emissions and spontaneous combustion.Conveyors are totally enclosed to prevent emissions. Dust suppression, enclosures, or baghouses willbe used as appropriate to control emissions from material transfer points and the coal bunkers. Coalspecifications are presented in Table 2-2.
Table 2-2Fuel Data for Main Boilers
Units Design Fuel Fuel Range
1. Fuel quality (coal) proximate analysis
Higher heating value (HHV) Btu/lb (kJ/kg) 8,910 (20,725) 8,550 - 9,380(19,887 - 21,818)
Lower heating value (LHV)or net calorific value Btu/lb (kJ/kg) 8,479 (19,723)
Total moisture % 14.2 13.4 – 15.6
Ash content % 20.5 17.6 – 23.4
Sulfur % 0.82 < 1.2
Volatile matter % 31.7 27.6 – 36
Coal particle size In 0-2 0-2
Percentage of outsize particle size % 10 10
Max. coal particle size In 4 4
2. Ultimate analysis
Carbon % wt. 56.38 41.96 – 70.26
Hydrogen % wt. 2.99 1.81 – 4.29
Oxygen (balance) % wt. 6.8 2.36 – 15.42
Nitrogen % wt. 1.00 0.56 – 1.47
Sulfur % wt. 0.82 0.59 – 0.98
Chlorine % wt. 0.01 = 0.03
Fluorine % wt. 0.01 = 0.05
Mercury Ppm 0.046 0.2
2.4.2 Pulverized Coal-fired Boilers
The power plant will be of the supercritical pulverized coal type and is designed for a total nominalgeneration capacity of 1,500 MW (gross) divided into two units of 750 MW (gross) and 683 MW (net)each. Each boiler will have a heat input of capacity of approximately 6,800 MMBtu/hr (extrememaximum) and will burn up to 382 tons/hour of coal. In the supercritical cycle, steam is produced at3,626 psi and 1,112 °F at a rate of 4,636,000 lb/hour. The high-pressure steam is fed through a steamturbine generator to generate electricity and then to a direct contact jet condenser.

09417-360-250R1 May, 2004
2-10
Air pollution controls for the pulverized coal-fired boilers will consist of the following:
• Low-NOx burners and selective catalytic reduction (SCR) to control NOx emissions;
• Low sulfur coal, hydrated lime injection before a fabric filter, and wet limestone flue gasdesulfurization to control SO2 emissions;
• Hydrated lime injection before a fabric filter, and wet limestone flue gas desulfurization tocontrol acid gas emissions including sulfuric acid mist;
• Activated carbon injection (if needed), hydrated lime injection before a fabric filter, and wetlimestone flue gas desulfuriation to control mercury emissions;
• A fabric filter to control particulate emissions; and
• Good combustion to control CO and VOC emissions.
2.4.3 Cooling Towers
A direct contact jet condenser will be used with a Heller dry cooling tower system. In this coolingsystem, the process steam from the steam turbine is fed to the condenser and condensed bydirect cooling with the cooling water coming from the cooling cycle. The blended cooling waterand condensate are collected in the hot-well and extracted by circulating water pumps.Approximately 2% of this flow – corresponding to the steam condensed – is fed to the boiler feedwater system by condensate pumps. The major part of the flow is returned to the cooling towerfor recooling. The cooling duty is performed by the cooling deltas, divided into parallel sectors,where cooling air flow is induced by a natural draft dry cooling tower.
The Heller-type hybrid cooling tower is used to minimize water consumption. When the ambienttemperature is below 80 °F, the cooling tower operates like a natural draft dry cooling tower. When thetemperature exceeds 80 °F, the facility has the option of applying water oversprays on the heatingsurfaces inside of the cooling tower to provide additional cooling. This type of cooling tower has noparticulate emissions.
2.4.4 Auxiliary Boilers
Three auxiliary steam generators provide auxiliary steam demand during stand still and start up of themain steam generator (auxiliary steam consumers: dearator, atomizing steam for oil firing not amechanical atomizer in use, steam air heater, turbine seals etc). The auxiliary steam generators are offire-tube/smoke-tube type (package boilers, shell type). Each auxiliary steam generator has a heatinput capacity of 86.4 MMBtu/hour. Emission are controlled by only burning low sulfur (0.05% sulfur)distillate oil, Low-NOx burners, good combustion, and limiting operation to an average of 1,650hours/year for the three boilers (equivalent to a total maximum annual fuel use in the three boilers of142,560 MMBtu/year at full load operation).

09417-360-250R1 May, 2004
2-11
2.4.5 Emergency Diesel Generators and Firewater Pumps
There will be two emergency diesel generators with capacities of 1,000 kW and two firewater pumpswith capacities of 180 kW. Emission will be controlled by only burning low sulfur (0.05% sulfur)distillate oil, ignition timing retard with turbocharging and aftercooling, good combustion, and limitingnormal operation to a maximum of 100 hours/year per engine.
2.4.6 Fuel Oil Supply
Low sulfur distillate oil (0.05% sulfur) will be used for startup of the pulverized coal-fired boilers andoperation of three auxiliary boilers. Oil will be delivered to the site by truck, unloaded at one of twounloading stations and stored in a 1.1 million gallon tank.
2.4.7 Limestone Supply
Ground limestone is delivered to the site by trucks and pneumatically conveyed to a limestone storagesilo. The silo will be equipped with a baghouse to control PM10 emissions. Limestone will bewithdrawn from the bottom of the silo by a rotary vane feeder and transported to the limestone slurrytank where it is mixed with water. The limestone slurry will be used in the wet flue gas desulfurizationsystem.
2.4.8 Hydrated Lime and Activated Carbon Supply
Hydrated lime and activated carbon, if needed, will be delivered to the site by trucks and pneumaticallyconveyed to storage silos. The silos will be equipped with a baghouse to control PM10 emissions.Hydrated lime will be injected in the duct prior to the fabric filter to control acid gas emissions.Activated carbon will be injected, if necessary, in the duct prior to the fabric filter to control mercuryemissions.
2.4.9 Anhydrous Ammonia Supply
Anhydrous ammonia will be delivered to the site by truck for storage in a pressurized tank. There areno air pollutant emissions from the pressurized storage tanks. The anhydrous ammonia systemconsists of all equipment required to unload, compress, store, transfer, vaporize, dilute, and convey theammonia/air mixture into the ammonia injection grid upstream of the selective catalytic reductionsystem.
2.4.10 Ash Handling
Fly ash will be collected by the main fabric filter. The pulverized coal-fired boiler will generate bottomash. Fly ash and bottom ash will be mixed in an ash silo. Emissions from the ash silo will becontrolled by a fabric filter. Gyspum, with a water content in the 10% to 20% range, will be generatedby the wet flue gas desulfurization system. The gypsum fly ash and bottom ash will be mixed togetherand then transported back to the mine by a conveyor.

09417-360-250R1 May, 2004
2-12
This page intentionally left blank

09417-360-250R1 May, 2004
3-1
3.0 REGULATORY SETTING
This project will be built on Navajo Nation trust land leased from the Navajo Nation through the U.S.Department of Interior. As a federally recognized tribe, the Navajo Reservation is consideredsovereign land and is not subject to the regulations of the State of New Mexico. They are subject tothe U.S. Environmental Protection Agency (EPA) regulations as are individual States. Air Permittingfor this project will be under the jurisdiction of EPA Region IX, since the majority of the Navajo Nation islocated in Arizona. All local regulations will be administered by the Navajo Nation EPA (NN EPA)which have been adopted for the most part from the New Mexico Environmental Department (NMED)regulations. The Navajo Nation has not been delegated authority under the Clean Air Act to issue aPrevention of Significant Deterioration permit by EPA, so the PSD permit will be issued by EPA RegionIX. DPA and Steag are continuing to coordinate with NN EPA on the Project.
This section presents a review of the air quality regulatory requirements applicable to the constructionand operation of the Desert Rock Energy Facility.
3.1 Ambient Air Quality Standards and Current Attainment Status
National Ambient Air Quality Standards (NAAQS) are established for specific air pollutants based onhealth effects criteria. The NAAQS for these criteria pollutants are expressed as total concentrations ofthe pollutants in the air to which the general public is exposed. The NAAQS are presented in Table3-1. The facility will be located near Farmington, San Juan County, New Mexico. This area is part ofNew Mexico Air Quality Control Region (AQCR) 014. The current air quality of the AQCR, based onactual measurement data, is better than the NAAQS. Thus AQCR 014 is designated as attaining theNAAQS for all criteria pollutants.
Similar to the NAAQS, New Mexico has state ambient air quality standards (NMAAQS). The NMAAQSare defined in Section 20.2.3 NMAC of the New Mexico Air Quality Regulations and are listed in Table3-2. The current air quality of the AQCR is also better than the NMAAQS.
The Desert Rock Energy Facility will be required to demonstrate that it will neither cause nor contributeto a violation of either the NAAQS or the NMAAQS. The NMAAQS apply only in the area in NewMexico located outside the Navajo Nation.
Major new sources located in attainment areas are required to obtain a PSD permit prior to initiation ofconstruction.

09417-360-250R1 May, 2004
3-2
Table 3-1Ambient Air Quality Standards
National AAQS1
Pollutant
Averaging
Period2 Primary Secondary
Annual 80 --3
24-hour 365 --3SO2
3-hour --3 1,300
Annual 50 50PM10
24-hour 150 150
Annual 15 15PM2.5
24-hour 65 65
8-hour 10,000 --3
CO1-hour 40,000 --3
1-hour 235 235Ozone
8-hour 157 157
NO2 Annual 100 100
Lead 3-month 1.5 --3
1. All standards in this table are expressed in µg/m 3.
2. National short-term ambient standards may be exceeded once per year; annual standardsmay never be exceeded. Ozone standard is attained when the expected number of days of anexceedance is equal to or less than one.
3. No ambient standard for this pollutant and/or averaging period.
Source: 40 CFR 52.21

09417-360-250R1 May, 2004
3-3
Table 3-2New Mexico Ambient Air Quality Standards
Pollutant Averaging Period Air Quality Standard
Annual1 0.050 ppmNO2
24-hour 0.01 ppm
Annual1 0.02 ppmSO2
24-hour 0.10 ppm
Annual2 60 µg/m3
30-day 90 µg/m3
7-day 110 µg/m3TSP
24-hour 150 µg/m3
8-hour 8.7 ppmCO
1-hour 13.1 ppm
H2S 1-hour 0.0103 ppm
1. Arithmetic Mean2. Geometric mean3. For the entire State with the exception of Pecos-Permian Basin Intrastate
AQCR, no to be exceeded more than once per year.Source: 20.2.3 NMAC
3.2 Prevention of Significant Deterioration (PSD) Requirements
PSD review applies to specific pollutants for which a project is considered major and the project area isdesignated as attainment or unclassified with respect to the NAAQS. For a new facility to be subject toPSD review, the project’s potential to emit (PTE) must exceed the PSD major source thresholds, whichare:
• 100 tpy if the source is one of the 28 named source categories, or
• 250 tpy for all other sources
The Desert Rock Energy Facility is one of the 28 named categories, specifically a fossil fuel firedsteam-generating plant with heat input greater than 250 MMBtu/hour. As such, the applicable PSDthreshold is 100 tpy. Once it is determined that a pollutant exceeds the PSD major source threshold,additional pollutants will be subject to PSD review if their potential to emit (PTE) exceeds the PSDSignificant Emission Rates. Table 3-3 compares the Desert Rock Energy Facility annual PTE with thePSD significant emission rates. As shown in the table, the Desert Rock Energy Facility’s PTE isestimated to be greater than the PSD significant emission rates for these PSD pollutants. PSD reviewand approval will therefore be required for these pollutants.

09417-360-250R1 May, 2004
3-4
Table 3-3Comparison of Desert Rock Energy Facility Annual PTE to the PSD Thresholds
PollutantPSD Significant Emission Rate
(tpy)Project PTE 1
(tpy)
CO 100 5,529
NOx 40 3,325
SO2 40 3,319
Particulate Matter (TSP/PM)2 25 570
PM103 15 1,120
Ozone (VOC) 40 166
Lead 0.6 11.1
Fluorides 3 13.3
Sulfuric Acid Mist (H2SO4) 7 221
1. Assumes 95 percent annual capacity factor at full load emissions.2. PM is defined as filterable particulate matter as measured by EPA Method 5.3. PM10 is defined as solid particulate matter smaller than 10 micrometers diameter as measured by EPA
Method 201 or 201A plus condensable particulate matter as measured by EPA Method 202. Because PM10
includes condensable particulate matter and PM does not include condensable particulate matter, PM10
emissions are higher than PM emissions.
3.2.1 Best Available Control Technology
A PSD source must conduct an analysis to ensure the application of the Best Available ControlTechnology (BACT), to emissions of pollutants subject to PSD review. Guidelines for the evaluation ofBACT can be found in EPA's Cost Control Manual (EPA 1996, 2002) and in the PSD/NSR WorkshopManual (EPA 1990 DRAFT). These guidelines were prepared by EPA to provide a consistentapproach to BACT and to ensure that the impacts of alternative emission control systems aremeasured by the same set of parameters.
3.2.2 Air Quality Monitoring Requirements
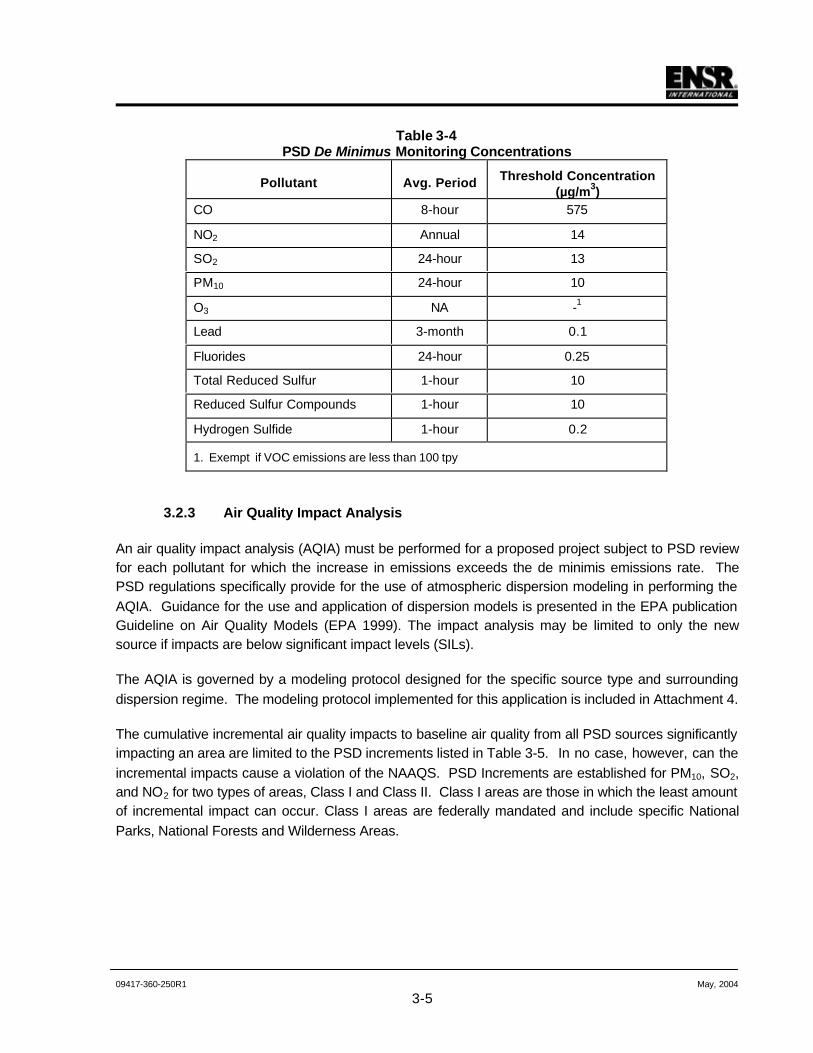
In accordance with requirements of 40 CFR 52.21(m), any application for a PSD permit must containan analysis of existing ambient air quality data in the area to be affected by the proposed project. Thedefinition of existing air quality can be satisfied by air measurement data from either a state-operatedor private network, or by a pre-construction monitoring program that is specifically designed to collectdata in the vicinity of the proposed source. This condition may be waived if the project would cause animpact less than EPA-specified de minimis monitoring levels established by the EPA. The de minimismonitoring levels are listed in Table 3-4.
09417-360-250R1 May, 2004
3-5
Table 3-4PSD De Minimus Monitoring Concentrations
Pollutant Avg. Period Threshold Concentration(µg/m3)
CO 8-hour 575
NO2 Annual 14
SO2 24-hour 13
PM10 24-hour 10
O3 NA -1
Lead 3-month 0.1
Fluorides 24-hour 0.25
Total Reduced Sulfur 1-hour 10
Reduced Sulfur Compounds 1-hour 10
Hydrogen Sulfide 1-hour 0.2
1. Exempt if VOC emissions are less than 100 tpy
3.2.3 Air Quality Impact Analysis
An air quality impact analysis (AQIA) must be performed for a proposed project subject to PSD reviewfor each pollutant for which the increase in emissions exceeds the de minimis emissions rate. ThePSD regulations specifically provide for the use of atmospheric dispersion modeling in performing theAQIA. Guidance for the use and application of dispersion models is presented in the EPA publicationGuideline on Air Quality Models (EPA 1999). The impact analysis may be limited to only the newsource if impacts are below significant impact levels (SILs).
The AQIA is governed by a modeling protocol designed for the specific source type and surroundingdispersion regime. The modeling protocol implemented for this application is included in Attachment 4.
The cumulative incremental air quality impacts to baseline air quality from all PSD sources significantlyimpacting an area are limited to the PSD increments listed in Table 3-5. In no case, however, can theincremental impacts cause a violation of the NAAQS. PSD Increments are established for PM10, SO2,and NO2 for two types of areas, Class I and Class II. Class I areas are those in which the least amountof incremental impact can occur. Class I areas are federally mandated and include specific NationalParks, National Forests and Wilderness Areas.

09417-360-250R1 May, 2004
3-6
Table 3-5Allowable PSD Increments and Significant Impact Levels (µg/m3)
PSD Increments SignificantImpact LevelsPollutant Averaging Time
Class I Class II Class II
Annual Arithmetic Mean 4 17 1PM10
24-hour Maximum 8 30 5
Annual Arithmetic Mean 2 20 1
24-hour Maximum 5 91 5SO2
3-hour Maximum 25 512 25
8-hour Maximum NA NA 500CO
1-hour Maximum NA NA 2,000
NO2 Annual Arithmetic Mean 2.5 25 1NA = Not applicable, i.e., no standard exists for this pollutant or averaging periodSource: 40CFR50; 40CFR52.21, 40CFR51.165
3.2.4 Additional Impacts Analyses
The additional impact analysis consists of three elements:
1. Growth
2. Soils and Vegetation Impacts
3. Visibility Impairment
The growth analysis projects air pollutant emissions associated with industrial, commercial, andresidential growth in direct support of the new source. Residential growth includes housing foremployees entering the region while industrial and commercial growth includes new sources providinggoods and services to the new employees and to the proposed source.
The analysis of impacts on soils and vegetation in the source’s impact area compares the total airquality impacts to concentrations known to cause harmful effects to the resident species. The visibilityimpairment analysis addresses impacts that occur within the impact area of the proposed new source,beginning with an initial screening for possible impairment and, if warranted, a more in-depth analysiswith computer modeling. The local visibility impairment analysis is distinct from the visibility impairmentanalysis required for PSD Class I areas, discussed below.

09417-360-250R1 May, 2004
3-7
3.2.5 PSD Class I Area Analysis
In addition to the analysis of PSD Class I Increment compliance, the PSD Class I analysis must alsoaddress impacts to special attributes of a Class I area that deterioration of air quality may adverselyaffect. Such attributes are referred to as Air Quality Related Values and are specified by the FederalLand Manager (FLM) of the respective Class I area. These analyses generally include visibilityimpacts, such as plume blight or contribution to region haze, and impacts from acid deposition.
3.3 Good Engineering Practice Stack Height Analysis
EPA regulations require the degree of emission limitation required for control of any pollutant not to beaffected by a stack that exceeds the Good Engineering Practice (GEP) height. GEP height is reflectiveof the height necessary to avoid having the exhaust caught in the downward flow of air currentscreated by structural and or ground effects, referred to as downwash. The portion of a stack, if any,that exceeds GEP height as defined by EPA cannot be used in atmospheric modeling of the source'simpacts. Conversely, the dispersion modeling of emissions from stacks below GEP height must reflectthe downwashing effects.
3.4 New Source Performance Standards
New Source Performance Standards (NSPS) apply to all sources within a given source category,regardless of geographic location or NAAQS attainment status. The standards define emissionlimitations that would be applicable to a particular source group. For PSD sources, BACT can be noless stringent than any applicable NSPS. The NSPS (contained in 40 CFR 60) applicable to theproject will include:
• Subpart A – General Provisions
• Subpart Da – Electric Utility Steam Generating Units
• Subpart Dc – Standards of Performance for Industrial-Commercial-Institutional SteamGenerating Units
• Subpart Y – Coal Preparation Plant
• Subpart OOO – Nonmetallic Mineral Processing Plant
• Subpart Kb – Volatile Organic Storage Vessels
3.4.1 Subpart A - General Provisions
Certain provisions of 40 CFR Part 60 Subpart A apply to the owner or operator of any stationarysource subject to a NSPS. Since the two supercritical pulverized coal-fired boilers (Subpart Da), thethree auxiliary boilers (Subpart Dc) and coal handling/processing (Subpart Y) will be subject to aNSPS, the Desert Rock Energy Facility will be required to comply with all applicable provisions ofSubpart A. Subpart A provisions which impose requirements on the Desert Rock Energy Facility areidentified in Table 3-6.

09417-360-250R1 May, 2004
3-8
Table 3-6Summary of Regulatory Requirements of NSPS Subpart A – General Provisions
40 CFR SubpartA Section
Requirement Compliance Action
60.7 Initial notification andrecordkeeping
Steag will submit all NSPS related notificationsto EPA Region IX for the proposed project in atimely manner.
60.8 Performance Tests Steag will conduct all required performance testsusing designated reference test methods.
60.11 Compliance with standardsand maintenancerequirements
Steag will operate and maintain the units usinggood air pollution control practices
60.13 Monitoring requirements Required pollutant monitoring pursuant to NSPSwill utilize methods outlined in 60.13.
60.19 General notification andreporting requirements
All NSPS reports and notification will follow theformat and schedule set forth in 60.19.
3.4.2 Subpart Da - Standards Of Performance For Electric Utility Steam GeneratingUnits
Subpart Da regulations apply to steam generating units for which construction, modification, orreconstruction commenced after September 18, 1978 and that have a heat input capacity of greaterthan 250 million Btu/hour. Since the coal fired boilers will have a heat input greater than 250MMBtu/hr and meet the “steam generating unit” definition, they will be subject to Subpart Da.
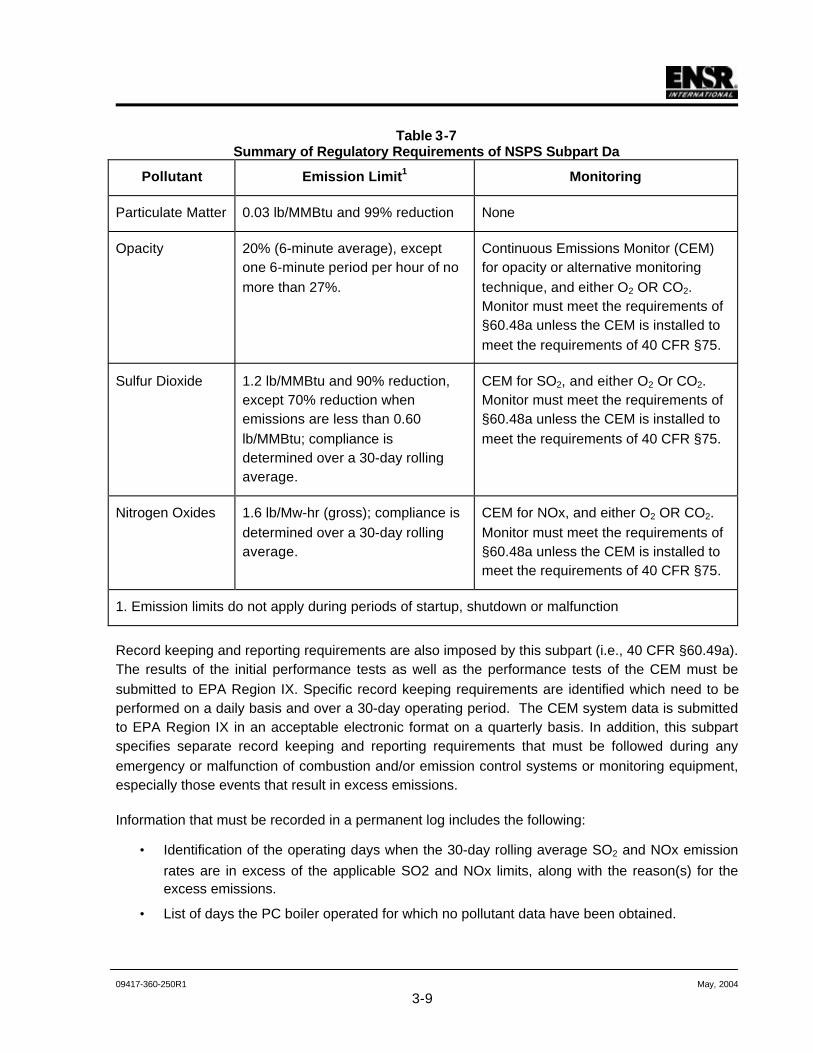
Subpart Da specifies emissions limitations, monitoring, reporting and record keeping requirementsfor PM, NOx, SO2 and opacity. A summary of the emission limitations and monitoring devicerequirements for each regulated pollutant is provided in Table 3-7.
The Desert Rock Energy Facility will be required to install a continuous emissions monitor (CEM) foropacity, SO2 and NOx pursuant to 40 CFR §60.47a(a), (b) and (c) and a CEM for O2 or CO2 pursuantto 40 CFR §60.47a(d). An initial performance test is required to demonstrate compliance withparticulate matter, opacity, NOx and SO2 emission standards in accordance with the test methodsspecified in §60.48a. Compliance with the NOx and SO2 standards will be determined based on a 30-day rolling average of NOx and SO2 emissions as measured by the CEMS.
09417-360-250R1 May, 2004
3-9
Table 3-7Summary of Regulatory Requirements of NSPS Subpart Da
Pollutant Emission Limit1 Monitoring
Particulate Matter 0.03 lb/MMBtu and 99% reduction None
Opacity 20% (6-minute average), exceptone 6-minute period per hour of nomore than 27%.
Continuous Emissions Monitor (CEM)for opacity or alternative monitoringtechnique, and either O2 OR CO2.Monitor must meet the requirements of§60.48a unless the CEM is installed tomeet the requirements of 40 CFR §75.
Sulfur Dioxide 1.2 lb/MMBtu and 90% reduction,except 70% reduction whenemissions are less than 0.60lb/MMBtu; compliance isdetermined over a 30-day rollingaverage.
CEM for SO2, and either O2 Or CO2.Monitor must meet the requirements of§60.48a unless the CEM is installed tomeet the requirements of 40 CFR §75.
Nitrogen Oxides 1.6 lb/Mw-hr (gross); compliance isdetermined over a 30-day rollingaverage.
CEM for NOx, and either O2 OR CO2.Monitor must meet the requirements of§60.48a unless the CEM is installed tomeet the requirements of 40 CFR §75.
1. Emission limits do not apply during periods of startup, shutdown or malfunction
Record keeping and reporting requirements are also imposed by this subpart (i.e., 40 CFR §60.49a).The results of the initial performance tests as well as the performance tests of the CEM must besubmitted to EPA Region IX. Specific record keeping requirements are identified which need to beperformed on a daily basis and over a 30-day operating period. The CEM system data is submittedto EPA Region IX in an acceptable electronic format on a quarterly basis. In addition, this subpartspecifies separate record keeping and reporting requirements that must be followed during anyemergency or malfunction of combustion and/or emission control systems or monitoring equipment,especially those events that result in excess emissions.
Information that must be recorded in a permanent log includes the following:
• Identification of the operating days when the 30-day rolling average SO2 and NOx emissionrates are in excess of the applicable SO2 and NOx limits, along with the reason(s) for theexcess emissions.
• List of days the PC boiler operated for which no pollutant data have been obtained.

09417-360-250R1 May, 2004
3-10
• Identification of the times when emissions data have been excluded from the calculation ofaverage emission rates and the reason(s) why.
• Identification of the “F” Factor, method of determination, and type of fuel combusted.
The “F” Factor will be determined during initial performance testing. If the “F” Factor isrecalculated during subsequent testing, the change will be noted in the quarterly reportssubmitted to EPA Region IX.
• Identification of the times when the pollutant concentration exceeds full span on the CEM.
• Description of any modifications made to the CEMS equipment.
• Results of the daily CEM drift tests and quarterly accuracy assessment. Daily drift tests willbe performed and recorded in the Data Acquisition Handling System (DAHS), but notsubmitted to EPA Region IX. Failed drift tests will be noted in the quarterly reports submittedto EPA Region IX.
Excess emission reports, including all of the record keeping data noted above, must be submittedquarterly. Otherwise, semi-annual reports will need to be prepared and submitted to supplement thequarterly excess emission report. All records must be maintained for at least two years following thedate of the record.
3.4.3 Subpart Dc - Standards Of Performance For Small Industrial-Commercial-Institutional Steam Generating Units
Subpart Dc regulations apply to each steam generating unit for which construction, modification, orreconstruction is commenced after June 9, 1989 and that has a maximum design heat input capacityof 29 megawatts (100 MMBtu/hr) or less, but greater than or equal to 2.9 MW (10 MMBtu/hr). Thissubpart would therefore apply to the three auxiliary boilers, which are rated at a heat input capacity of86.4 MMBtu/hr.
For SO2 emissions standards, Subpart Dc 60.42c(d) applies to this equipment. It states, “On and afterthe date on which the initial performance test is completed or required to be completed under Sec.60.8 of this part, whichever date comes first, no owner or operator of an affected facility that combustsoil shall cause to be discharged into the atmosphere from that affected facility any gases that containSO2 in excess of 215 ng/J (0.50 lb/million Btu) heat input; or, as an alternative, no owner or operator ofan affected facility that combusts oil shall combust oil in the affected facility that contains greater than0.5 weight percent sulfur.” The SO2 emission limits and fuel oil sulfur limits under this section apply atall times, including periods of startup, shutdown, and malfunction.
For particulate emissions standards, Subpart Dc 60.43c(c) applies to this equipment. It states, “Onand after the date on which the initial performance test is completed or required to be completed underSec. 60.8 of this part, whichever date comes first, no owner or operator of an affected facility thatcombusts coal, wood, or oil and has a heat input capacity of 8.7 MW (30 million Btu/hr) or greater shallcause to be discharged into the atmosphere from that affected facility any gases that exhibit greaterthan 20 percent opacity (6-minute average), except for one 6-minute period per hour of not more than

09417-360-250R1 May, 2004
3-11
27 percent opacity.” The PM and opacity standards under this section apply at all times, except duringperiods of startup, shutdown, or malfunction.
Subpart Dc requires notification of the date of construction or reconstruction, anticipated startup, andactual startup, of the facility. The design and annual capacity factors must be included in thisnotification.
3.4.4 Subpart Y – Coal Preparation Plant
Although the coal supply for the Desert Rock Energy Facility will be from the adjacent Navajo Nationcoal reserves leased to the BHP Billiton mine, the power plant will have a coal handling system. Thecoal handling system is subject to the provisions of Subpart Y for Coal Preparation Plants, whichhave been promulgated at 40 CFR §60.250 et seq. These provisions apply to affected facilities inwhich coal preparation plants process more than 181 Mg (200 tons) per day of coal. The affectedfacilities at the power plant include the coal processing and conveying equipment, coal storagesystems and coal transfer and loading systems.
Subpart Y limits the opacity to 20% from any coal processing and conveying equipment, coalstorage system or coal transfer and loading system processing coal. The Desert Rock coal handlingsystem is designed with dust suppression, containment, collection and enclosures that will limit theopacity to less than 20%.
Subpart Y requires an initial performance test using EPA-approved test methods to demonstratecompliance with the aforementioned emission limits. Opacity is verified by Reference Method 9 andprocedures described in 40 CFR §60.11.
3.4.5 Subpart OOO – Nonmetallic Mineral Processing Plant
Subpart OOO applies to certain activities at nonmetallic mineral processing plants. Limestone, whichwill be used for the emissions control systems, is classified as a nonmetallic mineral. Therequirements of Subpart OOO will apply to limestone material handling activities at the Desert RockEnergy Facility such as transfer, silos/storage bins, and loading.
The requirements of Subpart OOO include an emission limit of 0.022 gr/dscf and 7% opacity on stackemissions from transfer points, 10% opacity from fugitive emissions from belt conveyors, 15% opacityfrom fugitive emissions from crushers, and 7% opacity from baghouse emissions from storage binsrelated to limestone handling systems. Compliance will be determined using EPA Reference Method 5for stack emissions and Reference Method 9 for opacity determinations. Reporting will follow therequirements contained in §60.675.
3.4.6 Subpart Kb – Volatile Organic Liquid Storage Vessels
Distillate oil fuel for the auxiliary boiler and emergency engines will be stored on-site in a 1.1 milliongallon tank. A new tank of this size will be subject to Subpart Kb. Due to the low vapor pressure of

09417-360-250R1 May, 2004
3-12
distillate oil, this tank will be exempt from all provisions of Subpart Kb as specified in §60.110b(c)except for the design capacity recordkeeping requirements at 40 CFR §60.116b(a).
3.5 National Emissions Standards for Hazardous Air Pollutants
National Emissions Standards for Hazardous Air Pollutants (NESHAP) are reflected in a requirementfor Maximum Achievable Control Technology (MACT) standards, determined by EPA through ananalysis of the best controlled sources in a category and the cost of more stringent available controls.A new source emitting more than 10 tons per year of a single Hazardous Air Pollutant (HAP) or 25 tonsper year of a combination of HAPs is defined as a major source and must secure MACT approval priorto construction. If a MACT standard has not yet been promulgated for the source category, theapplicant must secure case-by-case MACT approval (Subpart B).
A MACT standard for the oil- and coal-fired electric utility steam generating unit source category hasnot yet been promulgated, but a regulation (Subpart UUUUU) was proposed in January 2004, with asupplementary notice in March 2004. MACT standards for industrial boilers (Subpart DDDDD) andinternal combustion engines (Subpart ZZZZ) have also been proposed, and final rules have beensigned but not yet been published in the Federal Register. Since the project is expected to be a majorsource of HAP, a case-by-case MACT approval will be required if these proposed regulations are notfinalized prior to PSD permit issuance. Even if not finalized during permit application processing for theDesert Rock Energy Facility, the proposed MACT standards will be used as needed for a case by casedetermination.
3.6 Title V – Major Source Operating Permit
Currently, the Navajo Nation has not been delegated authority for the Title V program. Until suchauthority is granted, a Title V permit under 40 CFR Part 71, administered by EPA, would be needed.
The Desert Rock Energy Facility will be required to submit a Title V operating permit application toEPA (or the Navajo Nation if they received Title V delegation prior to the facility’s one-year operationanniversary date) no later than 12 months after the commencement of operation. The application andpermit will essentially incorporate the requirement for operation encompassed by the PSD permit.
3.7 Compliance Assurance Monitoring
On October 27, 1997, EPA promulgated the Compliance Assurance Monitoring (CAM) Rule, 40 CFRPart 64, which addresses monitoring for certain emission units at major sources, thereby assuring thatfacility owners and operators conduct effective monitoring of their air pollution control equipment. Inorder to be subject to CAM, the following criteria must be met:
• The unit is subject to an emissions limitation or standard for the pollutant of concern;
• An “active” control device is used to achieve compliance with the emission limit; and
• The emission unit’s pre-control potential-to-emit is greater than the applicable major sourcethreshold.

09417-360-250R1 May, 2004
3-13
The CAM rule does not apply to emissions units/pollutants that are subject to Sections 111 (NSPS) or112 (NESHAP) of the CAA issued after November 15, 1990; the Acid Rain program or emissionstrading programs. Most emissions units/pollutants at the proposed project would be covered by othermonitoring requirements. Monitoring plans for any emissions units/pollutants subject to CAM would berequired to be developed with the submittal of the facility’s Title V permit application.
3.8 Acid Rain Provisions
The proposed coal-fired boilers for the Desert Rock Energy Facility are subject to the Acid RainProgram (ARP) pursuant to Title IV of the CAA Amendments of 1990. This will require:
• An Acid Rain Permit
• Continuous Emissions Monitoring System conforming to the ARP requirements.
• Allowances equivalent to annual SO2 emissions; and
• Emission limits of 40 CFR 76, to which BACT limits will conform or exceed.
The Acid Rain permit application must include the date that the unit will commence commercialoperation and the deadline for monitoring certification (90 days after commencement of commercialoperation). A Title IV Acid Rain monitoring plan will be submitted as required under 40 CFR 72. Theplan will include the installation, proper operation and maintenance of continuous monitoring systemsor approved monitoring provisions under 40 CFR 75 for NOX, SO2, CO2, and opacity. Depending onthe monitoring technology available at the time of installation, the plan will cite the specific operatingpractices and maintenance programs that will be applied to the instruments. The plan also will cite thespecific form of records that will be maintained, their availability for inspection, and the length of timethat they will be archived. The plan will cite that the Acid Rain permit and applicable regulations will bereviewed at specific intervals for continued compliance and the specific mechanism that will be used tokeep current on rule applicability.
3.9 Risk Management Program
The project will utilize anhydrous ammonia in the selective catalytic reduction system, in addition tolow-NOx burners, to control NOx emissions from the boilers. The storage amount of anhydrousammonia will require a Risk management Plan in accordance with EPA rules. Three elementscomprise the RMP:
• Hazard Assessment;
• Prevention Program; and• Emergency Response Program.
An approved RMP must be in place prior to exceeding the threshold storage amount of anhydrousammonia (10,000 lbs) at the Desert Rock Energy Facility.

09417-360-250R1 May, 2004
3-14
This page intentional left blank

09417-360-250R1 May, 2004
4-1
4.0 CONTROL TECHNOLOGY EVALUATION
4.1 Control Technology Overview
The Project is subject to Best Available Control Technology (BACT) for oxides of nitrogen (NOx), sulfurdioxide (SO2), carbon monoxide (CO), particulate matter (PM), particulate matter smaller than 10micrometer diameter (PM10), Volatile Organic Compounds (VOCs), lead (Pb), hydrogen fluoride (HF),and sulfuric acid mist (H2SO4). Mercury (Hg) and hydrogen chloride (HCl) have been targeted forfuture regulation under the Maximum Available Control Technology (MACT) standards for coal-firedpower plants. This document presents a “Top Down” BACT analysis, which begins with identificationof the most stringent level of control achieved on similar units. This level of control is referred to as theLowest Achievable Emission Rate (LAER). BACT is presumed to be equivalent to LAER unless case-specific technical feasibility, economic or environmental impacts would preclude it’s practicalapplication to the proposed project. If such factors are identified, the next best level of control issimilarly evaluated, and this process continues until the BACT level is determined on a case-by-casebasis for the particular emission units being evaluated for control.
While new MACT regulations for utility power plants, industrial boilers, and engines have beenproposed by EPA, they are not yet final. It is clear that any newly proposed coal fired power plant willhave to be designed for aggressive mercury control to meet future requirements. Furthermore, manyof the same control technologies that represent BACT candidates have also been shown capable ofmercury reduction, and therefore it is useful to consider the holistic application of state-of-the-artemissions control during facility design. As of this writing, a case-by-case MACT analysis is requiredfor mercury, and has been presented herein as part of the overall control technology review of theproposed facility.
4.1.1 Lowest Achievable Emission Rate
While the proposed project is not subject to the requirement to install LAER for any pollutant, in a TopDown control technology analysis LAER is used as the starting point since it establishes the lowestemission level that has been demonstrated in practice for a similar pulverized coal-fired power plant. .LAER, as defined in the "New Source Review Workshop Manual" (EPA, October 1990), is derivedfrom either of the following definitions:
"The most stringent emission limitation contained in the implementation plan of anyState for such class or category of source; or the most stringent emission limitationachieved in practice by such class or category of source."
The LAER standard is more stringent than BACT, since it considers only technological applicability ofthe best level of control that has been achieved in practice on another similar Unit, withoutconsideration of potential adverse economic, environmental, or energy impacts. It does, however,represent a useful starting point in the evaluation of potentially achievable levels of control. Todetermine the applicable emission limitations that would be representative of LAER, several sources

09417-360-250R1 May, 2004
4-2
were consulted including EPA's RACT/BACT/LAER Clearinghouse, representatives of EPA, and PSDpermits issued for other recent coal-fired power plants not yet listed in the EPA Clearinghouse.
4.1.2 Top-Down BACT
BACT requirements are intended to ensure that a proposed facility will incorporate control systems thatreflect the latest demonstrated practical techniques for a particular type of emission unit and do notresult in the exceedance of a NAAQS, PSD increment, or other standard imposed at the state level.The top-down BACT evaluation requires documentation and ranking of performance levels achievablefor each technically feasible pollutant control technology applicable to the Desert Rock Energy Facility.
The top-down approach to the BACT review process involves determining the most stringent controltechnique available (LAER) for a similar or identical emission source. If it can be shown that the LAERis technically, environmentally, or economically impractical on a case-by-case basis for the particularsource under evaluation, then the next most stringent level of control is determined and similarlyevaluated. The process continues until a control technology and associated emission level isdetermined which cannot be eliminated by any technical, environmental, or economic objections. Thetop-down BACT evaluation process is described in the EPA draft document "New Source ReviewWorkshop Manual. The five steps involved in a top-down BACT evaluation are:
• Identify all available control options with practical potential for application to the specificemission unit for the regulated pollutant under evaluation;
• Eliminate technically infeasible technology options;
• Rank remaining control technologies by control effectiveness;
• Evaluate most effective control alternative and document results; if top option is not selectedas BACT, evaluate next most effective control option; and
• Select BACT, which will be the most effective practical option not rejected based on energy,environmental, and economic impacts.
The "top-down" approach was used in this analysis to evaluate available pollution controls for theproposed Desert Rock Energy Facility.
4.1.3 Previous BACT/LAER Determinations for Pulverized Coal-fired Boilers
EPA's RACT/BACT/LAER Clearinghouse (RBLC) is a listing of RACT, BACT, and LAERdeterminations by governmental agencies for many types of air emission sources. ENSR consultedthis database as the first step in developing a list of the most recent BACT/LAER decisions forapplicable source types including pulverized coal facilities. The results of the RBLC search andinformation from more recent permits are summarized on a pollutant specific basis in the followingsections to identify and rank alternative technologies and achievable levels of control.

09417-360-250R1 May, 2004
4-3
4.2 BACT for Nitrogen Oxides (NOx)
4.2.1 Pulverized Coal-fired Boilers
4.2.1.1 Formation
NOx is formed during the combustion of fossil fuels including coal and is generally classified as eitherthermal NOx or fuel NOx. Thermal NOx is formed when elemental nitrogen reacts with oxygen in thecombustion air within the high temperature environment of the furnace. The rate of formation ofthermal NOx is a function of residence time and free oxygen, and is exponential with peak flametemperature. Fuel NOx is generated when nitrogen contained in the coal itself is oxidized. The rate offormation of fuel NOx is primarily a function of fuel bound nitrogen content of the coal but is alsoaffected by fuel air mixing.
NOx emissions can be reduced using either combustion controls (i.e., staged combustion techniquessuch as Low-NOx burners (LNB), flue gas recirculation (FGR), overfire air (OFA), natural gas reburn, orflue gas treatment including selective non-catalytic reduction (SNCR) or selective catalytic reduction(SCR). SCONOx is a proprietary catalytic control technology that has been applied to several smallgas turbines, however it has never been applied to a coal fired application and therefore has not beenconsidered further in this analysis. Most facilities being permitted today incorporate both combustioncontrols and add-on control to achieve NOx control.
4.2.1.2 Ranking of Available Control Techniques
A review of EPA's RBLC (see Attachment 2) and recent permit reviews indicates general levels of NOx
control that may be achieved with various combinations of control technology. Emission levels andcontrol technologies for pulverized coal combustion have been identified and ranked as shown in Table4-1.
4.2.1.3 Recent Permit Levels
The four most recent PSD permits identified for new pulverized coal-fired units are Sand Sage Power,LLC in Kansas issued 10/8/02, Thoroughbred Generating Co. LLC in Kentucky, issued 10/11/02,Roundup Power in Montana issued 07/21/03 and Longview Power, LLC in West Virginia draft issued12/4/03. Each of these projects were subject to top down BACT, and the emission limits contained inthose BACT approvals are representative of the current state-of-the-art for new pulverized coal powerplants. It should be noted that many of the recent power plant permits, especially in the West, proposeto burn Powder River Basin (PRB) coal from Wyoming. The Desert Rock Energy Facility will be amine-mouth plant burning subbituminous coal mined on the Navajo Reservation in New Mexico. Infact, the proposed Desert Rock project is not located near rail service, and it will be impracticable touse PRB coal. To the extent that other projects will achieve BACT based on use of a different coaltype (i.e. Powder River Basin coal vs. New Mexico subbituminous), permitted emission levels mayneed to be adjusted to the equivalent level that can be achieved with the particular coal type that isavailable to the Desert Rock Energy Facility.

09417-360-250R1 May, 2004
4-4
Table 4-1Ranking of NOx Control Technologies for Pulverized Coal Boilers
Pulverized CoalControl Technologies
Typical ControlEfficiency
Range(% Removal)
Typical EmissionLevel1
(lb/MMBtu)
TechnicallyFeasible for
Pulverized CoalBoilers
SCR and Low-NOx Burners 80-90 0.07-0.152 lb/MMBtu Yes
SNCR 40-60 0.2-0.3 lb/MMBtu Yes
Staged Combustion TechniquesIncluding Low-NOx Burners 30-50 0.15-0.53 lb/MMBtu Yes
SCONOxTM N/A N/A No
Gas Reburn 40-60 0.15-0.3 lb/MMBtu Requires NaturalGas On Site
1. Emission levels represent target steady state values at base load, long-term averages. All known projectsalso incorporate staged combustion techniques such as Low-NOx Burners.
2. An exception to this range is the W. A. Parish facility in Texas which is being designed to limit NOx emissionsto 0.03 lb/MMBtu with Alstom Low-NOx burners and SCR. However this facility will use PRB coal. Such lowerNOx levels may be achievable with PRB coal in tangentially or corner fired boilers due to the higher reactivityof the PRB coal, lower fuel nitrogen content and greater percentage of fuel nitrogen in the volatile fraction.However, the proposed project is a New Mexico mine mouth plant and cannot utilize PRB coal.
3. The lower end of this range is only achievable using PRB coal in tangentially or corner fired boilers.
N/A – Not available (no known installations of this technology on utility scale coal-fired boilers)
The Thoroughbred Project will employ SCR to achieve a NOx emission limit of 0.08 lb/MMBtu oneastern bituminous coal. This value has been proposed and demonstrated in practice on similar unitsburning eastern coal. The permit for Sand Sage, which will fire Powder River Basin coal was permittedwith a goal of achieving 0.08 lb/MMBtu after three years of operation, with an interim limit of 0.12lb/MMBtu. The permit contains a provision to adjust the 0.08 lb/MMBtu upward if it is shown thatdespite good faith efforts it can not be continuously achieved in practice. The Roundup Power permit(western bituminous) requires low-NOx burner, overfire air and SCR to limit NOx emissions to 0.07lb/MMBtu as a 24-hour average. The Longview permit requires low-NOx burners and SCR to limit NOx
emissions to 0.08 lb/MMBtu as a 24-hour average.
Based on these four recent BACT determinations, ENSR concludes that SCR in the range of 0.07 –0.08 lb. NOx/MMBtu is representative of state-of-the-art emission control for new pulverized coal units.
The Reliant Energy/Texas Genco W. A. Parish Unit 8 retrofit project in the Houston Texas area has adesign goal of 0.03 lb/MMBtu. This project is in the Houston–Galvenston ozone nonattainment areawhere large system wide NOx reductions are required to make progress toward attainment. Reliant

09417-360-250R1 May, 2004
4-5
Energy/Texas Genco plans to over-control Unit 8 so that they do not have to limit NOx emissions fromother units in their system to low levels. The W. A. Parish Station project is designed to limit NOx
emissions from the boiler by using Low-NOx burners to reduce emissions to 0.15 lb NOx/MMBtu.However, this level of NOx emissions, using Low-NOx burners, has only been demonstrated ontangentially or corner fired boilers using PRB coal and not on New Mexico coal. SCR at 80% controlefficiency will further reduce NOx emissions to 0.03 lb/MMBtu. The design emission levels are longterm average targets rather than continuous binding 24-hour average PSD emission limits. If 0.03lb/MMBtu cannot be achieved, Texas Genco may be able to meet their overall goal through reductionson other units. This unit has been installed but has only operated for a few days as of May 3, 2004,and hence cannot be considered to have been demonstrated in practice over long-term, continuousoperation. For these reasons, the W. A. Parish Unit 8 project does not represent a technically feasiblelevel of control for the Desert Rock Energy Facility.
Alternative control technologies with potential for application to the Desert Rock Energy Facility (usingNavajo Reservation coal) are reviewed below.
4.2.1.4 NOx Control Technology Discussion
Selective Catalytic Reduction
SCR is a process that involves post-combustion removal of NOx from flue gas with a catalytic reactor.In the SCR process, ammonia injected into the exhaust gas reacts with nitrogen oxides and oxygen toform nitrogen and water. SCR converts nitrogen oxides to nitrogen and water by the followingreactions (Cho, 1994):
4NO + 4NH3 +O2 → 4N2 + 6H2O
6NO + 4NH3 → 5N2 + 6H2O
2NO2 + 4NH3 + O2 → 3N2 + 6H2O
6NO2 + 8NH3 → 7N2 + 12H2O
NO + NO2 + 2NH3 → 2N2 + 3H2O
The reactions take place on the surface of a catalyst. The function of the catalyst is to effectively lowerthe activation energy of the NOx decomposition reaction. Technical factors related to this technologyinclude the catalyst reactor design, optimum operating temperature, sulfur content of the fuel, catalystde-activation due to aging or poisoning, ammonia slip emissions, and design of the ammonia injectionsystem.
The SCR system is comprised of a number of subsystems. These include the SCR reactor and flues,ammonia injection system and ammonia storage and delivery system. The SCR reactor withnecessary inlet and outlet duct work will be located downstream of the economizer and upstream ofthe air heater and the particulate control system.

09417-360-250R1 May, 2004
4-6
From the economizer outlet, the flue gas will first pass through a low-pressure ammonia/air injectiongrid designed to provide optimal mixing of ammonia with flue gas. The ammonia treated flue gas willthen flow through the catalyst bed and exit to the air heater.
The SCR system for a pulverized coal boiler typically utilizes a fixed bed catalyst in a vertical down-flow multi-stage reactor. The reactor will include a seal system to prevent gas from bypassing thecatalyst bed. Access openings for catalyst loading/removal and periodic internal inspection will beprovided. The reactor will contain multiple stages of catalyst with room for loading a future stage. Foreach stage, a soot blowing system will be provided. Each stage will be equipped with a platform withmonorails and hoists to accommodate catalyst loading and unloading.
Reduction catalysts are divided into two groups: base metal (lower temperature, primarily vanadium,platinum or titanium) and zeolite (higher temperature). Both groups exhibit advantages anddisadvantages in terms of operating temperature, reducing agent/NOx ratio, and optimum oxygenconcentration. A disadvantage common to base metal catalysts is the narrow range of temperatures inwhich the reactions will proceed. Platinum group catalysts have the advantage of requiring lowerignition temperature, but have been shown to also have a lower maximum operating temperature.Operating above the maximum temperature results in oxidation of ammonia to either nitrogen oxides(thereby actually increasing NOx emissions) or ammonium nitrate.
Optimum operating temperature for a vanadium-titanium catalyst system has been shown to be in therange of 550° to 800°F, which is significantly higher than for platinum catalyst systems. However, thevanadium-titanium catalyst systems begin to break down when continuously operating at temperaturesabove this range. Consequently, operating above the maximum temperature for the catalyst systemagain results in the oxidation of ammonia to either nitrogen oxides (increasing NOx emissions) orammonium nitrate.
Sulfur content of the fuel can be a concern for systems that employ SCR. Catalyst systems promotepartial oxidation of sulfur dioxide to sulfur trioxide (SO3), which combines with water to form sulfuricacid. At typical SCR operating temperatures, SO3 and sulfuric acid react with excess ammonia to formammonium salts. These ammonium salts may condense as the flue gases are cooled and can lead toincreased uncontrolled emissions of PM10 entering the particulate collector. Fouling may eventuallylead to decreased NOx reduction performance, increased system pressure drop over time anddecreased heat transfer efficiencies.
The SCR process is subject to catalyst deactivation over time. Catalyst deactivation occurs throughtwo primary mechanisms: physical deactivation and chemical poisoning. Physical deactivation isgenerally the result either of prolonged exposure to excessive temperatures or masking of the catalystdue to entrainment of particulate from ambient air or internal contaminants. Chemical poisoning iscaused by the irreversible reaction of the catalyst with a contaminant in the gas stream and is apermanent condition. Catalyst suppliers typically only guarantee a limited lifetime to very low emissionlevel, high performance catalyst systems.

09417-360-250R1 May, 2004
4-7
SCR manufacturers typically estimate 10 ppmvd of unreacted ammonia emissions (ammonia slip)when making guarantees at very high efficiency levels. To achieve high NOx reduction rates, SCRvendors suggest a higher ammonia injection rate than stoichiometrically required, which converselyresults in ammonia slip. Thus an emissions trade-off between NOx and ammonia may occur in highNOx reduction applications.
The potential environmental impacts associated with the use of SCR are summarized below:
• Unreacted ammonia would be emitted to the atmosphere (ammonia slip).
• Ammonium salts would increase loading to the particulate collection stage as PM10 (andPM2.5).
• Safety issues and Risk Management Planning may be required relative to the transportation,handling, and storage of ammonia (aqueous or anhydrous).
The application of SCR to coal-fired boilers was first developed in Germany, in response to German airregulations. SCR units had operated in Germany for ten years before they were first applied to coal-fired boilers in the U. S. and German utilities have now accumulated over twenty years of operatingexperience with this technology. Steag AG is one of these German utilities, and together with Encotec(it’s German engineering subsidiary), has far more design and operational experience in the advancedapplication of SCR technology to coal-firing than it’s U. S. counterparts. This special knowledge andexpertise is the basis for the design and emission reduction capability determination for the proposedDesert Rock Energy Facility.
Selective Non-Catalytic Reduction
SNCR has been applied to a number of different types of combustion sources, including petroleumheaters, utility and industrial boilers fired with natural gas and oil, as well as PC boilers and to coal-fired Circulating Fluidized Bed (CFB) boilers.
The SNCR process is based on a gas-phase homogeneous reaction, within a specified temperaturerange, between NOx in the flue gas and either injected NH3 or urea to produce gaseous nitrogen andwater vapor. SNCR systems do not employ a catalyst; the NOx reduction reactions are driven by thethermal decomposition of ammonia and the subsequent reduction of NOx. Consequently, the SNCRprocess operates at higher temperatures than the SCR process.
Critical to the successful reduction of NOx with SNCR is the temperature of the flue gas at the pointwhere the reagent is injected. For the ammonia injection process, the necessary temperature range is1,700 - 1,900°F; for the urea injection process the nominal temperature range is 1,600 - 2,100°F. Alsocritical to effective application of these processes are gas mixing, residence time at temperature, andammonia slip.
Theoretically, one mole of ammonia (or one-half mole of urea) will react with one mole of NOx, formingelemental nitrogen and water. In reality, not all the injected reagent will react due to imperfect mixing,

09417-360-250R1 May, 2004
4-8
uneven temperature distribution, and insufficient residence time. These physical limitations may becompensated for by injecting a large amount of excess reagent and essentially achieving low NOx
emissions at the expense of emissions of unreacted reagent, referred to as ammonia "slip." Theseemissions represent an adverse environmental impact and can lead to formation of ammonium saltsand may contribute to regional haze as a precursor to PM2.5. Thus, for a given boiler configuration,there is a limit on the degree of NOx reduction which can be achieved with SNCR while maintainingacceptable levels of ammonia slip.
A number of CFB boilers have been equipped with SNCR for NOx control as BACT according to thelistings in the RACT/BACT/LAER Clearinghouse. The CFB design is described as the ideal applicationfor SNCR in the available open literature. CFB boilers are constant temperature, variable heat transferdevices. The bed temperature and downstream flue gas temperature can be set by the operator towithin a few degrees. The typical temperature of CFB flue gas leaving the bed and entering the hotcyclone is at the ideal temperature for SNCR. Additionally, the reduction reagent is injected at the inletto the hot cyclone, where all of the flue gas is swirled at 50-75 ft/second, and forced to changedirection many times. This cyclonic action homogenizes the reagent flue gas NOx concentration, thusmaximizing mixing. Pulverized coal-fired units have a much more limited furnace temperature windowand poor lateral mixing, conditions which render SNCR less effective in these applications. SNCR hasbeen applied to PC boilers more often to achieve 30 – 50% reductions in response to ReasonablyAvailable Control Technology (RACT) since the technology can be retrofit more readily than add-oncontrol. Due to mixing limitations and a brief temperature window in which to react, SNCR isfundamentally less effective at controlling NOx from PC’s compared with CFB’s.
Staged Combustion
A number of techniques have been employed to reduce the formation of NOx by reducing peak flametemperature and/or starving the hottest parts of the flame for oxygen. By staging the combustionprocess, a longer, cooler flame results, which forms less NOx. Staged combustion techniques includeLow-NOx burners, flue gas recirculation, overfire air, burners out of service, and combinations of these.A collateral impact of staged combustion is an increase in emissions of products of incompletecombustion including CO, VOC and carbon in ash (referred to as Loss on Ignition, or LOI).
SCONOx
SCONOx is a NOx adsorption/desorption technology that has been applied to combustion turbines thatfire natural gas. This technology is extremely sensitive to the presence of sulfur in flue gas and couldnot be applied to coal-fired boilers. SCONOx is therefore determined to be not technically feasible forapplication to the proposed PC boilers and is not evaluated further in this analysis.
Gas Reburn
Natural gas reburn is a control technique that has shown promise as a potential retrofit to existingboilers, and may be capable of reducing emissions of NOx to 0.15 lb/MMBtu simply by starving the coalburners for excess oxygen and completing combustion with 12-15% gas in the upper furnace.

09417-360-250R1 May, 2004
4-9
Application of this technology assumes that natural gas in substantial quantity is already available onsite – otherwise it is technically infeasible. In any event, the level of NOx control that may be achievedis less than for the other add-on control technologies and therefore it is not considered further in thisanalysis.
4.2.1.5 Summary of Pulverized Coal-fired Boiler BACT for NOx
Based on a review of available control technologies for emissions of NOx from a pulverized coal-firedboiler, as well as 20+ years of Steag field experience and expertise in the application of SCR to coal-fired boilers, we conclude that the lowest NOx emission rate that have been demonstrated in practiceand can be achieved for the particular coal available to Desert Rock Energy Facility is 0.06 lb/MMBtuas a 24-hour average. This emission rate represents the best emissions control technology availablefor the proposed PC boilers, and therefore represent Lowest Achievable Emission Rate (LAER) as wellas a top-down BACT that is beyond previously established BACT emission limits. No adverse cost,energy, or environmental impacts have been identified that would prevent the proposed project fromcontinuously achieving 0.06 lb/MMBtu as a 24-hour average.
BACT for NOx for the Steag Desert Rock Energy Facility is concluded to be emission limits of 0.06lb/MMBtu as a 24-hour average using low-NOx burners and selective catalytic reduction.
4.2.2 Auxiliary Boilers
The Desert Rock Energy Facility includes three small distillate oil-fired auxiliary boilers with heat inputcapacities of approximately 86.4 MMBtu/hour. These boilers will be subject to NSPS 40 CFR 60Subpart Dc. Total annual fuel use in the three boilers will be limited to 142,560 MMBtu/year, which isequivalent to an average of only 550 hours of operation per year per boiler at full load.
Based on a review of recent permits for similar boilers and EPA’s RACT/BACT/LAER Clearinghouse(see Attachment 2), ENSR has concluded that BACT for NOx for these boilers is 0.10 lb/MMBtu usingLow-NOx Burners. Only one permit, issued in 1997, requires the use of SCR, however that unit isallowed to operate at full load, year round, and not on a limited duty as planned here. We note thatthere are a couple of very small boilers listed in the Clearinghouse with NOx emission rates of 0.038lb/MMBtu, however we believe these listings to be in error (and note that they also do not reflect thesame category of source). However, all of the 20 permits issued in the last 5 ½ years, for distillate oil-fired small industrial boilers have NOx emission rates of at least 0.10 lb/MMBtu.
NOx emissions from the auxiliary boilers will be controlled by limiting annual fuel use to a total of142,560 MMBtu/year, limiting operation to low sulfur distillate oil, and using Low-NOx burners to 0.1lb/MMBtu, which represents BACT for these emission sources.
4.2.3 Emergency Diesel Engines
The Desert Rock Energy Facility includes two emergency diesel generators (1,000 kW each) and twodiesel generator powered firewater pumps (180 kW each). These emergency diesel engines will not

09417-360-250R1 May, 2004
4-10
operate for more than 100 hours/year each. NOx emissions during operation will be controlled by onlyburning low sulfur distillate oil and ignition timing retard with turbocharging and aftercooling. Based onreview of recent permits for similar emergency diesel engines and EPA’s RACT/BACT/LAERClearinghouse, the top level of control or lowest NOx emission rate approximately 6.5 g/hp-hr. Thislevel of control represents BACT for the emergency diesel engines.
4.3 BACT for Sulfur Dioxide
4.3.1 Pulverized Coal-fired Boilers
4.3.1.1 Formation
Emissions of sulfur dioxide are generated in fossil fuel-fired sources from the oxidation of sulfur presentin the fuel. Approximately 98% of sulfur in solid fuels is emitted upon combustion as gaseous sulfuroxides. Uncontrolled emissions of SO2 are thus affected by fuel sulfur content alone, and not by thefiring mechanism, boiler size, or operation. Many coal-fired boilers in the U.S. limit emissions of SO2
through the use of low sulfur western coals, including PRB coal. Compared with a high sulfur easternbituminous coal that may contain as much as 4% sulfur, burning western coal can reduce SO2
emissions by approximately 70% to 90%. The selection of coal type and sulfur content is therefore animportant aspect of the determination of BACT and needs to be considered in conjunction with add-oncontrol alternatives when performing the top-down analysis.
4.3.1.2 Ranking of Available Add-On Control Techniques
Generally, there are two types of add-on control applicable to a coal-fired boiler: in-situ combustioncontrol (sorbent injection) and post-combustion control (flue gas desulfurization). In-situ control is usedeffectively in CFB boilers, and may be used in a PC boiler by using limestone injection into the furnace,however the level of control that is achievable is not comparable to post-combustion SO2 controlsystems. Post-combustion controls applicable to PC boilers are a wet scrubbing system or spray dryerabsorber (SDA) using reagents such as lime, limestone, sodium bicarbonate or magnesium oxide.
A comparative ranking of available SO2 control technologies (see Table 4-2) must take intoconsideration multiple variables including coal sulfur content, % removal and the resulting emissionrate (lb/MMBtu) in addition to collateral impacts on other pollutants, energy impacts, and otherenvironmental impacts.
4.3.1.3 Recent Permit Limits
Most of the PSD permit limits listed in EPA’s RACT/BACT/LAER Clearinghouse (see Attachment 2)since 1995 are in the 0.12 lb SO2 /MMBtu to 0.25 lb SO2 /MMBtu range. Many of these havecompliance averaging times in the 24-hour to 30-day range. In addition, there is one permit at 0.022lb/MMBtu and six in the 0.086 to 0.12 lb/MMBtu range.
The lowest permit limit is 0.022 lb/MMBtu for AES-Puerto Rico, which is a smaller CFB Unit, and is afundamentally different source type than the proposed Steag PC boilers. Additionally, the economics
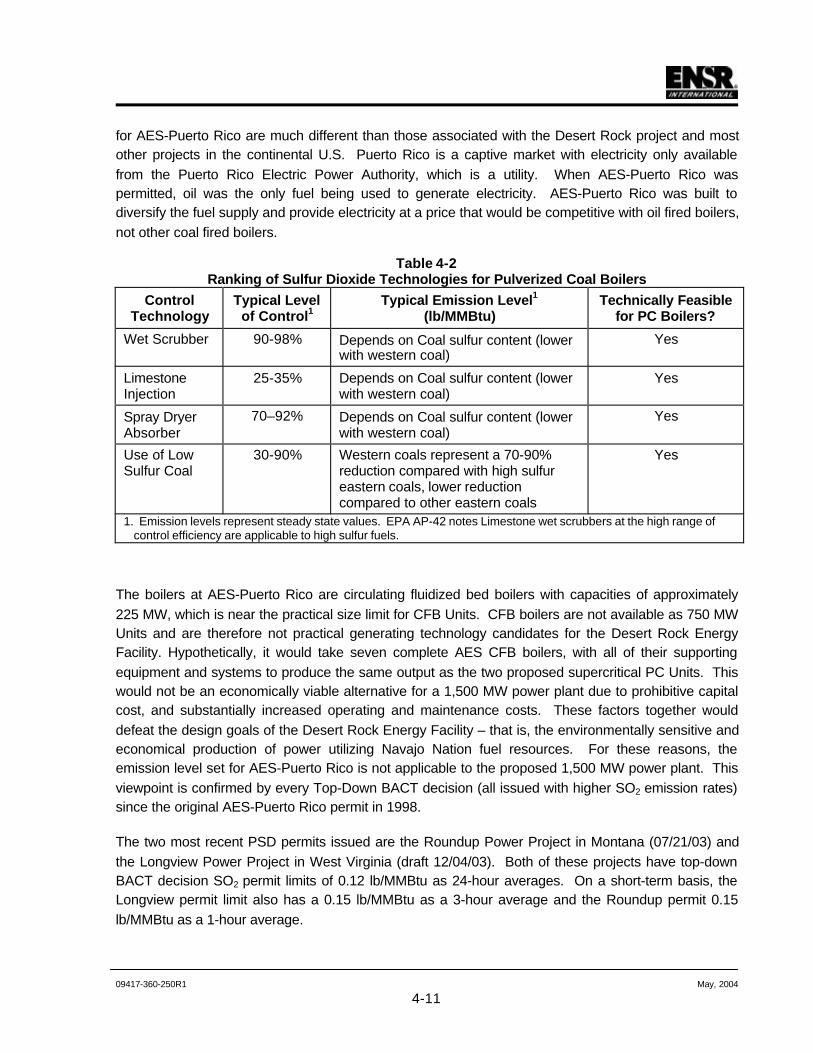
09417-360-250R1 May, 2004
4-11
for AES-Puerto Rico are much different than those associated with the Desert Rock project and mostother projects in the continental U.S. Puerto Rico is a captive market with electricity only availablefrom the Puerto Rico Electric Power Authority, which is a utility. When AES-Puerto Rico waspermitted, oil was the only fuel being used to generate electricity. AES-Puerto Rico was built todiversify the fuel supply and provide electricity at a price that would be competitive with oil fired boilers,not other coal fired boilers.
Table 4-2Ranking of Sulfur Dioxide Technologies for Pulverized Coal Boilers
ControlTechnology
Typical Levelof Control1
Typical Emission Level1
(lb/MMBtu)Technically Feasible
for PC Boilers?
Wet Scrubber 90-98% Depends on Coal sulfur content (lowerwith western coal)
Yes
LimestoneInjection
25-35% Depends on Coal sulfur content (lowerwith western coal)
Yes
Spray DryerAbsorber
70–92% Depends on Coal sulfur content (lowerwith western coal)
Yes
Use of LowSulfur Coal
30-90% Western coals represent a 70-90%reduction compared with high sulfureastern coals, lower reductioncompared to other eastern coals
Yes
1. Emission levels represent steady state values. EPA AP-42 notes Limestone wet scrubbers at the high range ofcontrol efficiency are applicable to high sulfur fuels.
The boilers at AES-Puerto Rico are circulating fluidized bed boilers with capacities of approximately225 MW, which is near the practical size limit for CFB Units. CFB boilers are not available as 750 MWUnits and are therefore not practical generating technology candidates for the Desert Rock EnergyFacility. Hypothetically, it would take seven complete AES CFB boilers, with all of their supportingequipment and systems to produce the same output as the two proposed supercritical PC Units. Thiswould not be an economically viable alternative for a 1,500 MW power plant due to prohibitive capitalcost, and substantially increased operating and maintenance costs. These factors together woulddefeat the design goals of the Desert Rock Energy Facility – that is, the environmentally sensitive andeconomical production of power utilizing Navajo Nation fuel resources. For these reasons, theemission level set for AES-Puerto Rico is not applicable to the proposed 1,500 MW power plant. Thisviewpoint is confirmed by every Top-Down BACT decision (all issued with higher SO2 emission rates)since the original AES-Puerto Rico permit in 1998.
The two most recent PSD permits issued are the Roundup Power Project in Montana (07/21/03) andthe Longview Power Project in West Virginia (draft 12/04/03). Both of these projects have top-downBACT decision SO2 permit limits of 0.12 lb/MMBtu as 24-hour averages. On a short-term basis, theLongview permit limit also has a 0.15 lb/MMBtu as a 3-hour average and the Roundup permit 0.15lb/MMBtu as a 1-hour average.

09417-360-250R1 May, 2004
4-12
4.3.1.4 SO2 Control Technology Discussion
Wet Flue Gas Desulfurization
The most frequently utilized wet flue gas desulfurization (FGD) technology is the wet limestone spraytower system. Typically, flue gas enters at the bottom of the absorber tower, continues verticallythrough the limestone/water spray, passes through a mist eliminator to control the re-entrained slurrydrops, and then exits the tower. Limestone (calcium carbonate) reacts with the sulfur dioxide to formcalcium sulfite. The calcium sulfite may then be oxidized to form calcium sulfate, since it is easier tode-water than calcium sulfite. This can be achieved by blowing compressed air into the slurry in theretention tank in the base of the tower or in an external oxidation tank.
To fully utilize the limestone, the slurry is re-circulated through the tower and a bleed stream is takenoff for de-watering. The bleed stream can be de-watered using a variety of techniques, includingthickeners, centrifuges and vacuum filters. The final slurry may contain 10% to 40% water by weight.
Wet scrubbers can also utilize limestone rather than lime. Some of the lime (calcium oxide) becomescalcium hydroxide in water. The slurry of calcium hydroxide and lime is fed to the spray tower. Sincethe cost of limestone is much less than lime, the limestone alternative is much more common. This isespecially the case for medium to high sulfur coals.
Spray Dryer Absorber
The spray dryer absorber is located upstream of the particulate collection system, typically fabric filters.The flue gas passes through a spray dryer vessel where it encounters a fine mist of lime slurry. Thelime slurry is injected into the spray dryer absorber through either a rotary atomizer or fluid nozzles.The moisture in the droplets evaporates and reacts with the SO2 in the flue gas to form insolublecalcium salts. The flue gas is cooled to approximately 18 to 30 °F above the adiabatic saturation of theflue gas. The calcium salts have a moisture content of approximately 2 to 3%, which falls to 1% beforereaching the particulate control device. When a fabric filter is used as the particulate control device, itallows for further reaction of the lime with the sulfur (and other acid gases) in the flue gas. This is dueto the layer of porous filter cake on the surface of the filter that contains the reagent that all flue gasmust pass through. This allows for increased efficiency of control of sulfuric acid mist, hydrogenchloride and mercury as compared to wet scrubbers.
Use of Low Sulfur Coal
Any discussion of the relative effectiveness of add on SO2 control must also take into account the levelof uncontrolled SO2 to be handled, which is highly dependent on the sulfur content of the coal to beburned. Higher removal efficiencies tend to be more practical when there is a high concentration ofSO2 in the flue gas, and vice versa. This is reflected in a comparison of the resulting emission rate inunits of lb of SO2 per MMBtu of fuel burned (or lb of SO2 per kW produced). For example, a proposedproject with a BACT limit of 0.16 lb/MMBtu using an 80% removal control system is environmentallysuperior to another project with a BACT limit of 0.32 lb/MMBtu and 95% removal. For a project located

09417-360-250R1 May, 2004
4-13
in the Western U.S., BACT generally includes use of low sulfur western coal as a part of a strategy tolimit SO2 to BACT levels in combination with add-on control.
4.3.1.5 Summary of Pulverized Coal-fired Boiler BACT for SO2
Steag is proposing to limit SO2 emissions to 0.06 lb/MMBtu as a 24-hr average by burning low sulfurwestern coal and using a wet limestone flue gas desulfurization system. This proposed emission rateis lower than any other project listed in EPA’s RACT/BACT/LAER Clearinghouse, except for AES-Puerto Rico, which was previously discussed. Steag’s proposed emission limit of 0.06 lb/MMBtu as a24-hour average is much lower than the two most recent permits which are the Roundup PowerProject in Montana (07/21/03) and the Longview Power Project in West Virginia (draft 12/04/03). Bothof these projects have SO2 permit limits of 0.12 lb/MMBtu as 24-hour averages or 100% higher thanthe proposed Desert Rock Energy Facility. Therefore, Steag has made a conscious decision toachieve even lower SO2 levels and this level of control is concluded to go beyond BACT for SO2 fromthe proposed Desert Rock PC boilers.
4.3.2 Auxiliary Boilers
The Desert Rock Energy Facility also includes three small distillate oil-fired auxiliary boilers with heatinput capacities of approximately 86.4 MMBtu/hour. Total annual fuel use in the three boilers will belimited to 142,560 MMBtu/year, which is equivalent to an average of 550 hours/year per boiler at fullload. SO2 emissions will be controlled by only burning low sulfur distillate oil with a maximum sulfurcontent of 0.05%. No add-on SO2 controls have ever been applied to similar sources. The burning oflow sulfur fuels such as low sulfur distillate oil is the only available SO2 control option and is the toplevel of control. Therefore, Steag proposes to only burn low sulfur distillate oil (0.05% sulfur maximum)and to restrict total annual fuel consumption to 142,560 MMBtu/year as BACT for the auxiliary boilers.
4.3.3 Emergency Diesel Engines
The project includes two emergency diesel generators (1,000 kW each) and two diesel generatorpowered firewater pumps (180 kW each). These energency diesel engines will not be operated formore than 100 hours/year each. No add-on SO2 controls have ever been applied to similar sources.The burning of low sulfur fuels such as low sulfur distillate oil is the only available SO2 control optionand represents the top level of control. Therefore, Steag proposes to only burn low sulfur distillate oil(0.05% sulfur maximum) and to restrict operation to 100 hours per year each as BACT for theproposed emergency diesel engines.
4.4 BACT for Carbon Monoxide
4.4.1 Pulverized Coal-fired Boilers
4.4.1.1 Formation of CO Emissions
Carbon monoxide is formed as a result of incomplete combustion of a hydrocarbon fuel. Control of COis accomplished by providing adequate fuel residence time, excess oxygen and high temperature in

09417-360-250R1 May, 2004
4-14
the combustion zone to ensure complete combustion. These control factors, however, also tend toresult in increased emissions of NOx. Conversely, a low NOx emission rate achieved throughcombustion modification techniques such as Low-NOx Burners can result in higher levels of COformation. Thus, a compromise is established to achieve the lowest NOx formation rate possible whilekeeping CO emission rates at acceptable levels.
4.4.1.2 Ranking of Available CO Control Technology Options
CO emissions from pulverized coal-fired boilers are a function of oxygen availability (excess air), flametemperature, residence time at flame temperature, combustion zone design, and turbulence. Allpulverized coal-fired boilers identified utilize front-end methods such as good combustion controlwherein CO formation is suppressed within the boiler. All listings in EPA’s RACT/BACT/LAERClearinghouse for pulverized coal-fired boilers utilize combustion control techniques for CO (seeAttachment 2). While gas-fired combustion turbines have been widely equipped with oxidation catalystcontrol technology, this technology is not applicable to coal-fired boilers. In addition to oxidizing CO,an oxidation catalyst would oxidize SO2 to produce SO3, which would exacerbate sulfuric acid mistemissions. The SO2 oxidation rate would be in the range of 5% or more resulting in very high sulfuricacid mist emissions if an oxidation catalyst were to be attempted on a coal-fired boiler.
BACT for CO for the recently permitted Roundup Power Project in Montana was approved in July 2003as 0.15 lb/MMBtu. In December 2003, a CO BACT emission limit of 0.11 lb/MMBtu was approved forthe Longview Power Project in West Virginia. EPA’s RACT/BACT/LAER Clearinghouse lists morethan 30 permits in the 0.10 lb/MMBtu to 0.15 lb/MMBtu range and only one less than 0.10 lb/MMBtu.
A review of EPA's RACT/BACT/LAER Clearinghouse and ENSR's review of recent permit decisions,indicates levels of CO control which may be achieved for coal-fired boilers. Emission levels andcontrol technologies have been identified and ranked in Table 4-3.
Table 4-3Ranking of CO Control Technology Options for Pulverized Coal-fired Boilers
Control TechnologyOption
Emission Level(lb/MMBtu)
Technically Feasibilityfor Pulverized Coal-fired Boilers?
Combustion controls 0.05 to 0.15 Yes
Oxidation catalyst Not determined No
SCONOx Not determined No

09417-360-250R1 May, 2004
4-15
4.4.1.3 CO Control Technology Discussion
Combustion Control
Combustion control refers to controlling emissions of CO through the design and operation of the boilerin a manner so as to limit CO formation. In general, a combustion control system seeks to maintainthe proper conditions to ensure complete combustion through one or more of the following operationdesign features: providing sufficient excess air, staged combustion to complete burn out of products ofincomplete combustion, sufficient residence time, and good mixing. All of these factors also tend toreduce emissions of VOC as well as CO. However, this process must be optimized with the efforts toreduce NOx emissions, which may increase when steps to lower CO are taken.
Catalytic Oxidation
Catalytic oxidation is the technology that has been used to obtain the most stringent control level forCO from natural gas-fired turbine combustion units. This technology has never been applied to a coal-fired unit. It is evaluated here to determine if it could be considered transferable technology forapplication to the proposed pulverized coal-fired boilers. In this alternative, a catalyst would besituated in the flue gas stream to lower the activation energy required to convert products ofincomplete combustion (CO and VOC) in the presence of oxygen (O2) to carbon dioxide and water.The catalyst permits combination of the reactant species at lower gas temperatures and residencetimes than would be required for uncatalyzed oxidation.
The catalyst would have to be located at a point where the gas temperature is within an acceptablerange. The effective temperature range for CO oxidation is between 600 °F and about 1,000 °F.Catalyst non-selectivity is a problem for sulfur containing fuels such as coal. Catalysts promoteoxidation of SO2 to SO3 as well as CO to CO2. The amount of SO2 conversion is a function oftemperature and catalyst design. Under optimum conditions, formation of SO3 can be minimized to 5%of inlet SO2. This level of conversion would result in a large collateral increase in H2SO4 emissionswhich aside from the increased ambient air impacts, could result in unacceptable amounts of corrosionto the fabric filter particulate collector, air preheater, ductwork and stack.
Oxidation catalysts are known to be extremely sensitive to potential masking, blinding or poisoning dueto trace elements such as metals in flue gas. While natural gas contains essentially no trace metals,coal contains many of trace compounds within the inert fraction referred to as ash. These tracecompounds are highly variable in concentration even from coal taken within the same mine or seam.There is no empirical evidence available to show that oxidation catalyst technology would actually workwith coal-fired boilers, or if so what the life of the catalyst might be.
ENSR contacted an oxidation catalyst system vendor to determine the technical feasibility of installingthis system on a coal-fired boiler. Due to the high particulate loading of the flue gas, variable traceelement concentration in the flue gas and the SO2 loading before air pollution control systems, thevendor stated that they could not provide a catalyst system for coal-fired applications. Consequently,

09417-360-250R1 May, 2004
4-16
oxidation catalyst systems are considered technically infeasible for application to the proposed coal-fired boilers.
SCONOx
SCONOx is a technology that has been widely discussed for application to many types of sources,however to date the only two known applications are on small gas turbine cogeneration systems. Likeoxidation catalyst, this technology has never been applied or even tested for application to coal-firedboilers. In fact, SCONOx actually utilizes the same CO reduction technology as oxidation catalystdiscussed previously. The SCONOx bed incorporates a coating of the same catalyst material,primarily to oxidize NO to NO2 but with the side benefit of also reducing emissions of CO. SCONOxtherefore has all the limitations cited above for oxidation catalyst, but is even further from considerationas transferable technology.
4.4.1.4 Summary of Pulverized Coal-fired Boiler BACT for CO
The only practical or demonstrated in practice measures to control CO from coal-fired boilers is goodcombustion. Combustion control, and the resulting optimized emission rate to minimize formation ofCO while also minimizing NOx, therefore represents the BACT control technology for the proposedboilers. BACT for CO from the proposed Desert Rock PC boilers is therefore concluded to be 0.10lb/MMBtu. This level is consistent with or lower than recent permits for new coal fired boilers and lowerthan the most recent top-down BACT decisions for the Roundup and Longview projects which werepermitted in the 0.11 lb/MMBtu to 0.15 lb/MMBtu range.
4.4.2 Auxiliary Boilers
The Desert Rock Energy Facility includes three small distillate oil-fired auxiliary boilers with heat inputcapacities of approximately 86.4 MMBtu/hour. Total annual fuel use in the three boilers will be limitedto 142,560 MMBtu/year, which is equivalent to an average of 550 hours/year per boiler at full load. ABACT limit for CO emissions of 0.036 lb/MMBtu and the annual total fuel restriction of 142,560MMBtu/year are proposed for these boilers, which reflect the lowest emission limits listed in EPA’sRACT/BACT/LAER Clearinghouse (see Attachment 2).
4.4.3 Emergency Diesel Engines
The project includes two emergency diesel generators (1,000 kW each) and two diesel generatorpowered firewater pumps (180 kW each). The diesel engines will not be operated for more than 100hours/year each. A BACT emission limit for these diesel engines of 0.5 g/hp-hr and a limitation of 100hours of operation per year (each) represents BACT for the proposed emergency diesel engines.
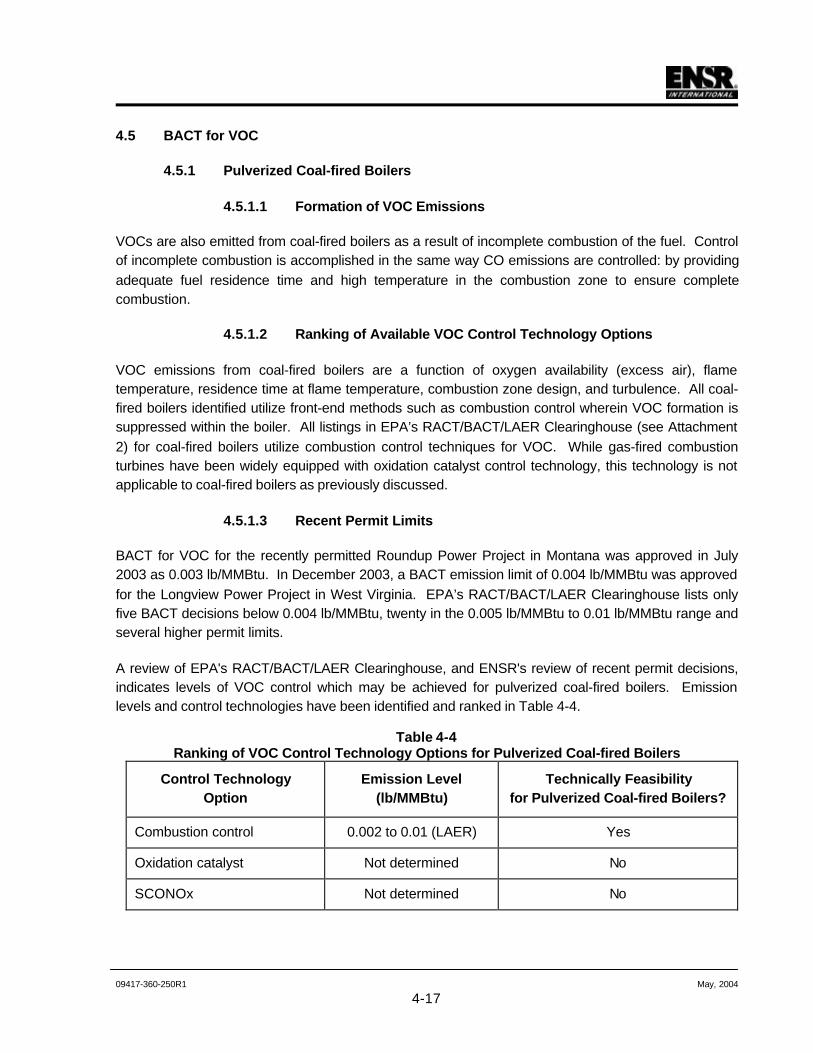
09417-360-250R1 May, 2004
4-17
4.5 BACT for VOC
4.5.1 Pulverized Coal-fired Boilers
4.5.1.1 Formation of VOC Emissions
VOCs are also emitted from coal-fired boilers as a result of incomplete combustion of the fuel. Controlof incomplete combustion is accomplished in the same way CO emissions are controlled: by providingadequate fuel residence time and high temperature in the combustion zone to ensure completecombustion.
4.5.1.2 Ranking of Available VOC Control Technology Options
VOC emissions from coal-fired boilers are a function of oxygen availability (excess air), flametemperature, residence time at flame temperature, combustion zone design, and turbulence. All coal-fired boilers identified utilize front-end methods such as combustion control wherein VOC formation issuppressed within the boiler. All listings in EPA’s RACT/BACT/LAER Clearinghouse (see Attachment2) for coal-fired boilers utilize combustion control techniques for VOC. While gas-fired combustionturbines have been widely equipped with oxidation catalyst control technology, this technology is notapplicable to coal-fired boilers as previously discussed.
4.5.1.3 Recent Permit Limits
BACT for VOC for the recently permitted Roundup Power Project in Montana was approved in July2003 as 0.003 lb/MMBtu. In December 2003, a BACT emission limit of 0.004 lb/MMBtu was approvedfor the Longview Power Project in West Virginia. EPA’s RACT/BACT/LAER Clearinghouse lists onlyfive BACT decisions below 0.004 lb/MMBtu, twenty in the 0.005 lb/MMBtu to 0.01 lb/MMBtu range andseveral higher permit limits.
A review of EPA's RACT/BACT/LAER Clearinghouse, and ENSR's review of recent permit decisions,indicates levels of VOC control which may be achieved for pulverized coal-fired boilers. Emissionlevels and control technologies have been identified and ranked in Table 4-4.
Table 4-4Ranking of VOC Control Technology Options for Pulverized Coal-fired Boilers
Control TechnologyOption
Emission Level(lb/MMBtu)
Technically Feasibilityfor Pulverized Coal-fired Boilers?
Combustion control 0.002 to 0.01 (LAER) Yes
Oxidation catalyst Not determined No
SCONOx Not determined No

09417-360-250R1 May, 2004
4-18
4.5.1.4 VOC Control Technology Discussion
Combustion Control
Combustion control refers to controlling emissions of VOC through the design and operation of theboiler in a manner so as to limit VOC formation. In general, a combustion control system seeks tomaintain the proper conditions to ensure complete combustion through one or more of the followingoperation design features: providing sufficient excess air, staged combustion to complete burn out ofproducts of incomplete combustion, sufficient residence time, and good mixing. All of these factorsalso have the by-product of reducing the emissions of CO. Pulverized coal-fired boilers are designedspecifically for efficient fuel combustion with thorough mixing and residence time at temperature, plusstaged combustion. This level of combustion control represents BACT for the proposed boilers.
Add-On Emission Controls
Catalytic oxidation and SCONOx are not applicable to coal-fired boilers as previously discussed inSection 4.4.1.3.
4.5.1.5 Summary of Pulverized Coal-fired Boiler BACT for VOC
The only practical or demonstrated in practice measures to control VOC emissions from coal-firedboilers is good combustion. Combustion control, and the resulting optimized emission rate to minimizeformation of VOC while also minimizing NOx, therefore represents BACT for the proposed boilers.Steag is proposing a VOC BACT limit of 0.003 lb/MMBtu, which is lower than the lowest emission ratein recent PC boiler permits.
4.5.2 Auxiliary Boilers
The project includes three small distillate oil-fired auxiliary boilers with heat input capacities ofapproximately 86.4 MMBtu/hour. Total annual fuel use in the three boilers will be limited to 142,560MMBtu/year, which is equivalent to an average of 550 hours/year per boiler at full load. BACT for VOCemissions is concluded to be an emission limit of 0.0024 lb/MMBtu and a total fuel restriction of142,560 MMBtu/year for these boilers based on EPA’s RACT/BACT/LAER Clearinghouse (seeAttachment 2).
4.5.3 Emergency Diesel Engines
The project includes two emergency diesel generators (1,000 kW each) and two diesel generatorpowered firewater pumps (180 kW each). The diesel engines will not be operated for more than 100hours/year each. A BACT emission limit for these diesel engines of 0.3 g/hp-hr and an operatingrestriction of 100 hours per year (each) represents BACT for VOC from these units based on EPAemission factors in AP-42.

09417-360-250R1 May, 2004
4-19
4.6 BACT for Particulate Matter
4.6.1 Pulverized Coal-fired Boilers
4.6.1.1 Formation of Particulate Matter
The composition and amount of particulate matter emitted from coal-fired boilers are a function of firingconfiguration, boiler operation, coal properties and emission controls. Particulate matter will be emittedfrom the pulverized coal-fired boilers as a result of entrainment of incombustible inert matter (ash) andcondensable substances such as acid gases. Both particulate matter (PM), and particulate mattersmaller than 10 micrometer diameter (PM10) require the application of BACT under the Federal PSDprogram. Particulate matter is total filterable particulate matter as determined by EPA Method 5 or 17.PM10 includes filterable particulate matter smaller 10 micrometer diameter as determined by EPAMethod 201 or 201A and condensable particulate matter as determined by EPA Method 202.
4.6.1.2 Ranking of Available Particulate Control Technology Options
PM10 emission limits are difficult to assess as many listings in the BACT/LAER Clearinghouse andeven in issued permits do not specify test methods. Consequently, ENSR has determined that manyemission limits only reflect filterable PM or PM10 and do not include condensable PM10. The permit forAES-Puerto Rico addressed this issue in detail. AES’s permit limits filterable PM10 to 0.015 lb/MMBtuand allows stack testing to determine an achievable PM10 emission limit. Stack tests showed thatfilterable PM10 emissions were below 0.015 lb/MMBtu. However, based on stack test results, AES hasapplied for an administrative change to their permit to set the total PM10 emission limit at 0.03lb/MMBtu. The permits for Energy Services of Manitowoc (a small CFB) contains a limit of 0.011lb/MMBtu, purported to include front and back half PM10. The actual permit for this facility does notspecify compliance test method, however, and ENSR believes that the permit limit is intended toinclude filterable PM10 only. This project has yet to be built or tested and its ability to comply with frontand back half PM10 limits is undetermined. Several other recent coal-fired boiler projects are listed withemission rates in the range of 0.010 lb/MMBtu to 0.015 lb/MMBtu based on front half (filterable) PMonly, and this level is representative of BACT and LAER for PM. BACT and LAER for PM10 mustaccount for additional emissions attributable to condensable PM10.
A review of EPA's RACT/BACT/LAER Clearinghouse indicates several levels of particulate control thatmay be achieved for pulverized boilers. Emission levels and control technologies have been identifiedand ranked in Table 4-5.
There are almost 50 coal-fired boilers listed in the EPA's BACT/LAER Clearinghouse with emissionlimits for filterable particulate matter that are less than or equal to 0.02 lb/MMBtu. All but one of theselistings report that a fabric filter is utilized (the AES Puerto Rico facility is the only exception). Thecontrol of PM using fabric filtration is clearly demonstrated for coal-fired boilers.

09417-360-250R1 May, 2004
4-20
Wet control techniques (venturi or other high-energy scrubbers), on the other hand, do not represent arecently applied or demonstrated control technique for coal-fired boilers and do not offer more stringentlevels of control of particulate matter than fabric filters.
Table 4-5Ranking of Particulate Control Technology Options for Pulverized Coal-fired Boilers
Control TechnologyOption
Emission Level(lb/MMBtu)
Technically Feasibilityfor Pulverized Coal-fired Boilers?
Fabric Filter 0.01 to 0.02 for filterablePM
Yes
Electrostatic precipitator 0.015 to 0.025 forfilterable PM
Yes
High energy wet scrubber Not determined No applications in the last 15 yearsto large coal-fired boilers
Emission levels represent target steady-state values at base load, for front-half (filterable) only. Inclusion of thecondensable fraction is anticipated to double the particulate emission rate for coal-fired boilers.
4.6.1.3 PM and PM 10 Control Technology Discussion
Fabric Filter
Fabric filters are widely used for particulate control from PC boilers and are capable of over 99%control efficiency. According to EPA’s Fabric Filter Fact sheet (EPA, 2000), “flue gas is passedthrough a tightly woven or felted fabric, causing PM in the flue gas to be collected on the fabric bysieving and other mechanisms. Fabric filters may be in the form of sheets, cartridges, or bags, with anumber of the individual fabric filter units housed together in a group. Bags are most common type offabric filter. The dust cake that forms on the filter from the collected PM can significantly increasecollection efficiency. Fabric filters are frequently referred to as baghouses because the fabric is usuallyconfigured in cylindrical bags. Bags may be 6 to 9 m (20 to 30 ft) long and 13 to 31 centimeters (cm)(5 to 12 inches) in diameter. Groups of bags are placed in isolatable compartments to allow cleaningof the bags or replacement of some of the bags without shutting down the entire fabric filter.
The advantages of fabric filters include:
1) High collection efficiency for a broad range of particle sizes;
2) Flexibility in design (various methods of cleaning methods and filter media);
3) Wide range of volumetric capacities;
4) Reasonable pressure drops and power requirements; and

09417-360-250R1 May, 2004
4-21
5) Handles a wide range of solid materials.
Some disadvantages of fabric filters are as follows:
1) Danger of explosion in the presence of a spark; or catastrophic bag damage due to fire; and
2) Wet particles can agglomerate on a filter cloth if the waste gases are at a temperature close totheir dew point.
4.6.1.4 Summary of PC Boiler BACT for Particulate Matter
Fabric filters and electrostatic precipitators (ESP’s) represent technically feasible options for the controlof particulate matter from coal-fired boilers. Wet control techniques (scrubbers), on the other hand, donot represent a demonstrated control technique and do not offer more stringent levels of control ofparticulate matter than fabric filters. ESP’s are generally less effective at controlling fine particulate,and are generally incapable of any additional control of other pollutants such as acid gases or mercury,and are not considered to represent the top level of available control technology.
Based on numerous projects using fabric filters, Steag proposes to use a fabric filter as BACT to limitPM emissions to 0.010 lb/MMBtu. In addition, Steag proposes to limit total PM10 (includingcondensable PM10) emissions to 0.02 lb/MMBtu. Very little data are available on condensable PM10
emissions from western coal (or any) coal-fired boilers, and for that reason Steag proposes acondensable PM10 limit of 0.02 lb/MMBtu as BACT for total PM10, but requests a trial period of threeyears to determine the feasibility of this exceptionally low limit. The proposed PM emission rate islower than the lowest emission level for a PC unit (Wygen 2 in Wyoming) listed in EPA’sRACT/BACT/LAER Clearinghouse.
4.6.2 Auxiliary Boilers
The project includes three small distillate oil-fired auxiliary boilers with heat input capacities ofapproximately 86.4 MMBtu/hour. Total annual fuel use in the three boilers will be limited to 142,560MMBtu/year, which is equivalent to an average of 550 hours/year per boiler at full load. ProposedBACT limits for PM and PM10 are based on the use of very low sulfur distillate oil, the total annual fuellimitation of 142,560 MMBtu/year, and EPA emission factors published in AP-42 and EPA’sRACT/BACT/LAER Clearinghouse (see Attachment 2). For PM, BACT for the auxiliary boilers is theannual fuel limitation, the use of 0.05% sulfur distillate oil, and an emission limit of 0.014 lb/MMBtubased on the EPA emission factor of 2 lb/1000 gal. For PM10, BACT includes an emission limit of0.024 lb/MMBtu based on adding the condensable PM10 emissions of 0.01 lb//MMBtu (1.3 lb/1,000 galbased on AP-42) to the PM emission rate.
4.6.3 Emergency Diesel Engines
The project includes two emergency diesel generators (1,000 kW each) and two diesel generatorpowered firewater pumps (180 kW each). The diesel engines will not be operated for more than 100hours/year each. BACT emission limits include the 100 hour per year (each) operating restriction, and

09417-360-250R1 May, 2004
4-22
limits of 0.19 g/hp-hr and 0.22 g/hp-hr PM and PM10, respectively, based on EPA emission factors inAP-42.
4.6.4 Material Handling Sources
Material handling sources will be controlled by dust suppression systems, enclosures and/or fabricfilters. For example, conveyors will be constructed of enclosed design in order to eliminate wind-blowndust emissions. Conveyors will lead to transfer towers, bunkers or silos that will include a “coal drop”.Such structures will also be of enclosed design and will be evacuated (when operating) through fabricfilter units, sometimes referred to as “bin vent filters”. Enclosed design of materials handling systemand evacuation through bin vent filters represents BACT for material handling equipment.
As discussed in Section 3.4, coal handling systems will be subject to NSPS Subpart Y and limestonehandling systems will be subject to NSPS Subpart OOO. A review of the EPA RACT/BACT/LAERClearinghouse (see Attachment 2) gives a range of control efficiencies from baghouses. Although themost recent permits for coal fired power plants, Bull Mountain and Roundup Power Projects,determined that BACT was 0.01 gr/dscf for all sources, the Mid America permit identified 0.005 gr/dscffor baghouses associated with coal sources and 0.01 gr/dscf for other material handling activities.Steag proposes to also specify these filterable PM/PM10 emissions limits of 0.005 gr/dscf for coal and0.01 gr/dscf for limestone and other materials.
We note that as a mine-mouth power plant, the Desert Rock Energy Facility will avoid fugitive dustemissions associated with rail unloading operations and active on-site storage piles. The inactivestorage pile will be covered with soil, geotextile or chemical crusting agents to prevent both weatheringof the coal and fugitive dust emissions. When coal is added to or reclaimed from the inactive pile,which is expected to be very infrequently, the coal will be wetted and/or treated with chemical agents tominimize any emissions of fugitive dust. These operational measures, and those of the NSPS for coalhandling operations (Subpart Y), represent BACT for inactive storage and associated coal handlingoperations.
4.7 BACT for Sulfuric Acid Mist
4.7.1 Pulverized Coal-fired Boilers
Emissions of sulfuric acid mist are generated in fossil fuel-fired sources from the oxidation of sulfurpresent in the fuel. The amounts of sulfur or SO2 that are oxidized to sulfuric acid mist may be affectedby trace metal catalysis.
The Thoroughbred Project in Kentucky has proposed a wet electrostatic precipitator (WESP)downstream of a wet scrubber, primarily for additional control of sulfuric acid mist. We note that thisproject exhibits high uncontrolled sulfuric acid mist emission levels because it will utilize a relativelyhigh sulfur eastern coal. The proposed Desert Rock Energy Facility, by comparison, will haveuncontrolled sulfuric acid mist levels that are only a fraction of Thoroughbred’s levels.

09417-360-250R1 May, 2004
4-23
Steag recognizes, however, that sulfuric acid mist is a precursor to the formation of regional haze, andchallenged it’s affiliated German engineers (Encotec) to include active control of sulfuric acid mist inthe design of the Desert Rock Energy Facility. As a result, an additional stage of acid gas removalusing hydrated lime (a technology that is proprietary to Encotec) has been included upstream of thefabric filter to remove sulfuric acid mist before it ever enters the wet scrubber.
The application of this technology will result in emission levels lower than those permitted forThoroughbred (with an add-on WESP), and represents a level beyond BACT at a sulfuric acid mistemission rate of 0.004 lb/MMBtu.
4.7.2 Auxiliary Boilers and Diesel Generators
No control alternatives beside the use of very low sulfur fuels have been identified for industrial boilersor emergency diesel generators. BACT for sulfuric acid mist for the proposed auxiliary boilers andemergency diesel engines is the use of low sulfur (0.05% S) distillate oil.
4.8 BACT for Hydrogen Fluoride
Emissions of hydrogen fluoride are generated in fossil fuel-fired sources from the oxidation of fluorinepresent in the fuel. For the PC boilers, the same proprietary acid gas pre-control technology designedby Encotec will control hydrogen fluoride emissions through the injection of hydrated lime before thefabric filter, with additional removal expected from the wet limestone scrubbing. Steag is proposing ahydrogen fluoride emission rate of 0.00024 lb/MMBtu based on an assumed concentration of fluorinein the coal of 100 ppm (estimated 98% control) as BACT. This emission rate is consistent with orlower than all recent BACT decisions.
No appreciable HF is emitted from distillate oil-fired industrial auxiliary boilers or emergency dieselengines, and the use of low fluorine bearing fuel (very low sulfur distillate oil) represents BACT for HFfor these emission sources.
4.9 BACT for Lead
Emissions of lead are generated in fossil fuel-fired sources from the impurities present in the fuel.Since lead is emitted as solid particulate from coal-fired boilers, it is already included in the PM andPM10 emission selected as BACT. BACT for lead emissions from the proposed PC boilers is thecontrol of PM emissions using fabric filtration (baghouse), and the emission limits determined torepresent BACT for PM10.
For distillate oil-fired industrial auxiliary boilers and emergency diesel engines, the use of low ash fuelsuch as distillate oil represents BACT.
4.10 Summary of BACT Emission Levels
The BACT levels determined through this evaluation for the Desert Rock Energy Facility aresummarized in Tables 4-6 and 4-7.

09417-360-250R1 May, 2004
4-24
Table 4-6Summary of Proposed BACT Emission Limits for PC and Auxiliary Boilers
Pollutant Emissions Limit(lb/MMBtu) Control Technology
Pulverized Coal-fired Boilers
NOx 0.06, 24-hour average, based oncontinuous emission monitoring
Low-NOx burners and SCR
SO2 0.06, 24-hour average, based oncontinuous emission monitoring
Low sulfur western coal, hydrated limeinjection before the fabric filter, and wetlimestone desulfurization
CO 0.10, 24-hour average, based oncontinuous emission monitoring
Good combustion practices
VOC 0.003, based on EPA Methods 25A and 19 Good combustion practices
PM 0.01, based on EPA Method 51 Baghouse
PM10 0.02 (total)2, based on EPA Methods 201or 201A and 2023
Baghouse
Pb No limit Baghouse
H2SO4 0.004, annual average, based on EPAMethod 8
Low sulfur western coal, hydrated limeinjection before the fabric filter, and wetlimestone desulfurization
HF 0.00024, annual average, based on EPAMethod 13B
Hydrated lime injection before the fabricfilter, and wet limestone desulfurization
Auxiliary Boilers
NOx 0.10 Low-NOx burners
SO2 0.05 Low sulfur distillate oil (0.05% S)
H2SO4 0.00087 Low sulfur distillate oil (0.05% S)
CO 0.036 Good combustion
VOC 0.0024 Good Combustion
PM 0.0101 Low sulfur distillate oil and goodcombustion
PM10 0.0243 Low sulfur distillate oil and goodcombustion
1. PM is defined as filterable particulate matter as measured by EPA Method 5.
2. Since insufficient information exists regarding whether this low limit is achievable, Steag proposes a three yeardemonstration test period.
3. PM10 is defined as solid particulate matter smaller than 10 micrometers diameter as measured by EPA Method201 or 201A plus condensable particulate matter as measured by EPA Method 202. Because PM10 includescondensable particulate matter and PM does not include condensable particulate matter, PM10 emissions arehigher than PM emissions.

09417-360-250R1 May, 2004
4-25
Table 4-7Summary of Proposed BACT Emission Limits for Other Sources
Pollutant Emissions Limit Control Technology
Emergency Generator and Firewater Pump
NOx 6.5 g/hp-hr Ignition timing retard, turbo-charging and after-cooling
SO2 0.19 g/hp-hr Low sulfur distillate oil (0.05% S)
H2SO4 0.006 g/hp-hr Low sulfur distillate oil (0.05% S)
CO 0.5 g/hp-hr Good combustion
VOC 0.3 g/hp-hr Good combustion
PM/PM10 0.24 g/hp-hr Low sulfur distillate oil and good combustion
Materials handling systems
PM/PM10 0.005 gr/dscf (filterable) for coalhandling baghouses and 0.01gr/dscf (filterable) for othermaterials
Enclosures, dust suppression, and fabric filters
4.11 Maximum Achievable Control Technology (MACT)
The Desert Rock Energy Facility will be a major source of HAPs. Since the MACT standard for coal-fired boilers has not been finalized, this application presents a hazardous air pollutant controltechnology analysis, that may be used to comply with case-by-case MACT if ultimately required bySection 112 (g) of the Clean Air Act for control of HAP emissions. We note that EPA has recentlyproposed an NSPS alternative to regulation under MACT. Should such a Rule be adopted in lieu of anapplicable Section 112 MACT Standard, the Desert Rock Energy Facility will be required to meet it.The analysis addresses: (1) non-mercury metallic HAP emissions, (2) mercury emissions, acid gases(hydrogen chloride and hydrogen fluoride), and organic HAPs.
We note that mercury control of emission sources such as coal-fired power plants is standardtechnology in Germany, and that Steag’s engineering affiliate Encotec brings the benefit of thisexperience to the proposed Desert Rock project. The proposed emission control train has beendesigned specifically to control mercury and other hazardous air pollutants to extremely low levels,particularly for a facility designed to burn Western coal.
Non-mercury metallic HAPs are emitted as part of the particulate emissions from coal combustion.The proposed Desert Rock Energy Facility will use fabric filter technology to limit PM emissions to 0.01lb/MMBtu, which is the lowest permitted emission rate for a coal-fired boiler and is, therefore,equivalent to LAER. EPA has used PM emission limits as surrogates for control of HAP metalemissions since a strong correlation exists between metallic HAP emissions and PM emissions.

09417-360-250R1 May, 2004
4-26
Therefore, the proposed fabric filter and PM emission rate represent a case-by-case MACT (orequivalent standard) for non-mercury metallic HAPs.
EPA’s proposals for mercury control are in a state of flux. However, as a new coal project engineeredin Germany, the Desert Rock Energy Facility is being designed to achieve an 80% reduction inmercury based on the mercury and chlorine characteristics of the Navajo Reservation (Western) coal.Contributing mercury reductions will be achieved in the SCR, through injection of adsorbent(s)upstream of the fabric filter, in the filter cake of the fabric filter itself, and finally through humidification,cooling and impingement in the wet flue gas desulfurization system. It is widely thought that additionalscrubber additives may become available in the next ten years that may be capable of furtherreductions.
In any event, Steag Power is proposing state-of-the-art mercury control, which represents case-by-case MACT (or equivalent standard) for control of mercury from burning Western coal. Based on theaverage expected mercury content of 0.046 ppm and 80% control efficiency, it is expected thatmercury emissions will be 8.64 x 10⁶ lb/MWh as compared to the proposed MACT standard of 20 x 106
lb/MWh as an annual average.
Hydrogen chloride and hydrogen fluoride will be controlled in two active stages: by the proprietary pre-control technology of injection of sorbents such as hydrated lime before the fabric filer followed by wetflue gas desulfurization. HCI will be controlled to less than 0.003 lb/MMBtu, and control efficiencies ofat least 98% for HF are expected. The proposed emissions controls, emission limits and high controlefficiencies represent case-by-case MACT (or equivalent standard) as well as top down BACT for HCIand HF.
Organic HAP emissions will be controlled by good combustion to limit CO and VOC emissions. Highcombustion efficiency as shown by the BACT emission rates for CO and VOC represents MACT (orequivalent standard) as well as top down BACT for organic HAP emissions.

09417-360-250R1 May, 2004
5-1
5.0 PROJECT EMISSIONS
Potential criteria pollutant emissions are summarized in Section 5.1. Startup and shutdown emissionare discussed in Section 5.2. Potential emissions of hazardous air pollutants are summarized inSection 5.3. Emission rates are based on preliminary plant design data from Steag, Encotec, othervendor data, and EPA emission factors from AP-42. Detailed emission calculations and stackparameters for each source are presented in Attachment 3.
5.1 Criteria Pollutant Emissions
Emissions of all criteria pollutants from all sources are controlled by applying BACT. Maximum annualcriteria pollutant emission rates are summarized in Table 5-1. The two 750 MW PC boilers are theprimary emission sources.
5.2 Startup and Shutdown Emissions
Start up and shutdown emissions have received much attention in the permitting of combustionturbines, since those sources may exhibit higher mass emissions during start up than during maximumoperation. This is generally not the case for coal-fired boilers, which exhibit peak mass emission ratesat maximum firing rate. Startup and shutdown procedures for the pulverized coal-fired boilers aredesigned to provide for equipment protection while minimizing emissions. Initial start up duration afteran outage may be dictated by the need to gradually warm up refractory materials, metal surfaces, andthe 750 MW steam turbine, and this is normally accomplished with start up fuel (such as oil), auxiliarysteam (to help preheat steam-side components) and low load operation. Startups are defined as cold,warm and hot to account for the amount of latent heat still in the boiler. The different starts are definedby the amount of time the boiler has been down. Cold starts are defined as starts after the boiler hasbeen down for more than 72 hours, warm starts more than 8 hours and less than 72 hours and hotstarts less than 8 hours. The design time required to safely bring each boiler up is defined below. Afailed start sequence or “trip” could require longer duration.
• 6.5 hours for a cold start;
• 4.0 hours for a warm start; and
• 2.6 hours for a hot start.
It is just as important not to cool the boiler down too fast. A normal shutdown will require 3-4 hours.
The maximum number of startups is anticipated to be 60 per year, an average of 30 per boiler (4 cold,10 warm and 16 hot). Startup and shutdown operations do not result in any excess daily or annualemissions compared to normal continuous operation. Thus, Desert Rock Energy Facility does notrequest any additional limits (beyond maximum allowable mass emission limits) to govern operationsduring start up and shutdown.

09417-360-250R1 May, 2004
5-2
Table 5-1Summary of Criteria Pollutant Maximum Potential Emissions
Pollutant PC Boilers(tpy)
AuxiliaryBoilers
(tpy)
EmergencyGenerators
(tpy)
Fire WaterPumps
(tpy)
MaterialHandling
(tpy)
StorageTanks(tpy)
ProjectPTE(tpy)
CO 5,526 2.55 0.17 0.031 n/a n/a 5,529
NOx 3,315 7.13 2.26 0.41 n/a n/a 3,325
SO2 3,315 3.61 0.068 0.012 n/a n/a 3,319
PM1 553 1.02 0.083 0.015 16.1 n/a 570
PM102 1,105 1.68 0.077 0.014 12.9 n/a 1,120
VOC 166 0.17 0.11 0.019 n/a 0.14 166
Lead 11.1 0.00064 0.000012 0.0000022 n/a n/a 11.1
Fluorides 13.3 neg neg neg neg neg 13.3
H2SO4 221 0.062 0.002 0.0004 n/a n/a 221
Mercury 0.057 0.000071 neg neg n/a n/a 0.057
HydrogenSulfide
neg neg neg neg n/a n/a neg
TotalReducedSulfur
neg neg neg neg n/a n/a neg
ReducedSulfurCompounds
neg neg neg neg n/a n/a neg
n/a – not applicable, neg. – negligible
1. PM is defined as filterable particulate matter as measured by EPA Method 5.
2. PM10 is defined as solid particulate matter smaller than 10 micrometers diameter as measured by EPA Method 201or 201A plus condensable particulate matter as measured by EPA Method 202. Because PM10 includescondensable particulate matter and PM does not include condensable particulate matter, PM10 emissions arehigher than PM emissions.
The facility design also includes three 86.4 MMBtu/hour boilers, equipped with superheaters, burninglow sulfur distillate oil (0.05% sulfur) to provide steam to assist with reducing the time for startup of themain boilers by preheating key areas. When the flue gas temperature of the PC boilers exceeds 600°F(320°C), which typically approximates a boiler load of 40%, the SCR system is placed in service andstartup is complete. The SCR will not function at temperatures below 600°F (320°C).
During a cold start, two auxiliary boilers will start providing steam to the main boiler and/or the steamturbine at least one hour before any fuel is fired in the main boiler. For the next 4.5 hours, boilerequipment will be gradually warmed up using steam from the auxiliary boilers and by firing low sulfur

09417-360-250R1 May, 2004
5-3
distillate oil (0.05%) in the main boiler. During the last hour, an auxiliary boiler will continue to operatewhile pulverized coal feeding is started and gradually increased until the boiler reaches 40% loadcompleting startup.
A warm start requires less time than a cold start because the equipment is hotter and thermal stressesare reduced. For a warm start, two auxiliary boilers will start providing steam to the main boiler and/orthe steam turbine approximately one hour before any fuel is fired in the main boiler. For the next 2hours, boiler equipment will be gradually warmed up using steam from the auxiliary boilers and byfiring low sulfur distillate oil (0.05%) in the main boiler. During the last hour, an auxiliary boiler willcontinue to operate while pulverized coal feeding is started and gradually increased until the boilerreaches 40% load completing startup.
A hot start only requires 2.6 hours because the equipment is relatively hot and thermal stresses arereduced. A hot start begins with firing of low sulfur distillate oil in the main boiler. After approximately 5minutes, two auxiliary boilers will start providing steam to the main boiler and/or the steam turbine.After about one hour, feeding of pulverized coal will be started. For the remaining 1.6 hours, the coalfeed rate will be gradually increased while the auxiliary boiler load and oil firing rate to the main boilerare decreased. During a hot start, average hourly emissions of all pollutants, except for NOx, are lessthan normal full load emissions. The slightly elevated NOx emission rates during startup are of a shortduration and do not result in any long-term increase in emissions compared to normal continuousoperation.
For a routine shutdown, an auxiliary boiler begins providing steam approximately 15-20 minutes beforethe coal feed rate is decreased below 40% load. At 40% load, the SCR is taken out of service. Thecoal feed rate is gradually decreased to 0% over a two-hour period. Toward the middle of this period,oil firing in the main boiler is started and the auxiliary boiler continues to operate. After coal feedingstops, oil firing continues in the main boiler for about 0.5 hours. During a shutdown, average hourlymass emissions of all pollutants are less than normal full load emissions.
5.3 Hazardous Air Pollutant Emissions
Emissions of HAPs are controlled by applying BACT as well as technology that would also qualify asMACT. Maximum annual HAPs emission rates are summarized in Table 5-2. Maximum emissions forall HAPs from the project are 227.8 tons/year with the pulverized coal-fired boilers accounting for 227.2tons/year. Hydrogen chloride emissions of 166 ton/year and hydrogen fluoride emissions of 13.3tons/year account for most of the emissions from the pulverized coal-fired boilers. Maximum mercuryemissions are estimated to be less than 0.06 tons/year.

09417-360-250R1 May, 2004
5-4
Table 5-2HAP Emissions Summary
Emissions UnitHAP Emissions
(tpy)
Main Boilers 227.8
Auxiliary Boilers 0.0037
Emergency Generators 0.0020
Diesel Fire Pumps 0.0009
Total Facility HAP Emissions (tpy) 227.8

09417-360-250R1 May, 2004
6-1
6.0 AIR QUALITY IMPACT ANALYSIS
6.1 Overview
This Section of the PSD application addresses all PSD requirements related to air quality and airquality related values impact analyses. The location of the Desert Rock Energy Facility isapproximately 25 - 30 miles (40 – 60 km) southwest of Farmington, New Mexico in the Four CornersArea where Arizona, Colorado, New Mexico and Utah meet. It is a region that contains a significantnumber of National Parks and Wilderness Areas, some of which have been designated as PSD Class Iareas. Steag and ENSR have worked closely with EPA and the Federal Land Managers (FLMs) fromboth the National Park Service (NPS) and the USDA Forest Service, as well as other Navajo Nation,State and Federal agencies, to perform the analyses for determining the potential for air qualityimpacts from this Project.
A slightly revised modeling protocol is provided in Attachment 4 and it describes the dispersionmodeling procedures for determining the air quality impact of the proposed facility on nearby PSDClass I and II areas. A review of the modeling procedures is presented in Section 6.2. The PSD ClassII modeling analysis consists of two components:
1) A “near-field” Class II modeling analysis to determine maximum impacts in the vicinity of theDesert Rock Energy Facility, and
2) A “distant” Class II modeling analysis that reviewed impacts at areas identified by the FLMsthat do not qualify for Class I protection under the Clean Air Act.
The near-field Class II and distant Class II modeling analysis and results are described in Sections 6.3and 6.4, respectively. Next the results of the analyses performed, including increment analyses,visibility and acid deposition assessments, for the Class I areas are given in Section 6.5. For thoseimpacts that were modeled to be over a significant impact criteria, cumulative analyses are provided inthe appropriate sections. Section 6.6 discusses additional impact analyses, such as a growthassessment, soils and vegetation analysis, ozone impact review, and other impact issues. The resultsof all the evaluations are then summarized in Section 6.7. The analyses conclude that operation of theDesert Rock Energy Facility will not have a significant adverse impact on air quality or related values inthis region.
6.2 Modeling Procedures
As discussed in the modeling protocol, ENSR used the CALPUFF modeling system for both the ClassI PSD modeling and Class II analyses due to the presence of complex winds in the vicinity of theproposed Desert Rock Energy Facility.

09417-360-250R1 May, 2004
6-2
ENSR used the following versions of the CALPUFF modeling system:
• CALMET version 5.2 (level 000602d),
• CALPUFF version 5.5 (level 010730_1), and
• CALPOST version 5.2 (level 991104d).
These software versions are the ones associated with the latest available user guides. Although EPAhas announced the availability of 2003 versions of the CALPUFF modeling system, these are stillbeing debugged and do not have any user’s guides available.
6.2.1 Meteorological Data
The meteorological data that was used as input to CALPUFF features three years of prognosticmesoscale meteorological (MM) data, as is recommended by the Guideline on Air Quality Models(Section 9.3.1.2(d)). The most advanced MM data was used, consisting of 2001-2003 hourlymeteorological data archived from the Rapid Update Cycle (RUC) model. Horizontal data resolutionfor the RUC model is 40 kilometers for 2001 and 2002, and 20 kilometers for 2003. The Rapid UpdateCycle data is referred to as “RUC40” for the 40-km resolution data and “RUC20” for the 20-kmresolution data. A technical paper describing a precedent for the regulatory use of this type of data in aNorth Dakota CALPUFF application is provided in Appendix B of the modeling protocol.
The CALMET modeling conducted for the nearby PSD Class II area used 1.5-km grid spacing,encompassing an area 210-km square. The CALMET modeling for the distant PSD Class II areas andthe PSD Class I area encompassed a 680 km x 552 km (E-W / N-S) area with a 4-km grid elementsize. Details regarding the CALMET modeling are provided in the modeling protocol (Attachment 4).
6.2.2 Stack Characteristics and Emissions
The PSD Class I and II modeling analyses used emission rates presented in Tables 6-1 through 6-4 forthe Desert Rock Energy Facility, which characterize emissions from the main stack and other ancillarycombustion sources associated with the plant. There are three start-up and one shutdown emissionsscenarios for the facility, as described in Section 3 of the modeling protocol. All of the start-up andshutdown emissions are less than minimum load (40% load) case and have not been modeledseparately.
CALPUFF has the ability to change the heat input rate as a function of the ambient temperature byusing an adjustment factor based on a reference ambient temperature. Steag provided data on thetemperature dependence of the heat input rate as shown in Table 6-5 for the 100% load case. Thesedata were used as input to the source characterization to more accurately model the hourly emissionsfrom the main stack at 100% and 40% load cases.
The Class I analysis modeled the main stack only at 100 percent load. A SCREEN3 analysis,provided in Appendix D of the modeling protocol, indicates that the lowest (40%) load case canpossibly lead to the highest near-field concentration predictions. Therefore, for the Class II analysis,

09417-360-250R1 May, 2004
6-3
the main stack at both 40 and 100 percent (maximum and minimum) load for both one and two unitsoperating was modeled, and emissions from the auxiliary boiler, the diesel generator and fire waterpump, and the material-handling sources were also included. The material handling sources wereconservatively modeled at 0.01 grains per dry standard cubic foot, although the emission pointsassociated with coal handling will be controlled to 0.005 grains per dry standard cubic foot.
Table 6-1Emission Rates and Stack Parameters for Each of the Main
BoilersPlant Performance Units 100% Load 40% Load
Full Load Heat Input to Boiler MMBtu/hr 6,810 2,724Emissions per BoilerSO2 (24-hour average) lb/MMBtu 0.060 0.060Hourly Emissions g/s 51.5 20.6NOX (24-hour average) lb/MMBtu 0.060 0.060Hourly Emissions g/s 51.5 20.6PM10 Total lb/MMBtu 0.020 0.020Hourly Emissions g/s 17.2 6.86CO lb/MMBtu 0.100 0.100Hourly Emissions g/s 85.8 34.3H2SO4 lb/MMBtu 0.0049 0.0049Hourly Emissions g/s 4.20 1.68Pb lb/MMBtu 0.00020 0.00020Hourly Emissions g/s 0.17 0.07Stack Parameters
Stack Gas Exit Temperature F 122 122K 323.15 323.15
Stack Gas Exit Velocity ft/s 82 32.8m/s 24.99 10.00
Stack Height ft 917 917m 279.5 279.5
Stack Diameter ft 36.77 36.77m 11.21 11.21

09417-360-250R1 May, 2004
6-4
Table 6-2Emission Rates and Stack Parameters for Each Auxiliary Steam Generator
Estimated Annual Hours of Operation: 550 hours/year
Stack Height: 98 feet
Stack Diameter: 2.924 feet
Stack Flow Rate: 33,038 cfm
Average Stack Exit Temperature: 284 oF
Stack Exit Velocity: 82 ft/s
Hourly Emissions Annual EmissionsPollutant
(lb/hr) (g/s) (lb/MMBtu) (tpy) (g/s)
CO 3.09 0.39 0.036 0.85 0.024
NOx 8.64 1.09 0.1 2.38 0.068
PM10 Total 2.04 0.26 0.024 0.56 0.016
SO2 4.38 0.55 0.051 1.20 0.035
H2SO4 0.076 0.010 0.00087 0.021 0.0006
Pb 0.00078 0.00010 0.000009 0.00021 0.00006
Table 6-3Emission Rates and Stack Parameters for Each Emergency Diesel GeneratorMaximum Annual Hours of Operation: 100 hours/year
Stack Height: 45 feet
Stack Diameter: 3 feet
Stack Flow Rate: 9058 cfm
Stack Gas Exit Temperature: 870 oF
Stack Gas Exit Velocity: 21 ft/s
Hourly Emissions Annual EmissionsPollutant
(lb/hr) (g/hp-hr) (g/s) (tpy) (g/s)
CO 1.74 0.50 0.22 0.09 2.5E-03
NOx 22.61 6.50 2.85 1.13 0.033
PM10 Total 0.77 0.22 0.10 0.04 1.10E-03
SO2 0.68 0.19 0.09 0.03 9.72E-04
H2SO4 0.02 0.01 0.003 0.00 2.95E-05
Pb 1E-04 3E-05 2E-05 6E-06 1.73E-07

09417-360-250R1 May, 2004
6-5
Table 6-4Emission Rates and Stack Parameters for Each Diesel Fire Water Pump
Maximum Annual Hours of Operation: 100 hours/year
Stack Height: 30 feet
Stack Diameter 0.6 feet
Stack Flow Rate: 1265 cfm
Stack Gas Exit Temperature: 900 oF
Stack Gas Exit Velocity: 74 ft/s
Hourly Emissions Annual EmissionsPollutant
(lb/hr) (g/hp-hr) (g/s) (tpy) (g/s)
CO 0.31 0.50 0.04 1.57E-02 4.5E-04
NOx 4.07 6.50 0.51 0.204 5.85E-03
PM10 Total 0.12 0.19 0.02 6.9E-03 1.98E-04
SO2 0.12 0.19 0.02 6.08E-03 1.75E-04
H2SO4 0.004 0.01 0.0005 1.84E-04 5.3E-06
Pb 2.E-05 3.E-05 3.E-06 1.08E-06 3.12E-08
Table 6-5Adjustment Factor for 100% Load Heat Input Rate
Emissions, lb/MMBtuTemperature Heat input
F CFactor
MMBtu/hr MMBtu/hr<32 <0 0.9230 6,286 12,57236.5 2.5 0.9299 6,332 12,66545.5 7.5 0.9343 6,363 12,72654.5 12.5 0.9398 6,400 12,80063.5 17.5 0.9465 6,446 12,89272.5 22.5 0.9528 6,489 12,97781.5 27.5 0.9609 6,543 13,08790.5 32.5 0.9698 6,604 13,20899.5 37.5 0.9869 6,721 13,442108.5 42.5 1.0000 6,810 13,620117.5 47.5 1.0135 6,902 13,804>122 >50 1.0310 7,021 14,043

09417-360-250R1 May, 2004
6-6
6.2.3 Significance Criteria and PSD Increments
In order to determine if impacts could be considered significant, modeling results are compared toSignificant Impact Levels (SILs), which act as screening levels to determine if further analysis isrequired. Table 6-6 provides the PSD Class II and Class I SILs that were used for this application. Ifimpacts are determined to be greater than the SILs, then a cumulative analysis is performed whichincludes background emission sources that would consume PSD increment. The PSD Class II andClass I increments, which are levels that cannot be exceeded, are also shown in Table 6-6.
Beside a PSD increment consumption analysis, if impacts exceed the relevant SILs, an ambient airquality standards (AAQS) analysis is also needed. The National and New Mexico AAQS wereprovided in Tables 3-1 and 3-2, respectively.
Table 6-6Significant Impact Levels and PSD Increments
Significant Impact Levels PSD Increments
PollutantAveraging
Period Class II 1
(µg/m3)Class I 2
(µg/m3)Class II(µg/m3)
Class I(µg/m3)
NO2 Annual 1 0.1 25 2.5
Annual 1 0.1 20 2
24-hour 5 0.2 91 5
SO2
3-hour 25 1 512 25
Annual 1 0.2 17 4PM10
24-hour 5 0.3 30 8
8-hour 500 N/A N/A N/ACO
1-hour 2,000 N/A N/A N/A
1. Not to be exceeded2. Proposed by EPA (1996; 61 FR 38249)There are no SILs or PSD Increments for ozone or lead.
6.2.4 Background Source Inventory
As will be described in Sections 6.3 and 6.5, the results of the modeling analyses determined thatbackground source inventory data were needed for SO2 sources both in the vicinity of the Desert RockEnergy Facility and the Class I areas, and PM10 sources were needed in the vicinity of the facility.
The source emissions data were obtained for an area out to 50 kilometers beyond the PSD Class IIpollutant-specific Significant Impact Areas (SIAs) for modeling compliance with the Class II increments

09417-360-250R1 May, 2004
6-7
and the NAAQS. Source data for the PSD Class I areas were obtained from the entire modelingdomain, following suggestions by the National Park Service (NPS), provided below. The sourceinformation used in the modeling was obtained from several sources (see the modeling archive):
• The National Park Service for three projects in Utah and New Mexico
• The state agencies in Utah, Colorado, Arizona, and New Mexico
• EPA’s 1999 National Emissions Inventory
• Aerial/satellite photos, topographic maps, and eyewitness information for the Navajo Nation.
Agency communications and documents relating to the background emissions inventory are providedin the modeling data archive (provided separately).
For the PSD Class II cumulative modeling, all sources, regardless of size, were selected within the SIAitself. Beyond the SIA, all SO2 sources were modeled except for very small sources with an emissionrate in tons per year (tpy) that was smaller than 0.8D, where D is the distance from the SIA inkilometers (km). The 0.8D relationship is based upon a NPS suggestion, and is consistent with athreshold emission rate of 40 tpy at a distance of 50 km. For PM10, the relationship applied was 0.3D.In either case, the relationship is consistent with the PSD significant emission rate threshold at adistance of 50 km. D was calculated based on the center of the circle that encompassed the receptorsat which the project is significant. The resulting PSD Class II SO2 and PM10 inventories are provided inSection 6.3.
For the NAAQS analysis, a regional background value was added for SO2 and PM10. Table 6-7 liststhe second-highest short-term and highest annual concentrations observed for each monitor.
Table 6-7Regional Background Concentrations for NAAQS Analysis
Measured Concentrations (µg/m3)Pollutant Monitor Site
AveragingPeriod 2000 2001 2002
3-hour 62.9 65.5 68.1SO2
1300 W. Navajo,Farmington, San Juan
CountyID 35-045-0008-42401-1
24-hour 18.3 18.3 21.0
24-hour 27.0 27.0 38.0PM10
W. Animas, Farmington,San Juan County
ID 35-045-0006-81102-1 Annual 16.0 17.0 17.0
For the PSD Class I cumulative modeling, all PSD sources with emissions of at least 100 tpy weremodeled for all applicable Class I areas, regardless of distance, as long as the sources were locatedinside the modeling domain. In addition, sources of at least 40 tpy between 50 and 100 km of a givenClass I area were included, as well as sources larger than 0.8D within 50 km of a Class I area. The

09417-360-250R1 May, 2004
6-8
additional sources less than 100 tpy were small in number, so all sources were modeled for the Class Iareas for simplicity in approach. The PSD Class I inventory for non-project SO2 sources is provided inSection 6.5.
6.3 Near-field PSD Class II Modeling Analyses
A modeling domain that extends approximately 105 kilometers in all directions from the proposedfacility location was used in this near-field Class II CALPUFF modeling analysis, as shown in Figure6-1. The total domain size of 210 kilometers was chosen because the maximum extent of the SIA isgenerally considered to be 50 kilometers from the proposed source location, but the high terrain in theUte Mountains in northern New Mexico was also populated with receptors out to about 55 km. Anadditional buffer distance of 50 km was provided for inclusion of background sources in a possiblecumulative source analysis. This design allows a 210 km x 210 km (E-W / N-S) grid with a 1.5-km gridelement size. The southwest corner of the grid is located at approximately 35.55°N latitude and109.75°W longitude.
6.3.1 Source and Receptor Locations
The proposed facility’s central location is noted by the UTM coordinates of the main stack, which are721,703.3 m (Easting) and 4,040,903.95 m (Northing) (UTM zone 12, North American Datum 1983[NAD83]). The Lambert Conformal location of this stack is 129.21 km (east) and 54.14 km (north),based on reference coordinates of 36° N latitude and 110° W longitude along with 30° N and 60° N asthe two standard parallels. The Class II CALPUFF analysis used receptors based on this LambertConformal projection and the main stack as the center of the grid (see Figure 6-2). Figure 6-3 showsthe near field receptor grid and fenceline. Receptors were placed along the proposed facility fence linespaced at every 50 meters. A multi-layered Cartesian grid combined with a polar grid extends out fromthe main stack as far as to resolve the SIA. The Cartesian receptor grid consists of 100-meter spacedreceptors beyond the fenceline out to 1.5 km, 250-meter spacing was used beyond 1.5 km out to 4 km,500-meter spacing was used beyond 4 km out to 8 km, and 1000-meter spacing was used beyond 8km out to 10 km. Beyond 10 km, polar grid receptors were used. The polar grid receptors were placedalong 36 10o radials extending from the central location of the main stacks. Receptors between 10 kmand 20 km were placed along each radial every 1000 meters, and from 20 km to 50 km, 5000-meterspacing were used. Additional densely spaced receptors were placed in one specific area withcomplex terrain (in the Ute Mountains to the north, in the direction where the proposed facility, the FourCorners Power Plant, and the San Juan Generating Station line up) to ensure resolution of themaximum impacts in that area. The near-field receptor elevations were developed from 7.5 minute(~30 meter spaced) and 10-meter spaced Digital Elevation Model (DEM) files. The polar coarse gridreceptors were developed from 90-meter spaced DEM files.

09417-360-250R1 May, 2004
6-9
Figure 6-1 Class II CALPUFF Modeling Domain

09417-360-250R1 May, 2004
6-10
Figure 6-2 Class II Receptor Grid

09417-360-250R1 May, 2004
6-11
Figure 6-3 Near-Field Receptor Grid

09417-360-250R1 May, 2004
6-12
6.3.1.1 Good Engineering Practice Stack Height Analysis
Federal stack height regulations limit the stack height used in performing dispersion modeling topredict the air quality impact of a source. Sources must be modeled at the actual physical stack heightunless that height exceeds the Good Engineering Practice (GEP) stack height. If the physical stackheight is less than the formula GEP height, the potential for the source's plume to be affected byaerodynamic wakes created by the building(s) must be evaluated in the dispersion modeling analysis.
A GEP stack height analysis was performed for all point emission sources that are subject to effects ofbuildings downwash at the proposed facility in accordance with the EPA's "Guideline for Determinationof Good Engineering Practice Stack Height” (EPA, 1985). A GEP stack height is defined as thegreater of 65 meters (213 feet), measured from the ground elevation of the stack, or the formula height(Hg), as determined from the following equation:
Hg = H + 1.5 L
where
H is the height of the nearby structure which maximizes Hg, and
L is the lesser dimension (height or projected width) of the building.
Both the height and the width of the building are determined through a vertical cross-sectionperpendicular to the wind direction. In all instances, the GEP formula height is based upon the highestvalue of Hg as determined from H and L over all nearby buildings over the entire range of possible winddirections. For the purposes of determining the GEP formula height, only buildings within 5L of thesource of interest are considered.
The GEP analysis was conducted with EPA’s BPIP program, version 95086. The building-specificwind directions were used as input to CALPUFF. Figures 6-4 and 6-5 show the buildings and stacksconsidered in the GEP analysis. The steam generator buildings (Building 1 in Figure 6-4) located westof the main stack were the determinants in this analysis. Each of these two buildings is 367 feet talland 213 long. The BPIP program combines these two buildings as a squat structure and uses theformula Hg = 2.5 x H. In this case the GEP stack height is 917 feet. The gray areas in Figure 6-5represent the areas modeled for the road network. The main stack of 917 feet is at GEP height,therefore no building dimensions were included in CALPUFF for the main stack.
A review of the distances between each source and controlling building and the plant fencelineindicated that all potential building cavities that affect stacks would be wholly contained within the plantproperty. As a result, no further analysis of building cavity effects is necessary.
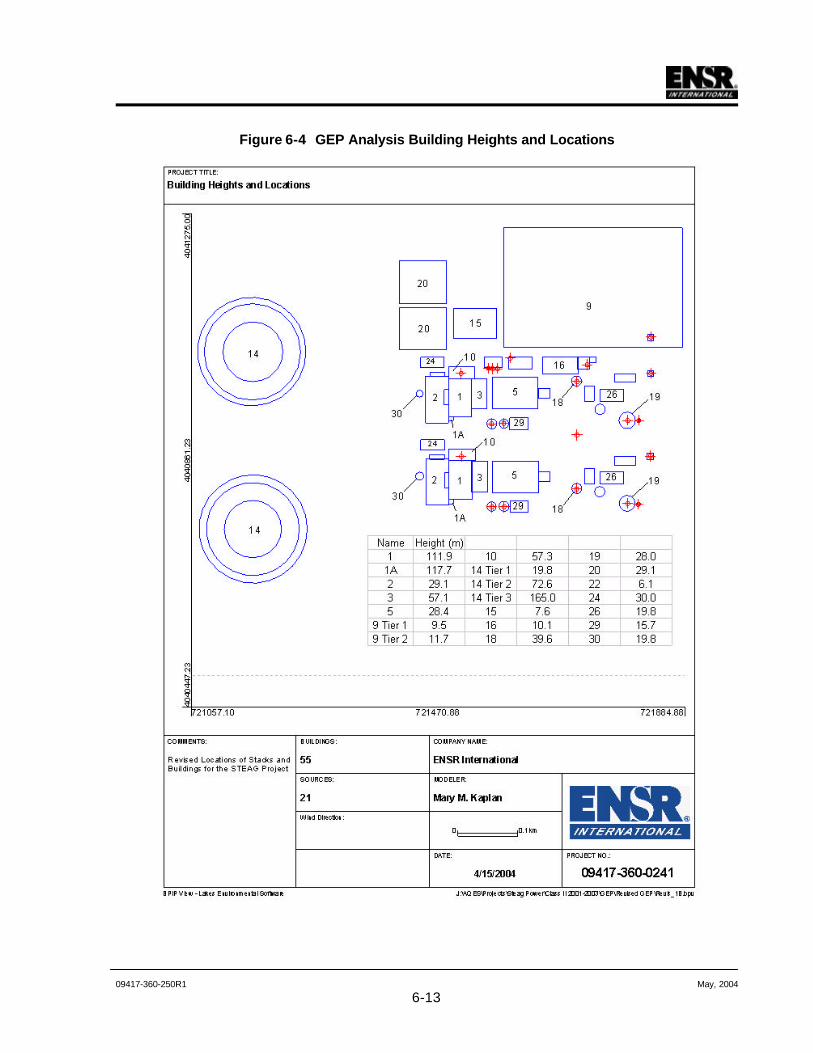
09417-360-250R1 May, 2004
6-13
Figure 6-4 GEP Analysis Building Heights and Locations

09417-360-250R1 May, 2004
6-14
Figure 6-5 GEP Analysis Stack Heights and Locations

09417-360-250R1 May, 2004
6-15
6.3.2 Near-field Project Only Class II Modeling Results
Results of the near-field (within 55 km) PSD Class II increment modeling from proposed Desert RockEnergy Facility emissions are provided in Tables 6-8a and 6-8b. The results indicate the following:
• The project emissions have a significant impact for SO2 and PM10, and an insignificant impact forCO and NOx.
• The project impacts are below the PSD increments. Most of the peak air quality impacts are within1 kilometer of the plant fenceline, so there is little likelihood for interaction with other sources in thearea.
• The following Significant Impact Area distances resulted:
Ø 11.0 km for SO2, and
Ø 1.7 km for PM10.
• The project has an insignificant impact for all pollutants modeled in areas outside the NavajoNation, including the area to the north in the Ute Mountains.
Table 6-8aMaximum Predicted Air Quality Impacts from the Proposed Project: Navajo Nation
PollutantAveraging
Period
MaximumModeled
Conc.(µg/m3)
Distance(km)
Bearing(Deg.)
SIL(µg/m3)
% ofSIL
PSDClass II
Increment(µg/m3)
% ofIncr.
NAAQS(µg/m3)
% ofAmbientStandard
NOX Annual 0.62 1 1.0 307 1 62% 25 2% 100 1%3 hour 2 130.60 1.1 129 25 522% 512 26% 1,300 10%
24 hour 16.35 0.6 44 5 327% 91 18% 365 4%
SO2
Annual 0.65 3.3 130 1 65% 20 3% 80 1%24 hour 10.16 0.6 40 5 203% 30 34% 150 7%PM10
Annual 2.04 0.5 19 1 204% 17 12% 50 4%1 hour 427.47 1.1 129 2000 21% N/A N/A 40,000 1%CO8 hour 3 145.01 1.1 129 500 29% N/A N/A 1,000 15%
Pb Quarterly 0.04 1.1 129 N/A N/A N/A N/A 2 3%1. National default ratio of 0.75 for NO2/NOx used.2. For 3-hour averages, an SO2 emission rate of 0.09 lb/MMBtu was assumed to account for short term variability.3. CALPUFF does not provide 8-hour average results, so a conservatively high 3-hour average is provided for CO.

09417-360-250R1 May, 2004
6-16
Table 6-8bMaximum Predicted Air Quality Impacts from the Proposed Project: New Mexico
PollutantAveraging
Period
MaximumModeled
Conc.(µg/m3)
Distance(km)
Bearing
(Deg.)
SIL(µg/m3)
% ofSIL
PSDClass II
Increment(µg/m3)
% ofIncr.
NAAQS(µg/m3)
% ofAmbientStandard
Annual 0.14 24.5 110 1 14% 25 1% 100 0%NOX
24 hour 1 1.56 24.6 20 N/A N/A N/A N/A N/A N/A
3 hour 2 9.26 24.6 20 25 37% 512 2% 1,300 1%
24 hour 1.46 24.6 20 5 29% 91 2% 365 0%
SO2
Annual 0.13 24.5 110 1 13% 20 1% 80 0%
24 hour 0.53 24.6 20 5 11% 30 2% 150 0%PM10
Annual 0.06 24.5 110 1 6% 17 0% 50 0%
1 hour 13.96 24.5 100 2000 1% N/A N/A 40,000 0%CO
8 hour 3 10.27 24.6 20 500 2% N/A N/A 10,000 1%
Pb Quarterly 0.005 24.6 20 N/A N/A N/A N/A 2 0%1. A 24-hour State of New Mexico NOx standard applies for receptors outside of the Navajo Nation.2. For 3-hour averages, an SO2 emission rate of 0.09 lb/MMBtu was assumed to account for short-term variability.3. CALPUFF does not provide 8-hour average results, so a conservatively high 3-hour average is provided for CO.
6.3.3 Near-field Cumulative Class II Modeling Results
As described above, the project only impacts were significant in the near-field for SO2 and PM10
emissions from the Desert Rock Energy Facility. Therefore, a cumulative analysis was performed forthese two pollutants.
The development of the background source inventory was described in Section 6.2.4. The SO2
sources that were included in the analysis are listed in Table 6-9 and the locations of the sources areshown in Figure 6-6. The PM10 sources that were included in the analysis are listed in Table 6-10 andthe locations are shown in Figure 6-7.
The receptors included in the cumulative modeling for SO2 and PM10 increment are shown in Figures6-8 and 6-9, respectively. Receptors were placed within the SIA, which reflected circles of roughly 11km and 1.7 km, respectively, as discussed above.
The cumulative PSD Class II modeling results are presented in Table 6-11a and the NAAQS resultsare presented in Table 6-11b. All values are well below the PSD Class II Increments and these resultsshow that the Project will not have a significant impact on SO2 or PM10 air quality.

09417-360-250 May, 20046-17
Table 6-9Class II SO2 Inventory
Facility ReleaseType
MODELID
LAM-X(km)
LAM-Y(km)
Elevation(m)
EmissionRate (g/s)
StackHeight
(m)
StackTemp
(K)
StackVelocity
(m/s)
StackDiameter
(m)
PSD Increment Consuming SourcesConoco, Inc./San Juan Gas Plant POINT 6 177.7170 81.7762 1710.7 0.007 17.07 690.93 14.23 5.70Conoco, Inc./San Juan Gas Plant POINT 7 177.7170 81.7762 1710.7 0.007 13.72 505.37 11.61 1.95Conoco, Inc./San Juan Gas Plant POINT 8 177.7170 81.7762 1710.7 0.007 13.72 505.37 11.61 1.95Conoco, Inc./San Juan Gas Plant POINT 9 177.6100 82.5624 1706.8 0.001 9.45 672.04 30.48 1.01Conoco, Inc./San Juan Gas Plant POINT 10 177.6104 82.5566 1710.7 0.001 9.45 672.04 30.48 1.01Conoco, Inc./San Juan Gas Plant POINT 11 177.6107 82.5507 1710.7 0.001 9.45 672.04 30.48 1.01Conoco, Inc./San Juan Gas Plant POINT 12 177.6110 82.5449 1710.7 0.001 9.45 672.04 30.48 1.01Conoco, Inc./San Juan Gas Plant POINT 13 177.7312 81.6801 1710.7 0.001 9.14 560.93 6.40 0.91Conoco, Inc./San Juan Gas Plant POINT 14 177.2912 81.8157 1702.8 0.001 9.14 560.93 6.40 1.10Conoco, Inc./San Juan Gas Plant POINT 15 177.2912 81.8157 1702.8 0.701 12.19 533.15 6.40 0.91Consolidated Constr/Asphalt POINT 16 153.4319 79.2029 1638.3 4.299 12.80 427.59 19.60 1.04Consolidated Constr/Crusher POINT 17 153.2172 79.2239 1636.1 0.159 4.88 730.93 46.63 0.15Consolidated Constr/Crusher POINT 18 153.2074 79.2142 1636.6 0.256 3.66 733.15 55.47 0.15El Paso Field Srvc/Chaco Plant POINT 19 164.5847 54.2197 1844.0 0.003 10.67 612.59 39.32 0.74El Paso Field Srvc/Chaco Plant POINT 20 164.5950 54.2291 1844.0 0.003 10.67 612.59 39.32 0.74El Paso Field Srvc/Chaco Plant POINT 21 164.6052 54.2385 1844.0 0.003 10.67 612.59 39.32 0.74El Paso Field Srvc/Chaco Plant POINT 22 164.6391 54.3148 1844.0 0.001 8.23 595.37 40.23 0.44El Paso Field Srvc/Chaco Plant POINT 23 164.6327 54.3075 1844.0 0.001 22.86 595.37 40.23 0.44El Paso Field Srvc/Chaco Plant POINT 24 164.6391 54.3148 1844.0 0.001 8.23 595.37 40.23 0.44El Paso Field Srvc/Chaco Plant POINT 25 164.8446 54.1931 1844.2 0.009 15.24 759.26 29.02 2.29El Paso Field Srvc/Chaco Plant POINT 26 164.8450 54.1853 1844.2 0.009 15.24 759.26 29.02 2.29El Paso Field Srvc/Chaco Plant POINT 27 164.8089 54.2185 1844.2 0.001 6.71 737.59 33.53 0.51El Paso Field Srvc/Chaco Plant POINT 28 164.8098 54.2029 1844.2 0.001 6.71 737.59 33.53 0.51
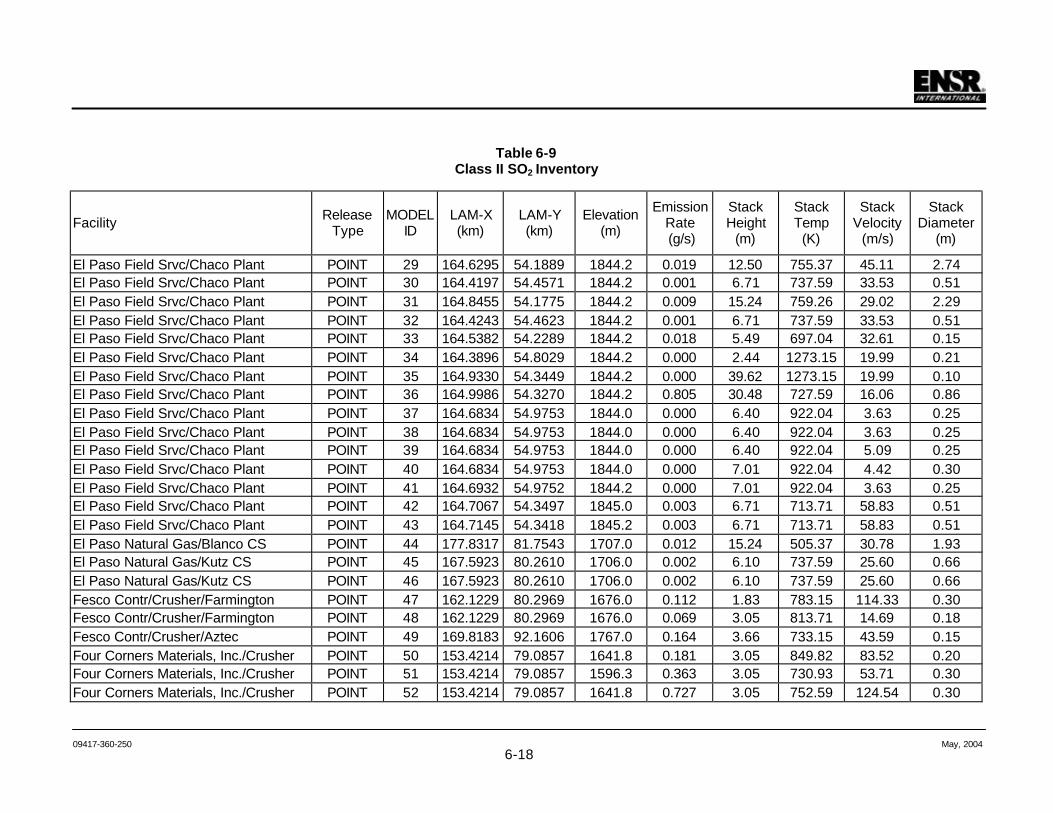
09417-360-250 May, 20046-18
Table 6-9Class II SO2 Inventory
Facility ReleaseType
MODELID
LAM-X(km)
LAM-Y(km)
Elevation(m)
EmissionRate (g/s)
StackHeight
(m)
StackTemp
(K)
StackVelocity
(m/s)
StackDiameter
(m)
El Paso Field Srvc/Chaco Plant POINT 29 164.6295 54.1889 1844.2 0.019 12.50 755.37 45.11 2.74El Paso Field Srvc/Chaco Plant POINT 30 164.4197 54.4571 1844.2 0.001 6.71 737.59 33.53 0.51El Paso Field Srvc/Chaco Plant POINT 31 164.8455 54.1775 1844.2 0.009 15.24 759.26 29.02 2.29El Paso Field Srvc/Chaco Plant POINT 32 164.4243 54.4623 1844.2 0.001 6.71 737.59 33.53 0.51El Paso Field Srvc/Chaco Plant POINT 33 164.5382 54.2289 1844.2 0.018 5.49 697.04 32.61 0.15El Paso Field Srvc/Chaco Plant POINT 34 164.3896 54.8029 1844.2 0.000 2.44 1273.15 19.99 0.21El Paso Field Srvc/Chaco Plant POINT 35 164.9330 54.3449 1844.2 0.000 39.62 1273.15 19.99 0.10El Paso Field Srvc/Chaco Plant POINT 36 164.9986 54.3270 1844.2 0.805 30.48 727.59 16.06 0.86El Paso Field Srvc/Chaco Plant POINT 37 164.6834 54.9753 1844.0 0.000 6.40 922.04 3.63 0.25El Paso Field Srvc/Chaco Plant POINT 38 164.6834 54.9753 1844.0 0.000 6.40 922.04 3.63 0.25El Paso Field Srvc/Chaco Plant POINT 39 164.6834 54.9753 1844.0 0.000 6.40 922.04 5.09 0.25El Paso Field Srvc/Chaco Plant POINT 40 164.6834 54.9753 1844.0 0.000 7.01 922.04 4.42 0.30El Paso Field Srvc/Chaco Plant POINT 41 164.6932 54.9752 1844.2 0.000 7.01 922.04 3.63 0.25El Paso Field Srvc/Chaco Plant POINT 42 164.7067 54.3497 1845.0 0.003 6.71 713.71 58.83 0.51El Paso Field Srvc/Chaco Plant POINT 43 164.7145 54.3418 1845.2 0.003 6.71 713.71 58.83 0.51El Paso Natural Gas/Blanco CS POINT 44 177.8317 81.7543 1707.0 0.012 15.24 505.37 30.78 1.93El Paso Natural Gas/Kutz CS POINT 45 167.5923 80.2610 1706.0 0.002 6.10 737.59 25.60 0.66El Paso Natural Gas/Kutz CS POINT 46 167.5923 80.2610 1706.0 0.002 6.10 737.59 25.60 0.66Fesco Contr/Crusher/Farmington POINT 47 162.1229 80.2969 1676.0 0.112 1.83 783.15 114.33 0.30Fesco Contr/Crusher/Farmington POINT 48 162.1229 80.2969 1676.0 0.069 3.05 813.71 14.69 0.18Fesco Contr/Crusher/Aztec POINT 49 169.8183 92.1606 1767.0 0.164 3.66 733.15 43.59 0.15Four Corners Materials, Inc./Crusher POINT 50 153.4214 79.0857 1641.8 0.181 3.05 849.82 83.52 0.20Four Corners Materials, Inc./Crusher POINT 51 153.4214 79.0857 1596.3 0.363 3.05 730.93 53.71 0.30Four Corners Materials, Inc./Crusher POINT 52 153.4214 79.0857 1641.8 0.727 3.05 752.59 124.54 0.30

09417-360-250 May, 20046-19
Table 6-9Class II SO2 Inventory
Facility ReleaseType
MODELID
LAM-X(km)
LAM-Y(km)
Elevation(m)
EmissionRate (g/s)
StackHeight
(m)
StackTemp
(K)
StackVelocity
(m/s)
StackDiameter
(m)
Four Corners Materials, Inc./Asphalt POINT 53 153.5395 79.2217 1638.3 0.009 12.50 416.48 24.44 1.04Giant Industries/Bloomfield Refinery POINT 57 176.8653 78.1801 1673.3 0.033 16.76 755.37 2.83 1.13Giant Industries/Bloomfield Refinery POINT 58 176.8653 78.1801 1673.3 0.089 9.14 449.82 1.37 0.91Giant Industries/Bloomfield Refinery POINT 59 176.8653 78.1801 1673.3 0.143 12.50 494.26 2.19 1.37Giant Industries/Bloomfield Refinery POINT 60 176.8653 78.1801 1673.3 5.383 24.38 1273.15 20.12 0.30Giant Industries/Bloomfield Refinery POINT 61 176.8653 78.1801 1673.3 0.009 14.02 644.26 6.16 0.55Giant Industries/Bloomfield Refinery POINT 62 176.8653 78.1801 1673.3 0.012 12.19 616.48 8.50 0.55Giant Industries/Bloomfield Refinery POINT 63 176.8653 78.1801 1673.3 0.001 12.19 598.15 5.49 0.76NavajoRefining/BulkProduct Terminal POINT 64 177.7128 75.2930 1750.6 0.037 7.62 1033.15 1.04 0.30Public Service Co NM/San Juan GS POINT 67 136.0993 88.1943 1614.9 168.170 121.92 322.04 15.85 8.53Public Service Co NM/San Juan GS POINT 68 136.0993 88.1943 1614.9 182.341 121.92 322.04 15.85 8.53Transwestern Pipeline/Bloomfield CS POINT 69 179.0205 81.2461 1704.3 0.012 15.24 755.37 46.45 1.07Transwestern Pipeline/Bloomfield CS POINT 70 179.0199 81.2559 1704.0 0.012 15.24 755.37 46.45 1.07Transwestern Pipeline/Bloomfield CS POINT 71 179.0194 81.2657 1710.7 0.012 15.24 755.37 46.45 1.07Valley Scrap Metal/Alum Sweat Furn POINT 72 144.8035 81.5583 1590.7 0.202 3.96 1144.26 3.17 0.46

09417-360-250 May, 20046-20
Table 6-9Class II SO2 Inventory
Facility ReleaseType
MODELID
LAM-X(km)
LAM-Y(km)
Elevation(m)
EmissionRate (g/s)
StackHeight
(m)
StackTemp
(K)
StackVelocity
(m/s)
StackDiameter
(m)
Additional Sources for NAAQS ModelingArizona Public Serv/4 Corners/GF POINT 1 132.5486 76.2073 1615.0 95.158 76.20 327.59 18.29 5.36Arizona Public Serv/4 Corners/GF POINT 2 132.5486 76.2073 1615.0 93.374 76.20 327.59 18.29 5.36Arizona Public Serv/4 Corners/GF POINT 3 132.6197 76.1436 1615.0 110.059 76.20 327.59 31.63 4.36Arizona Public Serv/4 Corners/GF POINT 4 132.9928 75.8145 1615.0 227.971 115.82 333.15 23.89 8.69Arizona Public Serv/4 Corners/GF POINT 5 132.9928 75.8145 1615.0 273.392 115.82 333.15 18.29 8.69Giant Industries/Bloomfield Ref/402M8 POINT 54 176.8653 78.1801 1673.3 10.685 42.06 538.71 9.14 0.91Giant Industries/Bloomfield Ref/402M8 POINT 55 176.8555 78.1796 1673.3 7.284 27.43 583.15 0.98 2.01Giant Industries/Bloomfield Ref/402M8 POINT 56 176.8653 78.1801 1673.3 2.624 23.77 766.48 4.94 1.10Public Service Co NM/San Juan GS POINT 65 136.0993 88.1943 1614.9 202.938 121.92 319.82 18.90 6.10Public Service Co NM/San Juan GS POINT 66 136.0993 88.1943 1614.9 201.635 121.92 317.59 18.29 6.10Public Service Co NM/San Juan GS POINT 74 136.0993 88.1943 1614.9 2.250 6.00 293.00 1.50 1.00Western Gas Resources/San JuanRiver
POINT 73 142.4155 83.6558 1614.8 89.951 62.79 810.93 3.41 0.91

09417-360-250 May, 20046-21
Figure 6-6 Cumulative Modeling SO2 Source Locations

09417-360-250 May, 20046-22
Figure 6-7 Cumulative Modeling PM 10 Source Locations

09417-360-250 May, 20046-23
Table 6-10Class II PM 10 Inventory
Facility ReleaseType
MODELID LAM-X (km) LAM-Y
(km)Elevation
(m)PM10 ER
(g/s)
StackHeight
(m)
StackTemp (K)
StackVelocity
(m/s)
StackDiameter
(m)PSD Increment Consuming Sources
Bloomfield Gravel/300tph Crusher POINT 6 171.6524 73.6905 1722.3 0.170 6.00 293.00 1.50 1.00Consolidated Constr/Asphalt POINT 7 153.4319 79.2029 1638.3 0.284 12.80 427.59 19.60 1.04Consolidated Constr/Crusher POINT 8 153.2465 79.2237 1636.2 0.443 7.60 697.00 32.60 0.30El Paso Field Srvc/Chaco Plant POINT 9 164.5847 54.2197 1844.0 0.152 10.67 612.59 39.32 0.74El Paso Field Srvc/Chaco Plant POINT 10 164.5950 54.2291 1844.0 0.152 10.67 612.59 39.32 0.74El Paso Field Srvc/Chaco Plant POINT 11 164.6052 54.2385 1844.0 0.152 10.67 612.59 39.32 0.74El Paso Field Srvc/Chaco Plant POINT 12 164.6391 54.3148 1844.0 0.081 8.23 595.37 40.23 0.44El Paso Field Srvc/Chaco Plant POINT 13 164.6327 54.3075 1844.0 0.081 22.86 595.37 40.23 0.44El Paso Field Srvc/Chaco Plant POINT 14 164.6391 54.3148 1844.0 0.081 8.23 595.37 40.23 0.44El Paso Field Srvc/Chaco Plant POINT 15 164.8446 54.1931 1844.2 0.029 15.24 759.26 29.02 2.29El Paso Field Srvc/Chaco Plant POINT 16 164.8450 54.1853 1844.2 0.029 15.24 759.26 29.02 2.29El Paso Field Srvc/Chaco Plant POINT 17 164.8089 54.2185 1844.2 0.032 6.71 737.59 33.53 0.51El Paso Field Srvc/Chaco Plant POINT 18 164.8098 54.2029 1844.2 0.032 6.71 737.59 33.53 0.51El Paso Field Srvc/Chaco Plant POINT 19 164.6295 54.1889 1844.2 0.046 12.50 755.37 45.11 2.74El Paso Field Srvc/Chaco Plant POINT 20 164.6834 54.9753 1844.0 0.026 6.40 922.04 3.63 0.25El Paso Field Srvc/Chaco Plant POINT 21 164.6834 54.9753 1844.0 0.026 6.40 922.04 3.63 0.25El Paso Field Srvc/Chaco Plant POINT 22 164.6834 54.9753 1844.0 0.032 6.40 922.04 5.09 0.25El Paso Field Srvc/Chaco Plant POINT 23 164.6834 54.9753 1844.0 0.032 7.01 922.04 4.42 0.30El Paso Field Srvc/Chaco Plant POINT 24 164.7067 54.3497 1845.0 0.063 6.71 713.71 58.83 0.51El Paso Field Srvc/Chaco Plant POINT 25 164.7145 54.3418 1845.2 0.063 6.71 713.71 58.83 0.51Four Corners Materials, Inc./Crusher POINT 26 153.4214 79.0857 1641.8 1.864 6.00 293.00 1.50 1.00Four Corners Materials, Inc./Asphalt POINT 27 153.5395 79.2217 1638.3 0.372 12.50 416.48 24.44 1.04Four Corners Materials, Inc./Batch POINT 28 156.5655 81.7993 1644.6 1.092 7.60 697.00 32.60 0.30Halliburton/Cement & Sand/425M2 POINT 29 154.1025 78.6903 1645.0 0.005 10.67 302.59 0.43 0.66Halliburton/Cement & Sand/425M2 POINT 30 154.1025 78.6903 1645.0 0.269 7.92 302.59 14.90 0.76Industrial Repair Service/Elecro-mec POINT 31 158.0030 77.6871 1645.9 0.618 6.00 293.00 1.50 1.00Phoenix Cement/San Juan Fly Ash POINT 32 136.1927 87.6075 1645.9 0.073 32.61 330.37 20.70 0.76Phoenix Cement/San Juan Fly Ash POINT 33 136.1927 87.6075 1645.9 0.053 25.60 297.04 21.00 0.61Phoenix Cement/San Juan Fly Ash POINT 34 136.1927 87.6075 1645.9 0.018 36.27 273.00 0.00 1.00

09417-360-250 May, 20046-24
Table 6-10Class II PM 10 Inventory
Facility ReleaseType
MODELID LAM-X (km) LAM-Y
(km)Elevation
(m)PM10 ER
(g/s)
StackHeight
(m)
StackTemp (K)
StackVelocity
(m/s)
StackDiameter
(m)Phoenix Cement/San Juan Fly Ash POINT 35 136.1927 87.6075 1645.9 0.029 38.71 330.37 21.37 0.34Public Service Co NM/San Juan GS POINT 38 136.0993 88.1943 1614.9 34.220 121.92 322.04 15.85 8.53Public Service Co NM/San Juan GS POINT 39 136.0993 88.1943 1614.9 33.573 121.92 322.04 15.85 8.53Public Service Co NM/San Juan GS POINT 41 136.0993 88.1943 1614.9 0.489 6.00 293.00 1.50 1.00Public Service Co NM/San Juan GS POINT 42 136.0993 88.1943 1614.9 0.127 7.60 697.00 32.60 0.30Valley Scrap Metal/Alum Sweat POINT 43 144.8035 81.5583 1590.7 0.832 3.96 1144.26 3.17 0.46Western Tank Mfg/Farmington Plant POINT 44 157.4162 77.5934 1644.8 0.545 7.60 697.00 32.60 0.30
Additional Sources for NAAQS ModelingArizona Public Serv/4 Corners/GF POINT 1 132.5486 76.2073 1615.0 36.872 76.20 327.59 18.29 5.36
Arizona Public Serv/4 Corners/GF POINT 2 132.5486 76.2073 1615.0 34.155 76.20 327.59 18.29 5.36Arizona Public Serv/4 Corners/GF POINT 3 132.6197 76.1436 1615.0 46.373 76.20 327.59 31.63 4.36Arizona Public Serv/4 Corners/GF POINT 4 132.9928 75.8145 1615.0 40.338 115.82 333.15 23.89 8.69
Arizona Public Serv/4 Corners/GF POINT 5 132.9928 75.8145 1615.0 40.336 115.82 333.15 18.29 8.69Public Service Co NM/San Juan GS POINT 36 136.0993 88.1943 1614.9 22.029 121.92 319.82 18.90 6.10Public Service Co NM/San Juan GS POINT 37 136.0993 88.1943 1614.9 21.917 121.92 317.59 18.29 6.10
Public Service Co NM/San Juan GS POINT 40 136.0993 88.1943 1614.9 32.907 6.00 293.00 1.50 1.00

09417-360-250R1 May, 20046-25
Figure 6-8 Receptors for Cumulative SO2 Modeling

09417-360-250R1 May, 20046-26
Figure 6-9 Receptors for Cumulative PM 10 Modeling

09417-360-250R1 May, 20046-27
Table 6-11aCumulative PSD Class II Modeling Results
PollutantAveraging
Period
ModeledConcentration
(µg/m3) 1
Distance(km)
Bearing(Deg.)
PSDClass II
Increment(µg/m3)
% ofIncrement
3 Hour 2 95.20 1.2 275 512 19%SO2
24 Hour 11.24 1.3 270 91 12%24 Hour 8.58 0.7 56 30 29%PM10
Annual 2.10 0.5 19 17 12%1. Second-highest short-term values, highest annual values.
2. SO2 3-hour results are based on an emission rate of 0.09 lb/MMBtu to account for short-termvariability. Emissions levels could be much greater and still not cause an incrementexceedance.
Table 6-11bCumulative NAAQS Modeling Results
PollutantAveraging
Period
ModeledConcentration
(µg/m3)(1)
RegionalBackground
(µg/m3)
Total Conc.(µg/m3)
Distance(km)
Bearing(Deg.)
NAAQS(µg/m3)
% ofAmbientStandard
3 Hour 1 133.87 68.1 201.97 10.9 63 1300 16%SO2
24 Hour 33.42 21.0 54.42 11.0 69 365 15%24 Hour 10.67 38.0 48.67 0.7 56 150 32%PM10
Annual 2.57 17.0 19.57 0.7 56 50 39%1. SO2 3-hour results are based on an emission rate of 0.09 lb/MMBtu to account for short-term
variability. Emissions levels could be much greater and still not cause a NAAQS exceedance.

09417-360-250R1 May, 20046-28
6.4 Distant Class II Area Assessment
CALPUFF was used to assess impacts at distant sensitive Class II areas (beyond 50 kilometers) asrequested by the Federal Land Managers (FLMs). These areas are shown in Figure 6-10, and include:
• Aztec Ruins National Monument • Natural Bridges National Monument
• Canyon de Chelly National Monument • Navajo National Monument
• Chaco Culture National Historic Park • Pecos National Historic Park
• Colorado National Monument • Petroglyph National Monument
• Cruces Basin Wilderness Area • Rainbow Bridge National Monument
• Curecanti National Recreation Area • Salinas Pueblo Missions National Monument
• El Malpais National Monument • South San Juan Wilderness Area
• El Morro National Monument • Sunset Crater National Monument
• Glen Canyon National Recreation Area • Wupatki National Monument
• Hovenweep National Monument • Yucca House National Monument
• Hubbel Trading Post National Historic Site • Zuni-Cibola NHP
• Lizard Head Wilderness Area • Wilson Mountain Primitive Area
• Mount Sneffels Wilderness Area • Uncompahgre Wilderness Area
Except where noted below, impacts at these areas have been addressed in terms of PSD Class IIincrement, regional haze, and acidic deposition. For all pollutants and averaging periods at eachdistant PSD Class II area, the modeling results discussed below show the project to have aninsignificant modeled increment, so no further modeling is required (Class II significance thresholds areshown in Table 6-6). Since these areas are not Class I designated, regional haze and acidicdeposition results associated with emissions from the main stacks alone are not subject to the FLAGPhase I (2000) procedures. Therefore, the results are being reported for informational purposes andare not compared to thresholds that are applicable for a Class I area.
Colorado National Monument, Wilson Mountain Primitive Area, and Uncompahgre Wilderness Areaare Class I protected areas for SO2 PSD increment in Colorado. Therefore, the SO2 Class Isignificance thresholds and increments apply to these Class II areas only. Proposed Class Isignificance thresholds and increment values can also be found in Table 6-6.
This modeling analysis assessed the impacts at the specified Class II areas from the proposedproject’s main stack alone operating at 100 percent load. Other small ancillary or fugitive sources werenot included in this portion of the modeling analysis because the effects of these sources are expectedto be confined within the first few hundred meters of the project site.

09417-360-250R1 May, 20046-29
Figure 6-10 Distant Sensitive PSD Class II Areas Considered in the Modeling Analysis

09417-360-250R1 May, 20046-30
Receptor grids for these areas were generated based on the suggestions of John Notar of the NPS.Receptor elevations were either picked from a topographic map or calculated using 90-meter spacedDigital Elevation Model (DEM) files.
The identified distant PSD Class II areas noted by the Federal Land Managers are all beyond 50 kmfrom the proposed source. Results of the PSD Class II increment modeling for these distant areas areprovided in Table 6-12. For these Class II areas, there are no impacts above the Class II SILs. Thethree areas in Colorado where PSD Class I SO2 increments apply are noted in the table, and theconcentrations are above the Class I SILs in these three areas (bolded in yellow).
Table 6-12Highest Modeled PSD Increment Concentrations (µg/m3)
Over Three Years (2001-2003), Distant Class II AreasNOX SO2 PM10Pollutant
Averaging Period Annual 3-hour 24-hour Annual 24-hour Annual
Aztec Ruins Nat. Mon. 0.010 2.144 0.339 0.032 0.313 0.026Canyon de Chelly Nat. Mon. 0.005 1.984 0.277 0.016 0.313 0.016Chaco Culture NHP 0.018 2.369 0.456 0.045 0.330 0.035Colorado Nat. Mon.* 0.002 1.172 0.150 0.005 0.141 0.006Cruces Basin NWA 0.007 1.231 0.203 0.016 0.145 0.014Curecanti NRA 0.002 1.636 0.273 0.005 0.184 0.006El Malpais Nat. Mon. 0.005 1.503 0.195 0.010 0.282 0.010El Morro Nat. Mon. 0.002 0.912 0.156 0.007 0.212 0.007Glen Canyon NRA 0.003 1.187 0.274 0.011 0.339 0.012Hovenweep Nat. Mon. 0.003 1.852 0.223 0.016 0.167 0.015Hubbel Trading Post NHS 0.001 1.128 0.179 0.006 0.237 0.007Lizard Head NWA 0.003 1.260 0.294 0.008 0.158 0.008Mount Sneffels NWA 0.003 0.966 0.201 0.007 0.168 0.007Natural Bridges Nat. Mon. 0.003 1.092 0.205 0.009 0.216 0.009Navajo Nat. Mon. 0.001 0.779 0.109 0.004 0.156 0.005Pecos NHP 0.004 0.979 0.161 0.009 0.123 0.012Petroglyph Nat. Mon. 0.007 0.715 0.254 0.018 0.225 0.015Rainbow Bridge Nat. Mon. 0.000 0.433 0.065 0.003 0.135 0.005Salinas Pueblo Missions Nat. Mon. 0.003 0.566 0.117 0.008 0.142 0.009South San Juan NWA 0.010 1.637 0.291 0.019 0.192 0.016Sunset Crater Nat. Mon. 0.000 0.358 0.046 0.001 0.087 0.002Uncompahgre NWA* 0.004 1.258 0.279 0.009 0.176 0.008Wilson Mountain Primitive Area* 0.002 1.106 0.186 0.007 0.149 0.007Wupatki Nat. Mon. 0.000 0.191 0.039 0.001 0.104 0.003Yucca House Nat. Mon. 0.003 1.923 0.250 0.012 0.240 0.012Zuni-Cibola NHP 0.002 0.761 0.132 0.007 0.202 0.008* subject under Colorado regulation to Class I SO2 increment protection

09417-360-250R1 May, 20046-31
Since the three Class II areas in Colorado are over the Class I increments, they were included in theSO2 cumulative analysis that was performed for the Class I areas as described in Section 6.5.3. TheSO2 results (high-second high in µg/m³) of the cumulative analysis for these three areas are:
3-hour 24-hour• Colorado National Monument 6.27 1.23• Uncompahgre NWA 8.79 1.94• Wilson Mountain Primitive Area 5.34 1.75
These values are well below the PSD Class I increments of 25 µg/m³ 3-hour and 5 µg/m³ 24-hour thatare applied by the State of Colorado for these Class II areas.
For informational purposes, results of the visibility (regional haze) assessment for these areas areprovided in Table 6-13 and of the sulfur and nitrogen deposition modeling are provided in Table 6-14.
Table 6-13CALPUFF PSD Class II Regional Haze Impact Analysis (Highest Extinction
Over Three Years), Distant PSD Class II Areas
Max Percent (%) Extinction ChangeClass II Area
FLAG f(RH) ValuesEPA f(RH) Values,
Includes Salt AerosolAztec Ruins Nat. Mon. 6.16 5.18Canyon de Chelly Nat. Mon. 6.64 6.67Chaco Culture NHP 11.24 10.09Colorado Nat. Mon. 2.82 2.93Cruces Basin NWA 6.21 5.98Curecanti NRA 6.17 6.68El Malpais Nat. Mon. 7.26 7.78El Morro Nat. Mon. 4.80 4.48Glen Canyon NRA 7.23 6.99Hovenweep Nat. Mon. 7.74 6.74Hubbel Trading Post NHS 6.18 6.34Lizard Head NWA 5.04 5.34Mount Sneffels NWA 3.70 4.14Natural Bridges Nat. Mon. 4.16 3.95Navajo Nat. Mon. 3.91 3.64Pecos NHP 4.92 4.43Petroglyph Nat. Mon. 4.26 4.40Rainbow Bridge Nat. Mon. 3.57 3.90Salinas Pueblo Missions Nat. Mon. 3.37 3.70South San Juan NWA 7.02 5.94Sunset Crater Nat. Mon. 2.92 2.55Uncompahgre NWA 6.39 6.65Wilson Mountain Primitive Area 3.54 3.88Wupatki Nat. Mon. 3.25 3.01Yucca House Nat. Mon. 8.97 7.91Zuni-Cibola NHP 5.40 5.77 MVISBK=2, RHMAX=95%, 10% ranked lowest background extinction

09417-360-250R1 May, 20046-32
Results the second column of Table 6-13 employ the FLAG f(RH) curve, while the values in the thirdcolumn employ the recently published EPA updates to the f(RH) curve. The EPA version of the f(RH)curve generally results in lower predicted changes to regional haze impacts. The 10% ranked lowestbackground extinction values are obtained from data provided prior to FLAG implementation by JohnNotar of the NPS. No attempt has been made to refine these results by reviewing periods of naturalobscuration due to meteorological interferences. Steag provides this information to show that theproposed project will not have an adverse impact on distant PSD Class II areas.
Table 6-14Maximum Total Deposition Over Three Years (2001-2003), Distant PSD Class II Areas
PSD Class II Area Nitrogen Deposition(kg/ha/yr)
Sulfur Deposition(kg/ha/yr)
Aztec Ruins Nat. Mon. 1.00E-02 3.08E-02
Canyon de Chelly Nat. Mon. 5.61E-03 1.45E-02
Chaco Culture NHP 1.29E-02 2.99E-02
Colorado Nat. Mon. 2.15E-03 4.76E-03
Cruces Basin NWA 5.74E-03 1.20E-02
Curecanti NRA 2.44E-03 4.86E-03
El Malpais Nat. Mon. 3.44E-03 7.82E-03
El Morro Nat. Mon. 2.52E-03 5.46E-03
Glen Canyon NRA 3.19E-03 7.98E-03
Hovenweep Nat. Mon. 5.49E-03 1.17E-02
Hubbel Trading Post NHS 3.09E-03 6.59E-03
Lizard Head NWA 3.78E-03 8.83E-03
Mount Sneffels NWA 3.28E-03 7.32E-03
Natural Bridges Nat. Mon. 3.12E-03 8.20E-03
Navajo Nat. Mon. 1.29E-03 3.07E-03
Pecos NHP 3.66E-03 8.45E-03
Petroglyph Nat. Mon. 4.29E-03 1.02E-02
Rainbow Bridge Nat. Mon. 1.33E-03 2.95E-03
Salinas Pueblo Missions Nat. Mon. 2.24E-03 5.05E-03
South San Juan NWA 7.54E-03 1.48E-02
Sunset Crater Nat. Mon. 7.63E-04 1.37E-03
Uncompahgre NWA 3.78E-03 7.41E-03
Wilson Mountain Primitive Area 3.50E-03 8.14E-03
Wupatki Nat. Mon. 9.18E-04 1.67E-03
Yucca House Nat. Mon. 5.46E-03 1.42E-02
Zuni-Cibola NHP 3.01E-03 6.37E-03

09417-360-250R1 May, 20046-33
6.5 PSD Class I Modeling Analysis
The impacts at PSD Class I areas within 300 kilometers of the proposed plant (see Figure 6-11) weremodeled with CALPUFF. The PSD Class I areas included the following National Parks (NP) orNational Monuments (NM):
• Arches • Bandelier • Black Canyon of the Gunnison
• Capitol Reef • Canyonlands • Grand Canyon
• Great Sand Dunes • Mesa Verde • Petrified Forest
PSD Class I areas also included the following Wilderness Areas (WA), all administered by the USDAForest Service.
• La Garita • Pecos • San Pedro Parks
• West Elk • Weminuche • Wheeler Peak
The long-range CALPUFF modeling analysis addressed ambient air impacts on Class I PSDIncrements and Air Quality Related Values (AQRVs) at these Class I areas.
6.5.1 Modeling Domain and Receptors
The CALPUFF modeling grid system was designed to extend approximately 50 kilometers east ofGreat Sand Dunes National Park, north of West Elk Wilderness, south of Petrified Forest, as well as350 kilometers west of the project site. The modeling domain proposed for this analysis is shown inFigure 6-12. The additional buffer distances beyond the Class I areas allow for the consideration ofpuff trajectory recirculations. This design allows for a 680 km x 552 km (E-W / N-S) grid with a 4-kmgrid element size. The southwest corner of the grid is located at approximately 34.28° N latitude and112.46° W longitude.
The receptors used in the refined CALPUFF analysis were limited to those actually within the PSDClass I boundary. However, if the park boundary extended more than 300 kilometers from the projectsite, then only those receptors within 300 kilometers were modeled in this CALPUFF analysis. Thereceptors for Arches, Bandelier, Black Canyon of the Gunnison, Capitol Reef, Canyonlands, GrandCanyon, Great Sand Dunes, Mesa Verde, and Petrified Forest National Parks, along with La Garita,Pecos, San Pedro Parks, West Elk, Weminuche, and Wheeler Peak Wilderness Areas were obtainedfrom a database of receptors for all Class I areas produced by the National Park Service.
6.5.2 Project Only PSD Class I Increment Modeling Results
Results of the PSD Class I increment modeling from proposed source emissions are provided in Table6-15. Values bolded in yellow are greater than the Class I significance levels. The NOx and PM10
impacts are insignificant in all PSD Class I areas, and only the SO2 impacts are significant. Note thatthe highest SO2 impacts are only about 20% of the full PSD Class I increment.

09417-360-250R1 May, 20046-34
Figure 6-11 PSD Class I Areas Considered in the Modeling Analysis

09417-360-250R1 May, 20046-35
Figure 6-12 PSD Class I CALPUFF Modeling Domain

09417-360-250R1 May, 20046-36
Table 6-15Highest Modeled PSD Class I Increment Concentrations (µg/m3) Over Three Years (2001-2003)
Pollutant NOX SO2 PM10
Averaging Period Annual 3-hour 24-hour Annual 24-hour Annual
Arches NP 0.001 1.415 0.172 0.004 0.260 0.005Bandelier NM 0.008 1.995 0.246 0.018 0.203 0.018Black Canyon of the Gunnison NM 0.002 1.050 0.177 0.005 0.185 0.006Canyonlands NP 0.002 0.967 0.202 0.007 0.264 0.007Capitol Reef NP 0.001 1.120 0.151 0.004 0.219 0.005Grand Canyon NP 0.000 0.564 0.132 0.002 0.167 0.003Great Sand Dunes NM 0.005 1.341 0.264 0.013 0.196 0.012La Garita WA 0.006 1.047 0.205 0.012 0.179 0.010Mesa Verde NP 0.009 2.662 0.415 0.019 0.293 0.015Pecos WA 0.006 1.382 0.223 0.014 0.163 0.014Petrified Forest NP 0.000 0.499 0.102 0.003 0.207 0.005San Pedro Parks WA 0.011 1.675 0.247 0.025 0.285 0.024Weminuche WA 0.009 2.031 0.338 0.016 0.207 0.013West Elk WA 0.002 0.858 0.145 0.004 0.187 0.005Wheeler Peak WA 0.003 1.174 0.156 0.009 0.118 0.010
Proposed Class I SIL 0.1 1.0 0.2 0.1 0.3 0.2
PSD Class I Increments 2.5 25.0 5.0 2.0 8.0 4.0
6.5.3 Cumulative Class I Increment Modeling Results
A cumulative SO2 increment modeling analysis was performed since the project-only impacts weregreater that the proposed Class I area SILs provided in Table 6-6. The background source inventory islisted in Table 6-16 and the locations of these sources that were included are shown in Figure 6-13.
Two coal-fired power plants, the San Juan Generating Station (SJGS) and the Four Corners PowerPlant (FCPP), had emission units that were either operating or under construction as of the SO2 majorsource baseline date of January 6, 1975. These units include all five of the FCPP boilers and units 1and 2 of the SJGS. The determination of the baseline versus current emission differences for theseunits is discussed in Attachment 6.
The cumulative modeling results for Class I increment are presented in Tables 6-17a and 6-17b. Theresults in Table 6-17a include increment expansion from FCPP. The results in Table 6-17b includeincrement expansion from SJGS and FCPP. Both tables show that cumulative impacts will be wellbelow the PSD Class I increments.

09417-360-250 May, 20046-37
Table 6-16PSD Class I SO2 Inventory
Name Model ID LAM-X(km)
LAM-Y(km)
Base El.(m)
EmissionRate(g/s)
StackHeight
(m)
Stack Temp(K)
Exit Velocity(m/s)
Stack Diameter(m)
PSD Increment ConsumingCholla Unit 2 Cholla2 -26.911 -116.171 1529.0 40.865 167.64 348.71 34.14 4.48
Springerville GS SGS1-4 75.443 -182.937 2128.0 1064.432 152.40 339.00 21.30 6.10Abitibi Consolidated Abitibi2 -30.183 -162.803 1844.0 43.650 65.23 380.37 18.35 3.66AE Staley MFG Staley 336.234 179.921 2322.6 2.451 5.18 1273.00 20.80 0.10
Nixon Unit 1 Nixon1 448.075 299.985 1676.4 257.594 140.21 422.59 19.62 5.33Nixon Unit 2 Nixon2 448.075 299.985 1676.4 6.149 64.01 558.15 15.43 1.07Kinder Morgan KMYJ 104.599 160.363 2017.8 1.008 6.10 644.26 2.54 0.61
Cameo Station CameoCur 141.295 342.308 1463.0 50.652 45.72 399.81 7.77 2.67Nucla Station Nucla 127.237 243.666 1694.7 135.274 65.53 408.15 23.34 3.66Holcim-Florence HFlor1 423.533 271.358 1536.2 109.000 110.00 376.00 14.52 6.00
Holcim-Florence HFlor2 423.515 271.386 1536.2 44.900 110.00 356.00 13.99 1.70Hunter Unit 2 Hunter2 -86.075 343.842 1723.6 65.179 182.88 329.26 17.82 7.32Hunter Unit 3 Hunter3 -86.096 343.811 1723.6 33.438 182.88 322.04 16.63 7.32
Lisbon Flare LisFlare 61.757 234.675 1828.8 1.155 12.20 613.15 83.58 0.46Lisbon Incinerator LisIncin 62.106 233.890 1828.8 38.800 64.98 736.76 7.35 1.83Consolidated Constr. CAsphlt 153.4319 79.2029 1638.3 4.299 12.80 427.59 19.60 1.036
San Juan GS Unit 3 SJGS3 136.0993 88.1943 1614.9 110.907 121.92 322.04 15.85 8.534San Juan GS Unit 4 SJGS4 136.0993 88.1943 1614.9 120.254 121.92 322.04 15.85 8.534Bloomfield Refinery BlmfdRef 176.8653 78.1801 1673.3 5.383 24.38 1273.15 20.12 0.305
Peabody Mustang Mustang 185.77 -35.03 2112.3 43.474 147.28 343.09 18.29 5.505Tri-State Escalante Escalant 170.81 -61.64 2103.8 62.267 138.07 324.26 15.24 6.096

09417-360-250 May, 20046-38
Table 6-16PSD Class I SO2 Inventory
Name Model ID LAM-X(km)
LAM-Y(km)
Base El.(m)
EmissionRate(g/s)
StackHeight
(m)
Stack Temp(K)
Exit Velocity(m/s)
Stack Diameter(m)
PSD Increment Expanding
Cameo Station CameoBse 141.295 342.308 1463.0 -48.620 12.65 416.5 2.29 45.72
San Juan Unit 1 SJGS1 136.0993 88.1943 1614.9 -589.503 121.92 317.59 18.29 6.096San Juan Unit 2 SJGS2 136.0993 88.1943 1614.9 -592.130 121.92 317.59 18.29 6.096Four Corners Unit 1 4C1 132.5486 76.2073 1615.0 -72.510 76.20 327.59 18.29 5.36
Four Corners Unit 2 4C2 132.5486 76.2073 1615.0 -79.036 76.20 327.59 18.29 5.36Four Corners Unit 3 4C3 132.6197 76.1436 1615.0 -86.247 76.20 327.59 31.63 4.36Four Corners Unit 4 4C4 132.9928 75.8145 1615.0 -982.547 115.82 333.15 23.89 8.69
Four Corners Unit 5 4C5 132.9928 75.8145 1615.0 -972.085 115.82 333.15 18.29 8.69

09417-360-250R1 May, 20046-39
Figure 6-13 PSD Class I SO2 Source Locations

09417-360-250R1 May, 20046-40
Table 6-17aPSD Class I SO2 Cumulative Modeling Results (FCPP Expansion Only)
Over 3 Years (2001-2003)High-Second High (µg/m³)Class I Area3-hour 1 24-hour
Arches NP 2.593 0.668Bandelier NM 8.724 1.691Black Canyon of the Gunnison NM 10.357 3.471Canyonlands NP 6.460 2.159Capitol Reef NP 2.230 0.594Great Sand Dunes NM 10.844 2.013La Garita WA 4.481 0.800Mesa Verde NP 13.700 1.242Pecos WA 5.486 1.444San Pedro Parks WA 9.174 2.292Weminuche WA 4.980 0.926Wheeler Peak WA 3.712 0.782
PSD Increment 25 51. SO2 3-hour results based on an emission rate of 0.09 lb/MMBtu to account
for short-term variability. Emissions levels could be much greater and stillnot cause an increment exceedance.
Table 6-17bPSD Class I SO2 Cumulative Modeling Results (FCPP and SJGS Expansion)
Over 3 Years (2001-2003)High-Second High (µg/m³)Class I Area3-hour 1 24-hour
Arches NP 2.593 0.661Bandelier NM 8.724 1.691Black Canyon of the Gunnison NM 10.348 2.945Canyonlands NP 6.410 2.093Capitol Reef NP 2.203 0.561Great Sand Dunes NM 4.959 1.944La Garita WA 4.457 0.778Mesa Verde NP 5.530 0.924Pecos WA 5.486 1.444San Pedro Parks WA 9.174 2.292Weminuche WA 4.703 0.926Wheeler Peak WA 3.712 0.782
PSD Increment 25 51. SO2 3-hour results based on an emission rate of 0.09 lb/MMBtu to account
for short-term variability. Emissions levels could be much greater and stillnot cause an increment exceedance.

09417-360-250R1 May, 20046-41
6.5.4 Regional Haze Impacts
Results of the regional haze impacts from the proposed project are provided in Tables 6-18a and6-18b. The results are presented in terms of the change in light extinction from natural backgroundextinction as provided in the FLAG (2000) guidance. These results are supplemented by severalrefinements in the regional haze impacts, as follows:
• A relative humidity cap of 95%.
• The f(RH) curves adopted by EPA (2003) are used.
• The contribution to natural background extinction by airborne salt particles, which are ignored byFLAG, is considered. Although the area in question is removed from the Pacific Ocean, there areplentiful sources of salt aerosols in the West from surface salt deposits and flats, as well as saltlakes. The general procedures used in the determination of the salt concentration (a hygroscopicparticulate component), are described in Appendix F of Attachment 4 (Modeling Protocol). Theconcentrations of airborne salt particles were obtained from IMPROVE measurements available atmost of the PSD Class I areas, and are listed in Table 6-19.
The regional haze modeling results in Table 6-18b (which incorporate reasonable and technicallydefensible refinements to FLAG) indicate that there are relatively few days with modeled visibilityextinction changes above 10% of natural background. A thorough review of the weather conditions onthese days indicates that all of them can be documented as being associated with one or more of thefollowing natural interferences to visibility:
• Occurrences of rain, snow, fog, etc.;
• Reduced visibility measurements at nearby representative airports;
• Cloud cover and/or elevated relative humidity at night, which would tend to preclude star-gazingactivities.
The FLAG procedure for computing regional haze impacts relies upon 24-hour averages because theNational Acid Precipitation Assessment Program study that formed the basis for visibility extinction in“natural conditions” relies upon daily particulate concentration measurements. This reliance upon dailyaverages (accounting for all 24 hours) has been verbally communicated to ENSR by the National ParkService on several occasions. The role of humidity in altering the natural visibility extinction is alreadypart of FLAG in the form of the f(RH) relationship, which is applied on an hourly basis before the dailyaverage is computed in CALPOST. However, the FLAG procedures, acknowledged by the NationalPark Service (Gebhart, 2004) as being a “screening procedure”, have neglected to account for theadditional effects on natural background extinction that are mentioned above. Techniques such as“MVISBK Option 7” in the CALPOST post-processor to CALPUFF do attempt to account for theadditional effects precipitation and fog effects as observed at airports, but do not account forinformation available from additional data sources such as transmissometer measurements and due to

09417-360-250R1 May, 20046-42
cloud cover at night. The procedures used here, as documented in Appendix B in Attachment 4,supplement the MVISBK = 7 option as follows:
• A more mathematically appropriate manner in computing the daily average of hourly ratios (ofsource-caused extinction to natural extinction) is provided in the form of a geometric mean. Thisalso improves upon the problem (for all current MVISBK options in CALPOST) that an outlierextinction value for a single hour can significantly and inappropriately affect the daily ratio.
• The difficult requirement to estimate the exact natural extinction that is needed in the MVISBK=7option calculation is avoided by making the reasonable assumption that for hours of naturalimpairment, the perceptibility of the source-caused extinction is essentially zero. This assumptionworks well with the use of the geometric mean of hourly ratios technique.
Table 6-18aFLAG Results Without Refinements
Class I Area Worst-CaseYear
No. of DaysOver 5%
No. of DaysOver 10%
Max %Change
Arches NP 2003 1 0 5.64
Bandelier NM 2001 9 2 17.97
Black Canyon of the Gunnison NM 2003 2 0 9.42
Canyonlands NP 2003 2 1 12.98
Capitol Reef NP 2002 2 0 6.80
Grand Canyon NP 2002 2 1 10.81
Great Sand Dunes NM 2002 5 0 7.59
La Garita WA 2001 1 0 5.67
Mesa Verde NP 2002 12 2 12.50
Pecos WA 2001 10 1 11.45
Petrified Forest NP 2002 3 1 12.29
San Pedro Parks WA 2001 14 4 27.35
Weminuche WA 2002 25 2 15.18
West Elk WA 2001 1 0 7.91
Wheeler Peak WA 2003 1 0 9.42
Worst-case year: FLAG f(RH) Values, MVISBK=2, RHMAX=98%

09417-360-250R1 May, 20046-43
Table 6-18bFLAG Results With Refinements
Class I AreaWorst-Case
YearNo. ofDays
Over 5%
No. ofDays Over
10%
Max %Change
AfterPreliminaryRefinement
Max %Change
AfterAdditional
Refinement
Arches NP 2003 0 0 4.21 --
Bandelier NM 2001 7 1 11.98 <5
Black Canyon of the Gunnison NM 2001 1 0 6.63 <5
Canyonlands NP 2003 1 0 8.39 <5
Capitol Reef NP 2002 2 0 6.93 <5
Grand Canyon NP 2002 1 0 8.36 <5
Great Sand Dunes NM 2002 3 0 7.40 <5
La Garita WA 2001 0 0 4.83 --
Mesa Verde NP 2002 7 0 8.90 <5
Pecos WA 2001 6 0 7.74 <5
Petrified Forest NP 2002 2 0 9.34 <5
San Pedro Parks WA 2001 10 1 17.00 <5
Weminuche WA 2002 5 0 7.16 <5
West Elk WA 2001 1 0 7.58 <5
Wheeler Peak WA 2003 1 0 5.17 <5
Worst-case year: EPA f(RH) Values, MVISBK=2, RHMAX=95%, Includes Salt Aerosol
All days over 5% with preliminary refinements subsequently determined to be associated with naturalobscuration. When these days are addressed (see Attachment 7), remaining days have less than a 5%change of extinction and no further analysis is required.
All days with modeled extinction changes over 5% (with the use of refinements used in the Table 6-18bresults) were associated with natural obscuration. With the application of these reasonablerefinements to FLAG (described in more detail in Attachment 7), for the days with a reported extinctionchange over 5% after the initial refinements (Table 6-18b) we find that there are no days left with anextinction change greater than 5%. (Details with documentation for each day that was reviewed areprovided with the modeling data archive.) Therefore, we conclude that the proposed project does notcause an adverse visibility impact in any PSD Class I area, and that no further modeling analysis forvisibility impacts is required.

09417-360-250R1 May, 20046-44
Table 6-19Annual Average Salt Concentrations in PSD Class I Areas (from IMPROVE Data)
PSD Class I AreaAnnual Average NaCl Conc.
(µg/m3)
Arches NP 0.065
Bandelier NM 0.095
Black Canyon of the Gunnison NM 1 0.086
Canyonlands NP 0.113
Capitol Reef NP 0.098
Grand Canyon NP – Hance 0.117
Great Sand Dunes NM 0.099
La Garita WA 1 0.086
Mesa Verde NP 0.117
Pecos WA 2 0.095
Petrified Forest NP 0.150
San Pedro Parks WA 0.114
Weminuche WA 0.086
West Elk WA 1 0.086
Wheeler Peak WA 0.100
1. Used data from Weminuche WA2. Used data from Bandelier NM
6.5.5 Sulfur and Nitrogen Deposition Analysis
Results of the sulfur and nitrogen deposition analysis due to emissions from the proposed source areprovided in Table 6-20. There are no published thresholds for acidic deposition for the PSD Class Iareas in which acidic deposition impacts will be addressed. The deposition results are provided herefor evaluation by the FLMs. However, it is noted that the United States Department of AgricultureForest Service (http://www.fs.fed.us/r6/aq/natarm/r8/r8_psd_screen.pdf, Appendix A) indicates that theminimum detectable level for measuring an increase in wet deposition of sulfates or nitrates is 0.5kg/ha/yr. For conservatism, the Forest Service recommends a significance level of one tenth of thisminimum detectable level, or 0.05 kg/ha/yr. In addition, the FLM has also recently developed aDeposition Analysis Threshold (DAT) for nitrogen (also used for sulfur) of one tenth of the significancelevel, or 0.005 kg/ha/yr (FLAG, 2001). This value is to be used as a trigger for further FLM analysis,rather than as an adverse impact threshold (Porter, 2004). Values shaded in Table 6-20 are above theDAT levels, but are all below the 0.05 kg/ha/yr significance levels mentioned above.

09417-360-250R1 May, 20046-45
Table 6-20Maximum Total Nitrogen Deposition Over Three Years (2001-2003)
PSD Class I AreaNitrogen Deposition
(kg/ha/yr)Sulfur Deposition
(kg/ha/yr)
ScreeningThreshold Value
(kg/ha/yr)
Arches NP 1.74E-03 3.47E-03 5.00E-03
Bandelier NM 6.34E-03 1.59E-02 5.00E-03
Black Canyon of the Gunnison NM 2.34E-03 4.48E-03 5.00E-03
Canyonlands NP 2.63E-03 5.71E-03 5.00E-03
Capitol Reef NP 1.18E-03 2.73E-03 5.00E-03
Grand Canyon NP 8.36E-04 1.54E-03 5.00E-03
Great Sand Dunes NM 3.19E-03 6.31E-03 5.00E-03
La Garita WA 4.95E-03 9.24E-03 5.00E-03
Mesa Verde NP 8.61E-03 2.15E-02 5.00E-03
Pecos WA 4.92E-03 1.14E-02 5.00E-03
Petrified Forest NP 1.71E-03 3.14E-03 5.00E-03
San Pedro Parks WA 7.95E-03 1.98E-02 5.00E-03
Weminuche WA 8.10E-03 1.67E-02 5.00E-03
West Elk WA 2.37E-03 4.32E-03 5.00E-03
Wheeler Peak WA 3.75E-03 7.44E-03 5.00E-03
6.5.6 Lake Acid Neutralizing Capacity Analysis
Sulfur and nitrogen deposition can impact lakes in and near Class I and sensitive Class II areas. TheForest Service provided ENSR with a screening methodology to calculate the change in lake acidneutralizing capacity (ANC) from a baseline value at several lakes within the modeling domain. Thescreening procedure used for this analysis is documented in Appendix G of Attachment 4.
Table 6-21 lists the lakes in the analysis and their monitored baseline acid neutralizing capacity in unitsof micro-equivalent per liter (µeq/l). The threshold values for change in ANC are as follows:
• If the baseline ANC > 25, up to a 10% change in ANC is allowed
• If the baseline ANC < 25, up to a 1 ueq/l change in ANC is allowed
• If the baseline ANC < 0, “no change” in ANC is allowed

09417-360-250R1 May, 20046-46
The results of the calculations are also presented in Table 6-21, and reflect the average increase overthe three years modeled in micro-equivalents per liter or percent change of ANC. The results showlittle to no increase in the acid neutralizing capacity of these lakes.
Table 6-21Baseline Acid Neutralizing Capacity and Potential Changes for
Lakes Within the Modeling Domain
WildernessArea
Lake Name UTM N UTM EBaseline
ANC(µeq/l)
ANCChange
(%)
AverageANC
Change(µeq/l)
Small Lake Above U-Shaped Lake
4,201,000 336,200 53.7 0.5 N/ALa Garita
U-Shaped Lake 4,200,850 336,500 65.3 0.4 N/A
Glacier 4,124,500 359,300 63.4 1.0 N/ASouth SanJuan
Lake South of BlueLakes
4,120,800 355,450 19.8 N/A 0.2
Big Eldorado 4,176,679 275,801 27.7 0.4 N/A
Little Eldorado 4,176,833 275,489 -2.4 N/A 0.2
Lower Sunlight 4,168,037 272,111 79.8 0.6 N/A
Upper Grizzly 4,166,642 271,756 24.3 N/A 0.4
Weminuche
White Dome 4,176,293 275,042 2.3 N/A 0.3
West Elk S. Golden 4,294,000 310,300 111 0.1 N/A
6.6 Additional Impact Analyses
The PSD regulation requires that additional analyses be performed when assessing the impacts of aproposed project. These additional analyses include an evaluation of potential impacts caused bysecondary emissions from growth caused by the project and an analysis of impacts to soils andvegetation that have economic value. In addition to these PSD required analysis, EPA requested thatSteag provide an analysis of the Project’s potential for impact to ozone in the area and also a review ofpotential impacts to biological and cultural resources. These analyses are provided in this Section.

09417-360-250R1 May, 20046-47
6.6.1 Growth Analysis
A growth analysis examines the potential emissions from secondary sources associated with theproposed project. While these activities are not directly involved in project operation, the emissionscan reasonably be expected to occur. For the proposed Desert Rock Energy Facility, secondaryemissions will be associated with:
• coal processing and handling activities associated with the coal supply, and
• the project workforce.
The secondary emissions associated with the Project are not expected to be substantial whencompared to direct emissions during either construction or operation of the facility. As discussedbelow, the emissions associated with the coal supply system will occur during plant operation and willbe primarily due to road dust from coal haul truck operation on unpaved roads. There will be little newgrowth in the area due to the small work force (200-225 employees) expected during plant operation.The emissions associated with the workforce will be primarily the result of motor vehicle exhaustemissions associated with the commute of workers to and from the plant site.
The emissions associated with the coal operation are expected to be localized in the immediate area ofthe mine. The emissions due to worker commute are expected to be distributed over a two-countyarea of San Juan and McKinley counties with limited impact at any given location. Based on thisanalysis, we conclude that there will be little impact beyond the local area surrounding the Desert RockEnergy Facility due to secondary emission sources.
6.6.1.1 Secondary Emissions Associated with Coal Supply
Coal for the Desert Rock Energy Facility will be purchased under a contract with BHP Billiton, theoperators of the Navajo Mine. The design specifications for the coal will require BHP Billiton to blendcoal from about five of the Navajo Mine coal seams.
Coal will be mined from an open pit and transported to the crushing plant by off-road mining trucks.The run-of-mine coal will be crushed and blended to meet the design specification of the proposedfacility. The blended coal will be fed onto a conveyor and transported to the coal bunkers of theproposed facility.
The coal handling facility owned and controlled by Steag will store approximately a 30-day supply ofblended coal on site as a strategic reserve. For normal operations of the facility this coal will remainuntouched. The mine will also maintain, on their site, a coal storage area with run-of-mine coal withseveral days supply.
These coal preparation activities will be under the control of BHP Billiton and will likely be conducted inan area south of the current mining operations and east and north of the proposed power generation

09417-360-250R1 May, 20046-48
facility. The mining, storage and blending activities associated with providing coal for the facility aresecondary activities caused by the power plant operation.
BHP Billiton has not provided details on how they will supply the coal to Steag. Based on typicaloperations of this sort, the fugitive PM10 emissions associated with the coal supply system areexpected to be on the order of 15 tpy from the coal handling activities and on the order of 50 tpy fromtravel on unpaved roads to haul coal from the mine site to the crushing plant. These emissions willlikely be controlled by industry-standard fugitive dust control measures. These fugitive dust emissionswill be very localized to the mine and blending facility area. The emissions will be associated with non-buoyant plumes released from ground level or near-ground activities. The dust released is unlikely totravel significant distances. Given the rural location for the power plant site and the limited transportdistances expected of the fugitive PM10 emissions, the impact is expected to be minor from thesesecondary fugitive emissions associated with the coal supply operation.
6.6.1.2 Emissions Due to Workforce Travel
The Desert Rock Energy Facility is proposing to locate in San Juan County, New Mexico. Duringconstruction, the project is expected to employ about 800 workers, although the workforce may be upto 3,000 workers during peak construction periods. After start of operations, there will beapproximately 200-225 employees.
The workers for the plant (both construction and operations) are primarily expected to come from SanJuan County and adjoining McKinley County. It is expected that approximately 10% of the workforcewill come from rural areas within the Navajo Nation. Most workers (~60%) will commute approximately30 miles from the Farmington and Shiprock areas (San Juan County) while the remainder willcommute approximately 75 miles from Gallup (McKinley County) and Window Rock (Apache County,Arizona). The Navajo Nation requires preferred employment of local people, hence many of theworkers are expected to come from rural areas in the Navajo Nation.
The estimated 2002 population of San Juan and McKinley counties was 120,400 and 74,000 persons.The basic construction workforce of 800 persons is less than 0.4% of the population from which thelabor pool will be drawn. Over the past six years, San Juan and McKinley Counties have consistentlyhad unemployment above the statewide average. From published New Mexico Department of Laborstatistics, the unemployment rate in San Juan and McKinley Counties in 2002 was 6.7% (3,500persons) and 6.1% (1,600 persons), respectively, compared with the statewide total of 5.4%. Whileonly a portion of the unemployed persons in the two counties would be qualified for construction oroperation jobs at the power plant, the number of unemployed workers in the two counties in 2002 isslightly less than two times the 3,000 workers on site during the peak periods and more than 6 timesthe daily average of 800 workers during most of the construction period. As many of the constructionworkers during peak periods will be transient workers hired or brought in by subcontractors, they maycause local short-term demand for services in area hotels and restaurants but will not contribute topermanent growth in the area due to their transient nature. Negligible growth is expected for theoperation phase given the small number of operational workers (225) in a two-county region of nearly200,000 persons.

09417-360-250R1 May, 20046-49
Based on current unemployment levels, the requirement by the Navajo Nation for preferredemployment for local persons, and the expectation that a significant number of workers will come fromthe existing employment pool in the area, population growth associated with the proposed project isexpected to be small.
Consequently, secondary emission increases associated with the project workforce will be dueprimarily to worker commuter trips. As approximately 30% of the workers will commute from Gallup(approximately 75 miles) and 60% from Shiprock and Farmington (approximately 25 miles), anaverage commute on the order of 40 miles is a reasonable estimate. For construction, assuming 800employee commute trips per day of 40 miles each way, the typical daily commute vehicle milestraveled (VMT) will be approximately 64,000 vehicle-miles per day. PM10, VOC and NOx from thistraffic might be on the order of 15 tpy for the three-year construction period. For operations, the VMTwill be much lower, less than approximately 18,000 vehicle-miles per day, or about 5 tpy of PM10, VOCand NOx.
Given the rural nature of the two-county region, vehicle emissions associated with the projectworkforce travel will likely be spread out over a substantial part of the two-county area, an area of over8,500 square miles. Consequently, the impacts of any emissions will not be concentrated but ratherwill be dispersed throughout a large area, thus limiting local impacts in the largely rural counties.
6.6.2 Impacts on Soils and Vegetation
PSD regulations require analysis of air quality impacts on sensitive vegetation types, with significantcommercial or recreational value, and sensitive types of soil. Evaluation of impacts on sensitivevegetation were performed by comparing the predicted impacts attributable to the Project with thescreening levels presented in A Screening Procedure for the Impacts of Air Pollution Sources onPlants, Soils, and Animals (EPA 1980).
The results of this analysis are given in Table 6-22. As shown in the table, all impacts are modeled tobe well below the screening levels. Most of the designated vegetation screening levels are equivalentto or less stringent than the NAAQS and/or PSD increments, therefore satisfaction of NAAQS and PSDincrements assures that sensitive vegetation will not be impacted.

09417-360-250R1 May, 20046-50
Table 6-22Screening Concentrations for Soils and Vegetation
Pollutant AveragingPeriod
ScreeningConcentration
(µg/m3)
Predicted Concentration(µg/m3)
SO2 1-Hour 917 384.9
3-Hour 786 130.6
Annual 18 0.65
NO2 4-Hours 1 3,760 87.2
1-Month 2 564 24.4
Annual 94 0.62
CO Weekly 1 1,800,000 427.5
Source: “A Screening Procedure for the Impacts of Air Pollution Sources on Plants, Soils,and Animals”. EPA 450/2-81-078, December 1980
1. Modeled with the 3-hour Averaging Time
2. Modeled with the 24-hour Averaging Time
6.6.3 Impacts on Ozone Concentrations
The New Mexico Environmental Department has recently conducted a comprehensive photochemicalmodeling study (using CAMx) of the projected ozone concentrations in the Farmington, NM area. The2004 study, found at www.nmenv.state.nm.us/ozonetf, included new sources, such as the proposedSteag project. The results of the study indicated that:
• Compliance with the 8-hour ozone standard is demonstrated for 2007 and 2012
• Ozone concentrations are expected to decrease slightly during the period leading up to 2012
• Background ozone (transported from long distances) is an important contributor to elevated ozonelevels
• Biogenic emissions contribute more to ozone formation that anthropogenic emissions
• Source categories of electric utilities, oil and gas sources, area sources, and mobile sources eachcontribute about equally to the formation of ozone in the Farmington area.
Based on the results of this study, which accounted for the Project emissions in the region, it can beconcluded that the Desert Rock Energy Facility will not cause or contribute to an exceedance of theozone AAQS in the region.

09417-360-250R1 May, 20046-51
6.6.4 Endangered Species and National Historic Preservation Acts
The proposed project requires Federal permits and an agreement to use trust lands of the NavajoNation. As a result, the project requires review under and compliance with the National EnvironmentalPolicy Act (NEPA) (42 U.S.C. 4321-4347) and its implementing regulations. Under NEPA, theprotection of environmental resources will be assessed and the potential impacts of the Project will bedetermined. This work will include a review under the Endangered Species Act (ESA) (7 U.S.C. 136;16 U.S.C. 460 et seq.) and Section 106 of the National Historic Preservation Act (NHPA) and itsimplementing regulations (Protection of Historic Properties, 36 CFR 800). Steag is prepared to workwith the Bureau of Indian Affairs (BIA), as the lead Federal agency under NEPA, in complying with allapplicable regulations. A discussion of the Project reviews to date under the ESA is contained inAttachment 8 and work related to the NHPA is contained in Attachment 9 of this application.
6.7 Summary of Air Quality Modeling Results
Dispersion modeling of the air quality impacts of the proposed Desert Rock Energy Facility has beencompleted. The results are summarized below.
6.7.1 PSD Class II results
• The Project impacts are above PSD Class II significance levels for a limited area around the facility(about 11 km for SO2 and 1.7 km for PM10). The project has insignificant impacts for CO and NOx.
• The peak impacts from the facility are located very close to the fenceline (within 1 km in mostcases). These impacts are likely due to the emergency generator or auxiliary boilers that do notrun continuously.
• The PSD increment consumption due to the facility emissions is well within PSD Class IIincrements. The cumulative modeling analysis shows compliance with PSD Class II incrementsand the NAAQS.
• The SO2 3-hour and 24-hour impacts are 19% and 12% of the PSD Increments and are locatedbetween 1.0 km and 1.5km from the main stack. The PM10 24-hour and annual impacts are 29%and 12% of the PSD Increments and are located within 1.0 km of the main stack.
• The SO2 3-hour and 24-hour impacts are 16% and 15% of the NAAQS and are located 11 km fromthe main stack. Distant impacts from the Four Corners Power Plant and the San Juan GeneratingStation are likely contributors to this total. The PM10 24-hour and annual impacts are 32% and39% of the NAAQS and are located within 1 km of the main stack.
• There are no modeled significant impacts from the proposed project in areas beyond the NavajoNation, including New Mexico lands and the Ute Mountain range to the north.

09417-360-250R1 May, 20046-52
• Impacts on numerous distant PSD Class II areas (located beyond 50 km) show incrementconsumption below significance limits. Steag has provided regional haze and deposition resultsfor informational purposes, since PSD Class I limits are not applicable in Class II areas. No furthermodeling analysis for these distant areas is needed.
6.7.2 PSD Class I Results
• The project impacts are above PSD Class I significance levels for SO2 in a number of areas(including three PSD Class II areas that have special Colorado designation as Class I for SO2).The project has an insignificant impact for NO2 and PM10 increment.
• The project’s impact is a small fraction of the total increment (slightly over 20% for SO2). Thecumulative analysis shows that the project does not cause or contribute to a PSD Class Iincrement violation. The 3-hour and 24-hour SO2 impacts are 41% and 69% of the PSDIncrements, respectively, for the cumulative modeling with Four Corners Power Plant incrementexpansion. The 3-hour and 24-hour SO2 impacts are 41% and 59% of the PSD Increments,respectively, for the cumulative modeling when accounting for the Four Corners Power Plant andSan Juan Generating Station increment expansion.
• The project’s impacts on sulfur and nitrogen deposition are higher than the very low DAT levelsthat trigger additional review in a few areas. The United States Department of Agriculture ForestService web site (http://www.fs.fed.us/r6/aq/natarm/document.htm) indicates that the minimumdetectable level for measuring an increase in wet deposition of sulfates or nitrates is 0.5 kg/ha/yr.For conservatism in judging impacts, the Forest Service recommends a deposition significancelevel of one tenth of this minimum detectable level, or 0.05 kg/ha/yr. All of the impacts modeled forthe proposed plant are below this significance level, and include a component of ammonia saltsthat are not acidic. Steag therefore concludes that the proposed project does not adversely impactdeposition. This information is being provided to the FLMs for their review.
• The project’s impacts on regional haze are higher than insignificance thresholds of 5% change tobackground extinction with the use of the FLAG screening procedures. A number of refinementsto FLAG are presented, and the results show that there are no remaining days over the three yearsmodeled that exceed the threshold of a 5% change. A review of those days indicates that they canbe documented as being associated with one or more of the following natural interferences tovisibility:
Ø Occurrences of rain, snow, fog, etc.;
Ø Reduced visibility measurements at nearby representative airports;
Ø Cloud cover and/or elevated relative humidity at night, which would tend to preclude star-gazing activities.
In conclusion, all potential impacts to air quality and air quality related values due to the Desert RockEnergy Facility are expected to be within acceptable levels.

09417-360-250R1 May, 20047-1
7.0 REFERENCES
Cho Soung, M., 1994. Properly Apply Selective Catalytic Reduction of NOx Removal. ChemicalEngineering Progress, January, Page 39.
Environ Corporation, 2004. Air Quality Modeling Analysis for the San Juan Early Action OzoneCompact: Base Case and Future Case Modeling.
Federal Land Manager’s Air Quality Related Values Workgroup (FLAG), 2001. Guidance on NitrogenDeposition Analysis Thresholds.
Federal Land Manager’s Air Quality Related Values Workgroup (FLAG), 2000. Phase I Report.December.
Gebhart, C., 2004. Personal communication to Robert Paine, comments on 2004 AWMA paper(which is provided as Appendix E in Attachment 4).
Interagency Workgroup on Air Quality Modeling (IWAQM), 1998. Phase 2 Summary Report andRecommendations for Modeling Long Range Transport Impacts. EPA-454/R-98-019.December.
New Mexico Environmental Department websitehttp://www.nmenv.state.nm.us/ozonetf/San%20Juan%20MPE%20&%20Attainment%20Demo%20Report.pdf, accessed April 2004.
Porter, Ellen, U. S. Fish & Wildlife Service, 2004. Personal communication with Robert Paine ofENSR.
Scire, J.S., D.G. Strimaitis, R.J. Yamartino, 2000. A User’s Guide for the CALPUFF Dispersion Model(Version 5). Earth Tech, Inc. Concord, MA.
Scire, J.S., F.R. Robe, M.E. Fernau, R.J. Yamartino, 2000. A User’s Guide for the CALMETMeteorological Model (Version 5). Earth Tech, Inc. Concord, MA.
U.S. Dept. of Agriculture - Forest Service web site (http://www.fs.fed.us/r6/aq/natarm/document.htm)
U.S. Environmental Protection Agency, 1980. A Screening Procedure for the Impacts of AirPollution Sources on Plants, Soils, and Animals. EPA-450/2-81-078. U.S. EnvironmentalProtection Agency, Research Triangle Park, NC 27711.

09417-360-250R1 May, 20047-2
U.S. Environmental Protection Agency, 1985. Guideline for Determination of Good EngineeringPractice Stack Height (Technical Support Document for Stack Height Regulations). EPA-450/4-80-023R. Office of Air Quality Planning and Standards, Research Triangle Park, NorthCarolina. June 1985.
U.S. Environmental Protection Agency, 1990. New Source Review Workshop Manual. October (Draft).
U.S. Environmental Protection Agency, 1996. New Source Review Workshop Manual.
U.S. Environmental Protection Agency, 1996. Cost Control Manual. Fifth Edition, EPA document453/B-96-001.
U.S. Environmental Protection Agency, 1997. Compliance Assurance Monitoring (CAM) Rule, 40 CFRPart 64. October 27.
U.S. Environmental Protection Agency, 1999. Guideline on Air Quality Models.
U.S. Environmental Protection Agency, 2000. Fabric Filter Fact Sheet.
U.S. Environmental Protection Agency, 2003. Guidance for Estimating Natural Visibility ConditionsUnder the Regional Haze Program (Appendix A). EPA-450/B-03-005. Office of Air QualityPlanning and Standards, Research Triangle Park, North Carolina. September 2003.