Embed Size (px)
Citation preview

Appendix F
Analytical Program


Bayo Canyon Aggregate Area Investigation Report, Revision 1
EP2008-0226 F-1 May 2008
F-1.0 INTRODUCTION
This appendix discusses the analytical methods and data-quality review for samples collected during investigations (1994, 1995, 1996, and 2007) of the Bayo Canyon Aggregate Area (former Technical Area [TA] 10) at Los Alamos National Laboratory (the Laboratory). Additionally, this appendix summarizes the effects of data-quality issues on the acceptability of the analytical data.
Quality assurance (QA), quality control (QC), and data validation procedures were implemented in accordance with the “Quality Assurance Project Plan Requirements for Sampling and Analysis” (LANL 1996, 054609), and the Los Alamos National Laboratory’s statements of work (SOWs) for analytical laboratories (LANL 1995, 049738; LANL 2000, 071233). The results of the QA/QC procedures were used to estimate the accuracy, bias, and precision of the analytical measurements. Samples for QC include method blanks, matrix spikes (MSs), laboratory control samples (LCSs), internal standards, initial calibration verifications (ICVs) and continuing calibration verifications (CCVs), surrogates, and tracers.
The type and frequency of laboratory QC analyses are described in the SOWs for analytical laboratories (LANL 1995, 049738; LANL 2000, 071233). Other QC factors, such as sample preservation and holding times, were also assessed in accordance with the requirements outlined in standard operating procedure (SOP) 01.02, Sample Containers and Preservation.
The following SOPs were used for data validation:
• SOP-15.01, Routine Validation of Volatile Organic Data
• SOP-15.02, Routine Validation of Semivolatile Organic Data
• SOP-15.04, Routine Validation of High Explosives Data
• SOP-15.05, Routine Validation of Inorganic Data
• SOP-15.06, Routine Validation of Gamma Spectroscopy Data
• SOP-15.07, Routine Validation of Chemical Separation Alpha Spectrometry, Gas Proportional Counting, and Liquid Scintillation Data
A routine data validation was performed for each data package (also referred to as request numbers), and analytical data were reviewed and evaluated based on U.S. Environmental Protection Agency (EPA) National Functional Guidelines, where applicable (EPA 1994, 048639; EPA 1999, 066649). As a result of the data validation and assessment efforts, qualifiers are assigned to the analytical records as appropriate. The data-qualifier definitions are provided in Table F-1.0-1.
F-2.0 ANALYTICAL DATA ORGANIZATION AND VINTAGE
The Bayo Canyon Aggregate Area consists of Consolidated Units 10-001(a)-99 and 10-002(a)-99, Solid Waste Management Unit (SWMU) 10-004(a), and Areas of Concern (AOC) C-10-001 and 10-009. For purposes of analytical data presentation and review, the Bayo Canyon Aggregate Area analytical data are provided as four separate databases corresponding to the four main areas investigated: Consolidated Units 10-001(a)-99 and 10-002(a)-99, SWMU 10-004(a), and AOC 10-009, which includes analytical data from AOC C-10-001.

Bayo Canyon Aggregate Area Investigation Report, Revision 1
May 2008 F-2 EP2008-0226
F-2.1 Historical Laboratory Screening Data and Sample Documentation
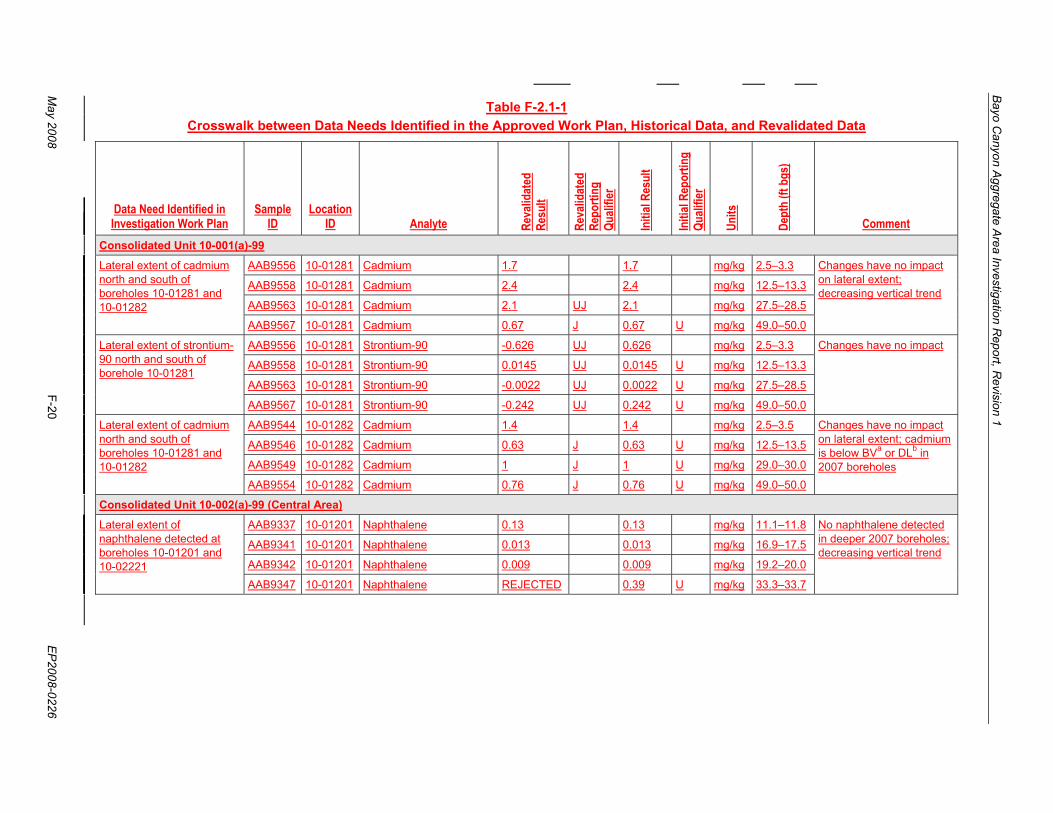
Samples collected before 1995–1996 were analyzed internally at the Laboratory’s Chemical Science and Technology (CST) on-site and off-site laboratories. Historical data, analyzed on-site by CST, have been determined by the Laboratory to be screening-level quality data only and are not used for decision-making purposes; therefore, CST on-site data are removed from reporting data sets used for assessing site contamination and/or risk and presented separately as screening data. Data analyzed off-site by CST are determined to be of sufficient quality for decision-making purposes only if complete data packages can be located and the analytical data are reviewed and revalidated to current QA standards. Table F-2.1-1 presents a crosswalk between the data needs identified in the approved work plan, the historical data set, and the revalidated data set, where changes were made as a result of revalidation.
Historical samples were collected within the Bayo Canyon Aggregate Area in 1994, 1995, and 1996, and many of these samples were submitted, all or in part, for analysis either to a CST on-site or off-site laboratory. All analytical data processed on-site in a CST mobile laboratory (e.g., Radvan, Chemvan) were removed from the reporting data sets. For investigation analytical data processed in a CST off-site laboratory, sample documentation was requested and the data validation package, if available, was reviewed. Data packages for CST off-site analytical data associated with historical field QC samples, however, were not requested because these samples were determined to add no value to the representative data set for the Bayo Canyon Aggregate Area.
Details regarding the quality review of vintage analytical data representative of the Bayo Canyon Aggregate Area are summarized in the following subsections.
F-2.1.1 Consolidated Unit 10-001(a)-99
Analytical data associated with 114 historical samples were processed on-site by CST in a mobile laboratory. These data were removed from the Consolidated Unit 10-001(a)-99 reporting data set as the data are screening level only and not suitable for decision-making purposes.
Analytical data associated with 29 samples processed off-site by CST were removed from the Consolidated Unit 10-001(a)-99 reporting data set for one or more of the following reasons: (1) complete data packages were requested to verify sample quality and results but are not available, (2) analytical data are associated with historical quality control (QC) samples, or (3) samples were processed on-site by the Laboratory’s Dynamic Experimentation (DX) laboratory, and the resulting data are screening level only and not suitable for decision-making purposes.
All remaining analytical results associated with historical sampling at Consolidated Unit 10-001(a)-99 are included in the reporting data set and reviewed further, along with data collected during the 2007 investigation.
F-2.1.2 Consolidated Unit 10-002(a)-99
Analytical data associated with 368 historical samples were processed on-site by CST in a mobile laboratory. These data were removed from the Consolidated Unit 10-002(a)-99 reporting data set because the data are screening level only and not suitable for decision-making purposes.
Analytical data associated with 96 samples processed off-site by CST were removed from the Consolidated Unit 10-002(a)-99 reporting data set for one or more of the following reasons: (1) complete data packages were requested to verify sample quality and results but were not available, (2) analytical data are associated with historical QC samples, or (3) samples were processed on-site by the DX laboratory, and the resulting data are screening level only and not suitable for decision-making purposes.

Bayo Canyon Aggregate Area Investigation Report, Revision 1
EP2008-0226 F-3 May 2008
All remaining analytical results associated with historical sampling at Consolidated Unit 10-002(a)-99 are included in the reporting data set and reviewed further, along with data collected during the 2007 investigation.
F-2.1.3 SWMU 10-004(a)
Analytical data associated with 35 historical samples were processed on-site by CST in a mobile laboratory. These data were removed from the SWMU 10-004(a) reporting data set because the data are screening level only and not suitable for decision-making purposes.
Analytical data associated with eight samples processed off-site by CST were removed from the SWMU 10-004(a) reporting data set because complete data packages were not available to verify sample quality and results.
All remaining analytical results associated with historical sampling at SWMU 10-004(a) are included in the reporting data set and reviewed further, along with data collected during the 2007 investigation.
F-2.1.4 AOC 10-009
All analytical results associated with historical sampling at AOC 10-009 are included in the reporting data set and reviewed further, along with data collected during the 2007 investigation. No analytical data (historical or current) are associated with AOC C-10-001.
F-3.0 INORGANIC CHEMICAL ANALYTICAL METHODS
Bayo Canyon Aggregate Area samples collected during historical investigations as well as the 2007 investigation were analyzed by one or more of the following inorganic chemical methods: target analyte list (TAL) metals, uranium, perchlorate, and wet chemistry. Samples were analyzed for TAL metals using EPA SW-846 Methods 6010, 6010B, 6020, 7040, 7060, 7420, 7470A, 7471, 7471A, 7740, and 7840. Other analytical methods included wet-chemistry EPA SW-846 Methods 9010 and 9012A for cyanide, EPA SW-846 Method 6850 for perchlorate, and generic kinetic phosphorescence analysis (KPA) for uranium (historical samples only). The analytical methods used for inorganic chemicals are listed in Table F-3.0-1.
At Consolidated Unit 10-001(a)-99, a total of 177 samples (1994 and 2007 vintage) were submitted for analysis of TAL metals, 97 samples (1994 vintage only) were submitted for analysis of uranium, 52 samples (2007 vintage only) were submitted for analysis of perchlorate, and 63 samples (1994 and 2007 vintage) were submitted for analysis of total cyanide.
At Consolidated Unit 10-002(a)-99, a total of 405 samples (1994 and 2007 vintage) were submitted for analysis of TAL metals; 271 samples (1994 vintage only) were submitted for analysis of uranium, 92 samples (2007 vintage only) were submitted for analysis of perchlorate, and 96 samples (1994 and 2007 vintage) were submitted for analysis of total cyanide.
At SWMU 10-004(a), a total of 42 samples (1994 and 2007 vintage) were submitted for analysis of TAL metals; 27 samples (1994 vintage only) were submitted for analysis of uranium, 11 samples (2007 vintage only) were submitted for analysis of perchlorate, and 11 samples (2007 vintage only) were submitted for analysis of total cyanide.

Bayo Canyon Aggregate Area Investigation Report, Revision 1
May 2008 F-4 EP2008-0226
At AOC 10-009, a total of 21 samples were collected during the 2007 investigation, and all were submitted for analysis of TAL metals, perchlorate, and total cyanide. No historical samples were submitted for inorganic chemical analysis.
Several samples collected during the 2007 investigation were also submitted for pH and/or geotechnical analysis. A total of 176 samples collected from the Bayo Canyon Aggregate Area were analyzed for pH by wet-chemistry methods. Four samples collected from AOC 10-009 were submitted for geotechnical analysis by the following methods: American Society for Testing and Materials (ASTM) Method D2216V for gravimetric and volumetric moisture content, ASTM Method D2434 for saturated hydraulic conductivity, ASTM Method D2937 for density, and Methods of Soil Analysis Method 18-1986 for calculated total porosity.
Tables H-3.1-1, H-4.1-1, H-5.1-1, and H-6.1-1 in Appendix H summarize, by data set, all samples collected and the analyses requested from the Bayo Canyon Aggregate Area. All inorganic chemical results are provided on a DVD provided in Appendix G.
F-3.1 Inorganic Chemical QA/QC Samples
To assess the accuracy and precision of inorganic chemical analyses, LCSs, preparation blanks (PBs), MS samples, laboratory duplicate samples, interference check samples (ICSs), and serial dilution samples were analyzed as part of the Bayo Canyon Aggregate Area investigations. Each of these QA/QC sample types is defined in the analytical services SOWs (LANL 1995, 049738; LANL 2000, 071233) and is described briefly in the sections below. For some of the analyses performed before the 1995 SOW was implemented, slightly different QA/QC procedures may have been followed.
The LCS serves as a monitor of the overall performance of each step during the analysis, including sample digestion. Following Laboratory SOP guidance, analytical results were qualified according to National Functional Guidelines (EPA 1994, 048639) if the individual LCS recovery indicated an unacceptable bias in the measurement of individual analytes. For inorganic chemicals in soil/tuff, LCS percent recoveries (%R) should fall into the control limits of 75%–125% (LANL 1995, 049738; LANL 2000, 071233).
Preparation blanks are used to measure bias and potential cross-contamination. All inorganic chemical results for the PB should be below the method detection limit (MDL).
The accuracy of inorganic chemical analyses is also assessed using MS samples. These samples are designed to provide information about the effect of the sample matrix on the sample preparation procedures and analytical technique. The MS acceptance criteria are 75%–125%, inclusive for all spiked analytes (LANL 1995, 049738; LANL 2000, 071233).
Laboratory duplicate samples assess the precision of inorganic chemical analyses. All relative percent differences (RPDs) between the sample and laboratory duplicate should be ±35% (LANL 1995, 049738; LANL 2000, 071233).
ICSs assess the accuracy of the analytical laboratory’s interelement and background correction factors used for inductively coupled plasma emission spectroscopy. The ICS %R should be within the acceptance range of 80%–120%. The QC acceptance limits are ±20%.
Serial dilution samples measure potential physical or chemical interferences and correspond to a sample dilution ratio of 1:5. The chemical concentration in the undiluted sample must be at least 50 times the

Bayo Canyon Aggregate Area Investigation Report, Revision 1
EP2008-0226 F-5 May 2008
MDL (100 times for inductively coupled plasma mass spectroscopy) for valid comparison. For sufficiently high concentrations, the RPD should be within 10%.
Details regarding the quality of the inorganic analytical data included in each Bayo Canyon Aggregate Area data set are summarized in the following subsections.
F-3.1.1 Consolidated Unit 10-001(a)-99
Inorganic chemical data for soil/tuff from Consolidated Unit 10-001(a)-99 that were rejected included
• the full suite of TAL metal results in four historical samples because the sample holding times were exceeded;
• the full suite of TAL metal results in three historical samples because MS %R values were in the range of 125%–150%, exceeding the acceptable range;
• two barium, two cyanide, seven lead, four silver, and four manganese results because the MS %R values were less than 30%; and
• 79 mercury results and 11 cyanide results because the samples were analyzed after a period equal to or greater than twice the holding time had elapsed.
Inorganic chemical data for soil/tuff from Consolidated Unit 10-001(a)-99 that were qualified as estimated (J) included
• 353 results for 20 TAL metals, 4 results for cyanide, 1 result for perchlorate, and 46 results for uranium because the reported result was between the estimated detection limit (EDL) and the MDL;
• 12 lead and 4 uranium results because both the sample and duplicate sample results were greater than or equal to 5 times the reporting limit (RL) and the duplicate RPD exceeded 35%;
• 13 results for 9 TAL metals because the serial dilution sample RPD exceeded 35%; and
• 54 results for 15 TAL metals because the MS analyses were performed on a non-Laboratory sample.
Inorganic chemical data for soil/tuff from Consolidated Unit 10-001(a)-99 that were qualified as estimated biased low (J–) included
• 214 results for 11 TAL metals because the MS %R values were greater than 30% but less than the lower acceptance level (LAL) of 75%;
• 20 calcium results, 4 magnesium results, 12 potassium results, 4 sodium results, 8 vanadium results, and 7 zinc results because the associated LCS %R was below the lower warning limit but was greater than or equal to the LAL of 75%; and
• 541 TAL metal results for 55 samples because the sample holding times were exceeded.
Inorganic chemical data for soil/tuff from Consolidated Unit 10-001(a)-99 that were qualified as estimated biased high (J+) included
• 85 results for 9 TAL metals because MS %R values were greater than 150%;
• 2 magnesium results, 4 manganese results, and 2 potassium results because the MS %R values exceeded the upper acceptance level (UAL) but were less than 150%;

Bayo Canyon Aggregate Area Investigation Report, Revision 1
May 2008 F-6 EP2008-0226
• 19 barium results, 4 beryllium results, 8 cadmium results, and 19 lead results because the associated LCS %R values exceeded the upper warning limit; and
• 17 silver results because the associated ICS %R values were between 50% and 80%.
A total of 496 inorganic chemical results were qualified as not detected (U) because either (1) the analytical laboratory qualified the analyte as not detected or (2) in comparison with the preparation blank, the sample result was greater than the EDL but less than or equal to 5 times the concentration of the related analyte in the blank.
A total of 304 inorganic chemical results were qualified as estimated and not detected (UJ) for one of the following reasons: the MS analyses were performed on a non-Laboratory sample, the MS %R values were greater than 150%, the MS %R values were greater than 30% but less than the LAL of 75%, the LCS %R values were below the lower warning limit but greater than or equal to the LAL of 75%, or the holding times were exceeded.
The rejected data reduced the number of sample results by 8%; however, the loss of these data did not substantially affect the assessment of risk or the nature and extent of inorganic chemicals at Consolidated Unit 10-001(a)-99. All other qualified data were used to evaluate the nature and extent of contamination (Appendix H) and the risk-screening assessments (Appendix I).
F-3.1.2 Consolidated Unit 10-002(a)-99
Inorganic chemical data for soil/tuff from Consolidated Unit 10-002(a)-99 that were rejected included
• the full suite of TAL metal results in 15 historical samples because the sample holding times were exceeded;
• 357 inorganic chemical results for TAL metals, cyanide, and uranium because MS %R values were in the range of 125%–150%, exceeding the acceptable range;
• 3 barium, 2 cyanide, 2 lead, 42 manganese, and 10 silver results because the MS %R values were less than 30%;
• 4 historical mercury results because the PBs, initial calibration blanks, or cross-contamination blanks were not analyzed with the samples; and
• 193 historical mercury results because the samples were analyzed after a period equal to or greater than twice the holding time had elapsed.
Inorganic chemical data for soil/tuff from Consolidated Unit 10-002(a)-99 that were qualified as estimated (J) included
• 1976 results for 27 inorganic chemicals (23 TAL metals plus cyanide, molybdenum, perchlorate and uranium) because the reported result was between the EDL and the MDL;
• 426 results for 23 inorganic chemicals (22 TAL metals plus uranium) because both the sample and duplicate sample results were greater than or equal to 5 times the RL and the duplicate RPD exceeded 35%;
• 11 chromium results and 1 sodium result because either the sample and/or duplicate sample results were greater than or equal to 5 times the RL and the difference between the samples exceeded 2 times the RL;
• 89 results for 17 TAL metals because the serial dilution samples were not analyzed;

Bayo Canyon Aggregate Area Investigation Report, Revision 1
EP2008-0226 F-7 May 2008
• 30 results for 9 TAL metals because the serial dilution sample RPD exceeded criteria;
• 16 historical uranium results because the MS analyses were performed on non-Laboratory samples; and
• 2 historical antimony results because MS %R values were greater than 30% but less than the LAL of 75%.
Inorganic chemical data for soil/tuff from Consolidated Unit 10-002(a)-99 that were qualified as estimated biased low (J–) included
• 279 results for 17 TAL metals because MS %R values were greater than 30% but less than the LAL of 75%;
• 13 aluminum results, 24 calcium results, 22 iron results, 10 magnesium results, 21 potassium results, 6 sodium results, 9 uranium results, 23 vanadium results, and 7 zinc results because the associated LCS %R values were below the lower warning limit but were greater than or equal to the LAL of 75%; and
• 520 TAL metal results associated with 42 historical samples because the sample holding times were exceeded.
Inorganic chemical data for soil/tuff from Consolidated Unit 10-002(a)-99 that were qualified as estimated biased high (J+) included
• 4 beryllium results because the associated ICV or CCV was recovered above the upper warning limit but was less than or equal to the UAL;
• 63 results for 12 TAL metals because MS %R values were greater than 150%;
• 1 antimony result, 6 arsenic results, 20 lead results, and 19 manganese results because the MS %R values exceeded the UAL of 125% but were below 150%; and
• 26 aluminum results, 3 arsenic results, 9 calcium results, 8 nickel results, 4 potassium results, 20 sodium results, and 4 uranium results because the associated LCS %R values exceeded the upper warning limit.
A total of 2074 inorganic chemical results were qualified as not detected (U) because either (1) the analytical laboratory qualified the analyte as not detected or (2) in comparison with the PB, the sample result was greater than the EDL but less than or equal to 5 times the concentration of the related analyte in the blank.
A total of 672 inorganic chemical results were qualified as estimated and not detected (UJ) for one of the following reasons: the duplicate sample analyzed was a non-Laboratory sample, a serial dilution sample was not analyzed with the samples, the MS %R values were greater than 150%, the MS %R values were greater than 30% but less than the LAL of 75%, the LCS %R values were below the lower warning limit but were greater than or equal to the LAL of 75%, or the holding times were exceeded.
The rejected data reduced the number of sample results by 10%; however, the loss of these data did not substantially affect the assessment of risk or the nature and extent for inorganic chemicals at Consolidated Unit 10-002(a)-99. All other qualified data were used to evaluate the nature and extent of contamination (Appendix H) and the risk-screening assessments (Appendix I).

Bayo Canyon Aggregate Area Investigation Report, Revision 1
May 2008 F-8 EP2008-0226
F-3.1.3 SWMU 10-004(a)
Inorganic chemical data for soil/tuff from SWMU 10-004(a) that were rejected included
• the full suite of TAL metal results in 4 historical samples because the data validator identified quality deficiencies;
• 4 cadmium and 5 silver results because the MS %R values were less than 30%; and
• 20 historical mercury results because the samples were analyzed after a period equal to or greater than twice the holding time had elapsed.
Inorganic chemical data for soil/tuff from SWMU 10-004(a) that were qualified as estimated (J) included
• 235 results for 21 inorganic chemicals (19 TAL metals plus cyanide and molybdenum) because the reported result was between the EDL and the MDL;
• 14 iron results, 7 lead results, 4 manganese results, and 6 zinc results because both the sample and duplicate sample results were greater than or equal to 5 times the RL and the duplicate RPD exceeded 35%;
• 7 chromium results and 4 lead results because either the sample and/or duplicate sample results were greater than or equal to 5 times the RL and the difference between the samples exceeded 2 times the RL; and
• 1 chromium result, 1 calcium result, 2 sodium results, and 1 iron result because the serial dilution sample RPD exceeded criteria.
Inorganic chemical data for soil/tuff from SWMU 10-004(a) that were qualified as estimated biased low (J–) included
• 57 results for 11 TAL metals because the MS %R values were greater than 30% but less than the LAL of 75%;
• 2 historical arsenic results because the LCS %R values were below the lower limit but were greater than or equal to the LAL of 75%; and
• 1 mercury and 1 cyanide result because the sample holding times were exceeded.
Inorganic chemical data for soil/tuff from SWMU 10-004(a) that were qualified as estimated biased high (J+) included
• seven aluminum results because the MS %R values were greater than 150%;
• four zinc results because the MS %R values exceeded the UAL of 125% but were less than 150%; and
• three mercury results and four potassium results because the LCS %R values exceeded the upper warning limit.
A total of 211 inorganic chemical results were qualified as not detected (U) because either (1) the analytical laboratory qualified the analyte as not detected or (2) in comparison with the preparation blank, the sample result was greater than the EDL but less than or equal to 5 times the concentration of the related analyte in the blank.
A total of 53 inorganic chemical results were qualified as estimated and not detected (UJ) for one of the following reasons: the sample and/or duplicate sample results were greater than or equal to 5 times the
Bayo Canyon Aggregate Area Investigation Report, Revision 1
EP2008-0226 F-9 May 2008
RL and the difference between the samples exceeded 2 times the RL, the MS %R values were greater than 30% but less than the LAL of 75%, the LCS %R values were below the lower warning limit but were equal to or exceeded the LAL of 75%, or the holding times were exceeded.
The rejected data reduced the number of sample results by 12%; however, the loss of these data did not substantially affect the assessment of risk or determination of nature and extent for inorganic chemicals at SWMU 10-004(a). All other qualified data were used to evaluate the nature and extent of contamination (Appendix H) and the risk-screening assessments (Appendix I).
F-3.1.4 AOC 10-009
No inorganic chemical data for soil/tuff from AOC 10-009 were rejected.
Inorganic chemical data for soil/tuff from AOC 10-009 that were qualified as estimated (J) included
• 8 arsenic results, 12 cadmium results, 10 mercury results, 6 molybdenum results, 6 selenium results, 21 silver results, and 12 thallium results because the reported result was between the EDL and the MDL.
Inorganic chemical data for soil/tuff from AOC 10-009 that were qualified as estimated biased low (J−) included
• 16 antimony and 11 selenium results because the MS %R values were greater than 30% but less than the LAL of 75%; and
• 1 cyanide result because the LCS %R values were below the lower warning limit but were equal to or exceeded the LAL of 75%.
A total of 135 inorganic chemical results were qualified as not detected (U) because either (1) the analytical laboratory qualified the analyte as not detected or (2) in comparison with the PB, the sample result was greater than the EDL but less than or equal to 5 times the concentration of the related analyte in the blank.
Twelve results for antimony (five results), cyanide (three results), and selenium (four results) were qualified as estimated and not detected (UJ) because the MS %R values were greater than 30% but less than the LAL of 75%.
All inorganic data collected from AOC 10-009 were used to evaluate the nature and extent of contamination (Appendix H) and the risk-screening assessments (Appendix I).
F-4.0 ORGANIC CHEMICAL ANALYSIS METHODS
Bayo Canyon Aggregate Area samples collected during historical investigations as well as the 2007 investigation were analyzed for high explosives (HE), semivolatile organic compounds (SVOCs), and volatile organic compounds (VOCs). Samples were analyzed using SW-846 Methods 8260 and 8260B (VOCs), 8270 and 8270C (SVOCs), and 8321A and 8330 (HE). All QC procedures were followed as required by the analytical laboratory SOWs (LANL 1995, 049738; LANL 2000, 071233). The analytical methods used for organic chemicals are listed in Table F-3.0-1.
At Consolidated Unit 10-001(a)-99, a total of 75 samples (1994 and 2007 vintage) were submitted for analysis of HE, 74 samples (1994 and 2007 vintage) were submitted for analysis of SVOCs, and 68 samples (1994 and 2007 vintage) were submitted for analysis of VOCs.

Bayo Canyon Aggregate Area Investigation Report, Revision 1
May 2008 F-10 EP2008-0226
At Consolidated Unit 10-002(a)-99, a total of 152 samples (1994 and 2007 vintage) were submitted for analysis of HE, 381 samples (1994 and 2007 vintage) were submitted for analysis of SVOCs, and 168 samples (1994 and 2007 vintage) were submitted for analysis of VOCs.
At SWMU 10-004(a), a total of 27 samples (1994 and 2007 vintage) were submitted for analysis of HE, 38 samples (1994 and 2007 vintage) were submitted for analysis of SVOCs, and 38 samples (1994 and 2007 vintage) were submitted for analysis of VOCs.
At AOCs 10-009 and C-10-001, a total of 21 samples were collected during the 2007 investigation, and all were submitted for analysis of HE, SVOCs, and VOCs. No historical samples were submitted for organic analysis.
Tables H-3.1-1, H-4.1-1, H-5.1-1, and H-6.1-1 (Appendix H) summarize, by data set, all samples collected from the Bayo Canyon Aggregate Area and the analyses requested. All organic chemical results are provided on CD in Appendix G.
F-4.1 Organic Chemical QA/QC Samples
The QC samples are designed to produce a qualitative measure of the reliability of a specific part of an analytical procedure. The methods for validating organic chemical results on the basis of the various QA/QC sample types are specified in the SOPs. Because some of the analyses may have been performed before the current SOWs were implemented (LANL 1995, 049738; LANL 2000, 071233), slightly different QA/QC procedures may have been followed. The validation of organic chemical data using QA/QC samples and other methods may have resulted in the rejection of the data or the assignment of various qualifiers to individual sample results.
Calibration verifications, LCSs, method blanks, surrogates, and internal standards were analyzed to assess the accuracy and precision of organic chemical analyses. Each of these QA/QC sample types is defined in the analytical services SOWs (LANL 1995, 049738; LANL 2000, 071233) and the applicable analytical methods, and summarized below.
Calibration verification is the establishment of a quantitative relationship between the response of the analytical instrument and the concentration of the target analyte. There are two aspects of calibration verification: initial and continuing. The initial calibration verifies the linearity of the calibration curve as well as the individual calibration standards used to perform the calibration. The continuing calibration verifies that the initial calibration is still linear and valid. The continuing calibration also serves to determine that analyte identification criteria, such as retention times and spectral matching, are being met.
The LCS is a sample of the same matrix that has been spiked with the target analytes and serves to monitor the overall performance. Following Laboratory SOP guidance, analytical results were qualified according to National Functional Guidelines (EPA 1999, 066649) if the individual LCS recoveries were not within method-specific acceptance criteria.
A method blank is an analyte-free matrix to which all reagents are added in the same volumes or proportions as those used in the environmental sample processing and which is extracted and analyzed in the same manner as the corresponding environmental samples. Method blanks are used to assess the potential for sample contamination during extraction and analysis.
A surrogate compound (surrogate) is an organic chemical used in the analyses of organic target analytes. The surrogate is similar in composition and behavior to the target analytes but is not normally found in environmental samples. Surrogates are added to every blank, sample, and spike to evaluate the
Bayo Canyon Aggregate Area Investigation Report, Revision 1
EP2008-0226 F-11 May 2008
efficiency with which analytes are recovered during extraction and analysis. The recovery percentage of the surrogates must be within specified ranges, or the sample may be rejected or assigned a qualifier.
Internal standards are chemical compounds added to every blank, sample, and standard extract at a known concentration. Internal standards are used as the basis for quantitation of target analytes. The %R for internal standards should be within the range of 50%–200%.
Details regarding the quality of the organic analytical data included in each Bayo Canyon Aggregate Area data set are summarized in the following subsections.
F-4.1.1 Consolidated Unit 10-001(a)-99
Organic chemical data for soil/tuff from Consolidated Unit 10-001(a)-99 that were rejected included
• the full suite of HE results in 11 historical samples and the results for all HE analytes (except high-melting explosive) in another 4 historical samples because the associated retention time shifted by more than 0.05 min from the mid-level standard of the initial calibration;
• 408 SVOC results and 372 VOC results in 6 historical samples because either the required calibration information was unavailable or the samples were analyzed on an expired calibration;
• the full suite of HE results in 1 historical sample, 1 result for amino-2,6-dinitrotoluene[4-], and 272 SVOC results in 4 historical samples because the data validator identified quality deficiencies; and
• 2 butanone[2-] results because the analyte was analyzed with a relative response factor of less than 0.05.
Organic chemical data for soil/tuff from Consolidated Unit 10-001(a)-99 that were qualified as estimated (J) included
• 50 VOC and 6 SVOC results because the concentrations were less than the estimated quantitation limit (EQL) but greater than the MDL;
• 1 ethylbenzene result, 2 isopropyltoluene[4-] results, and 1 toluene result because the associated internal standard area counts were less than 50% but greater than 10% of the previous continuing calibration standard;
• 3 toluene results because the associated sample concentration was greater than 5 times/10 times the amount in the method blank; and
• 1 acetone result because the initial calibration curve exceeded the percent relative standard deviation (%RSD) criteria and/or the continuing calibration standard exceeded the percent detection (%D) criteria.
A total of 8523 organic chemical results were qualified as not detected (U) for one of the following reasons: (1) the analytical laboratory qualified the analyte as not detected, (2) the associated sample concentration was less than 5 times/10 times the amount in the method blank, or (3) the associated mass spectrum did not meet method specifications.
A total of 718 organic chemical results were qualified as estimated and not detected (UJ) for one of the following reasons: (1) the analytical laboratory qualified the analyte as not detected, (2) the %RSD criteria and/or the continuing calibration standard exceeded the %D criteria, (3) associated internal standard area

Bayo Canyon Aggregate Area Investigation Report, Revision 1
May 2008 F-12 EP2008-0226
counts were less than 50% but greater than 10% of the previous continuing calibration standard, or (4) extraction holding times were exceeded by more than 2 times.
The rejected data reduced the number of sample results by 13%; however, the loss of these data did not substantially affect the assessment of risk or the nature and extent of organic chemicals at Consolidated Unit 10-001(a)-99. All other qualified data were used in the evaluation of the nature and extent of contamination (Appendix H) and the risk-screening assessments (Appendix I).
F-4.1.2 Consolidated Unit 10-002(a)-99
Organic chemical data for soil/tuff from Consolidated Unit 10-002(a)-99 that were rejected included
• 30 HE results in 3 historical samples because the required retention time documentation was unavailable;
• 637 HE results because the associated retention time shifted by more than 0.05 min from the mid-level standard of the initial calibration;
• 56 HE results and 1701 SVOC results because the data validator identified quality deficiencies;
• 474 SVOC results for 7 historical samples because the required LCS documentation was unavailable;
• 255 SVOC results for 5 historical samples because at least 1 sample surrogate %R was less than 10%;
• 1 benzo(g,h,i)perylene result because the required mass spectrum documentation was unavailable;
• 610 SVOC results and 121 VOC results because the sample analysis exceeded 2 times the method published holding time requirement;
• 136 SVOC results for 2 historical samples because analytical holding times were exceeded;
• 61 VOC results for 1 historical sample because the required surrogate information was unavailable; and
• 2 carbon tetrachloride results and 2 trichloroethane[1,1,1-] results because the associated analytes did not have a valid 5-point calibration and/or a standard at the RL.
Organic chemical data for soil/tuff from Consolidated Unit 10-002(a)-99 that were qualified as estimated (J) included
• 12 SVOC and 43 VOC results because the concentrations were less than the EQL but greater than the MDL;
• 1 acetone result, 2 bis(2-ethylhexyl)phthalate results, and 4 di-n-butylphthalate results because the associated sample concentration was greater than 5 times/10 times the amount in the method blank; and
• 6 acetone results, 2 benzoic acid results, 1 butanone[2-] result, and 5 methylene chloride results because the initial calibration curve exceeded the %RSD criteria and/or the continuing calibration standard exceeded the %D criteria.
Bayo Canyon Aggregate Area Investigation Report, Revision 1
EP2008-0226 F-13 May 2008
Organic chemical data for soil/tuff from Consolidated Unit 10-002(a)-99 that were qualified as estimated biased low (J−) included
• one bis(2-ethylhexyl)phthalate result and one diethylphthalate result because at least two sample surrogate %Rs in the same fraction were less than the LAL but greater than 10%;
• one acenaphthene result and one bis(2-ethylhexyl)phthalate result because at least one sample surrogate %R was less than 10%; and
• one result for each of bis(2-ethylhexyl)phthalate, bromobenzene, carbon tetrachloride, phenol, and trichloroethane[1,1,1-] because extraction/analytical holding times were exceeded by less than 2 times the published method holding time requirement.
A total of 30,814 organic chemical results were qualified as not detected (U) for one of the following reasons: (1) the analytical laboratory qualified the analyte as not detected, (2) the associated sample concentration was less than 5 times/10 times the amount in the method blank, or (3) the associated mass spectrum did not meet method specifications.
A total of 3955 organic chemical results were qualified as estimated and not detected (UJ) for one of the following reasons: (1) the %RSD criteria and/or the continuing calibration standard exceeded the %D criteria, (2) extraction/analytical holding times were exceeded by less than 2 times the published method holding time requirement, (3) associated internal standard area counts were less than 50% but greater than 10% of the previous continuing calibration standard, (4) LCS %R values were less than the LAL but greater than10%, or (5) at least 2 sample surrogate %R values in the same fraction were less than the LAL but greater than 10%.
The rejected data reduced the number of sample results by 11%; however, the loss of these data did not substantially affect the assessment of risk or the nature and extent of organic chemicals at Consolidated Unit 10-002(a)-99. All other qualified data were used in the evaluation of the nature and extent of contamination (Appendix H) and the risk-screening assessments (Appendix I).
F-4.1.3 SWMU 10-004(a)
Organic chemical data for soil/tuff from SWMU 10-004(a) that were rejected included
• 40 HE results in 4 historical samples because the required retention time documentation was unavailable;
• 52 HE results because the associated retention time shifted by more than 0.05 min from the mid-level standard of the initial calibration;
• 40 HE results and 195 SVOC results because the sample analysis exceeded 2 times the method-published holding time requirement;
• 813 SVOC results because the data validator identified quality deficiencies; and
• 1 butanone[2-] result because the analyte was analyzed with a relative response factor of less than 0.05.
Organic chemical data for soil/tuff from SWMU 10-004(a) that were qualified as estimated (J) included
• 2 di-n-butylphthalate results and 25 VOC results because the concentrations were less than the EQL but greater than the MDL;
Bayo Canyon Aggregate Area Investigation Report, Revision 1
May 2008 F-14 EP2008-0226
• 1 acetone result because the associated sample concentration was greater than 5 times/10 times the amount in the method blank; and
• 3 acetone results because initial calibration curves exceeded the %RSD criteria and/or the continuing calibration standards exceeded the %D criteria.
A total of 3915 organic chemical results were qualified as not detected (U) because either (1) the analytical laboratory qualified the analyte as not detected or (2) the associated sample concentration was less than 5 times/10 times the amount in the method blank.
A total of 230 organic chemical results were qualified as estimated and not detected (UJ) because the %RSD criteria and/or the continuing calibration standard exceeded the %D criteria.
The rejected data reduced the number of sample results by 27%; however, the loss of these data did not substantially affect the risk assessment of the nature and extent of organic chemicals at SWMU 10-004(a). All other qualified data were used in the evaluation of the nature and extent of contamination (Appendix H) and the risk-screening assessments (Appendix I).
F-4.1.4 AOC 10-009
No organic chemical data for soil/tuff from AOC 10-009 were rejected.
Four toluene results were J-qualified because the concentrations were less than the EQL but greater than the MDL.
A total of 2930 organic chemical results were qualified as not detected (U) because either (1) the analytical laboratory qualified the analyte as not detected or (2) the associated sample concentration was less than 5 times/10 times the amount in the method blank.
A total of 216 organic chemical results were qualified as estimated and not detected (UJ) because either (1) the %RSD criteria and/or the continuing calibration standard exceeded the %D criteria or (2) the associated internal standard area counts were less than 50% but greater than 10% of the previous continuing calibration standard.
All organic chemical data collected from AOC 10-009 were used in the evaluation of the nature and extent of contamination (Appendix H) and the risk-screening assessments (Appendix I).
F-5.0 RADIONUCLIDE ANALYSIS METHODS
Bayo Canyon Aggregate Area samples collected during historical investigations as well as the 2007 investigation were analyzed by one or more of the following radionuclide methods: (1) gamma spectroscopy (EPA Method 901.1 and generic gamma spectroscopy); (2) isotopic uranium, plutonium, and/or americium-241 (HASL Method 300); (3) strontium-90 (EPA Method 905); and (4) gross-alpha/-beta (EPA Method 900).
At Consolidated Unit 10-001(a)-99, a total of 4 samples (1994 vintage only) were submitted for gamma spectroscopy analysis, 20 samples (2007 vintage only) were submitted for isotopic uranium analysis, and 156 samples (1994 and 2007 vintage) were submitted for the analysis of strontium-90.
At Consolidated Unit 10-002(a)-99, a total of 18 samples (1994, 1996, and 2007 vintage) were submitted for gamma spectroscopy analysis, 15 samples (1994 and 2007 vintage only) were submitted for isotopic uranium analysis, 384 samples (1994, 1996, and 2007 vintage) were submitted for strontium-90 analysis,

Bayo Canyon Aggregate Area Investigation Report, Revision 1
EP2008-0226 F-15 May 2008
2 Quaternary alluvium samples (2007 vintage) were submitted for isotopic plutonium analysis, and 1 soil sample (2007 vintage) was submitted for the analysis of americium-241 and gross-alpha/-beta.
At SWMU 10-004(a), a total of 38 samples (1994 and 2007 vintage) were submitted for the analysis of strontium-90.
At AOCs 10-009 and C-10-001, a total of 25 samples (1995 and 2007 vintage) were submitted for the analysis of strontium-90.
Tables H-3.1-1, H-4.1-1, H-5.1-1, and H-6.1-1 (Appendix H) summarize, by data set, all samples collected from the Bayo Canyon Aggregate Area and the analyses requested. All radionuclide results are provided on CD (Appendix G).
F-5.1 Radionuclide QA/QC Samples
The minimum detectable concentration (MDC) for each radionuclide in PBs, method blanks, laboratory duplicates, tracer/carrier recovery, LCSs, and MS samples were analyzed as part of the Bayo Canyon Aggregate Area investigations to assess the accuracy and precision of radionuclide analyses. These QA/QC qualifiers and sample types for radionuclides are defined in the analytical services SOWs (LANL 1995, 049738; LANL 2000, 071233), are described in the applicable SOPs and are discussed briefly below. Because some of the analyses were performed before the 1995 SOW was implemented, slightly different QA/QC procedures may have been followed. The validation of radionuclide data using QA/QC samples and other methods may have resulted in the rejection of data or the assignment of various qualifiers to individual sample results.
The MDC for each radionuclide is defined as the minimum activity concentration that the analytical laboratory equipment can detect in 95% of the analyzed samples and is used to assess analytical performance.
PBs and method blanks are used to measure bias and assess potential cross-contamination of samples during preparation and analysis. Blank results should be less than the MDC for each radionuclide.
Laboratory duplicates are used to assess or demonstrate acceptable laboratory method precision at the time of analysis as well as to assess the long-term precision of an analytical method on various matrices. For radionuclide analyses, duplicate results are used to calculate a duplicate error ratio (DER). The DER is based on 1 standard deviation of the sample and the duplicate sample and should be less than 4.
The LCS serves as a monitor of the overall performance of each step during the analysis, and the acceptance criteria for LCSs are method-specific. For radionuclide methods, LCS %R values should fall into the control limits of 80%–120%.
The accuracy of radionuclide analyses is also assessed using MS samples. These samples are designed to provide information about the effect of the sample matrix on the sample preparation procedures and analytical technique. The MS %R values should be within the acceptance range of 75%–125%; however, if the sample result is more than 4 times the amount of the spike added, these acceptance criteria do not apply.
Details regarding the quality of the radionuclide analytical data included in each Bayo Canyon Aggregate Area data set are summarized in the following subsections.

Bayo Canyon Aggregate Area Investigation Report, Revision 1
May 2008 F-16 EP2008-0226
F-5.1.1 Consolidated Unit 10-001(a)-99
No radionuclide data for soil/tuff from Consolidated Unit 10-001(a)-99 were rejected.
A total of 180 radionuclide results were reported as not detected (U or UJ). Of these, 173 radionuclide results were reported as not detected (U) because either (1) the sample concentration was less than 3 times the total propagated uncertainty or (2) the sample concentration was less than the MDC. Seven strontium-90 results were qualified as estimated and not detected (UJ) because the LCS %R values were less than the LAL but greater than 10%. All other radionuclide results (60) were reported as detections without further qualification.
All radionuclide data collected from Consolidated Unit 10-001(a)-99 were used in the evaluation of the nature and extent of contamination (Appendix H) and the risk-screening assessments (Appendix I).
F-5.1.2 Consolidated Unit 10-002(a)-99
Radionuclide data for soil/tuff from Consolidated Unit 10-002(a)-99 that were rejected included
• six historical strontium-90 results because the associated LCSs %R values were less than 10%; and
• six historical strontium-90 results because the associated DER exceeded 4.
Radionuclide data for soil/tuff from Consolidated Unit 10-002(a)-99 that were qualified as estimated (J) included
• six historical strontium-90 results because the required duplicate documentation was unavailable; and
• one cesium-137 result, four strontium-90 results, and one uranium-238 result because the associated DER exceeded 2 but was less than 4.
Radionuclide data for soil/tuff from Consolidated Unit 10-002(a)-99 that were qualified as estimated biased low (J−) included
• one result each for europium-152, strontium-90, uranium-234, uranium-235, and uranium-238 because the method holding times were exceeded;
• one strontium-90 result because the associated MS %R value was less than the LAL of 75% but greater than 10%; and
• nine strontium-90 results because the associated LCS %R values were less than the LAL of 80% but greater than 10%.
Radionuclide data for soil/tuff from Consolidated Unit 10-002(a)-99 that were qualified as estimated biased high (J+) included
• three strontium-90 results because the associated MS %R values exceeded the UAL of 125%; and
• eight strontium-90 results, three uranium-234 results, three uranium-235 results, and three uranium-238 results because the associated LCS %R values exceeded the UAL of 120%.
A total of 385 radionuclide results were reported as not detected (U) for one of the following reasons: (1) the sample concentration was less than 3 times the total propagated uncertainty, (2) the sample

Bayo Canyon Aggregate Area Investigation Report, Revision 1
EP2008-0226 F-17 May 2008
concentration was less than the MDC, or (3) the sample concentration was less than or equal to 5 times the amount in the method blank. In addition, one americium-241 result was reported as estimated and not detected (UJ) because the LCS %R values were less than the LAL but greater than 10%.
The rejected data reduced the number of sample results by 2%, and the loss of these data did not substantially affect the assessment of radioactive dose or of the nature and extent of radionuclides at Consolidated Unit 10-002(a)-99. All other qualified data were used in the evaluation of the nature and extent of contamination (Appendix H) and the risk-screening assessments (Appendix I).
F-5.1.3 SWMU 10-004(a)
No radionuclide data for soil/tuff from SWMU 10-004(a) were rejected.
Out of 38 strontium-90 results, 37 were reported as not detected (U) because either (1) the sample concentration was less than 3 times the total propagated uncertainty or (2) the sample concentration was less than the MDC. The remaining strontium-90 result was reported as a detection without further qualification.
F-5.1.4 AOC 10-009
Two historical strontium-90 results were rejected because the required MDC or total propagated uncertainty documentation was unavailable.
Out of 23 strontium-90 results, 19 were reported as not detected (U) because the sample concentration was less than the MDC. The remaining four strontium-90 results were reported as detections without further qualification.
F-6.0 REFERENCES
The following list includes all documents cited in this appendix. Parenthetical information following each reference provides the author(s), publication date, and ER ID number. This information is also included in text citations. ER ID numbers are assigned by the Environmental Programs Directorate’s Records Processing Facility (RPF) and are used to locate the document at the RPF and, where applicable, in the master reference set.
Copies of the master reference set are maintained at the NMED Hazardous Waste Bureau; the U.S. Department of Energy–Los Alamos Site Office; the U.S. Environmental Protection Agency, Region 6; and the Directorate. The set was developed to ensure that the administrative authority has all material needed to review this document, and it is updated with every document submitted to the administrative authority. Documents previously submitted to the administrative authority are not included.
EPA (U.S. Environmental Protection Agency), February 1994. “USEPA Contract Laboratory Program National Functional Guidelines for Inorganic Data Review,” EPA-540/R-94/013, Office of Emergency and Remedial Response, Washington, D.C. (EPA 1994, 048639)
EPA (U.S. Environmental Protection Agency), October 1999. “USEPA Contract Laboratory Program National Functional Guidelines for Organic Data Review,” EPA540/R-99/008, Office of Emergency and Remedial Response, Washington, D.C. (EPA 1999, 066649)

Bayo Canyon Aggregate Area Investigation Report, Revision 1
May 2008 F-18 EP2008-0226
LANL (Los Alamos National Laboratory), July 1995. “Statement of Work (Formerly Called "Requirements Document") - Analytical Support, (RFP number 9-XS1-Q4257), (Revision 2 - July, 1995),” Los Alamos National Laboratory, Los Alamos, New Mexico. (LANL 1995, 049738)
LANL (Los Alamos National Laboratory), March 1996. “Quality Assurance Project Plan Requirements for Sampling and Analysis,” Los Alamos National Laboratory document LA-UR-96-441, Los Alamos, New Mexico. (LANL 1996, 054609)
LANL (Los Alamos National Laboratory), December 2000. “University of California, Los Alamos National Laboratory (LANL), I8980SOW0-8S, Statement of Work for Analytical Laboratories,” Rev. 1, Los Alamos National Laboratory, Los Alamos, New Mexico. (LANL 2000, 071233)

Bayo Canyon Aggregate Area Investigation Report, Revision 1
EP2008-0226 F-19 May 2008
Table F-1.0-1 Data-Qualifier Definitions
Data Qualifier Definition U The analyte was analyzed for but not detected.
J The analyte was positively identified, and the associated numerical value is estimated to be more uncertain than would normally be expected for that analysis.
J+ The analyte was positively identified, and the result is likely to be biased high.
J– The analyte was positively identified, and the result is likely to be biased low.
UJ The analyte was not positively identified in the sample, and the associated value is an estimate of the sample-specific detection or quantitation limit.
R The data are rejected as a result of major problems with QA/QC parameters.
May 2008
F-20 E
P2008-0226
Bayo C
anyon Aggregate A
rea Investigation Report, R
evision 1
Table F-2.1-1 Crosswalk between Data Needs Identified in the Approved Work Plan, Historical Data, and Revalidated Data
Data Need Identified in Investigation Work Plan
Sample ID
Location ID Analyte Re
valid
ated
Re
sult
Reva
lidat
ed
Repo
rting
Qu
alifie
r
Initi
al Re
sult
Initi
al Re
porti
ng
Quali
fier
Units
Dept
h (ft
bgs
)
Comment Consolidated Unit 10-001(a)-99
AAB9556 10-01281 Cadmium 1.7 1.7 mg/kg 2.5–3.3
AAB9558 10-01281 Cadmium 2.4 2.4 mg/kg 12.5–13.3
AAB9563 10-01281 Cadmium 2.1 UJ 2.1 mg/kg 27.5–28.5
Lateral extent of cadmium north and south of boreholes 10-01281 and 10-01282
AAB9567 10-01281 Cadmium 0.67 J 0.67 U mg/kg 49.0–50.0
Changes have no impact on lateral extent; decreasing vertical trend
AAB9556 10-01281 Strontium-90 -0.626 UJ 0.626 mg/kg 2.5–3.3
AAB9558 10-01281 Strontium-90 0.0145 UJ 0.0145 U mg/kg 12.5–13.3
AAB9563 10-01281 Strontium-90 -0.0022 UJ 0.0022 U mg/kg 27.5–28.5
Lateral extent of strontium-90 north and south of borehole 10-01281
AAB9567 10-01281 Strontium-90 -0.242 UJ 0.242 U mg/kg 49.0–50.0
Changes have no impact
AAB9544 10-01282 Cadmium 1.4 1.4 mg/kg 2.5–3.5
AAB9546 10-01282 Cadmium 0.63 J 0.63 U mg/kg 12.5–13.5
AAB9549 10-01282 Cadmium 1 J 1 U mg/kg 29.0–30.0
Lateral extent of cadmium north and south of boreholes 10-01281 and 10-01282
AAB9554 10-01282 Cadmium 0.76 J 0.76 U mg/kg 49.0–50.0
Changes have no impact on lateral extent; cadmium is below BVa or DLb in 2007 boreholes
Consolidated Unit 10-002(a)-99 (Central Area)
AAB9337 10-01201 Naphthalene 0.13 0.13 mg/kg 11.1–11.8
AAB9341 10-01201 Naphthalene 0.013 0.013 mg/kg 16.9–17.5
AAB9342 10-01201 Naphthalene 0.009 0.009 mg/kg 19.2–20.0
Lateral extent of naphthalene detected at boreholes 10-01201 and 10-02221
AAB9347 10-01201 Naphthalene REJECTED 0.39 U mg/kg 33.3–33.7
No naphthalene detected in deeper 2007 boreholes; decreasing vertical trend

EP
2008-0226 F-21
May 2008
Bayo C
anyon Aggregate A
rea Investigation Report, R
evision 1
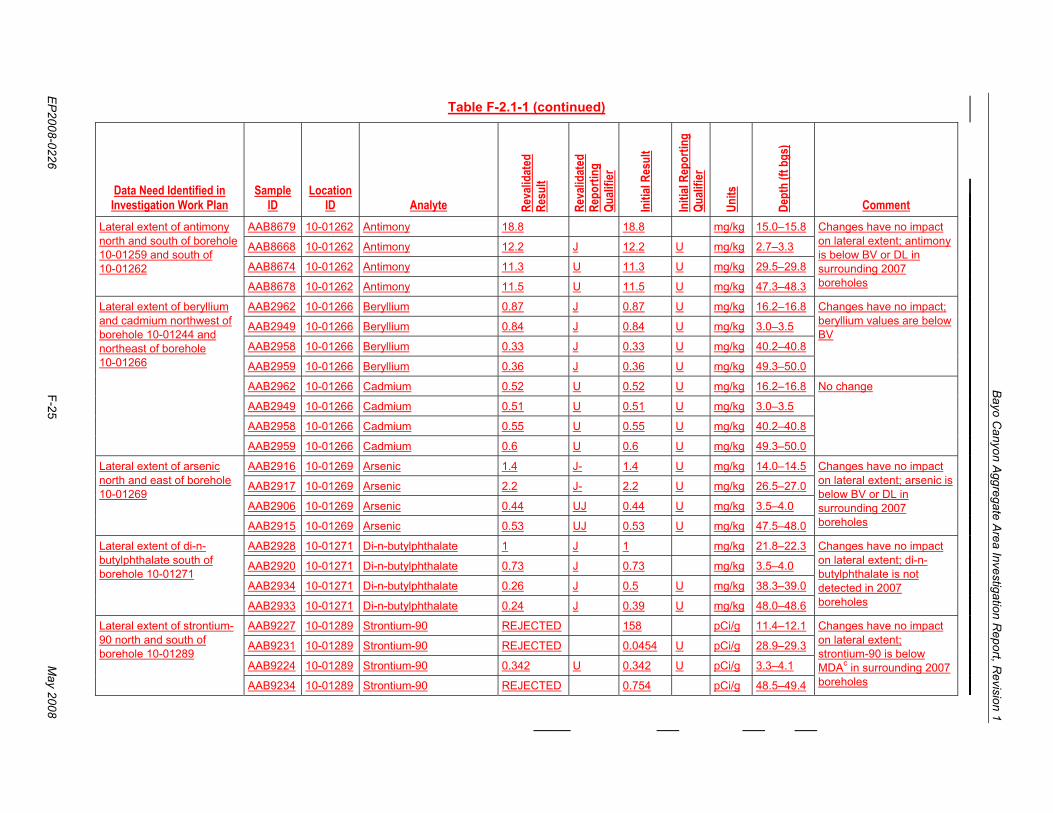
Table F-2.1-1 (continued)
Data Need Identified in Investigation Work Plan
Sample ID
Location ID Analyte Re
valid
ated
Re
sult
Reva
lidat
ed
Repo
rting
Qu
alifie
r
Initi
al Re
sult
Initi
al Re
porti
ng
Quali
fier
Units
Dept
h (ft
bgs
)
Comment AAB9360 10-01205 Cadmium 3.3 3.3 mg/kg 10.0–10.5
AAB9361 10-01205 Cadmium 1.1 1.1 mg/kg 14.3–14.8
AAB9363 10-01205 Cadmium 1.3 1.3 mg/kg 19.5–20.0
AAB9364 10-01205 Cadmium 0.81 U 0.81 U mg/kg 20.0–20.9
AAB9368 10-01205 Cadmium 2.7 2.7 mg/kg 39.0–40.0
Vertical extent of cadmium at borehole 10-01205 and the lateral extent of cadmium northwest of this location
AAB9399 10-01205 Cadmium 1.2 1.2 mg/kg 49.3–50.0
No change
AAB9351 10-01209 Beryllium 0.56 U 0.56 U mg/kg 14.0–14.7
AAB9354 10-01209 Beryllium 0.72 U 0.72 U mg/kg 29.0–29.6
AAB9357 10-01209 Beryllium 0.52 U 0.52 U mg/kg 37.5–38.4
Lateral extent of beryllium, particularly to the northwest of borehole 10-01209 and east of borehole 10-02220
AAB9359 10-01209 Beryllium 2.2 2.2 mg/kg 48.4–49.2
No change
AAB6392 10-01213 Antimony 9.6 U 9.6 U mg/kg 6.3–6.8
AAB6395 10-01213 Antimony 10.4 J 10.4 U mg/kg 19.2–19.7
AAB6404 10-01213 Antimony 18.6 18.6 mg/kg 39.2–39.7
AAB6403 10-01213 Antimony 11.7 U 11.7 U mg/kg 46.8–47.3
Change has no impact
AAB6392 10-01213 Zinc 24.1 24.1 mg/kg 6.3–6.8
AAB6395 10-01213 Zinc 87.4 87.4 mg/kg 19.2–19.7
AAB6404 10-01213 Zinc 25.1 25.1 mg/kg 39.2–39.7
Lateral extent of antimony and zinc to the west of borehole 10-01213
AAB6403 10-01213 Zinc 21.5 21.5 mg/kg 46.8–47.3
No change
AAB9269 10-01294 Ethylbenzene 0.005 U 0.005 U mg/kg 15–15.9 No change
AAB9271 10-01294 Ethylbenzene 0.006 U 0.006 U mg/kg 26.5–27.1
Vertical extent of ethylbenzene and xylene at borehole 10-01294
AAB9272 10-01294 Ethylbenzene 0.006 U 0.006 U mg/kg 26.5–27.1
AAB9274 10-01294 Ethylbenzene 0.035 0.035 mg/kg 36.6–37.4
AAB9277 10-01294 Ethylbenzene 0.027 0.027 mg/kg 48.7–49.4
AAB9269 10-01294 Xylene (Total) 0.006 U 0.006 U mg/kg 15–15.9 No change
AAB9271 10-01294 Xylene (Total) 0.006 U 0.006 U mg/kg 26.5–27.1

May 2008
F-22 E
P2008-0226
Bayo C
anyon Aggregate A
rea Investigation Report, R
evision 1
Table F-2.1-1 (continued)
Data Need Identified in Investigation Work Plan
Sample ID
Location ID Analyte Re
valid
ated
Re
sult
Reva
lidat
ed
Repo
rting
Qu
alifie
r
Initi
al Re
sult
Initi
al Re
porti
ng
Quali
fier
Units
Dept
h (ft
bgs
)
Comment AAB9272 10-01294 Xylene (Total) 0.016 0.016 mg/kg 26.5–27.1
AAB9274 10-01294 Xylene (Total) 0.014 0.014 mg/kg 36.6–37.4
AAB6583 10-02220 Beryllium 0.53 J 0.53 U mg/kg 14.0–14.5
AAB6584 10-02220 Beryllium 1.1 J 1.1 U mg/kg 17.0–17.5
AAB9428 10-02220 Beryllium 0.92 J 0.92 U mg/kg 18.0–18.6
AAB6600 10-02220 Beryllium 0.95 0.95 mg/kg 37.0–37.5
Lateral extent of beryllium, particularly to the northwest of borehole 10-01209 and east of borehole 10-02220
AAB6603 10-02220 Beryllium 3 J 3 mg/kg 49.4–50.0
Changes have no impact; many 2007 boreholes with valid data surround this location
AAB6583 10-02220 Strontium-90 37.2 37.2 mg/kg 14.0–14.5
AAB6584 10-02220 Strontium-90 40325.8 40325.8 mg/kg 17.0–17.5
AAB9428 10-02220 Strontium-90 18654 18654 mg/kg 18.0–18.6
Confirmation of the highest strontium-90 concentrations at borehole 10-02220
AAB6600 10-02220 Strontium-90 0.315 U 0.315 U mg/kg 37.0–37.5
No change
Lateral extent of naphthalene detected at boreholes 10-01201 and 10-02221
AAB8642 10-02221 Naphthalene 0.4 U 0.4 U mg/kg 14.2–15.0 No change
Consolidated Unit 10-002(a)-99 (Outside Central Area)
AAB3062 10-01228 Beryllium 0.26 J 0.26 U mg/kg 3.5–4.2
AAB3073 10-01228 Beryllium 2.3 2.3 mg/kg 21.4–21.8
AAB3069 10-01228 Beryllium 2.5 J 2.5 mg/kg 32.1–32.5
AAB3072 10-01228 Beryllium 0.35 J 0.35 U mg/kg 49.0–49.8
AAB3074 10-01232 Beryllium 0.25 J 0.25 U mg/kg 4.1–4.6
AAB3080 10-01232 Beryllium 2.2 2.2 mg/kg 21.5–21.9
AAB3085 10-01232 Beryllium 0.63 J 0.63 U mg/kg 41.8–42.3
Lateral extent of beryllium north, west, and south of boreholes 10-01228 and 10-01232
AAB3086 10-01232 Beryllium 0.58 J 0.58 U mg/kg 49.4–50.0
Changes have no impact on lateral extent; beryllium is below BV or DL in surrounding 2007 boreholes

EP
2008-0226 F-23
May 2008
Bayo C
anyon Aggregate A
rea Investigation Report, R
evision 1
Table F-2.1-1 (continued)
Data Need Identified in Investigation Work Plan
Sample ID
Location ID Analyte Re
valid
ated
Re
sult
Reva
lidat
ed
Repo
rting
Qu
alifie
r
Initi
al Re
sult
Initi
al Re
porti
ng
Quali
fier
Units
Dept
h (ft
bgs
)
Comment AAB3033 10-01242 Chromium 3.8 3.8 J mg/kg 30.3–30.9
AAB3019 10-01242 Chromium 2.8 2.8 J mg/kg 4.1–4.7
Lateral extent of chromium, copper, lead, and mercury north of borehole 10-01242
AAB3030 10-01242 Chromium 1.5 J 1.5 U mg/kg 46.5–47.3
AAB3032 10-01242 Chromium 20.6 20.6 J mg/kg 6.2–6.8
Changes have no impact on lateral extent; chromium is below BV or DL in surrounding 2007 boreholes
AAB3033 10-01242 Copper 9.1 9.1 mg/kg 30.3–30.9
AAB3019 10-01242 Copper 2.8 J 2.8 U mg/kg 4.1–4.7
AAB3030 10-01242 Copper 1.5 J 1.5 U mg/kg 46.5–47.3
AAB3032 10-01242 Copper 14.7 14.7 mg/kg 6.2–6.8
Changes have no impact on lateral extent; copper bounded in surrounding 2007 boreholes
AAB3033 10-01242 Lead 28.6 28.6 mg/kg 30.3–30.9
AAB3019 10-01242 Lead 12.1 12.1 mg/kg 4.1–4.7
AAB3030 10-01242 Lead 3.7 3.7 mg/kg 46.5–47.3
AAB3032 10-01242 Lead 52.6 52.6 mg/kg 6.2–6.8
Changes have no impact on lateral extent; lead is below BV or DL in surrounding 2007 boreholes
AAB3033 10-01242 Mercury REJECTED 0.06 U mg/kg 30.3–30.9
AAB3019 10-01242 Mercury REJECTED 0.1 U mg/kg 4.1–4.7
AAB3030 10-01242 Mercury REJECTED 0.06 U mg/kg 46.5–47.3
AAB3032 10-01242 Mercury REJECTED 0.28 mg/kg 6.2–6.8
Changes have no impact on lateral extent; mercury is below BV or DL in surrounding 2007 boreholes
AAB3018 10-01244 Beryllium 0.4 J 0.4 U mg/kg 12.5–13.1
AAB3017 10-01244 Beryllium 2.8 2.8 mg/kg 32.0–32.5
AAB3004 10-01244 Beryllium 0.63 J 0.63 U mg/kg 4.3–4.9
AAB3016 10-01244 Beryllium 0.6 J 0.6 U mg/kg 49.1–49.8
Changes have no impact on lateral extent; beryllium is below BV or DL in surrounding 2007 boreholes
AAB3018 10-01244 Cadmium 0.52 U 0.52 U mg/kg 12.5–13.1
AAB3017 10-01244 Cadmium 1.2 U 1.2 mg/kg 32.0–32.5
AAB3004 10-01244 Cadmium 0.4 U 0.4 U mg/kg 4.3–4.9
Lateral extent of beryllium and cadmium northwest of borehole 10-01244 and northeast of borehole 10-01266
AAB3016 10-01244 Cadmium 1 U 1 U mg/kg 49.1–49.8
Changes have no impact on lateral extent; cadmium is below BV or DL in surrounding 2007 boreholes

May 2008
F-24 E
P2008-0226
Bayo C
anyon Aggregate A
rea Investigation Report, R
evision 1
Table F-2.1-1 (continued)
Data Need Identified in Investigation Work Plan
Sample ID
Location ID Analyte Re
valid
ated
Re
sult
Reva
lidat
ed
Repo
rting
Qu
alifie
r
Initi
al Re
sult
Initi
al Re
porti
ng
Quali
fier
Units
Dept
h (ft
bgs
)
Comment AAB6264 10-01251 Beryllium 1.4 1.4 J mg/kg 28.9–29.5
AAB6258 10-01251 Beryllium 0.46 J 0.46 U mg/kg 3.1–3.8
AAB6268 10-01251 Beryllium 2.4 2.4 J mg/kg 44.0–44.6
Lateral extent of beryllium north of borehole 10-01251 and west of 10-01254
AAB6270 10-01251 Beryllium 2.5 2.5 J mg/kg 49.4–50.0
Changes have no impact; many 2007 boreholes with valid data surround this location
AAB6264 10-01251 Bis(2-ethylhexyl)phthalate 0.38 U 0.38 U mg/kg 28.9–29.5
AAB6258 10-01251 Bis(2-ethylhexyl)phthalate 0.35 U 0.35 U mg/kg 3.1–3.8
AAB6268 10-01251 Bis(2-ethylhexyl)phthalate 0.41 U 0.41 U mg/kg 44.0–44.6
Vertical extent of bis(2-ethylhexy)phthalate at borehole 10-01251
AAB6270 10-01251 Bis(2-ethylhexyl)phthalate 30 30 mg/kg 49.4–50.0
No change
AAB6251 10-01253 Cadmium 0.61 U 0.61 U mg/kg 26.5–27.1
AAB6244 10-01253 Cadmium 0.48 U 0.48 U mg/kg 3.5–4.1
AAB6257 10-01253 Cadmium 2.3 U 2.3 mg/kg 37.5–38.1
Lateral extent of cadmium south of borehole 10-01253
AAB6256 10-01253 Cadmium 0.55 U 0.55 U mg/kg 49.4–50.0
Change has no impact
AAB6281 10-01254 Beryllium 2 2 J mg/kg 28.4–29.3
AAB6271 10-01254 Beryllium 0.91 J 0.91 U mg/kg 3.1–4.3
AAB6289 10-01254 Beryllium 1.7 1.7 J mg/kg 33.0–33.6
Lateral extent of beryllium north of borehole 10-01251 and west of 10-01254
AAB6288 10-01254 Beryllium 0.98 J 0.98 U mg/kg 49.4–50.0
Changes have no impact; many 2007 boreholes with valid data surround this location
AAB6551 10-01257 Strontium-90 -0.21 U -0.21 U pCi/g 20.0–20.8
AAB6546 10-01257 Strontium-90 0.33 U 0.33 U pCi/g 28.4–29.1
AAB6537 10-01257 Strontium-90 340.02 340.02 pCi/g 3.6–4.2
Lateral extent of strontium-90 north of borehole 10-01257
AAB6550 10-01257 Strontium-90 0.13 U 0.13 U pCi/g 48.5–49.4
No change
AAB6525 10-01259 Antimony 10.1 U 10.1 U mg/kg 15.2–16.0
AAB6512 10-01259 Antimony REJECTED 9.6 U mg/kg 2.8–3.7
AAB6520 10-01259 Antimony 9.7 U 9.7 U mg/kg 28.5–29.2
Lateral extent of antimony north and south of borehole 10-01259 and south of 10-01262
AAB6524 10-01259 Antimony 14.9 14.9 mg/kg 48.6–49.5
Changes have no impact on lateral extent; antimony is below BV or DL in surrounding 2007 boreholes
EP
2008-0226 F-25
May 2008
Bayo C
anyon Aggregate A
rea Investigation Report, R
evision 1
Table F-2.1-1 (continued)
Data Need Identified in Investigation Work Plan
Sample ID
Location ID Analyte Re
valid
ated
Re
sult
Reva
lidat
ed
Repo
rting
Qu
alifie
r
Initi
al Re
sult
Initi
al Re
porti
ng
Quali
fier
Units
Dept
h (ft
bgs
)
Comment AAB8679 10-01262 Antimony 18.8 18.8 mg/kg 15.0–15.8
AAB8668 10-01262 Antimony 12.2 J 12.2 U mg/kg 2.7–3.3
AAB8674 10-01262 Antimony 11.3 U 11.3 U mg/kg 29.5–29.8
Lateral extent of antimony north and south of borehole 10-01259 and south of 10-01262
AAB8678 10-01262 Antimony 11.5 U 11.5 U mg/kg 47.3–48.3
Changes have no impact on lateral extent; antimony is below BV or DL in surrounding 2007 boreholes
AAB2962 10-01266 Beryllium 0.87 J 0.87 U mg/kg 16.2–16.8
AAB2949 10-01266 Beryllium 0.84 J 0.84 U mg/kg 3.0–3.5
AAB2958 10-01266 Beryllium 0.33 J 0.33 U mg/kg 40.2–40.8
AAB2959 10-01266 Beryllium 0.36 J 0.36 U mg/kg 49.3–50.0
Changes have no impact; beryllium values are below BV
AAB2962 10-01266 Cadmium 0.52 U 0.52 U mg/kg 16.2–16.8
AAB2949 10-01266 Cadmium 0.51 U 0.51 U mg/kg 3.0–3.5
AAB2958 10-01266 Cadmium 0.55 U 0.55 U mg/kg 40.2–40.8
Lateral extent of beryllium and cadmium northwest of borehole 10-01244 and northeast of borehole 10-01266
AAB2959 10-01266 Cadmium 0.6 U 0.6 U mg/kg 49.3–50.0
No change
AAB2916 10-01269 Arsenic 1.4 J- 1.4 U mg/kg 14.0–14.5
AAB2917 10-01269 Arsenic 2.2 J- 2.2 U mg/kg 26.5–27.0
AAB2906 10-01269 Arsenic 0.44 UJ 0.44 U mg/kg 3.5–4.0
Lateral extent of arsenic north and east of borehole 10-01269
AAB2915 10-01269 Arsenic 0.53 UJ 0.53 U mg/kg 47.5–48.0
Changes have no impact on lateral extent; arsenic is below BV or DL in surrounding 2007 boreholes
AAB2928 10-01271 Di-n-butylphthalate 1 J 1 mg/kg 21.8–22.3
AAB2920 10-01271 Di-n-butylphthalate 0.73 J 0.73 mg/kg 3.5–4.0
AAB2934 10-01271 Di-n-butylphthalate 0.26 J 0.5 U mg/kg 38.3–39.0
Lateral extent of di-n-butylphthalate south of borehole 10-01271
AAB2933 10-01271 Di-n-butylphthalate 0.24 J 0.39 U mg/kg 48.0–48.6
Changes have no impact on lateral extent; di-n-butylphthalate is not detected in 2007 boreholes
AAB9227 10-01289 Strontium-90 REJECTED 158 pCi/g 11.4–12.1
AAB9231 10-01289 Strontium-90 REJECTED 0.0454 U pCi/g 28.9–29.3
AAB9224 10-01289 Strontium-90 0.342 U 0.342 U pCi/g 3.3–4.1
Lateral extent of strontium-90 north and south of borehole 10-01289
AAB9234 10-01289 Strontium-90 REJECTED 0.754 pCi/g 48.5–49.4
Changes have no impact on lateral extent; strontium-90 is below MDAc in surrounding 2007 boreholes

May 2008
F-26 E
P2008-0226
Bayo C
anyon Aggregate A
rea Investigation Report, R
evision 1
Table F-2.1-1 (continued)
Data Need Identified in Investigation Work Plan
Sample ID
Location ID Analyte Re
valid
ated
Re
sult
Reva
lidat
ed
Repo
rting
Qu
alifie
r
Initi
al Re
sult
Initi
al Re
porti
ng
Quali
fier
Units
Dept
h (ft
bgs
)
Comment AAB9247 10-01293 Copper 9 9 mg/kg 10.0–10.8
AAB9235 10-01293 Copper 15.5 15.5 mg/kg 2.5–3.9
AAB9242 10-01293 Copper 2.7 J 2.7 U mg/kg 28.7–29.4
Lateral extent of copper south of borehole 10-01293
AAB9246 10-01293 Copper 1.9 J 1.9 U mg/kg 48.6–49.6
Changes have no impact on lateral extent; copper is below BV or DL in surrounding 2007 boreholes
AAB9247 10-01293 Strontium-90 3.39 J- 3.39 pCi/g 10.0–10.8
AAB9235 10-01293 Strontium-90 -0.706 U 0.706 U pCi/g 2.5–3.9
AAB9242 10-01293 Strontium-90 0.191 U 0.191 U pCi/g 28.7–29.4
Lateral extent of strontium-90 south of borehole 10-01293
AAB9246 10-01293 Strontium-90 3.19 J- 3.19 pCi/g 48.6–49.6
Changes have no impact on lateral extent; strontium-90 is below MDA in surrounding 2007 boreholes
SWMU 10-004(a)
AAB9455 10-01273 Mercury REJECTED 0.72 mg/kg 2.5–3.3
AAB9461 10-01273 Mercury 0.52 J+ 0.52 mg/kg 27.5–28.3
AAB9464 10-01273 Mercury 0.69 J+ 0.69 mg/kg 36.0–36.8
Lateral extent of mercury north of borehole 10-01273 and east of 10-01274
AAB9465 10-01273 Mercury 0.55 J+ 0.55 mg/kg 49.2–50.0
Changes have no impact
AAB9480 10-01274 Bis(2-ethylhexyl)phthalate REJECTED 0.35 U mg/kg 18.5–20
AAB9481 10-01274 Bis(2-ethylhexyl)phthalate REJECTED 1.1 mg/kg 18.5–20
AAB9477 10-01274 Bis(2-ethylhexyl)phthalate REJECTED 0.34 U mg/kg 2.5–3.4
Lateral extent of bis(2-ethylhexyl)phthalate east of borehole 10-01274 and south of borehole 10-01275
AAB9484 10-01274 Bis(2-ethylhexyl)phthalate REJECTED 0.36 U mg/kg 27.5–28.3
Changes have no impact on lateral extent; bis(2-ethylhexyl)phthalate is not detected in surrounding 2007 boreholes
Lateral extent of mercury north of borehole 10-01273 and east of 10-01274
AAB9484 10-01274 Mercury 0.1 U 0.1 UJ mg/kg 27.5–28.3 Change has no impact
AAB9469 10-01275 Bis(2-ethylhexyl)phthalate REJECTED 0.35 U mg/kg 14.2–15
AAB9474 10-01275 Bis(2-ethylhexyl)phthalate REJECTED 0.35 U mg/kg 34.2–35
AAB9476 10-01275 Bis(2-ethylhexyl)phthalate REJECTED 0.44 U mg/kg 49.2–50
Lateral extent of bis(2-ethylhexyl)phthalate east of borehole 10-01274 and south of borehole 10-01275
AAB9466 10-01275 Bis(2-ethylhexyl)phthalate REJECTED 0.54 mg/kg 5–5.8
Changes have no impact on lateral extent; bis(2-ethylhexyl)phthalate is not detected in surrounding 2007 boreholes

EP
2008-0226 F-27
May 2008
Bayo C
anyon Aggregate A
rea Investigation Report, R
evision 1
Table F-2.1-1 (continued)
Data Need Identified in Investigation Work Plan
Sample ID
Location ID Analyte Re
valid
ated
Re
sult
Reva
lidat
ed
Repo
rting
Qu
alifie
r
Initi
al Re
sult
Initi
al Re
porti
ng
Quali
fier
Units
Dept
h (ft
bgs
)
Comment AAB9498 10-01277 Beryllium 0.15 U 0.15 U mg/kg 2.5–3.5
AAB9506 10-01277 Beryllium 0.19 U 0.19 U mg/kg 22.5–23.3
AAB9509 10-01277 Beryllium 0.82 U 0.82 U mg/kg 38.0–39.0
Vertical extent of beryllium at borehole 10-01277
AAB9511 10-01277 Beryllium 4.6 4.6 mg/kg 61.5–62.5
No change
AAB9498 10-01277 Lead 2.7 J 2.7 J mg/kg 2.5–3.5
AAB9506 10-01277 Lead 3.7 J 3.7 J mg/kg 22.5–23.3
AAB9509 10-01277 Lead 7.8 J 7.8 J mg/kg 38.0–39.0
Vertical extent of lead at borehole 10-01277
AAB9511 10-01277 Lead 27.5 J 27.5 J mg/kg 61.5–62.5
No change
AAB9498 10-01277 Zinc 21.3 J+ 21.3 J mg/kg 2.5–3.5
AAB9506 10-01277 Zinc 16.1 J+ 16.1 J mg/kg 22.5–23.3
AAB9509 10-01277 Zinc 26.5 J+ 26.5 J mg/kg 38.0–39.0
Vertical extent of zinc at borehole 10-01277
AAB9511 10-01277 Zinc 68.2 J+ 68.2 J mg/kg 61.5–62.5
Changes have no impact
AAB9517 10-01278 Cadmium REJECTED 1.2 mg/kg 19.2–20
AAB9512 10-01278 Cadmium REJECTED 1.1 mg/kg 2.5–3.7
AAB9520 10-01278 Cadmium REJECTED 0.86 U mg/kg 33–33.7
AAB9523 10-01278 Cadmium REJECTED 0.95 U mg/kg 49–50
AAB9527 10-01279 Cadmium 0.79 U 0.79 U mg/kg 14.0–15.0
AAB9524 10-01279 Cadmium 0.76 U 0.76 U mg/kg 3.0–4.0
AAB9533 10-01279 Cadmium 1 J 1 U mg/kg 38.5–39.4
Lateral extent of cadmium west of boreholes 10-01278 and 10-01279
AAB9535 10-01279 Cadmium 1 U 1 U mg/kg 49.0–50.0
Changes have no impact on lateral extent; cadmium is below BV or DL in all but one surrounding 2007 boreholes
a BV = Background value. b DL = Detection limit. c MDA = Minimum detectable activity.

Bayo Canyon Aggregate Area Investigation Report, Revision 1
May 2008 F-28 EP2008-0226
Table F-3.0-1 Analytical Methods for Inorganic, Organic, and
Radionuclide Analyses for Bayo Canyon Aggregate Area Samples
Analytical Method Analytical Description Analytical Suite EPA 900 Gas proportional counting (GPC) Gross alpha/-beta
EPA 901.1 Gamma spectroscopy Cesium-134, cesium-137, cobalt-60, europium-152, ruthenium-106, sodium-22
EPA 905 GPC Strontium-90
EPA SW-846: 6010/6010B Inductively coupled plasma emission spectroscopy—atomic emission spectroscopy
Aluminum, antimony, arsenic, barium, beryllium ,boron, calcium, cadmium, cobalt, chromium, copper, iron, lead, lithium, magnesium, manganese, mercury, nickel, potassium, selenium, silicon, silver, sodium, thallium, titanium, uranium, vanadium, and zinc (TAL metals)
EPA SW-846:6020 Inductively coupled plasma mass spectrometry
Aluminum, antimony, arsenic, barium, beryllium, boron, calcium, cadmium, cobalt, chromium, copper, iron, lead, magnesium, manganese, nickel, potassium, selenium, silicon, silver, sodium, thallium, titanium, vanadium, and zinc (TAL metals)
EPA SW-846:6850 Liquid chromatography–mass spectrometry/mass spectrometry
Perchlorate
EPA SW-846:7040 Graphite furnace atomic absorption (GFAA)
Antimony
EPA SW-846:7060 GFAA Arsenic
EPA SW-846:7420 Colorimetric method Lead
EPA SW-846:7470A Cold vapor atomic absorption (CVAA)
Mercury
EPA SW-846:7471 CVAA Mercury
EPA SW-846:7471A CVAA Mercury
EPA SW-846:7740 GFAA Selenium
EPA SW-846:7840 GFAA Thallium
EPA SW-846: 8260 and 8260B Gas chromatography-mass spectrometry (GC/MS)
VOCs
EPA SW-846: 8270 and 8270C GC/MS SVOCs
EPA SW-846: 8321A and 8330 High performance liquid chromatography
HE
EPA SW-846:9010 and 9012A Automated colorimetric/off-line distillation
Total cyanide
Generic: gamma spectroscopy Gamma spectroscopy Americium-241, cesium-134, cesium-137, cobalt-60, europium-152, ruthenium-106, sodium-22, strontium-90, uranium-235
Generic: KPA Kinetic phosphorescence Uranium
HASL Method 300 Chemical separation alpha spectrometry
Isotopic uranium, isotopic plutonium, americium-241