Embed Size (px)
Citation preview

8/7/2019 Appendix V. Population Biology: Red Knot Final Presentation
http://slidepdf.com/reader/full/appendix-v-population-biology-red-knot-final-presentation 1/37
Marie Cook

8/7/2019 Appendix V. Population Biology: Red Knot Final Presentation
http://slidepdf.com/reader/full/appendix-v-population-biology-red-knot-final-presentation 2/37
Taxonomy
Kingdom: Animalia Phylum: Vertebrata
Class: Aves
Order: Scolopacidae Family: Charadriiformes
Genus: Calidris
Species: canutus Subspecies: islandica , rufa , roselaari,
rogersi, piersmai, and canutus

8/7/2019 Appendix V. Population Biology: Red Knot Final Presentation
http://slidepdf.com/reader/full/appendix-v-population-biology-red-knot-final-presentation 3/37
Genus Calidris
Commonly referred to as “waders” or “peeps” Small to medium-sized shorebirds with long wings and relatively short bills
Found locally in large mixed flocks alongcoastal estuaries, feeding via plucking, probing,and plowing
Arctic breeders that undergo long-hopmigrations
Members include Sandpipers, Dunlins, andStints
8/7/2019 Appendix V. Population Biology: Red Knot Final Presentation
http://slidepdf.com/reader/full/appendix-v-population-biology-red-knot-final-presentation 4/37
Calidris canutus: Brief Description Largest member of Calidris with stocky body Comparatively short bill, short legs About the size of an
American Robin Dull grey non-breeding
and bright red breeding
plumages Breed monogamously by
season in high arcticclimates and winter intropical or subtropicalclimates
Make one of the longestannual migrations,utilizing stopovers between jumps
Six subspecies recognized, varying geographically, and morphologically in terms of plumage, and wing and bill lengths.
Global population ≈ 1,050,000 birds

8/7/2019 Appendix V. Population Biology: Red Knot Final Presentation
http://slidepdf.com/reader/full/appendix-v-population-biology-red-knot-final-presentation 5/37
Calidris canutus Subspecies

8/7/2019 Appendix V. Population Biology: Red Knot Final Presentation
http://slidepdf.com/reader/full/appendix-v-population-biology-red-knot-final-presentation 6/37
Subspecies (cont’d)
North American subspecies C. c. rufa shows
lowest estimated population size.

8/7/2019 Appendix V. Population Biology: Red Knot Final Presentation
http://slidepdf.com/reader/full/appendix-v-population-biology-red-knot-final-presentation 7/37
Differences Among Subspecies Divergence
Last common ancestor can be traced to about 20,000 years before present.
This was about the time of the end of the last Ice Age. As ice retreated, populations dispersed throughout new
suitable habitats.
North American subspecies, rufa and roselaari diverged
about 1,200 years ago. Differences in Morphology
Wing and bill length
Brightness and patterns of plumage

8/7/2019 Appendix V. Population Biology: Red Knot Final Presentation
http://slidepdf.com/reader/full/appendix-v-population-biology-red-knot-final-presentation 8/37
Migration Strategy Fly thousands of miles without rest = long hop
migrant
Travel in species-specific f locks due to differences inspeed, altitude, and flock configuration preferences
among shorebirds Fly in wind tunnels to decrease energy costs of flight.
Decrease in digestive organ size for increased space forfat reserves
Increase flight muscle mass to endure long-distancemigration
Departure times, ranges, routes, and stopovers vary among subspecies
Non-breeding juveniles may not migrate to Arctic.

8/7/2019 Appendix V. Population Biology: Red Knot Final Presentation
http://slidepdf.com/reader/full/appendix-v-population-biology-red-knot-final-presentation 9/37
Metabolism During Migration
Products of lipid and protein metabolism are associated withflight. Highest in birds just arriving at
stopover Intermediate in refueling birds Lowest in inactive birds
Energy required during long-distancemigratory flight is largely acquired fromfat.
Supplemented by protein metabolism
Found to be mostly proportional tointensity of activity Provides compounds for citric acid cycle Explains why so many birds arrive at stopovers with largely
decreased flight muscles Organ reduction serves as evidence for protein use.

8/7/2019 Appendix V. Population Biology: Red Knot Final Presentation
http://slidepdf.com/reader/full/appendix-v-population-biology-red-knot-final-presentation 10/37
Tissue and Organ Plasticity Brain seems to be only homeostatic organ Large changes seen mainly in digestive organs
Negative relationship suggested between fat storage andreduction of size in kidneys, liver, and intestine
Organs aren’t used during migration Lessens maintenance cost
Lowers basal metabolic rate
Releases protein to be metabolized
Allows protection from breakdown of more crucial organs
Gizzard sizes are also reduced. HSC eggs are easily digested, allowing maintenance of
reduced gizzard during refueling.
Lean muscle mass increases while staging

8/7/2019 Appendix V. Population Biology: Red Knot Final Presentation
http://slidepdf.com/reader/full/appendix-v-population-biology-red-knot-final-presentation 11/37
Reasons for Northward Migration Reduced Competition and Predation
The harsh environment of the high arcticis conducive to less organisms, includingparasites.
Cryptic plumage and widely dispersed
large nest territories make knots harderfor predators to find.
Increased Resources During the short arctic summer, the sun
shines all or most of the day long,
creating a superabundance of plants andinsects. This nutrition is crucial for courtship,
reproduction, and nest success. Knots time their migration on the
availability of resources.

8/7/2019 Appendix V. Population Biology: Red Knot Final Presentation
http://slidepdf.com/reader/full/appendix-v-population-biology-red-knot-final-presentation 12/37
Predation at High Latitudes Nest predation negatively
proportional to latitude
Reduced predationcompensates for risks that
increase with latitude: Migration
High mortality
Poor weather conditions
At right, percent decrease of predation on artificial nests with latitude (McKinnon2010).

8/7/2019 Appendix V. Population Biology: Red Knot Final Presentation
http://slidepdf.com/reader/full/appendix-v-population-biology-red-knot-final-presentation 13/37
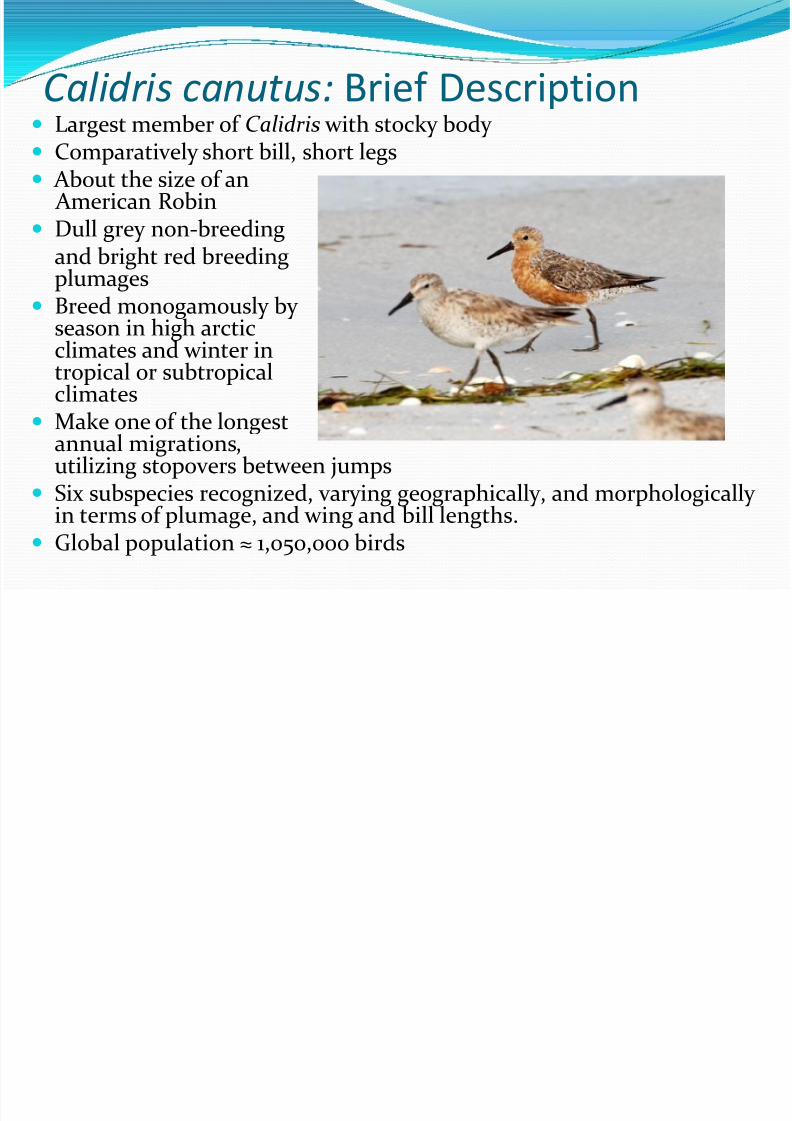
C. c. rufa Population decline
1980s = 100,000-150,000 knots
2006 = 17,200 knots
Four wintering ranges Mainly Florida, but also Georgia, and
South Carolina
Texas
Northern Brazil
Tierra del Fuego (TDF) Staging sites
Northward
Argentina
Venezuela
Delaware Bay
Southward James and Hudson Bays
Massachusetts, Connecticut, Rhode Island
Brazil
Breeding range
Central Canadian Arctic from
Southampton Island to Victoria Island
8/7/2019 Appendix V. Population Biology: Red Knot Final Presentation
http://slidepdf.com/reader/full/appendix-v-population-biology-red-knot-final-presentation 14/37
Distribution of C. c. rufa

8/7/2019 Appendix V. Population Biology: Red Knot Final Presentation
http://slidepdf.com/reader/full/appendix-v-population-biology-red-knot-final-presentation 15/37
Breeding Range Arrive in Arctic tundra in June to claim nesting
sites, depart in mid-July to early August Live territorially on slopes and cliffs that are within
easy access to wetlands Territory area 1.5 km2
Show high site fidelity Thrive on grasses and
their seeds until insectsemerge upon snowmelt
Predators include ArcticFox, Snowy Owls, and a
variety of Jaegers, whichprey upon eggs and chicks.
Nest success ≈ 75% (conservative)
8/7/2019 Appendix V. Population Biology: Red Knot Final Presentation
http://slidepdf.com/reader/full/appendix-v-population-biology-red-knot-final-presentation 16/37
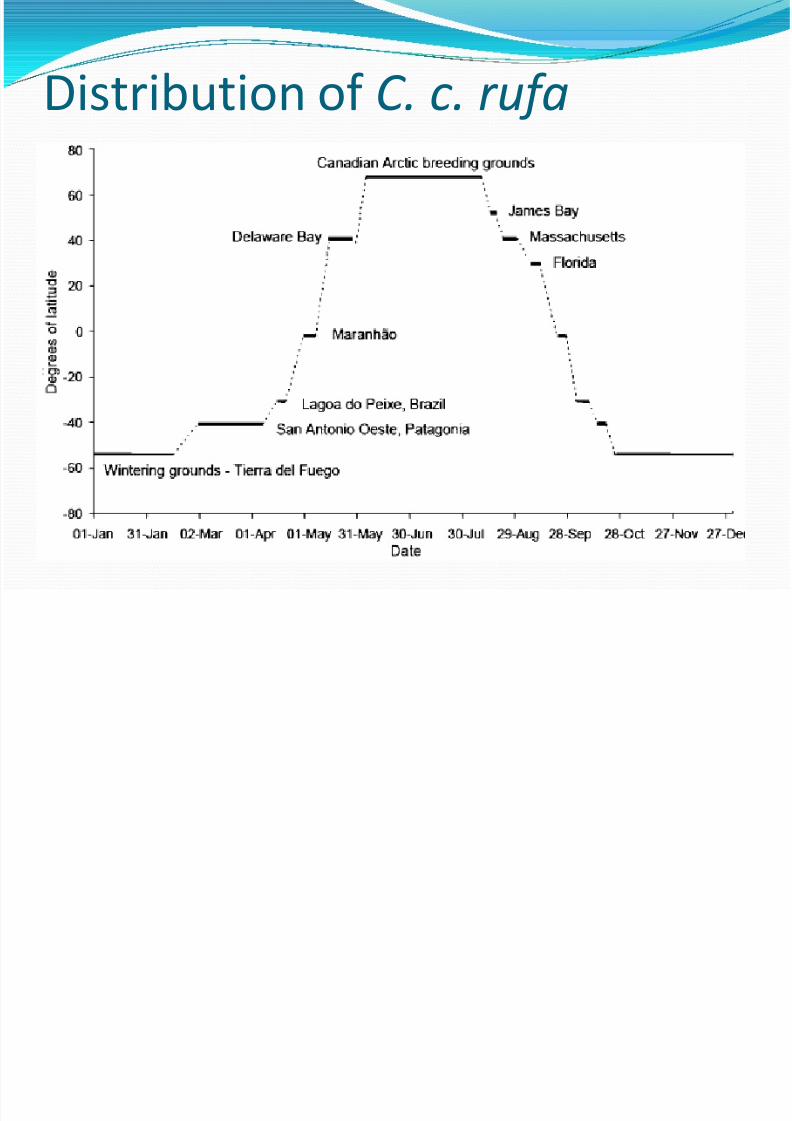
Reproduction
Reach sexual maturity aroundage 2 Males usually arrive first to claim
nesting territory. Males build up to 5 scrapes out of
vegetation
Males perform displays includingsong f lights during courtship.
Female is fertilized via cloacal kiss
from male. One brood laid per year Clutch size = 3 or 4 eggs Incubation by males and females for
around 22 days; females first to leave Chicks born precocial; fledge after 18
days

8/7/2019 Appendix V. Population Biology: Red Knot Final Presentation
http://slidepdf.com/reader/full/appendix-v-population-biology-red-knot-final-presentation 17/37
Limiting Factors of Recruitment Density-dependent:
Food, foraging success
Suitable nest sites
Predation
At right, % juveniles vs.index of winteringpopulation numbers A = before 1969
B = 1969-1995
(Boyd & Piersma 2001) Density-independent:
Weather conditions inbreeding grounds
Stochastic events

8/7/2019 Appendix V. Population Biology: Red Knot Final Presentation
http://slidepdf.com/reader/full/appendix-v-population-biology-red-knot-final-presentation 18/37
Predation of Chicks Largely by Arctic fox
Affected by predatory/prey cycles of Arctic fox and
lemmings Lemmings on 3-4 year cycle
When lemming population islow, chicks are alternate prey.
Predation of lemmings releasespressure on knot population.
Eggs and chicks predated increasepredator population.
8/7/2019 Appendix V. Population Biology: Red Knot Final Presentation
http://slidepdf.com/reader/full/appendix-v-population-biology-red-knot-final-presentation 19/37
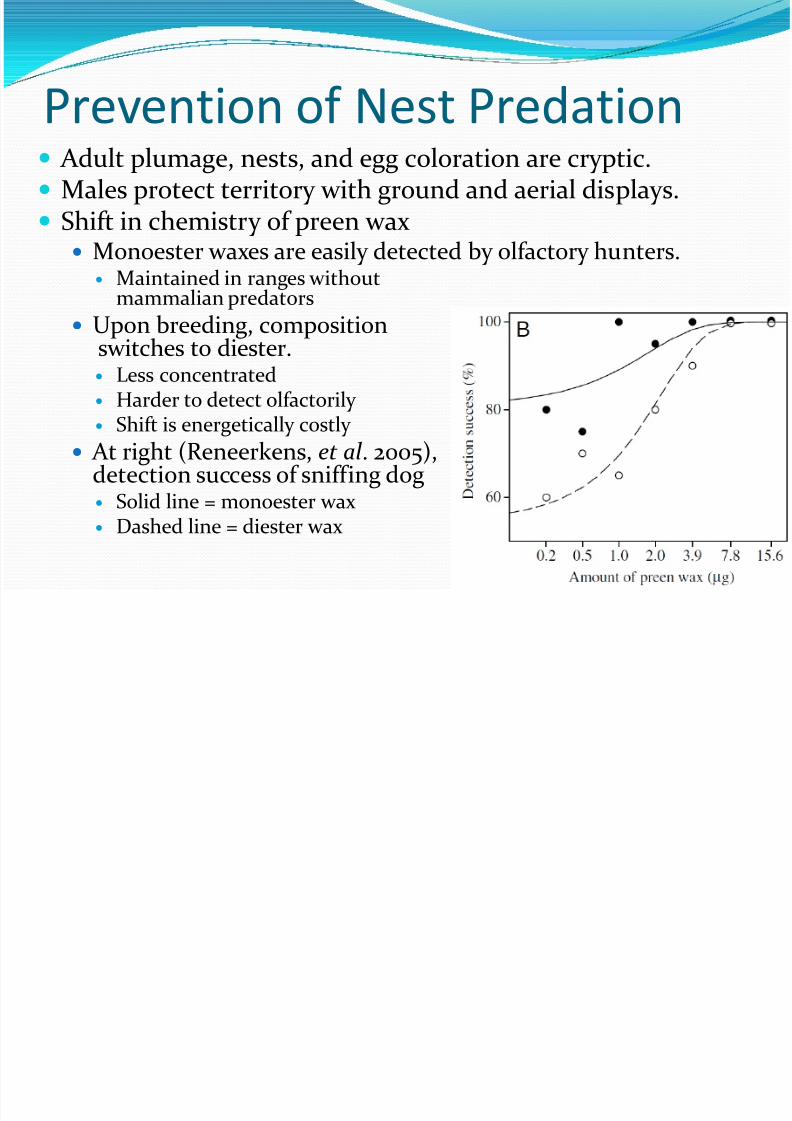
Prevention of Nest Predation Adult plumage, nests, and egg coloration are cryptic. Males protect territory with ground and aerial displays. Shift in chemistry of preen wax
Monoester waxes are easily detected by olfactory hunters. Maintained in ranges withoutmammalian predators
Upon breeding, compositionswitches to diester. Less concentrated Harder to detect olfactorily Shift is energetically costly
At right (Reneerkens, et al . 2005),detection success of sniffing dog Solid line = monoester wax Dashed line = diester wax
8/7/2019 Appendix V. Population Biology: Red Knot Final Presentation
http://slidepdf.com/reader/full/appendix-v-population-biology-red-knot-final-presentation 20/37
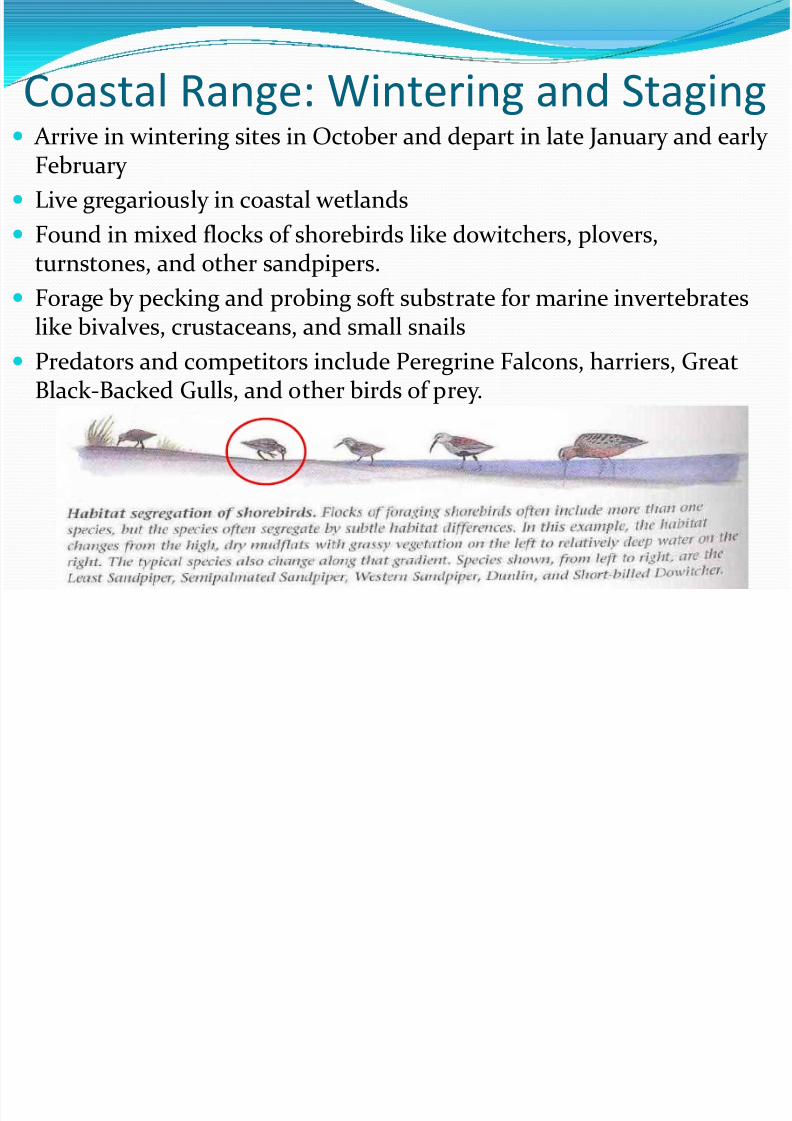
Coastal Range: Wintering and Staging
Arrive in wintering sites in October and depart in late January and early February
Live gregariously in coastal wetlands
Found in mixed flocks of shorebirds like dowitchers, plovers,turnstones, and other sandpipers.
Forage by pecking and probing soft substrate for marine invertebrateslike bivalves, crustaceans, and small snails
Predators and competitors include Peregrine Falcons, harriers, GreatBlack-Backed Gulls, and other birds of prey.

8/7/2019 Appendix V. Population Biology: Red Knot Final Presentation
http://slidepdf.com/reader/full/appendix-v-population-biology-red-knot-final-presentation 21/37
Foraging Probe upper 3cm of moist
sandy substrate
Herbst corpuscles Pressure sensory organs in
bill Allow detection of buried
prey and stones
Uses water molecules in
pores of sand to sensechanges in pressure aroundobject
Electron microscope imagesat right; bottom image x100

8/7/2019 Appendix V. Population Biology: Red Knot Final Presentation
http://slidepdf.com/reader/full/appendix-v-population-biology-red-knot-final-presentation 22/37
Foraging (Cont’d) Efficiency affected by: Tides – foraging area only
available at low tide Prey density – positive
relationship Predation – negative
relationship Disturbance – presence of
humans, dogs, gulls, etc. Ideal
Timed with prey availability Increased energy storage
Non-free
Travel from foraging to roostingsites is energetically costly Seem to choose foraging sites
based on closeness to saferoosting sites
At left, observations match
most closely to predicted modelfor ideal, non-free foragers

8/7/2019 Appendix V. Population Biology: Red Knot Final Presentation
http://slidepdf.com/reader/full/appendix-v-population-biology-red-knot-final-presentation 23/37
Delaware Bay Stopover
Second largest stopover in the world, utilized by 425,000 to1,000,000 migratory shorebirds
Last stopover before over 9,000mile migration to reachbreeding grounds
Knots begin to arrive in early May and depart for breedinggrounds in late May and early June.
Shorebirds depend on horseshoe
crab eggs to refuel. Delaware Bay is a prime spawning
area for Horseshoe Crabs. Knots need to about double body
mass from 90-120g – 180-220g toensure survival and breeding success.
Refueling success depends on arrivaltime and prey availability.

8/7/2019 Appendix V. Population Biology: Red Knot Final Presentation
http://slidepdf.com/reader/full/appendix-v-population-biology-red-knot-final-presentation 24/37
Harvesting increased in the 1990s by almost 10 times Eel and conch bait LAL medical testing to detect bacterial endotoxins Responsible for 90% decrease in egg availability
From 1992 to 1997, the reported harvest of crabs increased by 20
times from about 100,000 to more than 2 million. By 2004, harvest still exceeded production. Recovery will be slow since HSCs don’t mature until about age 10. Importance of eggs to knots
Easily digested when digestive
organs are reduced High in fat and protein Stopover at Delaware Bay is
synchronized to HSC spawning. Overharvesting has significantly
contributed to C. c. rufa decline.
Horseshoe Crabs (Limulus polyphemus)

8/7/2019 Appendix V. Population Biology: Red Knot Final Presentation
http://slidepdf.com/reader/full/appendix-v-population-biology-red-knot-final-presentation 25/37
Importance of Delaware Bay Utilized by 80% of North American Knot population
No suitable stopovers between DE Bay and breedinggrounds in Arctic
When eggs were overabundant, late-arriving knots couldstill reach a healthy departure weight.
In recent years, shortage of eggs slows weight gain in latebirds, reducing survival.
Declines in wintering numbers from staging populationssuggest high mortality during migration due to poorbody condition upon departure from DE Bay.
Poor health in part limits reproductive success.
8/7/2019 Appendix V. Population Biology: Red Knot Final Presentation
http://slidepdf.com/reader/full/appendix-v-population-biology-red-knot-final-presentation 26/37
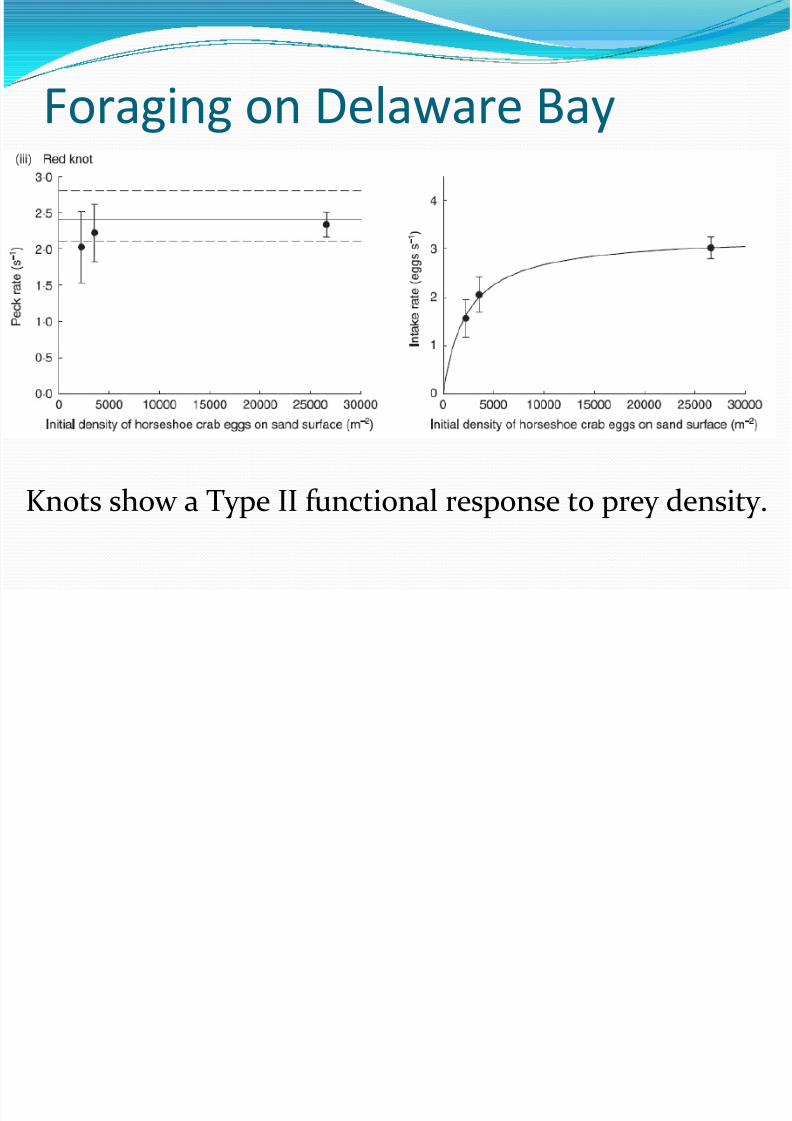
Foraging on Delaware Bay
Knots show a Type II functional response to prey density.

8/7/2019 Appendix V. Population Biology: Red Knot Final Presentation
http://slidepdf.com/reader/full/appendix-v-population-biology-red-knot-final-presentation 27/37
Cross-species Comparison
Semipalmated Sandpipers,Sanderlings (left)
Use Delaware Bay as a crucialstopover
Show population declines
Implications of importance of Delaware Bay to shorebirds whostage there during migration.
Hudsonian Godwits (right) Share wintering grounds with
C. c. rufa in TDF
Do not stop at Delaware Bay
Show stable populationdemographics

8/7/2019 Appendix V. Population Biology: Red Knot Final Presentation
http://slidepdf.com/reader/full/appendix-v-population-biology-red-knot-final-presentation 28/37
Life Table: 1995-1998 survival rates
(Baker, et al., 2004)

8/7/2019 Appendix V. Population Biology: Red Knot Final Presentation
http://slidepdf.com/reader/full/appendix-v-population-biology-red-knot-final-presentation 29/37
Life Table: 5% decline in 1995-1998 rates
(Baker, et al., 2004)

8/7/2019 Appendix V. Population Biology: Red Knot Final Presentation
http://slidepdf.com/reader/full/appendix-v-population-biology-red-knot-final-presentation 30/37
Life Table: 1998-2001 survival rates
(Baker, et al., 2004)

8/7/2019 Appendix V. Population Biology: Red Knot Final Presentation
http://slidepdf.com/reader/full/appendix-v-population-biology-red-knot-final-presentation 31/37
Demography Models
Adult Survival = 85% Juvenile Survival = ½ adultNest success = 75% (3/4 eggs)
Best Case: 1995-1998
Compromised Adult Survival
Adult Survival = 80% Juvenile Survival = ½ adultNest success = 75% (3/4 eggs)
(Baker, et al., 2004)

8/7/2019 Appendix V. Population Biology: Red Knot Final Presentation
http://slidepdf.com/reader/full/appendix-v-population-biology-red-knot-final-presentation 32/37
Demography Models (cont’d)
Pending Extinction: 1999-2000
Adult Survival = 60% Juvenile Survival = ½ adultNest success = 75% (3/4 eggs)
(Baker, et al., 2004)

8/7/2019 Appendix V. Population Biology: Red Knot Final Presentation
http://slidepdf.com/reader/full/appendix-v-population-biology-red-knot-final-presentation 33/37
Comparison of Demography Models (Baker et al. 2004)
95% ConfidenceInterval
95% ConfidenceInterval
Annual adultsurvival = 85%
Annual adultsurvival = 56%

8/7/2019 Appendix V. Population Biology: Red Knot Final Presentation
http://slidepdf.com/reader/full/appendix-v-population-biology-red-knot-final-presentation 34/37
Threats to Red Knot Population Before 1955, hunting accounted for majority of predation. Habitat Destruction
Dredging Coastal Development Oil pollution
Shortage of Resources Harvesting of HSCs in DE Bay
Harsh arctic winters yield food late Disturbance
Research efforts Beach use Dogs
Climate Change
Short term: advantageous because of lengthened Arctic summer Long term: disadvantageous because of decrease in tundra habitat needed for
breeding. Small population size
Since large numbers, and sometimes entire populations, winter and stage together,they are especially vulnerable to stochastic events.
Decreased genetic variability can lead to the accumulation of detrimental traits.
8/7/2019 Appendix V. Population Biology: Red Knot Final Presentation
http://slidepdf.com/reader/full/appendix-v-population-biology-red-knot-final-presentation 35/37
Conservation Status
NJ – Listed as threatened in 1999 US – Not listed Canada – Listed as endangered in 2007
Western Hemisphere Shorebird Reserve Network Protect habitat in Argentina, Brazil,
Peru, Suriname, Mexico, U.S., and Canada. Manage about 81 million hectares of habitat
Management of HSCs in DE Bay 2008 harvest moratoriums
Female crabs in Delaware All crabs in New Jersey All harvesting is prohibited during spawning (May 1-June 7)
Shorebird Steward Program Volunteers educate the public about how their use of the beach could disturb
important shorebird habitats. Beginning in 2003, beaches in DE Bay used by migratory bird populations have
been closed to the pubic during staging. Since C. c. rufa is threatened in NJ, conservation officers can cite beachgoers for
disturbance and trespassing.

8/7/2019 Appendix V. Population Biology: Red Knot Final Presentation
http://slidepdf.com/reader/full/appendix-v-population-biology-red-knot-final-presentation 36/37
Literature Cited
2006. Magnificent Shorebird Migration. Prince William Network.http://migration.pwnet.org/pdf/Magnificent_Shorebird_Migration.pdf
Baker, Allen J, et al. 2004. Rapid population decline in red knots: fitness consequences of decreased refuelingrates and late arrival in Delaware Bay. Royal Society. 271, 875–882
Battley, Phil, et al. 2000. Empirical evidence for differential organ reductions during trans-oceanic bird flight.The Royal Society. 276: 191-195.
Boyd, Hugh, Theunis Piersma. 2001. Changing balance between survival and recruitment explains population
trends in red knots Calidris canutus islandica wintering in Britain, 1969-1995. ARDEA. 89: 301-317. Brown, S., et al. 2000. National Shorebird Conservation Assessment: Shorebird Conservation Status,
Conservation Units, Population Estimates, Population Targets, and Species Prioritization. Manomet Center forConservation Sciences. http://www.Manomet.org/USSCP/files.htm
Buehler Deborah M., A. J. Baker. 2005. Population Divergence Times and Historical Demography in Red Knotsand Dunlins. Condor . 107: 497-513.
Cornell Lab of Ornithology. 2009. All About Birds. Cornell University.
http://www.allaboutbirds.org/guide/Red_Knot/lifehistory Gilg, Olivier, Nigel Yoccoz. 2010. Explaining Bird Migration. Science. 327:276-8.
Gillings, S, et al . 2007. Shorebird predation of horseshoe crab eggs in Delaware Bay: species contrasts andavailability constraints. Journal of Animal Ecology. 76: 503–514.
Greenberg, Russel. 2005. Birds of Two Worlds. Johns Hopkins University Press. Baltimore. 263-5.
Harrington, Brian . 2001. The Birds of North America. Cornell Lab of Ornithology.http://bna.birds.cornell.edu/bna/species/563/articles/introduction
Hernandez, Daniel. Ornithology Lecture. Spring 2010.

8/7/2019 Appendix V. Population Biology: Red Knot Final Presentation
http://slidepdf.com/reader/full/appendix-v-population-biology-red-knot-final-presentation 37/37
Literature Cited Landys, Meta, et al . 2005. Metabolic profile of long-distance flight and stopover in a shorebird. The
Royal Society. 272: 295-301. McKinnon, L., et al . 2010. Lower Predation Rates for Migratory Birds at High Latitudes. Science.
327:326-7.
Morrison, Guy, R.K. Ross, L. Niles. 2004. Declines in Wintering Populations of Red Knots in SouthernSouth America. Condor . 106: 60-70.
Niles, Lawrence et al. 2008. Status of the Red Knot (Calidris Canutus) in the Western Hemisphere.
Studies in Avain Biology. 36:1-185. Niles, Lawrence et al. 2009. Effects of Horseshoe Crab Harvest in Delaware Bay on Red Knots: Are
Harvest Restrictions Working? Bioscience. 59: 153-164.
Piersma, Theunis et al. 1998. A new pressure sensory mechanism for prey detection in birds: the useof principles of seabed dynamics? The Royal Society. 265: 1377-1383.
Reneerkens, Jeroen, et al. 2005. Switch to diester preen waxes may reduce avian nest predation by mammalian predators using olfactory cues. The Journal of Experimental Biology. 208: 4199-4202.
Sibley, David. 2001. Bird Life and Behavior. Andrew Stewart. New York. 15-50, 273-287.
Shorebird Phenomenon. Manomet Center for Conservation Sciences.http://www.shorebirdworld.org/template.php?g=5&c=4
Van Gils, Jan et al. 2005. Reinterpretation of gizzard sizes of red knots world-wide emphasizesoverriding importance of prey quality at migratory stopover sites. The Royal Society. 272: 2609-2618.
Van Gils, Jan et al. 2006. Foraging in a tidally structured environment by red knots (Calidris canutus):
Id l b t t f E l 8 8