Embed Size (px)
Citation preview

Appendix
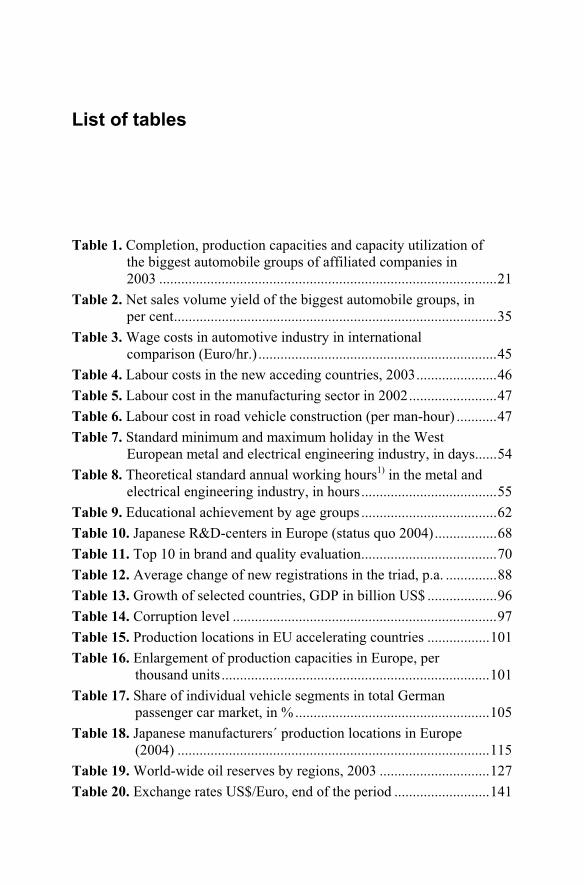
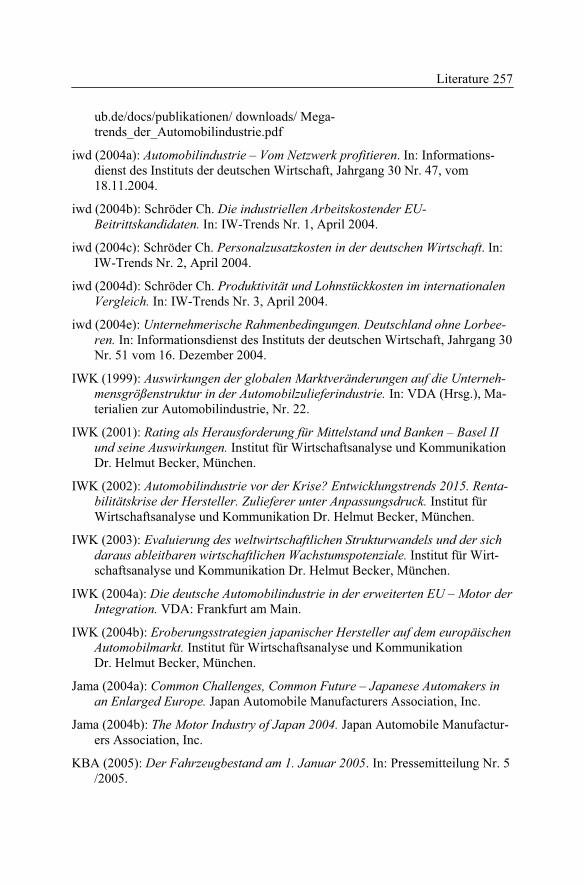
Table 27. Top-100 automobile suppliers
Rang UnternehmenAutomotive Um-sätze
2003/2004 in
Millionen USD1Rang Unternehmen
1 Robert Bosch 31.400 51 Pioneer2 Delphi 28.700 52 Alps Automotive
3 Denso 23.172 53 Koyo4 Johnson Controls 20 500 54 Saint-Gobain5 Bridgestone 18 280 55 Tokai Rika6 Michelin 17 347 56 Toyoda Gosei7 Visteon 17 097 57 Karmann
8 Lear 15 746 58 Cummins9 Magna 15 345 59 Dura Automotive Systems
10 Aisin Seiki 14 501 60 Pilkington11 Goodyear 13 362 61 Brose12 Continental 12.426 62 Getrag
13 ThyssenKrupp 12 359 63 Rheinmetall14 Siemens (VDO + Osram) 11.815 64 AsahiGlass15 Faurecia 11.540 65 NTN16 TRW Automotive 11.308 66 Showa17 Valeo 10 527 67 Tl Automotive18 ZF Group 8 346 68 Hayes Lemmerz
19 Dana 7.918 69 Hutchinson20 ArvinMeritor 7 788 70 Freudenberg21 Yazaki 6 375 71 Key Automotive22 DuPont 6 087 72 Draxlmaier23 Federal Mogul 5 546 73 SKF Automotive
24 Autoliv 5 301 74 Illinois Tool Works25 Matsushita Electric 5 016 75 PiasticOmmum (Inergy)26 Motorola 4 870 76 Stanley Electric Group27 Calsonic Kansei 4.771 77 Webasto28 GKN 4 706 78 3M Automotive
29 BASF 4 564 79 Degussa30 Schaeffler 4 389 80 Metaldyne31 PPG Industries 4.290 81 Eberspächer32 Collins&i Aikman 3 984 82 NewVenture Gear33 Mitsubishi Electric 3 774 83 Tachi-S34 Hitachi 3 773 84 Rieter
35 Tenneco Automotive 3 766 85 Flex-N-Gate36 Mahle 3 701 86 Tomkins37 American Axle & Manufacturing 3 683 87 Alcan38 Magneti Marelli 3.655 88 NSK39 Honeywelf 3 650 89 Edscha
40 Hella 3 525 90 Textron41 Cooper Tire & Rubber 3 514 91 Kostal42 Pirelli 3 386 92 Dow43 Takata 3 241 93 Trelleborg44 Behr 3.153 94 Schefenacker
45 Benteler 3.111 95 Mann + Hummel46 BorgWarner 3 069 96 Meridian Automotive47 Eaton 2.962 97 Oxford Automotive48 Bayer 2 820 98 Mitsui Mining & Smelting (Gecom)49 Tower Automotive 2 816 99 F.Tech50 Alcoa 2 800 100 Teksid Aluminum
sources: enterprise statements, business reports, AP official searches,1 turnover for business year 2003 or 2003/2004, automobile production (February 2005).
Appendix 240
Appendix 2
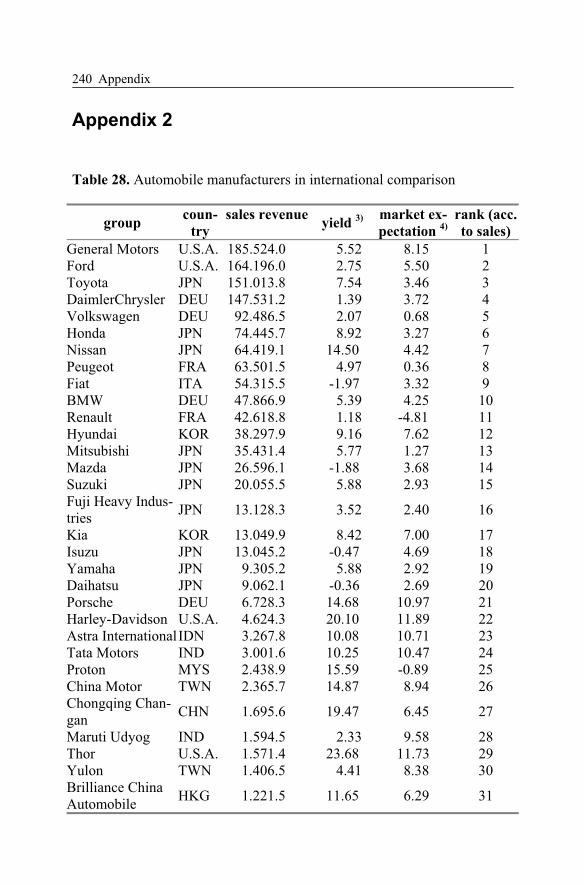
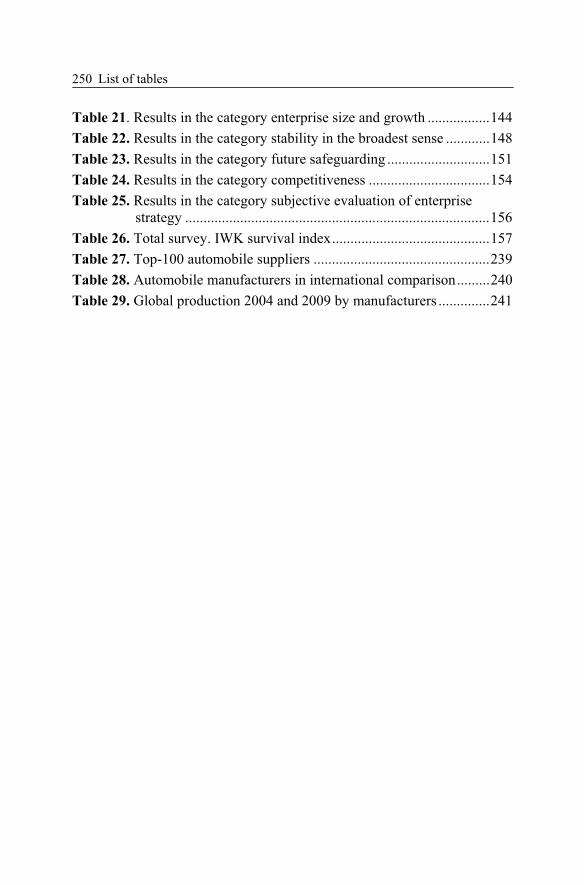
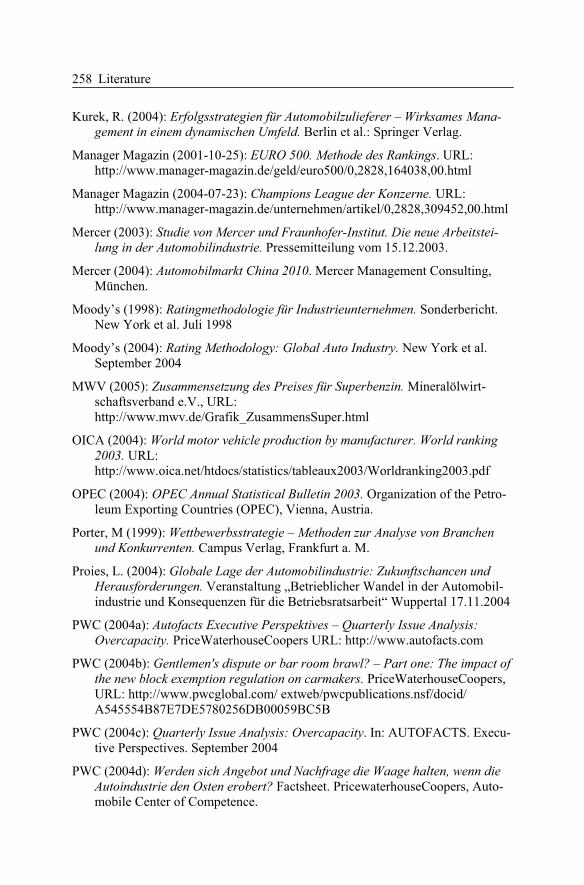
Table 28. Automobile manufacturers in international comparison
groupcoun-
try
sales revenue yield
3) market ex-
pectation4)
rank (acc.
to sales)
General Motors U.S.A. 185.524.0 5.52 8.15 1 Ford U.S.A. 164.196.0 2.75 5.50 2 Toyota JPN 151.013.8 7.54 3.46 3 DaimlerChrysler DEU 147.531.2 1.39 3.72 4 Volkswagen DEU 92.486.5 2.07 0.68 5 Honda JPN 74.445.7 8.92 3.27 6 Nissan JPN 64.419.1 14.50 4.42 7 Peugeot FRA 63.501.5 4.97 0.36 8 Fiat ITA 54.315.5 -1.97 3.32 9 BMW DEU 47.866.9 5.39 4.25 10 Renault FRA 42.618.8 1.18 -4.81 11 Hyundai KOR 38.297.9 9.16 7.62 12 Mitsubishi JPN 35.431.4 5.77 1.27 13 Mazda JPN 26.596.1 -1.88 3.68 14 Suzuki JPN 20.055.5 5.88 2.93 15 Fuji Heavy Indus-tries
JPN 13.128.3 3.52 2.40 16
Kia KOR 13.049.9 8.42 7.00 17 Isuzu JPN 13.045.2 -0.47 4.69 18 Yamaha JPN 9.305.2 5.88 2.92 19 Daihatsu JPN 9.062.1 -0.36 2.69 20 Porsche DEU 6.728.3 14.68 10.97 21 Harley-Davidson U.S.A. 4.624.3 20.10 11.89 22 Astra International IDN 3.267.8 10.08 10.71 23 Tata Motors IND 3.001.6 10.25 10.47 24 Proton MYS 2.438.9 15.59 -0.89 25 China Motor TWN 2.365.7 14.87 8.94 26 Chongqing Chan-gan
CHN 1.695.6 19.47 6.45 27
Maruti Udyog IND 1.594.5 2.33 9.58 28 Thor U.S.A. 1.571.4 23.68 11.73 29 Yulon TWN 1.406.5 4.41 8.38 30 Brilliance China Automobile
HKG 1.221.5 11.65 6.29 31
Appendix 241
Hero Honda IND 1.121.5 35.72 18.37 32 Mahindra & Mahindra
IND 1.104.9 5.73 9.98 33
Faw Car CHN 1.082.0 7.25 8.40 34 Bajaj Auto IND 922.9 9.18 8.87 35 Winnebago Indus-tries
U.S.A. 845.2 13.85 12.23 36
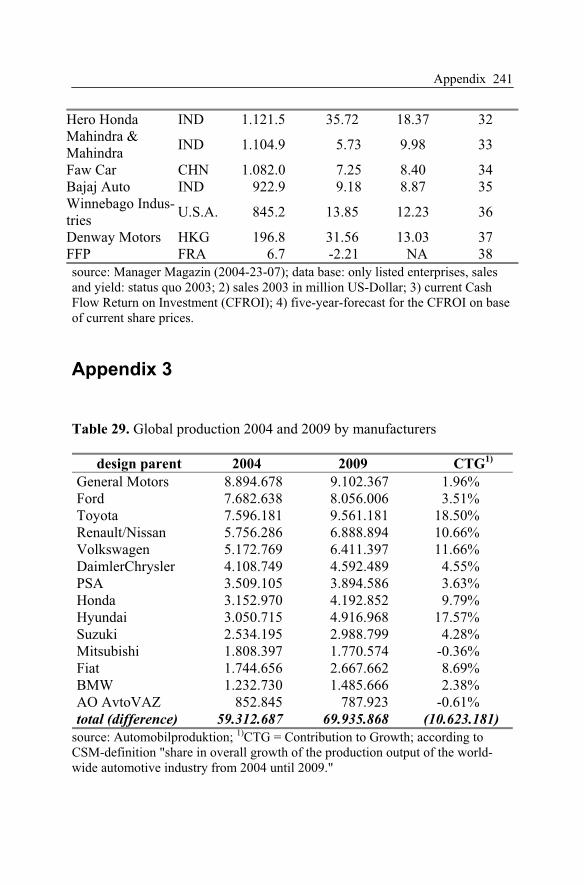
Denway Motors HKG 196.8 31.56 13.03 37 FFP FRA 6.7 -2.21 NA 38 source: Manager Magazin (2004-23-07); data base: only listed enterprises, sales and yield: status quo 2003; 2) sales 2003 in million US-Dollar; 3) current Cash Flow Return on Investment (CFROI); 4) five-year-forecast for the CFROI on base of current share prices.
Appendix 3
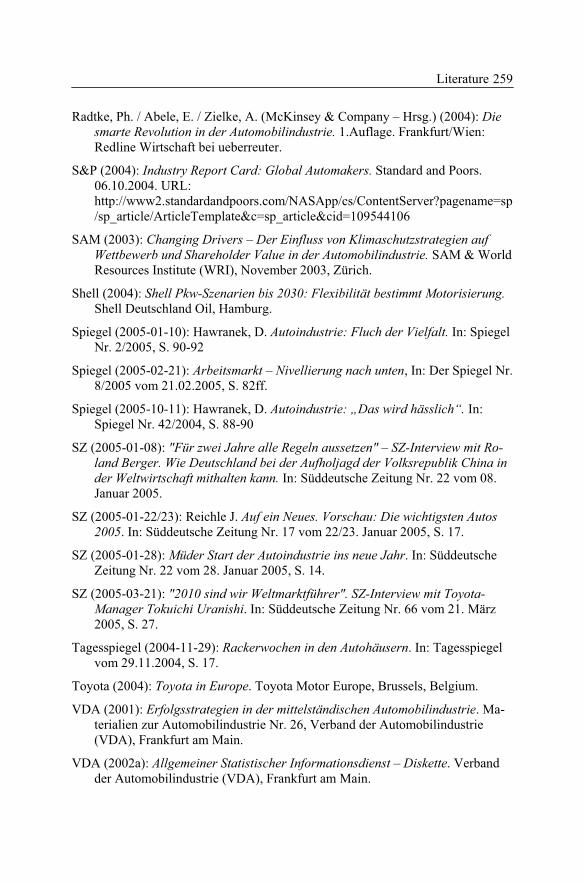
Table 29. Global production 2004 and 2009 by manufacturers
design parent 2004 2009 CTG1)
General Motors 8.894.678 9.102.367 1.96% Ford 7.682.638 8.056.006 3.51% Toyota 7.596.181 9.561.181 18.50% Renault/Nissan 5.756.286 6.888.894 10.66% Volkswagen 5.172.769 6.411.397 11.66% DaimlerChrysler 4.108.749 4.592.489 4.55% PSA 3.509.105 3.894.586 3.63% Honda 3.152.970 4.192.852 9.79% Hyundai 3.050.715 4.916.968 17.57% Suzuki 2.534.195 2.988.799 4.28% Mitsubishi 1.808.397 1.770.574 -0.36% Fiat 1.744.656 2.667.662 8.69% BMW 1.232.730 1.485.666 2.38% AO AvtoVAZ 852.845 787.923 -0.61% total (difference) 59.312.687 69.935.868 (10.623.181)
source: Automobilproduktion; 1)CTG = Contribution to Growth; according to CSM-definition "share in overall growth of the production output of the world-wide automotive industry from 2004 until 2009."
Appendix 242
Appendix 4a
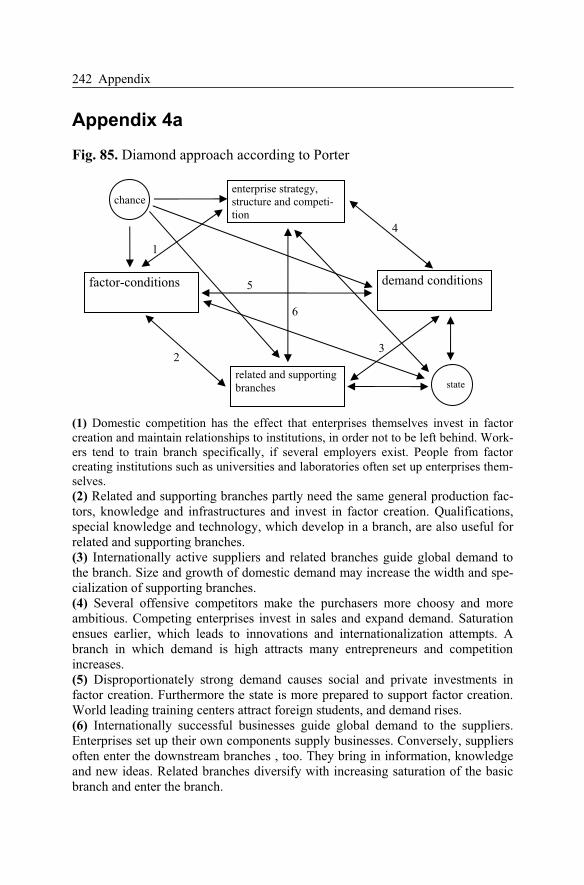
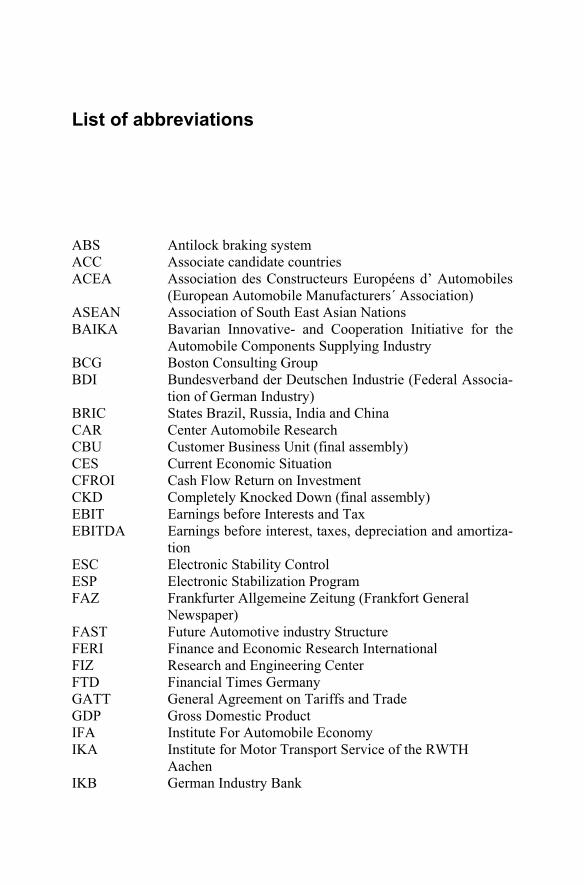
Fig. 85. Diamond approach according to Porter
(1) Domestic competition has the effect that enterprises themselves invest in factor creation and maintain relationships to institutions, in order not to be left behind. Work-ers tend to train branch specifically, if several employers exist. People from factor creating institutions such as universities and laboratories often set up enterprises them-selves.(2) Related and supporting branches partly need the same general production fac-tors, knowledge and infrastructures and invest in factor creation. Qualifications, special knowledge and technology, which develop in a branch, are also useful for related and supporting branches. (3) Internationally active suppliers and related branches guide global demand to the branch. Size and growth of domestic demand may increase the width and spe-cialization of supporting branches. (4) Several offensive competitors make the purchasers more choosy and more ambitious. Competing enterprises invest in sales and expand demand. Saturation ensues earlier, which leads to innovations and internationalization attempts. A branch in which demand is high attracts many entrepreneurs and competition increases. (5) Disproportionately strong demand causes social and private investments in factor creation. Furthermore the state is more prepared to support factor creation. World leading training centers attract foreign students, and demand rises. (6) Internationally successful businesses guide global demand to the suppliers. Enterprises set up their own components supply businesses. Conversely, suppliers often enter the downstream branches , too. They bring in information, knowledge and new ideas. Related branches diversify with increasing saturation of the basic branch and enter the branch.
enterprise strategy, structure and competi-tion
factor-conditions demand conditions
related and supporting branches
chance
state
1
23
4
5
6
Appendix 243
Appendix 4b
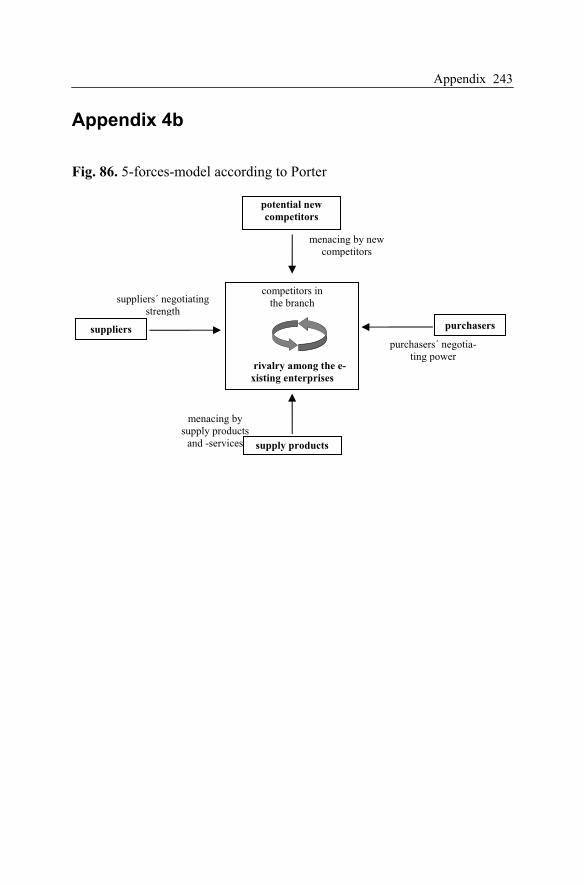
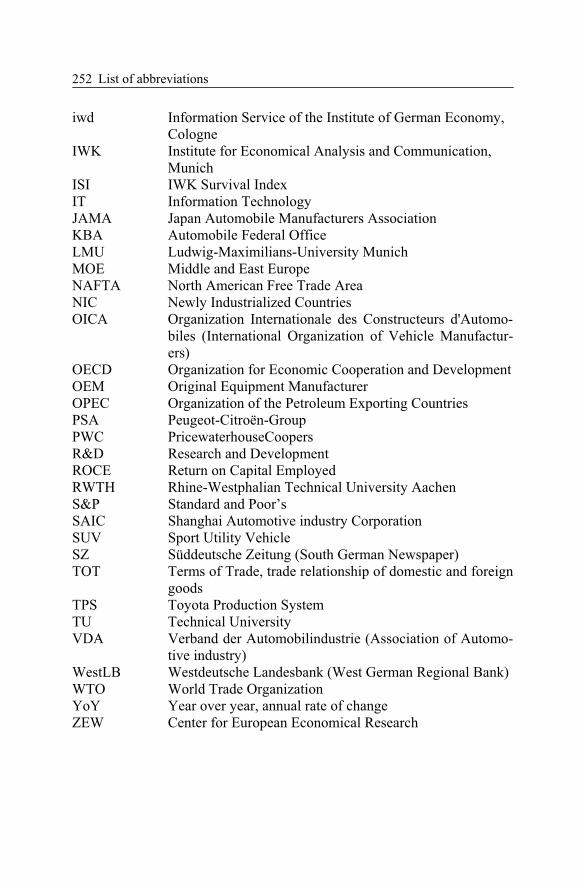
Fig. 86. 5-forces-model according to Porter
menacing by supply products
and -services
potential new
competitors
suppliers
menacing by new competitors
competitors in the branch
rivalry among the e-
xisting enterprises
purchasers
purchasers´ negotia-ting power
supply products
suppliers´ negotiating strength
List of figures
Fig. 1. Development of new PC registrations in the triad..........................12
Fig. 2. Development of new PC registrations in Germany........................13
Fig. 3. German car exports ........................................................................14
Fig. 4. PC-new registrations in West Europe ............................................16
Fig. 5. Development of market shares in West Europe .............................17
Fig. 6. Market shares of Japanese OEMs in Western Europe....................18
Fig. 7. Market shares of Japanese OEMs in Western Europe....................19
Fig. 8. "Unplanned" overcapacities 2009 (schematical description) .........20
Fig. 9. Entire production and capacities until 2011 ...................................22
Fig. 10. Development of capacity utilization in Western Europe 1997-2006 .............................................................................................24
Fig. 11. Regional Structure of Overcapacities in 2004..............................25
Fig. 12. More segments and niches ...........................................................27
Fig. 13. Net sales volume yield of the biggest automobile groups, in per cent.........................................................................................35
Fig. 14. Trend developments of net sales yields, in per cent .....................37
Fig. 15. Cost structure of entire added value in the automotive industry ........................................................................................42
Fig. 16. Labour costs in the West German manufacturing sector, in Euro per employee and year ........................................................44
Fig. 17. Wage costs in the automotive industry in international comparison (Euro/hr.) ..................................................................45
Fig. 18. Wage cost in industrial production in international comparison, (Euro/h.) ..................................................................48
Fig. 19. Additional staff costs in international comparison, in % of direct payment..............................................................................49
Fig. 20. Unit labour costs internationally in the year 2003, Germany = 100 ...............................................................................................52
List of figures 246
Fig. 21. Development of effective annual labour time in Germany and the U.S.A. ....................................................................................56
Fig. 22. German direct investments in East Europe ..................................57
Fig. 23. Passenger car stock per 1.000 inhabitants (2001) ........................59
Fig. 24. Production locations in East Europe 2004 ...................................60
Fig. 25. Labour cost index of the EU-entry countries relative to EU-15, 2004 .......................................................................................61
Fig. 26. Working population in the ACC-states, 2004 ..............................63
Fig. 27. Toyota passenger car production in Europe .................................71
Fig. 28. Concentration of automobile manufacturers 1970-2015..............75
Fig. 29. Introduction speed of innovations ................................................78
Fig. 30. Productivity pincer .......................................................................80
Fig. 31. Operative margin for European manufacturers´ capacity utilization 2000-2006 (forecast according to WestLB) ...............81
Fig. 32. Capacity utilization of the biggest motor vehicle groups in 2003, in per cent ..........................................................................84
Fig. 33. Sales volume and profit shares in the life cycle of an automobile ...................................................................................86
Fig. 34. Regional demand structure 2004..................................................87
Fig. 35. Growth of disposable real income................................................90
Fig. 36. Scenarios of population development ..........................................90
Fig. 37. Passenger car density by world regions .......................................91
Fig. 38. Forecast of new registrations in the triad until 2015, in mil.........92
Fig. 39. New registrations of passenger cars in Germany in accordance with inventory accession and replacement demand.........................................................................................92
Fig. 40. Contribution of the BRIC states to global growth, in % ..............94
Fig. 41. GDP forecast. Growth rates in the triad and in the BRIC countries.......................................................................................95
Fig. 42. Regional distribution of world GDP ............................................96
Fig. 43. Passenger car production in BRIC states .....................................99
Fig. 44. Regional growth of passenger car production, in mil. units.......100
Fig. 45. Production development of Asia ................................................102
Fig. 46. Models produced in China .........................................................103
Fig. 47. Passenger car demand and production capacity in China ..........104
List of figures 247
Fig. 48. Brand formative and non-brand formative modules with BMW as an example..................................................................106
Fig. 49. Development of the Mercedes-Benz model range .....................107
Fig. 50. Readiness to pay additional charge for new technologies per vehicle class (index)...................................................................110
Fig. 51. Equipment level in new passenger cars in Germany..................110
Fig. 52. Japanese production in Europe and exports to Europe...............113
Fig. 53. European parts for Japanese OEMs............................................114
Fig. 54. Downstream services, related to customer and vehicle..............121
Fig. 55. Concentration on brand and customer management ..................122
Fig. 56. Added value/added value share automobile manufacturer.........123
Fig. 57. Growth rates of oil production and reserves (1983 = 100).........128
Fig. 58. Oil price development ................................................................129
Fig. 59. Composition of the fuel price (euro super) in Germany.............130
Fig. 60. Concentration Automobile manufacturers 1960-2015 ...............136
Fig. 61. Model diagram of the calculation of the "IWK survival index".........................................................................................142
Fig. 62. Supply pyramid ..........................................................................164
Fig. 63. Amount of enterprises in automotive industry ...........................169
Fig. 64. Decreasing advance financing for R&D.....................................172
Fig. 65. Innovation strategy.....................................................................176
Fig. 66. High significance of innovations in vehicle construction ..........178
Fig. 67. Cost optimization strategy..........................................................180
Fig. 68. Sales shares with innovations and cost reduction in vehicle construction................................................................................181
Fig. 69. Effects of process innovations in vehicle construction (2002)...182
Fig. 70. Profitability limit for production shifts ......................................184
Fig. 71. Differing shifting pressure in the supply branch ........................185
Fig. 72. Content strategy..........................................................................187
Fig. 73. Volume strategy .........................................................................189
Fig. 74. Suppliers´ yields by size.............................................................191
Fig. 75. Increase of development cooperation.........................................194
Fig. 76. Propensity to invest in the automobile components supply industry 2001-2003 in relation to sales revenue ........................198
Fig. 77. Market shares of brake systems, world-wide .............................201
List of figures 248
Fig. 78. Regional distribution of market shares for brake systems .........202
Fig. 79. Attractiveness of locations .........................................................210
Fig. 80. Expectations of the automotive industry, relative to the build-up of new production capacities ................................................212
Fig. 81. Completion or crowding-out ......................................................214
Fig. 82. Future areas of competence in West Europe ..............................215
Fig. 83. Employees in the German automotive industry .........................219
Fig. 84. Evaluation of the locations Eastern Europe / China...................234
Fig. 85. Diamond approach according to Porter......................................242
Fig. 86. 5-forces-model according to Porter............................................243
List of tables
Table 1. Completion, production capacities and capacity utilization of the biggest automobile groups of affiliated companies in 2003 ............................................................................................21
Table 2. Net sales volume yield of the biggest automobile groups, in per cent........................................................................................35
Table 3. Wage costs in automotive industry in international comparison (Euro/hr.) .................................................................45
Table 4. Labour costs in the new acceding countries, 2003......................46
Table 5. Labour cost in the manufacturing sector in 2002........................47
Table 6. Labour cost in road vehicle construction (per man-hour) ...........47
Table 7. Standard minimum and maximum holiday in the West European metal and electrical engineering industry, in days......54
Table 8. Theoretical standard annual working hours1) in the metal and electrical engineering industry, in hours.....................................55
Table 9. Educational achievement by age groups .....................................62
Table 10. Japanese R&D-centers in Europe (status quo 2004).................68
Table 11. Top 10 in brand and quality evaluation.....................................70
Table 12. Average change of new registrations in the triad, p.a. ..............88
Table 13. Growth of selected countries, GDP in billion US$ ...................96
Table 14. Corruption level ........................................................................97
Table 15. Production locations in EU accelerating countries .................101
Table 16. Enlargement of production capacities in Europe, per thousand units .........................................................................101
Table 17. Share of individual vehicle segments in total German passenger car market, in %.....................................................105
Table 18. Japanese manufacturers´ production locations in Europe (2004) .....................................................................................115
Table 19. World-wide oil reserves by regions, 2003 ..............................127
Table 20. Exchange rates US$/Euro, end of the period ..........................141
List of tables 250
Table 21. Results in the category enterprise size and growth .................144
Table 22. Results in the category stability in the broadest sense ............148
Table 23. Results in the category future safeguarding ............................151
Table 24. Results in the category competitiveness .................................154
Table 25. Results in the category subjective evaluation of enterprise strategy ...................................................................................156
Table 26. Total survey. IWK survival index...........................................157
Table 27. Top-100 automobile suppliers ................................................239
Table 28. Automobile manufacturers in international comparison.........240
Table 29. Global production 2004 and 2009 by manufacturers ..............241
List of abbreviations
ABS Antilock braking system ACC Associate candidate countries ACEA Association des Constructeurs Européens d’ Automobiles
(European Automobile Manufacturers´ Association) ASEAN Association of South East Asian Nations BAIKA Bavarian Innovative- and Cooperation Initiative for the
Automobile Components Supplying Industry BCG Boston Consulting Group BDI Bundesverband der Deutschen Industrie (Federal Associa-
tion of German Industry) BRIC States Brazil, Russia, India and China CAR Center Automobile Research CBU Customer Business Unit (final assembly) CES Current Economic Situation CFROI Cash Flow Return on Investment CKD Completely Knocked Down (final assembly) EBIT Earnings before Interests and Tax EBITDA Earnings before interest, taxes, depreciation and amortiza-
tionESC Electronic Stability Control ESP Electronic Stabilization Program FAZ Frankfurter Allgemeine Zeitung (Frankfort General
Newspaper) FAST Future Automotive industry Structure FERI Finance and Economic Research International FIZ Research and Engineering Center FTD Financial Times Germany GATT General Agreement on Tariffs and Trade GDP Gross Domestic Product IFA Institute For Automobile Economy IKA Institute for Motor Transport Service of the RWTH
AachenIKB German Industry Bank
List of abbreviations 252
iwd Information Service of the Institute of German Economy, Cologne
IWK Institute for Economical Analysis and Communication, Munich
ISI IWK Survival Index IT Information Technology JAMA Japan Automobile Manufacturers Association KBA Automobile Federal Office LMU Ludwig-Maximilians-University Munich MOE Middle and East Europe NAFTA North American Free Trade Area NIC Newly Industrialized Countries OICA Organization Internationale des Constructeurs d'Automo-
biles (International Organization of Vehicle Manufactur-ers)
OECD Organization for Economic Cooperation and Development OEM Original Equipment Manufacturer OPEC Organization of the Petroleum Exporting Countries PSA Peugeot-Citroën-Group PWC PricewaterhouseCoopers R&D Research and Development ROCE Return on Capital Employed RWTH Rhine-Westphalian Technical University Aachen S&P Standard and Poor’s SAIC Shanghai Automotive industry Corporation SUV Sport Utility Vehicle SZ Süddeutsche Zeitung (South German Newspaper) TOT Terms of Trade, trade relationship of domestic and foreign
goodsTPS Toyota Production System TU Technical University VDA Verband der Automobilindustrie (Association of Automo-
tive industry) WestLB Westdeutsche Landesbank (West German Regional Bank) WTO World Trade Organization YoY Year over year, annual rate of change ZEW Center for European Economical Research
Literature
ACEA (2005): New Motor Vehicle Registrations. URL: http://www.acea.be/ASB/Download.nsf/ CategorizedView-Files?OpenForm&Language=English&cat1=6
ADAC (2004): Der ADAC-AutoMarxX im Dezember 2004 – Die Ergebnis –Übersicht. URL: http://www.adac.de/mitgliedschaft_leistungen/motorwelt/automarxx/ gtamd2004/default.asp?ComponentID=101758&SourcePageID=101788%230
ADAC (2005): ADAC-Preis „Gelber Engel“ 2005. In: ADACmotorwelt, Heft 2/05, Februar 2005, S. 12-23.
ARD (2004-10-28): Autohersteller in der Kostenfalle. URL: http://boerse.ard.de/druck.jsp?key=dokument_69384
AUDI (2004): Auto & Konjunktur. Materialien zum Vortrag des Oestricher Krei-ses vom 21 bis 22. Oktober 2004 in Budapest.
Automobil-Produktion (2004a): News – Toyota stärkt FuE in Europa. in Automo-bil-Produktion, Ausgabe 4, April 2004
Automobil-Produktion (2004b): Osteuropäisches Roulette. in Automobil-Produktion, Ausgabe 6, Juni 2004
Automobil-Produktion (2005): Im Fokus: DaimlerChrysler. In: Automobil-Produktion, Ausgabe 2, Februar 2005
Automobilwoche (2005-01-17): Große Herausforderung“ BMW-Finanzvorstand zu den diesjährigen Chancen und Risiken. In: Automobilwoche Nr. 1/2 17.01.05, S. 13.
Automobilwoche edition (2004a): Die Grenzen der Nischen – Nischen ohne Gren-zen? In: Automobilwoche edition, November 2004, S. 74.
Automobilwoche edition (2004b): Es lebe die Nische. Markt Segmentanalyse. In: Automobilwoche edition, November 2004, S. 8-10.
BAIKA (2003): Technologietrends in der Automobilindustrie und ihre Auswir-kungen auf die Zulieferindustrie. Überblickspräsentation auf Einladung der „Regionalmanagement Wirtschaftsregion Bamberg-Forchheim GmbH am 29. Oktober 2003, Schlüsselfeld.
Literature254
Bayern Innovativ (2002): Technologie-Trends in der Automobilindustrie. Bayern Innovativ Gesellschaft für Innovation und Wissenstransfer, Nürnberg.
BCG (2004): Produktionsstandort Deutschland – quo vadis? Fertigungsverlage-rungen – warum es sie gibt, wie sie sich entwickeln werden und was wir da-gegen tun können. The Boston Consulting Group, München.
Becker H. (2001): Logistik – Ein Überblick, URL: http://home.t-online.de/home/becker2/log2_1_1.htm
BMW (2002): Das Rating-Verfahren nach Basel II und seine Auswirkungen auf die Unternehmen des Automobilhandels. BMW Financial Services, München.
Borchert J. E. / Goos Ph. / Hagenhoff S. (2004): Innovationsnetzwerke als Quelle von Wettbewerbsvorteilen. In: Arbeitsbericht Nr. 11/2004, Institut für Wirt-schaftsinformatik, Georg-August-Universität Göttingen
Büschgen, H. / Everling O. (1996): Handbuch Rating. Gabler Verlag, Wiesbaden.
Cell Consulting (2004): EU-Osterweiterung bietet Potenziale für Automobilin-dustrie. In: Excellence Ausgabe II, 2004, Frankfurt am Main
DEKA-Bank (2004): Emerging Markets: Das Wachstum in den BRIC-Länder ist kein Selbstläufer. In: Konjunktur, Zinsen, Währungen, Nr. 3, September 2004, S. 8-13.
Delphi (2005): Warum deutsche Zulieferer den Zug nach Osteuropa nicht Verpas-sen sollten – und wo die Fallstricke liegen, Präsentation von Volker Barth, Vizepräsident Delphi und Präsident Delphi Europa, Deutscher Automobil In-dustrie Gipfel 2005, 14-15. März 2005, Stuttgart
DET-News (2003-09-16.): Japanese Automakers eye Europe’s young drivers. URL: http://www.detnews.com/2003/autosinsider/0309/17/autos-273010.htm
Deutsche Bank Research (2004-06-16): Automobilmarkt Osteuropa: Produktions-standort dauerhaft wichtiger als Absatzmarkt. In: EU-Monitor vom 16. Juni 2004 S. 11-20.
Deutsche Bank Research (2004-08-10): Deutschland auf dem Weg zu längeren Arbeitszeiten. In: Aktuelle Themen vom 10. August 2004.
Deutsche Bank Research (2004-09-17): Japanische Autos: nachhaltiger Auf-schwung erwartet. In: Aktuelle Themen vom 17. September 2004.
Deutsche Shell GmbH (2001): Mehr Autos – weniger Verkehr? – Szenarien es Pkw-Bestands und der Neuzulassungen in Deutschland bis zum Jahr 2020.Shell Pkw-Szenarien, Hamburg.
DIHK (2003): Produktionsverlagerung als Element der Globalisierungsstrategie von Unternehmen. Ergebnisse einer Unternehmensbefragung. Deutscher In-dustrie- und Handelskammertag (DIHK). Mai 2003
Literature 255
Dresdner Bank (2002): Rating: Ein bewährtes Verfahren gewinnt neue Bedeutung. Die Praxis der Bonitätsbeurteilung für mittlere und große Unternehmen.Frankfurt am Main.
Dudenhöffer F. / Büttner C. (2002): Automobil-Standort Deutschland. Teil 1 Em-pirische Ergebnisse. Pressekonferenz 8.10.2002, Neue Messe, Leipzig.
Dudenhöffer, F. (2002): Neue Wachstums-Branche: Die Automobil-Zulieferindustrie in: Automobile Engineering Partners, Heft 2/2002, S. 4-11.
Dudenhöffer, F. (2003): Kann Deutschland vom Zulieferer-Wachstum profitieren? In: Automobile Engineerings Partners Nr. 2/2003, S. 2-6.
DZ-Bank (2004): Neue Tarifpolitik in der Automobilindustrie – Bremse oder An-stoß für die Konjunktur? In: DZ-Bank Wirtschaftsbrief Nr. 75 vom 5.11.2004.
Eigermann, J. (2001): Quantitatives Credit-Rating unter Einbeziehung qualitativer Merkmale: Entwicklung eines Modells zur Ergänzung der Diskriminanzanaly-se durch regelbasierte Einbeziehung qualitativer Merkmale. Sternenfels: Verl. Wiss. und Praxis (= Schriftenreihe Finanzmanagement; Bd. 5).
EIRO (2000): Outsourcing und Arbeitsbeziehungen in der Automobilindustrie.European industrial relations observatory on-line. URL: www.eiro.eurofound.eu.int/2000/08/study/tn0008203s.html
Ernst&Young (2003): Finanzierungsdilemma – Automobilzulieferer: Branche erwartet weitere Fusionswelle. Ernst&Young AG, Eschborn/Frankfurt a. M.
Ernst&Young (2004a): Automobilstandort Deutschland in Gefahr? Ernst&Young AG, Eschborn/Frankfurt a. M.
Ernst&Young (2004b): Automobilzulieferer: weitere Produktionsverlagerungennach China und Osteuropa. Ernst&Young AG, Eschborn/Frankfurt a. M.
FAST-2015 (2004): „Future Automotive industry Structure (FAST) 2015 – die neue Arbeitsteilung in der Automobilindustrie“. Studie von Mercer Manage-ment Consulting und den Fraunhofer-Instituten IPA und IML. In: VDA – Ma-terialien zur Automobilindustrie Nr. 32.
FAZ (2004-08-10): Neue Runde im Rabatt-Kampf. In: Frankfurter Allgemeine Zeitung vom 10.08.2004. URL: http://www.faz.net/s/Rub EC1ACFE1EE274C81BCD3621EF555C83C/Doc~E0AF2F9C35B2B4F9DBE0D8E5C29CD7490~ATpl~Ecommon~Scontent.html
FAZ (2004-09-13): Autohersteller spüren die hohen Rohstoffpreise. In: Frankfur-ter Allgemeine Zeitung vom 13.09.2004.
FERI (2002): FERI Branchen-Rating. Branchenspezifische Kreditrisiken. In: FERI-Online, Fragen und Antworten, 9.12.2002.
Fraunhofer ISI (2004): Automobilzulieferer in der Klemme. Vom Spagat zwischen strategischer Ausrichtung und Auslandsorientierung. In: Mitteilungen aus der Produktionsinnovationserhebung, Nummer 32, März 2004.
Literature256
FTD (2004-12-02): Reinking, G. Peugeot schließt Kampfpreis für neuen Kleinwa-gen aus. In: Financial Times Deutschland vom 02.12.2004.
FTD (2004-12-05): Reinking, G. VW rückt von Hochpreisstrategie ab In: Financi-al Times Deutschland vom 05.12.2004.
FTD (2004-12-14): Ruch, M. / Reinking, G. Autokonzerne rücken enger zusam-men. In: Financial Times Deutschland vom 14.12.2004, S. 7.
FTD (2005-02-21): Fromm T. / Reinking, G. Führungskrise bedroht Fiat-Sanierung. In: Financial Times Deutschland vom 21.02.2005, S. 8.
Gesamtmetall (2004): Die deutsche Metall- und Elektro-Industrie in Zahlen ("Zahlenheft"). Gesamtverband der metallindustriellen Arbeitgeberverbände e.V. (Gesamtmetall) URL: http://www.gesamtmetall.de/Gesamtmetall/MEOnline.nsf/id/C35B6E9E29102400C1256BB3004E41B0
Handelsblatt (2004-06-29): Preisdruck zwingt Autozulieferer in engere Koopera-tionen – Rigides Kostendenken bei den Autokonzernen gefährdet die Struktur der Branche. In: Handelsblatt Nr. 123 vom 29.06.2004, S. 12.
Handelsblatt (2004-09-02): Autohersteller drosseln die Fertigung. In: Handelsblatt vom 02.09.2004, URL: http://www.handelsblatt.com/pshb/fn/relhbi/sfn/cn_artikel_drucken/strucid/PAGE_200012/pageid/PAGE_200038/docid/785564/SH/0/depot/0/index.html
Harbour consulting (2004): Manufacturing Efficiency – Why is it Important? Management briefing Traverse city, Presented by: Laurie a. Felax. August 3, 2004.
HAWK 2015 (2003): HAWK 2015 – Herausforderung Automobile Wertschöp-fungskette. Studie von McKinsey&Company. In: VDA – Materialien zur Au-tomobilindustrie Nr. 30.
Holzapfel, H. / Vahrenkamp, R. (1993): Fertigungstiefe beeinflusst Verkehr. In: Logistik Heute, Heft 12, S. 16-17.
IKB (2001): Automobilzulieferer 2000: Kräftiges Wachstum, differenzierte Er-tragsentwicklung. IKB Deutsche Industriebank, Düsseldorf.
IKB (2003a): Automobilindustrie – Neue Chancen, zunehmender Investitions- und Finanzierungsbedarf, Düsseldorf (=IKB-Report – Märkte im Fokus).
IKB (2003b): Rating für den Mittelstand. Dezember 2003, IKB Deutsche Indust-riebank, Düsseldorf (=IKB Information).
IKB (2004): Automobilzulieferer. Bericht zur Branche. Dezember 2004, IKB Deutsche Industriebank, Düsseldorf (=IKB Information).
Intra (2004): Megatrends der Automobilindustrie. Eine Zusammenfassung der wichtigsten Richtungsvorgaben des VDA-Technik Kongresses in Wolfsburg, des Automobilforums in Stuttgart und der IAA in Frankfurt. URL: www.intra-
Literature 257
ub.de/docs/publikationen/ downloads/ Mega-trends_der_Automobilindustrie.pdf
iwd (2004a): Automobilindustrie – Vom Netzwerk profitieren. In: Informations-dienst des Instituts der deutschen Wirtschaft, Jahrgang 30 Nr. 47, vom 18.11.2004.
iwd (2004b): Schröder Ch. Die industriellen Arbeitskostender EU-Beitrittskandidaten. In: IW-Trends Nr. 1, April 2004.
iwd (2004c): Schröder Ch. Personalzusatzkosten in der deutschen Wirtschaft. In: IW-Trends Nr. 2, April 2004.
iwd (2004d): Schröder Ch. Produktivität und Lohnstückkosten im internationalen Vergleich. In: IW-Trends Nr. 3, April 2004.
iwd (2004e): Unternehmerische Rahmenbedingungen. Deutschland ohne Lorbee-ren. In: Informationsdienst des Instituts der deutschen Wirtschaft, Jahrgang 30 Nr. 51 vom 16. Dezember 2004.
IWK (1999): Auswirkungen der globalen Marktveränderungen auf die Unterneh-mensgrößenstruktur in der Automobilzulieferindustrie. In: VDA (Hrsg.), Ma-terialien zur Automobilindustrie, Nr. 22.
IWK (2001): Rating als Herausforderung für Mittelstand und Banken – Basel II und seine Auswirkungen. Institut für Wirtschaftsanalyse und Kommunikation Dr. Helmut Becker, München.
IWK (2002): Automobilindustrie vor der Krise? Entwicklungstrends 2015. Renta-bilitätskrise der Hersteller. Zulieferer unter Anpassungsdruck. Institut für Wirtschaftsanalyse und Kommunikation Dr. Helmut Becker, München.
IWK (2003): Evaluierung des weltwirtschaftlichen Strukturwandels und der sich daraus ableitbaren wirtschaftlichen Wachstumspotenziale. Institut für Wirt-schaftsanalyse und Kommunikation Dr. Helmut Becker, München.
IWK (2004a): Die deutsche Automobilindustrie in der erweiterten EU – Motor der Integration. VDA: Frankfurt am Main.
IWK (2004b): Eroberungsstrategien japanischer Hersteller auf dem europäischen Automobilmarkt. Institut für Wirtschaftsanalyse und Kommunikation Dr. Helmut Becker, München.
Jama (2004a): Common Challenges, Common Future – Japanese Automakers in an Enlarged Europe. Japan Automobile Manufacturers Association, Inc.
Jama (2004b): The Motor Industry of Japan 2004. Japan Automobile Manufactur-ers Association, Inc.
KBA (2005): Der Fahrzeugbestand am 1. Januar 2005. In: Pressemitteilung Nr. 5 /2005.
Literature258
Kurek, R. (2004): Erfolgsstrategien für Automobilzulieferer – Wirksames Mana-gement in einem dynamischen Umfeld. Berlin et al.: Springer Verlag.
Manager Magazin (2001-10-25): EURO 500. Methode des Rankings. URL: http://www.manager-magazin.de/geld/euro500/0,2828,164038,00.html
Manager Magazin (2004-07-23): Champions League der Konzerne. URL: http://www.manager-magazin.de/unternehmen/artikel/0,2828,309452,00.html
Mercer (2003): Studie von Mercer und Fraunhofer-Institut. Die neue Arbeitstei-lung in der Automobilindustrie. Pressemitteilung vom 15.12.2003.
Mercer (2004): Automobilmarkt China 2010. Mercer Management Consulting, München.
Moody’s (1998): Ratingmethodologie für Industrieunternehmen. Sonderbericht. New York et al. Juli 1998
Moody’s (2004): Rating Methodology: Global Auto Industry. New York et al. September 2004
MWV (2005): Zusammensetzung des Preises für Superbenzin. Mineralölwirt-schaftsverband e.V., URL: http://www.mwv.de/Grafik_ZusammensSuper.html
OICA (2004): World motor vehicle production by manufacturer. World ranking 2003. URL:http://www.oica.net/htdocs/statistics/tableaux2003/Worldranking2003.pdf
OPEC (2004): OPEC Annual Statistical Bulletin 2003. Organization of the Petro-leum Exporting Countries (OPEC), Vienna, Austria.
Porter, M (1999): Wettbewerbsstrategie – Methoden zur Analyse von Branchen und Konkurrenten. Campus Verlag, Frankfurt a. M.
Proies, L. (2004): Globale Lage der Automobilindustrie: Zukunftschancen und Herausforderungen. Veranstaltung „Betrieblicher Wandel in der Automobil-industrie und Konsequenzen für die Betriebsratsarbeit“ Wuppertal 17.11.2004
PWC (2004a): Autofacts Executive Perspektives – Quarterly Issue Analysis: Overcapacity. PriceWaterhouseCoopers URL: http://www.autofacts.com
PWC (2004b): Gentlemen's dispute or bar room brawl? – Part one: The impact of the new block exemption regulation on carmakers. PriceWaterhouseCoopers, URL: http://www.pwcglobal.com/ extweb/pwcpublications.nsf/docid/A545554B87E7DE5780256DB00059BC5B
PWC (2004c): Quarterly Issue Analysis: Overcapacity. In: AUTOFACTS. Execu-tive Perspectives. September 2004
PWC (2004d): Werden sich Angebot und Nachfrage die Waage halten, wenn die Autoindustrie den Osten erobert? Factsheet. PricewaterhouseCoopers, Auto-mobile Center of Competence.
Literature 259
Radtke, Ph. / Abele, E. / Zielke, A. (McKinsey & Company – Hrsg.) (2004): Diesmarte Revolution in der Automobilindustrie. 1.Auflage. Frankfurt/Wien: Redline Wirtschaft bei ueberreuter.
S&P (2004): Industry Report Card: Global Automakers. Standard and Poors. 06.10.2004. URL: http://www2.standardandpoors.com/NASApp/cs/ContentServer?pagename=sp/sp_article/ArticleTemplate&c=sp_article&cid=109544106
SAM (2003): Changing Drivers – Der Einfluss von Klimaschutzstrategien auf Wettbewerb und Shareholder Value in der Automobilindustrie. SAM & World Resources Institute (WRI), November 2003, Zürich.
Shell (2004): Shell Pkw-Szenarien bis 2030: Flexibilität bestimmt Motorisierung.Shell Deutschland Oil, Hamburg.
Spiegel (2005-01-10): Hawranek, D. Autoindustrie: Fluch der Vielfalt. In: Spiegel Nr. 2/2005, S. 90-92
Spiegel (2005-02-21): Arbeitsmarkt – Nivellierung nach unten, In: Der Spiegel Nr. 8/2005 vom 21.02.2005, S. 82ff.
Spiegel (2005-10-11): Hawranek, D. Autoindustrie: „Das wird hässlich“. In: Spiegel Nr. 42/2004, S. 88-90
SZ (2005-01-08): "Für zwei Jahre alle Regeln aussetzen" – SZ-Interview mit Ro-land Berger. Wie Deutschland bei der Aufholjagd der Volksrepublik China in der Weltwirtschaft mithalten kann. In: Süddeutsche Zeitung Nr. 22 vom 08. Januar 2005.
SZ (2005-01-22/23): Reichle J. Auf ein Neues. Vorschau: Die wichtigsten Autos 2005. In: Süddeutsche Zeitung Nr. 17 vom 22/23. Januar 2005, S. 17.
SZ (2005-01-28): Müder Start der Autoindustrie ins neue Jahr. In: Süddeutsche Zeitung Nr. 22 vom 28. Januar 2005, S. 14.
SZ (2005-03-21): "2010 sind wir Weltmarktführer". SZ-Interview mit Toyota-Manager Tokuichi Uranishi. In: Süddeutsche Zeitung Nr. 66 vom 21. März 2005, S. 27.
Tagesspiegel (2004-11-29): Rackerwochen in den Autohäusern. In: Tagesspiegel vom 29.11.2004, S. 17.
Toyota (2004): Toyota in Europe. Toyota Motor Europe, Brussels, Belgium.
VDA (2001): Erfolgsstrategien in der mittelständischen Automobilindustrie. Ma-terialien zur Automobilindustrie Nr. 26, Verband der Automobilindustrie (VDA), Frankfurt am Main.
VDA (2002a): Allgemeiner Statistischer Informationsdienst – Diskette. Verband der Automobilindustrie (VDA), Frankfurt am Main.
Literature260
VDA (2002b): Auto – Jahresbericht 2002. Verband der Automobilindustrie (VDA), Frankfurt am Main.
VDA (2002c): Zukunft des Automobil-Standorts Deutschland. Materialien zur Automobilindustrie Nr. 27, Verband der Automobilindustrie (VDA), Frank-furt am Main.
VDA (2004-01-29): Das Autojahr 2003: Exportrekord sichert Wachstum – Das Autojahr 2004: Wende im deutschen Automarkt – Initiative für mehr Wert-schöpfung in Deutschland. In: VDA Pressedienst vom 29. Januar 2004. Frankfurt am Main.
VDA (2004a): Autojahresbericht 2004. Verband der Automobilindustrie (VDA), Frankfurt am Main.
VDA (2004b): Die deutsche Automobilindustrie in der erweiterten EU – Motor der Integration. Verband der Automobilindustrie (VDA), Frankfurt am Main.
VDA (2004c): Kräftiges Umsatzwachstum in der Zuliefererindustrie – Druck auf Margen bleibt hoch. In: VDA-Pressedienst vom 24.11.2004, Verband der Au-tomobilindustrie (VDA), Frankfurt am Main.
VDA (2005): Analysen zur Automobilkonjunktur 2004. VDA-Jahrespressekonferenz am 27. Januar 2005. Frankfurt am Main.
VDA (2005-01-27): 2004: Hohes Umsatzwachstum – 4.100 neue Arbeitsplätze – Plädoyer für eine “neues Geschäftsmodell Deutschland”. In: VDA Presse-dienst vom 27. Januar 2005. Frankfurt am Main.
Volkswagen (2004): Automobilindustrie. Vortrag von Herrn Dr. Uwe Elsner in der VDBE- Arbeitssitzung am 2. Dezember 2004 in Bad Homburg.
Weiss E. (2003): Branchen-Rating. Zur Erfassung branchenzpezifischer Kreditri-siken. In: RATINGaktuell, Nr. 2, S. 42-46.
WestLB (2004a): Lier H. / Westin F. AutoQ. Neither fish nor fowl. WestLB Eq-uity Markets, Düsseldorf. July 2004
WestLB (2004b): Lier H. / Westin F. Flexibility as a Competitive Edge, WestLB Equity Markets, Düsseldorf. June 2004
Wiehle U. et al. (2004): Kennzahlen für Aktionäre. Sonderauflage für die Deut-sche Post AG. Wiesbaden: comertis.
World Market Research Center (2003): Japanese Plants lead the way in WMRC European Automobile Productivity Index 2003. Press release. URL: http://www.wmrc.com/press_release/20030708-1.pdf
ZEW (2004): Innovationsreport Fahrzeugbau – Ergebnisse der deutschen Innova-tionserhebung 2003. ZEW-Branchenreport Innovationen Jahrg. 11 Nr. 11,
Zentrum für Europäische Wirtschaftsforschung GmbH (ZEW), Mannheim.
Author
Dr. Helmut Becker, Dipl. Volksw. (graduate economist) and Dipl. Kfm. (graduate in business management), has been managing the Institute for Economic Analysis and Communication (IWK), which he founded, since 1998 which is above all concerned with macroeconomic analyses and fore-casts for the preparation of strategic enterprise deci-sions as well as questions of enterprise communica-tion. A particular focus is the "old economy", espe-cially the enterprises of the automotive industry.
He acquired the necessary knowledge in the course of his long career in science and industry, first of all in the German Council ("5 Wise men") and from 1974 as head economist of the BMW Plc. During that time he held numerous posts in the German economy (BDI, VDA etc.).
With the collaboration of:
Yuriy Dutka, Dipl. Volksw. (Graduate economist), bornin 1977 in the Ukraine, studied economics at the Ternopil Academy of Economy (Ukraine) and at the University of Passau. Since March 2000 he has been employed by the IWK, first of all as scientific assistant, and in the mean-time as Senior Analyst and IT-specialist. His major re-sponsibilities are in the area of empirical economic re-search as well as analyses of countries and branches.
Niels Straub, Dipl. Volksw. (Graduate economist), born in 1974 in Berlin, studied economics at the LMU Munich. He was first employed as Senior Analyst, after finishing his studies in 2002, with focuses in the area automobile and public banks as well as in the macroeconomic analy-sis of countries. Presently he is employed as freelancer at the IWK during his postgraduate studies.