Embed Size (px)
Citation preview
Pacific Island Network
Vital Signs Monitoring Plan
Appendix O: Workshop & Scoping Documents: Part IV-Vital Signs Workshops
Compiled by Casey Cumming (HPI-CESU) Pacific Island Network (PACN) Territory of Guam War in the Pacific National Historical Park (WAPA) Commonwealth of the Northern Mariana Islands American Memorial Park, Saipan (AMME) Territory of American Samoa National Park of American Samoa (NPSA) State of Hawaii USS Arizona Memorial, Oahu (USAR) Kalaupapa National Historical Park, Molokai (KALA) Haleakala National Park, Maui (HALE) Ala Kahakai National Historic Trail, Hawaii (ALKA) Puukohola Heiau National Historic Site, Hawaii (PUHE) Kaloko-Honokohau National Historical Park, Hawaii (KAHO) Puuhonua o Honaunau National Historical Park, Hawaii (PUHO) Hawaii Volcanoes National Park, Hawaii (HAVO)
http://science.nature.nps.gov/im/units/pacn/monitoring/plan/
National Park Service U.S. Department of the Interior

Appendix O: Part IV Vital Signs Workshops
2
Suggested citation:
Cumming, C. 2006. Appendix O: Workshop & scoping documents: Part IV-Vital Signs workshops. In: HaySmith, L., F. L. Klasner, S. H. Stephens, and G. H. Dicus. Pacific Island Network vital signs monitoring plan. Natural Resource Report NPS/PACN/NRR—2006/003 National Park Service, Fort Collins, Colorado.
Last revision: 1 December 2005
Organization contact information:
National Park Service (NPS), Inventory and Monitoring Program, Pacific Island Network, PO Box 52, Hawaii National Park, HI 96718, phone: 808-985-6180, fax: 808-985-6111, http://science.nature.nps.gov/im/units/pacn/monitoring/plan/
Hawaii-Pacific Islands Cooperative Ecosystems Studies Unit (HPI-CESU), University of Hawaii at Manoa, 3190 Maile Way, St. John Hall #408, Honolulu, HI 96822-2279
Acknowledgements: This appendix was prepared with assistance from the Hawaii-Pacific Islands Cooperative Ecosystems Studies Unit (HPI-CESU) staff Jean Franklin, Task Agreement Number: CA-8012-AO-001.

National Park Service 3
Table of Contents Vital Signs Workshop, Honolulu: March 16-18, 2004 ................................................. 7 Workshop Participants ..................................................................................................................8 Meeting Overview, Welcome, and Introduction ..........................................................................11 National-Regional Monitoring perspective ..................................................................................11 Initial Vital Signs..........................................................................................................................11 Network Vital Signs: Organization, Identification, Prioritization .................................................11
Network Vital Signs: Group Question and Answer Session...................................................11 Conceptual Model Development in the Pacific Island Network...................................................13
Conceptual Models: Group Question, Answer, and Comment Session ................................13 Summary of main points from comments: ..............................................................................14
Geology Topical Session ............................................................................................................15 Participants: ............................................................................................................................15 Session Notes:........................................................................................................................15
Initial Vital Signs - Specific Comments:...............................................................................15 Synthesis of Main Points from Session Comments: ...........................................................17 Responses to Main Points Raised During Session:............................................................18
Initial Vital Signs: Geology .....................................................................................................19 Revised Vital Signs: Geology.................................................................................................19
Threatened, Endangered, and Species-of-Concern Topical Session.........................................21 Participants: ............................................................................................................................21 Session Notes:........................................................................................................................21
Initial Vital Signs - Specific Comments:...............................................................................21 Group Discussion on Missing Vital Signs, and/or Re-working of Vital Signs: .....................23 Synthesis of Main Points from Session Comments: ...........................................................23 Responses to Main Points Raised During Session:............................................................24
Initial Vital Signs: Threatened, Endangered, and Species-of-Concern..................................26 Revised Vital Signs: Threatened, Endangered, and Species-of-Concern .............................27
Air Quality / Climate Topical Session..........................................................................................28 Participants: ............................................................................................................................28 Session Notes:........................................................................................................................28
Initial Vital Signs - Specific Comments:...............................................................................28 General Comments / Feedback: .........................................................................................29 Synthesis of Main Points from Session Comments: ...........................................................30 Responses to Main Points Raised During Session:............................................................30 Additional Changes (not based on feedback received in workshop): .................................31
Initial Vital Signs: Air Quality/Climate.....................................................................................32 Revised Vital Signs: Air Quality/Climate ................................................................................33
Invasives Topical Session...........................................................................................................34 Participants: ............................................................................................................................34 Session Notes:........................................................................................................................34
Initial Vital Sign - Specific Comments: ................................................................................35 Potential New Vital Signs: ...................................................................................................37 Ranking/Priorities: ...............................................................................................................37
General Comments:................................................................................................................37 Partnerships: .......................................................................................................................38

Appendix O: Part IV Vital Signs Workshops
4
Other: ..................................................................................................................................38 Synthesis of Main Points from Session Comments, and Responses: ................................39
Initial Vital Signs: Invasives....................................................................................................41 Revised Vital Signs: Invasives ...............................................................................................42
Water Quality (marine, surface, & ground water) Topical Session .............................................43 Participants: ............................................................................................................................43 Session Notes:........................................................................................................................43
Initial Vital Signs – Specific Comments:..............................................................................43 Synthesis of Main Points from Session Comments: ...........................................................44 Responses to Main Points Raised During Session:............................................................45
Initial Vital Signs: Water Quality.............................................................................................46 Revised Vital Signs: Water Quality ........................................................................................47
Invertebrate Fauna (terrestrial) Topical Session.........................................................................48 Participants: ............................................................................................................................48 Session Notes:........................................................................................................................48
Initial Vital Signs - Specific Comments:...............................................................................48 Synthesis of Main Points from Session Comments, and Responses: ................................49
Initial Vital Signs: Invertebrate Fauna ....................................................................................50 Revised Vital Signs: Invertebrate Fauna................................................................................51
Birds and Bats Topical Session ..................................................................................................52 Participants: ............................................................................................................................52 Session Notes:........................................................................................................................52
Initial Vital Signs - Specific Comments:...............................................................................52 General comments for T23-T27: .........................................................................................53 Rankings: ............................................................................................................................53 Partnership Opportunities: ..................................................................................................53 Synthesis of Main Points from Session Comments: ...........................................................54 Reponses to Main Points Raised during Session: ..............................................................54
Initial Vital Signs: Birds and Bats ...........................................................................................55 Revised Vital Signs: Birds and Bats.......................................................................................56
Fresh Water Biology Topical Session .........................................................................................57 Participants: ............................................................................................................................57 Session Notes:........................................................................................................................57
Initial Vital Sign - Specific Comments: ................................................................................57 Transcription of General Comments: ..................................................................................58 Synthesis of Main Points from Session Comments: ...........................................................58 Responses to Main Points Raised During Session:............................................................59
Initial Vital Signs: Fresh Water Biology ..................................................................................61 Revised Vital Signs: Fresh Water Biology .............................................................................62
Vegetation (Vascular and Non-vascular Plants) Topical Session...............................................63 Participants: ............................................................................................................................63 Session Notes:........................................................................................................................63
Initial Vital Signs – Specific Comments:..............................................................................63 Potential New Vital Signs: ...................................................................................................66 Ranking/Priorities: ...............................................................................................................67 General Comments: ............................................................................................................67 Ideas for Possible Partnership Opportunities:.....................................................................67 Synthesis of Main Points from Session Comments, and Responses: ................................67
Initial Vital Signs: Vegetation .................................................................................................69 Revised Vital Signs: Vegetation.............................................................................................70
National Park Service 5
Vertebrate Fauna (Terrestrial –other than Birds and Bats) Topical Session ..............................71 Participants: ............................................................................................................................71 Session Notes:........................................................................................................................71
Initial Vital Signs - Specific Comments:...............................................................................71 General comments/feedback: .............................................................................................72 Methods/Metrics discussion: ...............................................................................................72 Partner/Reference suggestions:..........................................................................................72 Synthesis of Main Points from Session Comments: ...........................................................73 Responses to Main Points Raised During Session:............................................................73
Initial Vital Signs: Vertebrate Fauna.......................................................................................75 Revised Vital Signs: Vertebrate Fauna ..................................................................................76
Landscape Topical Session ........................................................................................................77 Participants: ............................................................................................................................77 Session Notes:........................................................................................................................77
Initial Vital Signs – Specific Comments:..............................................................................77 Significant Comments: ........................................................................................................79 Partnerships: .......................................................................................................................79 Post workshop follow up: ....................................................................................................79
Initial Vital Signs: Landscape .................................................................................................81 Revised Vital Signs: Landscape ............................................................................................82
Marine Benthic (Invertebrate) Topical Session ...........................................................................83 Participants: ............................................................................................................................83 Session Notes:........................................................................................................................83
Initial Vital Sign – Specific Comments:................................................................................83 Synthesis of Main Points from Session Comments: ...........................................................86 Responses to Main Points Raised During Session:............................................................86
Initial Vital Signs: Marine – Benthic (Invertebrates) ...............................................................88 Marine Fish and Fisheries Topical Session: ...............................................................................89
Participants: ............................................................................................................................89 Session Notes:........................................................................................................................89
Initial Vital Sign – Specific Comments:................................................................................89 Synthesis of Main Points from Session Comments: ...........................................................93 Responses to Main Points Raised During Session:............................................................93
Initial Vital Signs: Marine – Fish/Fisheries .............................................................................94 Marine Intertidal Topical Session................................................................................................95
Participants: ............................................................................................................................95 Session Notes:........................................................................................................................95
Initial Vital Sign – Specific Comments:................................................................................95 Other Comments:................................................................................................................96 Synthesis of Main Points from Session Comments: ...........................................................96 Responses to Main Points Raised During Session:............................................................97
Initial vital Signs: Marine - Intertidal .......................................................................................98 Marine Other Topical Session.....................................................................................................99
Participants: ............................................................................................................................99 Session Notes:........................................................................................................................99
Initial Vital Sign – Specific Comments:................................................................................99 Synthesis of Main Points from Session Comments: .........................................................101 Responses to Main Points Raised During Session:..........................................................101
Initial Vital Signs: Marine - Other .........................................................................................103

Appendix O: Part IV Vital Signs Workshops
6
Marine Session(s) Overview .....................................................................................................104 General Responses for Marine Vital Signs ...........................................................................104 Marine Session Comments – Applicable to Entire Monitoring Program ...............................105
Summary of Main Points from Comments ........................................................................106 Revised Vital Signs – Marine ................................................................................................108
Review(s) of Vital Signs Process ..............................................................................................109 Park Comments on Priorities ................................................................................................109
National Park of American Samoa ....................................................................................109 Haleakala National Park....................................................................................................109 Hawaii Volcanoes National Park .......................................................................................109 Puukohola Heiau National Historic Site ............................................................................110 Kaloko Honokohau National Historical Park .....................................................................110 War in the Pacific National Historical Park and American Memorial Park ........................110 USS Arizona Memorial......................................................................................................110 Kalaupapa National Historical Park...................................................................................110 Ala Kahakai National Historic Trail....................................................................................110 Puuhonua O Honaunau National Historical Park: .............................................................111
General Participant Comments on Priorities.........................................................................111 Pacific West Regional Coordinator Perspective on Priorities............................................111
General Participant Comments on Selection ........................................................................112 Overall ‘Outside’ Participant Perspectives ................................................................................112 Overall Park Participant Perspectives.......................................................................................113
Kaloko Honokohau National Historical Park .........................................................................113 Ala Kahakai National Historic Trail........................................................................................113 American Memorial Park.......................................................................................................113 Puukohola National Historic Site...........................................................................................114 Puuhonua O Honaunau National Historical Park..................................................................114 Kalaupapa National Historical Park ......................................................................................114 War in the Pacific National Historical Park............................................................................114 National Park of American Samoa........................................................................................114 Haleakala National Park .......................................................................................................115 Hawaii Volcanoes National Park...........................................................................................115
Final Revised Vital Signs, Planned Prioritization and Selection ...............................................115 Vital Sign Prioritization Process ............................................................................................115 Vital Sign Selection Process .................................................................................................117 Overall Revised Vital Signs...................................................................................................120
Post-Meeting Update ................................................................................................................127 PACN Vital Sign Framework.................................................................................................128
Vital Signs Meeting, Hilo: Nov. 4, 2004.................................................................... 149 Executive Summary ..............................................................................................................149 Important Recommendations................................................................................................149 Recurring themes..................................................................................................................149 Background...........................................................................................................................150 Participants ...........................................................................................................................150 Process .................................................................................................................................150 Review of VS Timeline..........................................................................................................152 Vital Sign Ranking Process...................................................................................................152 Beginning of Notes taken during meeting .............................................................................153

National Park Service 7
Vital Signs Workshop, Honolulu: March 16-18, 2004
The Pacific Island Network, Inventory & Monitoring Program held a Vital Signs Workshop on 16-18 March 2004 at the Imin Conference Center (East-West Center), University of Hawaii-Manoa. This report summarizes the input and results from that workshop. The format of this report generally follows the flow of the meeting, and concludes with the ultimate products: 1) revised list of Vital Signs and 2) draft description of the Vital Sign prioritization and selection process to use in the network monitoring plan.
The workshop purpose was to obtain peer review of proposed monitoring plan and Vital Sign identification and prioritization, by park managers and subject experts from within and outside of the NPS.
Organization of the workshop included the input and efforts of all the I&M staff. It was designed to allow discussions on vital signs of each natural resource topic by NPS employees and invited specialists. The I&M Workgroup Leaders, along with park staffs, submitted names of specialists whose expertise would be invaluable to the workshop. Those invited and attended are listed below.
The workshop was facilitated by Helen Felsing of the NPS Rivers, Trails and Conservation Assistance Program. Helen is based in Maui and has facilitated numerous meetings for the park service and other agencies. She trained the Workgroup Leaders for their role in facilitating their topical sessions and taking notes in other sessions.
The stated workshop goals/outcomes were: 1) (Peer) Review of the monitoring plan: summary of current ecological understanding, monitoring goals, desired future conditions, and conceptual models; 2) comments and suggestions for improvements upon the choice of and existing prioritization of Vital Signs (indicators) recommended for monitoring; 3) identify existing sampling (monitoring) methodology and identify or recommend needs for the development of new protocols with high-priority indicators; and 4) recommendations for partnerships to accomplish monitoring priorities. The bulk of the workshop, and this report, focus on the format, organization, and draft Vital Signs.
This report is intended to present and document the input received at the workshop and the resulting revisions to our Vital Signs. Fortunately, workshop participants typically felt free to contribute and express ideas for discussion. While we hope we’ve adequately captured these ideas and discussion, there may be suggestions that will ultimately prove inappropriate for use within the Pacific Island Network.
The last section of this document, “Overall Revised Vital Signs”, is our best interpretation and summation of the input received and the preferred direction we anticipate taking for the Pacific Island Network. These revised Vital Signs may differ from the revised Vital Signs resulting from individual sessions – a result of workshop participant suggestions to standardize and attempts to resolve differing suggestions from different sessions. These “Overall Revised Vital Signs” are what the network will use for future incorporation in the network Monitoring Plan.
These materials (this “Vital Sign Workshop Report”, workshop agenda, etc.) are available online at: http://www1.nature.nps.gov/im/units/pacn/monitoring/plan/2004/vs04/.

Appendix O: Part IV Vital Signs Workshops
8
Workshop Participants
Name Affiliation Email Address INVITED ATTENDEES: Antonelis, Bud NMFS, protected species [email protected] Barnes, John NOAA-CMDL [email protected] Beets, Jim UH Hilo – Marine Science [email protected] Bird, Chris UH Manoa [email protected] Birkeland, Chuck UH Manoa – Zoology/USGS [email protected] Brasher, Anne USGS-WRD [email protected] Bruegmann, Marie USFWS [email protected] Campbell, Earl USFWS [email protected] Caraway, Vickie DOFAW [email protected] Conant, Pat Hawaii DoA [email protected] Cory, Colleen The Nature Conservancy [email protected] Cowie, Rob UH Manoa [email protected] Daehler, Curt UH Manoa [email protected] Denslow, Julie USFWS [email protected] Drake, Don UH Manoa [email protected] Duvall, Fern DLNR/DOFAW [email protected] Elias, Tamar USGS-HVO [email protected] Englund, Ron BPBM [email protected] Evenhuis, Neal BPBM [email protected] Flint, Beth USFWS [email protected] Fretz, Scott DOFAW [email protected] Friedlander, Alan UH Manoa/NOAA/NOS/OI [email protected] Giambelluca, Tom UH Manoa [email protected] Gibson, Barbara UH Hilo [email protected] Gon, Sam The Nature Conservancy [email protected] Hauff, Rob DLNR [email protected] Helweg, David USGS-PIERC [email protected] Hess, Steve USGS-PIERC [email protected] Hill, Barry USGS-WRD [email protected] Howarth, Frank BPBM [email protected] Irwin, Roy NPS-WRD [email protected] Juvik, Sonia UH Hilo [email protected] Kinzie, Bob UH Manoa - Zoology [email protected] Kraus, Fred BPBM [email protected] Kuffner, Isla USGS [email protected] LaRosa, Anne Marie USFWS [email protected] Laws, Ed UH Manoa-Oceanography [email protected] Maekawa, Reid Navy [email protected] Maragos, Jim USFWS [email protected] Menard, Theresa The Nature Conservancy [email protected] Michaud, JP UH Hilo-Chemistry [email protected] Mueller-Dombois, Dieter UH Manoa, Emeritus [email protected] Muraoka, John Navy [email protected] Murphy, Jim USDA [email protected] Parrish, Jim Hawaii Coop Fish Res Unit [email protected] Poiani, Karen The Nature Conservancy [email protected]

National Park Service 9
Polhemus, Dan Smithsonian Institute [email protected] Raulerson, Lynn University of Guam [email protected] Reimer, Neil HDOA [email protected] Richmond, Bruce USGS/CMG [email protected] Rogers, Caroline USGS [email protected] Seamon, Joshua ASGDMWR [email protected] Sherwood, Alison UH Manoa - Botany [email protected] Sim, Tara UH Manoa - Zoology [email protected] Smith, Celia UH Manoa [email protected] Smith, Jen UH Hilo [email protected] Tribble, Gordon USGS [email protected] Wainscoat, Richard IFA-UH Manoa [email protected] Walsh, Bill DOFAW/DAR/DLNR [email protected] Wedding, Lisa UH/NPS/PICRP [email protected] Whistler, Art NTBG/Isle Botanica [email protected] Wilkinson, Mindy DLNR [email protected] Wiltse, Wendy US EPA [email protected] Work, Thierry USGS-NWHC [email protected] Yoshinaga, Alvin Lyon Arboretum [email protected] Young, Lisa DOH [email protected] Zabin, Chela UH Manoa [email protected] NPS EMPLOYEES AND COOPERATORS DIRECTLY INVOLVED WITH WORKSHOP Anderson, Steve HALE [email protected] Arakaki, Aric ALKA [email protected] Bailey, Cathleen HALE [email protected]
Basch, Larry HAVO/UH Manoa/PCSU [email protected], [email protected]
Beavers, Sallie KAHO [email protected] Bond, Stan KAHO [email protected] Carnevale, Maria KALA [email protected] Craig, Peter NPSA [email protected] Cumming, Casey PACN [email protected] Daniel, Raychelle PACN [email protected] DeVerse, Kimber PACN [email protected] Dicus, Gordon PACN [email protected] DiDonato, Eva NPSA [email protected] Felsing, Helen NPS R&T [email protected] Foote, David USGS [email protected] Harry, Bryan PWRO-Honolulu [email protected] Hu, Darcy PWRO/HAVO [email protected] Hughes, Guy KALA [email protected] Jacobi, Jim USGS [email protected] Kaholoaa, Raina HALE [email protected] Kawaiaea, Daniel PUHE [email protected] Kaye, Grant PACN [email protected] Klasner, Fritz PACN [email protected] Laber, Malia PUHO [email protected] Lane-Kamahele, Melia PWRO/Honolulu [email protected] Latham, Penny PWRO/Seattle [email protected] Licus, Jean PACN [email protected]

Appendix O: Part IV Vital Signs Workshops
10
Loh, Rhonda HAVO [email protected] Loope, Lloyd USGS/BRD [email protected] Magnacca, Karl PACN [email protected] Minton, Dwayne WAPA [email protected] Monello, Ryan NPSA [email protected] Neighbor, Doug NPSA [email protected] Pratt, Linda USGS [email protected] Saldua, Ben PUHE [email protected] Sayon, Chuck AMME [email protected] Schlappa, Karin PACN [email protected] Stephens, Sonia PACN [email protected] Stout, Ilana PACN [email protected] Trusdell, Frank USGS [email protected] Tunison, Tim HAVO [email protected] Welton, Patti HALE [email protected]

National Park Service 11
Tuesday, March 16th Morning Session
Meeting Overview, Welcome, and Introduction
This session consisted of a brief welcome to all participants and review of agenda. The original meeting agenda is available at: http://www1.nature.nps.gov/im/units/pacn/monitoring/plan/2004/vs04/agenda.htm.
National-Regional Monitoring perspective
This session consisted of a review of the National Park Service Inventory and Monitoring Program, specific introduction to concept of Vital Signs monitoring, and other pertinent details by Penny Latham, Pacific West Regional Inventory and Monitoring Program Coordinator. The presentation is available online at: http://www1.nature.nps.gov/im/units/pacn/monitoring/plan/2004/vs04/index.htm#products.
There were no specific questions associated with this session. See the following section on “Network Vital Signs” for questions and responses.
Initial Vital Signs
The initial Pacific Island Network Vital Signs, presented for discussion at the Vital Signs Workshop, are available for review online at: http://www1.nature.nps.gov/im/units/pacn/monitoring/plan/2004/vs04/vs-session_network.pdf.
Network Vital Signs: Organization, Identification, Prioritization
This session consisted of a review of NPS Pacific Island Network monitoring plan development to date by Fritz Klasner, NPS Pacific Island Network Ecologist. The presentation is available online at: http://www1.nature.nps.gov/im/units/pacn/monitoring/plan/2004/vs04/index.htm#products.
Network Vital Signs: Group Question and Answer Session
Question: Will funding depend on priorities? Answer: (Fritz): Yes, but not totally. Parks will be asked to review priorities one more
(final) time. Also, a key component of selection will be cost. Question: We need to have some estimate of that before prioritizing, at what point does
that come in? Answer: Cost effectiveness was prioritized – but we need to have more info on methods
to adequately assess this. Answer: (Penny): at this point it’s subjective and gut feeling. The network will need to
revisit once priorities are addressed.
Question: Will there be consistencies in methodology across networks? Answer: Yes, there will be consistencies in methodologies across networks to the extent
practical and appropriate to meet individual park needs. We will aim for a simple protocol that is customizable for each park. There will be fewer protocols with flexibility within them to keep reviews and protocol development manageable.

Appendix O: Part IV Vital Signs Workshops
12
Question: Are vital sign priorities park specific? Answer: Yes, vital sign priorities are park specific, but also presented as averaged across
the network.
Question: Will the network receive start up money before 2006? Answer: We have funding now. We will be using some of this for preparing agreements
for protocol development.
Question: for the list of monitoring objectives (see presentation on website) – do we have baseline data for some or any of these?
Answer: For some of these objectives yes, but in a lot of cases, no. The monitoring plan, where it identifies individual Vital Signs, will address this in more detail.
Email comment: I was dismayed to hear in several comments and on slides that research is seen as something done on the side, not as integral to the process of managing these parks. Frankly, without a research base at some level, it's not clear to me how you determine what is important to monitor or to manage. Your research basis may have been formed in other parks in other decades, but it is nonetheless the underpinning of our understanding of the functioning of ecosystems. There should be clear feedback loops among research, monitoring, and management. Sure some things are obvious and don't need a complicated statistical design to demonstrate. On the other hand we frequently think we understand much more than we do and false assumptions about the way the world works can become so ingrained that they become unquestioned. I would think that would be dangerous for management.
Answer: Research is integral to park management. One of the figures in the presentation identifies 4 core, linked components: inventories, monitoring, research, and management. This program is funded to help meet the needs of two of these components: inventories and monitoring. Exactly how the Inventory and Monitoring program interacts with management and research is something we need to spell out in our monitoring plan. It is anticipated that a significant research effort will be necessary to prepare for, improve, and interpret monitoring. Hopefully we’ll do a better job of communicating this in the future.
National Park Service 13
Conceptual Model Development in the Pacific Island Network
This session consisted of a review of the conceptual model development to date in the NPS Pacific Island Network monitoring plan by Sonia Stephens, Pacific Cooperative Studies Unit Freshwater Biology Workgroup Facilitator. The presentation is available online at: http://www1.nature.nps.gov/im/units/pacn/monitoring/plan/2004/vs04/index.htm#products.
Conceptual Models: Group Question, Answer, and Comment Session
Question: Were there any attempts to parameterize model? Will researchers be involved in attempts to assess strengths & directions of connections?
Answer (Sonia): We will do that for vital signs selected, but probably not more general models. We should be using models for Vital Sign selection, not just as communication tools. We will be using quantitative models in helping to decide on methods & metrics. Will researchers be helping with this? Yes, as part of development of Vital Sign protocols.
Answer (Penny): At larger scales, models are primarily conceptual tools to facilitate development of more specific, parameterized models for selected Vital Signs. We may do that with larger models eventually.
Question: Ecosystem sustainability model: in many cases ecosystem components are missing so won’t be functioning normally anyway. Is it important for parks to have some value for ecological integrity? For example a missing plant could be reintroduced. Model seems to assume intact ecosystem but the opposite is probably true.
Answer: Other models will address individual components; the ecosystem sustainability model does not address individual components.
Comment: Ecosystem models seem very linear & need to show more feedbacks. Dynamic state of system, but sometimes system feedbacks will mask responses. Need to watch that.
Comment: Suggestion made that we look at Odum’s (UF) models of energy flow. Question: There’s some confusion in drivers and stressors of causes & effects (e.g.,
rainfall + topography results in flood). Is this a problem? Answer: We’re trying to represent the most visible components & acknowledge there are
missing components. This is an attempt to make model useful & legible. We will be seeking additional input. Also, people are saying “habitat” when they mean “ecosystem”.
Question: Will modeling be rolled into a final product or score? The Nature Conservancy is doing this.
Answer: The I&M program has no mandate to do this, yet.
Comment: Need either a broader definition of Vital Sign or remove some from list, e.g., land use is listed as both a driver & stressor in different models, and is therefore
Appendix O: Part IV Vital Signs Workshops
14
not a Vital Sign. Points of entry (for invasive species) is another example, where points of entry is not a Vital Sign according to the definition provided in the monitoring plan. Further conceptual clarity is needed.
Comment: Considering that the process is starting from nothing, it’s good; building models is an iterative process
Email Comment: I am not convinced of the utility of the modeling component, unless there is an effort made to at least roughly parameterize those models. If the conceptual models were limited to the kinds that were presented, then they really represent no more than lists of interacting elements, because they do not define how these components interact nor the magnitude of the effect. Models are powerful heuristic tools that need not be blindingly complex, but they should be based in scientific research and they should be readjusted periodically as you get more information. The models should tell you what the important elements are to monitor and the data from the monitoring effort should help refine the models to give you more information. You may be developing a PR tool, but it's not going to go very far justifying your efforts to any serious scientific critic. And you have no way of knowing whether your models are good, bad, or indifferent.
Answer: According the NPS monitoring program guidance (http://science.nature.nps.gov/im/monitor/vsmTG.htm#Conmodel) well designed conceptual models will:
• Formalize current understanding of system processes and dynamics • Identify linkages of processes across disciplinary boundaries • Identify the bounds and scope of the system of interest • Contribute to communication
Summary of main points from comments:
• There needs to be more clarity on how we define the model components (drivers, stressors, etc.). Right now, this is not entirely consistent between or among models.
• The models given as examples seem very linear, and more work needs to go into showing both feedbacks and the strength of interactions between components. This will make the models more useful as tools to help select Vital Signs, rather than just as visual aids to the public.
We are beginning to look at addressing these comments in our models. These changes
will be reflected in future versions of our monitoring plan.

National Park Service 15
TOPICAL SESSIONS
Tuesday, March 16th Afternoon Wednesday, March 17th All Day
Geology Topical Session
Participants:
Grant Kaye (facilitator) Jean Licus (notes) Barry Hill Frank Trusdell Gordon Tribble Bruce Richmond Kimber DeVerse Sonia Stephens Chuck Sayon
Session Notes:
In the geology session, each vital sign was discussed in order. We began by discussing each vital sign’s monitoring question, and then went on to talk about their management goals, monitoring methods, and metrics. Notes of the discussion were recorded by Grant Kaye, while Jean Licus made notes of the vital signs which were not altered, and those aspects of the vital signs that were changed.
In this summary, vital sign-specific comments will be presented first, followed by the general comments, and information about changes made to the vital signs.
Initial Vital Signs - Specific Comments: Vital Sign P12 – Soil Erosion
• Add “rate of change” to monitoring question, consider looking at land use and human influences as well.
• Add sediment fingerprinting to monitoring method, and ensure that methods are integrated over the entire watershed.
• Metrics should include areal distribution of soil loss (mapping), as well as transport of sediment out of watershed.
• Consider dividing into natural vs. unnatural? No, but important to realize distinction. Vital Sign P13 – Soil Quality – Biological
• Add what are soil communities to monitoring • Add bulk density to metrics
Vital Sign P14 – Soil Quality – Chemical and Vital Sign P15 – Soil Quality – Physical
• No changes Vital Sign P16 – Soil Crusts
• Soil crusts – when they are broken, erosion accelerates • Ka`u desert, Pahala ash (HVO) • Baseline studies? Need to be inventoried
Vital Sign P17 – Flowing surface water hydrology • What is the spatial distribution of flow in question? • Flow regionalization into monitoring methods • Metrics field is too wordy • Erosion – delete? • Add flash flooding as a new vital sign
Appendix O: Part IV Vital Signs Workshops
16
• Stream flow – can be extrapolated, but long-term record in conjunction with periodic measurements are needed
• Rainfall can be used as a proxy (Frank Trusdell comment) • Yes, but with assumptions, such as: (Gordon Tribble response)
• Watershed is well characterized • Enough has been done to enable assumptions about permeability, water-saturation capacity, etc. • Need at least one measurement instrument (either at head or outlet)
• Permeability – measured by infiltration capacity • Combine two monitoring questions –
• 1) what is flow regimen? • 2) what are geomorphic conditions?
• Metrics field: add stream discharge over space and time • No need to measure stream water flow by erosion as metric
Vital Sign P18 – Wetlands hydrology (including anchialine pools) • Delete erosion (already considered elsewhere in other VS) • Need to know groundwater levels in wetlands, residence times, infiltration and permeability
and evaporation. • Include sedimentation patterns, including measuring deposition (which can be good –
AMME) • Wetlands – relationship between wetlands and groundwater – water levels in anchialine pools • Plants are a metric for water if have nothing else
Vital Sign P19 – Groundwater Dynamics • Salinity added as a metric • Add seepage • Samples from wells added to monitoring method • Measurement of movement between stream and groundwater into monitoring objectives
Vital Sign P34 – Volcanic Unrest – Ground Deformation and Vital Sign P35 – Volcanic Unrest – Lava Flows and Vital Sign P36 – Seismicity of Non-Volcanic Origin and Vital Sign P37 – Seismicity of Volcanic Origin
• No changes Vital Sign P38 – Mass Wasting – Geologic
• Consider accuracy, need to incorporate tsunamis • Recommendation for additional vital sign = marine inundation (see below), where metrics
would be water levels, erosion extent. • Careful that mass wasting does not become a catch-all, as it can be incited by events of
varied origin which are monitored differently (seismic = earthquake induced landslides, volcanic = edifice collapse, climactic = high precipitation events, etc).
• Add distinction of mass wasting of non-volcanic origin Debris flows Flash floods
Vital Sign P39 – Coastal Shoreline Change (erosion and accretion) • Add historical shoreline analyses to metrics • A need for additional tide gauges?

National Park Service 17
• Coastal erosion 1) land 2) beach (no need for new vital sign) depositional, soft shorelines must be monitored
more heavily • Shoreline change can come from:
Sea level change Storm frequency Removal/accretion of material
• Tide gauges? More? (Apua point, Halape, Keauhou, Pohue Bay south point already?) Talk to NOAA about partnerships Cost?
• Saipan is rising • What is the sea level center in Hawaii? (UH - http://uhslc.soest.hawaii.edu/)
Vital Sign P40 – Dune Change (erosion and accretion) • Sand dunes (KALA, HAVO) metric should be the wind regime
Vital Sign P41 – Permafrost on Big Island Summits • No change
Vital Sign P42 – Cave Environmental Conditions • No change
Vital Sign P43 and P44 – Caves (Karsts/non Karst) • Caves/karst – AMME – below water table, ground is too young • Lava tubes as new caves – mapped during eruption with VLF (Very Low Frequency), but
very short lived and quite inhabitable for a while, also frequently buried.
Email Comment: A suggestion to combine many of the vital signs (P12-P16, P17 and
P19, P34 and P35, P36 and P37, and P40-44 was received. Because these broad-sweeping changes were not suggested to or discussed by the group at the meeting, we declined to make them. Furthermore, we (Frank and Grant) found it disadvantageous to streamline vital signs that are so clearly different (i.e. seismicity and volcanic unrest are two geologic phenomenon that can have very different causes and effects, and thus should be considered separately). Additional suggested additions to P39 and P43 (the newly proposed vital sign) were incorporated and changes can be found in the revised Vital Signs chart for the Geology session.
Synthesis of Main Points from Session Comments:
The geology session went smoothly, as there were a small number of attendees who brought a diverse set of backgrounds, locations, and expertise. We made our way through the “Soil, water, and Nutrient Dynamics” category of vital signs expediently, changing wording and adding/removing elements of each vital sign.
We chose to skip the geologic hazards (volcanic activity) set of vital signs, due in part in the interest of time, and also to a general agreement within the group that these vital signs are already adequate and in little need of modification.
We discussed removing P42 (Cave Environmental Conditions) because we felt it did not completely pertain to geologic processes, and fit better in the Landscape category.
Appendix O: Part IV Vital Signs Workshops
18
Several times in our discussion, the idea of crating a new vital sign covering marine inundation was proposed. This idea was developed slightly further in the allotted time, and will be added to the list of geologic vital signs.
Responses to Main Points Raised During Session:
The comments and discussion of the group participating in the geology session were noted and used to edit, reorganize, and revise the vital signs. A new vital sign was proposed (see below), and one was removed - Cave Environmental Conditions (P42), as discussed above.
NEW Vital Sign P39 - Marine inundation (tsunami, flash floods, typhoon, water levels) • Monitoring Objective – Measure the impacts from extreme events such as coastal stream
flooding, storm/hurricane overwash, and tsunami inundation • Monitoring questions – What area the frequency and magnitude and distribution of marine
inundation events? What park resources are subject to inundation during stream flooding, large storms, or tsunamis/big wave events?
• Monitoring Methods – tide gauges, seismic networks, rain gauges, stream gauges, oceanic buoys, field mapping of water and debris lines (both horizontal incursion and vertical elevation)after an event, photograph damage and changes to park resources
• Monitoring Partners – NOAA/UH sea-level center, Pacific Tsunami Warning Center, National Weather Service
• Metrics – sea level, erosion/deposition, extent, discharge; precipitation, water levels in rivers and streams, tide data, earthquake detection, buoy readings out to sea, meters of inundation, deposit thickness in meters

National Park Service 19
Initial Vital Signs: Geology
Eco Char
Vital Sign Category
Monitoring Objectives
VS Id# Vital Sign Monitoring Question(s) Management Goal Monitoring Method Metrics
Vital Sign Rank (0-5)
Monitor soil erosion P12 Soil Erosion What are causes and locations of soil erosion? Understand patterns of soil erosion, minimize effects on resources erosion pins, sediment collectors, mapping Rate of change? 2.9
P13 Soil Quality - Biological Are soil communities changing? Identify trends in soil quality and evaluate potential for climate change analysis Soil sampling and analysis bacteria, fungal/microrhizzal, worms/nematodes/arthropods 1.7
P14 Soil Quality- Chemical Are soil buffering and filtering qualities changing? Identify trends in soil quality and evaluate potential for climate change analysis Soil sampling and analysis appropriate WQ measures, cations, pH, soil composition, Total
Nitrogen & Total Carbon 1.9
Monitor soil quality trends (physical, toxics/contaminants, other biologic and nutrients) P15 Soil Quality- Physical Are physical soil properties changing? Identify trends in soil quality and evaluate
potential for climate change analysis Soil sampling and analysis DOC, grain size, moisture content, parent material, percent organic matter, permeability, POC 2.3
Monitor condition and extent of soil crusts P16 Soil Crust Change (Arid-
Semiarid habitats) What are pressures/impacts on soil crusts, and how are they distributed in space and time? Document change and analyze for trend soil and geologic mapping, remote sensing,
periodic change analysis distribution of soil crusts, pH, rainfall, substrate composition, volcanic aerosol composition, wind spd/dir 0.9
Monitor trends in surface water flow regimes
P17 Flowing surface water hydrology
What are usual rates & range of flow? What is timing & magnitude of floods or droughts? Is erosion occurring, or are flow channels changing?
Understand patterns in surface water flow regimes & stream dynamics gages, sampling at permanent sites
erosion, discharge / recharge, diversion patterns, flood timing / magnitude, withdrawal & consumption rates, stream cross-section, stream discharge, stream gradient
2.7
Monitor wetland (incl. anchialine ponds) water flow exchange dynamics, size, and distribution
P18 Wetlands (incl. anchialine pools) hydrology
What are freshwater/saltwater recharge rates? What is habitat extent? What are temporal trends in recharge rates and habitat extent?
Understand patterns in water flow and recharge in surface features associated w/groundwater measure salinity, residence time, mapping
erosion, flood timing/magnitude, flow, parent material/geomorphology, plant cover/ species present, pool size, depth & salinity, rainfall, sediment loads, stream cross-section, stream discharge, stream gradient
3.2
Soil, W
ater, & N
utrient Dynam
ics
Monitor ground water flow rates and direction of movement (recharge)
P19 Groundwater dynamics What are rates of subsurface flow? What is level of freshwater/saltwater mixing? What are flow patterns?
Understand patterns & rates of flow in subsurface groundwater resources well, seep, & spring discharge measurements discharge/recharge, injections (sewage), permeability, tide
fluctuations, withdrawal & consumption rates 2.4
P34 Volcanic Unrest - Ground Deformation
What role does volcanic activity and deformation play in maintaining public safety, park facilities, and how do they affect natural processes?
Monitor volcanic activity and ground deformation patterns Dry and wet tilt meters, dilatometers, GPS GPS, subsurface temp, tilt meters 1.4 Monitor surface
volcanic activity (lava flows, eruption events & ground deformation) P35 Volcanic Unrest - Lava
Flows
What role do lava flows play in maintaining public safety, park facilities, and how do they affect natural processes?
Monitor activity; model risks/hazards Remote sensing, visual observation, tilt meters and dilatometers, GPS ground deformation tube mapping, flow direction/magnitude, GPS 1.2
P36 Seismicity of Non-Volcanic Origin Can we identify trends and predict hazards? Monitor activity; model risks/hazards Seismometers (local and global) tilt meters, seismometers, dilatometers (pressure gauges), EDM
(Electronic Distance Measuring) 1.9 Monitor volcanic & non-volcanic seismicity P37 Seismicity of Volcanic
Origin Can we identify trends and predict hazards? Monitor activity; model risks/hazards Seismometers (local and global) tilt meters, seismometers, dilatometers (pressure gauges), EDM (Electronic Distance Measuring) 1.8
Hazards
Monitor extent, location, and causes of mass wasting events (e.g. landslides)
P38 Mass Geologic Wasting Can we predict slope failure hazards to protect habitats and human safety? Can we monitor or identify causes? What are temporal trends?
Document and measure events. Identify threats to habitats, water resources, and humans.
Rainfall and other climactic analyses (precursors and catalysts), stream gauges, remote sensing
soil saturation, soil/ground creep, substrate composition/permeability, substrate distribution 1.6
Monitor shoreline dynamics P39 Coastal Shoreline Change
(erosion & accretion) Where are shorelines advancing, retreating, or stable? Document change and analyze for trends tide gauge, GPS, remote sensing, field
investigation, periodic change analysis
human development/infrastructure, substrate composition, shoreline aspect/position/slope, sea level, near shore physical oceanography
3.2
Track dune locations and topography P40 Dune Change (erosion &
accretion) Are drought & desertification influencing topsoil transport and seed/nutrient transport patterns?
Monitor dune formation/reactivation and wind erosion patterns
remote sensing, field investigation, periodic change analysis
grain size & parent material, rainfall, soil crust development, substrate composition, substrate distribution, veg stabilization, wind spd/dir
0.9
Identify and monitor the extent of permafrost
P41 Permafrost on Big Island summits
Is extent of permafrost declining? Influence on ground subsidence, slope failure, etc? Monitor changes in permafrost Remote Sensing (ground penetrating radar),
satellite thermal analysis, drilling temperature, volcanic activity (heating), permafrost thickness, rainfall 0.0
P42 Cave Environmental conditions
Are cave systems impacted and changing as a result of above ground changes or human activity & cultural practices? Are environmental conditions in caves changing (temp, humidity, light, etc.)?
Ensure integrity of cave systems by maintaining environmental habitats as well as cultural uses and resources
Station/plot data litterfall, Species distribution & abundance, human use levels, temperature, humidity, ground compaction, etc. 2.0
P43 Cave Geology: non-karst What are patterns of mineral accretion? Where & when are collapse/skylight formation or enlargement occurring?
Document changes in resource, ensure public safety
geologic mapping, periodic measurement of physical parameters and feature types dimensions, feature size, extent 2.2
Physical / C
hemical C
onditions
Geology
Landforms
Monitor karst and non-karst cave and lava tube habitat characteristics, topography, and extent
P44 Cave Geology: karst Are changes in karst systems leading to potential bedrock collapse, well yield disparities, poor groundwater quality, and soil instability?
Determine trends in karst systems -- growth of caves, declines in groundwater quality, etc.
Geologic mapping, remote sensing, surface water chemistry, groundwater discharge patterns baseline mapping, groundwater flow/quality 0.9
Revised Vital Signs: Geology Eco Vital Sign Monitoring Objectives VS Vital Sign Monitoring Question(s) Management Goal Monitoring Method Metrics

Appendix O: Part IV Vital Signs Workshops
20
Char Category Id#
Monitor soil erosion P12 Soil Erosion What are causes and locations of soil erosion, what are rates of change, what is land use and human impact?
Understand patterns of soil erosion, minimize effects on resources
erosion pins deployed together and integrated over watershed, sediment collectors, mapping, sediment fingerprinting
Areal distribution of rate of soil loss (mapping), transport out of watershed
P13 Soil Quality - Biological What are soil communities, and are they changing? Identify trends in soil quality and evaluate
potential for climate change analysis Soil sampling and analysis bacteria, fungal/microrhizzal, worms/nematodes/arthropods, bulk density
P14 Soil Quality- Chemical Are soil buffering and filtering qualities changing? Identify trends in soil quality and evaluate
potential for climate change analysis Soil sampling and analysis appropriate WQ measures, cations, pH, soil composition, Total Nitrogen & Total Carbon
Monitor soil quality trends (physical, toxics/contaminants, other biologic and nutrients)
P15 Soil Quality- Physical Are physical soil properties changing? Identify trends in soil quality and evaluate
potential for climate change analysis Soil sampling and analysis DOC, grain size, moisture content, parent material, percent organic matter, permeability, POC
Monitor condition and extent of soil crusts P16
Soil Crust Change (Arid-Semiarid habitats)
Where are soil crusts broken, what are pressures/impacts on soil crusts, and how are they distributed in space and time? Document change and analyze for trend soil and geologic mapping, remote sensing,
periodic change analysis distribution of soil crusts, pH, rainfall, substrate composition, volcanic aerosol composition, wind spd/dir
Monitor trends in surface water flow regimes P17 Flowing surface
water hydrology
What are usual rates & range of flow? What is timing & magnitude of floods or droughts? Is erosion occurring, or are flow channels changing? What is the spatial distribution of the flow in question? What is the flow regimen, and what are the geomorphic conditions?
Understand patterns in surface water flow regimes & stream dynamics
gauges, sampling at permanent sites, flow regionalization
discharge / recharge, diversion patterns, flood timing / magnitude, withdrawal & consumption rates, stream cross-section, stream discharge, stream gradient, rainfall, stream discharge over space/time
Monitor wetland (incl. anchialine ponds) water flow exchange dynamics, size, and distribution, measure movement of water between streams and groundwater
P18 Wetlands (incl. anchialine pools) hydrology
What are freshwater/saltwater recharge rates? What is habitat extent? What are temporal trends in recharge rates and habitat extent? What are groundwater levels, residence times, infiltration, permeability, and evaporation in wetlands? What is the relationship between groundwater and wetlands in anchialine pools?
Understand patterns in water flow and recharge in surface features associated w/groundwater
measure salinity, residence time, mapping, samples from wells
flood timing/magnitude, flow, parent material/geomorphology, plant cover/ species present, pool size, depth & salinity, rainfall, sediment loads, stream cross-section, stream discharge, stream gradient, , sedimentation patterns
Soil, W
ater, & N
utrient Dynam
ics
Monitor ground water flow rates and direction of movement (recharge) P19 Groundwater
dynamics What are rates of subsurface flow? What is level of freshwater/saltwater mixing? What are flow patterns?
Understand patterns & rates of flow in subsurface groundwater resources
well, seep, & spring discharge measurements
discharge/recharge, injections (sewage), permeability, tide fluctuations, withdrawal & consumption rates, salinity, seepage
P34 Volcanic Unrest - Ground Deformation
What role does volcanic activity and deformation play in maintaining public safety, park facilities, and how do they affect natural processes?
Monitor volcanic activity and ground deformation patterns Dry and wet tilt meters, dilatometers, GPS GPS, subsurface temp, tilt meters
Monitor surface volcanic activity (lava flows, eruption events & ground deformation)
P35 Volcanic Unrest - Lava Flows
What role do lava flows play in maintaining public safety, park facilities, and how do they affect natural processes? Monitor activity; model risks/hazards
Remote sensing, visual observation, tilt meters and dilatometers, GPS ground deformation
tube mapping, flow direction/magnitude, GPS
P36 Seismicity of Non-Volcanic Origin Can we identify trends and predict hazards? Monitor activity; model risks/hazards Seismometers (local and global) tilt meters, seismometers, dilatometers (pressure
gauges), EDM (Electronic Distance Measuring) Monitor volcanic & non-volcanic seismicity
P37 Seismicity of Volcanic Origin Can we identify trends and predict hazards? Monitor activity; model risks/hazards Seismometers (local and global) tilt meters, seismometers, dilatometers (pressure
gauges), EDM (Electronic Distance Measuring)
Monitor extent, location, and causes of mass wasting events (e.g. landslides, debris flows, flash floods, tsunami)
P38 Mass Geologic Wasting
Can we predict slope failure hazards to protect habitats and human safety? Can we monitor or identify causes? What are temporal trends?
Document and measure events. Identify threats to habitats, water resources, and humans.
Rainfall and other climactic analyses (precursors and catalysts), stream gauges, remote sensing
soil saturation, soil/ground creep, substrate composition/permeability, substrate distribution
Hazards
Measure the impacts from extreme events such as coastal stream flooding, storm/hurricane overwash, and tsunami inundation
P39 Marine Inundation What area the frequency and magnitude and distribution of marine inundation events, what park resources are subject to inundation during stream flooding, tsunamis, and large storms or big wave events?
Identify areas subject to periodic and damaging marine inundation and stream flooding events for the purpose of identifying park resources under threat.
Tide gauges, seismic networks, rain gauges, stream gauges, oceanic buoys, field mapping of water and debris lines (both horizontal incursion and vertical elevation)after an event, photograph damage and changes to park resources
water (sea) levels, erosion/deposition, extent, discharge
Monitor shoreline dynamics and change in shoreline position P40
Coastal Shoreline Change (erosion & accretion)
Where are shorelines advancing, retreating, or stable, and what is the rate of change?
Document shoreline change and analyze for trends to identify threatened resources
historical shoreline analysis (air photos, T-sheets), beach profiles, tide gauge data to examine local sea-level trends, field observations and measurements
human development/infrastructure, substrate composition, shoreline aspect/position/slope, sea level, nearshore physical oceanography, historical shoreline analysis, amount of change (m) over the time span between measurements (years).
Track dune locations and topography P41 Dune Change (erosion & accretion)
Are drought & desertification influencing topsoil transport and seed/nutrient transport patterns?
Monitor dune formation/reactivation and wind erosion patterns
remote sensing, field investigation, periodic change analysis
grain size & parent material, rainfall, soil crust development, substrate composition, substrate distribution, veg stabilization, wind regime
Identify and monitor the extent of permafrost P42 Permafrost on Big
Island summits Is extent of permafrost declining? Influence on ground subsidence, slope failure, etc? Monitor changes in permafrost Remote Sensing (ground penetrating radar),
satellite thermal analysis, drilling temperature, volcanic activity (heating), permafrost thickness, rainfall
Physical / C
hemical C
onditions
Geology
Landforms
Monitor karst and non-karst cave and lava tube habitat characteristics, topography, and extent
P43 Cave Geology: non-karst and karst
What are patterns of mineral accretion? Where & when are collapse/skylight formation or enlargement occurring? Are changes in karst systems leading to potential bedrock collapse, well yield disparities, poor groundwater quality, and soil instability?
Document changes in resource, growth of caves, declines in groundwater quality, etc., ensure public safety
geologic mapping, periodic measurement of physical parameters and feature types, remote sensing, surface water chemistry, groundwater discharge patterns
dimensions, feature size, extent, baseline mapping, groundwater flow/quality
National Park Service 21
Threatened, Endangered, and Species-of-Concern Topical Session
Participants:
Gordon Dicus (facilitator) Darcy Hu (notes) Sallie Beavers Tim Tunison Karl Magnacca Steve Miller Fern Duvall Patti Welton Vickie Caraway Jim Jacobi Caroline Rogers Raychelle Daniel Thierry Work Peter Craig Dwayne Minton Maria Carnevale Theresa Menard Guy Hughes Bud Antonelis Melia Lane-Kamahele
Session Notes:
We began the session by reviewing each Vital Sign to assess whether is was adequate or needed work. It was apparent that the group was going to suggest work for each Vital Sign, so we transitioned to simply discussing each Vital Sign in order. The following comments were made in reference to T13, with several participants noting that these comments apply broadly across all Vital Signs for this session:
• Measurable aspects from the Methods and Metrics fields should be incorporated into the Monitoring Questions. I & M program should strongly consider incorporating connectivity and genetics into each of these Vital Signs, which carries the implication of monitoring beyond park boundaries.
Initial Vital Signs - Specific Comments: Vital Sign T13 - Native Plant Species Protection (T, E, S-o-C species)
• Incorporate Metrics into Monitoring Question. • Work inventory strategy into the Vital Sign in order to cover possibility of new finds. • Connectivity and genetics are hallmark issues for T & E – incorporate into this and other
Vital Signs? • Another T & E hallmark is the difficulty of finding T & E species and collecting quantitative
data. An important discussion point concerned whether we should emphasize species richness in trying to detect change over time – i.e., for a given park, is the number of T & E species increasing or declining?
• Another discussion point concerned lumping of Vital Signs versus splitting. Some felt that we could create a broad T & E & S-o-C Vital Sign, and allow each park to tailor it to their specific T & E & S-o-C issues/species. Others felt it made more sense to split Vital Signs out on the basis of the methods and metrics appropriate for a given species or group of species.
Vital Sign T19 - Terrestrial Vertebrate (including off-shore islets refugia) Biodiversity • Question on where to focus management and monitoring – level of population or individual?
It was noted that population level monitoring will not address connectivity issues. • This Vital Sign should include “rare” species – e.g., seabird colonies.
Vital Sign T23 - Forest Birds and Bats (includes T & E spp.) • It was again noted that Vital Sign names need to be more descriptive by incorporating key
terms from Methods and Metrics. • Habitat change monitoring/detection is a separate Vital Sign. It was noted that this fact
applies to T19 through T29 and perhaps to the Marine Vital Signs as well.

Appendix O: Part IV Vital Signs Workshops
22
• Abundance/distribution metrics may be inadequate for T & E species – need quicker, easier way to assess trends.
• Importance of acquiring metrics at meaningful resolution. Potential need for establishing presence/absence thresholds in terms of management action.
• Bat metrics are species specific – differences greatest between flying foxes versus hoary. • Census versus survey. Census (counting all individuals) may be possible for colonial
roosters. Surveys and inferential monitoring to assess abundance is practically impossible; therefore, monitoring question “Is abundance changing over time?” is unrealistic. Using surveys to obtain an index is more realistic. For example, collection of “activity measures” as an uncalibrated index of population size would allow population trend conclusions (valid only to sites where data collected). Presence/absence measures are a good way to index bat populations in Hawaii; will not address abundance, but will get at distribution.
• While the question “Has abundance declined?” can be asked for bats that can be censused (e.g., flying foxes in Guam), the realistic questions for bats that can only be index monitored (e.g., Hawaiian hoary bat) are “Has distribution changed?” or “Have they abandoned traditional ‘hot-spots’?”
Vital Sign T25 - Invertebrate Charismatic or Species of Concern and Vital Sign T26 - Seabirds (including T & E spp.) and Vital Sign T27 - Shorebirds and Waterbirds (including T & E spp.) and Vital Sign T29 - Health of T, E, S-o-C species – Terrestrial Invertebrates
• Group agreed that much of the T23 discussion points apply to all of these Vital Signs too. • Again, the group stressed that habitat change should be a separate Vital Sign. • On the one hand folks felt that demographic measures described in the Monitoring Objective
gave a better description than the Vital Sign field. On the other hand there was still general agreement that monitoring demographics for T & E species may be too difficult to achieve, and that a quicker, easier approach (e.g., presence/absence) may be preferable.
• The importance of connectivity and genetics was again noted, and the need for a comprehensive approach extending beyond park boundaries was stressed.
• While the group acknowledged the importance of drawing upon existing recovery plans for listed T & E species, there was general consensus that the scope of the Inventory & Monitoring Program objectives and methods would exceed recovery plan specifics.
Vital Sign T30 - Established Disease & Pathogens of Terrestrial Vertebrates • Folks felt that disease/pathogen source and vector are just as important as
incidence/prevalence. • Issue applies to all key species, so perhaps inappropriate in the T & E session. • As a T & E issue, the focus should be on population health, not just disease/pathogens.
Perhaps, from T & E perspective, more appropriate to focus the Vital Sign on limiting factors and to look for commonalities among T & E species.
Vital Sign T31 - Alien Incipient Disease & Pathogens of Terrestrial Vertebrates • It was generally felt that this is not a Vital Sign. It may be useful information, but what
would we measure?? • If this is to remain a Vital Sign, then it needs clarification on whether it is targeting known
disease/pathogens that have not yet been documented in the parks. But this still leaves the question of what are we measuring?
• This issue applies broadly across many species, and is not really a T & E issue. Its application to T & E would be addressed in T30, modified to focus on population health and limiting factors.

National Park Service 23
Vital Sign M20 - Marine Species Protection (T, E, S-o-C species) • Telemetry (as a monitoring method) and movements (metrics) are not monitoring; but are
research topics. • Group felt that the Monitoring Question and Vital Sign should be re-worked to address
population health of specific species or species groups. Vital Sign M16 - Health of T, E, S-o-C Species – Sea Turtles
• This VS not originally included in the T & E & S-o-C session list, but identified by session participants as belonging on that list.
• Discussion on whether to broaden this VS to encompass turtle population health, or to create a new VS addressing turtle population health.
Group Discussion on Missing Vital Signs, and/or Re-working of Vital Signs:
It was generally felt that all of the T & E & S-o-C Vital Signs, excepting T30 & T31, should be re-worked to emphasize the health of T & E species or species groups. This should involve rephrasing monitoring questions and looking for commonalities between species or species groups. Folks felt that linkages were needed between T & E health monitoring and the ecological stressors and drivers, and that we should aim to identify commonalities in limiting factors, which could then be monitored among species groups. It was acknowledged that striving to monitor species health would involve demographic measures; while possibly quite difficult to measure, a demographic approach may allow for detection of unanticipated population problems.
Some folks stressed the need for T & E & S-o-C Vital Signs to explicitly identify the goal of periodically inventorying for species not yet known to occur in a given park.
Some folks stressed the importance of connectivity and genetics issues, and encouraged us to consider a stand-alone T & E connectivity and genetics Vital Sign.
Concerns were aired about the do-ability of measuring abundance, distribution, and demographics for some T & E & S-o-C species. It was suggested that we consider focusing on the richness or diversity of T & E & S-o-C species for the parks.
There was inconclusive discussion of whether to lump or split T & E& S-o-C Vital Signs. Some felt that it make more sense to lump similar plants and fauna into fewer T & E & S-o-C health Vital Signs, focusing on larger issues such as connectivity and abundance/distribution, and let the individual parks select their species of interest/priority. Others felt that it made more sense to split out T & E & S-o-C Vital Signs along more species-specific lines, driven by specific methods and metrics. Either way, the question of how to select which species or species groups to monitor remained as a source of debate and confusion.
Some asked about park responses to indications of decline for particular T & E & S-o-C species or species groups. How will T & E & S-o-C monitoring be linked to causes of decline?
Some felt that T & E & S-o-C Vital Signs could focus on specific known limiting factors. As an example, the need for basic natural history information on the Argentine ant in order to better understand the threat to silverswords was cited.
Synthesis of Main Points from Session Comments:
People struggled with the simplicity of Vital Sign names/descriptors. It was generally felt that each Vital Sign should be titled/described using an amalgamation of the Monitoring Objective, Vital Sign, Monitoring Method, and Metrics.
Participants felt that the T & E & S-o-C Vital Signs should focus on the health of selected species or species groups rather than on numbers (i.e., abundance). This goal would require
Appendix O: Part IV Vital Signs Workshops
24
certain population demographics to be measured and/or a focus on known limiting factors. One advantage is that such measures might provide for detection of unanticipated population problems.
Conversely, measuring demographics and distribution of T & E or rare species can be extremely difficult and exorbitantly expensive. Therefore, some folks felt that we should consider a broader approach that would strive to measure the species richness or diversity of T & E & S-o-C species at each park. This approach may provide a quicker and easier basis for park management decisions, and/or serve as a pointer for more focused research questions.
The importance of connectivity and genetics for T & E and rare species was noted. It was suggested that these issues be incorporated into each of this session’s Vital Signs, or be considered as a separate Vital Sign.
Some participants stressed the need for T & E & S-o-C Vital Signs to explicitly include periodic inventories for species new to a given park.
Several of the T & E & S-o-C Vital Signs mention habitat change in their Monitoring Question. The group felt that this was a stand-alone question and should be a separate Vital Sign (though not a Vital Sign specifically categorized as T & E & S-o-C).
Several participants felt that initial Vital Signs could be lumped to create one or more broad T & E & S-o-C Vital Signs, with the caveat that each park would need to tailor the Vital Sign(s) to their specific issues/species. Others felt it made more sense to split Vital Signs out on the basis of the methods and metrics appropriate for a given species or group of species.
Responses to Main Points Raised During Session:
Aware of the simplicity of many of the descriptors in the “Vital Sign” field of our “Revised Vital Signs” table, we’ve generally been operating on the expectation that individual Vital Signs would ultimately be titled more descriptively by combining elements of the Monitoring Objectives, Monitoring Question, Monitoring Methods, and Metrics fields. While some may ask why we haven’t yet done so, the current table arrangement was convenient for organizing the Vital Signs on an ecological and ecosystem component basis, and also provided a reasonable balance between lumping potential Vital Signs according to common objectives and questions versus splitting potential Vital Signs according to methods/metrics and specific species groups. In short, Vital Sign titles/descriptors have been and will continue to evolve.
The conflict between the desire to lump Vital Signs according to objectives/questions versus the desire to split Vital Signs according to methods/metrics will continue to be problematic. Interpreting this group’s input, we feel that the best approach is to define, on the one hand, some broad Vital Signs that seek to monitor T & E & S-o-C species richness or diversity using presence/absence measures; and, on the other hand, some fairly specific Vital Signs seeking to assess population health for specific T & E & S-o-C species groups. In terms of Vital Sign selection, it may turn out that the broader presence/absence Vital Signs get included in our initial monitoring efforts, and serve to point to population health Vital Signs needing to be addressed, as well as park priorities for focused cause/effect research.
The importance of connectivity and genetics for T & E & S-o-C species was raised during this session. While we intend to include at least one Vital Sign of this nature, these issues may be more appropriate for focused research efforts, and are ideal candidates for partnerships that reach well beyond park boundaries. This is not to say that such a Vital Sign will not be included in our initial monitoring efforts; that will have to be determined through our final ranking and selection process.

National Park Service 25
While it may be reasonable to assume that the occurrence of T & E & S-o-C species not yet known to occur in a given park would be captured by Vegetation Vital Signs striving to monitor native plant communities and alien plant occurrence, we will work periodic T & E & S-o-C inventories into one or more of our T & E & S-o-C Vital Signs.
Finally, the issue of habitat change monitoring should be adequately captured in the Vegetation Vital Signs dealing with Plant Biodiversity, Long-term Plant Succession, and Recovery/Change of Native Plant Communities. We will strive to incorporate a T & E & S-o-C element into the Monitoring Objectives and/or Management Goals of these Vegetation Vital Signs.
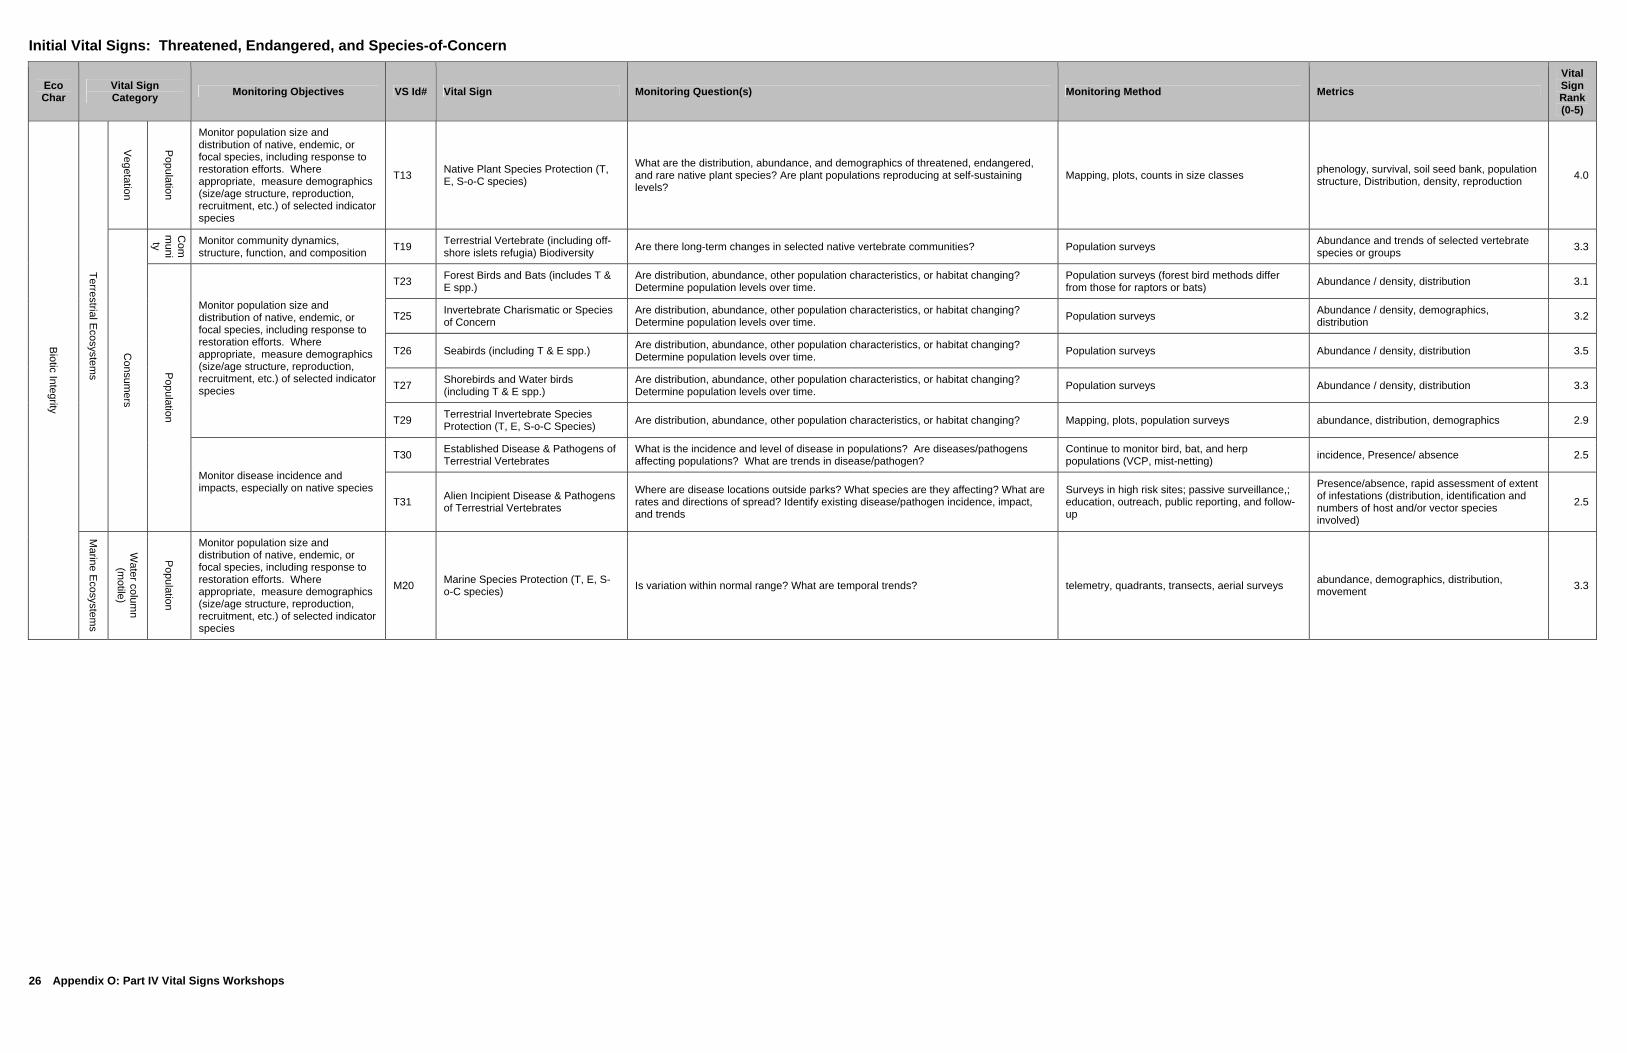
Appendix O: Part IV Vital Signs Workshops
26
Initial Vital Signs: Threatened, Endangered, and Species-of-Concern
Eco Char
Vital Sign Category Monitoring Objectives VS Id# Vital Sign Monitoring Question(s) Monitoring Method Metrics
Vital Sign Rank (0-5)
Vegetation
Population
Monitor population size and distribution of native, endemic, or focal species, including response to restoration efforts. Where appropriate, measure demographics (size/age structure, reproduction, recruitment, etc.) of selected indicator species
T13 Native Plant Species Protection (T, E, S-o-C species)
What are the distribution, abundance, and demographics of threatened, endangered, and rare native plant species? Are plant populations reproducing at self-sustaining levels?
Mapping, plots, counts in size classes phenology, survival, soil seed bank, population structure, Distribution, density, reproduction 4.0
Com
munity Monitor community dynamics,
structure, function, and composition T19 Terrestrial Vertebrate (including off-shore islets refugia) Biodiversity Are there long-term changes in selected native vertebrate communities? Population surveys Abundance and trends of selected vertebrate
species or groups 3.3
T23 Forest Birds and Bats (includes T & E spp.)
Are distribution, abundance, other population characteristics, or habitat changing? Determine population levels over time.
Population surveys (forest bird methods differ from those for raptors or bats) Abundance / density, distribution 3.1
T25 Invertebrate Charismatic or Species of Concern
Are distribution, abundance, other population characteristics, or habitat changing? Determine population levels over time. Population surveys Abundance / density, demographics,
distribution 3.2
T26 Seabirds (including T & E spp.) Are distribution, abundance, other population characteristics, or habitat changing? Determine population levels over time. Population surveys Abundance / density, distribution 3.5
T27 Shorebirds and Water birds (including T & E spp.)
Are distribution, abundance, other population characteristics, or habitat changing? Determine population levels over time. Population surveys Abundance / density, distribution 3.3
Monitor population size and distribution of native, endemic, or focal species, including response to restoration efforts. Where appropriate, measure demographics (size/age structure, reproduction, recruitment, etc.) of selected indicator species
T29 Terrestrial Invertebrate Species Protection (T, E, S-o-C Species) Are distribution, abundance, other population characteristics, or habitat changing? Mapping, plots, population surveys abundance, distribution, demographics 2.9
T30 Established Disease & Pathogens of Terrestrial Vertebrates
What is the incidence and level of disease in populations? Are diseases/pathogens affecting populations? What are trends in disease/pathogen?
Continue to monitor bird, bat, and herp populations (VCP, mist-netting) incidence, Presence/ absence 2.5
Terrestrial Ecosystem
s
Consum
ers
Population
Monitor disease incidence and impacts, especially on native species
T31 Alien Incipient Disease & Pathogens of Terrestrial Vertebrates
Where are disease locations outside parks? What species are they affecting? What are rates and directions of spread? Identify existing disease/pathogen incidence, impact, and trends
Surveys in high risk sites; passive surveillance,; education, outreach, public reporting, and follow-up
Presence/absence, rapid assessment of extent of infestations (distribution, identification and numbers of host and/or vector species involved)
2.5
Biotic Integrity
Marine E
cosystems
Water colum
n (m
otile)
Population
Monitor population size and distribution of native, endemic, or focal species, including response to restoration efforts. Where appropriate, measure demographics (size/age structure, reproduction, recruitment, etc.) of selected indicator species
M20 Marine Species Protection (T, E, S-o-C species) Is variation within normal range? What are temporal trends? telemetry, quadrants, transects, aerial surveys abundance, demographics, distribution,
movement 3.3

National Park Service 27
Revised Vital Signs: Threatened, Endangered, and Species-of-Concern
Eco Char Vital Sign Category Monitoring Objectives VS Id# Vital Sign Monitoring Question(s) Monitoring Method Metrics
Track the number of Threatened, Endangered, and Species-of-Concern species (plant, terrestrial vert, and marine) in each park as a measure of T, E, SoC species richness. Provide park managers with a quick, easy point of reference for management decisions, and/or to point to more focused monitoring or research needs.
New T, E, S-o-C Species Richness (Plant, Terr Vert, Marine)
Are the numbers of Threatened, Endangered, and Species-of-Concern species represented in each park increasing, decreasing, or steady?
Presence/absence surveys, with periodic inventory for new T, E, S-o-C species. Consider including "rare" species as well. presence/absence.
Vegetation
Population
Monitor population health of native, endemic, or focal species through measurement of demographics (size/age structure, reproduction, recruitment, etc.) for selected species; and identification of disease, pathogen, or other threats.
T13 Native Plant Species Protection (can include T, E, S-o-C species)
Are the demographics of threatened, endangered and rare native plant species changing? If so, are changes deleterious, and can we control or reduce threats to these populations?
Mapping, plots, counts in size classes phenology, survival, soil seed bank, population structure, density, reproduction
Com
munity
Monitor community dynamics, structure, function, and composition of selected communities within defined geographic areas. Periodically inventory to document new species in parks. Where appropriate, parks may emphasize off-shore islet refugia.
T19 Terrestrial Vertebrate Biodiversity (including off-shore islets refugia)
Are selected native vertebrate communities or guilds changing? This includes changes in abundance of selected species (determined from population surveys), and/or changes in the identity and number of species present in the community or guild of interest (determined from presence/absence monitoring).
Population surveys, presence/absence surveys. Periodic inventory for new T, E, S-o-C species. Emphasis includes seabird colonies.
Within defined areas or specified communities: abundance and trends of selected vertebrate species or groups, species richness.
T23 Forest bird and Bat Population Health (can include T & E spp.)
Are the demographics of selected forest bird and bat species changing? If so, are changes deleterious, and can we control or reduce threats to these populations?
Population surveys, including demographic measures (size/age structure, reproduction, recruitment, etc.) and prevalence of disease, pathogens, and/or population threats. (Forest bird methods differ from those for raptors or bats; and fruit bat methods will differ from insectivorous bats.)
Population demographics, density, distribution. Prevalence of disease, pathogens, other population threats.
T26 - T27 combined
Seabird, Shorebird, Waterbird Population Health (can include T & E spp.)
Are the demographics of selected seabird, shorebird, and waterbird species changing? If so, are changes deleterious, and can we control or reduce threats to these populations?
Population surveys, including demographic measures (size/age structure, reproduction, recruitment, etc.) and prevalence of disease, pathogens, and/or population threats. (Methods will differ for seabirds, shorebirds, and waterbirds.)
Population demographics, density, distribution. Prevalence of disease, pathogens, other population threats.
Terrestrial Ecosystem
s
Consum
ers
Population
Monitor population health of native, endemic, or focal species through measurement of demographics (size/age structure, reproduction, recruitment, etc.) for selected species; and identification of disease, pathogen, or other threats.
T29 Terrestrial Invertebrate Population Health (can include T & E spp.)
Are the demographics of selected terrestrial invertebrate species changing? If so, are changes deleterious, and can we control or reduce threats to these populations?
Population surveys, including demographic measures (size/age structure, reproduction, recruitment, etc.) and prevalence of disease, pathogens, and/or population threats.
Population demographics, density, distribution. Prevalence of disease, pathogens, other population threats.
Biotic Integrity
Marine
Ecosystem
s
Water
column
(motile)
Population
Monitor population health of native, endemic, or focal species through measurement of demographics (size/age structure, reproduction, recruitment, etc.) for selected species; and identification of disease, pathogen, or other threats.
M20 Marine Species Population Health (can include T & E spp.)
Are the demographics of selected marine species changing? If so, are changes deleterious, and can we control or reduce threats to these populations?
Population surveys, including demographic measures (size/age structure, reproduction, recruitment, etc.) and prevalence of disease, pathogens, and/or population threats.
Population demographics, density, distribution. Prevalence of disease, pathogens, other population threats.

Appendix O: Part IV Vital Signs Workshops
28
Air Quality / Climate Topical Session
Participants:
Karin Schlappa (facilitator) Fritz Klasner (notes) JP Michaud Tom Giambelluca John Barnes Lisa Young Priscilla Hill Roy Irwin David Foote Tamar Elias
Session Notes:
As there were not very many vital signs for this session, we did not divide them up into 2 groups (ones that were acceptable as is and ones that needed changes) as suggested by the agenda. We pretty much covered them in order. We did not cover P10 as none of the attendees was an expert on the subject. P10 was later covered in the marine intertidal session. Many of the comments were general in nature, and are covered in a general comments section following the specific comments.
Initial Vital Signs - Specific Comments: Vital Sign P1 – Visibility
• specify light extinction in monitoring question column • Methods: existing methods conform to legal programs. Real time readings such as
nephelometer would provide a broader range of information • The Hawaii state DOH is particularly interested in monitoring visibility since they cover
Clean Air Act (CAA) related mandates Vital Sign P2 – Atmospheric Deposition, wet (incl. occult) and dry
• Change monitoring question to a question, right now it is a statement. • What are the concerns regarding Hg? Why is it included as a metric (sulfates also and carbon) • Coincident water quality monitoring may help address issues. • This Vital sign was divided up between P3 & P5, and a new Vital Sign was created. See
“Additional Changes..” below. Vital Sign P3 – Atmospheric Gases: Climate Change Indicators, Human Pollutants, Natural-Volcanic
• Ozone and NOx may not be as valuable as aerosols (marine as well as bio aerosols) • The Hawaii state DOH is particularly interested in monitoring this since they cover CAA
related mandates. Vital Sign P4 – Marine Aerosols
• This Vital Sign was lumped with P5. See “Additional Changes..” below. Vital Sign P5 – Atmospheric Particulates: Climate Change Indicators, Human Pollutants, Natural-
Volcanic • The Hawaii state DOH is particularly interested in monitoring this since they cover CAA
related mandates. • Rewording of Vital Sign, Monitoring Question, Methods and Metrics. See “Additional
Changes..” below. Vital Sign P6 – Solar Radiation
• Changes in Methods and Metrics. See “Additional Changes..” below.

National Park Service 29
Vital Sign P7 – Weather & Climate • The Hawaii state DOH is interested in the results of the weather monitoring since
meteorological parameters are needed to model long range transport, which is something the DOH will be undertaking.
Vital Sign P8 – Extreme events (weather & ocean) • Changes in Vital Sign, Monitoring Question, Methods and Metrics. See “Additional
Changes..” below. Vital Sign P9 – Climate Representations – 2- & 3- dimensional
• Changes in Monitoring Question and Metrics. See “Additional Changes..” below. Vital Sign P10 – Ocean/Physical Dynamics: Currents, Sea Level, Tides/Swell
• This was covered in the marine intertidal session comments are included in notes for that session.
General Comments / Feedback:
• Change ‘metrics’ column heading to ‘metrics and measures’. • Emphasize significance of elevation range in parks (especially for high elevation parks). • Priorities
Priorities and methods need customization based on individual park settings (this comment came up with several vital signs)
When prioritizing look for relationship to other monitoring efforts and consider connection between toxicity and abundance (why monitor something that is abundant but has very low toxicity or, if a species is very toxic, monitor it even if it has low abundance or occurs only intermittently)
• Methods consider adding satellite systems and lidar
• Partners NOAA – CMDL in AS aerosols, greenhouse gases, solar radiation, Metrological
data, LIDAR measurements: details on internet DOH – Air Quality reports on internet T. Giambelluca, UH – HALENet (established) , HAVONet (in process of setting up),
American Samoa (planned), online info When arranging for partnerships for monitoring emphasize the advantage that there is
limited potential for development in parks. HAVO: advantage of AQ monitoring is that we are basically dealing with a single
pollutant, cause-effect relationships much easier to discern than in situations with multiple (anthropogenic) pollutants
• Further Resources look into ‘climate friendly parks initiative’ look into ‘NOAA climate reference network’
• Suggestions for new Vital Signs or rewriting of existing Vital Signs to include: air quality monitoring in conjunction with fires. measuring health effects of (HAVO) air quality. tracking of ENSO/PDO, climate variability (spatial and temporal) refined aerosol chemistry, particularly event chemistry periodic monitoring of trace aerosols or trace gases or other naturally generated
pollutants. (Possible contact for this type of monitoring: Ginger Garrison, USGS)

Appendix O: Part IV Vital Signs Workshops
30
Synthesis of Main Points from Session Comments:
In this session we received many constructive comments and suggestions. We have used these in editing the Vital Signs, Monitoring Objectives, and Monitoring Questions. We also incorporated suggestions for Monitoring Methods and Metrics. These latter fields, in particular, will continue to evolve.
Suggestions regarding further resources, partnering opportunities will be explored. Several new Vital Signs were suggested by participants. In evaluating these we had to
consider the definition of Vital Signs. Vital signs, as used by the National Park Service, are a subset of the physical, chemical and biological elements and processes of park ecosystems that are selected to represent the overall health or condition of park resources…..the elements and processes that are monitored are a subset of the total suite of natural resources that park managers are directed to preserve (Inventory & Monitoring glossary). There are hundreds of potential Vital Signs, I & M staff is carefully weighing issues to distinguish between monitoring questions for Vital Signs and research questions.
Responses to Main Points Raised During Session:
• Air quality monitoring for fires
Fires are infrequent in most parks. To ensure health and human safety the adopted method of closing roads and trails based on extent of the burning area and weather conditions has proven effective. At HAVO, where fires sometimes burn large areas and persist for a long time, the effect of fire on biogeochemical cycles can to some extent be monitored via the ongoing (CAA mandated) air quality monitoring.
• Measuring Health effects of (HAVO) air quality:
In consideration of the above mentioned limitations in the selection of Vital Signs we came to the conclusion that this is more of a research question and thus does not qualify as a Vital Sign. However, this does not preclude cooperation between air quality monitoring programs and health studies conducted by University research groups, the Department of Health or other agencies.
• Tracking ENSO/PDO:
This is part of Vital Sign P8 under and was described under ‘metrics’, we rewrote P8 to make it more obvious that these long term patterns are included in this Vital Sign.
• Refined aerosol chemistry particularly event chemistry:
In consideration of the above mentioned limitations in the selection of Vital Signs we came to the conclusion that this is more of a research question and thus does not qualify as a Vital Sign.
• Periodic monitoring of trace gases and aerosols:
We rewrote methods and metrics for Vital Signs P3 and P5 to include this
• Vital Sign P10 (Ocean physical dynamics) (discussed in intertidal session):
Currents were removed from this Vital Sign as several participants remarked that nearshore currents were much to variable to yield any useful information.

National Park Service 31
Response to suggestions regarding priorities and methods:
Not all the Vital Signs will be monitored in all the parks. Some will be monitored throughout the PACN, others will only be monitored in one or a few of the parks. Selection will be based on several criteria, including individual park rankings. A draft description of the selection process is found at the end of this document, and will be described in the next version of the monitoring plan.
Selection of Vital Signs and/or methods will include considerations of toxicity and abundance of a given species and usefulness of monitoring efforts given other ongoing monitoring efforts by NPS or other agencies, institutions.
The challenge for us in writing up the details for the Vital Signs (metrics, methods, etc.) is in presenting them in a way that makes them applicable for all parks in the PACN and, if a Vital Sign is monitored in several parks, ensures that monitoring methods are consistent and results will be comparable. At the same time, wording needs to leave enough flexibility to customize methods, etc. to be most useful for individual park requirements. Monitoring methods will be described in detail in the monitoring plan.
Additional Changes (not based on feedback received in workshop):
After doing further research we also decided on making the following changes to the initial list of Vital Signs presented at the meeting:
• Vital Sign P4 (marine aerosols) was eliminated as a separate Vital Sign but was included in P5 (atmospheric particulates)
• Vital Sign P2 (atmospheric deposition) was divided up as follows: dry deposition was included in P3 (atmospheric gases) and P5 (atmospheric particulates) since deposition estimates are in essence calculations based on meteorological data and the concentrations measured for P5. The monitoring questions and objectives were rewritten to reflect that deposition is now included in these Vital Signs. Furthermore, wet deposition and fog (cloud water) deposition were separated into two Vital Signs since some parks may be interested in precipitation chemistry but not fog chemistry.
• Vital Sign P5, P8 questions regarding impacts were removed from the monitoring questions section because they represent research questions that were not meant to be addressed by these Vital Signs.
• Vital Sign P9 the monitoring question was turned into the monitoring objective and new questions were written.
• In addition several minor changes were made to monitoring objectives, questions, methods and metrics for all the Vital Signs (P1-P10). Generally this involved adding methods for metrics that were listed, or correcting mistakes such as methods listed in metrics section or vice versa, removing metrics from Monitoring Objectives, etc.

Appendix O: Part IV Vital Signs Workshops
32
Initial Vital Signs: Air Quality/Climate
Eco Char
Vital Sign Category Monitoring Objectives VS
Id# Vital Sign Monitoring Question(s) Monitoring Method Metrics Vital Sign Rank (0-5)
Monitor visibility P1 Visibility Is sight distance, extinction, and quality reduced? Aerosol filters, cameras sight distance (extinction coefficient), particulate concentration, turbidity 2.9
Track rates of atmospheric deposition P2 Atmospheric Deposition: Wet (direct & occult) and Dry Document differences in Human vs. Volcanic vs. other natural sources Station data Total Hg & Hg concentration, Total N & N
concentration, Total S & S concentration 2.1
P3 Atmospheric Gases: Climate Change Indicators, Human Pollutants, Natural-Volcanic
How are atmospheric gas concentrations changing and are these changes having ecological or human health impacts? How does volcanic activity influence air quality?
Station data
Air toxics concentration/human, CO2 concentration/climate change, Nox concentration/humans, O3 concentration/humans, S concentration/volcanic
2.2
P4 Marine Aerosols How do marine aerosol levels vary over time and space? station data species, concentrations 1.4
P5
Atmospheric Particulates: Climate Change Indicators, Human Pollutants, Natural-Volcanic
How are atmospheric particulate species and concentrations changing and are these changes having ecological or human health impacts? Station data Dust, Particle analyses/species: 10-2.5-1 micron cuts,
species 2.2
Track atmospheric concentrations of particulates and gases, levels of radiation--emphasizing those with known human health or environmental impacts
P6 Solar radiation How are solar radiation inputs, UV-B, photosynthetically active radiation, or other wavelengths, fluxes changing?
UV-B monitoring (e.g. Brewer's), PAR sensors, total flux upwelling / downwelling 2.7
Monitor core weather/climate conditions within each park (on each island)
P7 Weather & Climate What are ranges of climate parameters within each park? Are they changing?
Weather stations (RAWS, COOP, NPS-ARD).
fog, wind, temperature, solar radiation, soil moisture, relative humidity, fuel moist/temp, wetness, precip (direct & occult)
3.4
Monitor frequency and intensity (severity) of extreme events (hurricanes, waves, winds, rain, etc.)
P8 Extreme events (weather & ocean)
What are impacts of extreme events? How often do they occur, and at what intensity? What are temporal trends? NOAA, USGS, NWS hurricane extent/intensities, ENSO extent/intensities,
etc 3.0
Climate & Air Quality
Identify and monitor spatial patterns of climate, such as trade-wind inversion elevation, lifting condensation level, lapse rates, etc.
P9 Climate Representations - 2- & 3- dimensional
Provide baseline data to help evaluate stability and variability in climate affecting natural populations, processes, and large scale ecological drivers?
modeling or mapping Lifting condensation Level, Temperature lapse rates, Trade-Wind Inversion, Cloud patterns (incl. radiation) 1.7
Physical / C
hemical C
onditions
Soil, Water, & Nutrient Dynamics
Monitor physical ocean dynamics--ocean currents, sea level, tides/swell P10 Ocean/Physical Dynamics:
Currents, Sea Level, Tides/Swell Is variation within normal range? What are temporal trends? Tide Gauge, GIS, Buoy data, satellite data
buoy data, instrument data, Mapping velocity and direction, maximum signal wave height, satellite data, sea level, flood timing / magnitude, tide fluctuations
2.7
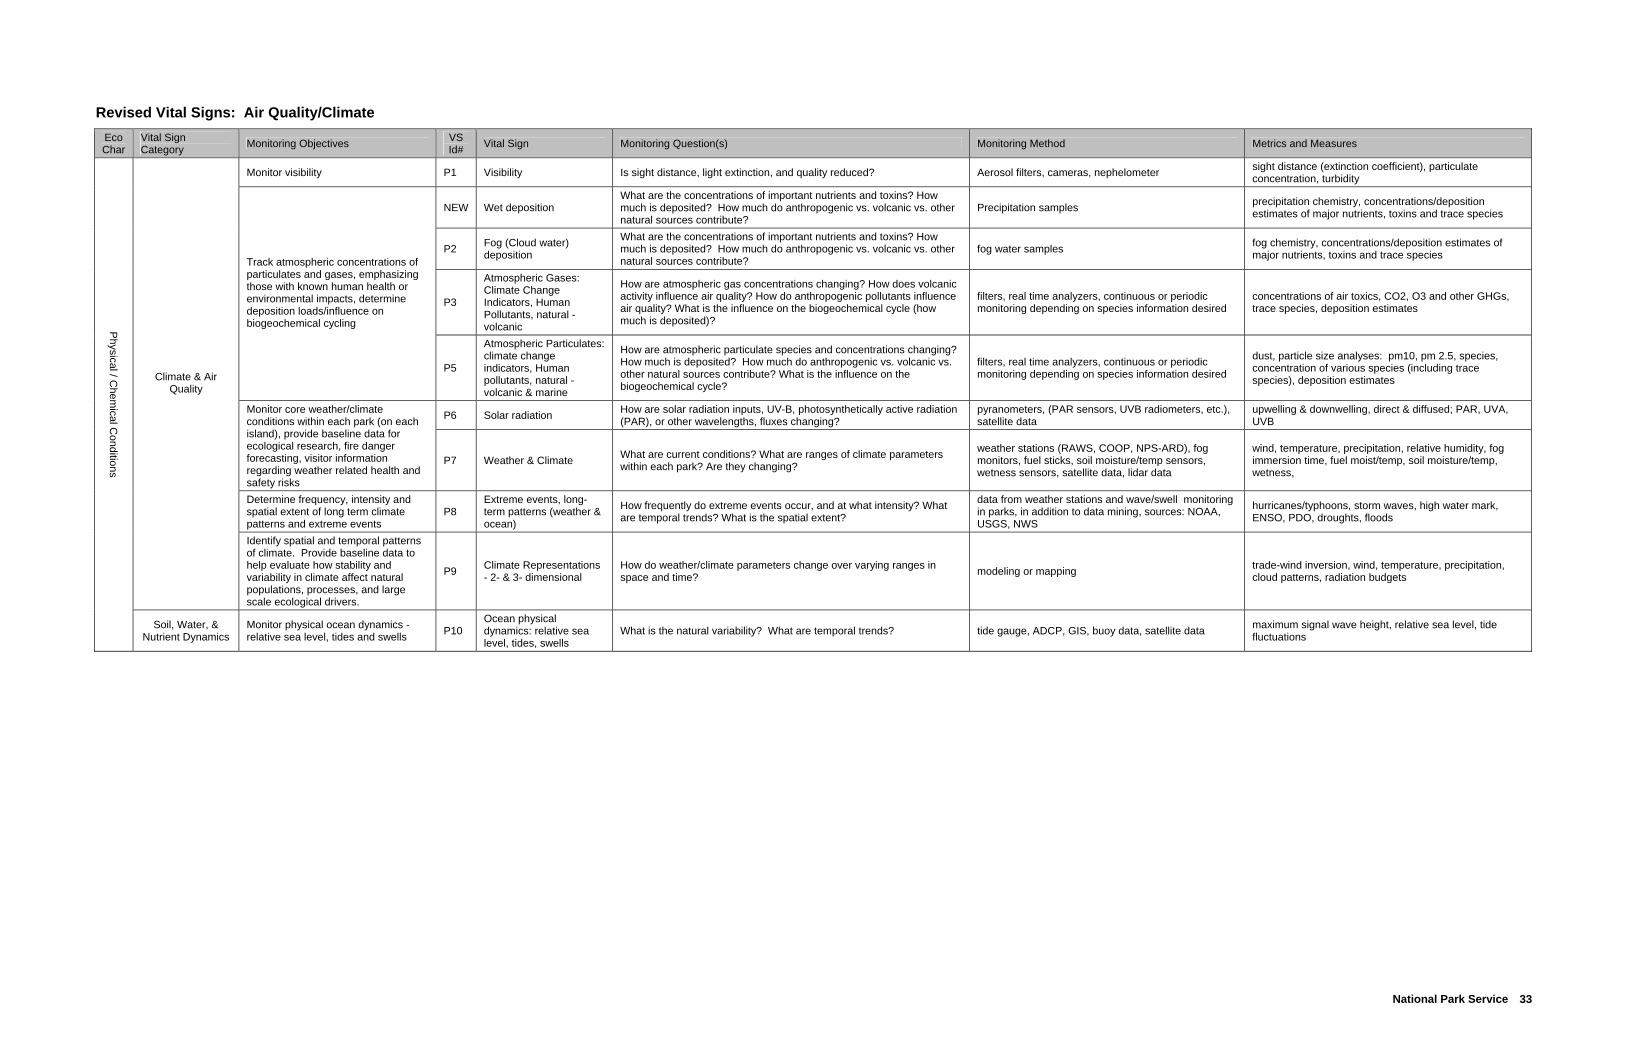
National Park Service 33
Revised Vital Signs: Air Quality/Climate Eco Char
Vital Sign Category Monitoring Objectives VS
Id# Vital Sign Monitoring Question(s) Monitoring Method Metrics and Measures
Monitor visibility P1 Visibility Is sight distance, light extinction, and quality reduced? Aerosol filters, cameras, nephelometer sight distance (extinction coefficient), particulate concentration, turbidity
NEW Wet deposition What are the concentrations of important nutrients and toxins? How much is deposited? How much do anthropogenic vs. volcanic vs. other natural sources contribute?
Precipitation samples precipitation chemistry, concentrations/deposition estimates of major nutrients, toxins and trace species
P2 Fog (Cloud water) deposition
What are the concentrations of important nutrients and toxins? How much is deposited? How much do anthropogenic vs. volcanic vs. other natural sources contribute?
fog water samples fog chemistry, concentrations/deposition estimates of major nutrients, toxins and trace species
P3
Atmospheric Gases: Climate Change Indicators, Human Pollutants, natural - volcanic
How are atmospheric gas concentrations changing? How does volcanic activity influence air quality? How do anthropogenic pollutants influence air quality? What is the influence on the biogeochemical cycle (how much is deposited)?
filters, real time analyzers, continuous or periodic monitoring depending on species information desired
concentrations of air toxics, CO2, O3 and other GHGs, trace species, deposition estimates
Track atmospheric concentrations of particulates and gases, emphasizing those with known human health or environmental impacts, determine deposition loads/influence on biogeochemical cycling
P5
Atmospheric Particulates: climate change indicators, Human pollutants, natural - volcanic & marine
How are atmospheric particulate species and concentrations changing? How much is deposited? How much do anthropogenic vs. volcanic vs. other natural sources contribute? What is the influence on the biogeochemical cycle?
filters, real time analyzers, continuous or periodic monitoring depending on species information desired
dust, particle size analyses: pm10, pm 2.5, species, concentration of various species (including trace species), deposition estimates
P6 Solar radiation How are solar radiation inputs, UV-B, photosynthetically active radiation (PAR), or other wavelengths, fluxes changing?
pyranometers, (PAR sensors, UVB radiometers, etc.), satellite data
upwelling & downwelling, direct & diffused; PAR, UVA, UVB
Monitor core weather/climate conditions within each park (on each island), provide baseline data for ecological research, fire danger forecasting, visitor information regarding weather related health and safety risks
P7 Weather & Climate What are current conditions? What are ranges of climate parameters within each park? Are they changing?
weather stations (RAWS, COOP, NPS-ARD), fog monitors, fuel sticks, soil moisture/temp sensors, wetness sensors, satellite data, lidar data
wind, temperature, precipitation, relative humidity, fog immersion time, fuel moist/temp, soil moisture/temp, wetness,
Determine frequency, intensity and spatial extent of long term climate patterns and extreme events
P8 Extreme events, long-term patterns (weather & ocean)
How frequently do extreme events occur, and at what intensity? What are temporal trends? What is the spatial extent?
data from weather stations and wave/swell monitoring in parks, in addition to data mining, sources: NOAA, USGS, NWS
hurricanes/typhoons, storm waves, high water mark, ENSO, PDO, droughts, floods
Climate & Air Quality
Identify spatial and temporal patterns of climate. Provide baseline data to help evaluate how stability and variability in climate affect natural populations, processes, and large scale ecological drivers.
P9 Climate Representations - 2- & 3- dimensional
How do weather/climate parameters change over varying ranges in space and time? modeling or mapping trade-wind inversion, wind, temperature, precipitation,
cloud patterns, radiation budgets
Physical / C
hemical C
onditions
Soil, Water, & Nutrient Dynamics
Monitor physical ocean dynamics - relative sea level, tides and swells P10
Ocean physical dynamics: relative sea level, tides, swells
What is the natural variability? What are temporal trends? tide gauge, ADCP, GIS, buoy data, satellite data maximum signal wave height, relative sea level, tide fluctuations
Appendix O: Part IV Vital Signs Workshops
34
Invasives Topical Session
Participants:
Lloyd Loope (facilitator) Ilana Stout (notes) Steve Hess Doug Neighbor Curt Daehler Ryan Monello Dave Helweg Dan Polhemus Frank Howarth Steve Anderson Bryan Harry Joshua Seamon Anne Brasher Cathleen Bailey Rhonda Loh Eva Didonato Penny Latham Lynn Raulerson Ben Saldua Earl Campbell Julie Denslow Mindy Wilkinson W.J. Walsh Celia Smith Coleen Cory AnneMarie LaRosa Larry Basch Karen Poiani Fred Krauss Daniel Kawaiaea Pat Conant Melia Laber Linda Pratt Rob Hauff Rob Cowie
Session Notes:
The Invasives topic (which for PACN has evolved to cover detection and monitoring of targeted incipient invasive species outside park boundaries) differs dramatically from the other categories of vital signs, and the session ran differently from most other sessions. The first half of the session was devoted to general discussion of the topics of early detection/prevention, the roles of partnerships and collaboration (including examples of existing partnerships), and addressing the scope of monitoring incipients in order to make the task more feasible. An important role of early detection and monitoring is not only keeping invaders from becoming established, but also serving as a method to detect how well the prevention system is working, so as to provide the possibility of fine-tuning it. The large number of agencies interested in contributing to invasive species detection/ prevention; benefits of the island condition (discrete boundaries, and relatively small area vs. continents); and existing knowledge and methods were encouraging reminders of what we’ve got going for us.
The second half of the session was dedicated to discussing changes to existing vital signs. Some comments addressed specific signs; however, many felt that proposed vital signs were too broad in scope to be realistic goals for monitoring. Many suggestions addressed reduction of the number of incipient invasives vital signs and strategies from other agencies for reducing the scope of the task. There was a general agreement that some prioritizing of worst invaders must occur. The Nature Conservancy’s “blacklist” approach to known invasives for eradication/ containment and Hawaii Department Of Agriculture’s lists of important new pests encountered by quarantine officers were discussed as examples for narrowing search parameters and integrating detection and prevention. Early detection must be integrated with prevention; a species detected but not yet established is a prime candidate for prevention focus. Methods such as the Hawaii- Pacific Weed Risk Assessment currently exist to evaluate the potential invasiveness of individual species and could be used in generating a “watch list” or “action list.”
It was felt that there needs to be substantial refinement of the monitoring questions, methods, and metrics. In general, the concept of passive surveillance was considered inadequate as a stand-alone (though possibly a valid supplement to other techniques). A distinction between points of entry to the park and points of entry to the island was made and the cost-effectiveness of extensive monitoring outside of the park was discussed. Emphasis of “pathways of entry” rather than “points of entry” was also recommended. Three potential new vital signs were identified, two of which have been incorporated into existing signs. There was little discussion of

National Park Service 35
the rankings or ranking process but it was widely agreed that ranking of vital signs should be on a park by park basis.
It is currently within the mandate of the parks to monitor for incipient weeds outside of their boundaries, though not to control them. NPS couldn’t possibly even conceive of “going it alone” with efforts outside parks. The scope of monitoring incipient invasives on an island-wide basis will very clearly require interagency cooperation. On the other hand, it seems inconceivable that NPS should not contribute in some substantial way toward assisting in the huge, absolutely necessary effort of prevention/early detection/rapid response (if there is to be any hope sustaining remnants of native island biodiversity over the long term). Emphasis of the NPS Monitoring program on appropriate protocols and data management, as well as the inspirational NPS objective (maintaining some semblance in the parks of the original native biodiversity) provides hope that NPS can continue its illustrious tradition since about 1970 of conservation leadership in Hawaii.
Initial Vital Sign - Specific Comments: Vital Sign H4 – Alien Invasive Species Points of Entry
• Define “point of entry”. Does this mean to the park? To the island? • Addressing “all taxa” makes this vital sign too broad • There was a general feeling that , as written, this vital sign was too broad in scope, likely to
be cost-prohibitive Methods/Metrics
• NPS has no control over the metric listed (need to define “point of entry” in the monitoring question)
• Change “point of entry” to “pathway of entry” in monitoring method, monitor pathways rather than individual taxa
Vital Sign T15 – Alien Incipient Plant Disease and Pathogens • No comments
Vital Sign T17 – Alien Incipient Invasive Plants • Too restrictive- needs rewording to include emergent invasives • Is/are, one/ many species- which is it? How to decide? • Needs revision for more consistent wording in the monitoring questions • The monitoring question that begins with “Is species present…” is a strategic question rather
than a monitoring question. Needs evaluation, rewording. Methods/ Metrics
• Define passive surveillance. What about active surveillance? • Proposed 2-pronged approach for incipient weeds:
• 1) monitoring Pathways & Ports of Entry • 2) monitoring specific buffer zone around areas of special concern within the
park • “Rapid assessment of extent of infestation” is not a metric
Vital Sign T31 - Alien Incipient Disease & Pathogens of Terrestrial Vertebrates • Needs revision for more consistent wording in the monitoring questions
Methods/ Metrics • Define passive surveillance. What about active surveillance?

Appendix O: Part IV Vital Signs Workshops
36
Vital Sign T37 - Alien Incipient Invasives – Predatory Terrestrial Vertebrates • Predatory terrestrial vertebrates vs. vertebrates (T40) in general? Needs clarification &
distinction or combination • Needs revision for more consistent wording in the monitoring questions • The monitoring question that begins with “Is species present…” is a strategic question rather
than a monitoring question. Needs evaluation, rewording. Methods/Metrics
• Define passive surveillance. What about active surveillance? • “Rapid assessment of extent of infestation” is not a metric
Vital Sign T38 – Alien Incipient Invasives – Fungi • Needs revision for more consistent wording in the monitoring questions • The monitoring question that begins with “Is species present…” is a strategic question rather
than a monitoring question. Needs evaluation, rewording. Methods/Metrics
• Define passive surveillance. What about active surveillance? • “Rapid assessment of extent of infestation” is not a metric
Vital Sign T39 – Alien Incipient Invasives - Terrestrial Invertebrates • Needs revision for more consistent wording in the monitoring questions • The monitoring question that begins with “Is species present…” is a strategic question rather
than a monitoring question. Needs evaluation, rewording. Methods/Metrics
• Define passive surveillance. What about active surveillance? • “Rapid assessment of extent of infestation” is not a metric • Alien Invertebrate monitoring methods;(Pat Conant comments written up on board after
session) • Partner with other agencies to expand insect light trapping network-Need taxonomists to ID • Identify host plants of pacific rim evil phytophages - target your surveys to those
Vital Sign T40 – Alien Incipient Invasives – Vertebrates • Predatory terrestrial vertebrates (T37) vs. vertebrates in general? Needs clarification &
distinction or combination • Needs revision for more consistent wording in the monitoring questions • The monitoring question that begins with “Is species present…” is a strategic question rather
than a monitoring question. Needs evaluation, rewording. Methods/Metrics
• Define passive surveillance. What about active surveillance? • “Rapid assessment of extent of infestation” is not a metric
Vital Sign F6 – Alien Incipient Invasives- Predatory Freshwater (vertebrate & invertebrate) • Research need: must characterize existing native communities first , before can address
invasives • The monitoring question that begins with “Is species present…” is a strategic question rather
than a monitoring question. Needs evaluation, rewording. Vital Sign M10 – Alien Incipient Coral Disease and Pathogens
• Research need: must characterize existing native communities first , before can address invasives

National Park Service 37
• Detection systems can work where the native community is already understood Vital Sign M12 – Alien Incipient Invasives - Benthic Marine
• Research need: must characterize existing native communities first , before can address invasives
• The monitoring question that begins with “Is species present,…” is a strategic question rather than a monitoring question. Needs evaluation, rewording.
• Detection systems can work where the native community is already understood Vital Sign M21 - Alien Incipient Invasives-Water Column Marine
• Research need: must characterize existing native communities first , before can address invasives
• The monitoring question that begins with “Is species present,…” is a strategic question rather than a monitoring question. Needs evaluation, rewording.
• Detection systems can work where the native community is already understood Vital Sign M28 – Alien Incipient Invasives – Intertidal Marine
• Research need: must characterize existing native communities first , before can address invasives
• The monitoring question that begins with “ Is species present,…” is a strategic question rather than a monitoring question. Needs evaluation, rewording.
• Detection systems can work where the native community is already understood Email comment:
“It's not clear to me that the work on the vital signs to date has done much more than list every possible thing that can be monitored in a natural ecosystem. This was certainly clear in the incipient invasives list, which seem to include all possible exotic life forms in all ecosystems and their interactions to the geographic boundary (and, for marine work, beyond) of the island. I am sure there are folks thinking critically about how to shorten that list, but it was not apparent to me. I think you have the majority of your work ahead of you.”
Potential New Vital Signs:
• Invertebrate disease (e.g. Bacillus thuringensis) • Need to include program for looking at novel invasives • Suggestion for a vital sign that monitors education/ public awareness of the invasive species
problem in the surrounding community (argument was for using the public as a ‘partner’ for prevention detection of incipient invasives)( L. Raulerson)
Ranking/Priorities:
• needs to be park by park
General Comments:
Species that bring along secondary invasives should have high priority
• “more bang for your buck” in addressing species that bring along secondary invasives • Concern about redundancy in vital signs • all vital signs for this session were concerned with incipients, and there was concern that
PACN needs to address management effectiveness on established invasives and the impacts of established invasives also (covered in other sessions)

Appendix O: Part IV Vital Signs Workshops
38
The park service has mandate to monitor outside of the park but not to control outside of
the park- NPS is seeking an exception for the state of Hawaii (Bryan Harry) Monitoring of incipient species outside the park is likely to be prohibitively expensive
and will require partnerships. Suggestion that incipients outside of the park be part of a targeted management response
rather than vital signs monitoring. Suggestion that vital signs monitoring teams working around other topics be trained/
authorized to identify and pull incipient aliens as they find them in the course of their other work. Monitoring techniques that are usually used for sampling rare incipients may be
inappropriate over a broad area (i.e. around the park boundary). Penny Latham reported that an NPS national I&M working group has addressed what is
appropriate use of monitoring for invasive species. They recognize four important uses:
• Early Detection • Predictive Modeling • Effectiveness Modeling • Biotic Secondary Effects of Invasive Species
Various networks are considering collaborative work outside park boundaries, but no network has actually stepped forward with this strategy yet. The mainland paradigm being considered involves working with partners for early detection within a buffer area around a park.
Need for Adaptive Monitoring and Management of Invasives
• Need to re-inventory/reevaluate existing knowledge of threats after the monitoring program has started
• Need to consider outside sources (partners), as ongoing monitoring within the park may not pick up new threats
• Timeframe for reevaluation of the program will differ for marine, terrestrial, freshwater systems
Partnerships:
• Mechanisms are already in place for an early warning system for Marine invasives if supported by NPS and other agencies ( e.g. shipping community – when boats are pulled into dry dock; Homeland Security measures)
• There was repeated emphasis on partnerships for monitoring points of entry • Partnerships should include communication on what is likely to be invasive to a new area and
sharing of lists of detection/prevention/eradication priorities
Other:
A workshop on the topic of “Toward an interagency system of early detection” has been proposed for the 2004 Hawaii Conservation Conference, June 29-30.
Ellen Van Gelder is currently funded by NPS to produce a review of what early detection work is currently being done by various agencies in Hawaii, New Zealand and elsewhere in the Pacific.

National Park Service 39
Synthesis of Main Points from Session Comments, and Responses:
As a result of participant feedback, there have been significant changes to the invasives group vital signs. The 13 initial vital signs (8 terrestrial, 4 marine, 1 freshwater) have been reorganized into 8 vital signs (5 terrestrial vital signs, 2 marine vital signs and 1 freshwater). Recommendations for more specific methods and metrics have been incorporated into existing signs and monitoring questions have been revised to be consistent across signs.
It should be noted that vital signs discussed in this session were only those concerned with incipient invasive species. Vital signs that address established invasive species, management effectiveness and impacts of established invasives were discussed in taxa- or community-specific sessions.
In the interest of cost-effectiveness and feasibility for this program it was determined that ”point-of-entry” and “high-risk areas” for the vital signs program might sometimes and for some taxa be island-wide and at other times and for other taxa might refer to the park and its adjacent areas rather than the island as a whole. Early detection/prevention will require that NPS engage with other federal and state agencies (FWS, USGS, USDA-FS, USDA-APHIS, HDOA, DLNR, HDOH, AS-DMWR, SPREP, etc.) toward a common vision for a Hawaii statewide interagency network for early detection of high-risk, high-impact invasive species.
In general, vital signs for terrestrial ecosystems with similar methods/ metrics have been combined. The vital signs for Predatory Terrestrial Vertebrates (T37) and Vertebrates in general (T40) have been combined into one vital sign, as have Alien Incipient Invasives – Fungi (T38) and Alien Incipient Invasive - Plants(T17). The incipient disease & pathogens vital signs for plants and vertebrates have been combined into one vital sign that also includes invertebrate disease (T31). The resulting Terrestrial Ecosystems vital signs following reorganization are: 1) Alien Incipient Invasives- Points/ Pathways of Entry; 2) Alien Incipient Invasives-Plants & Fungi; 3) Alien Incipient Invasives- Terrestrial Vertebrates; 4) Alien incipient Invasives- Terrestrial Invertebrates; 5) Alien incipient Disease and pathogens (Plants, Invertebrates & Vertebrates).
Invasive group vital signs overlapped with multiple other sessions, and changes made in these other sessions have been incorporated. Please refer to the Marine, Invertebrate and Freshwater sections of this document for further discussion of changes made by these groups.
Considerable changes have been made to monitoring questions, methods, metrics, and research needs sections. Several of these changes were directed towards making the monitoring task more manageable in scope. The necessity for developing a targeted “blacklist” or “action list” of worst habitat modifiers has been included in several signs. This list will need to be continually revised as the monitoring program progresses,and existing knowledge of threats change. This will require cooperation with outside agencies as ongoing monitoring may fail to pick up new threats. It may be appropriate to give higher priority to species that bring along secondary invasives. Methods for developing and maintaining this list will be addressed in protocol development.
The proposal that other monitoring teams be trained/authorized to ID and to pull incipient aliens as they are found will be passed on to other workgroups and addressed during the protocol development phase.
The proposed novel invasives and invertebrate disease vital signs have been included in existing vital signs. The proposal for vital sign monitoring of education/public awareness of the invasive species problem has not been incorporated at this time (it doesn’t fit well), though it is clearly a crucial consideration for NPS and its partners. Currently, Hawaii’s Coordinating Group

Appendix O: Part IV Vital Signs Workshops
40
on Alien Pest Species (CGAPS) has underway a research project to determine public knowledge and attitudes from randomly selected participants in focus groups. NPS is already involved, as are its partners, in efforts to promote better understanding of natural resource issues in Hawaii and the Pacific, including invasive species. (For example, see www.hear.org/hoike).
Several research needs were identified during the session. Marine and freshwater communities will need better characterization of native communities before invasives can be addressed. Identification of potential host plants for diseases (e.g., sudden oak death) or phytophagous insects looming in Pacific Rim states and countries, for example, could enable targeted surveys for incipient invertebrate species. And it is clear that the fine-scale monitoring usually used in vital sign monitoring within parks may be inappropriate for larger areas. Drastically different monitoring techniques and work with partners will be necessary if this type of monitoring is to take place. For example, experience from the USGS brown tree snake research program highlights essential ingredients of a program to detect rare objects. Outreach and database systems to encourage and record reporting are crucial, as are standard protocols for detecting new plant, invertebrate, and vertebrate pests.

National Park Service 41
Initial Vital Signs: Invasives
Eco Char
Vital Sign Category Monitoring Objectives VS
Id# Vital Sign Monitoring Question(s) Monitoring Method Metrics Vital Sign Rank (0-5) activi
ties &
cultul Land Use Monitor points of entry for invasive
species H4 Alien Invasive Species Points of Entry
What are points of entry for invasive species, ALL taxa? What species are being introduced--reaching the islands? Point / port of entry monitoring Number, identification of species detected /
interdicted 3.4
T15 Alien Incipient Plant Disease & Pathogens
Where are disease locations outside parks? What species are they affecting? What are rates and directions of spread? Identify existing disease/pathogen incidence, impact, and trends?
2.6
Vegetation
Population
Monitor occurrence of non-established (incipient) invasive species
T17 Alien Incipient Invasive Plants
Is species present, if so what is the nature and extent of infestation? What are the most effective strategies for detecting and preventing new invasives species? Where should efforts be focused? What are potential impacts?
Passive surveillance and follow-up; surveys in high- risk sites (e.g. roadsides, trails, ports, disturbed sites)
Presence/ absence, rapid assessment of extent of infestation 3.7
Monitor disease incidence and impacts, especially on native species T31
Alien Incipient Disease & Pathogens of Terrestrial Vertebrates
Where are disease locations outside parks? What species are they affecting? What are rates and directions of spread? Identify existing disease/pathogen incidence, impact, and trends
Surveys in high risk sites; passive surveillance,; education, outreach, public reporting, and follow-up
Presence/absence, rapid assessment of extent of infestations (distribution, identification and numbers of host and/or vector species involved)
2.5
T37 Alien Incipient Invasives - Predatory Terrestrial Vertebrate
Is species present, if so what is the nature and extent of infestation? What are the most effective strategies for detecting and preventing new invasives species? Where should efforts be focused? What are potential impacts?
Passive surveillance and follow-up on reports; education, outreach, and public reporting; surveys in high- risk sites
Predator population indices, presence/ absence, rapid assessment of extent of infestation 3.3
T38 Alien Incipient Invasives - Fungi
Is species present, if so what is the nature and extent of infestation? What are the most effective strategies for detecting and preventing new invasives species? Where should efforts be focused? What are potential impacts?
Passive surveillance and follow-up on reports; education, outreach, and public reporting; surveys in high- risk sites
distribution, Presence/ absence, rapid assessment of extent of infestation 2.0
T39 Alien Incipient Invasives - Terrestrial Invertebrates
Is species present, if so what is the nature and extent of infestation? What are the most effective strategies for detecting and preventing new invasives species? Where should efforts be focused? What are potential impacts?
Passive surveillance and follow-up on reports; education, outreach, and public reporting; surveys in high- risk sites
distribution, Presence/ absence, rapid assessment of extent of infestation 2.2
Terrestrial Ecosystem
s
Consum
ers
Population
Monitor occurrence of non-established (incipient) invasive species
T40 Alien Incipient Invasives - Vertebrates
Is species present, if so what is the nature and extent of infestation? What are the most effective strategies for detecting and preventing new invasives species? Where should efforts be focused? What are potential impacts?
Passive surveillance and follow-up; surveys in high- risk sites
distribution, Presence/ absence, rapid assessment of extent of infestation 2.6
er E
cosyste
Consum
ers
Populatio
n
Monitor occurrence of non-established (incipient) invasive species
F6
Alien Incipient Invasives - Predatory Freshwater (vertebrate and invertebrate)
Is species present, if so what is the nature and extent of infestation? What are the most effective strategies for detecting and preventing new invasives species? Where should efforts be focused? What are potential impacts?
Periodic sampling of freshwater habitats outside of parks abundance, Distribution 2.8
Monitor disease incidence and impacts, especially on native species M10 Alien Incipient Coral
Disease & Pathogens
Where are disease locations outside parks? What species are they affecting? What are rates and directions of spread? Identify existing disease/pathogen incidence, impact, and trends
Transects, quadrants (photo, video), mapping, incidence, modeling
Disease rates, occurrence, vectors, recruitment rates 2.5 B
enthic
Population
Monitor occurrence of non-established (incipient) invasive species
M12 Alien Incipient Invasives - Benthic Marine
Is species present, if so what is the nature and extent of infestation? What are the most effective strategies for detecting and preventing new invasives species? Where should efforts be focused? What are potential impacts?
transects, quadrants, mapping abundance, demography, distribution 2.8
Water
Colum
n (m
otile)
Population
Monitor occurrence of non-established (incipient) invasive species
M21 Alien Incipient Invasives - Water Column Marine
Is species present, if so what is the nature and extent of infestation? What are the most effective strategies for detecting and preventing new invasives species? Where should efforts be focused? What are potential impacts?
Transects, quadrants, tows, traps abundance, demography, distribution 2.1
Biotic Integrity
Marine E
cosystems Intertid
al
Population
Monitor occurrence of non-established (incipient) invasive species
M28 Alien Incipient Invasives - Intertidal Marine
Is species present, if so what is the nature and extent of infestation? What are the most effective strategies for detecting and preventing new invasives species? Where should efforts be focused? What are potential impacts?
Transects, quadrants, mapping, vectors, traps abundance, demography, distribution 2.6

Appendix O: Part IV Vital Signs Workshops
42
Revised Vital Signs: Invasives Eco Char
Vital Sign Category
Monitoring Objectives
VS Id# Vital Sign Monitoring Question(s) Monitoring Method Metrics COMMENTS / NOTES Research Needs
Hum
an activities &
cultural practices
Land Use
Monitor points and pathways of entry to the park for invasive species
H4
Alien Invasive Species Points/Pathways of Entry
How are invasive species getting to the country/state/island/park? What potential high-impact species have breached the border-protection system and have potential to reach the park?
Identify existing and new points & pathways of entry. Monitor for incipient species along known points/ pathways of entry. Identify targeted "blacklist" species of concern that warrant eradication/containment.
Presence-absence, identification & distribution of targeted "blacklist" species & other novel (previously undetected) invasives.
Partnerships with other agencies are necessary for 1) monitoring points/pathways of entry to the island as a whole 2) identifying species likely to reach the park 3) Determining a "blacklist" of worst habitat modifiers for eradication/ containment priorities.
Review and select among protocols used in Pacific area and elsewhere. If necessary, develop original protocols.
Producers
Population
Monitor occurrence of non-established (incipient) invasive species
T17 Alien Incipient Invasive Plants & Fungi
What potential high-impact species have breached the border-protection system and have potential to reach the park? What is the nature and extent of infestation? Is eradication/containment feasible and where should efforts be focused? What are potential impacts?
1) monitoring of pathways and ports of entry: surveys in high- risk sites (eg. roadsides, trails, ports, disturbed sites) AND 2) monitoring of specific buffer zone around areas of special concern within the park; rapid assessment of extent of infestation
Presence-absence, identification & distribution of targeted "blacklist" species & other novel (previously undetected) invasives.
Partnerships with other agencies are necessary for 1) identifying species likely to reach the park 2) determining worst habitat modifiers for eradication/containment priorities 3) covering appropriate ground. T38 has been combined with this vital sign.
Review and select among protocols used in Pacific area and elsewhere. If necessary, develop original protocols.
Monitor disease incidence and impacts, especially on native species
T31
Alien Incipient Disease & Pathogens (Plants , invertebrates & vertebrates)
What potential high-impact species have breached the border-protection system and have potential to reach the park? What species are they affecting? What are rates and directions of spread? Is eradication/containment feasible and where should efforts be focused?
Surveys in high risk sites; rapid assessment of extent of infestations passive surveillance; education, outreach, public reporting, and follow-up.
Presence-absence, identification & distribution of targeted "blacklist" species & other novel (previously undetected) invasives along with host and/or vector species involved)
T15 has been combined with this sign Review and select among protocols used in Pacific area and elsewhere. If necessary, develop original protocols.
T39
Alien Incipient Invasives - Terrestrial Invertebrates
What potential high-impact species have breached the border-protection system and have potential to reach the park? What is the nature and extent of infestation? Is eradication/containment feasible and where should efforts be focused? What are potential impacts?
Active monitoring (transects, plots, light trapping, etc.) in high-risk sites; rapid assessment of extent of infestation; mapping of new discoveries; education, outreach, and public reporting, follow-up on reports
Presence-absence, identification & distribution of targeted "blacklist" species & other novel (previously undetected) invasives.
Changes from Invertebrate Session are included here
Identify likely host plants of potentially high-impact phytophagous insects of Pacific Rim and target surveys to those. If necessary, develop original protocols.
Biotic integrity
Terrestrial Consum
ers
Population
Monitor occurrence of non-established (incipient) invasive species T40
Alien Incipient Invasives - Vertebrates
What potential high-impact species have breached the border-protection system and have potential to reach the park? What is the nature and extent of infestation? Is eradication/containment feasible and where should efforts be focused? What are potential impacts?
Surveys in high- risk sites, Trapping, Rapid assessment of extent of infestation, Passive surveillance and follow-up; education, outreach, and public reporting.
Presence-absence, identification & distribution of targeted "blacklist" species & other novel (previously undetected) invasives. Population indices.
T37 has been combined with this Vital Sign Review and select among protocols used in Pacific area and elsewhere. If necessary, develop original protocols.

National Park Service 43
Water Quality (marine, surface, & ground water) Topical Session
Participants:
Eva DiDonato (facilitator) Kimber DeVerse (notes) Karin Schlappa (notes) Bruce Richmond Penny Latham JP Michaud John Barnes Maria Carnevale Ed Laws Bill Walsh Larry Basch Melia Lane-Kamahele Grant Kaye Doug Neighbor Sonia Stephens Raychelle Daniel Ben Saldua Daniel Kawaiaea Sallie Beavers Guy Hughes Roy Irwin Caroline Rogers Tamar Elias Gordon Tribble Anne Brasher Dwayne Minton Chuck Sayon Lynn Raulerson Barry Hill
Session Notes:
After initial introductions, we opened the water quality vital sign discussion with questions to the group: “Do the water quality vital signs look alright to you?” and, “Did we miss any?” We then addressed each vital sign individually, discussing the appropriateness of the vital sign and its corresponding monitoring question. During this part of the session, metrics and needed research were not specifically covered although suggestions for such were recorded with the associated vital sign.
Initial Vital Signs – Specific Comments: Vital Sign H5 - Water Uses(s) Within & Surrounding Parks
• Split into 2 vital signs • VS should be water quantity or water availability. • Reword monitoring question: What is the natural water quantity? Is water
quantity sufficient? How do human withdrawals affect water availability to park resources? Include spatial extent in monitoring question. Research Question: What is the most sensitive organism that may be affected by availability of water?
• Add salinity to metrics. Vital Sign H7 - Litter/Debris
• Reword monitoring question • Move to viewscape topic group, or as appropriate
Vital Sign P20 - Ground Water Quality Core Parameters and Vital Sign P21 - Marine Water Quality Core Parameters and Vital Sign P22 - Surface water Quality Core Parameters and
• No change Vital Sign P23 - Ground Water Quality Supplemental Parameters
• remove chlorophyll a and turbidity • Add suspended sediments to metrics
Vital Sign P24 - Marine Water Quality Supplemental Parameters • Add suspended sediments to metrics
Vital Sign P25 - Surface Water Quality Supplemental Parameters • Add suspended sediments to metrics

Appendix O: Part IV Vital Signs Workshops
44
Vital Sign P26 - Ground Water Quality – Microbiology and Vital Sign P27 - Marine Water Quality – Microbiology and Vital Sign P28 - Surface Water Quality - Microbiology
• micro – may add viruses and protozoans. Be more specific as to bacterial metrics Vital Sign P29 - Ground Water Quality – Toxics & Contaminants
• add fat bags to methods. • Bioassays • (metrics) speciation can be important to assess toxicity. (E.g. for arsenic)
Vital Sign P30 - Marine Water quality – Toxics & Contaminants • Bioassays • (metrics) speciation can be important to assess toxicity. (E.g. for arsenic)
Vital Sign P31 - Surface Water Quality – Toxics & Contaminants • bioassays • (metrics) speciation can be important to assess toxicity. (E.g. for arsenic)
Vital Sign P32 - Marine Water Quality – Macro Invertebrates • Monitoring question reword (?) What does community dynamics indicate –
include algal communities. • Rework specifics of invert surveys • Change question. Are the assemblages of populations indicative of acceptable
water quality? Add macro algae as a metric. VS: Marine WQ effects on benthic assemblages.
Vital Sign P33 - Surface Water Quality – Macro Invertebrates • rework specifics of invert surveys • Change question. Are the assemblages of populations indicative of acceptable
water quality? Add macro algae as a metric. VS: Marine WQ effects on benthic assemblages.
Synthesis of Main Points from Session Comments:
In the water quality vital signs discussion session, many constructive comments were put forward. There was consensus that initial research is needed to determine baselines and to define the “normal range” and that the monitoring questions need rewording in order to address variability in space and time. Some participants suggested that the vital signs should more specifically describe the parameters of concern and that the term metrics should be clarified to include measures. Additional remarks noted the importance of considering the potential for impact in relation to concentration or presence of an analyte and of monitoring potentially impaired (303d) and pristine (ONRW) resources in addition to the officially recognized ones.
There was substantial dialogue on rewording the vital sign H5 “Water Use Within and Surrounding Parks” to reflect water quantity and availability to park resources and that it could possibly be split into two vital signs. The monitoring question was determined to be a research question and suggestions were made to reword it in terms of water availability and quantity.
Caution was advised in choosing the measures for vital signs P26, P27, and P28 (microbial contamination) citing inconclusive justification when one considers the microbial composition of tropical soils.
The group agreed that P32 “Marine Water Quality – Macroinvertebrates” and P33 “Surface Water Quality – Macroinvertebrates,” have potential as water quality vital signs but

National Park Service 45
specific survey methods and more research are needed before they could be applied as indicators of water quality.
Responses to Main Points Raised During Session:
Although some participants suggested that the vital signs should more specifically describe the parameters of concern, the water quality parameters have been clumped strategically in order to facilitate the ranking and selection process. In particular, a “Network Core” group combines total nitrogen, total phosphorous, and chlorophyll a with the nationally required water quality parameters for all freshwater, marine, and estuarine environments: temperature, specific conductance, pH, dissolved oxygen, and PAR. With this compartmentalized organization of water quality vital signs, park staff may prioritize their water resource monitoring issues without requiring in-depth knowledge of the actual analytes that characterize their respective resources.
The implicit need for baselines and control sites will be addressed appropriately by each topic group when developing their monitoring methods. Defining the “normal range” for parameters of interest may not be feasible for all resources but should remain a monitoring objective whenever a pristine or baseline resource is available. Wherever possible, monitoring objectives and questions will address spatial variability, although this may prove too costly for water quality monitoring.
In addition to H5 “Water Use Within and Surrounding Parks”, vital signs concerning water quantity and rate of movement, or hydrology, were covered in the geology discussion group (P12 through P19) as well as in the freshwater biology session (P17 and P18). As the group suggested, the vital sign and monitoring question for H5 has been changed to reflect water quantity and availability to park resources and the idea of separating water availability from water use and diversion has been addressed by the development of P17 “Water Diversion” in the freshwater biology session.
We’ve removed Chlorophyll a and turbidity from the metrics for P23 “Ground Water Quality – Supplemental Parameters.” “Suspended sediments” was added to P23, P24 and P25 for correlation with USGS monitoring data. It may not be appropriate for groundwater monitoring, although determination of the occurrence of sediment and size classes could assist in detecting physical disturbances to aquifers.
Comments on P32 and P33 from the Marine – Other and Freshwater Biology discussion groups also recommended incorporating algal communities and changing the monitoring questions to ask about the relationship of benthic communities to water quality. It is recognized that in other regions, a scientific basis for this relationship has been established but more research is needed before this can become a valid monitoring tool in the PACN. With interdisciplinary cooperation in designing the monitoring methods, data may become available to address some of these concerns in the future.
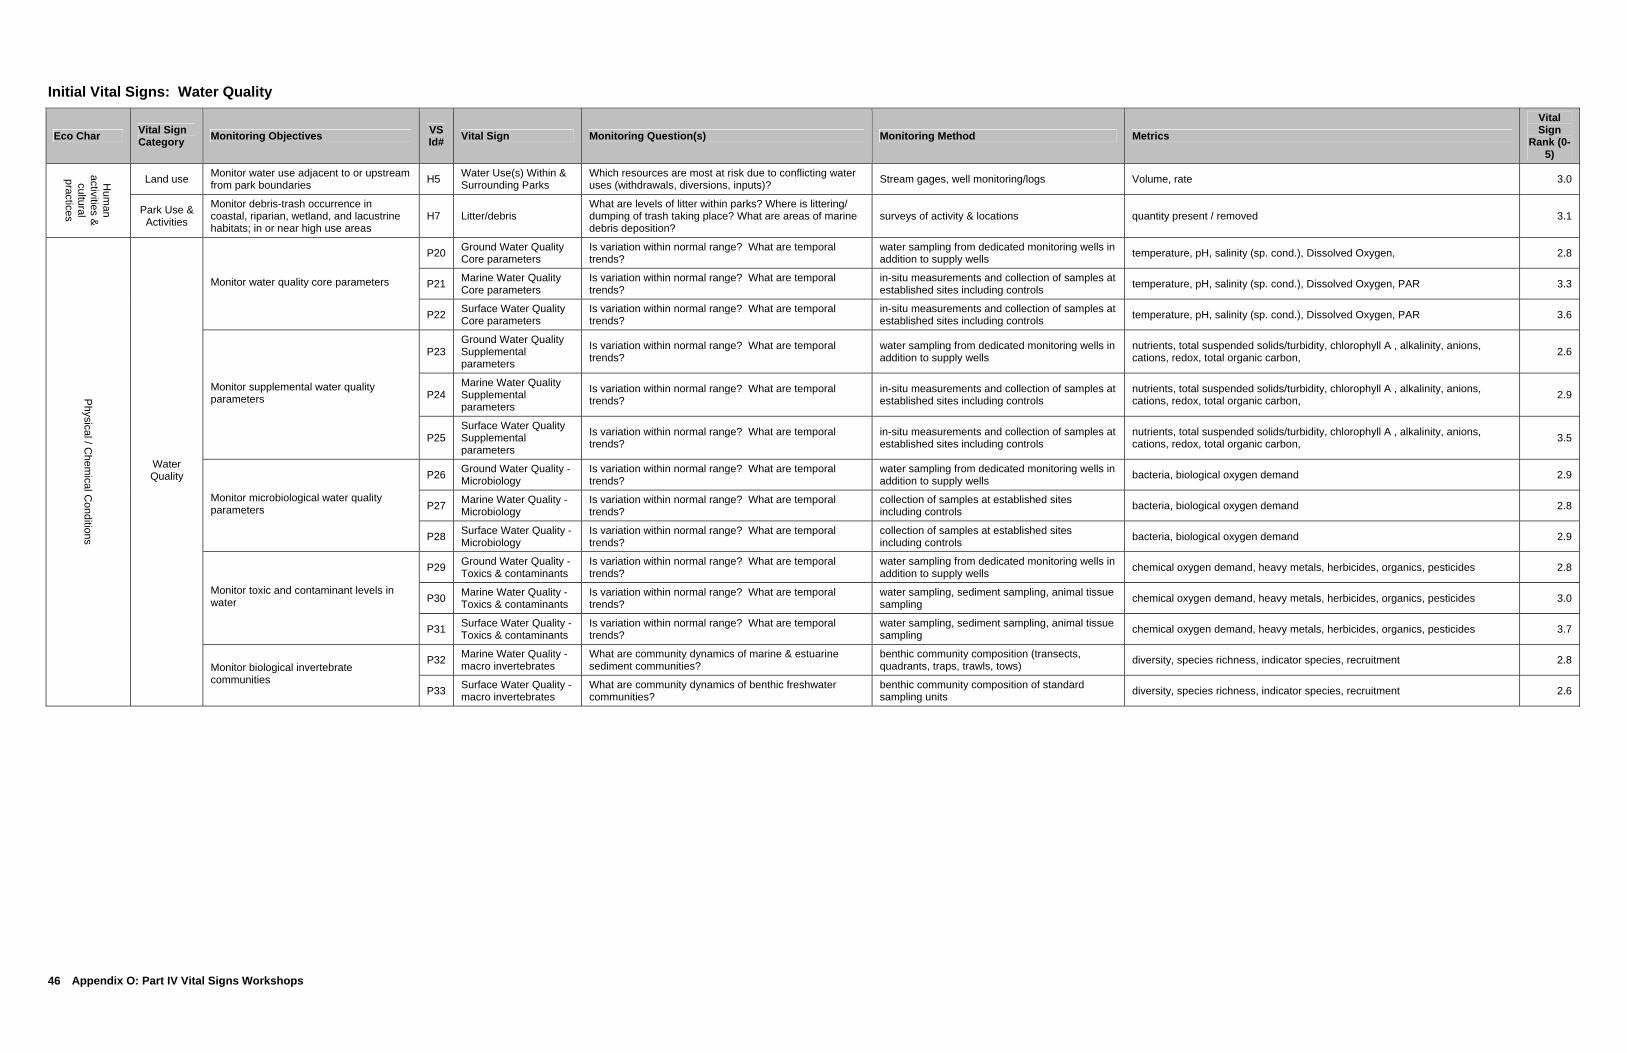
Appendix O: Part IV Vital Signs Workshops
46
Initial Vital Signs: Water Quality
Eco Char Vital Sign Category Monitoring Objectives VS
Id# Vital Sign Monitoring Question(s) Monitoring Method Metrics Vital Sign
Rank (0-5)
Land use Monitor water use adjacent to or upstream from park boundaries H5 Water Use(s) Within &
Surrounding Parks Which resources are most at risk due to conflicting water uses (withdrawals, diversions, inputs)? Stream gages, well monitoring/logs Volume, rate 3.0 H
uman
activities &
cultural practices
Park Use & Activities
Monitor debris-trash occurrence in coastal, riparian, wetland, and lacustrine habitats; in or near high use areas
H7 Litter/debris What are levels of litter within parks? Where is littering/ dumping of trash taking place? What are areas of marine debris deposition?
surveys of activity & locations quantity present / removed 3.1
P20 Ground Water Quality Core parameters
Is variation within normal range? What are temporal trends?
water sampling from dedicated monitoring wells in addition to supply wells temperature, pH, salinity (sp. cond.), Dissolved Oxygen, 2.8
P21 Marine Water Quality Core parameters
Is variation within normal range? What are temporal trends?
in-situ measurements and collection of samples at established sites including controls temperature, pH, salinity (sp. cond.), Dissolved Oxygen, PAR 3.3 Monitor water quality core parameters
P22 Surface Water Quality Core parameters
Is variation within normal range? What are temporal trends?
in-situ measurements and collection of samples at established sites including controls temperature, pH, salinity (sp. cond.), Dissolved Oxygen, PAR 3.6
P23 Ground Water Quality Supplemental parameters
Is variation within normal range? What are temporal trends?
water sampling from dedicated monitoring wells in addition to supply wells
nutrients, total suspended solids/turbidity, chlorophyll A , alkalinity, anions, cations, redox, total organic carbon, 2.6
P24 Marine Water Quality Supplemental parameters
Is variation within normal range? What are temporal trends?
in-situ measurements and collection of samples at established sites including controls
nutrients, total suspended solids/turbidity, chlorophyll A , alkalinity, anions, cations, redox, total organic carbon, 2.9
Monitor supplemental water quality parameters
P25 Surface Water Quality Supplemental parameters
Is variation within normal range? What are temporal trends?
in-situ measurements and collection of samples at established sites including controls
nutrients, total suspended solids/turbidity, chlorophyll A , alkalinity, anions, cations, redox, total organic carbon, 3.5
P26 Ground Water Quality - Microbiology
Is variation within normal range? What are temporal trends?
water sampling from dedicated monitoring wells in addition to supply wells bacteria, biological oxygen demand 2.9
P27 Marine Water Quality - Microbiology
Is variation within normal range? What are temporal trends?
collection of samples at established sites including controls bacteria, biological oxygen demand 2.8
Monitor microbiological water quality parameters
P28 Surface Water Quality - Microbiology
Is variation within normal range? What are temporal trends?
collection of samples at established sites including controls bacteria, biological oxygen demand 2.9
P29 Ground Water Quality - Toxics & contaminants
Is variation within normal range? What are temporal trends?
water sampling from dedicated monitoring wells in addition to supply wells chemical oxygen demand, heavy metals, herbicides, organics, pesticides 2.8
P30 Marine Water Quality - Toxics & contaminants
Is variation within normal range? What are temporal trends?
water sampling, sediment sampling, animal tissue sampling chemical oxygen demand, heavy metals, herbicides, organics, pesticides 3.0
Monitor toxic and contaminant levels in water
P31 Surface Water Quality - Toxics & contaminants
Is variation within normal range? What are temporal trends?
water sampling, sediment sampling, animal tissue sampling chemical oxygen demand, heavy metals, herbicides, organics, pesticides 3.7
P32 Marine Water Quality - macro invertebrates
What are community dynamics of marine & estuarine sediment communities?
benthic community composition (transects, quadrants, traps, trawls, tows) diversity, species richness, indicator species, recruitment 2.8
Physical / C
hemical C
onditions
Water Quality
Monitor biological invertebrate communities
P33 Surface Water Quality - macro invertebrates
What are community dynamics of benthic freshwater communities?
benthic community composition of standard sampling units diversity, species richness, indicator species, recruitment 2.6
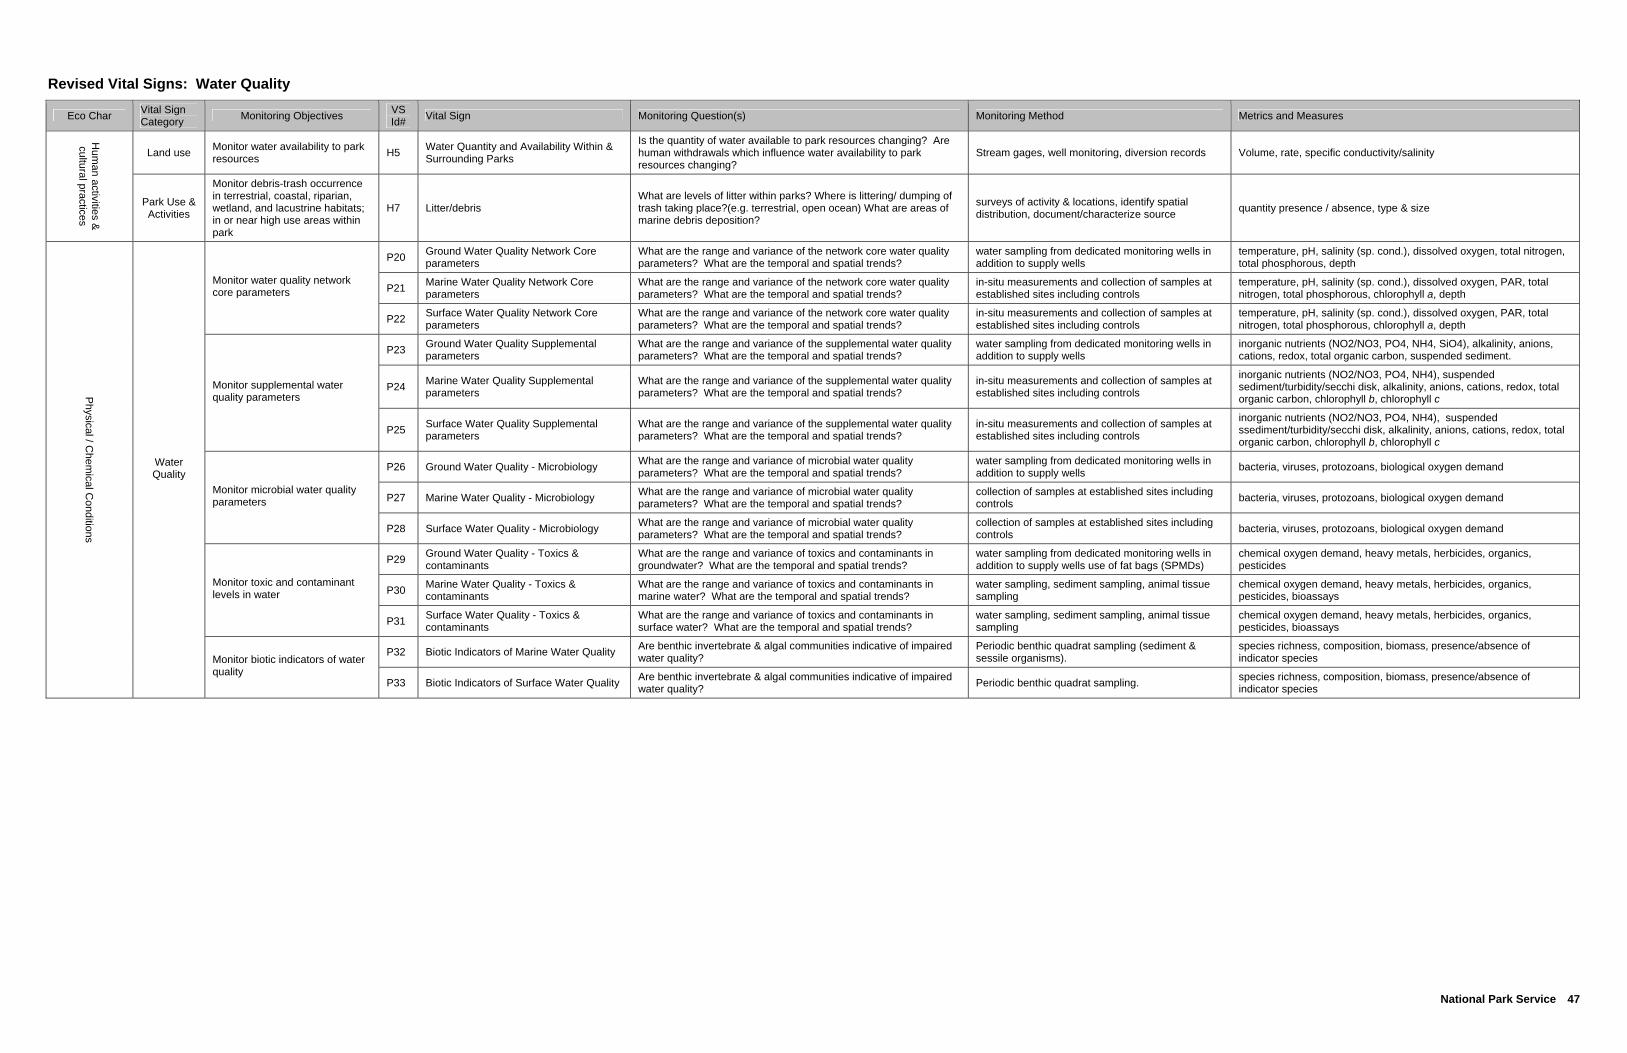
National Park Service 47
Revised Vital Signs: Water Quality
Eco Char Vital Sign Category Monitoring Objectives VS
Id# Vital Sign Monitoring Question(s) Monitoring Method Metrics and Measures
Land use Monitor water availability to park resources H5 Water Quantity and Availability Within &
Surrounding Parks
Is the quantity of water available to park resources changing? Are human withdrawals which influence water availability to park resources changing?
Stream gages, well monitoring, diversion records Volume, rate, specific conductivity/salinity
Hum
an activities &
cultural practices
Park Use & Activities
Monitor debris-trash occurrence in terrestrial, coastal, riparian, wetland, and lacustrine habitats; in or near high use areas within park
H7 Litter/debris What are levels of litter within parks? Where is littering/ dumping of trash taking place?(e.g. terrestrial, open ocean) What are areas of marine debris deposition?
surveys of activity & locations, identify spatial distribution, document/characterize source quantity presence / absence, type & size
P20 Ground Water Quality Network Core parameters
What are the range and variance of the network core water quality parameters? What are the temporal and spatial trends?
water sampling from dedicated monitoring wells in addition to supply wells
temperature, pH, salinity (sp. cond.), dissolved oxygen, total nitrogen, total phosphorous, depth
P21 Marine Water Quality Network Core parameters
What are the range and variance of the network core water quality parameters? What are the temporal and spatial trends?
in-situ measurements and collection of samples at established sites including controls
temperature, pH, salinity (sp. cond.), dissolved oxygen, PAR, total nitrogen, total phosphorous, chlorophyll a, depth
Monitor water quality network core parameters
P22 Surface Water Quality Network Core parameters
What are the range and variance of the network core water quality parameters? What are the temporal and spatial trends?
in-situ measurements and collection of samples at established sites including controls
temperature, pH, salinity (sp. cond.), dissolved oxygen, PAR, total nitrogen, total phosphorous, chlorophyll a, depth
P23 Ground Water Quality Supplemental parameters
What are the range and variance of the supplemental water quality parameters? What are the temporal and spatial trends?
water sampling from dedicated monitoring wells in addition to supply wells
inorganic nutrients (NO2/NO3, PO4, NH4, SiO4), alkalinity, anions, cations, redox, total organic carbon, suspended sediment.
P24 Marine Water Quality Supplemental parameters
What are the range and variance of the supplemental water quality parameters? What are the temporal and spatial trends?
in-situ measurements and collection of samples at established sites including controls
inorganic nutrients (NO2/NO3, PO4, NH4), suspended sediment/turbidity/secchi disk, alkalinity, anions, cations, redox, total organic carbon, chlorophyll b, chlorophyll c
Monitor supplemental water quality parameters
P25 Surface Water Quality Supplemental parameters
What are the range and variance of the supplemental water quality parameters? What are the temporal and spatial trends?
in-situ measurements and collection of samples at established sites including controls
inorganic nutrients (NO2/NO3, PO4, NH4), suspended ssediment/turbidity/secchi disk, alkalinity, anions, cations, redox, total organic carbon, chlorophyll b, chlorophyll c
P26 Ground Water Quality - Microbiology What are the range and variance of microbial water quality parameters? What are the temporal and spatial trends?
water sampling from dedicated monitoring wells in addition to supply wells bacteria, viruses, protozoans, biological oxygen demand
P27 Marine Water Quality - Microbiology What are the range and variance of microbial water quality parameters? What are the temporal and spatial trends?
collection of samples at established sites including controls bacteria, viruses, protozoans, biological oxygen demand
Monitor microbial water quality parameters
P28 Surface Water Quality - Microbiology What are the range and variance of microbial water quality parameters? What are the temporal and spatial trends?
collection of samples at established sites including controls bacteria, viruses, protozoans, biological oxygen demand
P29 Ground Water Quality - Toxics & contaminants
What are the range and variance of toxics and contaminants in groundwater? What are the temporal and spatial trends?
water sampling from dedicated monitoring wells in addition to supply wells use of fat bags (SPMDs)
chemical oxygen demand, heavy metals, herbicides, organics, pesticides
P30 Marine Water Quality - Toxics & contaminants
What are the range and variance of toxics and contaminants in marine water? What are the temporal and spatial trends?
water sampling, sediment sampling, animal tissue sampling
chemical oxygen demand, heavy metals, herbicides, organics, pesticides, bioassays
Monitor toxic and contaminant levels in water
P31 Surface Water Quality - Toxics & contaminants
What are the range and variance of toxics and contaminants in surface water? What are the temporal and spatial trends?
water sampling, sediment sampling, animal tissue sampling
chemical oxygen demand, heavy metals, herbicides, organics, pesticides, bioassays
P32 Biotic Indicators of Marine Water Quality Are benthic invertebrate & algal communities indicative of impaired water quality?
Periodic benthic quadrat sampling (sediment & sessile organisms).
species richness, composition, biomass, presence/absence of indicator species
Physical / C
hemical C
onditions
Water Quality
Monitor biotic indicators of water quality
P33 Biotic Indicators of Surface Water Quality Are benthic invertebrate & algal communities indicative of impaired water quality? Periodic benthic quadrat sampling. species richness, composition, biomass, presence/absence of
indicator species

Appendix O: Part IV Vital Signs Workshops
48
Invertebrate Fauna (terrestrial) Topical Session
Participants:
Karl Magnacca (facilitator) Jean Licus (notes) Patrick Conant Patti Welton Dan Polhemus Rhonda Loh Coleen Cory Penny Latham Raina Kaholoaa Frank Howarth Rob Cowie Bryan Harry David Foote Peter Craig
Session Notes:
During this session, we discussed each Vital Sign in order, including the monitoring question, methods, and metrics. General comments were recorded separately. There was not time for discussion of partnerships for monitoring or protocols; it was agreed to stay in contact to follow up on them. The Vital Sign-specific comments will be presented first, followed by the general comments with responses from the moderator.
Initial Vital Signs - Specific Comments: Vital Sign T10 - Recovery/Change of Native Vegetation with Invasive Alien Invertebrate Control and Vital Sign T11 - Invertebrate Biocontrol of Plants and Vital Sign T12 - Plant Pathogen Biocontrol of Plants
• All Deleted from Invertebrates and covered by Vegetation. Vital Sign T18 - Terrestrial Invertebrate Biodiversity
• Very important Vital Sign. Should clarify that this is monitoring diverse groups for their own value, not habitat quality. Needs clarification with regard to meaning of “hyper-diverse” [maybe remove?]; perhaps specify groups impacted to a greater degree. Can be looked at within a park or across a landscape.
Vital Sign T20 - Recovery/Change of Native Invertebrate Communities with Native Plant Restoration Vital Sign T21 – Recovery/Change of Native Fauna & Ecosystems with Restoration of Native
Vegetation. • As it is T20 is a subset of T21. They should be combined (changing “wildlife” to “fauna”
and “habitats” to “ecosystems”), or invertebrates removed from T21. Include population surveys in monitoring methods; specifically mention monitoring of colonization of outplants.
Vital Sign T22 - Invertebrate Biocontrol of Invertebrates • Add snails and non-native inverts to groups to be monitored for impacts [under monitoring
questions]. Add ecological effects of biocontrol. Add metrics from T25; change “infestation rates” to “parasitization/predation rates” (to monitor threats rather than impacts).
Vital Sign T25 - Invertebrate Charismatic or Species of Concern and Vital Sign T29 - Terrestrial Invertebrate Focal Species and Species of Special Concern (T, E, S-o-C,
rare and charismatic species • Combine T25 and T29; change Vital Sign name to “Invertebrate Focal Species and Species of
Special Concern”. Use Monitoring Questions and metrics from 25 and Monitoring Methods from 29.
Vital Sign T28 - Terrestrial Invertebrate Indicators Associated with Habitat Quality • Add “indicator” to Vital Sign. Include mapping and plots in Monitoring Methods.
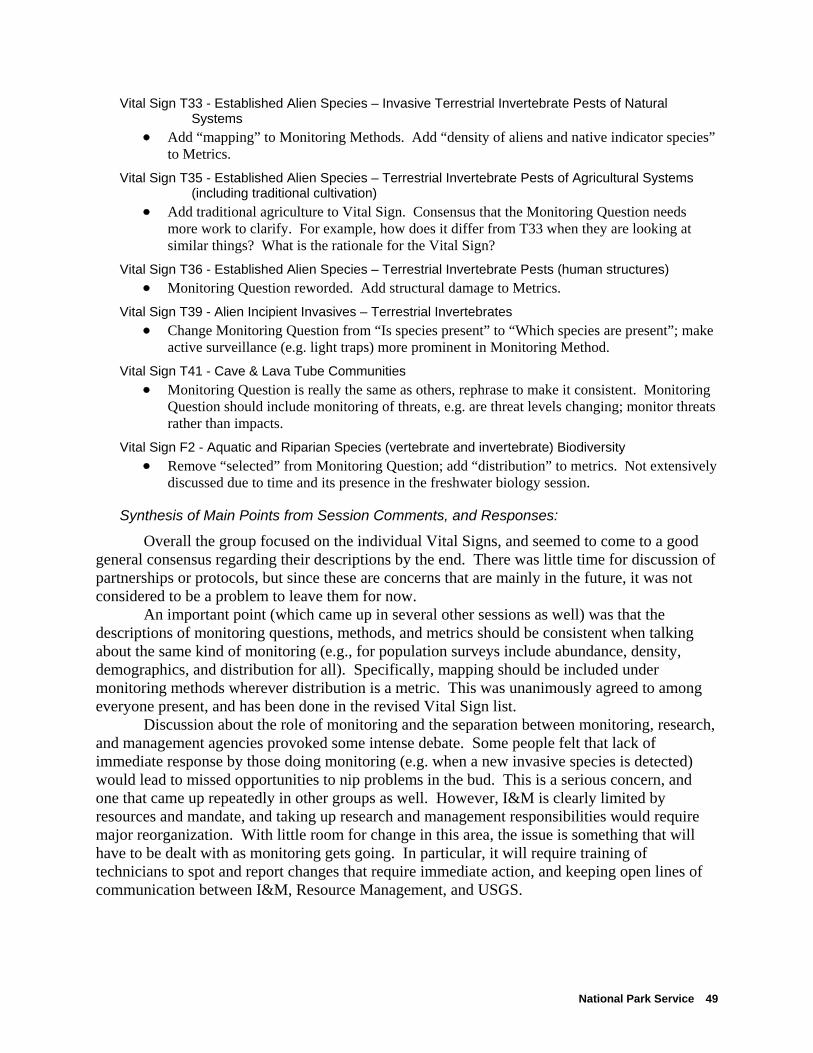
National Park Service 49
Vital Sign T33 - Established Alien Species – Invasive Terrestrial Invertebrate Pests of Natural Systems
• Add “mapping” to Monitoring Methods. Add “density of aliens and native indicator species” to Metrics.
Vital Sign T35 - Established Alien Species – Terrestrial Invertebrate Pests of Agricultural Systems (including traditional cultivation)
• Add traditional agriculture to Vital Sign. Consensus that the Monitoring Question needs more work to clarify. For example, how does it differ from T33 when they are looking at similar things? What is the rationale for the Vital Sign?
Vital Sign T36 - Established Alien Species – Terrestrial Invertebrate Pests (human structures) • Monitoring Question reworded. Add structural damage to Metrics.
Vital Sign T39 - Alien Incipient Invasives – Terrestrial Invertebrates • Change Monitoring Question from “Is species present” to “Which species are present”; make
active surveillance (e.g. light traps) more prominent in Monitoring Method. Vital Sign T41 - Cave & Lava Tube Communities
• Monitoring Question is really the same as others, rephrase to make it consistent. Monitoring Question should include monitoring of threats, e.g. are threat levels changing; monitor threats rather than impacts.
Vital Sign F2 - Aquatic and Riparian Species (vertebrate and invertebrate) Biodiversity • Remove “selected” from Monitoring Question; add “distribution” to metrics. Not extensively
discussed due to time and its presence in the freshwater biology session.
Synthesis of Main Points from Session Comments, and Responses:
Overall the group focused on the individual Vital Signs, and seemed to come to a good general consensus regarding their descriptions by the end. There was little time for discussion of partnerships or protocols, but since these are concerns that are mainly in the future, it was not considered to be a problem to leave them for now.
An important point (which came up in several other sessions as well) was that the descriptions of monitoring questions, methods, and metrics should be consistent when talking about the same kind of monitoring (e.g., for population surveys include abundance, density, demographics, and distribution for all). Specifically, mapping should be included under monitoring methods wherever distribution is a metric. This was unanimously agreed to among everyone present, and has been done in the revised Vital Sign list.
Discussion about the role of monitoring and the separation between monitoring, research, and management agencies provoked some intense debate. Some people felt that lack of immediate response by those doing monitoring (e.g. when a new invasive species is detected) would lead to missed opportunities to nip problems in the bud. This is a serious concern, and one that came up repeatedly in other groups as well. However, I&M is clearly limited by resources and mandate, and taking up research and management responsibilities would require major reorganization. With little room for change in this area, the issue is something that will have to be dealt with as monitoring gets going. In particular, it will require training of technicians to spot and report changes that require immediate action, and keeping open lines of communication between I&M, Resource Management, and USGS.

Appendix O: Part IV Vital Signs Workshops
50
Initial Vital Signs: Invertebrate Fauna
Eco Char Vital Sign Category Monitoring Objectives VS
Id# Vital Sign Monitoring Question(s) Monitoring Method Metrics Vital Sign
Rank (0-5)
Com
munit
y Monitor effects of management on native communities T10
Recovery/Change of Native Vegetation with Invasive Alien Invertebrate Control
Are native plant species recovering where invasive invertebrates are controlled? What are trends in plant community composition and structure following invasive invertebrate control?
Transects, plots species composition, vigor, size classes, density, Cover, abundance & distribution of alien inverts & native pollinators, flower & seed production
1.8
T11 Invertebrate Biocontrol of Plants
What is the long-term impact/efficacy on populations of blackberry, passionflower, & other pests? Are non-target plants, especially natives, being affected? Plots & transects for plants Infestation rates 1.7
Vegetation
Population
Monitor effects of biocontrol on native and invasive species
T12 Plant Pathogen Biocontrol of Plants
What is the impact/efficacy on populations of control target? Are non-target species being attacked? Plots & transects Infestation rates 1.6
Monitor community dynamics, structure, function, and composition T18 Terrestrial Invertebrate
Biodiversity What are trends in distribution and abundance of hyper-diverse groups w/in parks? Population surveys, transects, plots Diversity, evenness, endemism 2.9
T20
Recovery/Change of Native Invertebrates Communities with Native Plant Restoration
What native species are recolonizing restored areas? Which ones are not? Transects, plots abundance, Presence, trends of selected species or groups 2.5 C
onsumers
Com
munity
Monitor effects of management on native communities
T21
Recovery/change of Native Wildlife and habitats (including wetlands) with restoration of native vegetation
What are trends in plant community composition and structure resulting from outplanting and seed-sowing activities? What is the response of native vertebrate and invertebrate populations to plant community restoration? What are priority plant species that should be restored?
Transects, plots (monitoring of areas where seeds have been broadcast and native species outplanted)
size classes, vigor, species composition, seedling recruitment, growth rates, Cover, animal reproductive success, animal popn size, animal popn growth rates, survivorship, density
3.2
Monitor effects of biocontrol on native and invasive species T22 Invertebrate Biocontrol of
Invertebrates What is the impact of biocontrol agents on native moths, beetles, & parasitoids? What is the impact/efficacy on target populations? Population surveys, rearing Infestation rates 1.7
T25 Invertebrate Charismatic or Species of Concern
Are distribution, abundance, other population characteristics, or habitat changing? Determine population levels over time. Population surveys Abundance / density, demographics, distribution 3.2
T28 Terrestrial Invertebrates Associated with Habitat Quality
What are trends in invertebrate indicator species? Population surveys abundance, distribution, demographics 2.7
Monitor population size and distribution of native, endemic, or focal species, including response to restoration efforts. Where appropriate, measure demographics (size/age structure, reproduction, recruitment, etc.) of selected indicator species T29
Terrestrial Invertebrate Species Protection (T, E, S-o-C Species)
Are distribution, abundance, other population characteristics, or habitat changing? Mapping, plots, population surveys abundance, distribution, demographics 2.9
T33
Established Alien Species - Invasive Terrestrial Invertebrate Pests of natural systems
How effective is control? What are the abundance, distribution, and seasonal and year-to-year variations in populations? What are trends in impact? Transects, plots, population surveys abundance, distribution, demographics 2.4
T35
Established Alien Species - Terrestrial Invertebrate Pests (agricultural)
Monitor population fluctuations to determine when additional control actions are needed Population surveys Infestation rates of native and alien fruits 1.8
Monitor extent and response to treatment of established invasive species
T36
Established Alien Species - Terrestrial Invertebrate Pests (human structures)
Characterize extent of impact invertebrate pests are having on historical and other culturally significant structures? Periodic sampling of structures Infestation rates 1.9
Consum
ers
Population
Monitor occurrence of non-established (incipient) invasive species
T39 Alien Incipient Invasives - Terrestrial Invertebrates
Is species present, if so what is the nature and extent of infestation? What are the most effective strategies for detecting and preventing new invasives species? Where should efforts be focused? What are potential impacts?
Passive surveillance and follow-up on reports; education, outreach, and public reporting; surveys in high- risk sites
distribution, Presence/ absence, rapid assessment of extent of infestation 2.2
Terrestrial Ecosystem
s
Cave Systems Community Monitor changes in cave
communities T41 Cave & lava tube communities Are cave (biotic) communities changing? What are temporal trends? Population surveys, root type and abundance abundance, distribution, demographics 2.0
Biotic Integrity
ater E
cosys
Consu
mers
Com
munity
Monitor community dynamics, structure, function, and composition F2
Aquatic and Riparian Species (vertebrate and invertebrate) Biodiversity
Are there long-term changes in selected aquatic native communities? population surveys, transects Abundance and trends of selected species or groups 3.5

National Park Service 51
Revised Vital Signs: Invertebrate Fauna Eco Char Vital Sign Category Monitoring Objectives VS
Id# Vital Sign Monitoring Question(s) Monitoring Method Metrics
Monitor community dynamics, structure, function, and composition
T18 Terrestrial Invertebrate Biodiversity What are trends in distribution, abundance, and diversity of species groups within parks and across landscapes? Are species being locally extirpated or going extinct?
Population surveys, transects, plots, mapping Abundance, density, demographics, distribution, diversity, evenness, richness
Consum
ers
Com
munity T21
Recovery/Change of Native Fauna and Ecosystems with Restoration of Native Vegetation
What is the response of native vertebrate and invertebrate populations to plant community restoration, including alien control and outplanting and seed-sowing activities? Which native species are recolonizing restored areas? Which ones are not?
Population surveys, transects, plots, mapping Abundance, density, demographics, distribution, diversity, evenness, richness
Monitor effects of biocontrol on native and invasive species T22 Invertebrate Biocontrol of Invertebrates
What is the impact of biocontrol agents on native and non-native invertebrates (including moths, beetles, snails, and parasitoids)? What is the impact on target species?
Population surveys, transects, plots, mapping, rearing
Parasitism/predation rates; abundance/density, demographics, distribution of hosts and control agents
T28 Terrestrial Invertebrate Indicators Associated with Habitat Quality What are trends in distribution and abundance of invertebrate indicator species? Population surveys, transects, plots, mapping Abundance, density, demographics, distribution
T29
Terrestrial Invertebrate Focal Species and Species of Special Concern (T, E, S-o-C, rare, and charismatic species)
What are trends in distribution, abundance, other population characteristics, and habitat? Are threats changing? Population surveys, transects, plots, mapping Abundance, density, demographics, distribution
T33 Established Alien Species - Invasive Terrestrial Invertebrate Pests of Natural Systems
What are the abundance, distribution, and seasonal and year-to-year variations in populations? What are trends in impact? How effective is control? Population surveys, transects, plots, mapping Abundance, density, demographics, distribution of
aliens and native indicator species
T35 Established Alien Species - Terrestrial Invertebrate Pests of Agricultural Systems (including traditional cultivation)
What are the abundance, distribution, and seasonal and year-to-year variations in populations? What are trends in impact? How effective is control? Population surveys, transects, plots, mapping Infestation rates of native and alien hosts
Monitor extent and response to treatment of established invasive species
T36 Established Alien Species - Terrestrial Invertebrate Pests (human structures)
What is the impact of invertebrate pests on historic and other culturally significant structures? Periodic sampling of structures Infestation rates, structural damage
Consum
ers
Population
Monitor occurrence of non-established (incipient) invasive species
T39 Alien Incipient Invasives - Terrestrial Invertebrates
Which species are present? What is the nature and extent of infestation? Where should efforts be focused? What are potential impacts?
Active monitoring (transects, plots, trapping, etc.) in high-risk sites; mapping of new discoveries; education, outreach, and public reporting, follow-up on reports
Presence/absence, distribution, rapid assessment of extent of infestation
Cave Systems Community Monitor changes in cave
communities T41 Cave & lava tube communities What are trends in distribution, abundance, other population characteristics, and habitat quality? Are threats changing?
Population surveys, mapping; root type and abundance
Abundance, density, demographics, distribution, diversity, evenness, richness of natives and aliens
ater E
cosys
Consu
mers
Com
munity
Monitor community dynamics, structure, function, and composition
F2 Aquatic and Riparian Species (vertebrate and invertebrate) Biodiversity
What are long-term trends in native aquatic community composition, species richness, presence of aliens, and other measures of habitat quality? Population surveys, transects, plots, mapping Abundance, density, demographics, distribution,
diversity, evenness, richness
Appendix O: Part IV Vital Signs Workshops
52
Birds and Bats Topical Session
Participants:
Darcy Hu (facilitator) Casey Cumming (notes) Ryan Monello Cathleen Bailey Tim Tunison Steve Hess Fern Duvall Thierry Work Malia Laber Linda Pratt Beth Flint Theresa Menard Joshua Seamon
Session Notes:
In this session, we initially discussed each vital sign, including associated Monitoring Objectives, and for some, also monitoring questions, monitoring methods, and metrics. Our session closed with brief brainstorming for potential new partners.
Initial Vital Signs - Specific Comments: Vital Sign T19 – Terrestrial Vertebrate (including offshore islets refugia) Biodiversity
• This is the redundant in practice with T23 and T27: while the objective is different (community level focus vs. population level focus), methods are same.
• Needs to be reworded for clarification that this Vital Sign is examining site-specific distribution, such as off-shore islets or other defined areas of biodiversity. There was some concern about ensuring that community-level monitoring only be done on a defined and relatively small spatial scale.
• There was some discussion about the value of monitoring community attributes. Some participants felt that population level monitoring was usually more appropriate. Others felt that community-level monitoring was appropriate for the purposes of looking at changes in defined areas or defined locations.
Vital Sign T23 – Forest Birds and Bats (includes T&E Species) • Population focus here (vs. community focus of T19) • Don’t want to exclude aliens: “Bird” could include both native and aliens, both in actual Vital
Sign and in general methods; monitoring objective should say native and non-native. • Suggestion that game birds and owls would be valuable to monitor under this Vital Sign • For bats: monitoring method could be altered to include “and/or censuses.” For metrics, one
could use either a census (complete count) or a survey to assess abundance or density and distribution. In lieu of censuses, presence/absence surveys would yield info on distribution (one of our original suggested metrics for this Vital Sign), and relative abundance could be assessed by an index of “activity.”
Vital Sign T26 – Seabirds (including T&E species) • No specific changes suggested.
Vital Sign T27 – Shorebirds and waterbirds (including T&E species) • include “waterfowl” in addition to shorebirds and waterbirds.
Vital Sign T30 – Established Disease & Pathogens of Terrestrial Vertebrates • Broaden Vital Sign to include: causes of mortality and morbidity, not just disease. So this
would include contaminants. Thus, this really is a “wildlife health Vital Sign” • Need to determine mortality factors and then which of these are most important. • Use above 2 bullets and make this a separate Vital Signs.
National Park Service 53
• Monitoring objective: monitoring wildlife mortality and morbidity. Need methods and metrics to include telemetry to recovery carcasses.
• Monitoring question: what are the most important causes of mortality; are these changing over time?
Vital Sign T31 - Alien Incipient disease & Pathogens of Terrestrial Vertebrates • Vital Sign: Incipient: use “potential known” threat instead • Monitoring question is case-specific: tailored to whatever threat you are looking for. • MQ: Do you want to prevent these threats? • MQ: What species are threatened? • MQ: should focus on early detection and response—as early as possible. • One participant felt this was the opportunity to include special cases, like West Nile Virus.
Vital Sign T34 – Established Alien Species – Predatory Terrestrial Vertebrates • Make “predatory terrestrial vertebrates” more specific • Predators should be expanded to include:
• Animals that eat animals • Animals that eat plants • Insects that eat plants [although this does not fit in birds & bats session]
• This Vital Sign could also be expanded to include competitors. • “Strongly recommend adding ‘impacts’ of predatory vertebrates to Vital Signs.”
Vital Sign T37 – Alien Incipient Invasives – Predatory Terrestrial Vertebrate • “Strongly recommend adding ‘impacts’ of predatory vertebrates to Vital Signs.”
General comments for T23-T27:
• Add “non-native” to monitoring objective for T23-27. • Could lump all birds together and let parks decide on which species/types of birds, and split
up according to importance for each individual park. • Monitoring objective, methods and metrics don’t include habitat. Consider adding this. • One participant suggested that we attempt a meta-analysis of each or some of these groups to
determine if and which certain guilds drop out (e.g., in some studies of tropical forest birds, frugivores drop out with disturbance or habitat degradation).
Rankings:
We did not discuss rankings, in part because group recognized that the suggested significant changes to T30 and T31 would probably change ranking scores.
There was a question or concern expressed about how people were viewing incipient organisms—were they considering long-term threats from these organisms?
Partnership Opportunities:
The following were suggested as additional potential partners for bird and/or bat monitoring:
• Ducks Unlimited • Waterbird Conservation Council (Beth Flint) • Bat Conservation International (BCI)
Appendix O: Part IV Vital Signs Workshops
54
• Hawaiian Forest Bird Recover Team • Hawaiian Hoary Bat Conservation Association • The Nature Conservancy
Synthesis of Main Points from Session Comments:
The group felt that the population monitoring objective for terrestrial consumers (encompassing T23, T26, and T27) should include alien species monitoring rather than explicitly focusing solely on native species. There was also the suggestion that these three individual vital signs could be combined into a single one, with decisions about species to monitor made by the parks.
The most significant changes suggested by the group pertained to vital signs T30 and T31, which were aimed at monitoring known and incipient diseases. Both of these were broadened by replacing “disease and pathogens” with “causes of morbidity and mortality.” The group then termed these the wildlife health vital signs. There was also the suggestion that the incipient threat vital sign, T31, should be sharpened or clarified so that its intent is clear—early detection and response are paramount, as is prevention of threats where they do not already occur.
Lastly, the group favored expanding vital sign T34, Established Alien Species-Predatory Terrestrial Vertebrates, to include some non-traditional predators such as herbivores.
Reponses to Main Points Raised during Session:
T19 – included reference to the finite nature of community monitoring at some point. T23, 26 and 27 – A compromise was made on the suggestion to combine these into one
vital sign by combining 26 and 27, (seabirds, and shorebirds and waterfowl), while leaving forest birds and bats by itself. This reflects the known differences in methods for forest birds and bats, and also the attempt to end up with a structure similar to the one settled on by the T&E/SOC group for these same vital signs.
T30 & T31 – All aspects of these Vital Signs were edited and combined into a single vital sign, resulting in a more lengthy questions and methods section, but with a single, clearer objective and vital sign.
T37 – It was decided that much of the existing monitoring question was inappropriate or unanswerable via monitoring. Therefore, it was moved to the Comments section with a preface that research was needed to identify effective strategies to detect and prevent new introductions, to determine where efforts should be focused, and identify potential impacts.
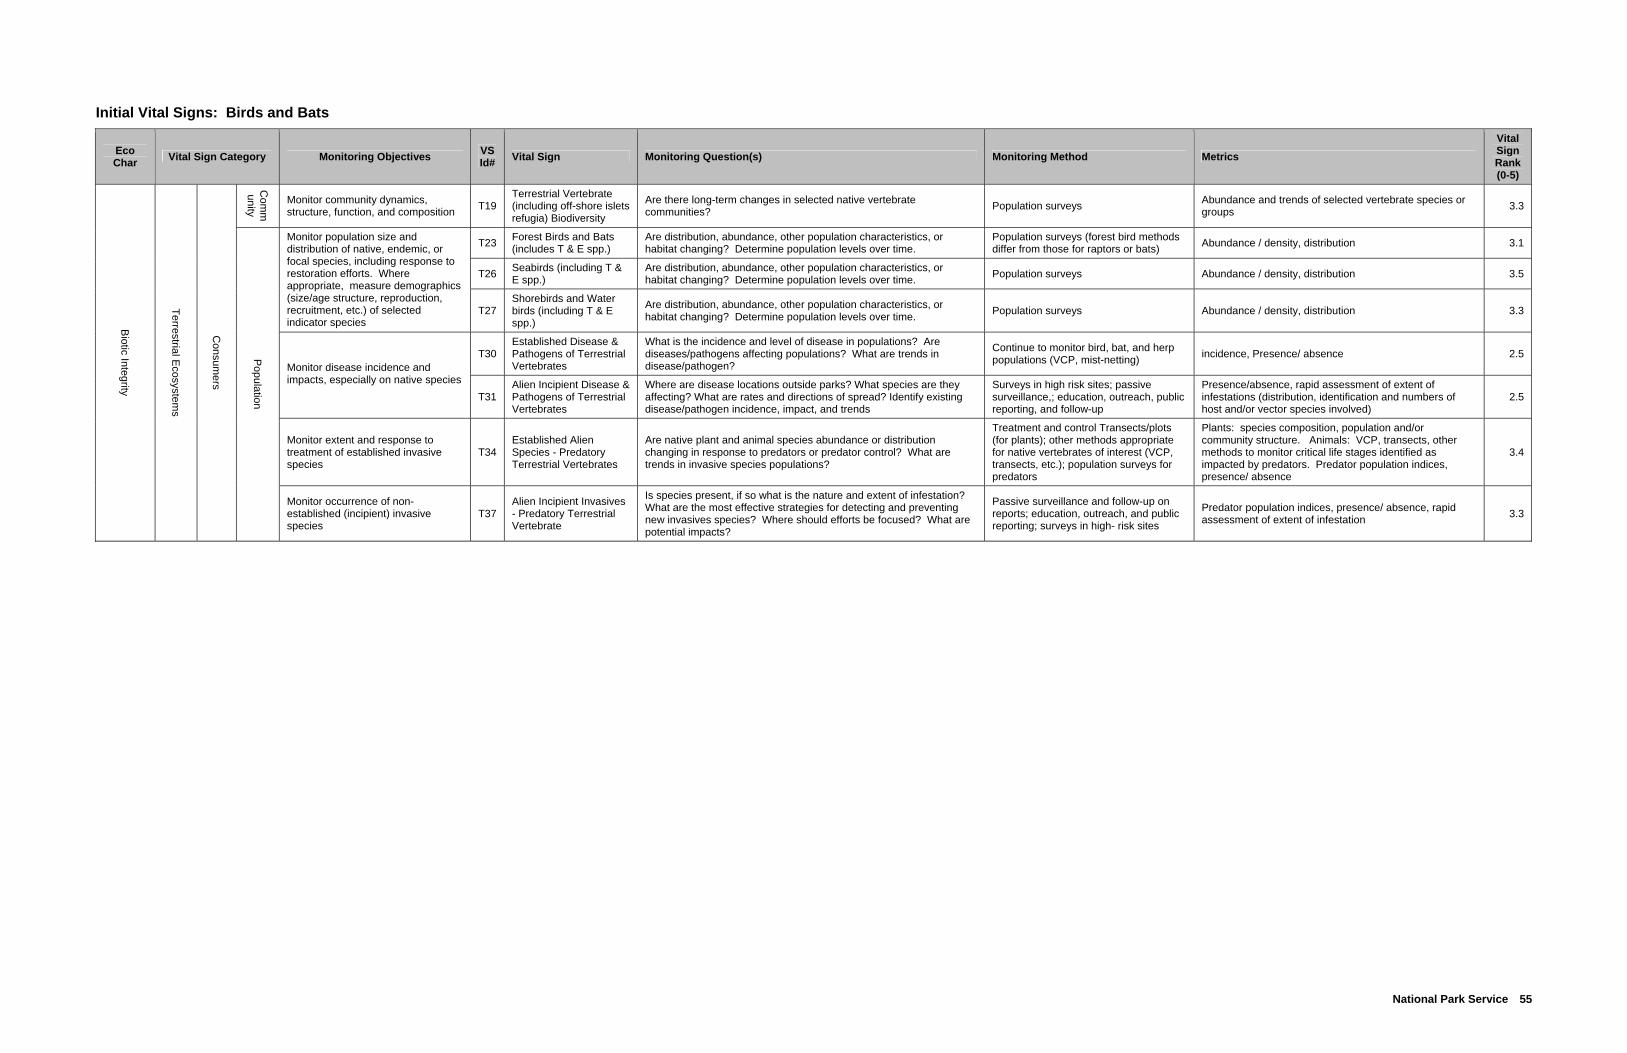
National Park Service 55
Initial Vital Signs: Birds and Bats
Eco Char Vital Sign Category Monitoring Objectives VS
Id# Vital Sign Monitoring Question(s) Monitoring Method Metrics Vital Sign Rank (0-5)
Com
munity
Monitor community dynamics, structure, function, and composition T19
Terrestrial Vertebrate (including off-shore islets refugia) Biodiversity
Are there long-term changes in selected native vertebrate communities? Population surveys Abundance and trends of selected vertebrate species or
groups 3.3
T23 Forest Birds and Bats (includes T & E spp.)
Are distribution, abundance, other population characteristics, or habitat changing? Determine population levels over time.
Population surveys (forest bird methods differ from those for raptors or bats) Abundance / density, distribution 3.1
T26 Seabirds (including T & E spp.)
Are distribution, abundance, other population characteristics, or habitat changing? Determine population levels over time. Population surveys Abundance / density, distribution 3.5
Monitor population size and distribution of native, endemic, or focal species, including response to restoration efforts. Where appropriate, measure demographics (size/age structure, reproduction, recruitment, etc.) of selected indicator species
T27 Shorebirds and Water birds (including T & E spp.)
Are distribution, abundance, other population characteristics, or habitat changing? Determine population levels over time. Population surveys Abundance / density, distribution 3.3
T30 Established Disease & Pathogens of Terrestrial Vertebrates
What is the incidence and level of disease in populations? Are diseases/pathogens affecting populations? What are trends in disease/pathogen?
Continue to monitor bird, bat, and herp populations (VCP, mist-netting) incidence, Presence/ absence 2.5
Monitor disease incidence and impacts, especially on native species
T31 Alien Incipient Disease & Pathogens of Terrestrial Vertebrates
Where are disease locations outside parks? What species are they affecting? What are rates and directions of spread? Identify existing disease/pathogen incidence, impact, and trends
Surveys in high risk sites; passive surveillance,; education, outreach, public reporting, and follow-up
Presence/absence, rapid assessment of extent of infestations (distribution, identification and numbers of host and/or vector species involved)
2.5
Monitor extent and response to treatment of established invasive species
T34 Established Alien Species - Predatory Terrestrial Vertebrates
Are native plant and animal species abundance or distribution changing in response to predators or predator control? What are trends in invasive species populations?
Treatment and control Transects/plots (for plants); other methods appropriate for native vertebrates of interest (VCP, transects, etc.); population surveys for predators
Plants: species composition, population and/or community structure. Animals: VCP, transects, other methods to monitor critical life stages identified as impacted by predators. Predator population indices, presence/ absence
3.4
Biotic Integrity
Terrestrial Ecosystem
s
Consum
ers
Population
Monitor occurrence of non-established (incipient) invasive species
T37 Alien Incipient Invasives - Predatory Terrestrial Vertebrate
Is species present, if so what is the nature and extent of infestation? What are the most effective strategies for detecting and preventing new invasives species? Where should efforts be focused? What are potential impacts?
Passive surveillance and follow-up on reports; education, outreach, and public reporting; surveys in high- risk sites
Predator population indices, presence/ absence, rapid assessment of extent of infestation 3.3

Appendix O: Part IV Vital Signs Workshops
56
Revised Vital Signs: Birds and Bats Eco Char
Vital Sign Category Monitoring Objectives VS
Id# Vital Sign Monitoring Question(s) Monitoring Method Measures (Metrics) COMMENTS / NOTES
Com
munity
Detect changes in the dynamics, structure, composition and/or function of selected communities within defined geographic areas. Periodically inventory to document new species in parks.
T19 Terrestrial Vertebrate Biodiversity (including off-shore islet refugia)
Are selected native vertebrate communities or guilds changing? This includes changes in abundance of selected species (determined from population surveys), and/or changes in the identity and number of species present in the community or guild of interest (determined from presence/absence monitoring).
Population surveys, presence/absence surveys. Periodic inventories focused on picking up new species records and/or locations.
Within defined areas or specified communities: abundance and trends of selected vertebrate species or groups, species richness
T23 Native and alien forest Bird and Bat populations (can include T & E spp.)
Are the demographics of native, endemic, or focal forest bird and bat species changing? If so, are changes deleterious, and can we control or reduce threats to these populations?
Population surveys, including demographic measures (size/age structure, reproduction, recruitment, etc.) and prevalence of disease, pathogens, and/or population threats. (Forest bird methods differ from those for raptors or bats; and fruit bat methods will differ from insectivorous bats.)
Population demographics, density, distribution. Prevalence of disease, pathogens, other population threats.
Monitor population health by detecting
changes in population size and distribution of native and non-native, endemic, or focal species, including
response to restoration efforts. Where appropriate, measure
demographics (size/age structure, reproduction, recruitment, etc.) of
selected indicator species T26-27
Seabird, Shorebird and Waterfowl populations (can include T & E spp.)
Are the demographics of native, endemic, or focal seabird, shorebird, and waterbird species changing? If so, are changes deleterious, and can we control or reduce threats to these populations?
Population surveys, including demographic measures (size/age structure, reproduction, recruitment, etc.) and prevalence of disease, pathogens, and/or population threats. (Methods will differ for seabirds, shorebirds, and waterbirds.)
Population demographics, density, distribution. Prevalence of disease, pathogens, other population threats. (For seabirds, probably focusing on nesting or roosting habitat vs. at-sea habitat except possibly for near-shore feeders.)
Assess health of terrestrial vertebrate populations, particularly sensitive, native species. Detect, identify, and quantify causes of mortality and morbidity and their impacts on the populations. Provide early detection information to help prevent occurrence and/or spread of potential new threats to popns.
T30-31
Wildlife (terrestrial vertebrate) health and targeted monitoring for disease/pathogens, esp. among native species (can include T & E)
What are the prevalences and levels (how severe), and trends in known causes of morbidity and mortality in targeted popns? Where cause-effect is clearly established, are these affecting the populations? For targeted potential (incipient) causes of mortality and morbidity: are these present in popn or geographic area of concern? Are they present in other popns or in locations outside the immediate area of concern? If so, what are rates and directions of spread?
Known causes: specimen and/or carcass collection (may include telemetry to recovery carcasses), host or vector surveys/sampling; surveys of affected populations to determine popn status and impacts. Potential causes: Surveys in high risk sites; passive surveillance (opportunistic carcass or sick animal collection); education & outreach to encourage public reporting; survey or report follow-up where needed; rapid assessment of extent of any infestations
Disease or threat prevalence, level, or presence/ absence; distribution and numbers of host and/or vector species involved; abundance or density of affected population. Potential causes: presence/absence; distribution, ID, and numbers of host and/or vector spp.
Research needed: for some diseases/pathogens, contaminants, etc., we may need to establish the link between the threat and what it does to the popn, so that we can be sure that popn monitoring is telling us about the impact of that particular threat.
Monitor extent and effects of predatory and omnivorous alien terrestrial verts, and monitor their response to management treatment.
T34
Status of Established Alien Predatory and Omnivorous Terrestrial Vert Species, and Response to Treatment
Are native plant and animal species' abundance or distribution changing in response to predatory or omnivorous invasives, or in response to efforts to control these invasives? What are trends in predatory and omnivorous invasive species populations?
Treatment and control transects, plots, or sites using appropriate methods to assess both invasive and native organisms of interest (VCP, transects, etc.); surveys for predators using appropriate methods to estimate population size and distribution
Plants: species composition, population and/or community structure. Animals: abundance or density, possibly presence/absence, and/or other measures of critical life stages identified as impacted by predators. Predators: population indices, presence/ absence, mapping.
Biotic Integrity
Terrestrial Ecosystem
s
Consum
ers
Population
Monitor for invasive terrestrial vertebrate species known to pose potential ecological threats (incipient species). Where appropriate, monitor response of these invasive species to management treatment.
T37
Targeted monitoring for (incipient) invasive terrestrial vertebrate species known to pose potential threats
Is species present? If so, what is the nature and extent of infestation? Are native plant and animal species' abundance or distribution changing in response to the invasive or its control? What are the pathways and points of entry?
Detection: surveys in high- risk sites; follow up on reports; education and outreach to encourage public reporting. Impacts and response to treatment: treatment and control transects, plots, or sites using appropriate methods to assess both invasive and native organisms of interest (VCP, transects, etc.); surveys for non-established predators using appropriate methods to estimate population size and distribution.
Presence/ absence; predator population indices and mapping; rapid assessment of infestation extent. Native plants: species composition, population and/or community structure; native animals: abundance or density, possibly presence/absence, and/or other measures of critical life stages identified as impacted by predators.
Research needed: What are the most effective strategies for detecting and preventing new invasives species? Where should efforts be focused?
National Park Service 57
Fresh Water Biology Topical Session
Participants:
Sonia Stephens (facilitator) Fritz Klasner (notes) Alison Sherwood Anne Brasher Bob Kinzie Tara Sim Dan Polhemus Sallie Beavers Doug Neighbor JP Michaud Darcy Hu Karl Magnacca Kimber DeVerse
Session Notes:
The group approached the discussion of Vital Signs by discussing each Vital Sign in order, either accepting it “as is” or recommending changes. Suggestions for methods and measures were made as we discussed each Vital Sign. General comments (including potential partners for monitoring) and specific comments were recorded on separate flip chart pages.
Initial Vital Sign - Specific Comments: Vital Sign P17 – Flowing surface water hydrology
• Split into 3 components-
• flow regime-floods & droughts, as well as base flow regime • erosion/channel morphology • water diversion quantity
• Measures: roughness, erosion=sediment influx, salinity & pH Vital Sign P18 – Wetlands (incl. anachialine pools) hydrology
• Does it include ponds/lakes, high-elevation ponds & bogs (lentic)? • Habitat extent in anchialine ponds: how do you quantify connectivity?
Vital Sign P33 – surface Water Quality – macro invertebrates • From Water Quality discussion-we are a long way from being able to use invertebrates as
indicators of water quality, this needs basic research • Add algae to invertebrates • Measures: species richness, composition, biomass
Vital Sign F1 – Community dynamics of primary producers • What are rates of productivity? • Productivity also from bacteria (Kauhako Crater-KALA); is it production of biomass or
photosynthetic activity that is of interest? (primary is biomass, also delete ‘normal’) • Community dynamics requires elaboration on time • Expand to include riparian species as well- same as F2, but for plants • Why limited to benthic, esp. in lakes/ponds? • Remove demographics (too vague)
Vital Sign F2 – Aquatic and Riparian Species (vertebrate and invertebrate) Biodiversity • Would include non-natives, and other fauna of special concern • ‘Trends in abundance or distribution of selected species or groups’
Vital Sign F3 – Freshwater Animals Disease & Pathogen • Includes parasites
Appendix O: Part IV Vital Signs Workshops
58
• ‘Are diseases or pathogens affecting populations’ is more a research question • Monitoring focus could be catching & documenting epidemics • Methods: remove tissue samples, include opportunistic sampling of dead individuals for
analysis, just field notes; ‘vectors’ needs to be clarified or removed • May/may not qualify for monitoring
Vital Sign F4 – Amphidromous Fauna Size-Age Structure, Reproduction and Recruitment • Replace ‘amphidromous fauna’ with ‘fauna of special concern’ or ‘focal species’ or ‘native or
selected species’ • Normal range of variation is not clear
Vital Sign F5 – Established Alien Species – Predatory Freshwater (vertebrate and invertebrate) • Aquatic rather than limited to fresh water (applies to F6/F3 too) • Remove “predatory” • Monitoring question needs rephrasing; remove management strategies • Methods: add mapping, trends, density • Clarify periodic sampling i.e., netting quadrats
Vital Sign F6 – Alien Incipient Invasives – Predatory Freshwater (vertebrate and invertebrate) • Include monitoring of known pathways, sampling outside parks • ‘Potential impacts’ is a research question
Transcription of General Comments:
• Divide freshwater ecosystems into lentic (still water) & lotic (running water) habitats (both in the ecological organization & some vital signs).
• When ‘distribution’ is a measure, include ‘mapping’ as a method (applies to all vital signs). • Prioritization • P33 is lowest priority, since more research is needed to make it a workable method in the
Pacific. • Plants & algae need more emphasis, as they are often overlooked. • Potential partners • STI can do remote sensing of benthic & aquatic areas
Synthesis of Main Points from Session Comments:
The group brought up several suggestions about changes to Vital Sign wordings and clarifications of intent. In many cases, suggestions were made on refining monitoring methods and measures.
The subject of flowing surface water hydrology was clarified in the discussion as having 3 components: water flow, erosion & channel morphology, and quantity of water being diverted. It was also suggested that there was a need to clarify the scope and intent of the non-flowing surface water Vital Sign.
Suggestions were made that the ecological organization of the freshwater Vital Signs be modified to show the diversity of ecosystems within the parks (lentic & lotic distinctions). For example, the marine Vital Signs were divided into benthic, intertidal, and ‘water-column’ categories, so freshwater Vital Signs would be separated into flowing and non-flowing categories.
Monitoring invertebrate and algal communities as water quality indicators was discussed as a future goal to work towards, but this is an area in which further research needs to be done
National Park Service 59
(especially in Guam, American Samoa, and the CNMI) before this can be implemented as a Vital Sign.
Recommendations were made that the ‘primary producers’ Vital Sign (F1) be expanded to include plankton, bacteria, and riparian vegetation. Comments were also made that primary producers are often overlooked, which is a concern.
Suggestions were made that Vital Sign (F2) include non-native species and species of special concern. There were also suggestions that F4 be expanded to include all focal species, not just amphidromous ones.
It was suggested that disease monitoring in animals could be opportunistic sampling of dead individuals or notes on health taken during other surveys. As such, you may not specifically need to have this as a vital sign.
Suggestions on invasive species vital signs: established invasive species should include non-predatory species, and incipient invasive species monitoring should include the monitoring of known pathways of introduction.
Responses to Main Points Raised During Session:
The Vital Sign related to flowing surface water (P17) was split into 3 separate Vital Signs (stream hydrology, stream channel habitat dynamics, and water diversion levels). A “water diversion level” Vital Sign was also discussed briefly in the Water Quality session, so comments from these two discussions were integrated. The scope of the non-flowing surface water hydrology Vital Sign (P18) was also clarified.
The structure of the freshwater ecological organization was not changed to reflect the distinction between flowing and non-flowing surface water ecosystems; it was decided that this would lead to quite a bit of replication of vital signs. However, new vital signs were added to make the distinction between wetland/riparian and aquatic species where appropriate. The organization of marine vital signs has also been changed (removing the benthic/intertidal/water-column categories) to be more similar to the freshwater & terrestrial organizations.
It was agreed that monitoring aquatic communities as an indicator of water quality is potentially a very powerful ecological indicator, though it needs further research in the Pacific. With clarified wording, this Vital Sign was left on the list for future consideration.
The ‘primary producers’ Vital Sign was split into two: ‘Aquatic primary producers’ (including benthic & planktonic organisms) and ‘Wetland & riparian plants’. This split reflects the distinction between these two functional groups as well as emphasizing their importance to aquatic ecosystems.
Vital Sign F2 was intended to look at trends in community diversity, rather than at particular species, so would include all species present (including non-native and focal species). It has been re-worded to clarify the distinction between a community-level Vital Sign and a population-level Vital Sign. Vital Sign F4, intended to look at population dynamics of individual species, has been changed to include all native focal species. Different focal species may be chosen in different ecosystems according to appropriateness (e.g., Megalagrion xanthomelas in KAHO anchialine pools). It was felt that alien species would be monitored.
The Vital Sign of disease in freshwater animals was re-worded and left on the list, but the suggestion that disease monitoring could be included as part of overall monitoring of population or community dynamics will be taken into account when protocols for community sampling are developed.

Appendix O: Part IV Vital Signs Workshops
60
Invasive species Vital Signs were modified to include non-predatory species and possible pathways of introduction. Both established and incipient invasive plant/algae species Vital Signs were added.
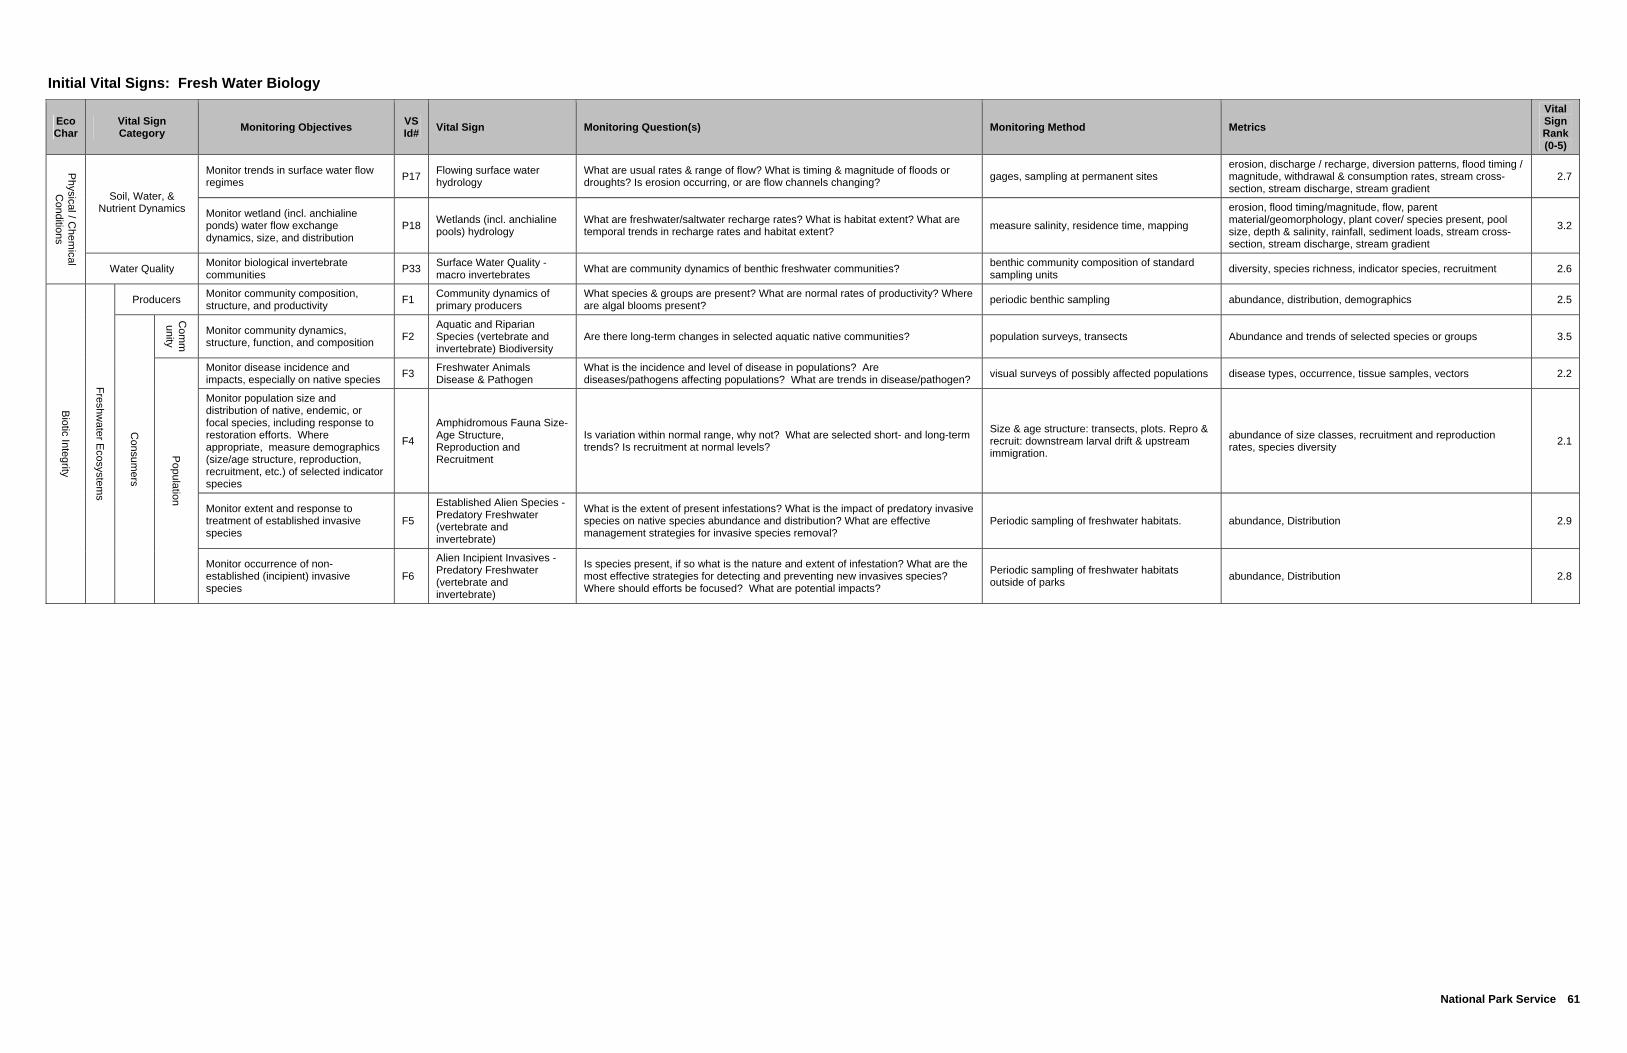
National Park Service 61
Initial Vital Signs: Fresh Water Biology
Eco Char
Vital Sign Category Monitoring Objectives VS
Id# Vital Sign Monitoring Question(s) Monitoring Method Metrics Vital Sign Rank (0-5)
Monitor trends in surface water flow regimes P17 Flowing surface water
hydrology What are usual rates & range of flow? What is timing & magnitude of floods or droughts? Is erosion occurring, or are flow channels changing? gages, sampling at permanent sites
erosion, discharge / recharge, diversion patterns, flood timing / magnitude, withdrawal & consumption rates, stream cross-section, stream discharge, stream gradient
2.7
Soil, Water, & Nutrient Dynamics Monitor wetland (incl. anchialine
ponds) water flow exchange dynamics, size, and distribution
P18 Wetlands (incl. anchialine pools) hydrology
What are freshwater/saltwater recharge rates? What is habitat extent? What are temporal trends in recharge rates and habitat extent? measure salinity, residence time, mapping
erosion, flood timing/magnitude, flow, parent material/geomorphology, plant cover/ species present, pool size, depth & salinity, rainfall, sediment loads, stream cross-section, stream discharge, stream gradient
3.2
Physical / C
hemical
Conditions
Water Quality Monitor biological invertebrate communities P33 Surface Water Quality -
macro invertebrates What are community dynamics of benthic freshwater communities? benthic community composition of standard sampling units diversity, species richness, indicator species, recruitment 2.6
Producers Monitor community composition, structure, and productivity F1 Community dynamics of
primary producers What species & groups are present? What are normal rates of productivity? Where are algal blooms present? periodic benthic sampling abundance, distribution, demographics 2.5
Com
munity
Monitor community dynamics, structure, function, and composition F2
Aquatic and Riparian Species (vertebrate and invertebrate) Biodiversity
Are there long-term changes in selected aquatic native communities? population surveys, transects Abundance and trends of selected species or groups 3.5
Monitor disease incidence and impacts, especially on native species F3 Freshwater Animals
Disease & Pathogen What is the incidence and level of disease in populations? Are diseases/pathogens affecting populations? What are trends in disease/pathogen? visual surveys of possibly affected populations disease types, occurrence, tissue samples, vectors 2.2
Monitor population size and distribution of native, endemic, or focal species, including response to restoration efforts. Where appropriate, measure demographics (size/age structure, reproduction, recruitment, etc.) of selected indicator species
F4
Amphidromous Fauna Size-Age Structure, Reproduction and Recruitment
Is variation within normal range, why not? What are selected short- and long-term trends? Is recruitment at normal levels?
Size & age structure: transects, plots. Repro & recruit: downstream larval drift & upstream immigration.
abundance of size classes, recruitment and reproduction rates, species diversity 2.1
Monitor extent and response to treatment of established invasive species
F5
Established Alien Species - Predatory Freshwater (vertebrate and invertebrate)
What is the extent of present infestations? What is the impact of predatory invasive species on native species abundance and distribution? What are effective management strategies for invasive species removal?
Periodic sampling of freshwater habitats. abundance, Distribution 2.9
Biotic Integrity
Freshwater E
cosystems
Consum
ers
Population
Monitor occurrence of non-established (incipient) invasive species
F6
Alien Incipient Invasives - Predatory Freshwater (vertebrate and invertebrate)
Is species present, if so what is the nature and extent of infestation? What are the most effective strategies for detecting and preventing new invasives species? Where should efforts be focused? What are potential impacts?
Periodic sampling of freshwater habitats outside of parks abundance, Distribution 2.8
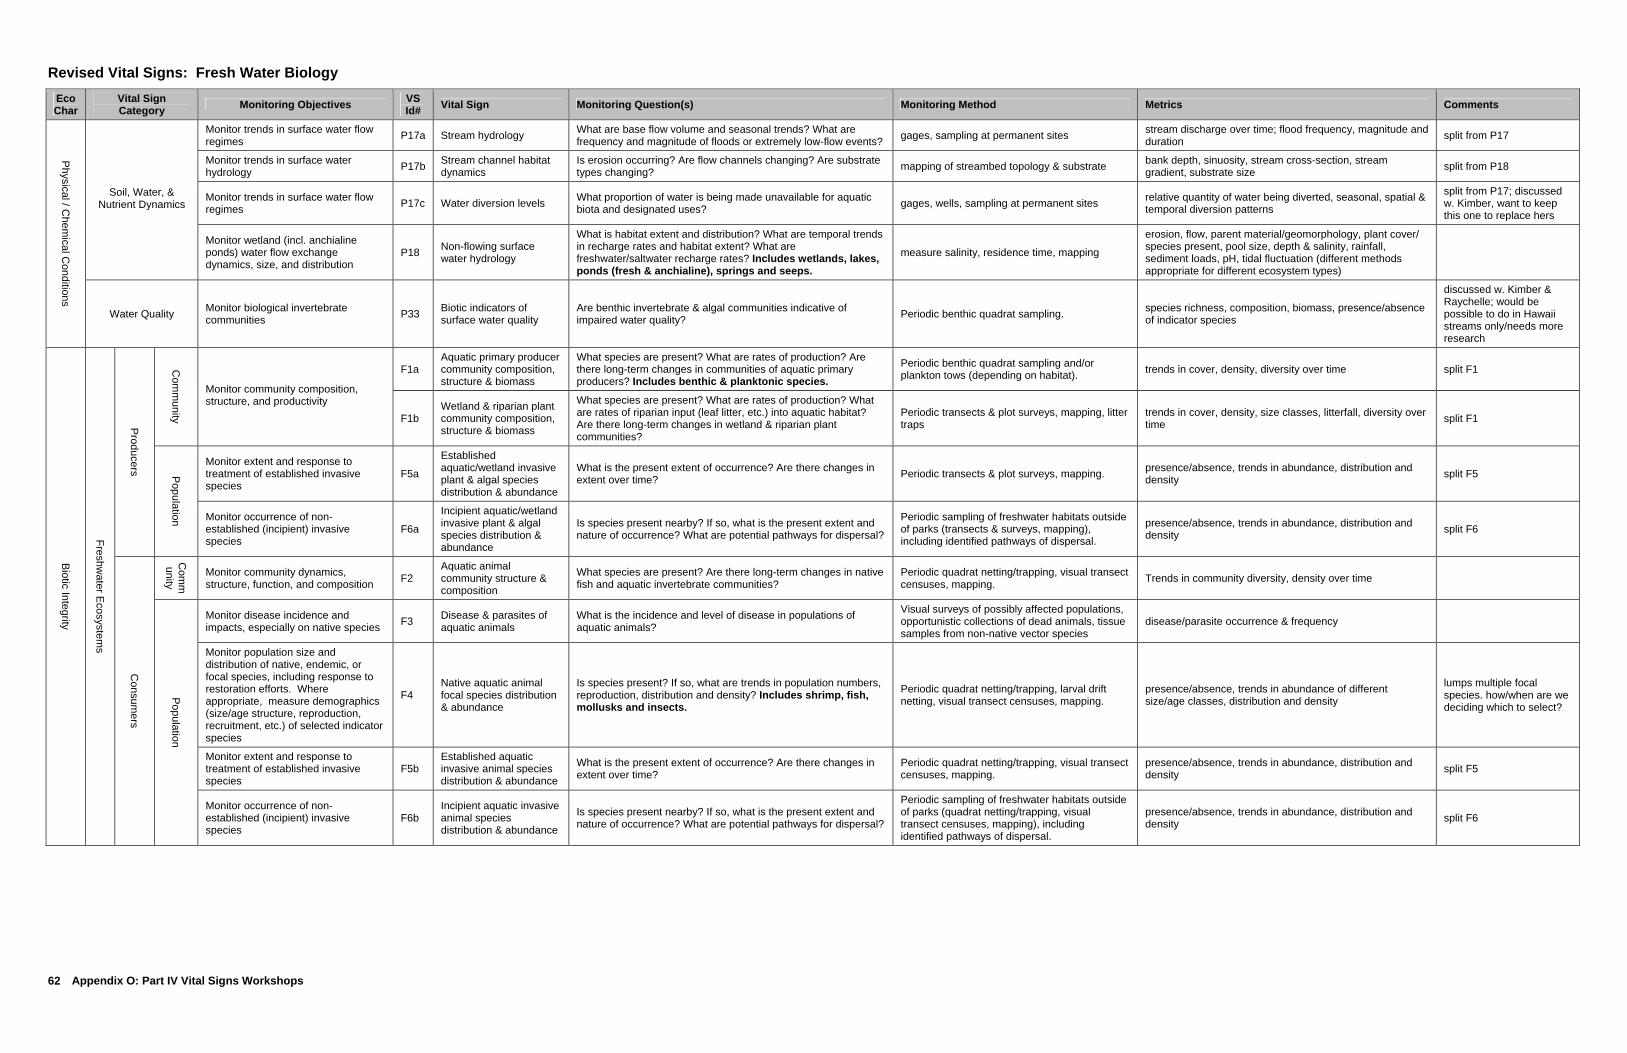
Appendix O: Part IV Vital Signs Workshops
62
Revised Vital Signs: Fresh Water Biology Eco Char
Vital Sign Category Monitoring Objectives VS
Id# Vital Sign Monitoring Question(s) Monitoring Method Metrics Comments
Monitor trends in surface water flow regimes P17a Stream hydrology What are base flow volume and seasonal trends? What are
frequency and magnitude of floods or extremely low-flow events? gages, sampling at permanent sites stream discharge over time; flood frequency, magnitude and duration split from P17
Monitor trends in surface water hydrology P17b Stream channel habitat
dynamics Is erosion occurring? Are flow channels changing? Are substrate types changing? mapping of streambed topology & substrate bank depth, sinuosity, stream cross-section, stream
gradient, substrate size split from P18
Monitor trends in surface water flow regimes P17c Water diversion levels What proportion of water is being made unavailable for aquatic
biota and designated uses? gages, wells, sampling at permanent sites relative quantity of water being diverted, seasonal, spatial & temporal diversion patterns
split from P17; discussed w. Kimber, want to keep this one to replace hers
Soil, Water, & Nutrient Dynamics
Monitor wetland (incl. anchialine ponds) water flow exchange dynamics, size, and distribution
P18 Non-flowing surface water hydrology
What is habitat extent and distribution? What are temporal trends in recharge rates and habitat extent? What are freshwater/saltwater recharge rates? Includes wetlands, lakes, ponds (fresh & anchialine), springs and seeps.
measure salinity, residence time, mapping
erosion, flow, parent material/geomorphology, plant cover/ species present, pool size, depth & salinity, rainfall, sediment loads, pH, tidal fluctuation (different methods appropriate for different ecosystem types)
Physical / C
hemical C
onditions
Water Quality Monitor biological invertebrate communities P33 Biotic indicators of
surface water quality Are benthic invertebrate & algal communities indicative of impaired water quality? Periodic benthic quadrat sampling. species richness, composition, biomass, presence/absence
of indicator species
discussed w. Kimber & Raychelle; would be possible to do in Hawaii streams only/needs more research
F1a Aquatic primary producer community composition, structure & biomass
What species are present? What are rates of production? Are there long-term changes in communities of aquatic primary producers? Includes benthic & planktonic species.
Periodic benthic quadrat sampling and/or plankton tows (depending on habitat). trends in cover, density, diversity over time split F1 C
omm
unity
Monitor community composition, structure, and productivity
F1b Wetland & riparian plant community composition, structure & biomass
What species are present? What are rates of production? What are rates of riparian input (leaf litter, etc.) into aquatic habitat? Are there long-term changes in wetland & riparian plant communities?
Periodic transects & plot surveys, mapping, litter traps
trends in cover, density, size classes, litterfall, diversity over time split F1
Monitor extent and response to treatment of established invasive species
F5a
Established aquatic/wetland invasive plant & algal species distribution & abundance
What is the present extent of occurrence? Are there changes in extent over time? Periodic transects & plot surveys, mapping. presence/absence, trends in abundance, distribution and
density split F5
Producers P
opulation Monitor occurrence of non-established (incipient) invasive species
F6a
Incipient aquatic/wetland invasive plant & algal species distribution & abundance
Is species present nearby? If so, what is the present extent and nature of occurrence? What are potential pathways for dispersal?
Periodic sampling of freshwater habitats outside of parks (transects & surveys, mapping), including identified pathways of dispersal.
presence/absence, trends in abundance, distribution and density split F6
Com
munity
Monitor community dynamics, structure, function, and composition F2
Aquatic animal community structure & composition
What species are present? Are there long-term changes in native fish and aquatic invertebrate communities?
Periodic quadrat netting/trapping, visual transect censuses, mapping. Trends in community diversity, density over time
Monitor disease incidence and impacts, especially on native species F3 Disease & parasites of
aquatic animals What is the incidence and level of disease in populations of aquatic animals?
Visual surveys of possibly affected populations, opportunistic collections of dead animals, tissue samples from non-native vector species
disease/parasite occurrence & frequency
Monitor population size and distribution of native, endemic, or focal species, including response to restoration efforts. Where appropriate, measure demographics (size/age structure, reproduction, recruitment, etc.) of selected indicator species
F4 Native aquatic animal focal species distribution & abundance
Is species present? If so, what are trends in population numbers, reproduction, distribution and density? Includes shrimp, fish, mollusks and insects.
Periodic quadrat netting/trapping, larval drift netting, visual transect censuses, mapping.
presence/absence, trends in abundance of different size/age classes, distribution and density
lumps multiple focal species. how/when are we deciding which to select?
Monitor extent and response to treatment of established invasive species
F5b Established aquatic invasive animal species distribution & abundance
What is the present extent of occurrence? Are there changes in extent over time?
Periodic quadrat netting/trapping, visual transect censuses, mapping.
presence/absence, trends in abundance, distribution and density split F5
Biotic Integrity
Freshwater E
cosystems
Consum
ers
Population
Monitor occurrence of non-established (incipient) invasive species
F6b Incipient aquatic invasive animal species distribution & abundance
Is species present nearby? If so, what is the present extent and nature of occurrence? What are potential pathways for dispersal?
Periodic sampling of freshwater habitats outside of parks (quadrat netting/trapping, visual transect censuses, mapping), including identified pathways of dispersal.
presence/absence, trends in abundance, distribution and density split F6

National Park Service 63
Vegetation (Vascular and Non-vascular Plants) Topical Session
Participants:
Linda Pratt (facilitator) Ilana Stout (notes) Art Whistler Lynn Raulerson Fern Duvall Tim Tunison Bryan Harry Karen Poiani Coleen Cory Guy Hughes Rhonda Loh Ryan Monello Curt Daehler Penny Latham Don Drake Patti Welton Sonia Juvik Lloyd Loope Joshua Seamon Daniel Kawaiaea J.P. Michaud Steve Hess Ben Saldua Karl Magnacca Sonia Stephens Jean Licus Grant Kaye Dieter Mueller-Dombois Melia Lane-Kamahele
Session Notes:
The two sessions on Vegetation ran concurrently and during the first session we addressed each vital sign individually. We began discussing each vital sign in detail, but changed tactics in the first session to identify which vital signs needed modification and return to them for specific comments. By the end of the first session we had identified three sets of 2-3 Vital Signs that were similar enough in questions and methods to combine. Five new vital signs were proposed. In the second session, the group revisited the individual vital signs to refine the monitoring questions and suggest more detailed methods and metrics to better match the questions and new focus of several vital signs. In general, there was consensus that the vital signs and questions needed to be worded carefully to make clear what specific subject was being addressed by proposed monitoring. There were a number of comments regarding the need to include important processes in monitoring. Non-vascular plants were discussed by the group, and there was general agreement that they could be included in several vital signs. Rankings were considered briefly, but participants did not feel strongly about the overall question of ranking, and there was recognition that vegetation signs were not ranked as a group but as part of all the topics combined. Ranks of two specific vital signs were deemed lower than warranted. Partnerships were discussed at the end of the session, and the group expressed interest in shared and consistent monitoring targets and methods among agencies and organizations managing similar or adjacent lands.
Initial Vital Signs – Specific Comments: Vital Sign T3 – Landscape Fragments, Patch Size, and Land Cover
• Clarify distinction between T3 and T7. T3 has more of a land cover emphasis, while T7 is more community based.
• What is this sign trying to detect? Landscape Pattern? Patch Viability? –Seems too general as currently stated. Methods/Metrics:
• Change “photography” to ”imaging.” • Add metrics as appropriate from #T4. • Take out FRAGSTST, change to “spatial statistics.” We don’t need to specify the program in
metrics.

Appendix O: Part IV Vital Signs Workshops
64
Vital Sign T4 – Fire Effects and Dynamics: Vegetation and Landscape Level • “What is natural fire frequency?” is a research question. Change to “What is the
current/recent fire regime and what are its implications?” • “Current /recent fire regime” includes fire intensity and anthropogenic issues such as arson as
ignition source. • Break this into two different vital signs: a) landscape-level monitoring questions, and b) a
second with community-level monitoring questions. • Add monitoring questions that deal specifically with T& E Species. • Remove “what are the biogeochemical effects of fire?” –it is a research question.
Methods/Metrics: • Add community level metrics, T& E metrics #T5. • Add extent/distribution of dieback, mapping component.
Vital Sign T5 – Forest Dieback • Don’t limit this to trees. In first monitoring question listed change “trees” to “native
components of natural vegetation”. • Monitoring Objective: Change from “Track insect and disease presence during forest
dieback” to “Track patterns of forest dieback or vitality”. • Add consideration of history of disturbance, landscape history & stand history. • Change to include native disease, fungi, etc. • Not necessarily/only disease related dieback. • Comment from handout: “disturbance would be on landscape level, effects would be on
community level”. Vital Sign T6 – Terrestrial Plant Biodiversity
• Identify which plant species are T&E, rare • Include abundance, presence or absence • Change to specifically address “rare and focal plant communities.” • Take out “short-term changes.” • Change from “native plant communities” to “communities of interest.” • Comment written after the session: “Biodiversity has different scales and is NOT community
change. If we want a biodiversity vital sign, it is a different approach/ question.” Methods/Metrics:
• Needs methods to address biodiversity both across and within communities. • Needs metrics addressing structure. • Methods and metrics should be compatible. • Include something about the spatial relation of the trees? (NPSA).
Vital Sign T7 – Long-Term Plant Succession • Change monitoring question to short-term and long-term plant succession. • Specifically include structure of epiphyte community and changes in epiphytes.
Methods/Metrics: • Change “plots” to “permanent plots.” • Needs metrics addressing structure. • Methods & metrics should be compatible. • Include something about the spatial relation of the trees? (NPSA)

National Park Service 65
Vital Sign T8 – Recovery/Change of Native Vegetation with Alien Plant Control and Vital Sign T9 – Recovery/Change of Native Vegetation with Feral Ungulate Control and Vital Sign T10 – Recovery/Change of Native Vegetation with Invasive Alien Invertebrate Control
• Combine three vital signs as one vital sign relating to management; change monitoring question to: “What are trends in plant community composition and structure following management (including alien plant control, feral ungulate control, invasive alien invertebrate control etc)?”
• Include looking at biodiversity and common or dominant species or community types. • Comments from handout: Broaden monitoring questions to include: T9-Add provision for
known density of ungulates (monitor ungulates) T10- Effect of management on alien plants (response of alien plants ) If combined- Effect of alien species control on other alien species.
Vital Sign T11 – Invertebrate Biocontrol of Plants and Vital Sign T12 – Plant Pathogen Biocontrol of Plants
• Combine these two vital signs into one. • Don’t just rely on infestation rates: look at demography and impacts. • Add need for longer term monitoring of biocontrol effects.
Vital Sign T13 – Native Plant Species Protection (including T & E and SOC) • Add “is the number of rare plant species increasing or decreasing?” • Add consideration of processes contributing to rarity- e.g. Seed dispersal, herbivory. • Not just T & E, SOC- also include park-specific focal species or species of special concern.
Vital Sign T14 – Established Plant Disease and Pathogens and Vital Sign T15 – Alien Incipient Plant Disease and Pathogens
• Combine two vital signs into one. • Structure as plant/community health monitoring instead. • Related to #T5 but population vs. landscape level objectives (need to illustrate these linkages
somewhere). • Should include native and alien infestation (disease, pathogen) • Comment from handout: “Causes of mortality and morbidity”.
Vital Sign T38 – Alien Incipient Invasives - Fungi • Possibility of lumping this sign with #T14 & #T15, but need comments from someone with
more expertise first: Suggestion to ask Don Hemmes. Vital Sign T16 – Established Alien Species – Plants
• Relative abundance of natives and invasives and consideration of non-vascular invasives have been incorporated into the monitoring questions.
Vital Sign T17 – Alien Incipient Invasive Plants • Change to include monitoring of processes (dispersal etc.); also consider this comment with
appropriate invasives section Vital Signs. • Include monitoring of impact on natives. • Need initial risk assessment for specific incipient invasive plants. • Comment from handout: “include monitoring of seedbank processes to predict changes”.
Vital Sign F1 – Community Dynamics of Primary Producers • Clarify monitoring question to also include wetland & riparian areas and vegetation
surrounding anchialine pools. • Change “what are normal rates…” to “determine current rates…” as it is currently worded,
this is a research question, not a monitoring question.

Appendix O: Part IV Vital Signs Workshops
66
• As in #T38, we are in need on more expertise; contact suggestion is Allison Sherwood at University of Hawai`i-Manoa.
• Native vs. alien plant species not clear. • Anchialine pools; what is role of vegetation in aging pools?
Potential New Vital Signs:
Vital sign - incorporating the Ahupua’a Concept
• Basis for monitoring & as a model to organize landscape information. • Could include in existing #T3. • Would address monitoring goal #6. • Primarily applicable for larger Hawaii parks- but will also affect small parks. • Concept also relates to water group (e.g. Stream flow).
Comments from handout: Ahupua`a concept should actually become the premise for
which these vital signs are applied.(Not sure if AMME/WAPA / NPSA have a similar native concept?)
Believe this focus (as applicable) would be beneficial because it:
1) Encompasses pretty much all the ecosystems/major categories to be monitored in the parks.
2) Represents probably the pristine conditions and desired level to which, if we had resources and capability, we would restore the parks.
3) It reflects the human association with the resources. 4 It becomes an important marketing aspect for partnerships and with which to gain local
community support/ land changes. 5) Provides numerous educational opportunities based on traditional Hawaiian practices
(Practices for conservation, careful observation of nature etc.). 6) Provides the opportunity to relate applied science and techniques to traditional
practices (transitioning efforts and terms to lay terms and people), improving communications to a wider audience.
7) Would become the catalyst that reunites natural and cultural resources, which to me, in Hawaii are inseparable.
Vital Sign - Other Catastrophic Events • Address impacts of catastrophic events other than fire on vegetation (communities?
landscapes?). • Include typhoon/ hurricanes etc.
Vital Sign - Relative abundance of natives/invasives in untreated communities • Possibly could be included in T6 or T16. • Include impact of invasives on natives.
Vital Sign - Monitor seed bank/ seed bank processes • Relative abundance of native and invasive seed in areas of concern/ managed areas.
Vital sign - Fire Effects and Dynamics at Community level. • What are the effects of fire on specific vegetation communities of interest.

National Park Service 67
Ranking/Priorities:
Vital Sign T3: Rank seems low, this is an important sign for large parks. Vital Sign T5: Rank seems low, this is an important driver for systems.
General Comments: Where is the role of pollinators being addressed?
• May need new Vital Sign to monitor reproduction of plants with rare or declining pollinators. • Possible metric: are seeds being set?
For landscape-level vital signs: • Explicitly identify related community and population vital signs.
Include land use history for some vital signs. • Method: investigate tenure, specifically who owned or managed land etc.
Monitor processes • Could these be included or is this more research-based? This depends on objectives of
monitoring. Non-Vascular Plants
• Add consideration of non-vascular plants to other vital signs (T16, T6, T7, T13, T17). • Do we know enough about the role of non-vascular plants as incipient aliens? • Where do Lichens fit?
Add linkages column that indicates other vital signs that are closely related- will be necessary to identify the most closely related linkages (e.g. the top 3) so you don’t end up with every vital sign linked.
How frequently and how long do you have to monitor before you have a long-term trend? Consider appropriate methods for handling tropical growth (multiple trunks, above
ground roots etc.)
Ideas for Possible Partnership Opportunities:
• Highly ranked vital signs from this session seem comparable to The Nature Conservancy Heritage’s high monitoring priorities
• Where possible strive for consistency of methods with partners so can share data. • State lands • Investigate `Ola`a-Kilauea Partnership monitoring. • Early Detection Network- DLNR, USFS and others (consult with Lloyd Loope).
Synthesis of Main Points from Session Comments, and Responses:
There were suggestions to improve each of the original 17 Vegetation Vital Signs; none was left in its original form. There was a general desire for more specificity in Monitoring Questions, Methods, and Metrics. Several comments were received regarding the need for the methods and methods to better match each other and the monitoring questions. Clarifications and changes to vital signs have been incorporated into the revised Vital Signs document, as suggested by participants at the session. The vital signs on landscape fragments and forest dieback were rewritten with additional monitoring questions to refine the intent of the monitoring.

Appendix O: Part IV Vital Signs Workshops
68
The idea of creating a column to illustrate “linkages” between related vital signs came up several times and has been incorporated to revised vital signs for the vegetation group.
New vital signs have been created for Other Catastrophic Events and Fire Effects and Dynamics at the Community level. Suggestions for three other new vital signs were not adopted, but the proposed concepts were added to related vital signs in the original list.
Relative abundance of natives/invasives in untreated communities, land use history, and seedbank and pollination processes have each been incorporated into several existing vital signs.
It seems more appropriate to include a recommendation to monitor along Ahupua`a (or other traditional land use division) boundaries in the methods for existing vital signs, rather than to create a new Ahupua`a Vital Sign. The ahupua`a concept has been incorporated into existing vegetation section Vital Signs as appropriate and the suggestion will be passed on to other workgroups as well (Landscape, and others?) This system will be for the collection of data and will not drive the sampling design.
There was general agreement that it was not necessary to split up similar vital signs along traditional lines of organism groups or to split up vital signs related to management activities. Following these suggestions we combined vital signs as follows: three management related topics (T8, T9, and T10), two biocontrol subjects (T11 and T12), and two plant disease signs (T14 and T15).
Two vital signs require additional input from specialists. Participants commented that experts on fungi and freshwater systems should be consulted to revise T38 and F1 vital signs.
Questions and comments on details of monitoring, such as the frequency and duration of monitoring to determine a long-term trend and appropriate methods for handling tropical growth will be addressed in monitoring protocols written for high priority vital signs. The issue of consistency of methods to allow sharing of data and analyses with partners will be covered in the next phase of the monitoring plan.

National Park Service 69
Initial Vital Signs: Vegetation
Eco Cha
r Vital Sign Category Monitoring Objectives VS
Id# Vital Sign Monitoring Question(s) Monitoring Method Metrics Vital Sign Rank (0-5)
Monitor patterns of distribution & extent of community types T3 Landscape Fragments, Patch
Size, Land Cover How are the distributions of plant communities and land cover inside and immediately outside the Parks changing over time? Mapping, repeat photography FRAGSTAT statistics, Vegetation type 2.6
Monitor fire regimes and effect on vegetation T4 Fire Effects & Dynamics: Vegetation and Landscape Level
What is a natural fire frequency? What changes in plant community composition and structure result from fire? What are the biogeochemical effects of fire? Transects, plots, histories change in vegetation structure, Cover, density,
erosion, nutrient loss, species composition 2.5
Landscape
Track insect and disease presence during forest dieback T5 Forest Dieback What percentage of trees in populations is declining or dying? What proportion are dying by
natural vs. non-native influences? What are temporal trends? Transects, plots, population surveys Plant cover, density, vigor, size classes, species composition, Density of herbivores relative to degree of dieback
1.5
T6 Terrestrial Plant Biodiversity Are there detectable short-term changes in selected native plant communities? plots, transects abundance, density, cover, Abundance and trends in selected focal groups of plant species
3.6 Monitor community dynamics, structure, function, and composition
T7 Long-term Plant Succession What are long-term trends in plant community composition and structure, regardless of management treatment or land use? Transects, plots, mapping, remote sensing Cover, density, vigor, size classes, growth
rates, species composition 3.5
T8 Recovery/Change of Native Vegetation with Alien Plant Control
What are trends in plant community composition and structure in response to alien plant control treatments? Transects, plots Cover, density, vigor, size classes, species
composition, recruitment rates 3.5
T9 Recovery/Change of Native Vegetation with Feral Ungulate Control
What are trends in plant community composition and structure after removal or sustained control of feral ungulates? Are habitats damaged by alien ungulate species restorable?
Transects, plots. Monitor fenced areas where ungulates have been removed.
Cover, density, vigor, size classes, species composition 2.4
Com
munity Monitor effects of management on native
communities
T10 Recovery/Change of Native Vegetation with Invasive Alien Invertebrate Control
Are native plant species recovering where invasive invertebrates are controlled? What are trends in plant community composition and structure following invasive invertebrate control? Transects, plots
species composition, vigor, size classes, density, Cover, abundance & distribution of alien inverts & native pollinators, flower & seed production
1.8
T11 Invertebrate Biocontrol of Plants
What is the long-term impact/efficacy on populations of blackberry, passionflower, & other pests? Are non-target plants, especially natives, being affected? Plots & transects for plants Infestation rates 1.7
Monitor effects of biocontrol on native and invasive species
T12 Plant Pathogen Biocontrol of Plants
What is the impact/efficacy on populations of control target? Are non-target species being attacked? Plots & transects Infestation rates 1.6
Monitor population size and distribution of native, endemic, or focal species, including response to restoration efforts. Where appropriate, measure demographics (size/age structure, reproduction, recruitment, etc.) of selected indicator species
T13 Native Plant Species Protection (T, E, S-o-C species)
What are the distribution, abundance, and demographics of threatened, endangered, and rare native plant species? Are plant populations reproducing at self-sustaining levels? Mapping, plots, counts in size classes phenology, survival, soil seed bank, population
structure, Distribution, density, reproduction 4.0
T14 Established Plant Disease & Pathogens
What is the incidence and level of disease in populations? Are diseases/pathogens affecting populations? What are trends in disease/pathogen? 2.9
Monitor disease incidence and impacts, especially on native species
T15 Alien Incipient Plant Disease & Pathogens
Where are disease locations outside parks? What species are they affecting? What are rates and directions of spread? Identify existing disease/pathogen incidence, impact, and trends? 2.6
Monitor extent and response to treatment of established invasive species T16 Established Alien Species -
Plants What is the distribution and abundance of established alien plants? What is the rate of spread of alien plants?
Mapping, transects, plots, counts in size classes Distribution mapping, frequency 4.0
Vegetation
Population
Monitor occurrence of non-established (incipient) invasive species T17 Alien Incipient Invasive Plants
Is species present, if so what is the nature and extent of infestation? What are the most effective strategies for detecting and preventing new invasives species? Where should efforts be focused? What are potential impacts?
Passive surveillance and follow-up; surveys in high- risk sites (e.g. roadsides, trails, ports, disturbed sites)
Presence/ absence, rapid assessment of extent of infestation 3.7
Terrestrial Ecosystem
s
Consu
mers
Population
Monitor occurrence of non-established (incipient) invasive species T38 Alien Incipient Invasives -
Fungi
Is species present, if so what is the nature and extent of infestation? What are the most effective strategies for detecting and preventing new invasives species? Where should efforts be focused? What are potential impacts?
Passive surveillance and follow-up on reports; education, outreach, and public reporting; surveys in high- risk sites
distribution, Presence/ absence, rapid assessment of extent of infestation 2.0
Biotic Integrity
er E
cos Producers Monitor community composition, structure, and productivity F1 Community dynamics of
primary producers What species & groups are present? What are normal rates of productivity? Where are algal blooms present? periodic benthic sampling abundance, distribution, demographics 2.5

Appendix O: Part IV Vital Signs Workshops
70
Revised Vital Signs: Vegetation Eco Char Vital Sign Category Monitoring Objectives VS
Id# Vital Sign Monitoring Question(s) Monitoring Method Metrics
Monitor patterns of distribution & extent of community types T3 Landscape Fragments
and Land Cover How are the distributions of plant communities and land cover inside and immediately outside the Parks changing over time? Are fragments or patches of natural vegetation decreasing in size or persisting over time?
Mapping, repeat imaging, transects, plots, histories, Where possible use traditional land divisions such as Ahupua'a for monitoring units
Spatial statistics, Vegetation type
Monitor fire regimes and effect on vegetation at the landscape level T4
Fire Effects & Dynamics: Landscape Level
What is current or recent fire regime? What is extent & intensity of fires? What are current natural and anthropogenic ignition sources ? What are the impacts of fire on landscape pattern and patch viability?
Transects, plots, histories, mapping. Erosion pins and sediment collectors for erosion monitoring.
Change in vegetation structure, erosion, or nutrient loss following fire, landscape history.
Track Patterns of Forest Health and Dieback T5 Forest Dieback
What percentage of the native components of natural vegetation in a population are declining or dying due to natural trends (including native diseases) or non-native influences? What proportion are dying due to natural vs. non-native influences? What are temporal trends?
Transects, plots, population surveys, mapping of affected areas.
Plant cover, density, vigor, size classes, species composition, density of stressor relative to degree of dieback, History of Disturbance, landscape history, Stand history, Extent and distribution of dieback
Monitor fire regimes and effect on vegetation at the community level
NEW-VEG1
Fire Effects & Dynamics: Community Level
What is current or recent fire regime? What are the implications to plant community composition and structure resulting from fire? What are impacts to threatened, endangered and SOC species of plants? What are impacts of fire to vertebrate and invertebrate groups?
Transects, plots, population surveys of focal plant, vertebrate and invertebrate species.
Change in vegetation structure, cover, density, vigor, size classes, recruitment rates, growth rates, species composition, presence/absence and abundance of focal groups
Landscape
Monitor effect of catastrophic events (other than fire) on vegetation
NEW-VEG2
Other Catastrophic events
What are the impacts of hurricane, typhoon, drought etc. on vegetation communities of interest? What are the implications to plant community composition and structure ? What are impacts on Threatened , Endangered and SOC. species?
Transects, plots, population surveys of focal plant vertebrate and invertebrate species. Erosion pins, sediment collectors, and mapping for erosion monitoring.
Change in vegetation structure, cover, density, erosion, nutrient loss, species composition
T6 Rare and Focal Plant Community Biodiversity
Are there detectable changes in selected communities of interest? What is the relative abundance of native and non native species of vascular or non-vascular plants in communities of interest? What plant species and natural communities are rare in the parks?
Transects, permanent plots.
Presence/ absence, abundance of focal species and groups; diversity indices both within and across plant communities; Changes in structure, density, cover, and trends in selected focal groups of plant species. Monitor community dynamics,
structure, function, and composition
T7 Plant Succession What are trends in plant community composition and structure of representative vegetation types (including epiphytic plants and both vascular and non-vascular plants), regardless of management treatment or land use?
Transects, permanent plots, mapping, remote sensing, long-term monitoring of tagged species
Cover, density, vigor, size classes, growth rates, species composition, long -term changes in structure, spatial relation of individuals
Com
munity
Monitor effects of management on native communities T8
Recovery/Change of Native Vegetation Following Management
What are trends in plant community composition and structure following management ( including : Alien plant control, Small mammal control, Feral ungulate control or removal, Invasive alien invertebrate control, and Outplanting/seeding activities)? What are impacts of management on biodiversity and on common species or community types? What are the effects of alien species control on other alien species?
Transects, plots. Population surveys of native and alien invertebrates.
Cover, density, vigor, size classes, species composition, recruitment rates. Focal plant flower and seed production. Abundance and distribution of alien invertebrates and native pollinators.
Monitor effects of biocontrol on native and invasive species T11 Biocontrol of Plants What is the long-term impact/efficacy of plant biocontrol (using either plant pathogens or invertebrates) on
populations of the control target? Are non-target plants, especially natives, being affected? Plots & transects for plants, long term monitoring of biocontrol effects on populations
Infestation rates, cover, density, vigor, size classes, recruitment rates, damage indices for both natives and target alien species. Presence and abundance of biocontrol agent.
Monitor population size and distribution of native, endemic, or focal species, including response to restoration efforts. Where appropriate, measure demographics (size/age structure, reproduction, recruitment, etc.) of selected indicator species
T13 Native Plant Species Protection (T, E, S-o-C, and Focal species)
What are the distribution, abundance, and demographics of threatened, endangered, rare and focal native vascular and non-vascular plant species? Is the overall number of rare plant species increasing or decreasing? Are plant populations reproducing at sustaining levels? Is pollination, seed bank, seed set, and seedling recruitment adequate to maintain levels? Is genetic diversity being maintained?
Mapping, plots, counts in size classes. Soil cores and subplots for seed banks. Flower and fruit monitoring at focal plant populations. Genetic analysis of focal species samples.
Phenology, survival, soil seed bank, population structure, distribution, density, reproduction. Genetic similarity of individuals in populations.
Monitor disease incidence and impacts, especially on native species T14 Species/ Community
health
What are the incidences and levels of plant pathogen and disease (including native, established alien, and incipient alien disease) in populations? Are diseases/pathogens affecting populations within the park? What are trends in disease/pathogen including rate and direction of spread? What are the causes of disease and mortality in selected plant populations?
Transects, plots, population surveys
Monitor extent and response to treatment of established invasive species
T16 Established Alien Species - Plants
What is the distribution and abundance of established alien plants (including mosses)? What is the rate of spread of alien plants? What is the relative abundance of native and invasive species? What are the impacts on native species of vascular and nonvascular plants? What is the potential of alien plant species to invade and dominate communities?
Mapping, transects, plots, counts in size classes. Soil cores and subplots for seed banks.
Distribution mapping, frequency, cover, density and population structure of alien and native species. Species composition of seedbanks.
Vegetation
Population
Monitor occurrence of non-established (incipient) invasive species T17
Alien Incipient Invasive Vascular and Non-vascular Plants
Is alien species present, and if so, what is the nature and extent of infestation? What is the mode of dispersal through which the species entered the park? What are potential impacts on native species or communities? What are the most likely invaders of parks?
Shared surveillance by multiple agencies and public, including follow-up on reports; surveys in high- risk sites inside and outside parks (e.g. roadsides, trails, ports, disturbed sites). Observations of seed dispersers and collection of seed rain information. Soil cores and subplots for seed banks.
Presence/ absence, assessment of extent of infestation. Density and size class of impacted native plant populations. Species composition of affected native communities. Species composition of seedbanks.
Terrestrial Ecosystem
s
Consum
ers
Populatio
n Monitor occurrence of non-established (incipient) invasive species T38 Alien Incipient
Invasives - Fungi
Is species present, if so what is the nature and extent of infestation? What are the most effective strategies for detecting and preventing new invasives species? Where should efforts be focused? What are potential impacts on native communities?
Shared surveillance by multiple agencies and public, including follow-up on reports; education, outreach, and public reporting; surveys in high- risk sites
Distribution, presence/ absence, assessment of extent of infestation.
Biotic Integrity
er E
cosyste
Producers Monitor community composition, structure, and productivity F1 Community dynamics
of primary producers
What species & groups of primary producers are present within freshwater bodies; wetland & riparian areas; bogs; and surrounding anchialine pools? What is the role of surrounding vegetation in the aging of anchialine pools? What are the current rates of of productivity? What is the proportion of native vs. alien species contributing to productivity? Where are algal blooms present?
Periodic benthic sampling. Transects and plots in wetlands. Litter sampling. Surface water sampling.
Abundance, distribution, demographics of wetland plant species. Species composition of wetland communities. Volume of litter production per species. Species composition and biomass of algae.

National Park Service 71
Vertebrate Fauna (Terrestrial –other than Birds and Bats) Topical Session
Participants:
Cathleen Bailey (facilitator) Gordon Dicus (notes) Earl Campbell Coleen Cory Steve Hess Jim Murphy Mailia Laber Beth Flint Jean Licus Darcy Hu Fern Duvall Fred Kraus Doug Neighbor
Session Notes:
During this session, we discussed each Vital Sign in order, either accepting it “as is” or recommending changes. During this process, general comments/feedback was recorded on a separate flip chart page. Here, the Vital Sign-specific comments will be presented first, followed by the general comments. We closed the session with a brief discussion of methods and metrics, and suggestions regarding partners and references for methodology or protocols; in this summary document, the methods/metrics/partners/references info is presented last.
Initial Vital Signs - Specific Comments: Vital Sign T19 - Terrestrial Vertebrate (including off-shore islets refugia) Biodiversity
• Strike “native” from the Monitoring Question; suggest striking “long-term” too. Vital Sign T21 - Recovery/Change of Native Wildlife and Habitats w/ restoration of native vegetation
• Reword to emphasize recovery of all vertebrates with restoration of habitat. • Monitoring Question – strike plant reference, monitor all vertebrate; last question is research
(what plants should be focus of restoration efforts). Vital Sign T24 - Herps (native)
• OK as is. Vital Sign T30 - Established Disease & Pathogens of Terrestrial Vertebrates
• Reword Vital Sign based on previous session: birds & bats comments. • Vital Sign = Wildlife Health. Monitoring Objective = Monitor health of wildlife populations.
Monitoring Question = What are causes of morbidity/mortality? Methods/Metrics = surveys, carcass/specimen collection.
Vital Sign T31 - Alien Incipient Disease & Pathogens of Terrestrial Vertebrates • Reword Vital Sign based on previous session: birds & bats comments. • Vital Sign = Targeted Monitoring for Specific Diseases/Pathogens. Monitoring Objective =
Monitor for diseases/pathogens known to pose potential threats. Monitoring Question = What are the prevalences of known incipient diseases/pathogens and where are they? Methods/Metrics – no suggestions.
Vital Sign T32 - Established Alien Species – Feral Ungulates and Vital Sign T34 - Established Alien Species – Predatory Terrestrial Vertebrates
• General consensus was to focus, on the one hand, on monitoring established alien terrestrial vertebrates and, on the other hand, monitoring the response of selected established alien terrestrial vertebrates to treatment. Some participants felt this could be captured by 2 Vital Signs (phrasing as ‘predatory and omnivorous’ to cover ungulates, rats, etc). Other participants felt that there are valid reasons (ecological and political/funding) for keeping

Appendix O: Part IV Vital Signs Workshops
72
ungulates separate from predatory species, essentially resulting in 4 Vital Signs to capture this construct.
• If going with the former approach (2 Vital Signs), then need to include omnivorous terrestrial vertebrates in both the Vital Sign title and the Monitoring Question.
• Strike reference to “competition” from Monitoring Question(s), as competition is not relevant to the issues of alien species abundance and impacts.
• Add “distribution” to the Monitoring Question(s). Vital Sign T37 - Alien Incipient Invasives – Predatory Terrestrial Vertebrates and Vital Sign T40 - Alien Incipient Invasives - Invertebrates
• Adjust to specify monitoring for targeted incipient alien species. So, Vital Sign = Targeted monitoring for invasive species known to pose potential threats.
• Combine T37 with T40, with the Monitoring Objective = Monitor for known threats (or species known to pose potential threats).
• Strike the last 3 monitoring questions; replace with, “What are pathways and points of entry?”
Vital Sign M15 - Established Marine Animal (other than turtles) Disease & Pathogens and Vital Sign M16 - Established Turtle Disease & Pathogens
• Make changes as with T30 and T31, except focus is on marine.
General comments/feedback:
Because the inventory and monitoring of vertebrates is a dynamic process, several participants felt that the need for recurring inventory/survey effort to pick up new species should be made explicit. This could mean a new Vital Sign, or it could just be spelled out within an existing Vital Sign(s) – the logical choice here being T19.
Several participants also felt that the effects of fire (and perhaps including other catastrophic events) should be explicitly dealt with by our monitoring strategy/methods. Again, this could be a new Vital Sign, or could be incorporated into an existing Vital Sign – for the latter, the suggestion was T4 (Biotic Integrity – Terrestrial Ecosystems – Vegetation – Landscape) with a modification such that the Monitoring Objective aims to “Monitor fire regimes and effects” not limited to vegetation.
Methods/Metrics discussion:
Herp sampling will require various established methods beyond transects and plots. This includes pitfall traps, baited traps, etc. There are good references available (see next section).
Need a general, “garbage can catch-all” description for methods and metrics to account for uncertainty and flexibility; specific metrics will evolve and will be dependent on whichever species become the focus of monitoring. Recommend striking “passive surveillance” as a method for alien incipient invasives.
Group noted the importance of using standardized, accepted techniques as specific species-oriented methods and metrics are developed.
Partner/Reference suggestions:
Smithsonian publications for mammals, amphibians, (and reptiles?) on accepted sampling standards. Editor = Mercedes Foster.
Wildlife Society Techniques Manual is rather outdated. Center for Disease Control also has a Techniques Manual.

National Park Service 73
Potential partners: FWS; TNC; USDA – Wildlife Resources Research Center; USGS; ISC’s; DAR; U of Guam; State agencies; CESU; DMWR; CNMI – DMW; GDAWR (Guam); SPREP.
Synthesis of Main Points from Session Comments:
The group did a great job of staying focused and generated very helpful suggestions for improving the Vital Signs, Monitoring Objectives, and Monitoring Questions, and in some cases the Monitoring Methods and Metrics as well.
While the group felt there were some important aspects missing from the Vital Signs (namely an emphasis on periodic inventories to document new vertebrate species or unanticipated species spread, and an emphasis on the effects of fire, perhaps including the effects of other catastrophic events), there was general agreement that these aspects could be addressed within existing Vital Signs. Specifically, T19 could be expanded to capture the need for periodic inventories to adequately capture the dynamic goal of monitoring terrestrial vertebrate biodiversity. And T4, under the Landscape session, could expand its stated objective of monitoring fire regimes and effects to include vertebrates (and other taxa?).
A fair amount of discussion focused on the monitoring of established alien species. The possibility of combining T32 (feral ungulates) with T34 (predatory vertebrates), as envisioned by this group, would result in two Vital Signs – one focused on monitoring the alien vertebrates, and one focused on monitoring the response of selected alien vertebrates to treatment. Others in this group felt that there are valid ecological and political/funding reasons for keeping ungulates separate from predatory vertebrates, and therefore felt that the dual nature of the monitoring objectives would necessitate four Vital Signs.
As was discussed in other sessions, this group felt that the disease/pathogen Vital Signs should be re-worded so as to focus on monitoring the health of wildlife populations, and on targeted monitoring for specific diseases/pathogens. This applied to Vital Signs under the Terrestrial Ecosystem category (T30 and T31) and the Marine Ecosystem category (M15 and M16).
The group discussed how to deal with incipient threats and was favorable to the idea of monitoring for targeted incipient threats. This would make monitoring for incipient threats realistic.
Finally, this group offered some helpful suggestions on methods and metrics, noting that more detailed, species-oriented methods and metrics will evolve and change, as will the detailed focus of various aspects of the monitoring program. The group offered some suggestions on reference sources and potential partners.
Responses to Main Points Raised During Session:
We’ve used the group’s constructive comments in editing the Vital Signs, Monitoring Objectives, and Monitoring Questions. Where possible, we’ve incorporated their comments into the Monitoring Methods and Metrics as well; these latter fields, in particular, will continue to evolve. In addition, we’ve attempted to expand the scope of Vital Sign T19 (Terrestrial Vertebrate Biodiversity), encompassing the group’s suggestion to explicitly state the need for periodic inventory for T, E, S-o-C species not yet known to occur in a given park.
The group’s suggestion for a Vital Sign (T4, Monitor fire regimes and effects) outside the topical scope of this session will be considered in the write-up and editing for the Landscape session.

Appendix O: Part IV Vital Signs Workshops
74
We agreed with those in the Vertebrate Fauna session group who felt that there are valid political and/or funding reasons for keeping feral ungulates separate from predatory alien vertebrates. Therefore, we decided on four Vital Signs to capture the goal of monitoring alien vertebrates and monitoring the response of selected alien vertebrates to treatment.
We’ve adopted the suggested changes to the Disease/Pathogen Vital Signs, for both the terrestrial realm and the marine environment.

National Park Service 75
Initial Vital Signs: Vertebrate Fauna
Eco Char Vital Sign Category Monitoring Objectives VS
Id# Vital Sign Monitoring Question(s) Monitoring Method Metrics Vital Sign Rank (0-5)
Monitor community dynamics, structure, function, and composition T19
Terrestrial Vertebrate (including off-shore islets refugia) Biodiversity
Are there long-term changes in selected native vertebrate communities? Population surveys Abundance and trends of selected vertebrate species or groups 3.3
Com
munity
Monitor effects of management on native communities T21
Recovery/change of Native Wildlife and habitats (including wetlands) with restoration of native vegetation
What are trends in plant community composition and structure resulting from outplanting and seed-sowing activities? What is the response of native vertebrate and invertebrate populations to plant community restoration? What are priority plant species that should be restored?
Transects, plots (monitoring of areas where seeds have been broadcast and native species outplanted)
size classes, vigor, species composition, seedling recruitment, growth rates, Cover, animal reproductive success, animal popn size, animal popn growth rates, survivorship, density
3.2
Monitor population size and distribution of native, endemic, or focal species, including response to restoration efforts. Where appropriate, measure demographics (size/age structure, reproduction, recruitment, etc.) of selected indicator species
T24 Herps (native) Are distribution, abundance, other population characteristics, or habitat changing? Determine population levels over time. Population surveys Abundance / density, distribution 1.7
T30 Established Disease & Pathogens of Terrestrial Vertebrates
What is the incidence and level of disease in populations? Are diseases/pathogens affecting populations? What are trends in disease/pathogen?
Continue to monitor bird, bat, and herp populations (VCP, mist-netting) incidence, Presence/ absence 2.5
Monitor disease incidence and impacts, especially on native species
T31 Alien Incipient Disease & Pathogens of Terrestrial Vertebrates
Where are disease locations outside parks? What species are they affecting? What are rates and directions of spread? Identify existing disease/pathogen incidence, impact, and trends
Surveys in high risk sites; passive surveillance,; education, outreach, public reporting, and follow-up
Presence/absence, rapid assessment of extent of infestations (distribution, identification and numbers of host and/or vector species involved)
2.5
T32 Established Alien Species - Feral Ungulates
What are the relative abundance and population trends of feral ungulates? What are the impacts of feral ungulates? Is competition from invasive spp changing distribution, abundance, etc. of native spp.?
Animal activity transects Index of ungulate damage (to both plants and animals as appropriate) index of erosion damage by ungulates, plant species recovery after removal of ungulates
2.4 Monitor extent and response to treatment of established invasive species
T34 Established Alien Species - Predatory Terrestrial Vertebrates
Are native plant and animal species abundance or distribution changing in response to predators or predator control? What are trends in invasive species populations?
Treatment and control Transects/plots (for plants); other methods appropriate for native vertebrates of interest (VCP, transects, etc.); population surveys for predators
Plants: species composition, population and/or community structure. Animals: VCP, transects, other methods to monitor critical life stages identified as impacted by predators. Predator population indices, presence/ absence
3.4
T37 Alien Incipient Invasives - Predatory Terrestrial Vertebrate
Is species present, if so what is the nature and extent of infestation? What are the most effective strategies for detecting and preventing new invasives species? Where should efforts be focused? What are potential impacts?
Passive surveillance and follow-up on reports; education, outreach, and public reporting; surveys in high- risk sites
Predator population indices, presence/ absence, rapid assessment of extent of infestation 3.3
Terrestrial Ecosystem
s
Consum
ers
Population
Monitor occurrence of non-established (incipient) invasive species
T40 Alien Incipient Invasives - Vertebrates
Is species present, if so what is the nature and extent of infestation? What are the most effective strategies for detecting and preventing new invasives species? Where should efforts be focused? What are potential impacts?
Passive surveillance and follow-up; surveys in high- risk sites
distribution, Presence/ absence, rapid assessment of extent of infestation 2.6
M15
Established Marine Animal (other than turtles) Disease & Pathogens
What is the incidence and level of disease in populations? Are diseases/pathogens affecting populations? What are trends in disease/pathogen?
Incidence, telemetry disease types, occurrence, tissue samples, vectors 1.9
Biotic Integrity
Marine
Ecosystem
s
Water colum
n (m
otile)
Population
Monitor disease incidence and impacts, especially on native species
M16 Established Turtle Disease & Pathogens
What is the incidence and level of disease in populations? Are diseases/pathogens affecting populations? What are trends in disease/pathogen?
incidence, telemetry (mark-recapture) disease types, occurrence, vectors 2.9

Appendix O: Part IV Vital Signs Workshops
76
Revised Vital Signs: Vertebrate Fauna Eco Char Vital Sign Category Monitoring Objectives VS Id# Vital Sign Monitoring Question(s) Monitoring Method Metrics
Detect changes in the dynamics, structure, composition and/or function of selected communities within defined geographic areas. Periodically inventory to document new species in parks.
T19 Terrestrial Vertebrate Biodiversity (including off-shore islet refugia)
Are selected native vertebrate communities or guilds changing? This includes changes in abundance of selected species (determined from population surveys), and/or changes in the identity and number of species present in the community or guild of interest (determined from presence/absence monitoring).
Population surveys, presence/absence surveys. Periodic inventories focused on picking up new species records and/or locations.
Within defined areas or specified communities: abundance and trends of selected vertebrate species or groups, species richness
Com
munity Monitor effects of management on vertebrate
communities T21 Recovery/change of Terrestrial Vertebrates with Restoration of Habitats
What is the response of vertebrate populations to habitat restoration efforts?
Transects, plots (monitoring of areas where seeds have been broadcast and native species outplanted)
size classes, vigor, species composition, seedling recruitment, growth rates, Cover, animal reproductive success, animal popn size, animal popn growth rates, survivorship, density
Monitor population size and distribution of native, endemic, or focal species, including response to restoration efforts. Where appropriate, measure demographics (size/age structure, reproduction, recruitment, etc.) of selected indicator species
T24 Herps (native) Are distribution, abundance, other population characteristics, or habitat changing? Determine population levels over time.
Population surveys. A variety of standardized techniques (depending on target species) -- pitfall traps, baited traps, etc.
Abundance / density, distribution
Assess health of terrestrial vertebrate populations, particularly sensitive, native species. Detect, identify, and quantify causes of mortality and morbidity and their impacts on the populations. Provide early detection information to help prevent occurrence and/or spread of potential new threats to popns.
T30-31
Wildlife (terrestrial vertebrate) health and targeted monitoring for disease/pathogens, esp. among native species (can include T & E)
What are the prevalences and levels (how severe), and trends in known causes of morbidity and mortality in targeted popns? Where cause-effect is clearly established, are these affecting the populations? For targeted potential (incipient) causes of mortality and morbidity: are these present in popn or geographic area of concern? Are they present in other popns or in locations outside the immediate area of concern? If so, what are rates and directions of spread?
Known causes: specimen and/or carcass collection (may include telemetry to recovery carcasses), host or vector surveys/sampling; surveys of affected populations to determine popn status and impacts. Potential causes: Surveys in high risk sites; education & outreach to encourage public reporting; survey or report follow-up where needed; rapid assessment of extent of any infestations
Disease or threat prevalence, level, or presence/ absence; distribution and numbers of host and/or vector species involved; abundance or density of affected population. Potential causes: presence/absence; distribution, ID, and numbers of host and/or vector spp.
Monitor extent and effects of alien feral ungulates, and monitor their response to management treatment.
T32 Status of Established Alien Feral Ungulates, and Response to Treatment
What are the relative abundance, distribution, and population trends of feral ungulates? Are native plant and animal species' abundance or distribution changing in response to feral ungulates, or in response to efforts to control feral ungulates?
Treatment and control transects, plots, or sites using appropriate methods to assess both invasive and native organisms of interest (VCP, transects, etc.); surveys for predators using appropriate methods to estimate population size and distribution, treatment and control Transects/plots (for plants); other methods appropriate for native vertebrates of interest (VCP, transects, etc.); population surveys for predators
Plants: species composition, population and/or community structure. Animals: abundance or density, possibly presence/absence, and/or other measures of critical life stages identified as impacted by predators. Predators: population indices, presence/ absence, mapping. Plants: species composition, population and/or community structure. Animals: VCP, transects, other methods to monitor critical life stages identified as impacted by predators. Predator population indices, presence/ absence
Monitor extent and effects of predatory and omnivorous alien terrestrial verts, and monitor their response to management treatment.
T34
Status of Established Alien Predatory and Omnivorous Terrestrial Vert Species, and Response to Treatment
Are native plant and animal species' abundance or distribution changing in response to predatory or omnivorous invasives, or in response to efforts to control these invasives? What are trends in predatory and omnivorous invasive species populations?
Treatment and control transects, plots, or sites using appropriate methods to assess both invasive and native organisms of interest (VCP, transects, etc.); surveys for predators using appropriate methods to estimate population size and distribution, treatment and control Transects/plots (for plants); other methods appropriate for native vertebrates of interest (VCP, transects, etc.); population surveys for predators
Plants: species composition, population and/or community structure. Animals: abundance or density, possibly presence/absence, and/or other measures of critical life stages identified as impacted by predators. Predators: population indices, presence/ absence, mapping. Plants: species composition, population and/or community structure. Animals: VCP, transects, other methods to monitor critical life stages identified as impacted by predators. Predator population indices, presence/ absence
Terrestrial Ecosystem
s
Consum
ers
Population
Monitor for invasive terrestrial vertebrate species known to pose potential ecological threats (incipient species). Where appropriate, monitor response of these invasive species to management treatment.
T37 incorp T40
Targeted monitoring for (incipient) invasive terrestrial vertebrate species known to pose potential threats
Is species present? If so, what is the nature and extent of infestation? Are native plant and animal species' abundance or distribution changing in response to the invasive or its control? What are the pathways and points of entry?
Detection: surveys in high- risk sites; follow up on reports; education and outreach to encourage public reporting. Impacts and response to treatment: treatment and control transects, plots, or sites using appropriate methods to assess both invasive and native organisms of interest (VCP, transects, etc.); surveys for non-established predators using appropriate methods to estimate population size and distribution.
Presence/ absence; predator population indices and mapping; rapid assessment of infestation extent. Native plants: species composition, population and/or community structure; native animals: abundance or density, possibly presence/absence, and/or other measures of critical life stages identified as impacted by predators.
Biotic Integrity
Marine E
cosystems
Water colum
n (motile)
Population
Assess health of marine vertebrate populations, particularly sensitive, native species. Detect, identify, and quantify causes of mortality and morbidity and their impacts on the populations. Provide early detection information to help prevent occurrence and/or spread of potential new threats to popns.
M15 incorp M16
Wildlife (marine vertebrate) health and targeted monitoring for disease/pathogens, esp. among sensitive species (can include T & E spp.)
What are the prevalences and levels (how severe), and trends in known causes of morbidity and mortality in targeted popns? Where cause-effect is clearly established, are these affecting the populations? For targeted potential (incipient) causes of mortality and morbidity: are these present in popn or geographic area of concern? Are they present in other popns or in locations outside the immediate area of concern? If so, what are rates and directions of spread?
Known causes: specimen and/or carcass collection (may include telemetry to recovery carcasses), host or vector surveys/sampling; surveys of affected populations to determine popn status and impacts. Potential causes: Surveys in high risk sites; education & outreach to encourage public reporting; survey or report follow-up where needed; rapid assessment of extent of any infestations
Disease or threat prevalence, level, or presence/ absence; distribution and numbers of host and/or vector species involved; abundance or density of affected population. Potential causes: presence/absence; distribution, ID, and numbers of host and/or vector spp.

National Park Service 77
Landscape Topical Session
Participants:
Jean Licus (facilitator) Fritz Klasner (notes) Cathleen Bailey Anne Brasher Barbara Gibson Bryan Harry Darcy Hu Sonia Juvik Grant Kaye Fritz Klasner Jean Licus Rhonda Loh Ryan Monello Ilana Stout Doug Neighbor Linda Pratt Lynn Raulerson Joshua Seamon Patti Welton
Session Notes:
Bulleted items reflect suggested changes to be made to vital signs, objectives, questions, methods or metrics, by group attendees, along with some specific comments and concerns recorded in the group session.
Initial Vital Signs – Specific Comments: Vital Sign H1 - Soundscapes
• Remove the word species from the monitoring question. • Add to the monitoring questions, “Are we exceeding an acceptable level of sound”? • Add spatial distribution to the metrics. • Concerns were expressed about helicopters in HAVO and HALE.
Vital Sign H2 - Viewsheds • Rephrase the monitoring question to include “How are the viewsheds changing in and
surrounding the park”? • Metrics to include percent of a change as well as presence or absence. • Question came up if it would be more appropriate as an inventory, but consensus was
periodic photography from set points would be feasible. Vital Sign H3 - Lightscapes
• Monitoring question to include “Is artificial light appropriately shielded”? • What is impact on night sky from artificial light sources outside the park? • Metrics should include color. Baseline is natural sky levels not greater than 10% deviation. • Methods should stress calibrated/repeatable also satellite imaging, which is also a good
source for inventory. • Counts of artificial light sources within parks would be appropriate • Comment on the monitoring question that “basic human safety needs” is too soft.
Vital Sign H5 - Water Use(s) Within & Surrounding Parks • This vital sign was not discussed, as the group felt it more appropriate for the water quality
and freshwater biology sessions. Vital Sign H6 - Land Use(s) Within & Surrounding Parks
• Additional monitoring questions include:
• What changes within park are associated with changes in land use? • What land use changes are occurring within and adjacent to the park? (trends in use
types) What are the predicted impacts of land use changes on park values? • Are there detectable changes in park due to land use?

Appendix O: Part IV Vital Signs Workshops
78
• Comments made that monitoring may not identify resources at risk. Vital Sign H7 - Litter/debris
• Also discussed in the Water Quality & Marine other session • Suggested to reword the monitoring question & move to the viewscapes topic group where
appropriate (water quality group) • The monitoring question to address impacts on wildlife • Monitoring objective would focus on park as a whole although as is presents a focus
(marine). Also to differentiate location between terrestrial and open ocean • Methods would be to measure and identify spatial distribution and document/characterize
source. Also including fishing line, near shore campers and cultural practices impacting shoreline,
• Metrics should include type & size, presence/absence Vital Sign H8 - Marine Recreational Activities & Grounding/Anchor Damage
• This vital sign was more appropriately addressed in the marine group; therefore will no longer be part of the landscape vital signs.
Vital Sign H9 - Footprint & Visitor Use Patterns • Include timing and intensity in the monitoring objective. • Metrics should include quantification of use levels.
Vital Sign H10 - Subsistence Farming/Agriculture • Subsumed within H6
Vital Sign H11 - Bio-prospecting Harvest & H12: Coral/Sand Mining Harvest • Concerns were addressed about monitoring because there already is a system of applying for
a permit when conducting bio-prospecting harvest. • H11 along with H12 also suggests a market exchange. • Suggested to drop as Vital Signs • Monitoring question could discern between commercial versus cultural for H11-H14. • Changed the first question to: What are annual harvest levels of sand/coral? • Adjusted the second question to target harvested resources and at what rate of decrease. • Added rate of decrease to the metrics.
Vital Sign H13 - Culturally Significant Plant Harvest and Vital Sign H14 - Culturally Significant Vertebrate Species Harvest
• It was suggested to lump these two vital signs as “cultural” harvest with a focus on documenting total harvest efforts, etc.
Vital Sign H16 - Management Zone Uses • Suggested to drop as a vital sign because they are already being managed. • It was also suggested to monitor visitor education as related to exposure to hazards.
Vital Sign H17 - Wilderness Area-HAVO, HALE, other Unofficial • Comment made this is another form of monitoring management. • Objective could be to gain feedback on use of wilderness areas. • Question could read “Are Wilderness areas being unacceptably changed?
Vital Sign P11 - Biogeochemical Cycles- Nutrient Cycling • Monitoring question should read “How are processes changing over time? • Methods and metrics are too broad that it may be better to leave them blank.

National Park Service 79
• This vital sign should rely heavily on partner expertise (e.g. Vitousek, USGS, Mauna Loa Observatory, UH), which is currently in research mode.
Vital Sign P42 - Cave Environmental conditions • This vital sign was also discussed in the geology group with a focus on physical impacts of
human activity. Therefore, it has been permanently moved from the geology workgroup to the landscape section. This vital sign was not discussed in detail in this session but was reviewed post workshop with Bobby Camara who has done extensive research work with caves and impacts.
• Change and reword monitoring questions: How does human activity & cultural practices impact and change cave systems above ground (outside) and inside? How do natural/human induced impacts affect environmental cave conditions (temp, humidity, light, etc.)?
• Add to monitoring methods: Photo points (repeat photography) Vital Sign T1 - Soil and Pollen Landscape History
• The monitoring question is more of a research question. More inventories would be required with the best sites found in an archeological context.
• It was suggested to drop as a vital sign. Vital Sign T2 - Ecozone Boundaries and Vital Sign T3 - Landscape Fragments, Patch Size, Land Cover
• Suggested to be merged with T3 retaining much of the question and also using improvements from Veg. session.
Vital Sign T4 - Fire Effects & Dynamics: Vegetation and Landscape Level • This vital sign will be addressed in the vegetation session as it was not discussed in the
landscape group.
Significant Comments:
There were some concerns by NPS management regarding monitoring areas such as management zones and wilderness areas because those areas have already been designated and are intensively managed by the park service. There was also some discussion on the monitoring of land use within the park, which is addressed in the vital sign, refer to notes on H6.
T1 & H9- As transcribed from flip chart. Levels of resource use associated with H9 and role of archeological or paleo landscape as a resource.
Partnerships:
• Peter Vitousek • USGS • Mauna Loa Observatory • University of Hawaii
Post workshop follow up:
Following the workshop I&M staff consulted with additional park staff regarding T1 and it was suggested to keep the vital sign because there are parks in the pacific with intact paleo landscapes. By monitoring soil and pollen we can then determine changes in paleo landscapes. We have restructured the vital sign to be more appropriate for monitoring which will then be re-ranked by the parks.

Appendix O: Part IV Vital Signs Workshops
80
Consulted with Linda Pratt regarding T2 and we decided to keep Ecozone Boundaries a separate vital sign instead of lumping with T3, which was suggested by the group. The reasoning for this is Ecozone Boundaries are on a larger scale and are affected by long term perturbation (natural/unnatural) where as landscape fragments being discontinuous and distinct are much more affected by small scale disturbances. Changes have been made to T2 to reflect how the zones are changing due to long term disturbances.
Bio-prospecting & Coral/Sand Mining Harvests (H11&H12) were considered important issues regarding the protection and preservation of natural resources in PACN; therefore these vital signs where combined into one (H11) Commercial Harvest, with a focus on commercial activities affecting natural resources. Likewise, Culturally Significant Plant & Vertebrate Species Harvest (H13&H14), has been reorganized into a single vital sign, (H13) Culturally Significant Harvest, with a focus on monitoring total harvest while maintain population levels which is reflected in the revised Vital Signs.

National Park Service 81
Initial Vital Signs: Landscape
Eco Char
Vital Sign Category Monitoring Objectives VS
Id# Vital Sign Monitoring Question(s) Monitoring Method Metrics Vital Sign Rank (0-5)
Soundscapes Monitor sound sources, frequencies, occurrence, and levels H1 Alien, Natural, Human Soundscapes
Are alien species sounds appropriate to management zone? Are naturally present sounds maintained at appropriate frequencies, occurrence, db levels?
point/plot sampling frequency (hz), frequency (time), Sound durations, Sound levels, sound source identification 2.6
Monitor landscape / seascape appearance H2 Viewsheds Are landscapes/seascapes changing? historical photos qualitative 2.7
Viewscapes / Lightscapes Monitor light levels and characteristics of
light/dark cycles H3 Lightscape & Night sky Are natural light/dark cycles maintained as appropriate (e.g. no inappropriate shading, etc)? Is artificial light restricted to basic human safety needs only?
above ground (aerial or satellite) vs. on ground measurements (photographs) Light intensity, spatial distribution, temporal frequency 2.7
Monitor water use adjacent to or upstream from park boundaries H5 Water Use(s) Within & Surrounding
Parks Which resources are most at risk due to conflicting water uses (withdrawals, diversions, inputs)? Stream gages, well monitoring/logs Volume, rate 3.0
Land Use Monitor land use adjacent to, or upstream of, park boundaries H6 Land Use(s) Within & Surrounding
Parks What areas are most at risk due to conflicting adjacent changes in land use (e.g. ranching, urbanization)? Aerial photography, mapping, plots change detection maps 3.4
Monitor debris-trash occurrence in coastal, riparian, wetland, and lacustrine habitats; in or near high use areas
H7 Litter/debris What are levels of litter within parks? Where is littering/ dumping of trash taking place? What are areas of marine debris deposition? surveys of activity & locations quantity present / removed 3.1
H8 Marine Recreational Activities & Groundings/Anchor Damage Are use levels changing? What are trends? plots, transects, and surveys
density of fish line, density of lead sinkers on bottom, level/degree of trampling, percent broken coral, quantity of beach users, quantity of diver hours, water films
2.5
H9 Footprint & Visitor Use Patterns Are locations and/or intensity in use areas (visitor or management) changing? Are use levels associated w/detectable levels of resource change?
VERP program, repeated mapping of use areas, plot sampling erosion, plant cover 3.3
Monitor patterns of park visitation, use & damage (terrestrial & marine)
H10 Subsistence Farming/Agriculture What areas are affected by subsistence farming and how are these practices modifying plant communities?
Mapping/gps perimeter of farmed areas, aerial photos area covered by disturbance, Distribution 1.2
Monitor incidence & occurrence of bioprospecting H11 Bio-prospecting Harvest
Are harvest levels changing? What are trends? Is human harvest changing distribution, abundance, or other population characteristics? What are current trends (research activities) in bioprospecting.
Surveys in various targeted habitats: pharmaceutical plants, thermal pools, coral reefs, intertidal zones, etc. Quantification of research activity, harvest levels, and of targeted population characteristics.
harvest composition, harvest quantity, Research activity 1.9
H12 Coral/Sand Mining Harvest Are harvest levels changing? What are trends? plots/transects and remote sensing harvest composition, harvest quantity 1.2
H13 Culturally Significant Plant Harvest What impact does gathering of plant materials by humans have on harvested populations? Transects, plots Cover, demographics, density 2.5
Park Use & Activities
Monitor levels of take & harvest of harvested species (marine, freshwater, and terrestrial) or resources (coral, sand)
H14 Culturally Significant Vertebrate Species Harvest
Is human harvest changing distribution, abundance or other population characteristics? Can there be a balance between management goals of sustaining population numbers and culturally important species?
Systematic monitoring and/or population surveys of harvested species collection statistics, counts by class, Creel counts 1.6
Monitor patterns and effects of use and management H16 Management Zone uses
Are locations, extent and/or intensity in use areas (visitor or management) changing? Are use levels associated w/detectable levels of resource change?
mapping quantify and qualify uses and extent(s) 3.1
Hum
an activities & cultural practices
Management Zones
Monitor effects of management practices on wilderness character H17 Wilderness Areas - HAVO, HALE,
other Unofficial Monitor to identify the need for, or effects of, management actions Limits of acceptable change. Nature, magnitude, and source of impacts Limits of Acceptable Change (LAC) 1.1
Soil, Water, & Nutrient
Dynamics
Monitor cycles of nutrients and elements within soils and water--including carbonate (oceanic), nitrogen, and phosphorous
P11 Biogeochemical Cycles - Nutrient Cycling
How are fluctuations changing over time (source, directions, levels of flow)? monitoring plots
Aquatic senescence, Coral growth-CaCO3 deposition, Forest productivity (litter rain, incremental growth), Key constituents (N, K, CaCO3)
2.5 Physical /
Chem
ical C
onditions
Geolog
y Landforms Monitor karst and non-karst cave and lava tube habitat characteristics, topography, and extent
P42 Cave Environmental conditions Are cave systems impacted and changing as a result of above ground changes or human activity & cultural practices? Are environmental conditions in caves changing (temp, humidity, light, etc.)?
Station/plot data litterfall, Species distribution & abundance, human use levels, temperature, humidity, ground compaction, etc. 2.0
T1 Soil and Pollen Landscape History Are intact paleo landscapes being altered? Mapping; Pollen and charcoal assemblages, soil horizons, etc. Rate of change? 2.3
T2 Ecozone Boundaries Are locations of ecotones changing? Are the communities that comprise ecological boundary zones changing?
vegetation mapping, landscape photography, high spatial resolution plots change detection maps 2.1
Monitor patterns of distribution & extent of community types
T3 Landscape Fragments, Patch Size, Land Cover
How are the distributions of plant communities and land cover inside and immediately outside the Parks changing over time? Mapping, repeat photography FRAGSTAT statistics, Vegetation type 2.6
Biotic Integrity
Terrestrial Ecosystem
s
Vegetation
Landscape
Monitor fire regimes and effect on vegetation T4 Fire Effects & Dynamics: Vegetation
and Landscape Level
What is a natural fire frequency? What changes in plant community composition and structure result from fire? What are the biogeochemical effects of fire?
Transects, plots, histories change in vegetation structure, Cover, density, erosion, nutrient loss, species composition 2.5

Appendix O: Part IV Vital Signs Workshops
82
Revised Vital Signs: Landscape Eco Char
Vital Sign Category Monitoring Objectives VS
Id# Vital Sign Monitoring Question(s) Management Goal Monitoring Method Metrics
Soundscapes Monitor sound sources, frequencies, occurrence, and levels
H1 Alien, Natural, Human Soundscapes
Are alien sounds appropriate to management zone? Are naturally present sounds maintained at appropriate frequencies, occurrence, db levels? Are we exceeding an acceptable level of sound?
Maintain natural sounds, limit/eliminate alien or human sounds as appropriate to mgmt zones (incl. outside of human audible range)
point/plot sampling frequency (hz), frequency (time), Sound durations, Sound levels, sound source identification, spatial distribution
Monitor landscape / seascape appearance H2 Viewsheds How are the viewsheds changing in and surrounding the park? Are
landscapes/seascapes changing? Maintain historical viewsheds historical photos qualitative,% of change, presence/absence
Viewscapes / Lightscapes Monitor light levels and
characteristics of light/dark cycles
H3 Lightscape & Night sky
Are natural light/dark cycles maintained as appropriate (e.g. no inappropriate shading, etc)? Is artificial light appropriately shielded? Is artificial light restricted to basic human safety needs only? What is impact on night sky from artificial light sources outside the park?
Naturally occurring light/dark cycles continue, the prevalence of artificial light minimized
above ground (aerial or satellite) vs. on ground measurements (photographs) count of artificial light sources within park, calibrated/repeatable.
Light intensity, spatial distribution, temporal frequency, color. Baseline not greater than 10% deviation.
Land Use Monitor land use adjacent to, or upstream of, park boundaries
H6 Land Use(s) Within & Surrounding Parks
What areas are most at risk due to conflicting adjacent changes in land use (e.g. ranching, urbanization)? What land use changes are occurring within and adjacent to the park? (trends in use types) What are the predicted impacts of land use changes on park values? Are there detectable changes in park due to land use.
Establish a baseline, track changes, and anticipate future stressors Aerial photography, mapping, plots change detection maps
Monitor debris-trash occurrence in terrestrial, coastal, riparian, wetland, and lacustrine habitats; in or near high use areas
H7 Litter/debris What are levels of litter within parks? Where is littering/ dumping of trash taking place? (e.g. terrestrial, open ocean) Where are areas of marine debris deposition?
Reduce or eliminate sources of litter & debris surveys of activity & locations, identify spatial distribution, document/characterize source
quantity presence / absence, type & size
H9 Footprint & Visitor Use Patterns
Are locations and/or intensity in use areas (visitor or management) changing? Are use levels associated w/detectable levels of resource change?
Maintain human use levels w/appropriate impact-intensities
VERP program, repeated mapping of use areas, plot sampling erosion, plant cover, quantify use levels Monitor patterns of park
visitation (e.g. timing, intensity), use & damage (terrestrial & marine) H10 Subsistence
Farming/Agriculture What areas are affected by subsistence farming and how are these practices modifying plant communities?
Establish a baseline for future evaluation of impacts; protect primary and secondary forest
Mapping/gps perimeter of farmed areas, aerial photos area covered by disturbance, Distribution
Monitor incidence & occurrence of commercial harvest activities
H11 Commercial Harvest
What are annual harvest levels of sand/coral? Is human harvest changing distribution, abundance, or other population characteristics of harvested resources? At what rate? (% of decrease) What are current trends (commercial activities) in bioprospecting, coral/sand mining?
Maintain natural conditions and processes
Survey in various targeted habitats: pharmaceutical plants, thermal pools, coral reefs, intertidal zones, etc. Quantification of commercial activity, harvest levels, and of targeted population characteristics. Plot/transects and remote sensing
harvest composition, harvest quantity, rate or % of decrease, Commercial activity
Park Use & Activities
Monitor levels of take & species (marine, intertidal, freshwater, and terrestrial) or resources (coral, sand) related to cultural practices
H13 Culturally Significant Harvest
Is human harvest changing distribution, abundance or other population characteristics? Can there be a balance between management goals or sustaining population numbers and culturally important species?
Maintain natural conditions and processes; Determine policy and limits for harvesting, sustain population levels
Transects, plots, systematic monitoring and/or population surveys of harvested species
collection statistics, counts by class, creel counts
Monitor patterns and effects of use and management
H16 Management Zone uses Are locations, extent and/or intensity in use areas (visitor or management) changing? Are use levels associated w/detectable levels of resource change?
Maintain human use levels and types w/in appropriate management zones and with appropriate impact-intensities
mapping quantify and qualify uses and extent(s)
Hum
an activities & cultural practices
Management Zones Monitor effects of
management practices on wilderness character
H17 Wilderness Areas - HAVO, HALE, other Unofficial
Monitor to identify the need for, or effects of, management actions. Are wilderness areas being unacceptably changed?
Ensure management actions and visitor impacts on resources and character do not exceed standards and conditions (potential or designated wilderness)
Limits of acceptable change. Nature, magnitude, and source of impacts Limits of Acceptable Change (LAC)
Soil, Water, & Nutrient
Dynamics
Monitor cycles of nutrients and elements within soils and water--including carbonate (oceanic), nitrogen, and phosphorous
P11 Biogeochemical Cycles - Nutrient Cycling How are processes changing over time (source, directions, levels of flow)? Maintain ecological processes at fundamental levels monitoring plots
Aquatic senescence, Coral growth-CaCO3 deposition, Forest productivity (litter rain, incremental growth), Key constituents (N, K, CaCO3)
Physical / C
hemical
Conditions
Geology
Landforms
Monitor karst and non-karst cave and lava tube habitat characteristics, topography, and extent
P42 Cave Environmental conditions
How does human activity & cultural practices impact and change cave systems above ground (outside) and inside? How do natural/human induced impacts affect environmental cave conditions (temp, humidity, light, etc.)?
Ensure integrity of cave systems by maintaining environmental habitats as well as cultural uses and resources
Station/plot data, photo points (repeat photography)
litterfall, Species distribution & abundance, human use levels, temperature, humidity, ground compaction, etc.
T1 Soil and Pollen Landscape History
Do the parks contain intact paleolandscapes? Are these resources being altered or disturbed? Are species represented in the pollen record that are now absent from the park? What is the relative sensitivity of natural landscapes to disturbance? What are recent (historical) changes in vegetation community types? What is the timing of arrival of alien invasives?
Document the paleo-historical landscapes still present
Mapping; Pollen and charcoal assemblages, macrofossils, soil horizons, etc.
Species composition, rate of change?
Biotic Integrity
Terrestrial E
cosystems
Vegetation
Landscape
Monitor patterns of distribution & extent of community types
T2 Ecozone Boundaries Are locations of ecotones changing due to long term natural/unnatural perturbations? Are the communities that comprise ecological boundary zones changing(increasing/decreasing in size)?
Document and track stable vs. dynamic terrestrial ecozone boundaries
vegetation mapping, landscape photography, high spatial resolution plots
change detection maps

National Park Service 83
Marine Benthic (Invertebrate) Topical Session
Participants:
Larry Basch (facilitator) Raychelle Daniel (notes) Jim Maragos Chuck Birkeland Bill Walsh Ilsa Kuffner Caroline Rogers Jim Beets Bruce Richmond Peter Craig Celia Smith Alan Friedlander Lisa Wedding Roy Irwin Chuck Sayon Dave Helweg Maria Carnevale Eva DiDonato Casey Cumming Dwayne Minton
Session Notes:
All the marine sessions followed a similar progression. We decided to go through the list and discuss each vital sign instead of listing out vital signs that needed to be revisited, as indicated by the agenda. The participants offered suggestions for improvement on the vital sign, vital sign monitoring questions, the methods and metrics. General monitoring and marine monitoring topics were discussed throughout the sessions and those notes were kept on a separate sheet of paper from the vital sign specific comments. Some of the general discussion and suggestions are highlighted in a separate section at the end of the marine sessions. Overall, the marine sessions were a valuable source of information and led to a reorganization of the vital signs. The revised vital signs appear at the end of the marine sessions.
Initial Vital Sign – Specific Comments: Vital Sign M1 – Coral Growth (erosion & accretion)
• Change vital sign from "coral growth" to: "reef erosion or accretion" • Monitoring method: add transects, mapping • Metrics: add percent cover • Research: Historical component using aerial photographs?
Vital Sign M2 – Benthic Habitats • Monitoring question: rephrase question, "how" implies a research question • Vital sign: Change from "benthic habitats" to "benthic category" • Consider large scale habitat types (i.e. lagoons, coral reefs) • The historical context could be added using aerial photographs. There are archives of
photographs for most areas spanning back 50 years that could be used to view change. However we need to be cautious when doing this, keep in mind other events that could have landscape level effects such as hurricanes
• NOAA habitat characterizations, topography, history • In the metrics landscape scale: leeward/windward • In the methods: delete transects & quadrats • In metrics: add cover by type, and percent cover • Research: Historical component using aerial photographs?
Vital Sign M3 – Benthic Marine Invertebrates and Algae Biodiversity • Add or substitute "diversity" in place of "composition" in monitoring question or monitoring
objective • Metrics: remove cover by type, is biomass needed?, what is the utility of relative abundance?,
add species composition, species diversity can be derived from counts, genetic component?,
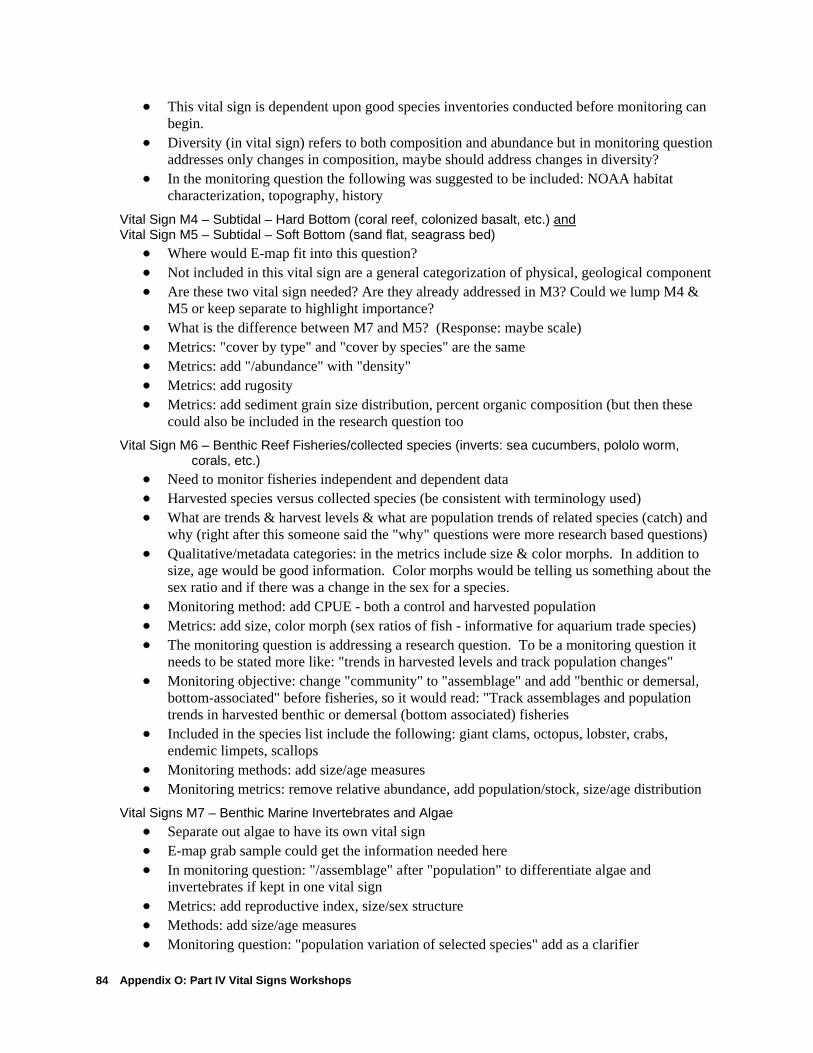
Appendix O: Part IV Vital Signs Workshops
84
• This vital sign is dependent upon good species inventories conducted before monitoring can begin.
• Diversity (in vital sign) refers to both composition and abundance but in monitoring question addresses only changes in composition, maybe should address changes in diversity?
• In the monitoring question the following was suggested to be included: NOAA habitat characterization, topography, history
Vital Sign M4 – Subtidal – Hard Bottom (coral reef, colonized basalt, etc.) and Vital Sign M5 – Subtidal – Soft Bottom (sand flat, seagrass bed)
• Where would E-map fit into this question? • Not included in this vital sign are a general categorization of physical, geological component • Are these two vital sign needed? Are they already addressed in M3? Could we lump M4 &
M5 or keep separate to highlight importance? • What is the difference between M7 and M5? (Response: maybe scale) • Metrics: "cover by type" and "cover by species" are the same • Metrics: add "/abundance" with "density" • Metrics: add rugosity • Metrics: add sediment grain size distribution, percent organic composition (but then these
could also be included in the research question too Vital Sign M6 – Benthic Reef Fisheries/collected species (inverts: sea cucumbers, pololo worm,
corals, etc.) • Need to monitor fisheries independent and dependent data • Harvested species versus collected species (be consistent with terminology used) • What are trends & harvest levels & what are population trends of related species (catch) and
why (right after this someone said the "why" questions were more research based questions) • Qualitative/metadata categories: in the metrics include size & color morphs. In addition to
size, age would be good information. Color morphs would be telling us something about the sex ratio and if there was a change in the sex for a species.
• Monitoring method: add CPUE - both a control and harvested population • Metrics: add size, color morph (sex ratios of fish - informative for aquarium trade species) • The monitoring question is addressing a research question. To be a monitoring question it
needs to be stated more like: "trends in harvested levels and track population changes" • Monitoring objective: change "community" to "assemblage" and add "benthic or demersal,
bottom-associated" before fisheries, so it would read: "Track assemblages and population trends in harvested benthic or demersal (bottom associated) fisheries
• Included in the species list include the following: giant clams, octopus, lobster, crabs, endemic limpets, scallops
• Monitoring methods: add size/age measures • Monitoring metrics: remove relative abundance, add population/stock, size/age distribution
Vital Signs M7 – Benthic Marine Invertebrates and Algae • Separate out algae to have its own vital sign • E-map grab sample could get the information needed here • In monitoring question: "/assemblage" after "population" to differentiate algae and
invertebrates if kept in one vital sign • Metrics: add reproductive index, size/sex structure • Methods: add size/age measures • Monitoring question: "population variation of selected species" add as a clarifier
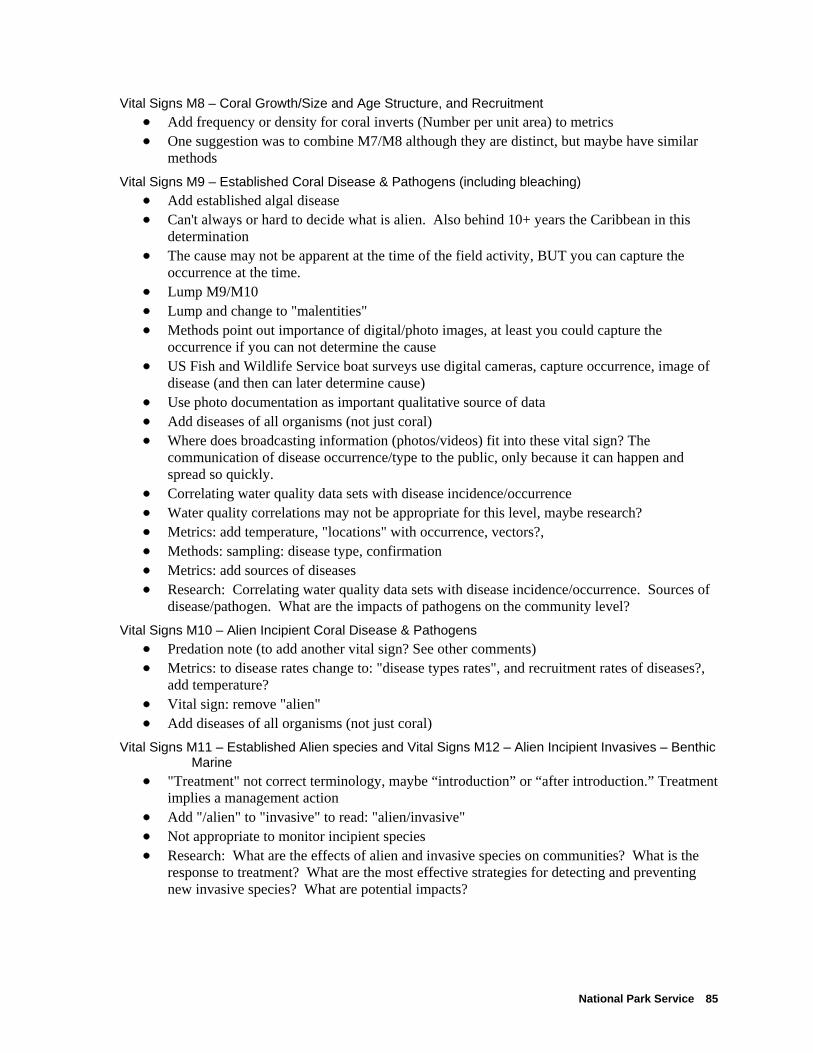
National Park Service 85
Vital Signs M8 – Coral Growth/Size and Age Structure, and Recruitment • Add frequency or density for coral inverts (Number per unit area) to metrics • One suggestion was to combine M7/M8 although they are distinct, but maybe have similar
methods Vital Signs M9 – Established Coral Disease & Pathogens (including bleaching)
• Add established algal disease • Can't always or hard to decide what is alien. Also behind 10+ years the Caribbean in this
determination • The cause may not be apparent at the time of the field activity, BUT you can capture the
occurrence at the time. • Lump M9/M10 • Lump and change to "malentities" • Methods point out importance of digital/photo images, at least you could capture the
occurrence if you can not determine the cause • US Fish and Wildlife Service boat surveys use digital cameras, capture occurrence, image of
disease (and then can later determine cause) • Use photo documentation as important qualitative source of data • Add diseases of all organisms (not just coral) • Where does broadcasting information (photos/videos) fit into these vital sign? The
communication of disease occurrence/type to the public, only because it can happen and spread so quickly.
• Correlating water quality data sets with disease incidence/occurrence • Water quality correlations may not be appropriate for this level, maybe research? • Metrics: add temperature, "locations" with occurrence, vectors?, • Methods: sampling: disease type, confirmation • Metrics: add sources of diseases • Research: Correlating water quality data sets with disease incidence/occurrence. Sources of
disease/pathogen. What are the impacts of pathogens on the community level? Vital Signs M10 – Alien Incipient Coral Disease & Pathogens
• Predation note (to add another vital sign? See other comments) • Metrics: to disease rates change to: "disease types rates", and recruitment rates of diseases?,
add temperature? • Vital sign: remove "alien" • Add diseases of all organisms (not just coral)
Vital Signs M11 – Established Alien species and Vital Signs M12 – Alien Incipient Invasives – Benthic Marine
• "Treatment" not correct terminology, maybe “introduction” or “after introduction.” Treatment implies a management action
• Add "/alien" to "invasive" to read: "alien/invasive" • Not appropriate to monitor incipient species • Research: What are the effects of alien and invasive species on communities? What is the
response to treatment? What are the most effective strategies for detecting and preventing new invasive species? What are potential impacts?

Appendix O: Part IV Vital Signs Workshops
86
Vital Signs M9 through12 • Appear more community related and they are not acting at the species level where one
species is affecting specific species. Different level of organization, not necessarily at population level.
• Linkage to management-specific cases where invasive species and pathogens studied at species level and monitor at higher levels
Other Comments • Predation (e.g. in M10). How do you detect difference between predation effects and disease
effects? For example, after the fact, crown-of-thorns sea star predation on corals could be mistaken for disease.
• Endemism: level at different regions, if there are changes over time you might worry. Metric under diversity, might come up in an inventory/species list. Include under M3
• Broadcasting disease/pathogen occurrence
Synthesis of Main Points from Session Comments:
Based on the inadequate level of current inventories, especially for benthic invertebrates, it is going to be important to ensure that thorough inventories are completed before monitoring commences.
It was recommended that algae should be separated from the invertebrates/coral vital signs (initial M7 split), highlighting its importance and significance in the marine environment.
The group thought that several vital signs should be combined. We incorporated coral growth (initial M8) with the metrics of benthic marine invertebrates (initial M7) into a revised vital sign to monitor coral and other marine invertebrate community structure and dynamics. We combined incipient and established diseases and pathogens (initial M9 and M10) into a revised vital sign, to monitor marine health (see T&E and Vertebrate Fauna session notes). We combined established and incipient alien/invasive species (initial M11 and initial M12) into a revised vital sign, marine alien/invasive extent and occurrence. The feasibility and usefulness of monitoring incipient species was questioned, and in the marine environment ballast water sampling was one of the few examples presented. For this reason the group suggested combining incipient and established species.
No new vital signs were proposed for this session.
Responses to Main Points Raised During Session:
• Incorporate coral growth as a metric at a community-level vital sign
Coral growth (initial M8) is important and easily measurable, but, based on the recommendations of the session participants; the coral growth vital sign has been combined into the vital sign covering coral community structure and dynamics. This vital sign examines biology processes, including coral growth, that affect community structure, and it was felt that highlighting a single process in its own vital sign might imply a greater importance, which may not necessarily be accurate.
• Separate algae from coral
Algae should be separated from invertebrates and have its own vital sign. We agree with the session participants that marine plants need to be separated from other benthic organisms (e.g. initial Vital Sign M7). Marine plants are often excluded from monitoring

National Park Service 87
and survey efforts because of perceived taxonomic difficulties. We feel that marine algae are significant contributors to coral reef formation and health that it cannot be “overlooked.” To ensure this, we have provided algae and other vascular plants with their own series of vital signs that are parallel to those developed for non-plant species.
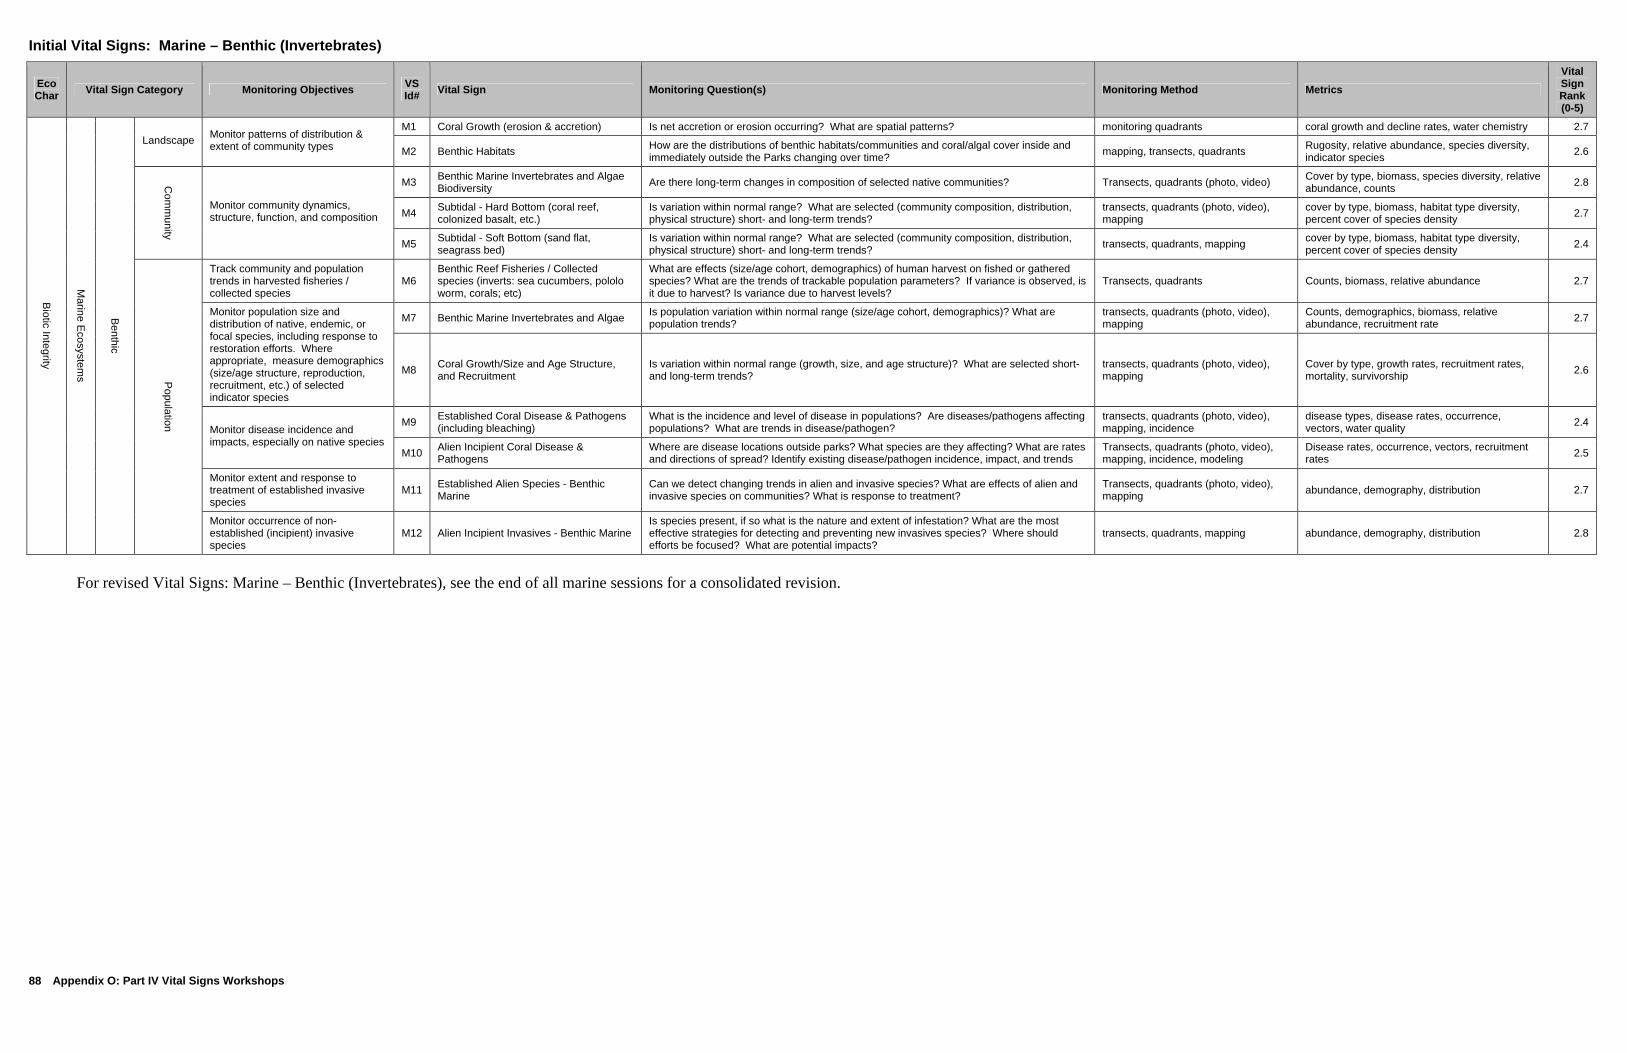
Appendix O: Part IV Vital Signs Workshops
88
Initial Vital Signs: Marine – Benthic (Invertebrates)
Eco Char Vital Sign Category Monitoring Objectives VS
Id# Vital Sign Monitoring Question(s) Monitoring Method Metrics Vital Sign Rank (0-5)
M1 Coral Growth (erosion & accretion) Is net accretion or erosion occurring? What are spatial patterns? monitoring quadrants coral growth and decline rates, water chemistry 2.7 Landscape Monitor patterns of distribution &
extent of community types M2 Benthic Habitats How are the distributions of benthic habitats/communities and coral/algal cover inside and immediately outside the Parks changing over time? mapping, transects, quadrants Rugosity, relative abundance, species diversity,
indicator species 2.6
M3 Benthic Marine Invertebrates and Algae Biodiversity Are there long-term changes in composition of selected native communities? Transects, quadrants (photo, video) Cover by type, biomass, species diversity, relative
abundance, counts 2.8
M4 Subtidal - Hard Bottom (coral reef, colonized basalt, etc.)
Is variation within normal range? What are selected (community composition, distribution, physical structure) short- and long-term trends?
transects, quadrants (photo, video), mapping
cover by type, biomass, habitat type diversity, percent cover of species density 2.7
Com
munity
Monitor community dynamics, structure, function, and composition
M5 Subtidal - Soft Bottom (sand flat, seagrass bed)
Is variation within normal range? What are selected (community composition, distribution, physical structure) short- and long-term trends? transects, quadrants, mapping cover by type, biomass, habitat type diversity,
percent cover of species density 2.4
Track community and population trends in harvested fisheries / collected species
M6 Benthic Reef Fisheries / Collected species (inverts: sea cucumbers, pololo worm, corals; etc)
What are effects (size/age cohort, demographics) of human harvest on fished or gathered species? What are the trends of trackable population parameters? If variance is observed, is it due to harvest? Is variance due to harvest levels?
Transects, quadrants Counts, biomass, relative abundance 2.7
M7 Benthic Marine Invertebrates and Algae Is population variation within normal range (size/age cohort, demographics)? What are population trends?
transects, quadrants (photo, video), mapping
Counts, demographics, biomass, relative abundance, recruitment rate 2.7 Monitor population size and
distribution of native, endemic, or focal species, including response to restoration efforts. Where appropriate, measure demographics (size/age structure, reproduction, recruitment, etc.) of selected indicator species
M8 Coral Growth/Size and Age Structure, and Recruitment
Is variation within normal range (growth, size, and age structure)? What are selected short- and long-term trends?
transects, quadrants (photo, video), mapping
Cover by type, growth rates, recruitment rates, mortality, survivorship 2.6
M9 Established Coral Disease & Pathogens (including bleaching)
What is the incidence and level of disease in populations? Are diseases/pathogens affecting populations? What are trends in disease/pathogen?
transects, quadrants (photo, video), mapping, incidence
disease types, disease rates, occurrence, vectors, water quality 2.4
Monitor disease incidence and impacts, especially on native species
M10 Alien Incipient Coral Disease & Pathogens
Where are disease locations outside parks? What species are they affecting? What are rates and directions of spread? Identify existing disease/pathogen incidence, impact, and trends
Transects, quadrants (photo, video), mapping, incidence, modeling
Disease rates, occurrence, vectors, recruitment rates 2.5
Monitor extent and response to treatment of established invasive species
M11 Established Alien Species - Benthic Marine
Can we detect changing trends in alien and invasive species? What are effects of alien and invasive species on communities? What is response to treatment?
Transects, quadrants (photo, video), mapping abundance, demography, distribution 2.7
Biotic Integrity
Marine E
cosystems
Benthic
Population
Monitor occurrence of non-established (incipient) invasive species
M12 Alien Incipient Invasives - Benthic Marine Is species present, if so what is the nature and extent of infestation? What are the most effective strategies for detecting and preventing new invasives species? Where should efforts be focused? What are potential impacts?
transects, quadrants, mapping abundance, demography, distribution 2.8
For revised Vital Signs: Marine – Benthic (Invertebrates), see the end of all marine sessions for a consolidated revision.

National Park Service 89
Marine Fish and Fisheries Topical Session:
Participants:
Dwayne Minton (Facilitator) Raychelle Daniel (notes) Kimber DeVerse Jim Parrish Guy Hughes Bill Walsh Ben Saldua Charles Birkeland Jim Maragos Larry Basch Ilsa Kuffner Caroline Rogers Jim Beets Peter Craig Daniel Kawaiaea Maria Carnevale Alan Friedlander Lisa Wedding Roy Irwin Chuck Sayon Bryan Harry Anne Brasher JP Michaud Sallie Beavers Eva DiDonato Casey Cumming
Session Notes:
All the marine sessions followed a similar progression. We decided to go through the list and discuss each vital sign instead of listing out vital signs that needed to be revisited, as indicated by the agenda. The participants offered suggestions for improvement on the vital sign, vital sign monitoring questions, the methods and metrics. General monitoring and marine monitoring topics were discussed throughout the sessions and those notes were kept on a separate sheet of paper from the vital sign specific comments. Some of the general discussion and suggestions are highlighted in a separate section at the end of the marine sessions. Overall, the marine sessions were a valuable source of information and led to a reorganization of the vital signs. The revised vital signs appear at the end of the marine sessions.
Initial Vital Sign – Specific Comments: Vital Sign H15 – Reef Fisheries Harvest
• The monitoring question was bordering on research (Is human harvest changing distribution, abundance, or other population characteristics)
• Monitoring question could be stated more like: "are harvested organism (species) levels changing?"
• There are separate questions being addressed in the monitoring question & the fisheries independent and dependent measures should be looked at/addressed separately, particularly because fisheries extend beyond the park boundary. The creel surveys in American Samoa were used as an example.
• Someone asked if it was necessary to include information on other species and their interaction (indirectly) with data interpretation, for example birds and other pelagic fish consuming fish. Is it possible to incorporate this into the methods?
• The monitoring objective and the vital sign are not in agreement. The monitoring objective refers to terrestrial, freshwater and with the resources includes coral & sand. Need to work on the wording.
• Monitoring method: add "in park on species" after "systematic monitoring of fishing" • Monitoring method: "population characteristics of target species covered elsewhere (M14) • Make sure algae is covered somewhere • "Monitor fishery and outcome of fishery" another way to rephrase/readdress the fishery
dependent/independent data monitoring • Research: Is human harvest changing distribution abundance, or other population
characteristics? How are assemblages/communities of associated species affected?

Appendix O: Part IV Vital Signs Workshops
90
Vital Sign M13 – Water Column Marine Vertebrates and Invertebrates Biodiversity • Is it necessary to make the distinction between benthos and water column
species/environments (thus doubling the number of vital signs)? • In addition to the above statement when we are discussing water column marine vertebrates
and invertebrates, we are essentially referring to reef fish and squid, and if that is all that fit into that category, it might make more sense to state it as such (get rid of classification terminology).
• Monitoring question: Using the word "long-term" constrains us on the temporal scale. We may not capture short-term impacts.
• "Long-term" monitoring in this vital sign might not be necessary • What type of change are we trying to get at? By looking at the individual species? How
would we do the statistical analysis on the community level over a short period of time? Then the discussion was clarified that we were still looking at the community/assemblage level of organization and not at the species level
• It might be difficult to get (or we might miss), over time/space the one point/event/occurrence important to the assemblage.
• Analysis should be at the level of scale at the community level (in metrics) • Telemetry, movement, distribution are not a monitoring issue, these metrics all address
research issues. Then it was brought to attention that these types of information should all be known before monitoring commences.
• Add mapping to monitoring methods (distribution in monitoring question) • Monitoring question: remove "long-term" • Vital sign: be more specific (in word choice) • Research: Before monitoring begins, we need to know movement, telemetry, and in some
cases distribution. Vital Sign M14 – Water Column Reef Fisheries
• Remove the word "community" and replace with "assemblage" • Monitoring questions are addressing research questions • Research: what are the effects of human harvest on Fished/gathered species? If variance is
observed is it due to harvest? • Is it practical for parks to monitor harvest levels? It might be difficult to monitor harvest
when you are not looking to start with. And, maybe to monitor the population parameters of the fish?
• It was suggested to monitor an entire assemblage for both the component not harvested as well as the harvested species; and then see how the entire assemblage reacts. This would involve monitoring both fisheries dependent/independent species.
• Assemblages addressed in the vital sign discussed above (earlier). This vital sign examines particular/specific species
• Some parks might want to look at assemblage and species population parameters for some species (e.g. yellow tang)
• Is the concept same as in M25??? • LOOK AT: M14, H15 and M14 together • Monitoring objective: change "fisheries" to "selected" • Consider "assemblages" and remove "communities" from monitoring question • Monitoring method: remove quadrats • Metrics: add "frequency" to "size frequency class" and remove "recruitment" • Changes in trends in population versus historical condition & versus outside parks
National Park Service 91
• Vital sign is not a vital sign but a topic, rewrite • Monitoring question: the phrase "what are effects of human harvest on fished or gathered
species" matches the method of H15 of population characteristics of target species • Examine condition of selected population versus the historical condition. Where historical
qualitative data do not exist, historical anecdotal qualitative sources of data should be explored and utilized. Comparable protocols should be used across regions, comparable monitoring methods.
Vital Sign M15 – Established Marine Animal (other than turtles)Disease & Pathogens • Is it useful to separate out turtles? Why not combine them? • Add parasites (i.e. ectoparasites that can be observed on body of fish) • Where to contaminants fit in? • Remove telemetry in the methods • Also consider qualitative metadata (comment brought up in previous session applies) • Noticed the low ranking, and it might be "good" because it might not necessarily be one to
place monitoring efforts, but at the same time might be important for some parks (i.e. a low overall rank but really important to one park)
• Vital sign: consider abiotic causes and parasites • Ulcers & abnormalities - could be a topic for research • Monitor not just for existing areas of concern, but for unpredictable & developing new issues • Vital sign: see health note in Threatened & Endangered Species (T&E) session; monitor for
health versus for disease • Monitoring question: response to endocrine disruptions & other chemical causes • Monitoring method: remove telemetry • Metrics: vectors is more research question • "Marine animals", does this include corals? Or is that covered elsewhere? • Research: Correlating water quality data sets with disease incidence/occurrence. Sources of
disease/pathogen. What are the impacts of pathogens on the community level? Vital Sign M17 – Established Alien Species – Water Column Marine
• Questions are more research oriented • Can we "detect" a change in trends? • If we monitor the assemblage, then trends will fall out. (e.g. Roi increases over time then look
at the impacts on the assemblage, looking more at trophic interactions) • Should we get rid of this vital sign? • Should keep it so that we can look at alien species • Monitoring objective: "treatment" = implies a management action, remove! • Vital sign: it is stated as a topic, not a vital sign • Monitoring questions are research questions • Monitoring method: add mapping (because distribution in metrics) • Alien & invasive are both mentioned in monitoring question, but not addressed in vital sign
or monitoring objective Vital Sign M21 – Alien Incipient Invasives – Water Column Marine
• Lump incipient with established (M21 and M17) • Covered in M14 - see above • Vital sign: topic, not a vital sign • Monitoring method: add mapping (because distribution in metrics)
Appendix O: Part IV Vital Signs Workshops
92
• How do you monitor for this specifically? I suggest you delete because this would be covered in basic fish data collection (M14 as rewritten)
Vital Sign M18 – Water Column Marine Invertebrates • If squid are the only species that fit into this category, then call it "squid"! • Monitoring question: be more specific, maybe "temporal trends" • Should plankton models be considered? Response: No, but could be considered in research • This vital sign was described as being "less than vital" and should consider being dropped • This vital sign needs to be more specific. It is very vague • Research: What are the effects of alien and invasive species on communities? What is the
response to treatment? What are the most effective strategies for detecting and preventing new invasive species? What are potential impacts?
Vital Sign M19 – Fish Growth/Size and Age Structure, and Recruitment • Fisheries agencies more likely to monitor this vital sign • Partnering might be an option • In some cases the parks might have more resources to conduct this work & particularly if
there is an impact in a particular park, then that park should take some of the responsibility towards some of the monitoring
• Identify areas that are do-able • This would be more issue driven by park. Some of these might be more important for parks
to decide. • These fish parameters are measured during fish/fisheries surveys and will fall out • Growth, age where monitoring might not be accomplished. • Size is included in M14 • Select parameters that are monitored everywhere and then have selective monitoring
parameters by park/region • Issues could develop after implementation, then they might be missed in the long-term
picture • Size and age and recruitment in the vital sign are research questions • Include color morph and qualitative data • Consider condensing into M14
Vital Sign M20 – Marine, Species Protection (T,E, S-o-C Species) • Add either "prized", "targeted", or "selected" as clarifier to the word "species" • Change "Marine species protection" to "protected marine species" • Strike "variation within normal range" • Monitoring questions that use the word “variation,” statistically mean range versus variability • Monitoring question: change to: "What are temporal trends in distribution, abundance, and
size" • Consider recruitment in monitoring question or research • Vital sign: include culturally important species • Monitoring methods: telemetry is more research oriented • Metrics: add recruitment • Vital sign: this is a topic, not a vital sign
Vital Sign M25 – Intertidal Reef Fisheries / Collected species (limu, opihi, crabs, fish, etc.) • See H15, same comments apply, particularly separating fisheries dependent/independent data

National Park Service 93
• Change “collected” to “harvested,” collected seemed to imply specimens were being gathered for study.
• Metrics: add density • Methods: add mapping
Other Comments: • Ciguatera needs to be addressed somewhere • Sharks in PUHE should be considered or highlighted in the vital sign • Sliding baseline syndrome should be considered • During the M6 discussion, it was pointed out that there seemed to be redundancy with human
harvest (three sections on same group of species)
Synthesis of Main Points from Session Comments:
The role of NPS monitoring nearshore fisheries was briefly discussed. NPS management emphasized the agency’s obligation towards stewardship and the need to understand ecological processes in and near park boundaries, including effects of stressors on natural resources. Without working outside of boundaries, it was felt that information necessary to manage park natural resources would be incomplete, jeopardizing the agency’s primary mission.
The group recommended differentiating and separating fisheries dependent (i.e. catch) and independent (i.e. stock/population) sources of data in the vital signs.
It was suggested to use the term “assemblages” in lieu of “communities” (M14); communities may be impractical to monitor and individual populations too specific. Assemblages are more easily measured and serve as a reliable community level bioindicator reflective of change.
There were recommendations to both lump and split vital signs during this session. It was again recommended to consider algae separately (splitting). It was recommended to lump those vital signs pertaining to invasive/alien species into a single vital sign (e.g. M21 and M17).
It was recommended to consider the concept of sliding baselines and ghost communities in these vital signs when considering the composition of baseline inventories of the present communities in the parks. Sliding baselines and ghost communities are more philosophical topics than tangible monitoring issues; they are none-the-less critical when drawing conclusions about the status/impairment of park resources.
No new vital signs were proposed for this session.
Responses to Main Points Raised During Session:
• Distinction between fisheries dependent and independent data:
Session participants distinguished between fisheries dependent (i.e. actual harvest) and fishery independent (i.e. population size) monitoring. We have clarified this issue by ensuring the two monitoring objectives are addressed separately. One vital sign examines the catch landed. Two vital signs address both targeted and non-targeted fish species at two ecological levels. One vital sign would monitor fish communities at an assemblage level, and a second vital sign would monitor selected fish species population dynamics.

Appendix O: Part IV Vital Signs Workshops
94
Initial Vital Signs: Marine – Fish/Fisheries
Eco Char Vital Sign Category Monitoring Objectives VS
Id# Vital Sign Monitoring Question(s) Monitoring Method Metrics Vital Sign Rank (0-5)
Hum
an activities &
cultural practices
Park Use & Activities Monitor levels of take & harvest of harvested species (marine, freshwater, and terrestrial) or resources (coral, sand)
H15 Reef Fisheries Harvest Are harvest levels changing? What are trends? Is human harvest changing distribution, abundance, or other population characteristics? Harvest includes legal and illegal take.
Systematic monitoring of fishing and harvest of shellfish and other inverts in coastal areas; population characteristics of target species
catch per unit effort, collection statistics (quantity, age/size), composition, Creel counts, harvest quantity
2.6
Community Monitor community dynamics, structure, function, and composition M13 Water Column Marine Vertebrates and
Invertebrates Biodiversity Are there long-term changes (community composition, distribution) in selected native communities?
telemetry, quadrants, transects, aerial surveys, tows, traps
Relative abundance, demographics, distribution, movement, diversity 2.8
Track community and population trends in harvested fisheries species M14 Water Column Reef Fisheries Is variation in community / population parameters due to harvest? What are effects of
human harvest on fished or gathered species? Transects, quadrant Abundance, demography, size class, recruitment 2.2
Monitor disease incidence and impacts, especially on native species M15 Established Marine Animal (other than
turtles) Disease & Pathogens What is the incidence and level of disease in populations? Are diseases/pathogens affecting populations? What are trends in disease/pathogen? Incidence, telemetry disease types, occurrence, tissue samples, vectors 1.9
Monitor extent and response to treatment of established invasive species M17 Established Alien Species - Water
Column Marine Can we detect changing trends in alien and invasive species? What are effects of alien and invasive species on communities? What is response to treatment? Transects, quadrants abundance, demography, distribution 2.5
M18 Water Column Marine Invertebrates Is variation within normal range? What are temporal trends? Transects, quadrants, tows, traps Abundance, size, demography, recruitment rates 2.8
M19 Fish Growth/Size and Age Structure, and Recruitment Is variation within normal range? What are selected short- and long-term trends? transects, quadrants,
photoquadrants, mapping abundance of size classes, recruitment rates, species diversity 3.2
Monitor population size and distribution of native, endemic, or focal species, including response to restoration efforts. Where appropriate, measure demographics (size/age structure, reproduction, recruitment, etc.) of selected indicator species
M20 Marine Species Protection (T, E, S-o-C species) Is variation within normal range? What are temporal trends? telemetry, quadrants, transects,
aerial surveys abundance, demographics, distribution, movement 3.3
Water colum
n (motile)
Population
Monitor occurrence of non-established (incipient) invasive species M21 Alien Incipient Invasives - Water Column
Marine
Is species present, if so what is the nature and extent of infestation? What are the most effective strategies for detecting and preventing new invasives species? Where should efforts be focused? What are potential impacts?
Transects, quadrants, tows, traps abundance, demography, distribution 2.1
Biotic Integrity
Marine E
cosystems
Intertidal
Pop
ulation
Track community and population trends in harvested fisheries collected species M25 Intertidal Reef Fisheries / Collected
species (limu, opihi, crabs, fish, etc.) What are effects of human harvest on fished or gathered species? What are trends in harvested species?
Transects, quadrants, mapping, traps, biomass, percent cover Demographics, size, recruitment, distribution 2.3
For revised Vital Signs: Marine – Fish/Fisheries, see the end of all marine sessions for a consolidated revision.

National Park Service 95
Marine Intertidal Topical Session
Participants:
Dwayne Minton (facilitator) Karl Magnacca (notes) Bruce Richmond Karin Schlappa Coleen Cory Larry Basch Dan Polhemus Chris Bird Chela Zabin Malia Laber Eva DiDonato Maria Carnevale Roy Irwin Guy Hughes Ben Saldua Daniel Kawaiaea Caroline Rogers
Session Notes:
All the marine sessions followed a similar progression. We decided to go through the list and discuss each vital sign instead of listing out vital signs that needed to be revisited, as indicated by the agenda. The participants offered suggestions for improvement on the vital sign, vital sign monitoring questions, the methods and metrics. General monitoring and marine monitoring topics were discussed throughout the sessions and those notes were kept on a separate sheet of paper from the vital sign specific comments. Some of the general discussion and suggestions are highlighted in a separate section at the end of the marine sessions. Overall, the marine sessions were a valuable source of information and led to a reorganization of the vital signs. The revised vital signs appear at the end of the marine sessions.
Initial Vital Sign – Specific Comments: Vital Sign M22 – Intertidal Biodiversity – Vertebrates, Invertebrates, and Algae
• Method/metric: add mapping/distribution • Metric: add "diversity" • Vital sign: add "vascular plants, etc. to title" to read: "vertebrates, invertebrates, algae,
vascular plants, etc." • Monitoring question: "what are long-term changes" • Metrics: use "assemblages" rather than "species"
Vital Sign M23 – Intertidal – Hard Bottom and Vital Sign M24 – Intertidal – Soft Bottom (sandbeach, mudflat, mangrove)
• Vital sign: "intertidal community condition & functional groups" • Metrics: change "type" to "functional groups"
Vital Sign M25 – Intertidal Reef Fisheries/Collected species (limu, opihi, crabs, fish, etc.) • See comments from fisheries group • Include competitors and other ecologically related species with respect to harvested species
Vital Sign M26 – Intertidal Marine Invertebrates, Fish, and Algae • Monitoring question: add "distribution" • Methods: add "mapping" • Monitoring question: "how are species distributed?" • Monitoring method: add "mapping"
Vital Sign M27 – Established Alien Species – Intertidal Marine • Combine with M28 • Methods: add "mapping"
Appendix O: Part IV Vital Signs Workshops
96
• Research: What are the effects of alien and invasive species on communities? What is the response to treatment? What are the most effective strategies for detecting and preventing new invasive species? What are potential impacts?
Vital Sign M28 – Alien Incipient Invasives – Intertidal Marine • Monitoring method: add "monitor known potential pathways" • Monitoring questions are more research oriented questions • Monitor outside park: sources/pathways, vectors/early warning system, such as ballast water
monitoring work • Research: What are the effects of alien and invasive species on communities? What is the
response to treatment? What are the most effective strategies for detecting and preventing new invasive species? What are potential impacts?
Vital Sign P10 – Ocean/Physical Dynamics: Currents, Sea Level, Tides/Swell (see Air Quality/Climate)
• Include freshwater stress, nutrient loading, low-wave events, harbor development, currents, sedimentation
• Waves, currents & tides all measured with ADCP • Temperature, salinity, nutrients/water quality together & chlorophyll (water column
productivity on & near shore) • Currents more an inventory/research question? Too variable to monitor? • Monitoring method: wave rider buoys
Other Comments:
• Add landscape level vital sign (human structures, advancement of invasive species, etc) • Consider comparability between parks (methods & metrics) • Rethink vital sign about monitoring after restoration, changing baselines • Sea level rise with cultural significance (structures/petroglyphs) • Refer landscape vital sign to intertidal trampling (H8) • PUHE: response to operation tugboat reef blasting • PUHE: effects of man-made structures on intertidal areas geomorphology, habitat types,
change in nearshore circulation patterns • Combined natural & cultural vital sign: submerged cultural features (PUHE heiau, KAHO
rock walls, fishponds) • Trampling effects, human impacts (literature, including Hawaii) • Monitoring method: include wave rider buoys • It was recommended to consider effects of organic input into the intertidal region (including
nutrient loading). Organic input into the intertidal region originating from freshwater and sedimentation sources.
• The effect of beach raking on the intertidal region was also brought up. In some areas such as WAPA the sand is washed onto the nearby road and subsequently raked back onto the beach with minimal effect of burial killing. However, in other more managed beaches, such as Waikiki the negative effects of raking have resulted in no ghost crabs, amphipods, mole crabs, etc. that were originally inhabiting these intertidal areas.
Synthesis of Main Points from Session Comments:
It was suggested that in lieu of monitoring an entire community it might be more feasible to monitor an indicator/focal species as a proxy for change in the community.

National Park Service 97
One new vital sign was proposed for a landscape-level intertidal vital sign that incorporates geomorphological change including both natural and anthropogenic substrates (e.g. sea wall) and the community that inhabits them. These landscape level features were felt to be critical to understanding intertidal processes.
Responses to Main Points Raised During Session:
A landscape level vital sign was developed to address shoreline changes over a large spatial scale. This vital sign would be useful for looking at large scale biological and geological changes in the coastal features and would be critical to understanding intertidal processes. It was felt that a landscape level vital sign would better address issues such as shoreline change or alteration and could provide better explanatory power if changes in intertidal communities were observed.
Participants raised the issue of using focal species as indicators of community structure. Unfortunately, adequate time was not spent discussing this point to clearly define its level of current understanding and thus its merit. We feel that the revised structure of the vital signs adequately encompasses this idea such that no additional changes are needed. The I&M program should further investigate this topic, as it may lead to viable methodologies for characterizing intertidal communities above the species scale.

Appendix O: Part IV Vital Signs Workshops
98
Initial vital Signs: Marine - Intertidal
Eco Char
Vital Sign Category Monitoring Objectives VS Id# Vital Sign Monitoring Question(s) Monitoring Method Metrics
Vital Sign Rank (0-5)
M22 Intertidal Biodiversity - Vertebrates, Invertebrates, and Algae
Are there long-term changes in selected native communities, distribution, cover? Population surveys, transects, quadrants Abundance and trends of selected species or groups, evenness, richness 3.1
M23 Intertidal - Hard Bottom Is variation within normal range? What are selected (community composition, distribution, physical structure, habitat extent) short- and long-term trends? transects, quadrants cover by type, habitat type diversity, percent cover of
species density 2.2
Com
munity
Monitor community dynamics, structure, function, and composition
M24 Intertidal - Soft Bottom (sand beach, mudflat, mangrove)
Is variation within normal range? What are selected (community composition, distribution, physical structure, habitat extent) short- and long-term trends? transects, quadrants, mapping cover by type, habitat type diversity, percent cover of
species density 2.6
Track community and population trends in harvested fisheries collected species M25
Intertidal Reef Fisheries / Collected species (limu, opihi, crabs, fish, etc.)
What are effects of human harvest on fished or gathered species? What are trends in harvested species?
Transects, quadrants, mapping, traps, biomass, percent cover Demographics, size, recruitment, distribution 2.3
Monitor population size and distribution of native, endemic, or focal species, including response to restoration efforts. Where appropriate, measure demographics (size/age structure, reproduction, recruitment, etc.) of selected indicator species
M26 Intertidal Marine Invertebrates, Fish, and Algae Is variation within normal range? What are the long / short term trends? population surveys, quadrants, transects,
traps, tows abundance, distribution, evenness, demography, recruitment 3.0
Monitor extent and response to treatment of established invasive species M27 Established Alien Species -
Intertidal Marine Can we detect changing trends in alien and invasive species? What are effects of alien and invasive species on communities? What is response to treatment?
population surveys, quadrants, transects, traps, tows abundance, demography, distribution 2.5
Biotic Integrity
Marine E
cosystems
Intertidal Population
Monitor occurrence of non-established (incipient) invasive species M28 Alien Incipient Invasives - Intertidal
Marine
Is species present, if so what is the nature and extent of infestation? What are the most effective strategies for detecting and preventing new invasives species? Where should efforts be focused? What are potential impacts?
Transects, quadrants, mapping, vectors, traps abundance, demography, distribution 2.6
For revised Vital Signs: Marine – Intertidal, see the end of all marine sessions for a consolidated revision.
National Park Service 99
Marine Other Topical Session
Participants:
Raychelle Daniel (facilitator) Casey Cumming (notes) Sonia Stephens Kimber DeVerse Peter Craig Jen Smith Lisa Wedding Bud Antonelis Sallie Beavers Roy Irwin
Session Notes:
All the marine sessions followed a similar progression. We decided to go through the list and discuss each vital sign instead of listing out vital signs that needed to be revisited, as indicated by the agenda. The participants offered suggestions for improvement on the vital sign, vital sign monitoring questions, the methods and metrics. General monitoring and marine monitoring topics were discussed throughout the sessions and those notes were kept on a separate sheet of paper from the vital sign specific comments. Some of the general discussion and suggestions are highlighted in a separate section at the end of the marine sessions. Overall, the marine sessions were a valuable source of information and led to a reorganization of the vital signs. The revised vital signs appear at the end of the marine sessions.
Initial Vital Sign – Specific Comments: Vital Sign H8 – Marine Recreational Activities & Groundings/Anchor Damage
• Metrics: density of discarded fish line • Methods: add mapping (of anchor damage) where boats anchor • Add marine debris from fishing, campers, cultural practices
Vital Sign H7 – Litter/debris (see Landscape) • The source of debris/trash should be distinguished from terrestrial and open water sources • Add impacts (of debris) directly on wildlife into the vital sign.
Vital Sign H12 – Coral/Sand Mining Harvest • Monitoring question: "what are annual harvest levels?" • Research: "what is the replacement rate?" • Monitor and differentiate between natural & human removal of sand/coral versus the natural
replacement rate • Methods: add mapping
Vital Sign P21-30 – See Water Quality Vital Signs Vital Sign P21 – Marine Water Quality Core parameters
• Why is this on this list? • Core parameters: needs work. Also include nutrient input
Vital Sign P24 – Marine Water Quality Supplemental parameters • Add additional pigments from water samples (e.g. chlorophylls) • Also use satellite images • Another metric to consider is sedimentary pore water sampling. Sedimentary pore water
sampling will get intrusion rate at different depths and give vertical profiles more linkage to land and sea
• If above can't be done, then use chlorophyll a • Salinity, dissolved oxygen

Appendix O: Part IV Vital Signs Workshops
100
Vital Sign P30 – Marine Water Quality – Toxics & contaminants • Add biotoxins
Vital Sign P32 – Marine Water Quality - macroinvertebrates • This vital sign is more research oriented • Consider to toss this vital sign; core water sampling is more informative • Consistency is lacking to monitor invertebrate communities as indicators of water quality • Monitoring question rewording: does the benthic community indicate impaired water quality?
Vital Sign M5 – Subtidal – Soft Bottom (sand flat, seagrass bed) • Consistency is lacking, the use of this heading, “subtidal” needs to be reconsidered. • Soft bottom should be changed to benthic and algae • Monitoring question: variation of what? What does variation cover? • Seagrass could be separated to have its own vital sign (using measures of density) or to have
this vital sign encompass only seagrass. • Is soft bottom covered in invert session? • Reword monitoring to match vital sign category: "what are selected short & long term trends
in invert & plant community compositions? Vital Sign M6 – Benthic Reef Fisheries/Collected species (inverts: sea cucumbers, pololo worm,
corals, etc) • Monitoring question: last two sentences are more research oriented. Wording needs work. • Methods: add mapping • Algae: be sure this is covered in one of the harvested/human use vital signs
Vital Sign M7- Benthic Marine Invertebrates and Algae • Covered in earlier session • It was recommended that it should be rewritten to address species of selected interest. • The objective should be the vital sign • Invasive species would fall into this category, they would be observed during monitoring
surveys Vital Sign M14 – Water Column Reef Fisheries
• This vital sign was covered in fisheries session (see notes) • Add “ selective” to this vital sign • Deleted “community” • Added population of reef fisheries • Nationwide fish fall out of ranking due to their movement
Vital Sign M15 – Established Marine Animal (other than turtles) Disease & Pathogens and Vital Sign M16 – Established Turtle Disease & Pathogens
• This was covered in Threatened & Endangered Species (T&E) session • It is difficult to monitor disease, have to look at population health • Add: insular and transient species, monk seals, cetaceans • Partnerships will be important for this vital sign, especially with turtles
Vital Sign M17 – Established Alien Species – Water Column Marine • What is the reason benthic & fisheries were separated out? Possibly due to monitoring
methods. You could use a third category: demersal. Because it seems that this vital sign is duplication. Another term to use is “coral reef associated species.”
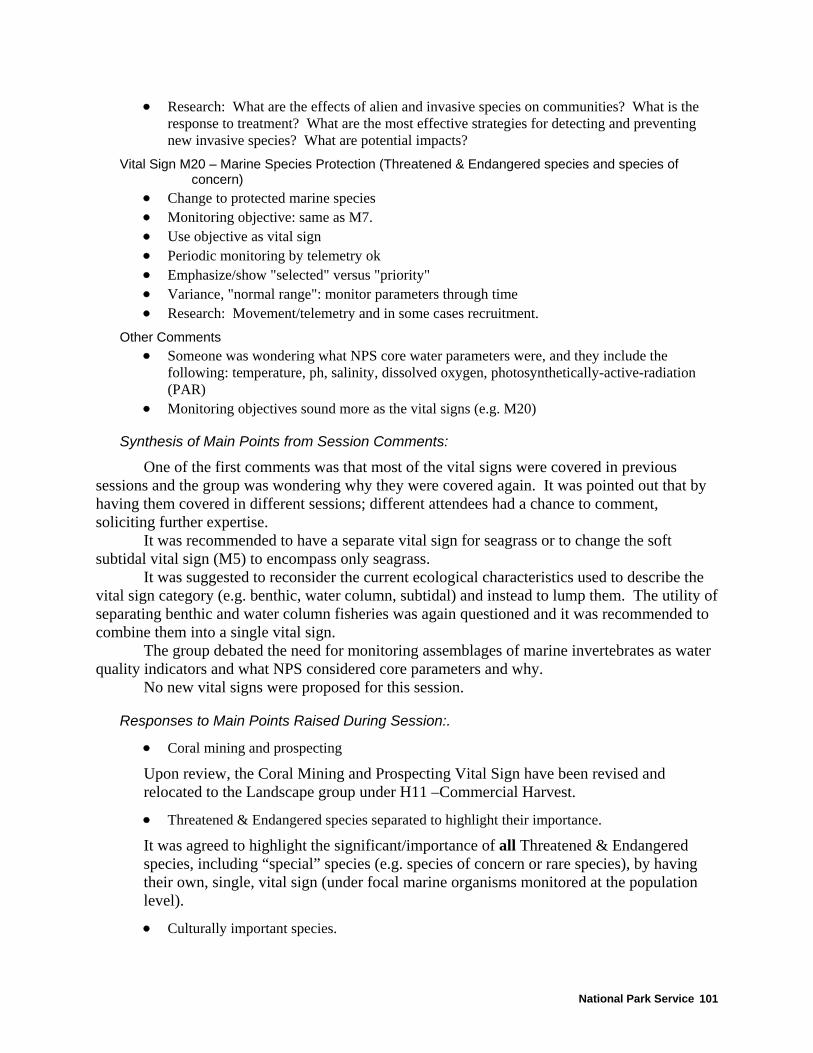
National Park Service 101
• Research: What are the effects of alien and invasive species on communities? What is the response to treatment? What are the most effective strategies for detecting and preventing new invasive species? What are potential impacts?
Vital Sign M20 – Marine Species Protection (Threatened & Endangered species and species of concern)
• Change to protected marine species • Monitoring objective: same as M7. • Use objective as vital sign • Periodic monitoring by telemetry ok • Emphasize/show "selected" versus "priority" • Variance, "normal range": monitor parameters through time • Research: Movement/telemetry and in some cases recruitment.
Other Comments • Someone was wondering what NPS core water parameters were, and they include the
following: temperature, ph, salinity, dissolved oxygen, photosynthetically-active-radiation (PAR)
• Monitoring objectives sound more as the vital signs (e.g. M20)
Synthesis of Main Points from Session Comments:
One of the first comments was that most of the vital signs were covered in previous sessions and the group was wondering why they were covered again. It was pointed out that by having them covered in different sessions; different attendees had a chance to comment, soliciting further expertise.
It was recommended to have a separate vital sign for seagrass or to change the soft subtidal vital sign (M5) to encompass only seagrass.
It was suggested to reconsider the current ecological characteristics used to describe the vital sign category (e.g. benthic, water column, subtidal) and instead to lump them. The utility of separating benthic and water column fisheries was again questioned and it was recommended to combine them into a single vital sign.
The group debated the need for monitoring assemblages of marine invertebrates as water quality indicators and what NPS considered core parameters and why.
No new vital signs were proposed for this session.
Responses to Main Points Raised During Session:.
• Coral mining and prospecting
Upon review, the Coral Mining and Prospecting Vital Sign have been revised and relocated to the Landscape group under H11 –Commercial Harvest.
• Threatened & Endangered species separated to highlight their importance.
It was agreed to highlight the significant/importance of all Threatened & Endangered species, including “special” species (e.g. species of concern or rare species), by having their own, single, vital sign (under focal marine organisms monitored at the population level).
• Culturally important species.

Appendix O: Part IV Vital Signs Workshops
102
Culturally important marine plants and animal species, including limu, opihi, etc., were separated from other marine species (initial M20) to highlight their importance. The PACN program has adopted as it one of its goals to monitor culturally significant species, therefore, highlighting these species with their own vital sign will meet that objective. Culturally significant marine organisms in H12 should also be included, provided they are explicitly mentioned in the text. Failing to specifically mention these groups may cause them to be inadvertently excluded from future consideration.

National Park Service 103
Initial Vital Signs: Marine - Other
Eco Char
Vital Sign Category Monitoring Objectives VS
Id# Vital Sign Monitoring Question(s) Monitoring Method Metrics Vital Sign
Rank (0-5)
Monitor patterns of park visitation, use & damage (terrestrial & marine) H8 Marine Recreational Activities &
Groundings/Anchor Damage Are use levels changing? What are trends? plots, transects, and surveys
density of fish line, density of lead sinkers on bottom, level/degree of trampling, percent broken coral, quantity of beach users, quantity of diver hours, water films
2.5
Hum
an activities &
cultural practices
Park Use & Activities
Monitor levels of take & harvest of harvested species (marine, freshwater, and terrestrial) or resources (coral, sand)
H12 Coral/Sand Mining Harvest Are harvest levels changing? What are trends? plots/transects and remote sensing harvest composition, harvest quantity 1.2
Monitor water quality core parameters P21 Marine Water Quality Core parameters Is variation within normal range? What are temporal trends? in-situ measurements and collection of samples at established sites including controls
temperature, pH, salinity (sp. cond.), Dissolved Oxygen, PAR 3.3
Monitor supplemental water quality parameters P24 Marine Water Quality Supplemental
parameters Is variation within normal range? What are temporal trends? in-situ measurements and collection of samples at established sites including controls
nutrients, total suspended solids/turbidity, chlorophyll A , alkalinity, anions, cations, redox, total organic carbon,
2.9
Monitor microbiological water quality parameters P27 Marine Water Quality - Microbiology Is variation within normal range? What are temporal trends? collection of samples at established sites
including controls bacteria, biological oxygen demand 2.8
Monitor toxic and contaminant levels in water P30 Marine Water Quality - Toxics &
contaminants Is variation within normal range? What are temporal trends? water sampling, sediment sampling, animal tissue sampling
chemical oxygen demand, heavy metals, herbicides, organics, pesticides 3.0
Physical / C
hemical C
onditions
Water Quality
Monitor biological invertebrate communities P32 Marine Water Quality - macro invertebrates
What are community dynamics of marine & estuarine sediment communities?
benthic community composition (transects, quadrants, traps, trawls, tows)
diversity, species richness, indicator species, recruitment 2.8
Com
munity Monitor community dynamics, structure,
function, and composition M5 Subtidal - Soft Bottom (sand flat, seagrass bed)
Is variation within normal range? What are selected (community composition, distribution, physical structure) short- and long-term trends? transects, quadrants, mapping cover by type, biomass, habitat type diversity,
percent cover of species density 2.4
Track community and population trends in harvested fisheries / collected species M6
Benthic Reef Fisheries / Collected species (inverts: sea cucumbers, pololo worm, corals; etc)
What are effects (size/age cohort, demographics) of human harvest on fished or gathered species? What are the trends of trackable population parameters? If variance is observed, is it due to harvest? Is variance due to harvest levels?
Transects, quadrants Counts, biomass, relative abundance 2.7
Benthic
Population
Monitor population size and distribution of native, endemic, or focal species, including response to restoration efforts. Where appropriate, measure demographics (size/age structure, reproduction, recruitment, etc.) of selected indicator species
M7 Benthic Marine Invertebrates and Algae Is population variation within normal range (size/age cohort, demographics)? What are population trends? transects, quadrants (photo, video), mapping Counts, demographics, biomass, relative
abundance, recruitment rate 2.7
Track community and population trends in harvested fisheries species M14 Water Column Reef Fisheries Is variation in community / population parameters due to harvest? What are
effects of human harvest on fished or gathered species? Transects, quadrant Abundance, demography, size class, recruitment 2.2
M15 Established Marine Animal (other than turtles) Disease & Pathogens
What is the incidence and level of disease in populations? Are diseases/pathogens affecting populations? What are trends in disease/pathogen?
Incidence, telemetry disease types, occurrence, tissue samples, vectors 1.9 Monitor disease incidence and impacts, especially on native species
M16 Established Turtle Disease & Pathogens
What is the incidence and level of disease in populations? Are diseases/pathogens affecting populations? What are trends in disease/pathogen?
incidence, telemetry (mark-recapture) disease types, occurrence, vectors 2.9
Monitor extent and response to treatment of established invasive species M17 Established Alien Species - Water
Column Marine
Can we detect changing trends in alien and invasive species? What are effects of alien and invasive species on communities? What is response to treatment?
Transects, quadrants abundance, demography, distribution 2.5
Biotic Integrity
Marine E
cosystems
Water C
olumn (m
otile)
Population
Monitor population size and distribution of native, endemic, or focal species, including response to restoration efforts. Where appropriate, measure demographics (size/age structure, reproduction, recruitment, etc.) of selected indicator species
M20 Marine Species Protection (T, E, S-o-C species) Is variation within normal range? What are temporal trends? telemetry, quadrants, transects, aerial
surveys abundance, demographics, distribution, movement 3.3
For revised Vital Signs: Marine – Other, see the end of all marine sessions for a consolidated revision.

Appendix O: Part IV Vital Signs Workshops
104
Marine Session(s) Overview
With the advent of the National Park Service Coral Reef Program, marine resources in NPS units have received increased attention. This attention includes the desire for an integrated consideration of marine resources, as reflected in the general responses and a single presentation of revised Vital Signs.
General Responses for Marine Vital Signs
• Is it necessary to have these (benthic, water column, intertidal) divisions, that double/triple the number of vital signs?
We agree with the recommendations of the session participants to reduce the number of vital signs by reorganizing our ecological characteristics. We have consolidated several of the vital signs, in particular we have removed duplicate vital signs that differed only by ecological characteristic (e.g. benthic, water column & intertidal). However, these characteristics were not completely lost, but have been incorporated into their ecological level of monitoring (landscape, community/assemblage & population). However, we did retain some separation (e.g. Threatened & Endangered species). We felt some level of separation was necessary to facilitate vital sign selection and implementation.
• Why do we have a separate vital sign for incipient species? Can we monitor them?
We combined established and incipient species into a single a vital sign. The monitoring of incipient species, though critical in concept, is difficult to imagine in practice. For this reason, we do not want to remove it from consideration and hope that viable monitoring methods can be developed to adequately address them.
• Sliding baseline and reconstruction of historical data.
The issue of sliding baselines, raised in several marine sessions, is a critical issue that must be addressed. This issue has been addressed in the marine section of the Phase 1 monitoring document and is raised here to reinforce its importance. Without a solid understanding of past conditions, especially in light of sliding baselines, it will be difficult to draw valid and meaningful conclusions about the status/impairment of park resources. Qualitative data (e.g. photographs) are an important source of information where data might be absent or scarce.
• The importance of qualitative data.
Qualitative data was not explicitly considered previously in the marine vital signs but participants in several of the marine sessions stressed the importance of collecting and using qualitative data in monitoring and assessing baseline conditions. We will incorporate qualitative data into the methodology of the selected vital signs and appears in the measures and metrics section of the attached vital signs. Qualitative data will also be critical in assembling baseline conditions, especially in light of sliding baselines and the need to use information that may not have been collected in a scientifically rigorous manner.
• What is the role of NPS monitoring adjacent/outside established boundaries?
This issue is critical to the entire PACN I&M program, but it is particularly relevant to the marine section. Submerged land issues are complex, and involve federal, state and

National Park Service 105
territorial governments and their associated land management agencies. The purview of PACN I&M Program must extend beyond park boundaries in order to succeed.
Marine Session Comments – Applicable to Entire Monitoring Program
• Consider phrasing metrics category as “measures” • Monitoring of "diversity" is based on a robust inventory occurring beforehand. Where
diversity mentioned, would need to have inventory already completed • Be careful/cautious in developing too many new protocols. There are already a lot out there
developed that might only need some tweaking • Be careful with being too standard. If you are addressing new questions, then you need new
methods. • Don't wait for the perfect method to come along, just make sure that any methodology (new
or existing) is statistically rigorous and valid. • Reinforced previous comments on addressing new questions with new methodologies, and to
embrace new technologies (e.g. using video on benthic surveys) • Consider the amount of time needed to spend at a site, particularly a new/first visit. You need
to take into consideration (in methodology) the effort needed to get to remote/hard to access sites versus sites that are easily accessible.
• The "A", analysis, tends to be glossed over in the methodology and should be incorporated and considered when designing protocols and should be taken into consideration in a monitoring plan.
• The importance of getting (park) people into the water was stressed and to have them see their underwater park communities.
• Consider & think about what statistical analysis would be used, QA/QC consistency being used for a methodology/protocol. Quite often they comprise the bulk of time and money spent on a project, often two to three times the time and effort of monitoring costs.
• Consider using large aggregations for more powerful/useful analyses • Qualitative descriptions need to be incorporated in the vital sign • Monitoring questions seem to be phrased more as research-oriented questions (e.g. M6) • Measures should be included with metrics • Single out Threatened & Endangered (T&E) species • Why the separate benthic & water column categories for the vital signs? It might not be the
best division to make. The wording (semantics) might need some work (consider other wording).
• There should be more consistency between the methods and the vital signs (i.e. if mapping is a methodology then distribution should be in the metrics)
• Disease might not necessarily be a result from a biological source. There are both biological and chemical levels of disease types (e.g. pollutants in Pearl Harbor and USAR)
• When referring to "community" level of organization in the vital sign category, it might also be good to include "assemblages" to account for marine organisms
• The low ranking (of M15 disease) was pointed out and it was expressed as being "good" because it might not necessarily be one to place monitoring efforts, but at the same time it might be very important for “one” park and could fall out of the selection process.
• Examine present condition of selected population versus the historical condition. Where historical qualitative data do not exist, historical anecdotal qualitative sources of data should be explored and utilized. Comparable protocols should be used across regions, comparable monitoring methods.

Appendix O: Part IV Vital Signs Workshops
106
• NPS has the authority and responsibility to monitor outside boundaries. We have an obligation to learn what is happening.
• The importance of having partnerships/cooperators was emphasized, along with the above statement and it was pointed out that USVI established a new monument without the cooperation/partnership support and had a difficult time
• Presenting and examining historical data are important considerations to account for the importance of a shifting baseline. Historical data do not exist, in most cases in the quantitative form of today's data, but offer more meta/qualitative data and can offer a sense of where baseline shifted from. And, the other consideration are "ghost communities," whereby what we observe and see as a community today might not represent what might have previously existed. Is there a way we can think of this concept for the parks?
• The importance of getting park/staff people in the water was emphasized so that they can see and observe what resources exist in their parks. It was further pointed out that if there are no bodies in the park then get cooperators/collaborators that have knowledge of these areas in the water and observing.
• A concern was raised about the use of the word “normal” and what it means • A concern was made about distinctions between yearly and seasonal fish and how they might
be addressed in the vital signs • It was hoped that oral history/ethnographic sources were/would be researched for information
(historic harvest/types of species/quantities) • Consider comparability between parks in the methods & metrics • Rethink the vital signs that indicate monitoring after restoration and consider changing
baselines
Summary of Main Points from Comments
Concern was raised over the clarity of the vital signs. Attendees found them to be generalized statements that needed that needed rewording to provide better clarity and accuracy. In some cases, they needed to be more explicitly stated, such as the vital sign “water column vertebrates/invertebrates,” which was recommended to be stated as “fish and squid.” Some monitoring questions were more research directed and needed to be rephrased to reflect monitoring objectives. And, for those vital signs that referred to “species” it was recommended to use a clarifier such as “prized,” “targeted,” or “selected.” Consistency was needed among the monitoring objective, vital sign, monitoring questions, methods, and metrics (e.g. where there was mapping as a method, then distribution should have been a metric). The use of the term “measure” should be considered in addition to “metrics,” because metric carries specific meanings in some disciplines that may deviate from our intended usage.
Vitals signs had a considerable amount of overlap making it difficult to differentiate among them; and in many cases it was recommended to lump overlapping vital signs. For example, three alien/invasive vital signs (benthic, water column & intertidal) could be lumped into one marine alien/invasive vital sign (revised M11). However, concern was also raised over the possibility of overlumping for fear that important species might become lost within larger groupings, such as threatened & endangered (T&E) species.
It was recommended to include assemblages in the ecological organization of the vital signs. In many instances monitoring assemblages would be more informative than looking at individual species and more practical than monitoring the entire community. Assemblages are a reliable community level bioindicator and can be reflective of environmental change.

National Park Service 107
Diversity related vital signs are dependent on good inventories and it was stressed that thorough inventories need to be completed beforehand.
Emphasis was placed on methodology selection. Attendees stressed the need to incorporate quality assurance, consistency, and statistical analysis early in the planning process of the monitoring plan. During the development of methodology it was recommended to consider comparability (of methods) across parks and with other monitoring programs. However, where applicable (and especially if new questions are being addressed), new methodologies should be incorporated, particularly when new technologies emerge. The program should remain open to incorporating new technologies into future methodologies and must consider ways to transition in new techniques at the same time maintaining data comparability, quality and consistency.
The importance of qualitative data was highlighted. Qualitative data (e.g. color) can serve as a valuable source of information in the data collection process and should be included in measures and metrics, where appropriate. Another type of qualitative data that might prove useful is historical data (e.g. photographs). Quite often historical data do not exist at the present quantitative level, but qualitative historical data can offer a general idea of past community structure. This data will be critical when considering the sliding baseline syndrome and/or ghost communities.
The value of having park staff in the field was raised on several occasions. Many attendees felt it was critical to have staff routinely in the field to increase their familiarity with the park’s resources. Extensive time in the field would also increase the likelihood of detecting changes in the park (e.g. the arrival of a new invasive species) and be effective in monitoring.
During the vital sign selection process, the network must consider that although a vital sign might have a low overall ranking, it might be very important for one park and comprise the majority of monitoring effort for that park. A low overall ranking should not indicate that it falls out of the ranking process. Vital signs need to be responsive to the specific situations at individual parks.

Appendix O: Part IV Vital Signs Workshops
108
Revised Vital Signs – Marine Eco Char VS Category Monitoring Objectives VS ID# Vital Sign Monitoring Question(s) Monitoring Method Metrics & Measures
Patterns of park visitation, use & damage due to marine recreational activities, groundings/anchor damage, including debris/damage from fishing, campers, & cultural practices
H8 Marine recreational activity impacts
Are use levels of marine recreational activities changing? What are the trends in observable damage to marine environments as a result of marine recreational use? Including damage from groundings/anchor damage, trampling, debris/damage from fishing, campers & cultural practices.
Mapping for anchor damage, timed visitor counts, periodic surveys of transects and/or quadrats (for damage assessments)
Visitor density (including dive hours), measure of damage (e.g. distribution & amount of severity of anchor damage, amount of lead sinkers, fishing line or net entangled on bottom, number of broken corals level/degree of trampling, water films)
Hum
an activities and C
ultural practices
Park U
se & A
ctivities
Monitor levels of selected harvested reef fisheries species H15 Harvest levels of selected fisheries species
What are the trends in the harvest of fisheries species? Harvest includes legal and illegal take.
Systematic monitoring of fishing in park on species and harvest of shellfish and other inverts in coastal areas, creel surveys
CPUE (control & harvested population), collection statistics (quantity, age/size), composition
Monitor patterns, distributions & extent of landscape-level benthic habitat types M1 & M2 Benthic habitat type
distribution
Are the distributions of large scale habitat types (inside and immediately outside the parks) changing over time (i.e. lagoons, algal/coral reef cover)? Is reef erosion/accretion occurring?
Habitat mapping Distribution, relative abundance, cover by type, rugosity
Landscape NEW Intertidal habitat change What are the trends in the large scale ecological/geomorphological & habitat type changes? Mapping Distribution
Monitor diversity (composition & abundance) and distribution of benthic marine Invertebrates and algae (including coral reef, colonized basalt, sand bottom, etc.)
M3 Coral and other marine invertebrate community structure & dynamics
Are there long-term changes in benthic community diversity (abundance and composition) and distribution of selected native communities? What are the community dynamics?
Transects, quadrats (including photo, video)
Species composition & counts, percent cover of species, diversity, density/abundance, rugosity, coral growth rates
Monitor intertidal biodiversity, including community dynamics, structure & composition of intertidal vertebrates, invertebrates, algae and vascular plants
M22, M23 Intertidal community structure & dynamics
Are there long-term changes in selected native communities' composition, distribution, cover?
Population surveys, transects, quadrats, mapping
Abundance and trends of selected assemblages or groups, evenness, richness, distribution, assemblages of foundation species
Monitor community dynamics, structure and composition of water column marine vertebrates and invertebrate biodiversity (encompasses fish, squid & marine mammals)
M13 Marine fish assemblage structure & dynamics
What are the trends in community composition & distribution in selected native communities?
Transects, distance sampling, timed swim counts Relative abundance, demographics, diversity
Com
munity
M24, M5
Marine algae and vascular plant (including mangroves and seagrass) community structure & dynamics
Are there long-term changes in selected native communities' composition, distribution, cover?
Transects, quadrats (photo, video), mapping
Distribution, species composition & diversity, density, biomass, shoot density (seagrass)
Monitor population size, distribution of native endemic or focal species. Where appropriate measure demographics (size/age structure, reproduction, recruitment, etc) of selected indicator species
Focal marine fish population dynamics
What are the trends in abundance and distribution of selected marine fish populations? And if applicable/selected, what are the size/age classes?
Transects, mapping, population characteristics (demographics) of target species
Abundance, distribution, demography (size/age class frequency), qualitative data including general health and color morph
Monitor population size, distribution of native endemic or focal species. Where appropriate measure demographics (size/age structure, reproduction, recruitment, etc) of selected indicator species
Focal marine algae and vascular plant population dynamics
What are the trends in cover and frequency/density of selected marine algae and vascular plant species (including mangroves and seagrass)?
Transects, quadrats, species sampling for select turf species, crustose corallines and frondose algal species
Frequency for solitary algae, cover by species, demographics, recruitment, reproduction, growth rates. Qualitative data including general health.
Monitor population size, distribution of native endemic or focal species. Where appropriate measure demographics (size/age structure, reproduction, recruitment, etc) of selected indicator species
Focal marine coral and other invertebrate population dynamics
What are trends in abundance, distribution of selected coral and/or invertebrate species? If applicable/selected what are the trends in reproductive indexes, growth, survival and recruitment of selected species?
Population surveys, transects, quadrats (photo and/or video), mapping
frequency/density (number per unit area), distribution, growth rates, survival, recruitment rate, reproductive index. Qualitative data, including general health
Monitor population size, distribution of native endemic or focal species. Where appropriate measure demographics (size/age structure, reproduction, recruitment, etc) of selected indicator species
M20 Focal marine Threatened & Endangered Species population dynamics
What are trends in distribution & abundance of protected marine species or selected species of concern? What are the trends in recruitment, growth & survival rates for those species selected?
Transects, quadrats, mapping, marine mammal surveys, periodic telemetry
Abundance, demography (where appropriate), distribution, recruitment, growth, survival. Qualitative data including general health
Monitor extent and occurrence of established alien/invasive marine species
M27, M28, M17, M18, M11, M12
Established & Incipient marine alien/invasive species extent and occurrence
What are the trends in the incidence and level of infestation of alien/invasive species?
Population surveys, transects, quadrats, mapping
Presence/absence, trends in abundance, distribution and density, demography?, lab taxonomy?
Biotic Integrity
Marine E
cosystems
Population
Monitor disease, parasite and pathogen incidence (including abiotic causes) and impacts on established marine animals (other than turtles but including insular and transient species, monk seals & cetaceans)
M9, M15
Established & Incipient disease, parasites and pathogens, including abiotic, in marine animals and plants (including Threatened & Endangered species)
What are the trends in incidence and level of disease in populations? Established marine animals include turtles, insular and transient species, monk seals & cetaceans, etc.
Appropriate surveys for incidence Disease types, occurrence, tissue samples, qualitative data (e.g. stage of disease, qualitative description of host condition)
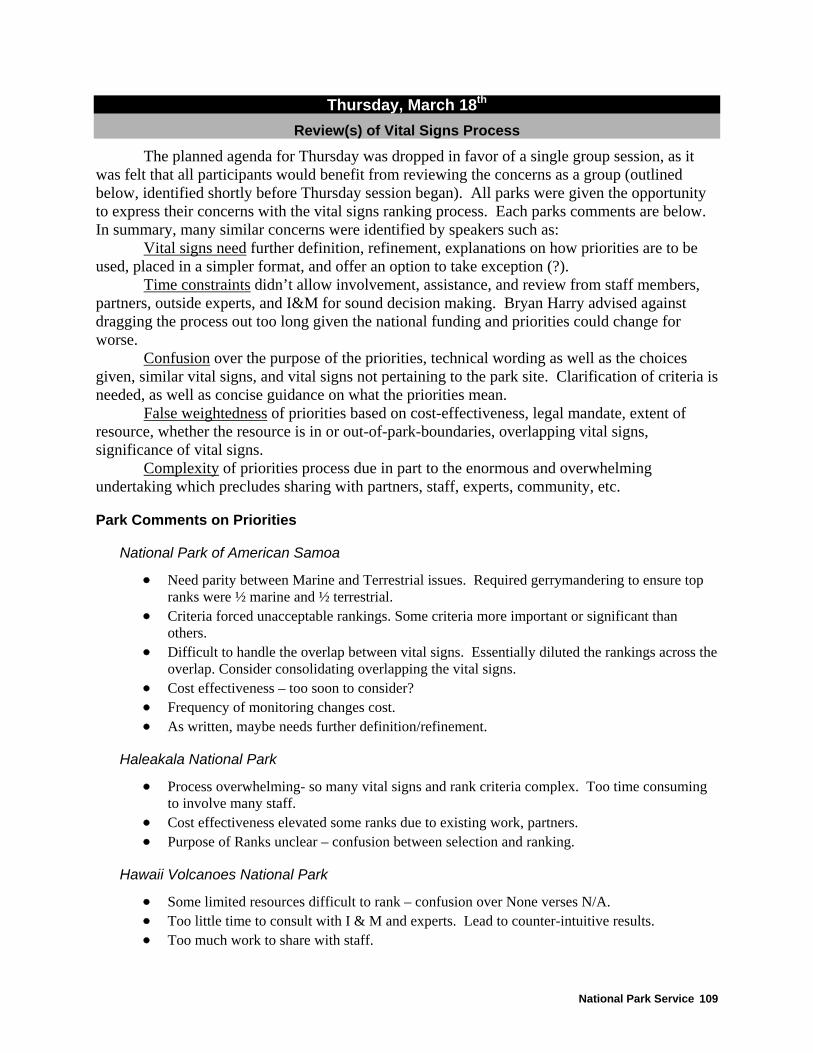
National Park Service 109
Thursday, March 18th Review(s) of Vital Signs Process
The planned agenda for Thursday was dropped in favor of a single group session, as it was felt that all participants would benefit from reviewing the concerns as a group (outlined below, identified shortly before Thursday session began). All parks were given the opportunity to express their concerns with the vital signs ranking process. Each parks comments are below. In summary, many similar concerns were identified by speakers such as:
Vital signs need further definition, refinement, explanations on how priorities are to be used, placed in a simpler format, and offer an option to take exception (?).
Time constraints didn’t allow involvement, assistance, and review from staff members, partners, outside experts, and I&M for sound decision making. Bryan Harry advised against dragging the process out too long given the national funding and priorities could change for worse.
Confusion over the purpose of the priorities, technical wording as well as the choices given, similar vital signs, and vital signs not pertaining to the park site. Clarification of criteria is needed, as well as concise guidance on what the priorities mean.
False weightedness of priorities based on cost-effectiveness, legal mandate, extent of resource, whether the resource is in or out-of-park-boundaries, overlapping vital signs, significance of vital signs.
Complexity of priorities process due in part to the enormous and overwhelming undertaking which precludes sharing with partners, staff, experts, community, etc.
Park Comments on Priorities
National Park of American Samoa
• Need parity between Marine and Terrestrial issues. Required gerrymandering to ensure top ranks were ½ marine and ½ terrestrial.
• Criteria forced unacceptable rankings. Some criteria more important or significant than others.
• Difficult to handle the overlap between vital signs. Essentially diluted the rankings across the overlap. Consider consolidating overlapping the vital signs.
• Cost effectiveness – too soon to consider? • Frequency of monitoring changes cost. • As written, maybe needs further definition/refinement.
Haleakala National Park
• Process overwhelming- so many vital signs and rank criteria complex. Too time consuming to involve many staff.
• Cost effectiveness elevated some ranks due to existing work, partners. • Purpose of Ranks unclear – confusion between selection and ranking.
Hawaii Volcanoes National Park
• Some limited resources difficult to rank – confusion over None verses N/A. • Too little time to consult with I & M and experts. Lead to counter-intuitive results. • Too much work to share with staff.

Appendix O: Part IV Vital Signs Workshops
110
• Criteria resulted in counterintuitive ranks. • Very complex ranking process • Scale of resource not taken into account in ranking criteria.
Puukohola Heiau National Historic Site
• Ranking criteria overwhelming; need to have others involved. • Vital signs technical wording not always clear; needed additional expertise. • Vital signs not pertaining to park added confusion. • Too tight a timeline. • Concerned about some highs and lows – not reflective of park concerns.
Kaloko Honokohau National Historical Park
• Scale of vital sign not well accounted for in rank criteria. • Good start, but decisions on selection will include park priorities, existing partnerships, etc. • Ranking as a team worked well. Helpful exercise for perspective on vital signs and
resources. • Legal mandate criteria skewed ranks toward marine resources. • Cost effectiveness was confusing for vital signs that ranked low on other criteria. • Clarification on confusing vital sign from the workshop process will lead to different
rankings.
War in the Pacific National Historical Park and American Memorial Park
• Cost effectiveness didn’t seem appropriate per earlier comments. • Legal mandate criteria skewed rankings for some – especially where resource was small scale
or non-resident. • Ranking vital signs complex, precluding sharing with partners or staff. • Therefore hindered process of info gathering where personal expertise was lacking. • Local park-level peer review would be very helpful. Time constraints didn’t allow.
USS Arizona Memorial
• “Very low, No opinion, and Not Applicable” were confusing. • Odd natural site – difficult to weigh criteria geared toward natural resources…however,
Bryan feels natural resource issues need emphasis.
Kalaupapa National Historical Park
• Consider ranking as beginning of selection process – good tool to start. • Too huge and digital to involve community. • Subject based approach – lacks site-based and between site analyses in vital signs formulation
and planning process. (within and across parks). • Too rushed for needed discussions.
Ala Kahakai National Historic Trail
• Very difficult to prioritize because different segments of trail have different issues. • Dependence on volunteers makes park wish to keep the rank process simple.
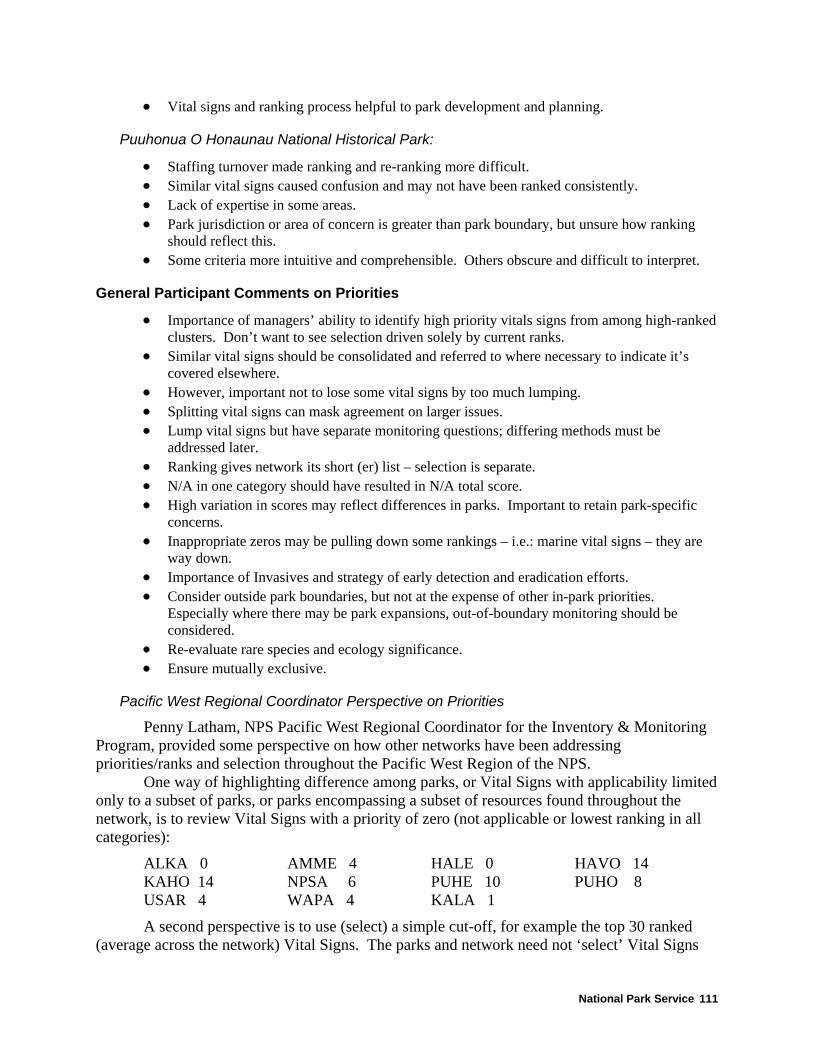
National Park Service 111
• Vital signs and ranking process helpful to park development and planning.
Puuhonua O Honaunau National Historical Park:
• Staffing turnover made ranking and re-ranking more difficult. • Similar vital signs caused confusion and may not have been ranked consistently. • Lack of expertise in some areas. • Park jurisdiction or area of concern is greater than park boundary, but unsure how ranking
should reflect this. • Some criteria more intuitive and comprehensible. Others obscure and difficult to interpret.
General Participant Comments on Priorities
• Importance of managers’ ability to identify high priority vitals signs from among high-ranked clusters. Don’t want to see selection driven solely by current ranks.
• Similar vital signs should be consolidated and referred to where necessary to indicate it’s covered elsewhere.
• However, important not to lose some vital signs by too much lumping. • Splitting vital signs can mask agreement on larger issues. • Lump vital signs but have separate monitoring questions; differing methods must be
addressed later. • Ranking gives network its short (er) list – selection is separate. • N/A in one category should have resulted in N/A total score. • High variation in scores may reflect differences in parks. Important to retain park-specific
concerns. • Inappropriate zeros may be pulling down some rankings – i.e.: marine vital signs – they are
way down. • Importance of Invasives and strategy of early detection and eradication efforts. • Consider outside park boundaries, but not at the expense of other in-park priorities.
Especially where there may be park expansions, out-of-boundary monitoring should be considered.
• Re-evaluate rare species and ecology significance. • Ensure mutually exclusive.
Pacific West Regional Coordinator Perspective on Priorities
Penny Latham, NPS Pacific West Regional Coordinator for the Inventory & Monitoring Program, provided some perspective on how other networks have been addressing priorities/ranks and selection throughout the Pacific West Region of the NPS.
One way of highlighting difference among parks, or Vital Signs with applicability limited only to a subset of parks, or parks encompassing a subset of resources found throughout the network, is to review Vital Signs with a priority of zero (not applicable or lowest ranking in all categories):
ALKA 0 AMME 4 HALE 0 HAVO 14 KAHO 14 NPSA 6 PUHE 10 PUHO 8 USAR 4 WAPA 4 KALA 1
A second perspective is to use (select) a simple cut-off, for example the top 30 ranked (average across the network) Vital Signs. The parks and network need not ‘select’ Vital Signs

Appendix O: Part IV Vital Signs Workshops
112
by 30 September 2004, but must develop a ‘short list’ by this date, that will be used in the Phase 3 portion of the program.
Summary:
• The quantity of zero rankings for a park reflect differences in resources • There also was differing approaches among the parks in use of zeros, N/A’s, and low ranks:
the network needs to provide clear instructions and consistent applications for prioritizing • Consider using a cutoff point, selecting the top portion of network ranked Vital Signs?
General Participant Comments on Selection
• I&M direction includes development of a short list – essentially based on rankings, but network has flexibility in selection strategy. (Akin to Fritz’s “should have” list).
• Category structure should facilitate insurance that broad and representative array of vital signs make the short list.
• But, Threatened and Endangered Species will drive the short list to certain extent. • Include other factors such as top park priorities when looking at short list, not just numeric
ranks for network. Let the Park managers override network ranks based on the importance of a natural resource in their park.
• Short list criteria could include terrestrial and marine to ensure both are represented. • Water Quality has more specific guidance for choosing vital signs. Suggests small groups
with relevant expertise to choose (?) or discuss selection. • Desired selection results are clouding the vital sign prioritization process. • Current “snapshot” may be lacking for identifying and selecting long-term vital signs for
monitoring. Need assessment of likelihood of future changes in mandates/funding sources, etc? (Superintendents?) Prepare for adaptive strategy.
• Have small group address selection (refine criteria) and then share more widely.
Due to the number of concerns with vital sign criteria and the selection process, a Selection Criteria Committee was formed. This committee will help articulate the desired selection process. Those who volunteered for this committee are:
Bryan Harry Tim Tunison Patty Welton Fern Duvall Chuck Sayon Roy Irwin Daniel Kawaiaea Ben Saluda Peter Craig Steven J. Anderson Doug Neighbor
Overall ‘Outside’ Participant Perspectives
The workshop participants, who were invited for their expertise in their field, and attended Thursdays session, are listed below.
Bill Steiner – USGS-PIERC: Partner–recent emphasis on watersheds. Potential to seek National Initiative funds.
Dan Polhemus – Smithsonian: Emphasis on invertebrates. Caroline Rogers – USGS – Virgin Islands: Share park resource information to identify
commonalities. Bruce Richmond – USGS – California: Coastal hazard maps, potential for partnerships. Karen Poiani – The Nature Conservancy: Potential for site-by-site partnering.

National Park Service 113
Fern Duvall – DOFAW: Increasing interest in landscape perspective; increasing potential for partnerships. Encourage further contacts between DOFAW and I&M on each island.
Frank Trusdell – USGS – HVO: geologic considerations are the ‘bedrock’ of a monitoring program, a variety of geologic monitoring is already ongoing throughout the network.
Roy Irwin – NPS – WRD: NPS-WRD has provided guidance on monitoring Vital Signs and welcomes the opportunity participate
Josh Seamon – DMWR, American Samoa: DMWR has several long standing monitoring programs; potential for partnership.
Lynn Raulerson – University of Guam: enjoyed participation in effort. Anne Brasher – USGS – WRD: Hydrologic and biologic issues.
Overall Park Participant Perspectives
The remainder of Thursday’s session allowed each park representative to share their parks natural resource issues, concerns, and needs.
Kaloko Honokohau National Historical Park
• Assistance: current water quality and hydrologic issues. • Expand UH-Hilo role – Division of Aquatic Resources. • Developer’s data: Issue of water quality standards on coral reef data. • Issue: incorporating significance of marine resources in vital signs/priorities despite lack of
legal mandate. • Issue: need help with water bird monitoring.
Ala Kahakai National Historic Trail
• Community involvement in monitoring and development. • Interest: build/expand community partnerships to manage the trail. • Question: width of corridor? No defined distance. Current and potential offers for land
donations. No legislative authority; dependent on private property volunteerism. • Question: management of cave resources? Need for planning.
American Memorial Park
• Surrounding urbanization major issue. • Natural perturbations exacerbate anthropogenic impacts. • Wetland: major natural resource includes 2 threatened and endangered birds; represents
remnant coastal habitat now virtually lost elsewhere on island. • Brown Tree Snake – major threat. Want baseline in case of introduction. • Coccinea – newly introduced invasive plant. • Hydrology – need information; also plans to alter this (Army Corps). • Beach loss and gain needs monitoring. And maybe further info on causes.? • Adjacent coastal area: possible partnership in need of development to manage this area.

Appendix O: Part IV Vital Signs Workshops
114
Puukohola National Historic Site
• Erosion is a major concern especially around the heaiu. • Marine and water quality issues in areas outside authorized managing zone(s). • Loss of algae species and mollusk species. • Dewatering of bay. • Issues regarding underwater temple and sharks. • Alien terrestrial species issues and scarcity of traditional use species. • Harbor and other-use expansion issues. • Surrounding development pressures.
Needs Assistance with: • Prioritization of issues for managing treatments. • Mauna Kea Soil Conservation District – seed dispersal. • More baseline info: turtles, etc. • Issue of pond-ocean connectivity (natural resource and health, safety)
Puuhonua O Honaunau National Historical Park
• Fish pond conservation and analysis, soil core and pollen analysis. • Shorebird inventory • Invasive plant species; cultural landscape • Cultural resources – coastal erosion issues.
Needs Assistance with: • Plant restoration/plantings. Permit issues, long term planning. • Pristine coral resources, marine resources, jurisdiction expansion, partnerships (DAR).
Kalaupapa National Historical Park
• Additional Resources: intact riparian areas, one is within potential expansion. And a small section of coral reef.
• Issues: Fisheries management, managing zones, visitor use patterns, south-shore coral reef studies, data off-shore islets – biodiversity.
• Current projects: Vegetation mapping and invasives disturbance. Upland land and hydrology assessments.
War in the Pacific National Historical Park
• Coral issues well covered. • Terrestrial issues, Fresh water issues, and Marine Toxicants all need assistance. • Issues: Erosion, especially post fire. And mass wasting/geology.
National Park of American Samoa Issues:
• Coral bleaching; sedimentation; disease and pathogens. • Fish harvest levels; fish population growth • Marine water quality • Forest monitoring plots • Limiting subsistence farming land extent

National Park Service 115
• Park expansion and inventory needs. Current partnerships: EPA on water quality and DMWR on forest bird monitoring. Needed Assistance with:
• Land snails • Coconut crabs • Tahiti petrels • Stream resources and issues – these have a tendency to fall through the cracks.
Haleakala National Park
• Partners: The Nature Conservancy, State and National Forest Reserves, private ranches. • Good Baseline info • Recent focus on active managing. Now transitioning to restoration. • Little monitoring programs and data. • Assistance needed: endemic invertebrates and aquatic resources.
Hawaii Volcanoes National Park
• Intensively managed landscape • Upcoming inventories – partnering with USGS • Long-running volcano monitoring. • Keep focus on monitoring of treatment effectiveness: Need permanent plots. • Aquatic and Marine resources: need baseline and Assistance Partnerships. • Visitor use and development: soundscape and nightsky.
Final Revised Vital Signs, Planned Prioritization and Selection
The remainder of this document is essentially a draft of the Pacific Island Network monitoring plan, pertaining to the process of Vital Sign prioritization and selection. A final (actual) version of the process used as well as the actual priorities and selected Vital Signs will appear in the next version of the network monitoring plan (http://www1.nature.nps.gov/im/units/pacn/monitoring/).
Vital Sign Prioritization Process
Vital Signs are a subset of physical, chemical, and biological elements and processes of park ecosystems that are selected to represent the overall health or condition of park resources, known or hypothesized effects of stressors, or elements that have important human values. The elements and processes that are monitored are a subset of the total suite of natural resources that park managers are directed to preserve "unimpaired for future generations," including water, air, geological resources, plants and animals, and the various ecological, biological, and physical processes that act on those resources. Vital signs may occur at any level of organization including landscape, community, population, or genetic level, and may be compositional (referring to the variety of elements in the system), structural (referring to the organization or pattern of the system), or functional (referring to ecological processes). Because of the need to maximize the use and relevance of monitoring results for making management decisions, vital signs selected by parks may include elements that were selected because they have important human values (e.g., harvested or charismatic species) or because of some known or hypothesized threat or stressor/response relationship with a particular park resource.
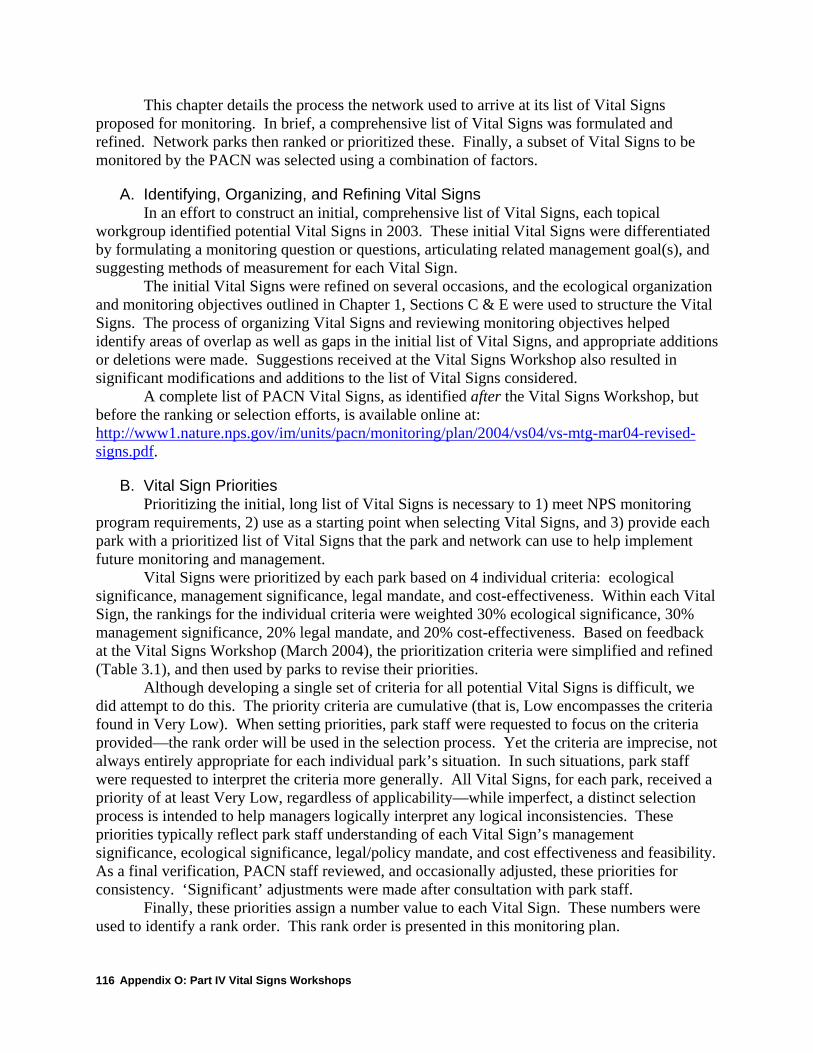
Appendix O: Part IV Vital Signs Workshops
116
This chapter details the process the network used to arrive at its list of Vital Signs proposed for monitoring. In brief, a comprehensive list of Vital Signs was formulated and refined. Network parks then ranked or prioritized these. Finally, a subset of Vital Signs to be monitored by the PACN was selected using a combination of factors.
A. Identifying, Organizing, and Refining Vital Signs In an effort to construct an initial, comprehensive list of Vital Signs, each topical
workgroup identified potential Vital Signs in 2003. These initial Vital Signs were differentiated by formulating a monitoring question or questions, articulating related management goal(s), and suggesting methods of measurement for each Vital Sign.
The initial Vital Signs were refined on several occasions, and the ecological organization and monitoring objectives outlined in Chapter 1, Sections C & E were used to structure the Vital Signs. The process of organizing Vital Signs and reviewing monitoring objectives helped identify areas of overlap as well as gaps in the initial list of Vital Signs, and appropriate additions or deletions were made. Suggestions received at the Vital Signs Workshop also resulted in significant modifications and additions to the list of Vital Signs considered.
A complete list of PACN Vital Signs, as identified after the Vital Signs Workshop, but before the ranking or selection efforts, is available online at: http://www1.nature.nps.gov/im/units/pacn/monitoring/plan/2004/vs04/vs-mtg-mar04-revised-signs.pdf.
B. Vital Sign Priorities Prioritizing the initial, long list of Vital Signs is necessary to 1) meet NPS monitoring
program requirements, 2) use as a starting point when selecting Vital Signs, and 3) provide each park with a prioritized list of Vital Signs that the park and network can use to help implement future monitoring and management.
Vital Signs were prioritized by each park based on 4 individual criteria: ecological significance, management significance, legal mandate, and cost-effectiveness. Within each Vital Sign, the rankings for the individual criteria were weighted 30% ecological significance, 30% management significance, 20% legal mandate, and 20% cost-effectiveness. Based on feedback at the Vital Signs Workshop (March 2004), the prioritization criteria were simplified and refined (Table 3.1), and then used by parks to revise their priorities.
Although developing a single set of criteria for all potential Vital Signs is difficult, we did attempt to do this. The priority criteria are cumulative (that is, Low encompasses the criteria found in Very Low). When setting priorities, park staff were requested to focus on the criteria provided—the rank order will be used in the selection process. Yet the criteria are imprecise, not always entirely appropriate for each individual park’s situation. In such situations, park staff were requested to interpret the criteria more generally. All Vital Signs, for each park, received a priority of at least Very Low, regardless of applicability—while imperfect, a distinct selection process is intended to help managers logically interpret any logical inconsistencies. These priorities typically reflect park staff understanding of each Vital Sign’s management significance, ecological significance, legal/policy mandate, and cost effectiveness and feasibility. As a final verification, PACN staff reviewed, and occasionally adjusted, these priorities for consistency. ‘Significant’ adjustments were made after consultation with park staff.
Finally, these priorities assign a number value to each Vital Sign. These numbers were used to identify a rank order. This rank order is presented in this monitoring plan.

National Park Service 117
Table 3.1. Vital Sign prioritization criteria. CRITERIA (Weight) SUB-CRITERIA
Man
agem
ent
Sign
ifica
nce
(30%
)
High: There is an obvious, direct application of the data to a key management decision, or for evaluating the effectiveness of past management decisions. Monitoring results are likely to provide early warning of resource impairment, and will save park resources and money if a problem is discovered early.
Medium: The Vital Sign will produce results that are clearly understood and accepted by park managers, other policy makers, research scientists, and the general public, all of whom should be able to recognize the implications of the Vital Sign’s results for protecting and managing the park’s natural resources. Data will permit managers to make informed decisions.
Low: In addition to addressing a management decision, data provide information that support other management decisions. The Vital Sign addresses a wide-spread (pervasive) resource or issue.
Very Low: Data are of interest to the public, there is an application of the data to performance (GPRA) goals.
Ecol
ogic
al S
igni
fican
ce
(30%
)
High: There is a strong, defensible linkage between the Vital Sign and the ecological function or critical resource it is intended to represent. The Vital Sign provides early warning of undesirable changes to important resources and can signify an impending change in the ecological system.
Medium: The Vital Sign represents a resource or function of moderate ecological importance based on the conceptual model of the system and the supporting ecological literature.
Low: The Vital Sign is sufficiently sensitive; small changes in the Vital Sign can be used to detect a significant change in the target resource or function. Reference conditions exist within the region, and/or threshold values are specified in the available literature that can be used to measure deviance from a desired condition.
Very Low: Data from the Vital Sign are needed by the parks to fill gaps in current ecological knowledge. The Vital Sign complements Vital Signs at other scales and levels of biological organization.
Lega
l/Pol
icy
Man
date
(20%
)
This criterion is part of ‘Management Significance’ but is purposely separated here to emphasize those Vital Signs and resources that are required to be monitored by some legal or policy mandate. The intent is to give additional priority to a Vital Sign if a park is directed to monitor specific resources because of some binding legal or Congressional mandate, such as specific legislation and executive orders, or park enabling legislation. The binding document may be with parties at the local, state, regional, or federal level.
High: The park is required to monitor this specific resource/Vital Sign by some specific, binding, legal mandate (e.g., Endangered Species Act for an endangered species, Clean Air Act for Class 1 airsheds), or park enabling legislation.
Medium: The resource/Vital Sign is specifically covered by an Executive Order (e.g., invasive plants, wetlands), a specific ‘Memorandum of Understanding’ signed by the NPS (e.g., bird monitoring), or specific Congressional mandates. The need to monitor the resource is generally indicated by some type of federal or state law or other general legislative mandates.
Low: The resource/Vital Sign is listed as a sensitive resource or resource of concern by credible state, regional, or local conservation agencies or organizations, but it is not specifically identified in any federal or state legislation. The resource/Vital Sign is also covered by the Organic Act and other general legislative or Congressional mandates such as the Omnibus Park Management Act and GPRA.
Very Low: There is no legal mandate for this particular resource/Vital Sign.
Cos
t Effe
ctiv
enes
s an
d Fe
asib
ility
(2
0%)
High: The Vital Sign has measurable results that are repeatable with different, qualified personnel. Actual monitoring (sampling & analysis) would be economically viable and efficient at an appropriate frequency and intensity.
Medium: Protocol development and monitoring (sampling & analysis) is believed to be economically viable (or suitable protocols already exist).
Low: While partners may exist for protocol development, data collection, or analysis, economic costs are uncertain or believed to be high.
Very Low: While management uses for data may exist if data were available, economic costs (fiscal, time, or other resources) are prohibitive to implementing monitoring.
Vital Sign Selection Process
Selection of Vital Signs for funding and future program emphasis was distinct from the prioritization process; to allow the network to incorporate all of the information and ideas available, and then produce judgments, manage conflict, and promote consensus. This selection

Appendix O: Part IV Vital Signs Workshops
118
process used the park-generated priorities discussed above as a starting point. Selection also employed the ecological organization (Chapter 1) to ensure an adequate distribution (or at least consideration) across the range of potential Vital Signs within each park. The first attempt at selecting Vital Signs (in Fiscal Year 2004), was a draft, and revised in subsequent years as the monitoring plan was completed and monitoring implemented.
Step 1: In order to quickly initiate the selection process, the final Vital Sign prioritization effort also included the opportunity for each park (whomever was responsible for prioritization at each park), to propose initial selected Vital Signs. This included fields that specified, for each Vital Sign, 1) a designation of ‘year 1’, ‘year 2’, ‘opportunistic’, ‘not appropriate at this time’ and 2) a designation of intensity and frequency of ‘high’, ‘medium’, or ‘low’. PACN staff assisted each park with this prioritization and selection through conference calls when parks initiated this process.
Step 2: PACN staff compiled the draft suggestions from each park and compiled them for the network (parks applicable, intensity and frequency, and designation of ‘year 1’, …). At this stage, the Vital Signs were reviewed and selections revised for adequate representation of explicitly identified selection criteria (priority and ecological organization), synergy among similar and dissimilar Vital Signs, and network resources available.
Step 3: This draft of selected Vital Signs was emailed to all parks, and several conference calls among PACN and park staff were held to discuss similarities and differences, identify additional criteria to use when selecting, and revise selections. These discussion focused on differences in the explicitly identified selection criteria (priority and ecological organization), and a variety of criteria not explicitly identified (adapted from the annual Servicewide Comprehensive Call for Natural Resource Project criteria).
• Vital Sign Appropriateness: Is this a representative element of the overall health or condition of park resources, known or hypothesized effects of stressors, or elements that have important human values?
• Significance of the Resource or Issue to the Parks: Is this an important resource or issue to the parks involved?
• Relative Significance of the Park Proportion of the Resource or Issue: Is the resource or issue addressed by the Vital Sign regionally significant in proportion to the park’s role in it preservation or conservation?
• Severity of the Threat, Problem, or Need(s): How pervasive and severe is the need or threat? (The current or imminence of need(s) is intentionally not mentioned, as we hope to implement a monitoring program that includes a mix of immediate, tactical monitoring as well as long-term monitoring.)
• Problem Resolution: Will this monitoring contribute directly to management decisions or actions?
• Project Support: Are the parks, region, or other partners willing to commit to this monitoring?
Step 4: The final selection step involved a group decision among parks and individuals. We asked each park to revise the initial draft selection in a meeting with a representative from each park, plus the PACN science advisor and a USGS (or other potential monitoring partner) representative. This essentially consisted of consecutive round-robins of input and discussion to refine the draft. Criteria for selection included explicitly identified (priority and ecological organization), not explicitly identified (see above), and the parks applicable, intensity and frequency, and designation of ‘year 1’, ‘year 2’, ‘opportunistic’, and ‘not appropriate at this time’. Group discussion focused on adjusting the initial, draft selections based on anticipated
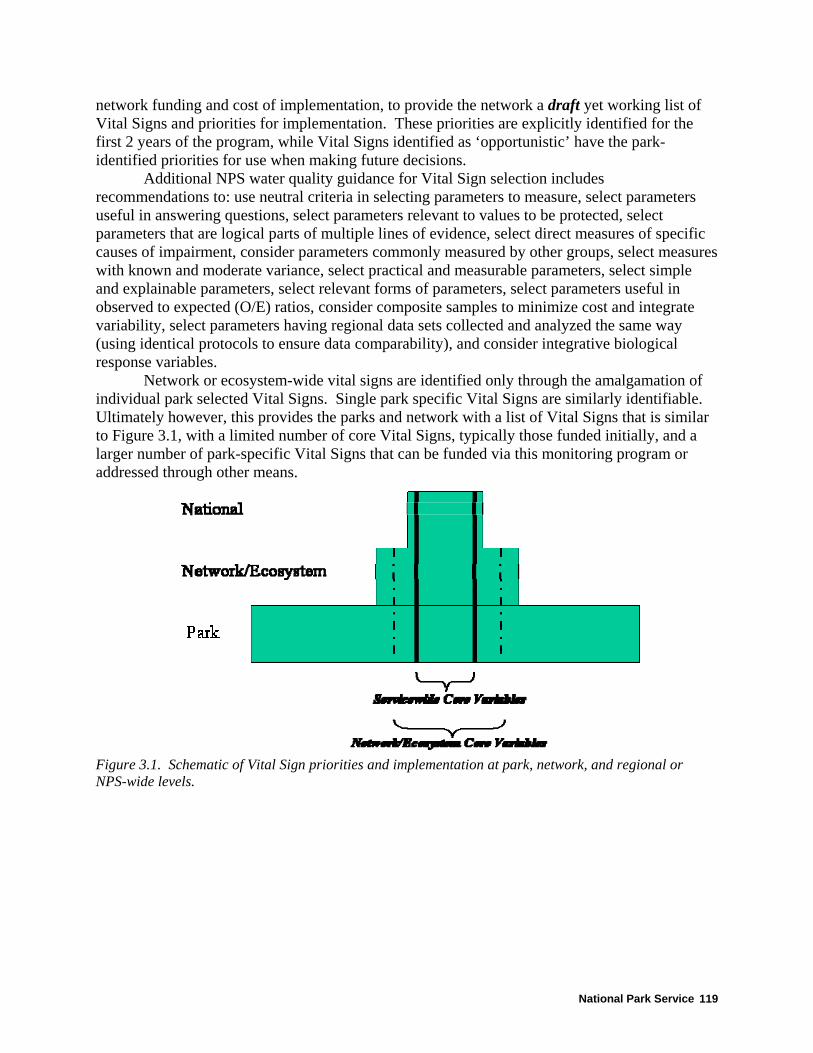
National Park Service 119
network funding and cost of implementation, to provide the network a draft yet working list of Vital Signs and priorities for implementation. These priorities are explicitly identified for the first 2 years of the program, while Vital Signs identified as ‘opportunistic’ have the park-identified priorities for use when making future decisions.
Additional NPS water quality guidance for Vital Sign selection includes recommendations to: use neutral criteria in selecting parameters to measure, select parameters useful in answering questions, select parameters relevant to values to be protected, select parameters that are logical parts of multiple lines of evidence, select direct measures of specific causes of impairment, consider parameters commonly measured by other groups, select measures with known and moderate variance, select practical and measurable parameters, select simple and explainable parameters, select relevant forms of parameters, select parameters useful in observed to expected (O/E) ratios, consider composite samples to minimize cost and integrate variability, select parameters having regional data sets collected and analyzed the same way (using identical protocols to ensure data comparability), and consider integrative biological response variables.
Network or ecosystem-wide vital signs are identified only through the amalgamation of individual park selected Vital Signs. Single park specific Vital Signs are similarly identifiable. Ultimately however, this provides the parks and network with a list of Vital Signs that is similar to Figure 3.1, with a limited number of core Vital Signs, typically those funded initially, and a larger number of park-specific Vital Signs that can be funded via this monitoring program or addressed through other means.
Figure 3.1. Schematic of Vital Sign priorities and implementation at park, network, and regional or NPS-wide levels.
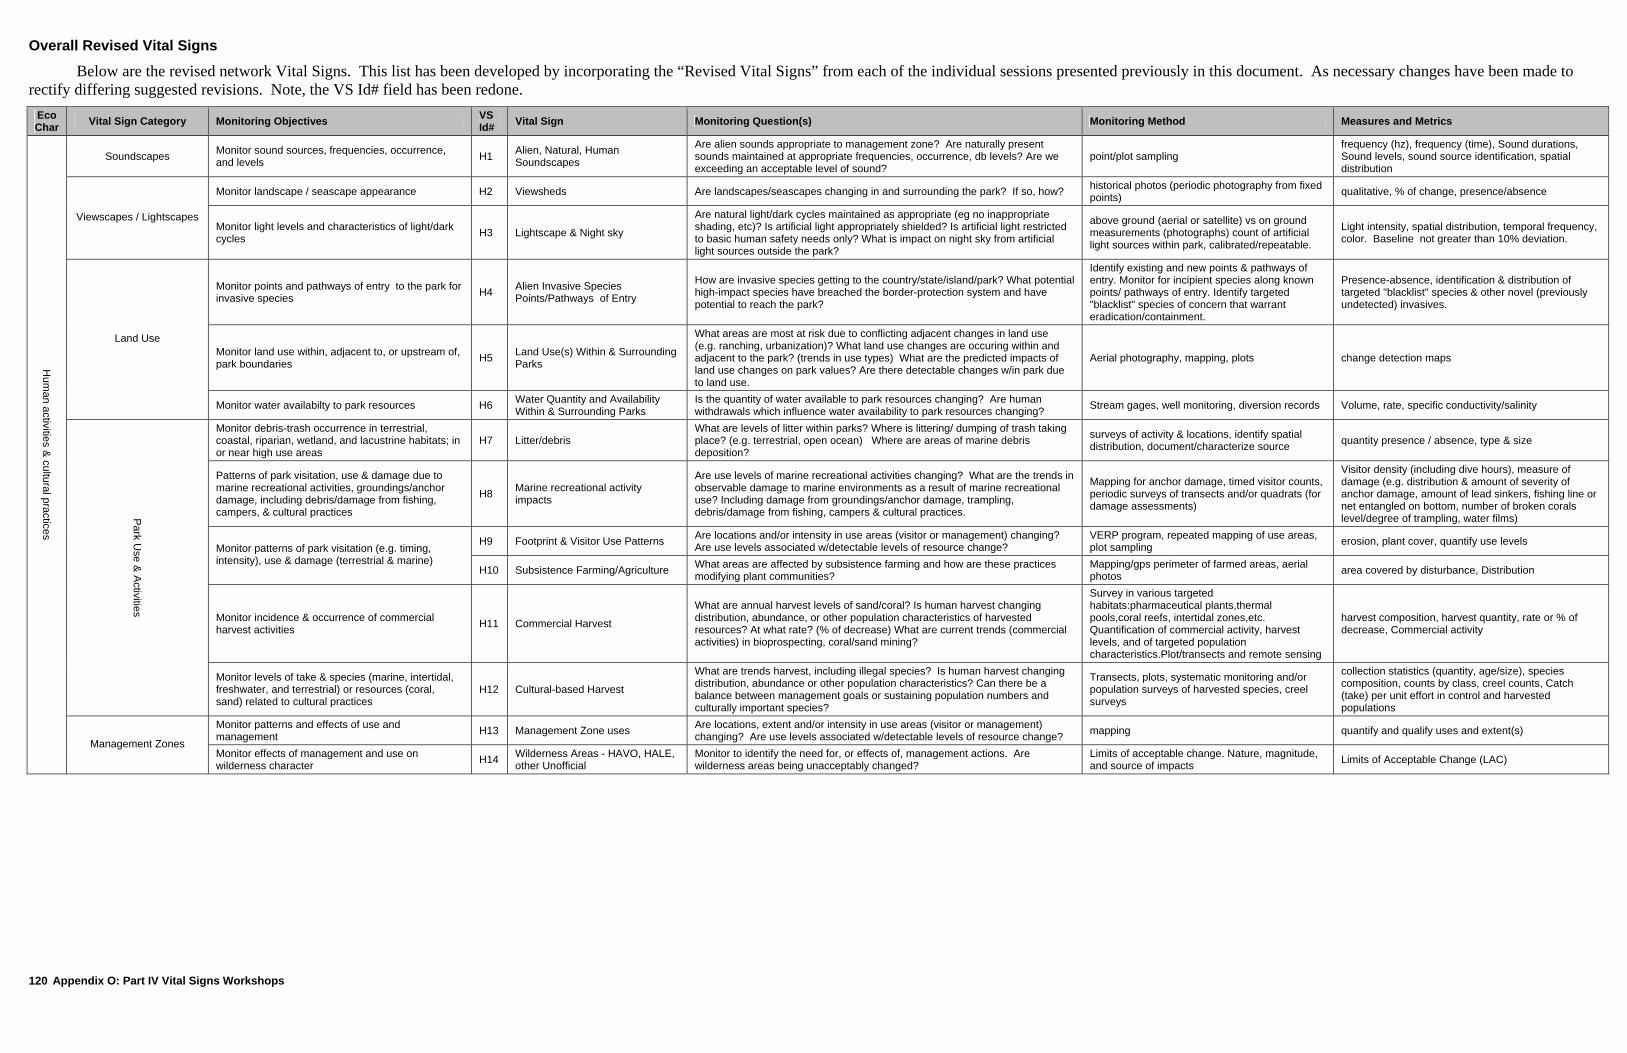
Appendix O: Part IV Vital Signs Workshops
120
Overall Revised Vital Signs
Below are the revised network Vital Signs. This list has been developed by incorporating the “Revised Vital Signs” from each of the individual sessions presented previously in this document. As necessary changes have been made to rectify differing suggested revisions. Note, the VS Id# field has been redone.
Eco Char Vital Sign Category Monitoring Objectives VS
Id# Vital Sign Monitoring Question(s) Monitoring Method Measures and Metrics
Soundscapes Monitor sound sources, frequencies, occurrence, and levels H1 Alien, Natural, Human
Soundscapes
Are alien sounds appropriate to management zone? Are naturally present sounds maintained at appropriate frequencies, occurrence, db levels? Are we exceeding an acceptable level of sound?
point/plot sampling frequency (hz), frequency (time), Sound durations, Sound levels, sound source identification, spatial distribution
Monitor landscape / seascape appearance H2 Viewsheds Are landscapes/seascapes changing in and surrounding the park? If so, how? historical photos (periodic photography from fixed points) qualitative, % of change, presence/absence
Viewscapes / Lightscapes Monitor light levels and characteristics of light/dark cycles H3 Lightscape & Night sky
Are natural light/dark cycles maintained as appropriate (eg no inappropriate shading, etc)? Is artificial light appropriately shielded? Is artificial light restricted to basic human safety needs only? What is impact on night sky from artificial light sources outside the park?
above ground (aerial or satellite) vs on ground measurements (photographs) count of artificial light sources within park, calibrated/repeatable.
Light intensity, spatial distribution, temporal frequency, color. Baseline not greater than 10% deviation.
Monitor points and pathways of entry to the park for invasive species H4 Alien Invasive Species
Points/Pathways of Entry
How are invasive species getting to the country/state/island/park? What potential high-impact species have breached the border-protection system and have potential to reach the park?
Identify existing and new points & pathways of entry. Monitor for incipient species along known points/ pathways of entry. Identify targeted "blacklist" species of concern that warrant eradication/containment.
Presence-absence, identification & distribution of targeted "blacklist" species & other novel (previously undetected) invasives.
Monitor land use within, adjacent to, or upstream of, park boundaries H5 Land Use(s) Within & Surrounding
Parks
What areas are most at risk due to conflicting adjacent changes in land use (e.g. ranching, urbanization)? What land use changes are occuring within and adjacent to the park? (trends in use types) What are the predicted impacts of land use changes on park values? Are there detectable changes w/in park due to land use.
Aerial photography, mapping, plots change detection maps
Land Use
Monitor water availabilty to park resources H6 Water Quantity and Availability Within & Surrounding Parks
Is the quantity of water available to park resources changing? Are human withdrawals which influence water availability to park resources changing? Stream gages, well monitoring, diversion records Volume, rate, specific conductivity/salinity
Monitor debris-trash occurrence in terrestrial, coastal, riparian, wetland, and lacustrine habitats; in or near high use areas
H7 Litter/debris What are levels of litter within parks? Where is littering/ dumping of trash taking place? (e.g. terrestrial, open ocean) Where are areas of marine debris deposition?
surveys of activity & locations, identify spatial distribution, document/characterize source quantity presence / absence, type & size
Patterns of park visitation, use & damage due to marine recreational activities, groundings/anchor damage, including debris/damage from fishing, campers, & cultural practices
H8 Marine recreational activity impacts
Are use levels of marine recreational activities changing? What are the trends in observable damage to marine environments as a result of marine recreational use? Including damage from groundings/anchor damage, trampling, debris/damage from fishing, campers & cultural practices.
Mapping for anchor damage, timed visitor counts, periodic surveys of transects and/or quadrats (for damage assessments)
Visitor density (including dive hours), measure of damage (e.g. distribution & amount of severity of anchor damage, amount of lead sinkers, fishing line or net entangled on bottom, number of broken corals level/degree of trampling, water films)
H9 Footprint & Visitor Use Patterns Are locations and/or intensity in use areas (visitor or management) changing? Are use levels associated w/detectable levels of resource change?
VERP program, repeated mapping of use areas, plot sampling erosion, plant cover, quantify use levels
Monitor patterns of park visitation (e.g. timing, intensity), use & damage (terrestrial & marine)
H10 Subsistence Farming/Agriculture What areas are affected by subsistence farming and how are these practices modifying plant communities?
Mapping/gps perimeter of farmed areas, aerial photos area covered by disturbance, Distribution
Monitor incidence & occurrence of commercial harvest activities H11 Commercial Harvest
What are annual harvest levels of sand/coral? Is human harvest changing distribution, abundance, or other population characteristics of harvested resources? At what rate? (% of decrease) What are current trends (commercial activities) in bioprospecting, coral/sand mining?
Survey in various targeted habitats:pharmaceutical plants,thermal pools,coral reefs, intertidal zones,etc. Quantification of commercial activity, harvest levels, and of targeted population characteristics.Plot/transects and remote sensing
harvest composition, harvest quantity, rate or % of decrease, Commercial activity
Park U
se & A
ctivities
Monitor levels of take & species (marine, intertidal, freshwater, and terrestrial) or resources (coral, sand) related to cultural practices
H12 Cultural-based Harvest
What are trends harvest, including illegal species? Is human harvest changing distribution, abundance or other population characteristics? Can there be a balance between management goals or sustaining population numbers and culturally important species?
Transects, plots, systematic monitoring and/or population surveys of harvested species, creel surveys
collection statistics (quantity, age/size), species composition, counts by class, creel counts, Catch (take) per unit effort in control and harvested populations
Monitor patterns and effects of use and management H13 Management Zone uses Are locations, extent and/or intensity in use areas (visitor or management)
changing? Are use levels associated w/detectable levels of resource change? mapping quantify and qualify uses and extent(s)
Hum
an activities & cultural practices
Management Zones Monitor effects of management and use on wilderness character H14 Wilderness Areas - HAVO, HALE,
other Unofficial Monitor to identify the need for, or effects of, management actions. Are wilderness areas being unacceptably changed?
Limits of acceptable change. Nature, magnitude, and source of impacts Limits of Acceptable Change (LAC)

National Park Service 121
Eco Char Vital Sign Category Monitoring Objectives VS
Id# Vital Sign Monitoring Question(s) Monitoring Method Measures and Metrics
Monitor visibility P1 Visibility Is sight distance, light extinction, and quality reduced? Aerosol filters, cameras, nephelometer sight distance (extinction coefficient), particulate concentration, turbidity
P2 Wet deposition What are the concentrations of important nutrients and toxins? How much is deposited? How much do anthropogenic vs. volcanic vs. other natural sources contribute?
Precipitation samples precipitation chemistry, concentrations/deposition estimates of major nutrients, toxins and trace species
P3 Fog (Cloud water) deposition What are the concentrations of important nutrients and toxins? How much is deposited? How much do anthropogenic vs. volcanic vs. other natural sources contribute?
fog water samples fog chemistry, concentrations/deposition estimates of major nutrients, toxins and trace species
P4 Atmospheric Gases: Climate Change Indicators, Human Pollutants, natural - volcanic
How are atmospheric gas concentrations changing? How does volcanic activity influence air quality? How do anthropogenic pollutants influence air quality? What is the influence on the biogeochemical cycle (how much is deposited)?
filters, real time analyzers, continuous or periodic monitoring depending on species information desired
concentrations of air toxics, CO2, O3 and other GHGs, trace species, deposition estimates
Track atmospheric concentrations of particulates and gases, emphasizing those with known human health or environmental impacts, determine deposition loads/influence on biogeochemical cycling
P5
Atmospheric Particulates: climate change indicators, Human pollutants, natural - volcanic & marine
How are atmospheric particulate species and concentrations changing? How much is deposited? How much do anthropogenic vs. volcanic vs. other natural sources contribute? What is the influence on the biogeochemical cycle?
filters, real time analyzers, continuous or periodic monitoring depending on species information desired
dust, particle size analyses: pm10, pm 2.5, species, concentration of various species (including trace species), deposition estimates
P6 Solar radiation How are solar radiation inputs, UV-B, photosynthetically active radiation (PAR), or other wavelengths, fluxes changing?
pyranometers, (PAR sensors, UVB radiometers, etc.), satellite data
upwelling & downwelling, direct & diffused; PAR, UVA, UVB
Monitor core weather/climate conditions within each park (on each island), provide baseline data for ecological research, fire danger forecasting, visitor information regarding weather related health and safety risks
P7 Weather & Climate What are current conditions? What are ranges of climate parameters within each park? Are they changing?
weather stations (RAWS, COOP, NPS-ARD), fog monitors, fuel sticks, soil moisture/temp sensors, wetness sensors, satellite data, lidar data
wind, temperature, precipitation, relative humidity, fog immersion time, fuel moist/temp, soil moisture/temp, wetness,
Document frequency, intensity and spatial extent of long term climate patterns and extreme events P8 Extreme events, long-term
patterns (weather & ocean) How frequently do extreme events occur, and at what intensity? What are temporal trends? What is the spatial extent?
data from weather stations and wave/swell monitoring in parks, in addition to data mining, sources: NOAA, USGS, NWS
hurricanes/typhoons, storm waves, high water mark, ENSO, PDO, droughts, floods
Clim
ate & A
ir Quality
Identify spatial and temporal patterns of climate. Provide baseline data to help evaluate how stability and variability in climate affect natural populations, processes, and large scale ecological drivers.
P9 Climate Representations - 2- & 3- dimensional
How do weather/climate parameters change over varying ranges in space and time? modeling or mapping trade-wind inversion, wind, temperature, precipitation,
cloud patterns, radiation budgets
Monitor physical ocean dynamics - relative sea level, tides and swells P10 Ocean physical dynamics:
relative sea level, tides, swells What is the natural variability? What are temporal trends? tide gauge, ADCP, GIS, buoy data, satellite data maximum signal wave height, relative sea level, tide fluctuations
Monitor cycles of nutrients and elements within soils and water--including carbonate (oceanic), nitrogen, and phosphorous
P11 Biogeochemical Cycles - Nutrient Cycling How are processes changing over time (source, directions, levels of flow)? monitoring plots
Aquatic senescence, Coral growth-CaCO3 deposition, Forest productivity (litter rain, incremental growth), Key constituents (N, K, CaCO3)
Monitor soil erosion P12 Soil Erosion What are causes and locations of soil erosion, what are rates of change, what is land use and human impact?
erosion pins deployed together and integrated over watershed, sediment collectors, mapping, sediment fingerprinting
Areal distribution of rate of soil loss (mapping), transport out of watershed
P13 Soil Quality - Biological What are soil communities, and are they changing? Soil sampling and analysis bacteria, fungal/microrhizzal, worms/nematodes/arthropods, bulk density
P14 Soil Quality- Chemical Are soil buffering and filtering qualities changing? Soil sampling and analysis appropriate WQ measures, cations, pH, soil composition, Total Nitrogen & Total Carbon
Monitor soil quality trends (physical, toxics/contaminants, other biologic and nutrients)
P15 Soil Quality- Physical Are physical soil properties changing? Soil sampling and analysis DOC, grain size, moisture content, parent material, percent organic matter, permeability, POC
Monitor condition and extent of soil crusts P16 Soil Crust Change (Arid-Semiarid habitats)
Where are soil crusts broken, what are pressures/impacts on soil crusts, and how are they distributed in space and time?
soil and geologic mapping, remote sensing, periodic change analysis
distribution of soil crusts, pH, rainfall, substrate composition, volcanic aerosol composition, wind spd/dir
P17 Flowing surface water hydrology
What are usual rates & range of flow? What is timing & magnitude of floods or droughts? Is erosion occurring, or are flow channels changing? What is the spatial distributionof the flow in question? What is the flow regimen, and what are the geomorphic conditions? What are base flow volume and seasonal trends? What are frequency and magnitude of floods or extremely low-flow events?
gauges, sampling at permanent sites, flow regionalization
discharge / recharge, diversion patterns, flood timing / magnitude, withdrawal & consumption rates, stream cross-section, stream discharge, stream gradient, rainfall, stream discharge over space/time
P18 Stream channel habitat dynamics Is erosion occurring? Are flow channels changing? Are substrate types changing? mapping of streambed topology & substrate bank depth, sinuosity, stream cross-section, stream
gradient, substrate size
Monitor trends in surface water hydrology and flow regimes
P19 Water diversion levels What proportion of water is being made unavailable for aquatic biota and designated uses? gages, wells, sampling at permanent sites relative quantity of water being diverted, seasonal, spatial
& temporal diversion patterns Monitor wetland (incl. anchialine ponds) water flow exchange dynamics, size, and distribution, measure movement of water between streams and groundwater. Includes wetlands, lakes, ponds (fresh & anchialine), springs and seeps.
P20 Wetland hydrology
What are freshwater/saltwater recharge rates? What is habitat extent and distribution? What are temporal trends in recharge rates and habitat extent? What are groundwater levels, residence times, infiltration, permeability, and evaporation in wetlands? What is the relationship between groundwater and wetlands in anchialine pools?
measure salinity, residence time, mapping, samples from wells
flood timing/magnitude, flow, parent material/geomorphology, plant cover/ species present, pool size, depth & salinity, rainfall, sediment loads, pH, tidal fluctuation, stream cross-section, stream discharge, stream gradient, bank erosion, sedimentation patterns
Physical / C
hemical C
onditions
Soil, W
ater, & N
utrient Dynam
ics
Monitor ground water flow rates and direction of movement (recharge) P21 Groundwater dynamics What are rates of subsurface flow? What is level of freshwater/saltwater mixing?
What are flow patterns? well, seep, & spring discharge measurements discharge/recharge, injections (sewage), permeability, tide fluctuations, withdrawal & consumption rates, salinity, seepage

Appendix O: Part IV Vital Signs Workshops
122
Eco Char
Vital Sign Category Monitoring Objectives VS
Id# Vital Sign Monitoring Question(s) Monitoring Method Measures and Metrics
P22 Ground Water Quality Network Core parameters
What are the range and variance of the network core water quality parameters? What are the temporal and spatial trends?
water sampling from dedicated monitoring wells in addition to supply wells
temperature, pH, salinity (sp. cond.), dissolved oxygen, total nitrogen, total phosphorous, depth
P23 Marine Water Quality Network Core parameters
What are the range and variance of the network core water quality parameters? What are the temporal and spatial trends?
in-situ measurements and collection of samples at established sites including controls
temperature, pH, salinity (sp. cond.), dissolved oxygen, PAR, total nitrogen, total phosphorous, chlorophyll a, depth
Monitor water quality network core parameters
P24 Surface Water Quality Network Core parameters
What are the range and variance of the network core water quality parameters? What are the temporal and spatial trends?
in-situ measurements and collection of samples at established sites including controls
temperature, pH, salinity (sp. cond.), dissolved oxygen, PAR, total nitrogen, total phosphorous, chlorophyll a, depth
P25 Ground Water Quality Supplemental parameters
What are the range and variance of the supplemental water quality parameters? What are the temporal and spatial trends?
water sampling from dedicated monitoring wells in addition to supply wells
inorganic nutrients (NO2/NO3, PO4, NH4, SiO4), alkalinity, anions, cations, redox, total organic carbon, suspended sediments.
P26 Marine Water Quality Supplemental parameters
What are the range and variance of the supplemental water quality parameters? What are the temporal and spatial trends?
in-situ measurements and collection of samples at established sites including controls
inorganic nutrients (NO2/NO3, PO4, NH4), suspended sediments/turbidity/secchi disk, alkalinity, anions, cations, redox, total organic carbon, chlorophyll b, chlorophyll c
Monitor supplemental water quality parameters
P27 Surface Water Quality Supplemental parameters
What are the range and variance of the supplemental water quality parameters? What are the temporal and spatial trends?
in-situ measurements and collection of samples at established sites including controls
inorganic nutrients (NO2/NO3, PO4, NH4), suspended sediments/turbidity/secchi disk, alkalinity, anions, cations, redox, total organic carbon, chlorophyll b, chlorophyll c
P28 Ground Water Quality - Microbiology
What are the range and variance of microbial water quality parameters? What are the temporal and spatial trends?
water sampling from dedicated monitoring wells in addition to supply wells bacteria, viruses, protozoans, biological oxygen demand
P29 Marine Water Quality - Microbiology
What are the range and variance of microbial water quality parameters? What are the temporal and spatial trends?
collection of samples at established sites including controls bacteria, viruses, protozoans, biological oxygen demand
Monitor microbiological water quality parameters
P30 Surface Water Quality - Microbiology
What are the range and variance of microbial water quality parameters? What are the temporal and spatial trends?
collection of samples at established sites including controls bacteria, viruses, protozoans, biological oxygen demand
P31 Ground Water Quality - Toxics & contaminants
What are the range and variance of toxics and contaminants in groundwater? What are the temporal and spatial trends?
water sampling from dedicated monitoring wells in addition to supply wells use of fat bags (SPMDs) chemical oxygen demand, heavy metals, herbicides, organics, pesticides
P32 Marine Water Quality - Toxics & contaminants
What are the range and variance of toxics and contaminants in marine water? What are the temporal and spatial trends?
water sampling, sediment sampling, animal tissue sampling
chemical oxygen demand, heavy metals, herbicides, organics, pesticides, bioassays
Monitor toxic and contaminant levels in water
P33 Surface Water Quality - Toxics & contaminants
What are the range and variance of toxics and contaminants in surface water? What are the temporal and spatial trends?
water sampling, sediment sampling, animal tissue sampling
chemical oxygen demand, heavy metals, herbicides, organics, pesticides, bioassays
P34 Biotic Indicators of Marine Water Quality Are benthic invertebrate & algal communities indicative of impaired water quality? Periodic benthic quadrat sampling (sediment &
sessile organisms). species richness, composition, biomass, presence/absence of indicator species
Water Q
uality
Monitor biotic (communities) indicators of water quality
P35 Biotic Indicators of Surface Water Quality Are benthic invertebrate & algal communities indicative of impaired water quality? Periodic benthic quadrat sampling. species richness, composition, biomass, presence/absence of indicator
species
P36 Volcanic Unrest - Ground Deformation
What role does volcanic activity and deformation play in maintaining public safety, park facilities, and how do they affect natural processes? Dry and wet tilt meters, dilatometers, GPS GPS, subsurface temp, tilt meters Monitor surface volcanic activity (lava
flows, eruption events & ground deformation) P37 Volcanic Unrest - Lava Flows What role do lava flows play in maintaining public safety, park facilities, and how do
they affect natural processes? Remote sensing, visual observation, tilt meters and dilatometers, GPS ground deformation tube mapping, flow direction/magnitude, GPS
P38 Seismicity of Non-Volcanic Origin Can we identify trends and predict hazards? Seismometers (local and global) tilt meters, seismometers, dilatometers (pressure gauges), EDM
(Electronic Distance Measuring) Monitor volcanic & non-volcanic seismicity
P39 Seismicity of Volcanic Origin Can we identify trends and predict hazards? Seismometers (local and global) tilt meters, seismometers, dilatometers (pressure gauges), EDM (Electronic Distance Measuring)
Monitor extent, location, and causes of mass wasting events (e.g. landslides, debris flows, flash floods, tsunami)
P40 Mass Geologic Wasting Can we predict slope failure hazards to protect habitats and human safety? Can we monitor or identify causes? What are temporal trends?
Rainfall and other climactic analyses (precursors and catalysts), stream gauges, remote sensing
soil saturation, soil/ground creep, substrate composition/permeability, substrate distribution
Hazards
Measure the impacts from extreme events such as coastal stream flooding, storm/hurricane overwash, and tsunami inundation
P41 Marine Inundation What area the frequency and magnitude and distribution of marine inundation events, what park resources are subject to inundation during stream flooding, tsunamis, and large storms or big wave events?
Tide gauges, seismic networks, rain gauges, stream gauges, oceanic buoys, field mapping of water and debris lines (both horizontal incursion and vertical elevation)after an event, photograph damage and changes to park resources
water (sea) levels, erosion/deposition, extent, discharge
Monitor shoreline dynamics and change in shoreline position P42 Coastal Shoreline Change
(erosion & accretion) Where are shorelines advancing, retreating, or stable, and what is the rate of change?
historical shoreline analysis (air photos, T-sheets), beach profiles, tide gauge data to examine local sea-level trends, field observations and measurements
human development/infrastructure, substrate composition, shoreline aspect/position/slope, sea level, nearshore physical oceanography, historical shoreline analysis, amount of change (m) over the time span between measurements (years).
Track dune locations and topography P43 Dune Change (erosion & accretion)
Are drought & desertification influencing topsoil transport and seed/nutrient transport patterns?
remote sensing, field investigation, periodic change analysis
grain size & parent material, rainfall, soil crust development, substrate composition, substrate distribution, veg stabilization, wind regime
Identify and monitor the extent of permafrost P44 Permafrost on Big Island
summits Is extent of permafrost declining? Influence on ground subsidence, slope failure, etc?
Remote Sensing (ground penetrating radar), satellite thermal analysis, drilling temperature, volcanic activity (heating), permafrost thickness, rainfall
P45 Cave Geology: non-karst and karst
What are patterns of mineral accretion? Where & when are collapse/skylight formation or enlargement occurring? Are changes in karst systems leading to potential bedrock collapse, well yield disparities, poor groundwater quality, soil instability?
geologic mapping, periodic measurement of physical parameters and feature types, remote sensing, surface water chemistry, groundwater discharge patterns
dimensions, feature size, extent, baseline mapping, groundwater flow/quality
Physical / C
hemical C
onditions
Geology
Landforms
Monitor karst and non-karst cave and lava tube habitat characteristics, topography, and extent
P46 Cave Environmental conditions How does human activity & cultural practices impact and change cave systems above ground (outside) and inside? How do natural/human induced impacts affect environmental cave conditions (temp, humidity, light, etc.)?
Station/plot data, photo points (repeat photography) litterfall, Species distribution & abundance, human use levels, temperature, humidity, ground compaction, etc.
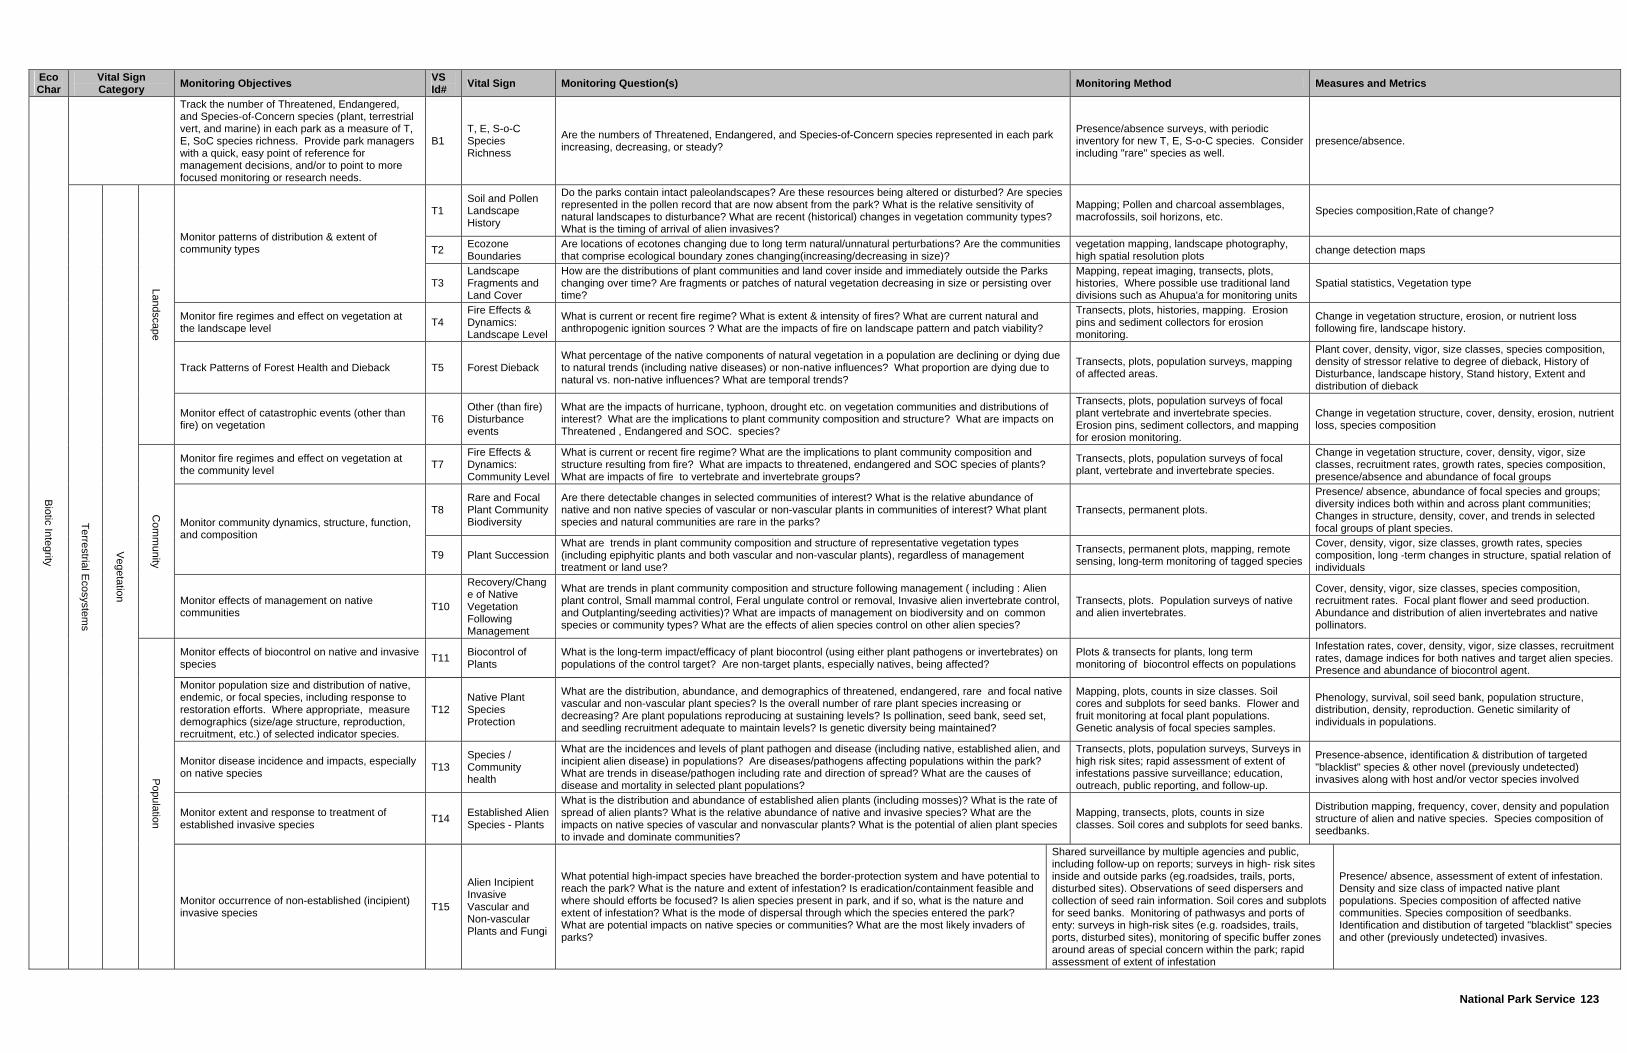
National Park Service 123
Eco Char
Vital Sign Category Monitoring Objectives VS
Id# Vital Sign Monitoring Question(s) Monitoring Method Measures and Metrics
Track the number of Threatened, Endangered, and Species-of-Concern species (plant, terrestrial vert, and marine) in each park as a measure of T, E, SoC species richness. Provide park managers with a quick, easy point of reference for management decisions, and/or to point to more focused monitoring or research needs.
B1 T, E, S-o-C Species Richness
Are the numbers of Threatened, Endangered, and Species-of-Concern species represented in each park increasing, decreasing, or steady?
Presence/absence surveys, with periodic inventory for new T, E, S-o-C species. Consider including "rare" species as well.
presence/absence.
T1 Soil and Pollen Landscape History
Do the parks contain intact paleolandscapes? Are these resources being altered or disturbed? Are species represented in the pollen record that are now absent from the park? What is the relative sensitivity of natural landscapes to disturbance? What are recent (historical) changes in vegetation community types? What is the timing of arrival of alien invasives?
Mapping; Pollen and charcoal assemblages, macrofossils, soil horizons, etc. Species composition,Rate of change?
T2 Ecozone Boundaries
Are locations of ecotones changing due to long term natural/unnatural perturbations? Are the communities that comprise ecological boundary zones changing(increasing/decreasing in size)?
vegetation mapping, landscape photography, high spatial resolution plots change detection maps
Monitor patterns of distribution & extent of community types
T3 Landscape Fragments and Land Cover
How are the distributions of plant communities and land cover inside and immediately outside the Parks changing over time? Are fragments or patches of natural vegetation decreasing in size or persisting over time?
Mapping, repeat imaging, transects, plots, histories, Where possible use traditional land divisions such as Ahupua'a for monitoring units
Spatial statistics, Vegetation type
Monitor fire regimes and effect on vegetation at the landscape level T4
Fire Effects & Dynamics: Landscape Level
What is current or recent fire regime? What is extent & intensity of fires? What are current natural and anthropogenic ignition sources ? What are the impacts of fire on landscape pattern and patch viability?
Transects, plots, histories, mapping. Erosion pins and sediment collectors for erosion monitoring.
Change in vegetation structure, erosion, or nutrient loss following fire, landscape history.
Track Patterns of Forest Health and Dieback T5 Forest Dieback What percentage of the native components of natural vegetation in a population are declining or dying due to natural trends (including native diseases) or non-native influences? What proportion are dying due to natural vs. non-native influences? What are temporal trends?
Transects, plots, population surveys, mapping of affected areas.
Plant cover, density, vigor, size classes, species composition, density of stressor relative to degree of dieback, History of Disturbance, landscape history, Stand history, Extent and distribution of dieback
Landscape
Monitor effect of catastrophic events (other than fire) on vegetation T6
Other (than fire) Disturbance events
What are the impacts of hurricane, typhoon, drought etc. on vegetation communities and distributions of interest? What are the implications to plant community composition and structure? What are impacts on Threatened , Endangered and SOC. species?
Transects, plots, population surveys of focal plant vertebrate and invertebrate species. Erosion pins, sediment collectors, and mapping for erosion monitoring.
Change in vegetation structure, cover, density, erosion, nutrient loss, species composition
Monitor fire regimes and effect on vegetation at the community level T7
Fire Effects & Dynamics: Community Level
What is current or recent fire regime? What are the implications to plant community composition and structure resulting from fire? What are impacts to threatened, endangered and SOC species of plants? What are impacts of fire to vertebrate and invertebrate groups?
Transects, plots, population surveys of focal plant, vertebrate and invertebrate species.
Change in vegetation structure, cover, density, vigor, size classes, recruitment rates, growth rates, species composition, presence/absence and abundance of focal groups
T8 Rare and Focal Plant Community Biodiversity
Are there detectable changes in selected communities of interest? What is the relative abundance of native and non native species of vascular or non-vascular plants in communities of interest? What plant species and natural communities are rare in the parks?
Transects, permanent plots.
Presence/ absence, abundance of focal species and groups; diversity indices both within and across plant communities; Changes in structure, density, cover, and trends in selected focal groups of plant species. Monitor community dynamics, structure, function,
and composition
T9 Plant Succession What are trends in plant community composition and structure of representative vegetation types (including epiphyitic plants and both vascular and non-vascular plants), regardless of management treatment or land use?
Transects, permanent plots, mapping, remote sensing, long-term monitoring of tagged species
Cover, density, vigor, size classes, growth rates, species composition, long -term changes in structure, spatial relation of individuals
Com
munity
Monitor effects of management on native communities T10
Recovery/Change of Native Vegetation Following Management
What are trends in plant community composition and structure following management ( including : Alien plant control, Small mammal control, Feral ungulate control or removal, Invasive alien invertebrate control, and Outplanting/seeding activities)? What are impacts of management on biodiversity and on common species or community types? What are the effects of alien species control on other alien species?
Transects, plots. Population surveys of native and alien invertebrates.
Cover, density, vigor, size classes, species composition, recruitment rates. Focal plant flower and seed production. Abundance and distribution of alien invertebrates and native pollinators.
Monitor effects of biocontrol on native and invasive species T11 Biocontrol of
Plants What is the long-term impact/efficacy of plant biocontrol (using either plant pathogens or invertebrates) on populations of the control target? Are non-target plants, especially natives, being affected?
Plots & transects for plants, long term monitoring of biocontrol effects on populations
Infestation rates, cover, density, vigor, size classes, recruitment rates, damage indices for both natives and target alien species. Presence and abundance of biocontrol agent.
Monitor population size and distribution of native, endemic, or focal species, including response to restoration efforts. Where appropriate, measure demographics (size/age structure, reproduction, recruitment, etc.) of selected indicator species.
T12 Native Plant Species Protection
What are the distribution, abundance, and demographics of threatened, endangered, rare and focal native vascular and non-vascular plant species? Is the overall number of rare plant species increasing or decreasing? Are plant populations reproducing at sustaining levels? Is pollination, seed bank, seed set, and seedling recruitment adequate to maintain levels? Is genetic diversity being maintained?
Mapping, plots, counts in size classes. Soil cores and subplots for seed banks. Flower and fruit monitoring at focal plant populations. Genetic analysis of focal species samples.
Phenology, survival, soil seed bank, population structure, distribution, density, reproduction. Genetic similarity of individuals in populations.
Monitor disease incidence and impacts, especially on native species T13
Species / Community health
What are the incidences and levels of plant pathogen and disease (including native, established alien, and incipient alien disease) in populations? Are diseases/pathogens affecting populations within the park? What are trends in disease/pathogen including rate and direction of spread? What are the causes of disease and mortality in selected plant populations?
Transects, plots, population surveys, Surveys in high risk sites; rapid assessment of extent of infestations passive surveillance; education, outreach, public reporting, and follow-up.
Presence-absence, identification & distribution of targeted "blacklist" species & other novel (previously undetected) invasives along with host and/or vector species involved
Monitor extent and response to treatment of established invasive species T14 Established Alien
Species - Plants
What is the distribution and abundance of established alien plants (including mosses)? What is the rate of spread of alien plants? What is the relative abundance of native and invasive species? What are the impacts on native species of vascular and nonvascular plants? What is the potential of alien plant species to invade and dominate communities?
Mapping, transects, plots, counts in size classes. Soil cores and subplots for seed banks.
Distribution mapping, frequency, cover, density and population structure of alien and native species. Species composition of seedbanks.
Biotic Integrity
Terrestrial Ecosystem
s
Vegetation
Population
Monitor occurrence of non-established (incipient) invasive species T15
Alien Incipient Invasive Vascular and Non-vascular Plants and Fungi
What potential high-impact species have breached the border-protection system and have potential to reach the park? What is the nature and extent of infestation? Is eradication/containment feasible and where should efforts be focused? Is alien species present in park, and if so, what is the nature and extent of infestation? What is the mode of dispersal through which the species entered the park? What are potential impacts on native species or communities? What are the most likely invaders of parks?
Shared surveillance by multiple agencies and public, including follow-up on reports; surveys in high- risk sites inside and outside parks (eg.roadsides, trails, ports, disturbed sites). Observations of seed dispersers and collection of seed rain information. Soil cores and subplots for seed banks. Monitoring of pathwasys and ports of enty: surveys in high-risk sites (e.g. roadsides, trails, ports, disturbed sites), monitoring of specific buffer zones around areas of special concern within the park; rapid assessment of extent of infestation
Presence/ absence, assessment of extent of infestation. Density and size class of impacted native plant populations. Species composition of affected native communities. Species composition of seedbanks. Identification and distibution of targeted "blacklist" species and other (previously undetected) invasives.

Appendix O: Part IV Vital Signs Workshops
124
Eco Char
Vital Sign Category Monitoring Objectives VS
Id# Vital Sign Monitoring Question(s) Monitoring Method Measures and Metrics
T16 Terrestrial Invertebrate Biodiversity
What are trends in distribution, abundance, and diversity of speciose groups within parks and across landscapes? Are species being locally extirpated or going extinct?
Population surveys, transects, plots, mapping Abundance, density, demographics, distribution, diversity, evenness, richness Detect changes in the dynamics, structure, composition
and/or function of selected communities within defined geographic areas. Periodically inventory to document new species in parks. Where appropriate, parks may emphasize off-shore (or other forms of) islet refugia T17
Terrestrial Vertebrate Biodiversity (including off-shore islet refugia)
Are selected native vertebrate communities or guilds changing? This includes changes in abundance of selected species (determined from population surveys), and/or changes in the identity and number of species present in the community or guild of interest (determined from presence/absence monitoring).
Population surveys, presence/absence surveys. Periodic inventories focused on picking up new species records (especially T, E, S-o-C species, and seabird colonies) and/or locations.
Within defined areas or specified communities: abundance and trends of selected vertebrate species or groups, species richness
Com
munity
Monitor effects of management on fauna communities T18 Recovery/change of native fauna with habitat restoration
What is the response of native vertebrate and invertebrate populations to habtiat restoration, including alien control and outplanting and seed-sowing activities? Which native species are recolonizing restored areas? Which ones are not?
Population surveys, transects, plots (monitoring of areas where seeds have been broadcast and native species outplanted), mapping
Abundance, density, size classes, vigor, species composition, seedling recruitment, growth rates, Cover, animal reproductive success, animal population size, animal population growth rates, survivorship, distribution, diversity, evenness, richness
Monitor effects of biocontrol on native and invasive species T19 Invertebrate Biocontrol of Invertebrates
What is the impact of biocontrol agents on native and non-native invertebrates (including moths, beetles, snails, and parasitoids)? What is the impact on target species?
Population surveys, transects, plots, mapping, rearing
Parasitism/predation rates; abundance/density, demographics, distribution of hosts and control agents
T20 Selected native and alien forest Bird and Bat populations (can include T & E spp.)
Are the demographics of selected native, endemic, or focal forest bird and bat species changing? If so, are changes deleterious, and can we control or reduce threats to these populations?
Population surveys, including demographic measures (size/age structure, reproduction, recruitment, etc.) and prevalence of disease, pathogens, and/or population threats. (Forest bird methods differ from those for raptors or bats; and fruit bat methods will differ from insectivorous bats.)
Population demographics, density, distribution. Prevalence of disease, pathogens, other population threats.
Monitor population health by detecting changes in population size and distribution of native and non-native, endemic, or focal species, including response to restoration efforts. Where appropriate, measure demographics (size/age structure, reproduction, recruitment, etc.) of selected indicator species
T21 Herps (native) Are distribution, abundance, other population characteristics, or habitat changing? Determine population levels over time.
Population surveys. A variety of standardized techniques (depending on target species) -- pitfall traps, baited traps, etc.
Abundance / density, distribution
Monitor population health of native, non-native, endemic, or focal species through measurement of demographics (size/age structure, reproduction, recruitment, etc.) for selected species; and identification of disease, pathogen, or other threats.
T22 Seabird, Shorebird, Waterbird Population Health (can include T & E spp.)
Are the demographics of selected seabird, shorebird, and waterbird species changing? If so, are changes deleterious, and can we control or reduce threats to these populations?
Population surveys, including demographic measures (size/age structure, reproduction, recruitment, etc.) and prevalence of disease, pathogens, and/or population threats. (Methods will differ for seabirds, shorebirds, and waterbirds.)
Population demographics, density, distribution. Prevalence of disease, pathogens, other population threats. (For seabirds, probably focusing on nesting or roosting habitat vs at-sea habitat except possibly for near-shore feeders.)
Monitor population size and distribution of native, endemic, or focal species, including response to restoration efforts - and the habitat where present. Where appropriate, measure demographics (size/age structure, reproduction, recruitment, etc.)
T23 Terrestrial Invertebrate Indicators Associated with Habitat Quality
What are trends in distribution and abundance of invertebrate indicator species? Population surveys, transects, plots, mapping Abundance, density, demographics, distribution
Monitor population health of native, endemic, or focal species through measurement of demographics (size/age structure, reproduction, recruitment, etc.) for selected species; and identification of threats.
T24
Terrestrial Invertebrate Focal Species and Species of Special Concern (T, E, S-o-C, rare, and charismatic species)
What are trends in distribution, abundance, other population characteristics, and habitat? Are threats changing? If so are changes deleterious, and can we control or reduce threats to these populations?
Population surveys (including demographics), transects, plots, mapping
Abundance, density, demographics (size/age, structure, reproduction, recruitment, etc), distribution, documentation of other population threats
Assess health of terrestrial vertebrate populations, particularly sensitive, native species. Detect, identify, and quantify causes of mortality and morbidity and their impacts on the populations. Provide early detection information to help prevent occurrence and/or spread of potential new threats to populations.
T25
Wildlife (terrestrial vertebrate) health and targeted monitoring for disease/pathogens, esp among native species (can include T & E)
What are the prevalences and levels (how severe), and trends in known causes of morbidity and mortality in targeted popns? Where cause-effect is clearly established, are these affecting the populations? For targeted potential (incipient) causes of mortality and morbidity: are these present in popn or geographic area of concern? Are they present in other popns or in locations outside the immediate area of concern? If so, what are rates and directions of spread?
Known causes: specimen and/or carcass collection (may include telemetry to recovery carcasses), host or vector surveys/sampling; surveys of affected populations to determine popn status and impacts. Potential causes: Surveys in high risk sites; passive surveillance (opportunistic carcass or sick animal collection); education & outreach to encourage public reporting; survey or report follow-up where needed; rapid assessment of extent of any infestations
Disease or threat prevalence, level, or presence/ absence; distribution and numbers of host and/or vector species involved; abundance or density of affected population. Potential causes: presence/absence; distribution, ID, and numbers of host and/or vector spp.
Monitor extent and effects of alien feral ungulates, and monitor their response to management treatment. T26
Status of Established Alien Feral Ungulates, and Response to Treatment
What are the relative abundance, distribution, and population trends of feral ungulates? Are native plant and animal species' abundance or distribution changing in response to feral ungulates, or in response to efforts to control feral ungulates?
Treatment and control transects, plots, or sites using appropriate methods to assess both invasive and native organisms of interest (VCP, transects, etc.); surveys for predators using appropriate methods to estimate population size and distributionTreatment and control Transects/plots (for plants); other methods appropriate for native vertebrates of interest (VCP, transects, etc.); population surveys for predators
Plants: species composition, population and/or community structure. Animals: abundance or density, possibly presence/absence, and/or other measures of critical life stages identified as impacted by predators. Predators: population indices, presence/ absence, mapping.Plants: species composition, population and/or community structure. Animals: VCP, transects, other methods to monitor critical life stages identified as impacted by predators. Predator population indices, presence/ absence
Monitor extent and response to treatment of established invasive species T27
Established Alien Species - Invasive Terrestrial Invertebrate Pests of Natural Systems
What are the abundance, distribution, and seasonal and year-to-year variations in populations? What are trends in impact? How effective is control?
Population surveys, transects, plots, mapping Abundance, density, demographics, distribution of aliens and native indicator species
Monitor extent and effects of predatory and omnivorous alien terrestrial verts, and monitor their response to management treatment.
T28
Status of Established Alien Predatory and Omnivorous Terrestrial Vert Species, and Response to Treatment
Are native plant and animal species' abundance or distribution changing in response to predatory or omnivorous invasives, or in response to efforts to control these invasives? What are trends in predatory and omnivorous invasive species populations?
Treatment and control transects, plots, or sites using appropriate methods to assess both invasive and native organisms of interest (VCP, transects, etc.); surveys for predators using appropriate methods to estimate population size and distribution.
Plants: species composition, population and/or community structure. Animals: abundance or density, possibly presence/absence, and/or other measures of critical life stages identified as impacted by predators. Predators: population indices, presence/ absence, mapping.
Biotic Integrity
Terrestrial Ecosystem
s
Consum
ers
Population
Monitor extent and response to treatment of established T29 Established Alien Species - What are the abundance, distribution, and seasonal and year-to-year Population surveys, transects, plots, mapping Infestation rates of native and alien hosts

National Park Service 125
Eco Char
Vital Sign Category Monitoring Objectives VS
Id# Vital Sign Monitoring Question(s) Monitoring Method Measures and Metrics
Terrestrial Invertebrate Pests of Agricultural Systems (including traditional cultivation)
variations in populations? What are trends in impact? How effective is control?
invasive species
T30 Established Alien Species - Terrestrial Invertebrate Pests (human structures)
What is the impact of invertebrate pests on historic and other culturally significant structures? Periodic sampling of structures Infestation rates, structural damage
Monitor for invasive terrestrial vertebrate species known to pose potential ecological threats (incipient species). Where appropriate, monitor response of these invasive species to management treatment.
T31
Targeted monitoring for (incipient) invasive terrestrail vertebrate species known to pose potential threats
What potential high-impact species have breached the border-protection system and have potential to reach the park? What is the nature and extent of infestation? Is eradication/containment feasible and where should efforts be focused? What are potential impacts? Is species present in park? If so, what is the nature and extent of infestation? Are native plant and animal species' abundance or distribution changing in response to the invasive or its control? What are the pathways and points of entry?
Detection: surveys in high- risk sites; follow up on reports; education and outreach to encourage public reporting. Impacts and reponse to treatment: treatment and control transects, plots, or sites using appropriate methods to assess both invasive and native organisms of interest (VCP, transects, etc.); surveys for non-established predators using appropriate methods to estimate population size and distribution.
Identification & distribution of targeted 'blacklist' and other novel (previously undetected) invasives. Presence/ absence; predator population indices and mapping; rapid assessment of infestation extent. Native plants: species composition, population and/or community structure; native animals: abundance or density, possibly presence/absence, and/or other measures of critical life stages identified as impacted by predators.
Monitor occurrence of non-established (incipient) invasive species T32 Alien Incipient Invasives -
Terrestrial Invertebrates
What potential high-impact species have breached the border-protection system and have potential to reach the park? What is the nature and extent of infestation? Is eradication/containment feasible and where should efforts be focused? Which species are present in park? What is the nature and extent of infestation? Where should efforts be focused? What are potential impacts?
Active monitoring (transects, plots,light trapping, etc.) in high-risk sites;rapid assessment of extent of infestation; mapping of new discoveries; education, outreach, and public reporting, follow-up on reports
Identification & distribution of targeted 'blacklist' and other novel (previously undetecteed) invasives. Presence/absence, distribution, rapid assessment of extent of infestation
Cave S
ystems
Com
munity
Monitor changes in cave communities T33 Cave & lava tube communities What are trends in distribution, abundance, other population characteristics, and habitat quality? Are threats changing?
Population surveys, mapping; root type and abundance
Abundance, density, demographics, distribution, diversity, evenness, richness of natives and aliens
F1 Aquatic primary producer community composition, structure & biomass
What species are present? What are rates of production? What is the proportion of native vs. alien species contributing to productivity? Are there long-term changes in communities of aquatic primary producers? Where are algal blooms present? Includes benthic & planktonic species.
Periodic benthic quadrat sampling and/or plankton tows (depending on habitat).
trends in cover, density, diversity over time, distribution, species composition & biomass
Com
munity
Monitor community composition, structure, and productivity
F2 Wetland & riparian plant community composition, structure & biomass
What species are present? What are rates of production? What is the proportion of native vs. alien species contributing to productivity? What are rates of riparian input (leaf litter, etc.) into aquatic habitat? Are there long-term changes in wetland & riparian plant communities?
Periodic transects & plot surveys, mapping, litter traps, surface water sampliig
trends in cover, density, size classes, litterfall, diversity over time, distribution, demographics, species composition, litter volume per species
Monitor extent and response to treatment of established invasive species F3
Established aquatic/wetland invasive plant & algal species distribution & abundance
What is the present extent of occurrence? Are there changes in extent over time? Periodic transects & plot surveys, mapping. presence/absence, trends in abundance, distribution
and density
Producers P
opulation Monitor occurrence of non-established (incipient) invasive species F4
Incipient aquatic/wetland invasive plant & algal species distribution & abundance
Is species present nearby? If so, what is the present extent and nature of occurrence? What are potential pathways for dispersal?
Periodic sampling of freshwater habitats outside of parks (transects & surveys, mapping), including identified pathways of dispersal.
presence/absence, trends in abundance, distribution and density
Com
munity
Monitor community dynamics, structure, function, and composition F5
Aquatic & Riparian animal community structure & composition
What species are present? Are there long-term changes in native fish and aquatic invertebrate communities (composition, species richness, presence of aliens, etc.)?
Population surveys, periodic quadrat netting/trapping, visual transect censuses, plots, mapping.
Trends in community diversity, density over time, abundance, demographics, distribution, evenness, richness
Monitor disease incidence and impacts, especially on native species F6 Disease & parasites of aquatic
animals What is the incidence and level of disease in populations of aquatic animals? Visual surveys of possibly affected populations, opportunistic collections of dead animals, tissue samples from non-native vector species
disease/parasite occurrence & frequency
Monitor population size and distribution of native, endemic, or focal species, including response to restoration efforts. Where appropriate, measure demographics (size/age structure, reproduction, recruitment, etc.) of selected indicator species
F7 Native aquatic animal focal species distribution & abundance
Is species present? If so, what are trends in population numbers, reproduction, distribution and density? Includes shrimp, fish, molluscs and insects.
Periodic quadrat netting/trapping, larval drift netting, visual transect censuses, mapping.
presence/absence, trends in abundance of different size/age classes, distribution and density
Monitor extent and response to treatment of established invasive species F8
Established aquatic invasive animal species distribution & abundance
What is the present extent of occurrence? Are there changes in extent over time?
Periodic quadrat netting/trapping, visual transect censuses, mapping.
presence/absence, trends in abundance, distribution and density
Biotic Integrity
Freshwater E
cosystems
Consum
ers
Population
Monitor occurrence of non-established (incipient) invasive species F9
Incipient aquatic invasive animal species distribution & abundance
Is species present nearby? If so, what is the present extent and nature of occurrence? What are potential pathways for dispersal?
Periodic sampling of freshwater habitats outside of parks (quadrat netting/trapping, visual transect censuses, mapping), including identified pathways of dispersal.
presence/absence, trends in abundance, distribution and density
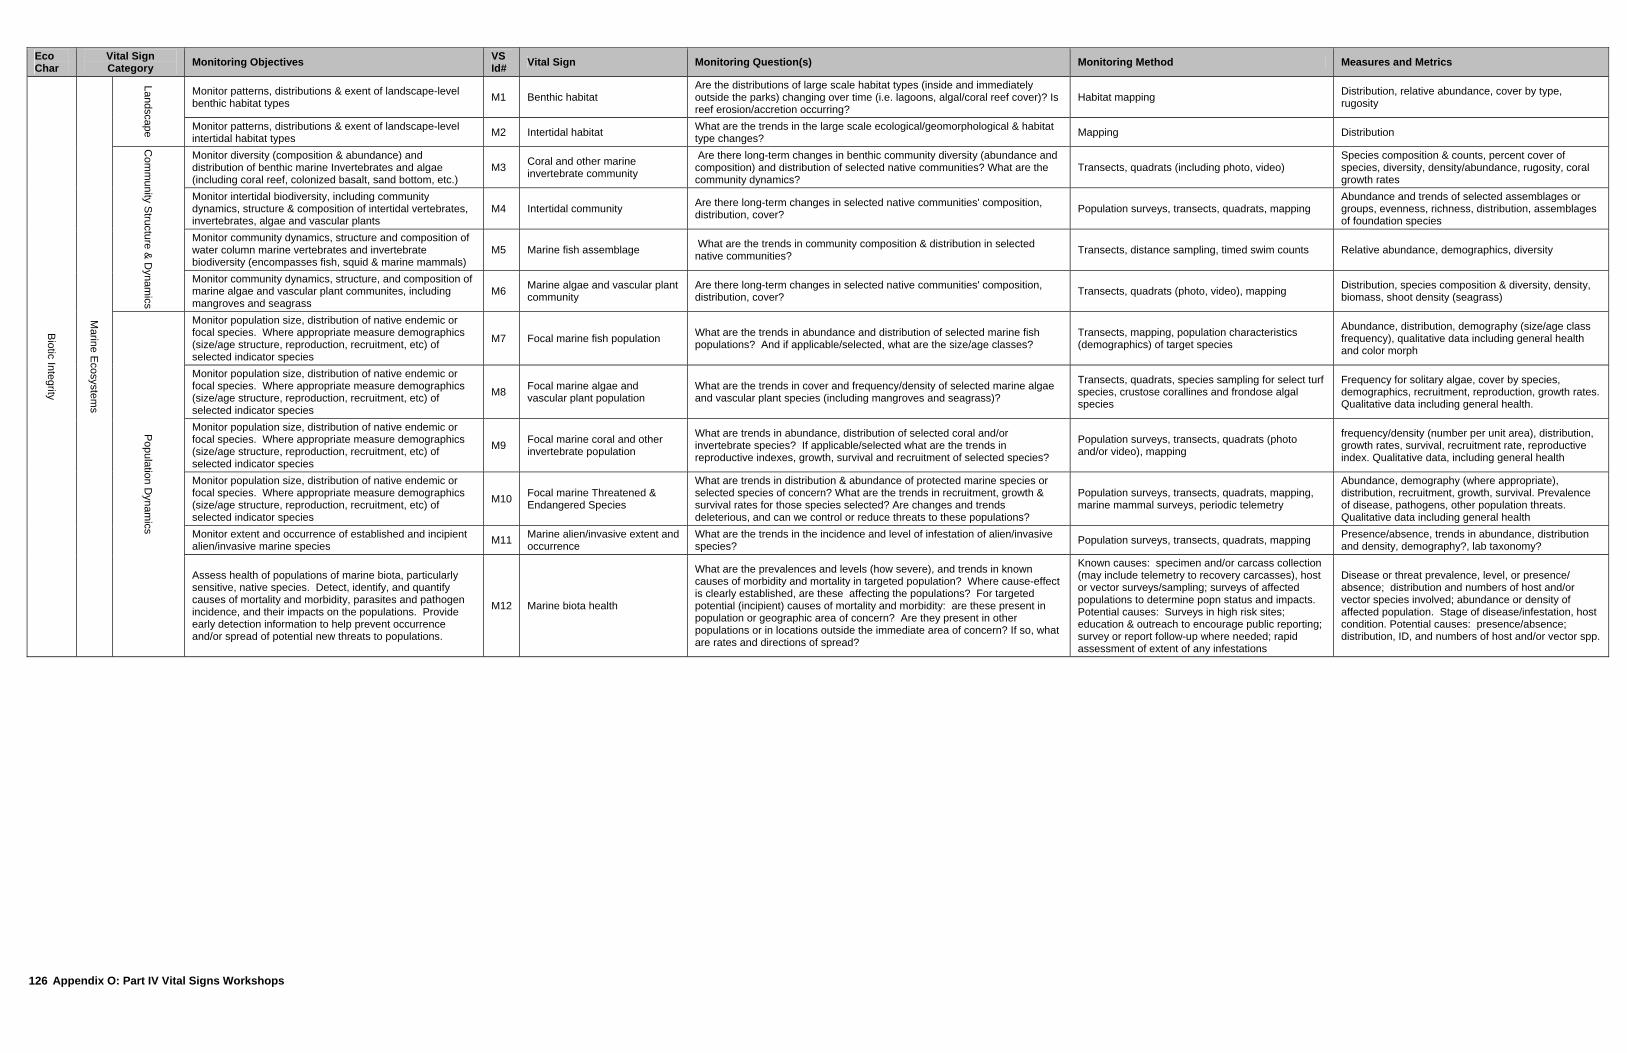
Appendix O: Part IV Vital Signs Workshops
126
Eco Char
Vital Sign Category Monitoring Objectives VS
Id# Vital Sign Monitoring Question(s) Monitoring Method Measures and Metrics
Monitor patterns, distributions & exent of landscape-level benthic habitat types M1 Benthic habitat
Are the distributions of large scale habitat types (inside and immediately outside the parks) changing over time (i.e. lagoons, algal/coral reef cover)? Is reef erosion/accretion occurring?
Habitat mapping Distribution, relative abundance, cover by type, rugosity
Landscape
Monitor patterns, distributions & exent of landscape-level intertidal habitat types M2 Intertidal habitat What are the trends in the large scale ecological/geomorphological & habitat
type changes? Mapping Distribution
Monitor diversity (composition & abundance) and distribution of benthic marine Invertebrates and algae (including coral reef, colonized basalt, sand bottom, etc.)
M3 Coral and other marine invertebrate community
Are there long-term changes in benthic community diversity (abundance and composition) and distribution of selected native communities? What are the community dynamics?
Transects, quadrats (including photo, video) Species composition & counts, percent cover of species, diversity, density/abundance, rugosity, coral growth rates
Monitor intertidal biodiversity, including community dynamics, structure & composition of intertidal vertebrates, invertebrates, algae and vascular plants
M4 Intertidal community Are there long-term changes in selected native communities' composition, distribution, cover? Population surveys, transects, quadrats, mapping
Abundance and trends of selected assemblages or groups, evenness, richness, distribution, assemblages of foundation species
Monitor community dynamics, structure and composition of water column marine vertebrates and invertebrate biodiversity (encompasses fish, squid & marine mammals)
M5 Marine fish assemblage What are the trends in community composition & distribution in selected native communities? Transects, distance sampling, timed swim counts Relative abundance, demographics, diversity
Com
munity S
tructure & D
ynamics
Monitor community dynamics, structure, and composition of marine algae and vascular plant communites, including mangroves and seagrass
M6 Marine algae and vascular plant community
Are there long-term changes in selected native communities' composition, distribution, cover? Transects, quadrats (photo, video), mapping Distribution, species composition & diversity, density,
biomass, shoot density (seagrass)
Monitor population size, distribution of native endemic or focal species. Where appropriate measure demographics (size/age structure, reproduction, recruitment, etc) of selected indicator species
M7 Focal marine fish population What are the trends in abundance and distribution of selected marine fish populations? And if applicable/selected, what are the size/age classes?
Transects, mapping, population characteristics (demographics) of target species
Abundance, distribution, demography (size/age class frequency), qualitative data including general health and color morph
Monitor population size, distribution of native endemic or focal species. Where appropriate measure demographics (size/age structure, reproduction, recruitment, etc) of selected indicator species
M8 Focal marine algae and vascular plant population
What are the trends in cover and frequency/density of selected marine algae and vascular plant species (including mangroves and seagrass)?
Transects, quadrats, species sampling for select turf species, crustose corallines and frondose algal species
Frequency for solitary algae, cover by species, demographics, recruitment, reproduction, growth rates. Qualitative data including general health.
Monitor population size, distribution of native endemic or focal species. Where appropriate measure demographics (size/age structure, reproduction, recruitment, etc) of selected indicator species
M9 Focal marine coral and other invertebrate population
What are trends in abundance, distribution of selected coral and/or invertebrate species? If applicable/selected what are the trends in reproductive indexes, growth, survival and recruitment of selected species?
Population surveys, transects, quadrats (photo and/or video), mapping
frequency/density (number per unit area), distribution, growth rates, survival, recruitment rate, reproductive index. Qualitative data, including general health
Monitor population size, distribution of native endemic or focal species. Where appropriate measure demographics (size/age structure, reproduction, recruitment, etc) of selected indicator species
M10 Focal marine Threatened & Endangered Species
What are trends in distribution & abundance of protected marine species or selected species of concern? What are the trends in recruitment, growth & survival rates for those species selected? Are changes and trends deleterious, and can we control or reduce threats to these populations?
Population surveys, transects, quadrats, mapping, marine mammal surveys, periodic telemetry
Abundance, demography (where appropriate), distribution, recruitment, growth, survival. Prevalence of disease, pathogens, other population threats. Qualitative data including general health
Monitor extent and occurrence of established and incipient alien/invasive marine species M11 Marine alien/invasive extent and
occurrence What are the trends in the incidence and level of infestation of alien/invasive species? Population surveys, transects, quadrats, mapping Presence/absence, trends in abundance, distribution
and density, demography?, lab taxonomy?
Biotic Integrity
Marine E
cosystems
Population D
ynamics
Assess health of populations of marine biota, particularly sensitive, native species. Detect, identify, and quantify causes of mortality and morbidity, parasites and pathogen incidence, and their impacts on the populations. Provide early detection information to help prevent occurrence and/or spread of potential new threats to populations.
M12 Marine biota health
What are the prevalences and levels (how severe), and trends in known causes of morbidity and mortality in targeted population? Where cause-effect is clearly established, are these affecting the populations? For targeted potential (incipient) causes of mortality and morbidity: are these present in population or geographic area of concern? Are they present in other populations or in locations outside the immediate area of concern? If so, what are rates and directions of spread?
Known causes: specimen and/or carcass collection (may include telemetry to recovery carcasses), host or vector surveys/sampling; surveys of affected populations to determine popn status and impacts. Potential causes: Surveys in high risk sites; education & outreach to encourage public reporting; survey or report follow-up where needed; rapid assessment of extent of any infestations
Disease or threat prevalence, level, or presence/ absence; distribution and numbers of host and/or vector species involved; abundance or density of affected population. Stage of disease/infestation, host condition. Potential causes: presence/absence; distribution, ID, and numbers of host and/or vector spp.

National Park Service 127
Post-Meeting Update
Since the Pacific Island Network held it’s Vital Sign Workshop in March 2004, additional guidance has been provided (see http://science.nature.nps.gov/im/monitor/). This guidance includes a standardized framework for all NPS Inventory and Monitoring Networks, as well as additional clarification as to how specific Vital Signs should be when identified. Adapting the Pacific Island Network framework, Vital Signs, descriptions, and other aspects of our monitoring required changes not discussed during the workshop. This document does NOT reflect adjustments made after this workshop.
For the most recent version of the Pacific Island Network Monitoring Plan as well as network and individual park Vital Signs, see http://www1.nature.nps.gov/im/units/pacn/monitoring/.
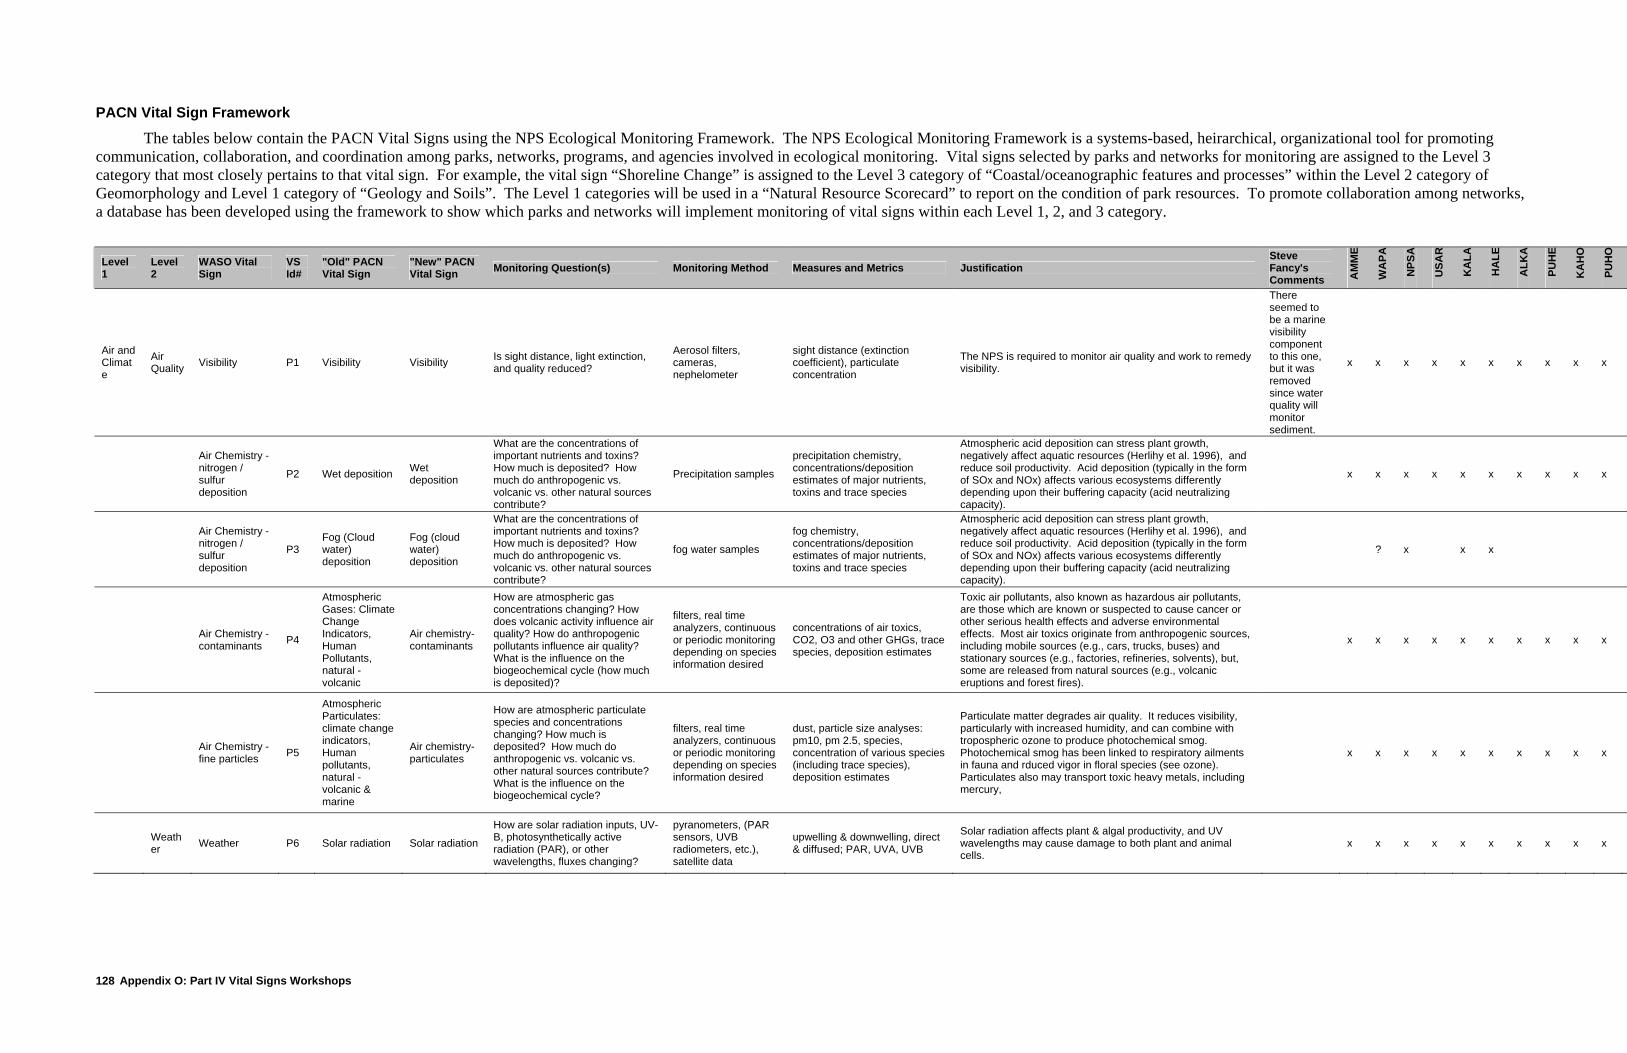
Appendix O: Part IV Vital Signs Workshops
128
PACN Vital Sign Framework
The tables below contain the PACN Vital Signs using the NPS Ecological Monitoring Framework. The NPS Ecological Monitoring Framework is a systems-based, heirarchical, organizational tool for promoting communication, collaboration, and coordination among parks, networks, programs, and agencies involved in ecological monitoring. Vital signs selected by parks and networks for monitoring are assigned to the Level 3 category that most closely pertains to that vital sign. For example, the vital sign “Shoreline Change” is assigned to the Level 3 category of “Coastal/oceanographic features and processes” within the Level 2 category of Geomorphology and Level 1 category of “Geology and Soils”. The Level 1 categories will be used in a “Natural Resource Scorecard” to report on the condition of park resources. To promote collaboration among networks, a database has been developed using the framework to show which parks and networks will implement monitoring of vital signs within each Level 1, 2, and 3 category.
Level 1
Level 2
WASO Vital Sign
VS Id#
"Old" PACN Vital Sign
"New" PACN Vital Sign Monitoring Question(s) Monitoring Method Measures and Metrics Justification
Steve Fancy's Comments A
MM
E
WA
PA
NPS
A
USA
R
KA
LA
HA
LE
ALK
A
PUH
E
KA
HO
PUH
O
Air and Climate
Air Quality Visibility P1 Visibility Visibility Is sight distance, light extinction,
and quality reduced?
Aerosol filters, cameras, nephelometer
sight distance (extinction coefficient), particulate concentration
The NPS is required to monitor air quality and work to remedy visibility.
There seemed to be a marine visibility component to this one, but it was removed since water quality will monitor sediment.
x x x x x x x x x x
Air Chemistry - nitrogen / sulfur deposition
P2 Wet deposition Wet deposition
What are the concentrations of important nutrients and toxins? How much is deposited? How much do anthropogenic vs. volcanic vs. other natural sources contribute?
Precipitation samples
precipitation chemistry, concentrations/deposition estimates of major nutrients, toxins and trace species
Atmospheric acid deposition can stress plant growth, negatively affect aquatic resources (Herlihy et al. 1996), and reduce soil productivity. Acid deposition (typically in the form of SOx and NOx) affects various ecosystems differently depending upon their buffering capacity (acid neutralizing capacity).
x x x x x x x x x x
Air Chemistry - nitrogen / sulfur deposition
P3 Fog (Cloud water) deposition
Fog (cloud water) deposition
What are the concentrations of important nutrients and toxins? How much is deposited? How much do anthropogenic vs. volcanic vs. other natural sources contribute?
fog water samples
fog chemistry, concentrations/deposition estimates of major nutrients, toxins and trace species
Atmospheric acid deposition can stress plant growth, negatively affect aquatic resources (Herlihy et al. 1996), and reduce soil productivity. Acid deposition (typically in the form of SOx and NOx) affects various ecosystems differently depending upon their buffering capacity (acid neutralizing capacity).
? x x x
Air Chemistry - contaminants P4
Atmospheric Gases: Climate Change Indicators, Human Pollutants, natural - volcanic
Air chemistry- contaminants
How are atmospheric gas concentrations changing? How does volcanic activity influence air quality? How do anthropogenic pollutants influence air quality? What is the influence on the biogeochemical cycle (how much is deposited)?
filters, real time analyzers, continuous or periodic monitoring depending on species information desired
concentrations of air toxics, CO2, O3 and other GHGs, trace species, deposition estimates
Toxic air pollutants, also known as hazardous air pollutants, are those which are known or suspected to cause cancer or other serious health effects and adverse environmental effects. Most air toxics originate from anthropogenic sources, including mobile sources (e.g., cars, trucks, buses) and stationary sources (e.g., factories, refineries, solvents), but, some are released from natural sources (e.g., volcanic eruptions and forest fires).
x x x x x x x x x x
Air Chemistry - fine particles P5
Atmospheric Particulates: climate change indicators, Human pollutants, natural - volcanic & marine
Air chemistry- particulates
How are atmospheric particulate species and concentrations changing? How much is deposited? How much do anthropogenic vs. volcanic vs. other natural sources contribute? What is the influence on the biogeochemical cycle?
filters, real time analyzers, continuous or periodic monitoring depending on species information desired
dust, particle size analyses: pm10, pm 2.5, species, concentration of various species (including trace species), deposition estimates
Particulate matter degrades air quality. It reduces visibility, particularly with increased humidity, and can combine with tropospheric ozone to produce photochemical smog. Photochemical smog has been linked to respiratory ailments in fauna and rduced vigor in floral species (see ozone). Particulates also may transport toxic heavy metals, including mercury,
x x x x x x x x x x
Weather Weather P6 Solar radiation Solar radiation
How are solar radiation inputs, UV-B, photosynthetically active radiation (PAR), or other wavelengths, fluxes changing?
pyranometers, (PAR sensors, UVB radiometers, etc.), satellite data
upwelling & downwelling, direct & diffused; PAR, UVA, UVB
Solar radiation affects plant & algal productivity, and UV wavelengths may cause damage to both plant and animal cells.
x x x x x x x x x x

National Park Service 129
Level 1
Level 2
WASO Vital Sign
VS Id#
"Old" PACN Vital Sign
"New" PACN Vital Sign Monitoring Question(s) Monitoring Method Measures and Metrics Justification
Steve Fancy's Comments A
MM
E
WA
PA
NPS
A
USA
R
KA
LA
HA
LE
ALK
A
PUH
E
KA
HO
PUH
O
Weather P7 Weather & climate
Weather patterns
What are current conditions? What are ranges of climate parameters within each park? Are they changing?
weather stations (RAWS, COOP, NPS-ARD), fog monitors, fuel sticks, soil moisture/temp sensors, wetness sensors, satellite data, lidar data
wind, temperature, precipitation, relative humidity, fog immersion time, fuel moist/temp, soil moisture/temp, wetness,
Measurements of temperature, precipitation, wind, and humidity provide important, supportive information to other studies and indicators. In their own right, they can act as indicators of changing climatic conditions and weather patterns (regional shifts, drought, etc.). A long term meteorological monitoring program is essential to evaluate how meteorological agents of change influence the functioning of ecosystems.
x x x x x x x x x x
Weather P8
Extreme events, long-term patterns (weather & ocean)
Extreme weather events
How frequently do extreme events occur, and at what intensity? What are temporal trends? What is the spatial extent?
data from weather stations and wave/swell monitoring in parks, in addition to data mining, sources: NOAA, USGS, NWS
hurricanes/typhoons, storm waves, high water mark, ENSO, PDO, droughts, floods
Locations, frequency and magnitude of extreme weather events influence biological communities.
This vital sign includes both weather and marine events, and P41 basically covers marine events. We need to either delete P41 or remove the aquatic component from this vital sign.
x x x x x x x x x x
Weather P9
Climate Representations - 2- & 3- dimensional
Weather modeling
How do weather/climate parameters change over varying ranges in space and time?
modeling or mapping trade-wind inversion, wind, temperature, precipitation, cloud patterns, radiation budgets
Measurements of temperature, precipitation, wind, and humidity provide important, supportive information to other studies and indicators. In their own right, they can act as indicators of changing climatic conditions and weather patterns (regional shifts, drought, etc.). A long term meteorological monitoring program is essential to evaluate how meteorological agents of change influence the functioning of ecosystems.
It was suggested that this vital sign be merged with P7 as an additional method.
x x x x x x x x x x
Geology and Soils
Geomorphology
Stream / river channel characteristics
P18 Stream channel habitat dynamics
Stream channel characteristics
Is erosion occurring? Are flow channels changing? Are substrate types changing?
mapping of streambed topology & substrate
bank depth, sinuosity, stream cross-section, stream gradient, substrate size
Changes in stream morphology can be indicative of land-use change. Native Pacific stream species are sensitive to habitat change, while alien species often prefer altered conditions.
x x x x x x x x
Coastal / oceanographic features and processes
P42
Coastal Shoreline Change (erosion & accretion)
Shoreline change
Where are shorelines advancing, retreating, or stable, and what is the rate of change?
historical shoreline analysis (air photos, T-sheets), beach profiles, tide gauge data to examine local sea-level trends, field observations and measurements
human development/infrastructure, substrate composition, shoreline aspect/position/slope, sea level, nearshore physical oceanography, historical shoreline analysis, amount of change (m) over the time span between measurements (years).
Change in shoreline morphology affect both coastal and marine resourcse, such as wetlands, tidepools, coral reefs, and seagrass beds.
x x x x x x x x x x
Windblown features and processes
P43 Dune Change (erosion & accretion)
Dune change Are drought & desertification influencing topsoil transport and seed/nutrient transport patterns?
remote sensing, field investigation, periodic change analysis
grain size & parent material, rainfall, soil crust development, substrate composition, substrate distribution, veg stabilization, wind regime
?

Appendix O: Part IV Vital Signs Workshops
130
Level 1
Level 2
WASO Vital Sign
VS Id#
"Old" PACN Vital Sign
"New" PACN Vital Sign Monitoring Question(s) Monitoring Method Measures and Metrics Justification
Steve Fancy's Comments A
MM
E
WA
PA
NPS
A
USA
R
KA
LA
HA
LE
ALK
A
PUH
E
KA
HO
PUH
O
Hillslope features and processes
P40 Mass Geologic Wasting
Mass geologic wasting
Can we predict slope failure hazards to protect habitats and human safety? Can we monitor or identify causes? What are temporal trends?
Rainfall and other climactic analyses (precursors and catalysts), stream gauges, remote sensing
soil saturation, soil/ground creep, substrate composition/permeability, substrate distribution
Mass geologic wasting is a hazard. ? x x x ? ? x
Subsurface Geologic Processes
Volcanic features and processes
P36
Volcanic Unrest - Ground Deformation
Volcanic ground deformation
What role does volcanic activity and deformation play in maintaining public safety, park facilities, and how do they affect natural processes?
Dry and wet tilt meters, dilatometers, GPS
GPS, subsurface temp, tilt meters Volcanic activity is a hazard. x ? ? ?
Volcanic features and processes
P37 Volcanic Unrest - Lava Flows
Lava flows
What role do lava flows play in maintaining public safety, park facilities, and how do they affect natural processes?
Remote sensing, visual observation, tilt meters and dilatometers, GPS ground deformation
tube mapping, flow direction/magnitude, GPS Volcanic activity is a hazard. x ? ? ?
Seismic activity P38 Seismicity of Non-Volcanic Origin
Non-volcanic seismicity
Can we identify trends and predict hazards?
Seismometers (local and global)
tilt meters, seismometers, dilatometers (pressure gauges), EDM (Electronic Distance Measuring)
Non-volcanic seismicity is a hazard.
WASO would like us to combine volcanic & non-volcanic seismicity eventually.
? ? ? ? ? ? ? ? ? ?
Volcanic features and processes
P39 Seismicity of Volcanic Origin
Volcanic seismicity
Can we identify trends and predict hazards?
Seismometers (local and global)
tilt meters, seismometers, dilatometers (pressure gauges), EDM (Electronic Distance Measuring)
Volcanic seismicity is both a hazard and predictor of surface eruptions.
WASO would like us to combine volcanic & non-volcanic seismicity eventually.
x ? ? x x x x x
Caves / karst features and processes
P45 Cave Geology: non-karst and karst
Cave and karst geology
What are patterns of mineral accretion? Where & when are collapse/skylight formation or enlargement occurring? Are changes in karst systems leading to potential bedrock collapse, well yield disparities, poor groundwater quality, soil instability?
geologic mapping, periodic measurement of physical parameters and feature types, remote sensing, surface water chemistry, groundwater discharge patterns
dimensions, feature size, extent, baseline mapping, groundwater flow/quality
? x x ? ? ? ? ? ?
Caves / karst features and processes
P46 Cave Environmental conditions
Cave and karst environment
How does human activity & cultural practices impact and change cave systems above ground (outside) and inside? How do natural/human induced impacts affect environmental cave conditions (temp, humidity, light, etc.)?
Station/plot data, photo points (repeat photography)
litterfall, Species distribution & abundance, human use levels, temperature, humidity, ground compaction, etc.
Environmental conditions in caves and lava tubes are easily disturbed by human activity. However, caves and lava tubes are often important traditional cultural sites in Hawaii (and elsewhere?).
? x x ? ? ? ? ? ?
Soil Quality Soil erosion P12 Soil Erosion Soil erosion
What are causes and locations of soil erosion, what are rates of change, what is land use and human impact?
erosion pins deployed together and integrated over watershed, sediment collectors, mapping, sediment fingerprinting
Areal distribution of rate of soil loss (mapping), transport out of watershed
Erosion and sedimentation are directly indicative of soil disturbance and provide a good indicator of the rate or extent of land use change. When suspended in water, fine sediments increase turbidity, decrease light penetration, and alter primary productivity. Sediment particles < 63 micrometers in size are frequently adsorbed to by a variety of contaminants, especially nutrients and heavy metals (Wood and Armitage 1997). In some cases excessive sediment accumulation can alter the hydrologic regime.
x x x ? x x x x x x

National Park Service 131
Level 1
Level 2
WASO Vital Sign
VS Id#
"Old" PACN Vital Sign
"New" PACN Vital Sign Monitoring Question(s) Monitoring Method Measures and Metrics Justification
Steve Fancy's Comments A
MM
E
WA
PA
NPS
A
USA
R
KA
LA
HA
LE
ALK
A
PUH
E
KA
HO
PUH
O
Soil biota P13 Soil Quality - Biological Soil biota What are soil communities, and
are they changing? Soil sampling and analysis
bacteria, fungal/microrhizzal, worms/nematodes/arthropods, bulk density
Soil biota can be excellent integrated indicators of climate change (Rillig, et al., 1999; Soil Biota and Climate Change, 1998), land use fragmentation, soil chemistry and nutrient cycling (Hendrix, et al. 1998), physical qualities, and recovery from past disturbances. Some of the biota respond strongly to minor changes in soil temperature regimes, chemistry, moisture conditions, soil physical structure, and organic matter qualities/input.
x x x ? x x x x x x
Soil chemistry- nitrogen/sulphur
P14 Soil Quality- Chemical Soil chemistry Are soil buffering and filtering
qualities changing? Soil sampling and analysis
appropriate WQ measures, cations, pH, soil composition, Total Nitrogen & Total Carbon
Soil quality is a particularly important attribute of ecosystem function. Soil structure, percolation, carbon content (both elemental and organic), profile condition (especially A and B horizons), litter layer condition, soil surface stability, and mineral soil exposure are all valuable measures of soil quality. Of these, the greatest response may be detected in litter layer conditions and soil carbon content. These attributes integrate a large number of factors and represent a sensitive early warning of change. Soil carbon can be related to productivity changes, soil chemistry, and community changes which in turn relate to a wide number of the stressors.
x x x ? x x x x x x
Soil organic matter P15 Soil Quality-
Physical Soil physical properties
Are physical soil properties changing?
Soil sampling and analysis
DOC, grain size, moisture content, parent material, percent organic matter, permeability, POC
Soil quality is a particularly important attribute of ecosystem function. Soil structure, percolation, carbon content (both elemental and organic), profile condition (especially A and B horizons), litter layer condition, soil surface stability, and mineral soil exposure are all valuable measures of soil quality. Of these, the greatest response may be detected in litter layer conditions and soil carbon content. These attributes integrate a large number of factors and represent a sensitive early warning of change. Soil carbon can be related to productivity changes, soil chemistry, and community changes which in turn relate to a wide number of the stressors.
x x x ? x x x x x x
Biological soil crusts P16
Soil Crust Change (Arid-Semiarid habitats)
Biological soil crusts
Where are soil crusts broken, what are pressures/impacts on soil crusts, and how are they distributed in space and time?
soil and geologic mapping, remote sensing, periodic change analysis
distribution of soil crusts, pH, rainfall, substrate composition, volcanic aerosol composition, wind spd/dir
Biological soil crusts are fragile communities important in controlling erosion and chemical processes in arid ecosystems. (How much of this do we actually have?)
? ? ? ?
Permafrost P44 Permafrost on Big Island summits
Permafrost Is extent of permafrost declining? Influence on ground subsidence, slope failure, etc?
Remote Sensing (ground penetrating radar), satellite thermal analysis, drilling
temperature, volcanic activity (heating), permafrost thickness, rainfall
We don't actually know if we have permafrost.
Water Hydrology
Marine hydrology P10
Ocean physical dynamics: relative sea level, tides, swells
Marine hydrology
What is the natural variability? What are temporal trends?
tide gauge, ADCP, GIS, buoy data, satellite data
maximum signal wave height, relative sea level, tide fluctuations
An understanding of marine hydrology is importint in predicting the effects of storms and high wave events on marine resources.
x x x x x x x x x x
Marine hydrology P41 Marine
Inundation Extreme coastal events
What area the frequency and magnitude and distribution of marine inundation events, what park resources are subject to inundation during stream flooding, tsunamis, and large storms or big wave events?
Tide gauges, seismic networks, rain gauges, stream gauges, oceanic buoys, field mapping of water and debris lines (both horizontal incursion and vertical elevation)after an event, photograph damage and changes to park resources
water (sea) levels, erosion/deposition, extent, discharge
Coastal inundations affect natural coastal resources such as wetlands, shorelines, & tidepools.
See notes for P8. x x x x x x x x x x

Appendix O: Part IV Vital Signs Workshops
132
Level 1
Level 2
WASO Vital Sign
VS Id#
"Old" PACN Vital Sign
"New" PACN Vital Sign Monitoring Question(s) Monitoring Method Measures and Metrics Justification
Steve Fancy's Comments A
MM
E
WA
PA
NPS
A
USA
R
KA
LA
HA
LE
ALK
A
PUH
E
KA
HO
PUH
O
Surface water dynamics P17
Flowing surface water hydrology
Stream dynamics
What are usual rates & range of flow? What is timing & magnitude of floods or low-flow events? What is the spatial distribution of the flow in question? What are base flow volume and seasonal trends?
gauges, sampling at permanent sites, flow regionalization
discharge / recharge over space & time, diversion patterns, flood timing / magnitude
Hydrologic changes concern stream high and low flows in response to weather events, effects on aquatic life, and impacts to recreation and aesthetics. The terrestrial concern with these changes is related to water table drawdown (loss of small wetland habitats), riparian habitat loss, and stream bank scouring that can lead to erosion/sedimentation and associated habitat degradation, as well as invasion by exotic plants. Pacific Island streams typically have frequent and unpredictable periods of high flow associated with rainfall (e.g., Oki & Brasher 2003). These flooding events can be hazardous to human life, but are important to the maintenance of habitat for native species.
x x x x x x x x
Surface water dynamics P20 Wetland
hydrology Wetland dynamics
What are freshwater/saltwater recharge rates? What is habitat extent and distribution? What are temporal trends in recharge rates and habitat extent? What are groundwater levels, residence times, infiltration, permeability, and evaporation in wetlands? What is the relationship between groundwater and wetlands in anchialine pools? Includes wetlands, anchialine pools, bogs, and lakes.
measure salinity, residence time, mapping, samples from wells
flood timing/magnitude, flow, parent material/geomorphology, plant cover/ species present, pool size, depth & salinity, rainfall, sediment loads, pH, tidal fluctuation, stream cross-section, stream discharge, stream gradient, bank erosion, sedimentation patterns
An understanding of wetland hydrology is required for predicting the effects of natural and human-induced hydrological changes (e.g., sea level rise, drought conditions, municipal groundwater withdrawal) and the fate of contaminants on wetland systems (Weiskel and Howes 1992, Martin 1993, Urish et al. 1993).
x x ? x x x x x x
Groundwater dynamics P21 Groundwater
dynamics Groundwater dynamics
What are rates of subsurface flow? What is level of freshwater/saltwater mixing? What are flow patterns?
well, seep, & spring discharge measurements
discharge/recharge, injections (sewage), permeability, tide fluctuations, withdrawal & consumption rates, salinity, seepage
An understanding of water table levels is required for predicting the effects of natural and human-induced hydrological changes (e.g., sea level rise, drought conditions, municipal groundwater withdrawal) and the fate of contaminants (e.g., landfill leachate) (Weiskel and Howes 1992, Martin 1993, Urish et al. 1993). Groundwater may be the significant water source for certain ripariain systems, wetlands, and municipal water supplies (sole-source aquifers).
x x x ? x x x x x x
Surface water dynamics
P19 (delete H6)
Water diversion levels
Water diversion levels
What proportion of water is being made unavailable for aquatic biota and designated uses?
gages, wells, sampling at permanent sites
relative quantity of water being diverted, seasonal, spatial & temporal diversion patterns
Diversion of surface water for agriculture and industry and withdrawal of groundwater for human consumption is one of the most significant stressors to freshwater biota on Pacific Islands. Water diversion reduces base flow in streams, thereby decreasing habitat availability, flow velocity, and channel size (Brasher 1997). Other effects of stream diversion include dampening of both the frequency and magnitude of periodic flooding events (Brasher 1997) and lowering the water table, which shrinks wetlands. The degree of water diversion varies from island to island and park to park.
x x x x ? x x x x
Water Quality
Water chemistry/ Water quality - nutrients ??
P22
Ground Water Quality Network Core parameters
Ground water quality-core parameters
What are the range and variance of the network core water quality parameters? What are the temporal and spatial trends?
water sampling from dedicated monitoring wells in addition to supply wells
temperature, pH, salinity (sp. cond.), dissolved oxygen, total nitrogen, total phosphorous, depth
These protocols provide required minimum baseline data for water quality assessment and are used throughout the National Park Service.
x x x ? x x x x x x
Water chemistry/ Water quality - nutrients
P23
Marine Water Quality Network Core parameters
Marine water quality-core parameters
What are the range and variance of the network core water quality parameters? What are the temporal and spatial trends?
in-situ measurements and collection of samples at established sites including controls
temperature, pH, salinity (sp. cond.), dissolved oxygen, PAR, total nitrogen, total phosphorous, chlorophyll a, depth
These protocols provide required minimum baseline data for water quality assessment and are used throughout the National Park Service.
x x x x x x x x x x

National Park Service 133
Level 1
Level 2
WASO Vital Sign
VS Id#
"Old" PACN Vital Sign
"New" PACN Vital Sign Monitoring Question(s) Monitoring Method Measures and Metrics Justification
Steve Fancy's Comments A
MM
E
WA
PA
NPS
A
USA
R
KA
LA
HA
LE
ALK
A
PUH
E
KA
HO
PUH
O
Water chemistry/ Water quality - nutrients
P24
Surface Water Quality Network Core parameters
Surface water quality-core parameters
What are the range and variance of the network core water quality parameters? What are the temporal and spatial trends?
in-situ measurements and collection of samples at established sites including controls
temperature, pH, salinity (sp. cond.), dissolved oxygen, PAR, total nitrogen, total phosphorous, chlorophyll a, depth
These protocols provide required minimum baseline data for water quality assessment and are used throughout the National Park Service.
x x x x x x x x x
Water chemistry/ Water quality - nutrients
P25
Ground Water Quality Supplemental parameters
Ground water quality-supplemental parameters
What are the range and variance of the supplemental water quality parameters? What are the temporal and spatial trends?
water sampling from dedicated monitoring wells in addition to supply wells
inorganic nutrients (NO2/NO3, PO4, NH4, SiO4), alkalinity, anions, cations, redox, total organic carbon, suspended sediments.
x x x ? x x x x x x
Water chemistry/ Water quality - nutrients
P26
Marine Water Quality Supplemental parameters
Marine water quality-supplemental parameters
What are the range and variance of the supplemental water quality parameters? What are the temporal and spatial trends?
in-situ measurements and collection of samples at established sites including controls
inorganic nutrients (NO2/NO3, PO4, NH4), suspended sediments/turbidity/secchi disk, alkalinity, anions, cations, redox, total organic carbon, chlorophyll b, chlorophyll c
x x x x x x x x x x
Water chemistry/ Water quality - nutrients
P27
Surface Water Quality Supplemental parameters
Surface water quality-supplemental parameters
What are the range and variance of the supplemental water quality parameters? What are the temporal and spatial trends?
in-situ measurements and collection of samples at established sites including controls
inorganic nutrients (NO2/NO3, PO4, NH4), suspended sediments/turbidity/secchi disk, alkalinity, anions, cations, redox, total organic carbon, chlorophyll b, chlorophyll c
x x x x x x x x x
Water quality - microorganisms
P28 Ground Water Quality - Microbiology
Ground water quality-microorganisms
What are the range and variance of microbial water quality parameters? What are the temporal and spatial trends?
water sampling from dedicated monitoring wells in addition to supply wells
bacteria, viruses, protozoans, biological oxygen demand
Measurement of coliform content can be indicative of human and animal waste problems upstream and can relate to storm water discharge from urbanizing landscapes.
x x x ? x x x x x x
Water quality - microorganisms
P29 Marine Water Quality - Microbiology
Marine water quality-microorganisms
What are the range and variance of microbial water quality parameters? What are the temporal and spatial trends?
collection of samples at established sites including controls
bacteria, viruses, protozoans, biological oxygen demand
Measurement of coliform content can be indicative of human and animal waste problems upstream and can relate to storm water discharge from urbanizing landscapes.
x x x x x x x x x x
Water quality - microorganisms
P30 Surface Water Quality - Microbiology
Surface water quality-microorganisms
What are the range and variance of microbial water quality parameters? What are the temporal and spatial trends?
collection of samples at established sites including controls
bacteria, viruses, protozoans, biological oxygen demand
Measurement of coliform content can be indicative of human and animal waste problems upstream and can relate to storm water discharge from urbanizing landscapes.
x x x x x x x x x
Water quality - toxics P31
Ground Water Quality - Toxics & contaminants
Ground water quality-toxics
What are the range and variance of toxics and contaminants in groundwater? What are the temporal and spatial trends?
water sampling from dedicated monitoring wells in addition to supply wells use of fat bags (SPMDs)
chemical oxygen demand, heavy metals, herbicides, organics, pesticides
Water quality concerns are with off-site pollution, inappropriate visitor use, atmospheric deposition (stream acidification), water pollution effects on use of water resources, and loss of aquatic biota.
x x x ? x x x x x x
Water quality - toxics P32
Marine Water Quality - Toxics & contaminants
Marine water quality-toxics
What are the range and variance of toxics and contaminants in marine water? What are the temporal and spatial trends?
water sampling, sediment sampling, animal tissue sampling
chemical oxygen demand, heavy metals, herbicides, organics, pesticides, bioassays
Water quality concerns are with off-site pollution, inappropriate visitor use, atmospheric deposition (stream acidification), water pollution effects on use of water resources, and loss of aquatic biota.
x x x x x x x x x x
Water quality - toxics P33
Surface Water Quality - Toxics & contaminants
Surface water quality-toxics
What are the range and variance of toxics and contaminants in surface water? What are the temporal and spatial trends?
water sampling, sediment sampling, animal tissue sampling
chemical oxygen demand, heavy metals, herbicides, organics, pesticides, bioassays
Water quality concerns are with off-site pollution, inappropriate visitor use, atmospheric deposition (stream acidification), water pollution effects on use of water resources, and loss of aquatic biota.
x x x x x x x x x
Water quality - macroinvertebrates and algae
P34
Biotic Indicators of Marine Water Quality
Marine water quality-macroinvertebrates and algae
Are benthic invertebrate & algal communities indicative of impaired water quality?
Periodic benthic quadrat sampling (sediment & sessile organisms).
species richness, composition, biomass, presence/absence of indicator species
Aquatic organisms, especially non-mobile ones, provide a time-integrated record of water quality at a site (e.g., Zolan 1981). However, this area needs more research in the Pacific before this vital sign can be applied.
x x x x x x x x x x

Appendix O: Part IV Vital Signs Workshops
134
Level 1
Level 2
WASO Vital Sign
VS Id#
"Old" PACN Vital Sign
"New" PACN Vital Sign Monitoring Question(s) Monitoring Method Measures and Metrics Justification
Steve Fancy's Comments A
MM
E
WA
PA
NPS
A
USA
R
KA
LA
HA
LE
ALK
A
PUH
E
KA
HO
PUH
O
Water quality - macroinvertebrates and algae
P35
Biotic Indicators of Surface Water Quality
Surface water quality-macroinvertebrates and algae
Are benthic invertebrate & algal communities indicative of impaired water quality?
Periodic benthic quadrat sampling.
species richness, composition, biomass, presence/absence of indicator species
Aquatic organisms, especially non-mobile ones, provide a time-integrated record of water quality at a site (e.g., Zolan 1981). However, this area needs more research in the Pacific before this vital sign can be applied.
x x x x x x x x x
Biological Integrity
Invasive Species
H4
Alien Invasive Species Points/Pathways of Entry
Invasive species: early warning and modeling
How are invasive species getting to the country/state/island/park? What potential high-impact species have breached the border-protection system and have potential to reach the park?
Identify existing and new points & pathways of entry. Monitor for incipient species along known points/ pathways of entry. Identify targeted "blacklist" species of concern that warrant eradication/containment.
Presence-absence, identification & distribution of targeted "blacklist" species & other novel (previously undetected) invasives.
Concern about ecological damage from exotic invasive species involves impacts to native flora and fauna, natural disturbance regimes, and ecosystem functions. Especially among these are concerns for threatened and endangered species sustainability and loss of more common species. Invasive exotic species include both terrestrial & aquatic flora not native to the region that aggressively affect native species.
x x x x x x x x x x
Invasive plants T14 Established Alien Species - Plants
Invasive species: established plants
What is the distribution and abundance of established alien plants (including mosses)? What is the rate of spread of alien plants? What is the relative abundance of native and invasive species? What are the impacts on native species of vascular and nonvascular plants? What is the potential of alien plant species to invade and dominate communities?
Mapping, transects, plots, counts in size classes. Soil cores and subplots for seed banks.
Distribution mapping, frequency, cover, density and population structure of alien and native species. Species composition of seedbanks.
In the Pacific Island Parks, alien species invasions have altered many ecosystems and vegetation components of cultural landscapes by displacement of native species and increased habitat fragmentation. Monitoring changes in native ecosystems and vegetation components of cultural landscapes allows park managers to understand habitat loss, control alien species, and restore natural vegetation
x x x ? x x x x x x
Invasive plants & fungi T15
Alien Incipient Invasive Vascular and Non-vascular Plants and Fungi
Invasive species: early warning & modeling of plants and fungi
What potential high-impact species have breached the border-protection system and have potential to reach the park? What is the nature and extent of infestation? Is eradication/containment feasible and where should efforts be focused? Is alien species present in park, and if so, what is the nature and extent of infestation? What is the mode of dispersal through which the species entered the park? What are potential impacts on native species or communities? What are the most likely invaders of parks?
Shared surveillance by multiple agencies and public, including follow-up on reports; surveys in high- risk sites inside and outside parks (eg.roadsides, trails, ports, disturbed sites). Observations of seed dispersers and collection of seed rain information. Soil cores and subplots for seed banks. Monitoring of pathwasys and ports of enty: surveys in high-risk sites (e.g. roadsides, trails, ports, disturbed sites), monitoring of specific buffer zones around areas of special concern within the park; rapid assessment of extent of infestation
Presence/ absence, assessment of extent of infestation. Density and size class of impacted native plant populations. Species composition of affected native communities. Species composition of seedbanks. Identification and distibution of targeted "blacklist" species and other (previously undetected) invasives.
Some of these species may dramatically alter natural vegetation or vegetation elements of cultural landscapes. Assessing the threat posed by incipient invasive species and detecting their presence are important monitoring functions for Pacific Island Parks to insure proactive and cost-effective management
x x x x x x x x x x

National Park Service 135
Level 1
Level 2
WASO Vital Sign
VS Id#
"Old" PACN Vital Sign
"New" PACN Vital Sign Monitoring Question(s) Monitoring Method Measures and Metrics Justification
Steve Fancy's Comments A
MM
E
WA
PA
NPS
A
USA
R
KA
LA
HA
LE
ALK
A
PUH
E
KA
HO
PUH
O
Invasive ungulates T26
Status of Established Alien Feral Ungulates, and Response to Treatment
Invasive species: established ungulates
What are the relative abundance, distribution, and population trends of feral ungulates? Are native plant and animal species' abundance or distribution changing in response to feral ungulates, or in response to efforts to control feral ungulates?
Treatment and control transects, plots, or sites using appropriate methods to assess both invasive and native organisms of interest (VCP, transects, etc.); surveys for predators using appropriate methods to estimate population size and distributionTreatment and control Transects/plots (for plants); other methods appropriate for native vertebrates of interest (VCP, transects, etc.); population surveys for predators
Plants: species composition, population and/or community structure. Animals: abundance or density, possibly presence/absence, and/or other measures of critical life stages identified as impacted by predators. Predators: population indices, presence/ absence, mapping.Plants: species composition, population and/or community structure. Animals: VCP, transects, other methods to monitor critical life stages identified as impacted by predators. Predator population indices, presence/ absence
Concern about ecological damage from exotic invasive species involves impacts to native flora and fauna, natural disturbance regimes, and ecosystem functions. Especially among these are concerns for threatened and endangered species sustainability and loss of more common species. Invasive exotic species include both terrestrial and aquatic fauna, insects, diseases, and pathogens not native to the region that aggressively affect native species.
x x x x x ? ? x
Invasive terrestrial invertebrates
T27
Established Alien Species - Invasive Terrestrial Invertebrate Pests of Natural Systems
Invasive species: established terrestrial invertebrate pests
What are the abundance, distribution, and seasonal and year-to-year variations in populations? What are trends in impact? How effective is control?
Population surveys, transects, plots, mapping
Abundance, density, demographics, distribution of aliens and native indicator species
The establishment of different invasive animals has different consequences for native communities, depending on such factors as the invasive species’ behavior and feeding and habitat preferences. Invasive aquatic species can either predate upon or compete for food with natives. Introduction of invasive aquatic species which occupy different ecological niches than natives can have indirect effects, such as introduction of parasites or alteration of habitat.
x x x x x x x x x
Invasive terrestrial invertebrates
T28
Status of Established Alien Predatory and Omnivorous Terrestrial Vert Species, and Response to Treatment
Invasive species: established terrestrial invertebrate predators
Are native plant and animal species' abundance or distribution changing in response to predatory or omnivorous invasives, or in response to efforts to control these invasives? What are trends in predatory and omnivorous invasive species populations?
Treatment and control transects, plots, or sites using appropriate methods to assess both invasive and native organisms of interest (VCP, transects, etc.); surveys for predators using appropriate methods to estimate population size and distribution.
Plants: species composition, population and/or community structure. Animals: abundance or density, possibly presence/absence, and/or other measures of critical life stages identified as impacted by predators. Predators: population indices, presence/ absence, mapping.
The establishment of different invasive animals has different consequences for native communities, depending on such factors as the invasive species’ behavior and feeding and habitat preferences. Invasive aquatic species can either predate upon or compete for food with natives. Introduction of invasive aquatic species which occupy different ecological niches than natives can have indirect effects, such as introduction of parasites or alteration of habitat.
x x x x x x x x x
Invasive terrestrial invertebrates
T29
Established Alien Species - Terrestrial Invertebrate Pests of Agricultural Systems (including traditional cultivation)
Invasive species: established terrestrial invertebrate agricultural pests
What are the abundance, distribution, and seasonal and year-to-year variations in populations? What are trends in impact? How effective is control?
Population surveys, transects, plots, mapping
Infestation rates of native and alien hosts
Concern about ecological damage from exotic invasive species involves impacts to native flora and fauna, natural disturbance regimes, and ecosystem functions. Especially among these are concerns for threatened and endangered species sustainability and loss of more common species.
x x x x x x x x x

Appendix O: Part IV Vital Signs Workshops
136
Level 1
Level 2
WASO Vital Sign
VS Id#
"Old" PACN Vital Sign
"New" PACN Vital Sign Monitoring Question(s) Monitoring Method Measures and Metrics Justification
Steve Fancy's Comments A
MM
E
WA
PA
NPS
A
USA
R
KA
LA
HA
LE
ALK
A
PUH
E
KA
HO
PUH
O
Invasive terrestrial invertebrates
T30
Established Alien Species - Terrestrial Invertebrate Pests (human structures)
Invasive species: established terrestrial invertebrate pests of human structures
What is the impact of invertebrate pests on historic and other culturally significant structures?
Periodic sampling of structures
Infestation rates, structural damage
Concern about ecological damage from exotic invasive species involves impacts to native flora and fauna, natural disturbance regimes, and ecosystem functions. Especially among these are concerns for threatened and endangered species sustainability and loss of more common species.
x x x x x x x x x
Invasive terrestrial vertebrates
T31
Targeted monitoring for (incipient) invasive terrestrail vertebrate species known to pose potential threats
Invasive species: early warning & modeling of terrestrial vertebrates
What potential high-impact species have breached the border-protection system and have potential to reach the park? What is the nature and extent of infestation? Is eradication/containment feasible and where should efforts be focused? What are potential impacts? Is species present in park? If so, what is the nature and extent of infestation? Are native plant and animal species' abundance or distribution changing in response to the invasive or its control? What are the pathways and points of entry?
Detection: surveys in high- risk sites; follow up on reports; education and outreach to encourage public reporting. Impacts and reponse to treatment: treatment and control transects, plots, or sites using appropriate methods to assess both invasive and native organisms of interest (VCP, transects, etc.); surveys for non-established predators using appropriate methods to estimate population size and distribution.
Identification & distribution of targeted 'blacklist' and other novel (previously undetected) invasives. Presence/ absence; predator population indices and mapping; rapid assessment of infestation extent. Native plants: species composition, population and/or community structure; native animals: abundance or density, possibly presence/absence, and/or other measures of critical life stages identified as impacted by predators.
Alien species invasions can impact native animals by predation; competition; facilitating the introduction of alien diseases and parasites; and displacing food supply, roost sites or other important habitat components. Invasive species may be even more damaging to native species and ecosystems on a global scale than the loss and degradation of habitats.
x x x x x x x x x x
Invasive terrestrial invertebrates
T32
Alien Incipient Invasives - Terrestrial Invertebrates
Invasive species: early warning & modeling of terrestrial invertebrates
What potential high-impact species have breached the border-protection system and have potential to reach the park? What is the nature and extent of infestation? Is eradication/containment feasible and where should efforts be focused? Which species are present in park? What is the nature and extent of infestation? Where should efforts be focused? What are potential impacts?
Active monitoring (transects, plots,light trapping, etc.) in high-risk sites;rapid assessment of extent of infestation; mapping of new discoveries; education, outreach, and public reporting, follow-up on reports
Identification & distribution of targeted 'blacklist' and other novel (previously undetecteed) invasives. Presence/absence, distribution, rapid assessment of extent of infestation
The establishment of different invasive animals has different consequences for native communities, depending on such factors as the invasive species’ behavior and feeding and habitat preferences. Invasive terrestrial species can either predate upon or compete for food with native animals. Introduction of invasive terrestrial species which occupy different ecological niches than natives can affect patterns of herbivory, disturbance regimes, and natural ecosystem function.
x x x x x x x x x x
Invasive freshwater plants
F3
Established aquatic/wetland invasive plant & algal species distribution & abundance
Invasive species: established freshwater & wetland plants and algae
What is the present extent of occurrence? Are there changes in extent over time?
Periodic transects & plot surveys, mapping.
presence/absence, trends in abundance, distribution and density
Alien plant and algal species can serve as important indicators of ecosystem health. Invasive plant and algal species can impede water flow (filamentous algae and grasses), increase sediment deposition (mangrove and grasses), change patterns of organic matter input (fruit-bearing or nitrogen fixing plants), exclude native plants, and provide an inferior food source for aquatic herbivores. Alien and invasive species are capable of invading and significantly altering ecosystem composition, structure and function - often out-competing and excluding native species (e.g., Harwell et al. 1999, Cuddigy and Stone 1990). The Invasive Species Act of 1996 mandates federal agencies to manage these species.
x x x x x x x x x x

National Park Service 137
Level 1
Level 2
WASO Vital Sign
VS Id#
"Old" PACN Vital Sign
"New" PACN Vital Sign Monitoring Question(s) Monitoring Method Measures and Metrics Justification
Steve Fancy's Comments A
MM
E
WA
PA
NPS
A
USA
R
KA
LA
HA
LE
ALK
A
PUH
E
KA
HO
PUH
O
Invasive freshwater plants
F4
Incipient aquatic/wetland invasive plant & algal species distribution & abundance
Invasive species: early warning & modeling of freshwater & wetland plants and algae
Is species present nearby? If so, what is the present extent and nature of occurrence? What are potential pathways for dispersal?
Periodic sampling of freshwater habitats outside of parks (transects & surveys, mapping), including identified pathways of dispersal.
presence/absence, trends in abundance, distribution and density
Alien plant and algal species can serve as important indicators of ecosystem health. Invasive plant and algal species can impede water flow (filamentous algae and grasses), increase sediment deposition (mangrove and grasses), change patterns of organic matter input (fruit-bearing or nitrogen fixing plants), exclude native plants, and provide an inferior food source for aquatic herbivores. Assessing the threat posed by incipient invasive species and detecting their presence are important monitoring functions for Pacific Island parks to insure proactive and cost-effective management.
x x x x x x x x x x
Invasive freshwater animals
F8
Established aquatic invasive animal species distribution & abundance
Invasive species: established freshwater animals
What is the present extent of occurrence? Are there changes in extent over time?
Periodic quadrat netting/trapping, visual transect censuses, mapping.
presence/absence, trends in abundance, distribution and density
The establishment of different invasive animals has different consequences for native communities, depending on such factors as the invasive species’ behavior and feeding and habitat preferences. Invasive aquatic species can either predate upon or compete for food with natives. An example of this is the introduction of water surface-feeding topminnows, which have a profound predatory impact on native aquatic insect larvae, in contrast to bottom-feeding native gobies (Englund 1999). Conversely, the introduction of alien prey species can alter the diet of native predators (Kido et al. 1993). Introduction of invasive aquatic species which occupy different ecological niches than natives can have indirect effects, such as introduction of parasites or alteration of habitat.
? x x x x x x x x
Invasive freshwater animals
F9
Incipient aquatic invasive animal species distribution & abundance
Invasive species: early warning & modeling of freshwater animals
Is species present nearby? If so, what is the present extent and nature of occurrence? What are potential pathways for dispersal?
Periodic sampling of freshwater habitats outside of parks (quadrat netting/trapping, visual transect censuses, mapping), including identified pathways of dispersal.
presence/absence, trends in abundance, distribution and density
The establishment of different invasive animals has different consequences for native communities, depending on such factors as the invasive species’ behavior and feeding and habitat preferences. Invasive aquatic species can either predate upon or compete for food with natives. An example of this is the introduction of water surface-feeding topminnows, which have a profound predatory impact on native aquatic insect larvae, in contrast to bottom-feeding native gobies (Englund 1999). Conversely, the introduction of alien prey species can alter the diet of native predators (Kido et al. 1993). Introduction of invasive aquatic species which occupy different ecological niches than natives can have indirect effects, such as introduction of parasites or alteration of habitat.
x x x x x x x x x x
Invasive marine species M11
Marine alien/invasive extent and occurrence
Invasive species: established marine species
What are the trends in the incidence and level of infestation of alien/invasive species?
Population surveys, transects, quadrats, mapping
Presence/absence, trends in abundance, distribution and density, demography?, lab taxonomy?
The establishment of different invasive animals has different consequences for native communities, depending on such factors as the invasive species’ behavior and feeding and habitat preferences. Invasive aquatic species can either predate upon or compete for food with natives. Introduction of invasive aquatic species which occupy different ecological niches than natives can have indirect effects, such as introduction of parasites or alteration of habitat. Alien and invasive species are capable of invading and significantly altering ecosystem composition, structure and function - often out-competing and excluding native species (e.g., Harwell et al. 1999, Cuddigy and Stone 1990). Marine invasives species are receiving increasing scientific and public attention. There are now severe outbreaks of some species on some reefs in the Pacific. These species, their ecological consequences and possible means of control are subjects of very active research. The magnitude and geographic extent of this problem is not adequatly known.
x x x x x x x x x x
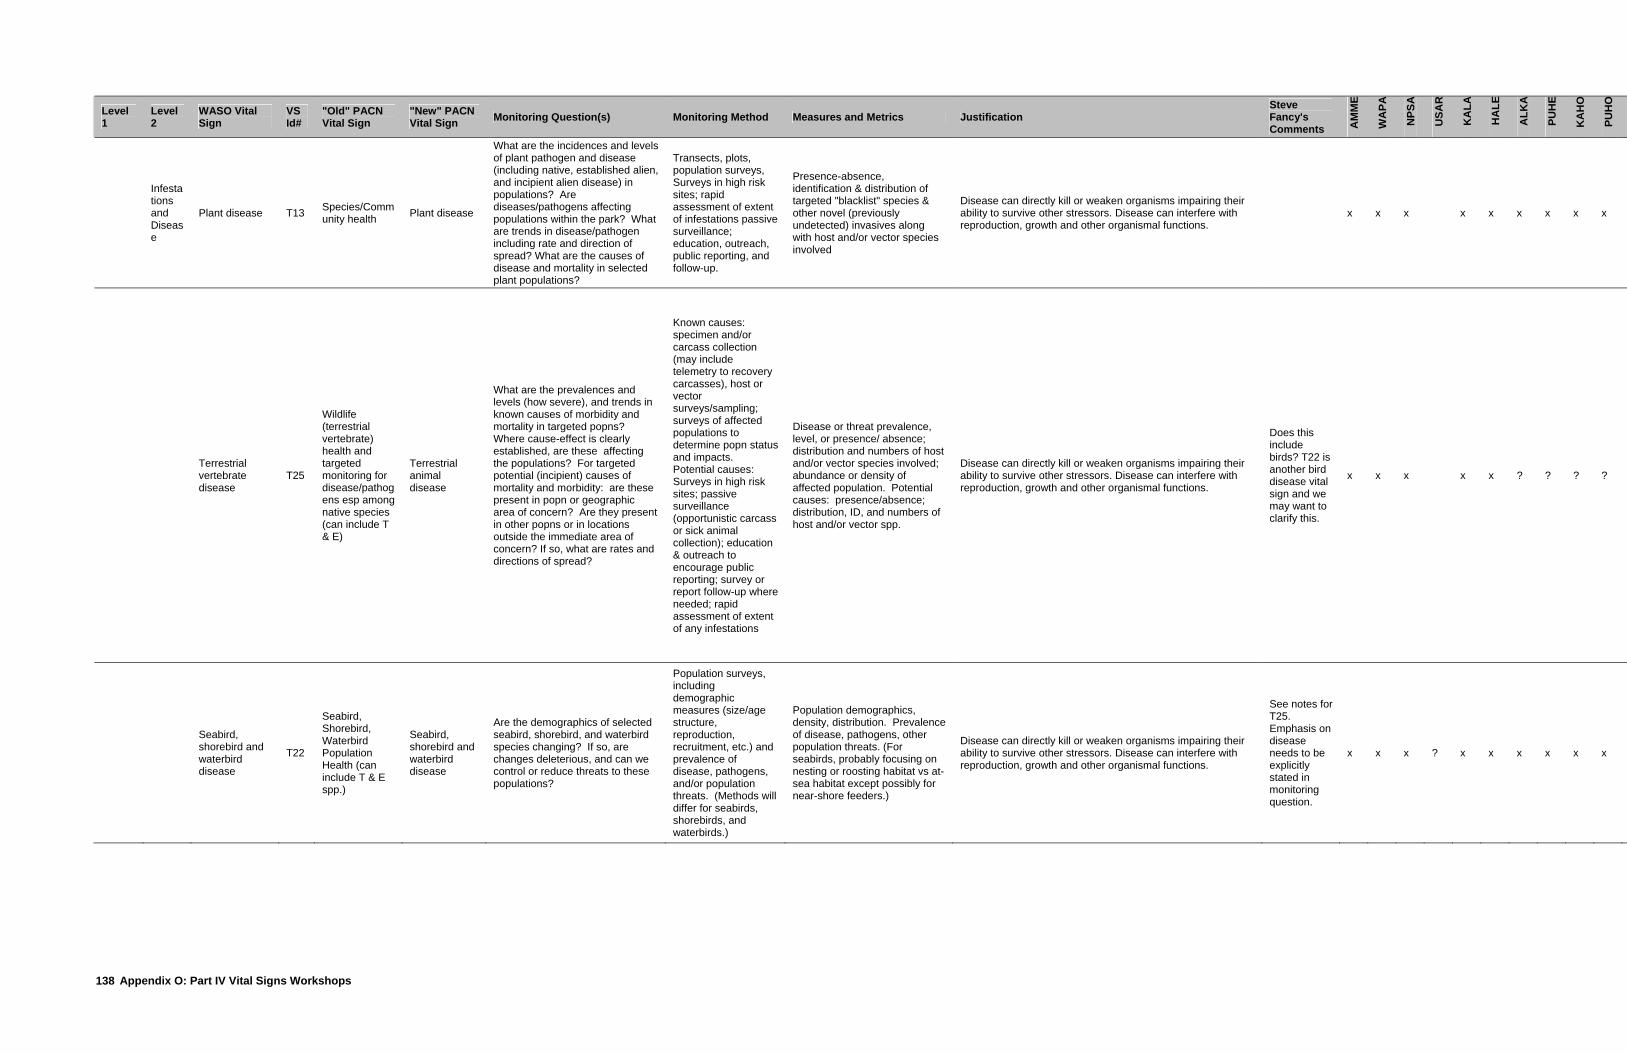
Appendix O: Part IV Vital Signs Workshops
138
Level 1
Level 2
WASO Vital Sign
VS Id#
"Old" PACN Vital Sign
"New" PACN Vital Sign Monitoring Question(s) Monitoring Method Measures and Metrics Justification
Steve Fancy's Comments A
MM
E
WA
PA
NPS
A
USA
R
KA
LA
HA
LE
ALK
A
PUH
E
KA
HO
PUH
O
Infestations and Disease
Plant disease T13 Species/Community health Plant disease
What are the incidences and levels of plant pathogen and disease (including native, established alien, and incipient alien disease) in populations? Are diseases/pathogens affecting populations within the park? What are trends in disease/pathogen including rate and direction of spread? What are the causes of disease and mortality in selected plant populations?
Transects, plots, population surveys, Surveys in high risk sites; rapid assessment of extent of infestations passive surveillance; education, outreach, public reporting, and follow-up.
Presence-absence, identification & distribution of targeted "blacklist" species & other novel (previously undetected) invasives along with host and/or vector species involved
Disease can directly kill or weaken organisms impairing their ability to survive other stressors. Disease can interfere with reproduction, growth and other organismal functions.
x x x x x x x x x
Terrestrial vertebrate disease
T25
Wildlife (terrestrial vertebrate) health and targeted monitoring for disease/pathogens esp among native species (can include T & E)
Terrestrial animal disease
What are the prevalences and levels (how severe), and trends in known causes of morbidity and mortality in targeted popns? Where cause-effect is clearly established, are these affecting the populations? For targeted potential (incipient) causes of mortality and morbidity: are these present in popn or geographic area of concern? Are they present in other popns or in locations outside the immediate area of concern? If so, what are rates and directions of spread?
Known causes: specimen and/or carcass collection (may include telemetry to recovery carcasses), host or vector surveys/sampling; surveys of affected populations to determine popn status and impacts. Potential causes: Surveys in high risk sites; passive surveillance (opportunistic carcass or sick animal collection); education & outreach to encourage public reporting; survey or report follow-up where needed; rapid assessment of extent of any infestations
Disease or threat prevalence, level, or presence/ absence; distribution and numbers of host and/or vector species involved; abundance or density of affected population. Potential causes: presence/absence; distribution, ID, and numbers of host and/or vector spp.
Disease can directly kill or weaken organisms impairing their ability to survive other stressors. Disease can interfere with reproduction, growth and other organismal functions.
Does this include birds? T22 is another bird disease vital sign and we may want to clarify this.
x x x x x ? ? ? ?
Seabird, shorebird and waterbird disease
T22
Seabird, Shorebird, Waterbird Population Health (can include T & E spp.)
Seabird, shorebird and waterbird disease
Are the demographics of selected seabird, shorebird, and waterbird species changing? If so, are changes deleterious, and can we control or reduce threats to these populations?
Population surveys, including demographic measures (size/age structure, reproduction, recruitment, etc.) and prevalence of disease, pathogens, and/or population threats. (Methods will differ for seabirds, shorebirds, and waterbirds.)
Population demographics, density, distribution. Prevalence of disease, pathogens, other population threats. (For seabirds, probably focusing on nesting or roosting habitat vs at-sea habitat except possibly for near-shore feeders.)
Disease can directly kill or weaken organisms impairing their ability to survive other stressors. Disease can interfere with reproduction, growth and other organismal functions.
See notes for T25. Emphasis on disease needs to be explicitly stated in monitoring question.
x x x ? x x x x x x

National Park Service 139
Level 1
Level 2
WASO Vital Sign
VS Id#
"Old" PACN Vital Sign
"New" PACN Vital Sign Monitoring Question(s) Monitoring Method Measures and Metrics Justification
Steve Fancy's Comments A
MM
E
WA
PA
NPS
A
USA
R
KA
LA
HA
LE
ALK
A
PUH
E
KA
HO
PUH
O
Freshwater animal disease & parasites
F6
Disease & parasites of freshwater animals
Freshwater animal disease
What is the incidence and level of disease in populations of freshwater animals?
Visual surveys of possibly affected populations, opportunistic collections of dead animals, tissue samples from non-native vector species
disease/parasite occurrence & frequency
Disease can directly kill or weaken organisms impairing their ability to survive other stressors. Disease can interfere with reproduction, growth and other organismal functions. Parasite and disease levels indicate health of aquatic populations. Introduced fish in Hawaii have been shown to carry parasites such as leeches or diseases which may be transferred to native stream fish. These introduced parasite species often have greater impacts on native Hawaiian fish than native parasites do, due to differences in their life cycles (Font 2003). The prawn Macrobrachium lar (introduced to Hawaii, but native to the other island groups in the PACN) likely introduced the “black spot” disease to shrimp on Oahu (Eldridge 1994). This is an issue of unknown magnitude on the other islands in the PACN, though fewer parasite species have been found in situations with fewer alien fish introductions . The introduction of mosquitoes (Culex spp.) to freshwater habitats has had wide-ranging effects on both human and avian health; different species spread diseases such as avian and human malaria, dengue fever and West Nile virus.
? ? x x x x x x x
Marine animal disease M12 Marine biota
health Marine disease
What are the prevalence and levels (how severe) and trends in known causes of morbidity and mortality in targeted population? Where cause-effect is clearly established, are these affecting the populations? For targeted potential (incipient) causes of mortality and morbidity: are these present in population or geographic area of concern? Are they present in other populations or in locations outside the immediate area of concern? If so, what are rates and directions of spread? Includes animals, coral, and algae.
Known causes: specimen and/or carcass collection (may include telemetry to recovery carcasses), host or vector surveys/sampling; surveys of affected populations to determine popn status and impacts. Potential causes: Surveys in high risk sites; education & outreach to encourage public reporting; survey or report follow-up where needed; rapid assessment of extent of any infestations
Disease or threat prevalence, level, or presence/ absence; distribution and numbers of host and/or vector species involved; abundance or density of affected population. Stage of disease/infestation, host condition. Potential causes: presence/absence; distribution, ID, and numbers of host and/or vector spp.
Disease can directly kill or weaken organisms impairing their ability to survive other stressors. Disease can interfere with reproduction, growth and other organismal functions.
x x x x x x x x x x
Focal species or Communities
Focal plant commnuities T8
Rare and Focal Plant Community Biodiversity
Focal plant biodiversity
Are there detectable changes in selected communities of interest? What is the relative abundance of native and non native species of vascular or non-vascular plants in communities of interest? What plant species and natural communities are rare in the parks?
Transects, permanent plots.
Presence/ absence, abundance of focal species and groups; diversity indices both within and across plant communities; Changes in structure, density, cover, and trends in selected focal groups of plant species.
With the loss of native plant communities or vegetation components of cultural landscapes due to invasive species or habitat change, populations of important native and Polynesian species are depleted or locally extirpated. Understanding changes in populations of these key species is important for their restoration or maintenance.
x x x x x x x x x
Focal plant commnuities T9 Plant
Succession
Focal plant community succession
What are trends in plant community composition and structure of representative vegetation types (including epiphytic plants and both vascular and non-vascular plants), regardless of management treatment or land use?
Transects, permanent plots, mapping, remote sensing, long-term monitoring of tagged species
Cover, density, vigor, size classes, growth rates, species composition, long -term changes in structure, spatial relation of individuals
Ecosystems are characterized by a unique set of species (the community) that change naturally over time in response to changes in environmental variables and disturbance regimes and species interactions. By studying long-term community change, the responses of communities to various drivers can be better understood.
It was suggested that this vital sign will be captured with T2, T3, and T8.
x x x x x x x x x

Appendix O: Part IV Vital Signs Workshops
140
Level 1
Level 2
WASO Vital Sign
VS Id#
"Old" PACN Vital Sign
"New" PACN Vital Sign Monitoring Question(s) Monitoring Method Measures and Metrics Justification
Steve Fancy's Comments A
MM
E
WA
PA
NPS
A
USA
R
KA
LA
HA
LE
ALK
A
PUH
E
KA
HO
PUH
O
Focal plant commnuities T10
Recovery/Change of Native Vegetation Following Management
Response of native plant communities to non-biocontrol management
What are trends in plant community composition and structure following management ( including : Alien plant control, Small mammal control, Feral ungulate control or removal, Invasive alien invertebrate control, and Outplanting/seeding activities)? What are impacts of management on biodiversity and on common species or community types? What are the effects of alien species control on other alien species?
Transects, plots. Population surveys of native and alien invertebrates.
Cover, density, vigor, size classes, species composition, recruitment rates. Focal plant flower and seed production. Abundance and distribution of alien invertebrates and native pollinators.
Restoration or alien species control programs may cause both positive and negative changes in park vegetation. Monitoring is needed to understand the impacts of management programs by studying long-term community change and the information used to make management decisions.
It was suggested that T10 & T11 be combined.
? ? ? ? ? ? ? ? ?
Focal plant species T11 Biocontrol of
Plants
Response of native plant communities to biocontrol
What is the long-term impact/efficacy of plant biocontrol (using either plant pathogens or invertebrates) on populations of the control target? Are non-target plants, especially natives, being affected?
Plots & transects for plants, long term monitoring of biocontrol effects on populations
Infestation rates, cover, density, vigor, size classes, recruitment rates, damage indices for both natives and target alien species. Presence and abundance of biocontrol agent.
Concern about ecological damage from exotic invasive species involves impacts to native flora and fauna, natural disturbance regimes, and ecosystem functions. Especially among these are concerns for threatened and endangered species sustainability and loss of more common species.
It was suggested that T10 & T11 be combined.
? ? ? ? ? ? ? ? ?
Focal plant species T12
Native Plant Species Protection
Focal plant species
What are the distribution, abundance, and demographics of threatened, endangered, rare and focal native vascular and non-vascular plant species? Is the overall number of rare plant species increasing or decreasing? Are plant populations reproducing at sustaining levels? Is pollination, seed bank, seed set, and seedling recruitment adequate to maintain levels? Is genetic diversity being maintained?
Mapping, plots, counts in size classes. Soil cores and subplots for seed banks. Flower and fruit monitoring at focal plant populations. Genetic analysis of focal species samples.
Phenology, survival, soil seed bank, population structure, distribution, density, reproduction. Genetic similarity of individuals in populations.
Some species are sensitive to environmental change processes, both natural and anthropogenic, and can act as indicators of specific changes. Likewise, the parks are required to maintain populations of native species. Monitoring the growth, distribution, and reproductive dynamics of more sensitive species provides information that may act as an early warning for the welfare of the target species as well as that of associated species. Threatened and endangered species are an important aspect of biodiversity. Parks are mandated (Endangered Species Act) to monitor their condition and implement conservation activities to further their recovery.
x x x x x x x x x
Focal invertebrate communities
T16 Terrestrial Invertebrate Biodiversity
Focal terrestrial invertebrate biodiversity
What are trends in distribution, abundance, and diversity of speciose groups within parks and across landscapes? Are species being locally extirpated or going extinct?
Population surveys, transects, plots, mapping
Abundance, density, demographics, distribution, diversity, evenness, richness
Properties of faunal assemblages and populations may be important indicators of environmental change because fauna serve a great diversity of ecological functions that affect ecosystem productivity, resilience, and sustainability (Walker 1992, Risser 1995, Marcot et al. 1998). Terrestrial fauna also are desirable subjects for long-term ecological monitoring because they have widespread public appeal, and changes in the park’s fauna are likely to garner a high level of public interest and generate support for corrective or remedial management actions.
x x x ? x x x x x x
Focal vertebrate communities
T17
Terrestrial Vertebrate Biodiversity (including off-shore islet refugia)
Focal terrestrial vertebrate biodiversity
Are selected native vertebrate communities or guilds changing? This includes changes in abundance of selected species (determined from population surveys), and/or changes in the identity and number of species present in the community or guild of interest (determined from presence/absence monitoring).
Population surveys, presence/absence surveys. Periodic inventories focused on picking up new species records (especially T, E, S-o-C species, and seabird colonies) and/or locations.
Within defined areas or specified communities: abundance and trends of selected vertebrate species or groups, species richness
Properties of faunal assemblages and populations may be important indicators of environmental change because fauna serve a great diversity of ecological functions that affect ecosystem productivity, resilience, and sustainability (Walker 1992, Risser 1995, Marcot et al. 1998). Terrestrial fauna also are desirable subjects for long-term ecological monitoring because they have widespread public appeal, and changes in the park’s fauna are likely to garner a high level of public interest and generate support for corrective or remedial management actions.
x x x x x x

National Park Service 141
Level 1
Level 2
WASO Vital Sign
VS Id#
"Old" PACN Vital Sign
"New" PACN Vital Sign Monitoring Question(s) Monitoring Method Measures and Metrics Justification
Steve Fancy's Comments A
MM
E
WA
PA
NPS
A
USA
R
KA
LA
HA
LE
ALK
A
PUH
E
KA
HO
PUH
O
Focal vertebrate communities
T18
Recovery/change of native fauna with habitat restoration
Response of native terrestrial animal communities to vegetation management
What is the response of native vertebrate and invertebrate populations to habitat restoration, including alien control and outplanting and seed-sowing activities? Which native species are recolonizing restored areas? Which ones are not?
Population surveys, transects, plots (monitoring of areas where seeds have been broadcast and native species outplanted), mapping
Abundance, density, size classes, vigor, species composition, seedling recruitment, growth rates, Cover, animal reproductive success, animal population size, animal population growth rates, survivorship, distribution, diversity, evenness, richness
Properties of faunal assemblages and populations may be important indicators of environmental change because fauna serve a great diversity of ecological functions that affect ecosystem productivity, resilience, and sustainability (Walker 1992, Risser 1995, Marcot et al. 1998). Terrestrial fauna also are desirable subjects for long-term ecological monitoring because they have widespread public appeal, and changes in the park’s fauna are likely to garner a high level of public interest and generate support for corrective or remedial management actions.
x x x x x ? x ?
Focal invertebrate species
T19 Invertebrate Biocontrol of Invertebrates
Response of native invertebrate communities to biocontrol
What is the impact of biocontrol agents on native and non-native invertebrates (including moths, beetles, snails, and parasitoids)? What is the impact on target species?
Population surveys, transects, plots, mapping, rearing
Parasitism/predation rates; abundance/density, demographics, distribution of hosts and control agents
Concern about ecological damage from exotic invasive species involves impacts to native flora and fauna, natural disturbance regimes, and ecosystem functions. Especially among these are concerns for threatened and endangered species sustainability and loss of more common species. .
? ? ? ? ? ? ? ? ?
Forest birds & bats T20
Selected native and alien forest Bird and Bat populations (can include T & E spp.)
Forest birds and bats
Are the demographics of selected native, endemic, or focal forest bird and bat species changing? If so, are changes deleterious, and can we control or reduce threats to these populations?
Population surveys, including demographic measures (size/age structure, reproduction, recruitment, etc.) and prevalence of disease, pathogens, and/or population threats. (Forest bird methods differ from those for raptors or bats; and fruit bat methods will differ from insectivorous bats.)
Population demographics, density, distribution. Prevalence of disease, pathogens, other population threats.
Some species are sensitive to environmental change processes, both natural and anthropogenic, and can act as indicators of specific changes. Likewise, the parks are required to maintain populations of native species. Monitoring the growth, distribution, and reproductive dynamics of more sensitive species provides information that may act as an early warning for the welfare of the target species as well as that of associated species.
x x x x x ?
Reptiles T21 Herps (native) Native reptiles
Are distribution, abundance, other population characteristics, or habitat changing? Determine population levels over time.
Population surveys. A variety of standardized techniques (depending on target species) -- pitfall traps, baited traps, etc.
Abundance / density, distribution
Some species are sensitive to environmental change processes, both natural and anthropogenic, and can act as indicators of specific changes. Likewise, the parks are required to maintain populations of native species. Monitoring the growth, distribution, and reproductive dynamics of more sensitive species provides information that may act as an early warning for the welfare of the target species as well as that of associated species.
x x x
Focal invertebrate species
T23
Terrestrial Invertebrate Indicators Associated with Habitat Quality
Focal invertebrate species
What are trends in distribution and abundance of invertebrate indicator species?
Population surveys, transects, plots, mapping
Abundance, density, demographics, distribution
The loss of plant habitat is the biggest indirect threat to invertebrates. Habitat loss can occur either by direct human destruction or modification, or by transformation as a result of alien plant invasion. In general, most insect species are tied directly or indirectly to the vegetation native to the area. Relatively few native species are found in areas dominated by exotic plants.
x x x ? x x x x x x
Cave biota T33 Cave & lava tube communities
Cave & lava tube biota
What are trends in distribution, abundance, other population characteristics, and habitat quality? Are threats changing?
Population surveys, mapping; root type and abundance
Abundance, density, demographics, distribution, diversity, evenness, richness of natives and aliens
Some species are sensitive to environmental change processes, both natural and anthropogenic, and can act as indicators of specific changes. Likewise, the parks are required to maintain populations of native species. Monitoring the growth, distribution, and reproductive dynamics of more sensitive species provides information that may act as an early warning for the welfare of the target species as well as that of associated species.Cave fauna (e.g., Mammoth Cave) are emerging as highly vulnerable species to environmental stressors.
? ? ? ? x ? ? x
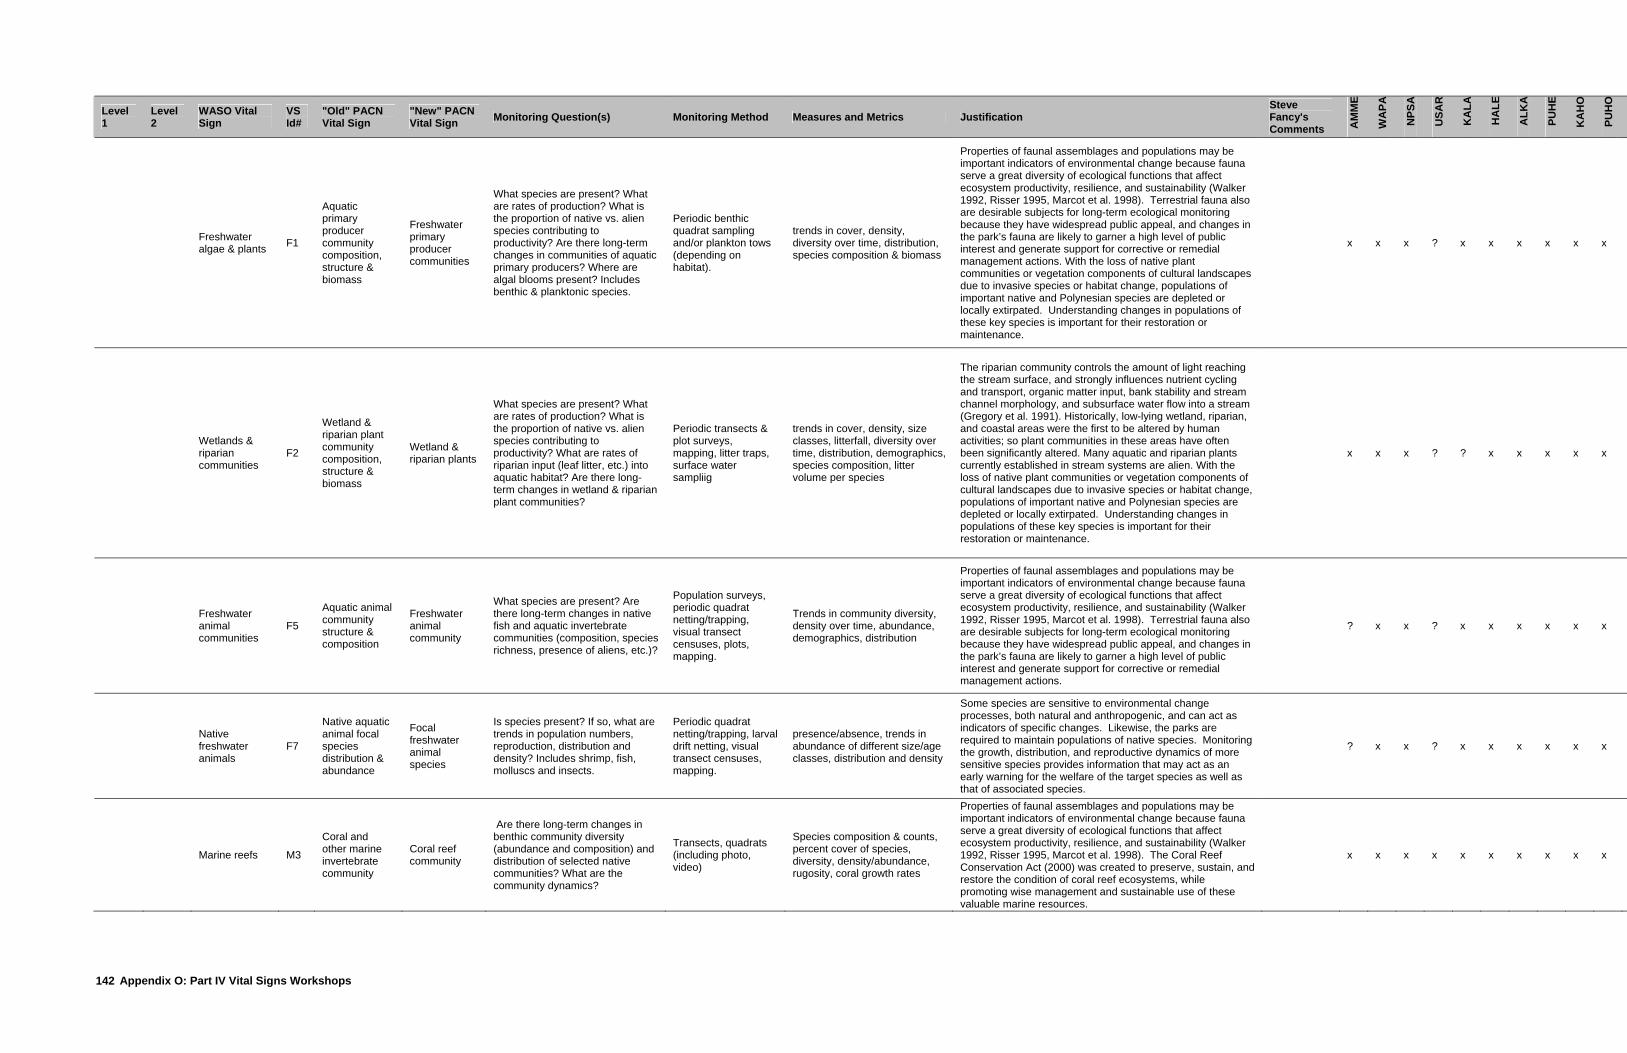
Appendix O: Part IV Vital Signs Workshops
142
Level 1
Level 2
WASO Vital Sign
VS Id#
"Old" PACN Vital Sign
"New" PACN Vital Sign Monitoring Question(s) Monitoring Method Measures and Metrics Justification
Steve Fancy's Comments A
MM
E
WA
PA
NPS
A
USA
R
KA
LA
HA
LE
ALK
A
PUH
E
KA
HO
PUH
O
Freshwater algae & plants F1
Aquatic primary producer community composition, structure & biomass
Freshwater primary producer communities
What species are present? What are rates of production? What is the proportion of native vs. alien species contributing to productivity? Are there long-term changes in communities of aquatic primary producers? Where are algal blooms present? Includes benthic & planktonic species.
Periodic benthic quadrat sampling and/or plankton tows (depending on habitat).
trends in cover, density, diversity over time, distribution, species composition & biomass
Properties of faunal assemblages and populations may be important indicators of environmental change because fauna serve a great diversity of ecological functions that affect ecosystem productivity, resilience, and sustainability (Walker 1992, Risser 1995, Marcot et al. 1998). Terrestrial fauna also are desirable subjects for long-term ecological monitoring because they have widespread public appeal, and changes in the park’s fauna are likely to garner a high level of public interest and generate support for corrective or remedial management actions. With the loss of native plant communities or vegetation components of cultural landscapes due to invasive species or habitat change, populations of important native and Polynesian species are depleted or locally extirpated. Understanding changes in populations of these key species is important for their restoration or maintenance.
x x x ? x x x x x x
Wetlands & riparian communities
F2
Wetland & riparian plant community composition, structure & biomass
Wetland & riparian plants
What species are present? What are rates of production? What is the proportion of native vs. alien species contributing to productivity? What are rates of riparian input (leaf litter, etc.) into aquatic habitat? Are there long-term changes in wetland & riparian plant communities?
Periodic transects & plot surveys, mapping, litter traps, surface water sampliig
trends in cover, density, size classes, litterfall, diversity over time, distribution, demographics, species composition, litter volume per species
The riparian community controls the amount of light reaching the stream surface, and strongly influences nutrient cycling and transport, organic matter input, bank stability and stream channel morphology, and subsurface water flow into a stream (Gregory et al. 1991). Historically, low-lying wetland, riparian, and coastal areas were the first to be altered by human activities; so plant communities in these areas have often been significantly altered. Many aquatic and riparian plants currently established in stream systems are alien. With the loss of native plant communities or vegetation components of cultural landscapes due to invasive species or habitat change, populations of important native and Polynesian species are depleted or locally extirpated. Understanding changes in populations of these key species is important for their restoration or maintenance.
x x x ? ? x x x x x
Freshwater animal communities
F5
Aquatic animal community structure & composition
Freshwater animal community
What species are present? Are there long-term changes in native fish and aquatic invertebrate communities (composition, species richness, presence of aliens, etc.)?
Population surveys, periodic quadrat netting/trapping, visual transect censuses, plots, mapping.
Trends in community diversity, density over time, abundance, demographics, distribution
Properties of faunal assemblages and populations may be important indicators of environmental change because fauna serve a great diversity of ecological functions that affect ecosystem productivity, resilience, and sustainability (Walker 1992, Risser 1995, Marcot et al. 1998). Terrestrial fauna also are desirable subjects for long-term ecological monitoring because they have widespread public appeal, and changes in the park’s fauna are likely to garner a high level of public interest and generate support for corrective or remedial management actions.
? x x ? x x x x x x
Native freshwater animals
F7
Native aquatic animal focal species distribution & abundance
Focal freshwater animal species
Is species present? If so, what are trends in population numbers, reproduction, distribution and density? Includes shrimp, fish, molluscs and insects.
Periodic quadrat netting/trapping, larval drift netting, visual transect censuses, mapping.
presence/absence, trends in abundance of different size/age classes, distribution and density
Some species are sensitive to environmental change processes, both natural and anthropogenic, and can act as indicators of specific changes. Likewise, the parks are required to maintain populations of native species. Monitoring the growth, distribution, and reproductive dynamics of more sensitive species provides information that may act as an early warning for the welfare of the target species as well as that of associated species.
? x x ? x x x x x x
Marine reefs M3
Coral and other marine invertebrate community
Coral reef community
Are there long-term changes in benthic community diversity (abundance and composition) and distribution of selected native communities? What are the community dynamics?
Transects, quadrats (including photo, video)
Species composition & counts, percent cover of species, diversity, density/abundance, rugosity, coral growth rates
Properties of faunal assemblages and populations may be important indicators of environmental change because fauna serve a great diversity of ecological functions that affect ecosystem productivity, resilience, and sustainability (Walker 1992, Risser 1995, Marcot et al. 1998). The Coral Reef Conservation Act (2000) was created to preserve, sustain, and restore the condition of coral reef ecosystems, while promoting wise management and sustainable use of these valuable marine resources.
x x x x x x x x x x

National Park Service 143
Level 1
Level 2
WASO Vital Sign
VS Id#
"Old" PACN Vital Sign
"New" PACN Vital Sign Monitoring Question(s) Monitoring Method Measures and Metrics Justification
Steve Fancy's Comments A
MM
E
WA
PA
NPS
A
USA
R
KA
LA
HA
LE
ALK
A
PUH
E
KA
HO
PUH
O
Intertidal communities M4 Intertidal
community Intertidal community
Are there long-term changes in selected native communities' composition, distribution, cover?
Population surveys, transects, quadrats, mapping
Abundance and trends of selected assemblages or groups, evenness, richness, distribution, assemblages of foundation species
Properties of faunal assemblages and populations may be important indicators of environmental change because fauna serve a great diversity of ecological functions that affect ecosystem productivity, resilience, and sustainability (Walker 1992, Risser 1995, Marcot et al. 1998).
x x x x x x x x x
Marine fish communities M5 Marine fish
assemblage Marine fish community
What are the trends in community composition & distribution in selected native communities?
Transects, distance sampling, timed swim counts
Relative abundance, demographics, diversity
Properties of faunal assemblages and populations may be important indicators of environmental change because fauna serve a great diversity of ecological functions that affect ecosystem productivity, resilience, and sustainability (Walker 1992, Risser 1995, Marcot et al. 1998).
x x x x x x x x x x
Marine macro-algae and seagrass commnuities
M6
Marine algae and vascular plant community
Marine algae and vascular plant community
Are there long-term changes in selected native communities' composition, distribution, cover?
Transects, quadrats (photo, video), mapping
Distribution, species composition & diversity, density, biomass, shoot density (seagrass)
Properties of faunal assemblages and populations may be important indicators of environmental change because fauna serve a great diversity of ecological functions that affect ecosystem productivity, resilience, and sustainability (Walker 1992, Risser 1995, Marcot et al. 1998).
x x x x x x x x x x
Marine fish M7 Focal marine fish population
Focal marine fish species
What are the trends in abundance and distribution of selected marine fish populations? And if applicable/selected, what are the size/age classes?
Transects, mapping, population characteristics (demographics) of target species
Abundance, distribution, demography (size/age class frequency), qualitative data including general health and color morph
Properties of faunal assemblages and populations may be important indicators of environmental change because fauna serve a great diversity of ecological functions that affect ecosystem productivity, resilience, and sustainability (Walker 1992, Risser 1995, Marcot et al. 1998).
x x x x x x x x x x
Marine macro-algae and seagrass species
M8
Focal marine algae and vascular plant population
Focal marine algae & plant species
What are the trends in cover and frequency/density of selected marine algae and vascular plant species (including mangroves and seagrass)?
Transects, quadrats, species sampling for select turf species, crustose corallines and frondose algal species
Frequency for solitary algae, cover by species, demographics, recruitment, reproduction, growth rates. Qualitative data including general health.
Properties of faunal assemblages and populations may be important indicators of environmental change because fauna serve a great diversity of ecological functions that affect ecosystem productivity, resilience, and sustainability (Walker 1992, Risser 1995, Marcot et al. 1998).
x x x x x x x x x x
Focal marine invertebrate species
M9
Focal marine coral and other invertebrate population
Focal coral & marine invertebrate species
What are trends in abundance, distribution of selected coral and/or invertebrate species? If applicable/selected what are the trends in reproductive indexes, growth, survival and recruitment of selected species?
Population surveys, transects, quadrats (photo and/or video), mapping
frequency/density (number per unit area), distribution, growth rates, survival, recruitment rate, reproductive index. Qualitative data, including general health
Properties of faunal assemblages and populations may be important indicators of environmental change because fauna serve a great diversity of ecological functions that affect ecosystem productivity, resilience, and sustainability (Walker 1992, Risser 1995, Marcot et al. 1998).
x x x x x x x x x x
At-risk Biota
Threatened, endangered & at-risk species
B1 T, E, S-o-C Species Richness
Threatened, endangered, and at-risk species richness
Are the numbers of Threatened, Endangered, and Species-of-Concern species, and their populations, represented in each park increasing, decreasing, or steady?
Presence/absence surveys, with periodic inventory for new T, E, S-o-C species. Consider including "rare" species as well.
presence/absence.
Threatened and endangered species are an important aspect of biodiversity. Parks are mandated (Endangered Species Act) to monitor their condition and implement conservation activities to further their recovery.
x x x x x x x x x x
Federal T & E species M10
Focal marine Threatened & Endangered Species
Marine at-risk species
What are trends in distribution & abundance of protected marine species or selected species of concern? What are the trends in recruitment, growth & survival rates for those species selected? Are changes and trends deleterious, and can we control or reduce threats to these populations?
Population surveys, transects, quadrats, mapping, marine mammal surveys, periodic telemetry
Abundance, demography (where appropriate), distribution, recruitment, growth, survival. Prevalence of disease, pathogens, other population threats. Qualitative data including general health
Threatened and endangered species are an important aspect of biodiversity. Parks are mandated (Endangered Species Act, Marine Mammal Protection Act) to monitor their condition and implement conservation activities to further their recovery.
x x x x x x x x x x
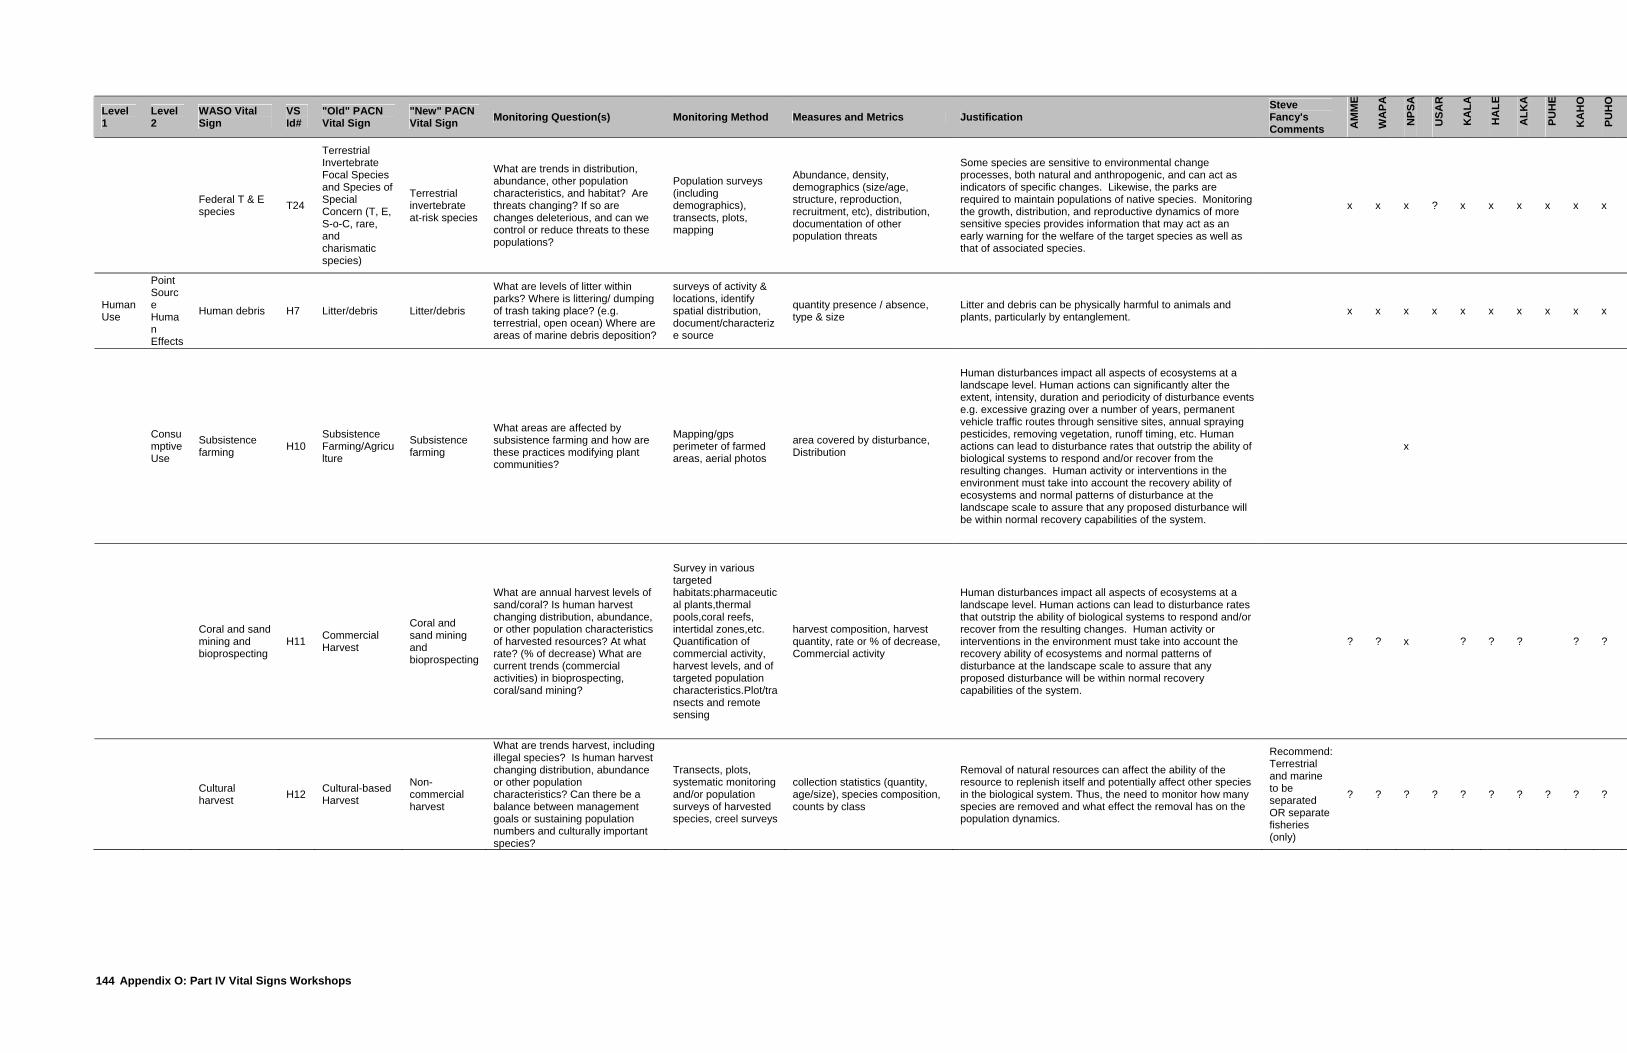
Appendix O: Part IV Vital Signs Workshops
144
Level 1
Level 2
WASO Vital Sign
VS Id#
"Old" PACN Vital Sign
"New" PACN Vital Sign Monitoring Question(s) Monitoring Method Measures and Metrics Justification
Steve Fancy's Comments A
MM
E
WA
PA
NPS
A
USA
R
KA
LA
HA
LE
ALK
A
PUH
E
KA
HO
PUH
O
Federal T & E species T24
Terrestrial Invertebrate Focal Species and Species of Special Concern (T, E, S-o-C, rare, and charismatic species)
Terrestrial invertebrate at-risk species
What are trends in distribution, abundance, other population characteristics, and habitat? Are threats changing? If so are changes deleterious, and can we control or reduce threats to these populations?
Population surveys (including demographics), transects, plots, mapping
Abundance, density, demographics (size/age, structure, reproduction, recruitment, etc), distribution, documentation of other population threats
Some species are sensitive to environmental change processes, both natural and anthropogenic, and can act as indicators of specific changes. Likewise, the parks are required to maintain populations of native species. Monitoring the growth, distribution, and reproductive dynamics of more sensitive species provides information that may act as an early warning for the welfare of the target species as well as that of associated species.
x x x ? x x x x x x
Human Use
Point Source Human Effects
Human debris H7 Litter/debris Litter/debris
What are levels of litter within parks? Where is littering/ dumping of trash taking place? (e.g. terrestrial, open ocean) Where are areas of marine debris deposition?
surveys of activity & locations, identify spatial distribution, document/characterize source
quantity presence / absence, type & size
Litter and debris can be physically harmful to animals and plants, particularly by entanglement. x x x x x x x x x x
Consumptive Use
Subsistence farming H10
Subsistence Farming/Agriculture
Subsistence farming
What areas are affected by subsistence farming and how are these practices modifying plant communities?
Mapping/gps perimeter of farmed areas, aerial photos
area covered by disturbance, Distribution
Human disturbances impact all aspects of ecosystems at a landscape level. Human actions can significantly alter the extent, intensity, duration and periodicity of disturbance events e.g. excessive grazing over a number of years, permanent vehicle traffic routes through sensitive sites, annual spraying pesticides, removing vegetation, runoff timing, etc. Human actions can lead to disturbance rates that outstrip the ability of biological systems to respond and/or recover from the resulting changes. Human activity or interventions in the environment must take into account the recovery ability of ecosystems and normal patterns of disturbance at the landscape scale to assure that any proposed disturbance will be within normal recovery capabilities of the system.
x
Coral and sand mining and bioprospecting
H11 Commercial Harvest
Coral and sand mining and bioprospecting
What are annual harvest levels of sand/coral? Is human harvest changing distribution, abundance, or other population characteristics of harvested resources? At what rate? (% of decrease) What are current trends (commercial activities) in bioprospecting, coral/sand mining?
Survey in various targeted habitats:pharmaceutical plants,thermal pools,coral reefs, intertidal zones,etc. Quantification of commercial activity, harvest levels, and of targeted population characteristics.Plot/transects and remote sensing
harvest composition, harvest quantity, rate or % of decrease, Commercial activity
Human disturbances impact all aspects of ecosystems at a landscape level. Human actions can lead to disturbance rates that outstrip the ability of biological systems to respond and/or recover from the resulting changes. Human activity or interventions in the environment must take into account the recovery ability of ecosystems and normal patterns of disturbance at the landscape scale to assure that any proposed disturbance will be within normal recovery capabilities of the system.
? ? x ? ? ? ? ?
Cultural harvest H12 Cultural-based
Harvest
Non-commercial harvest
What are trends harvest, including illegal species? Is human harvest changing distribution, abundance or other population characteristics? Can there be a balance between management goals or sustaining population numbers and culturally important species?
Transects, plots, systematic monitoring and/or population surveys of harvested species, creel surveys
collection statistics (quantity, age/size), species composition, counts by class
Removal of natural resources can affect the ability of the resource to replenish itself and potentially affect other species in the biological system. Thus, the need to monitor how many species are removed and what effect the removal has on the population dynamics.
Recommend: Terrestrial and marine to be separated OR separate fisheries (only)
? ? ? ? ? ? ? ? ? ?
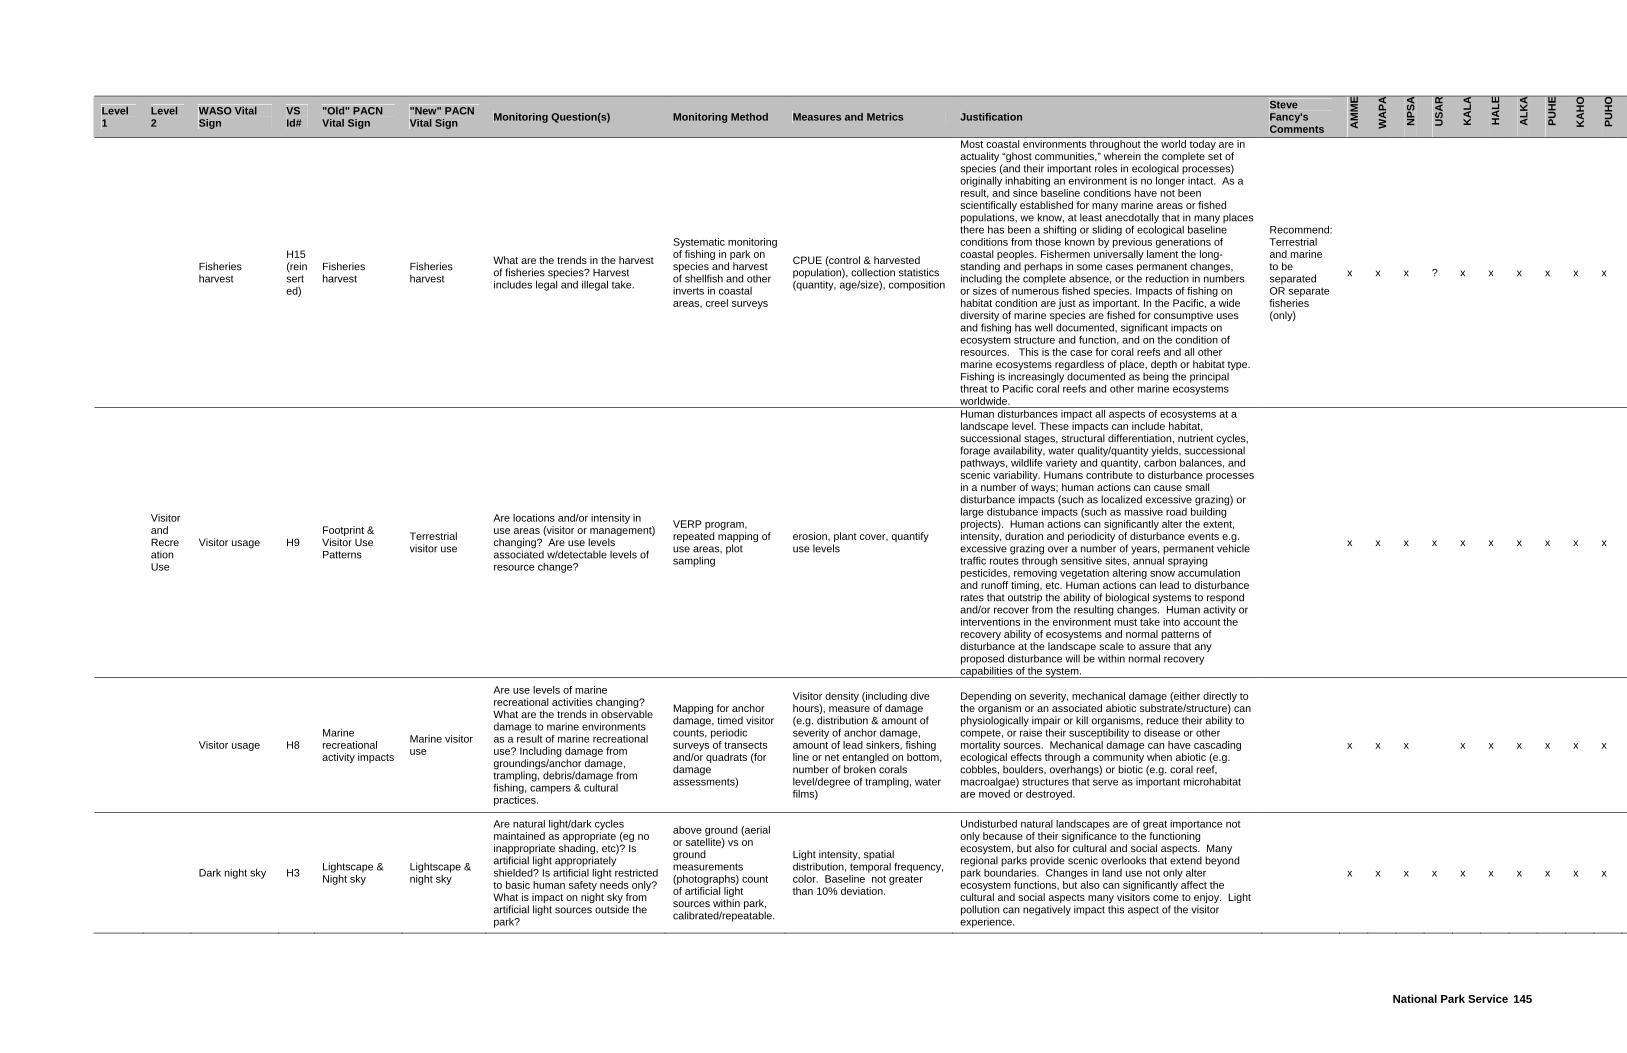
National Park Service 145
Level 1
Level 2
WASO Vital Sign
VS Id#
"Old" PACN Vital Sign
"New" PACN Vital Sign Monitoring Question(s) Monitoring Method Measures and Metrics Justification
Steve Fancy's Comments A
MM
E
WA
PA
NPS
A
USA
R
KA
LA
HA
LE
ALK
A
PUH
E
KA
HO
PUH
O
Fisheries harvest
H15 (reinserted)
Fisheries harvest
Fisheries harvest
What are the trends in the harvest of fisheries species? Harvest includes legal and illegal take.
Systematic monitoring of fishing in park on species and harvest of shellfish and other inverts in coastal areas, creel surveys
CPUE (control & harvested population), collection statistics (quantity, age/size), composition
Most coastal environments throughout the world today are in actuality “ghost communities,” wherein the complete set of species (and their important roles in ecological processes) originally inhabiting an environment is no longer intact. As a result, and since baseline conditions have not been scientifically established for many marine areas or fished populations, we know, at least anecdotally that in many places there has been a shifting or sliding of ecological baseline conditions from those known by previous generations of coastal peoples. Fishermen universally lament the long-standing and perhaps in some cases permanent changes, including the complete absence, or the reduction in numbers or sizes of numerous fished species. Impacts of fishing on habitat condition are just as important. In the Pacific, a wide diversity of marine species are fished for consumptive uses and fishing has well documented, significant impacts on ecosystem structure and function, and on the condition of resources. This is the case for coral reefs and all other marine ecosystems regardless of place, depth or habitat type. Fishing is increasingly documented as being the principal threat to Pacific coral reefs and other marine ecosystems worldwide.
Recommend: Terrestrial and marine to be separated OR separate fisheries (only)
x x x ? x x x x x x
Visitor and Recreation Use
Visitor usage H9 Footprint & Visitor Use Patterns
Terrestrial visitor use
Are locations and/or intensity in use areas (visitor or management) changing? Are use levels associated w/detectable levels of resource change?
VERP program, repeated mapping of use areas, plot sampling
erosion, plant cover, quantify use levels
Human disturbances impact all aspects of ecosystems at a landscape level. These impacts can include habitat, successional stages, structural differentiation, nutrient cycles, forage availability, water quality/quantity yields, successional pathways, wildlife variety and quantity, carbon balances, and scenic variability. Humans contribute to disturbance processes in a number of ways; human actions can cause small disturbance impacts (such as localized excessive grazing) or large distubance impacts (such as massive road building projects). Human actions can significantly alter the extent, intensity, duration and periodicity of disturbance events e.g. excessive grazing over a number of years, permanent vehicle traffic routes through sensitive sites, annual spraying pesticides, removing vegetation altering snow accumulation and runoff timing, etc. Human actions can lead to disturbance rates that outstrip the ability of biological systems to respond and/or recover from the resulting changes. Human activity or interventions in the environment must take into account the recovery ability of ecosystems and normal patterns of disturbance at the landscape scale to assure that any proposed disturbance will be within normal recovery capabilities of the system.
x x x x x x x x x x
Visitor usage H8 Marine recreational activity impacts
Marine visitor use
Are use levels of marine recreational activities changing? What are the trends in observable damage to marine environments as a result of marine recreational use? Including damage from groundings/anchor damage, trampling, debris/damage from fishing, campers & cultural practices.
Mapping for anchor damage, timed visitor counts, periodic surveys of transects and/or quadrats (for damage assessments)
Visitor density (including dive hours), measure of damage (e.g. distribution & amount of severity of anchor damage, amount of lead sinkers, fishing line or net entangled on bottom, number of broken corals level/degree of trampling, water films)
Depending on severity, mechanical damage (either directly to the organism or an associated abiotic substrate/structure) can physiologically impair or kill organisms, reduce their ability to compete, or raise their susceptibility to disease or other mortality sources. Mechanical damage can have cascading ecological effects through a community when abiotic (e.g. cobbles, boulders, overhangs) or biotic (e.g. coral reef, macroalgae) structures that serve as important microhabitat are moved or destroyed.
x x x x x x x x x
Dark night sky H3 Lightscape & Night sky
Lightscape & night sky
Are natural light/dark cycles maintained as appropriate (eg no inappropriate shading, etc)? Is artificial light appropriately shielded? Is artificial light restricted to basic human safety needs only? What is impact on night sky from artificial light sources outside the park?
above ground (aerial or satellite) vs on ground measurements (photographs) count of artificial light sources within park, calibrated/repeatable.
Light intensity, spatial distribution, temporal frequency, color. Baseline not greater than 10% deviation.
Undisturbed natural landscapes are of great importance not only because of their significance to the functioning ecosystem, but also for cultural and social aspects. Many regional parks provide scenic overlooks that extend beyond park boundaries. Changes in land use not only alter ecosystem functions, but also can significantly affect the cultural and social aspects many visitors come to enjoy. Light pollution can negatively impact this aspect of the visitor experience.
x x x x x x x x x x

Appendix O: Part IV Vital Signs Workshops
146
Level 1
Level 2
WASO Vital Sign
VS Id#
"Old" PACN Vital Sign
"New" PACN Vital Sign Monitoring Question(s) Monitoring Method Measures and Metrics Justification
Steve Fancy's Comments A
MM
E
WA
PA
NPS
A
USA
R
KA
LA
HA
LE
ALK
A
PUH
E
KA
HO
PUH
O
Visitor usage H13 Management Zone uses
Management zone uses
Are locations, extent and/or intensity in use areas (visitor or management) changing? Are use levels associated w/detectable levels of resource change?
mapping quantify and qualify uses and extent(s)
The character of a landscape's pattern (patch size, distribution, shape, dispersion, connection, etc.) influences the distribution, abundance, and movement of plants and animals (see review by Franklin and Forman, 1987). Fragmentation has been called the greatest worldwide threat to forest wildlife (Rosenburg and Raphael, 1986) and the primary cause of species extinction (Wilcox and Murphy, 1985). Connectivity of landscapes depends on the spatial distribution of habitats across a landscape as well as the scale at which organisms interact with landscape pattern (Merriam 1984, Noss 1991).
Suggestion that mapping would be a method for H9.
? ? ? ? ? ? ? ? ?
Ecosystem Pattern and Processes
Fire Fire dynamics T4
Fire Effects & Dynamics: Landscape Level
Fire dynamics: landscape
What is current or recent fire regime? What is extent & intensity of fires? What are current natural and anthropogenic ignition sources ? What are the impacts of fire on landscape pattern and patch viability?
Transects, plots, histories, mapping. Erosion pins and sediment collectors for erosion monitoring.
Change in vegetation structure, erosion, or nutrient loss following fire, landscape history.
Disturbances, either of natural or of human origin impact all aspects of ecosystems at a landscape level. These impacts can include habitat, successional stages, structural differentiation, nutrient cycles, forage availability, water quality/quantity yields, successional pathways, wildlife variety and quantity, carbon balances, and scenic variability.
It was suggested that T4 & T7 be combined; you could get at community effects by using a subsampling structure as part of your monitoring protocol.
? x x ? x ? ? ? ?
Fire dynamics T7
Fire Effects & Dynamics: Community Level
Fire dynamics: community
What is current or recent fire regime? What are the implications to plant community composition and structure resulting from fire? What are impacts to threatened, endangered and SOC species of plants? What are impacts of fire to vertebrate and invertebrate groups?
Transects, plots, population surveys of focal plant, vertebrate and invertebrate species.
Change in vegetation structure, cover, density, vigor, size classes, recruitment rates, growth rates, species composition, presence/absence and abundance of focal groups
Disturbances, either of natural or of human origin impact all aspects of ecosystems at a landscape level. These impacts can include habitat, successional stages, structural differentiation, nutrient cycles, forage availability, water quality/quantity yields, successional pathways, wildlife variety and quantity, carbon balances, and scenic variability.
It was suggested that T4 & T7 be combined; you could get at community effects by using a subsampling structure as part of your monitoring protocol.
? x x ? x ? ? ? ?
Land Use and Cover
Land use H5
Land Use(s) Within & Surrounding Parks
Land use within & surrounding parks
What areas are most at risk due to conflicting adjacent changes in land use (e.g. ranching, urbanization)? What land use changes are occuring within and adjacent to the park? (trends in use types) What are the predicted impacts of land use changes on park values? Are there detectable changes w/in park due to land use.
Aerial photography, mapping, plots change detection maps
Alerations in land use and its intensity of use may contribute to and be indicative of pollution of water and air resources, fragment habitat, alteration of migratory patterns of birds, increase soil erosion, and the introduction exotic invasive species.
x x x x x x x x x x
Land cover T1 Soil and Pollen Landscape History
Landscape history
Do the parks contain intact paleolandscapes? Are these resources being altered or disturbed? Are species represented in the pollen record that are now absent from the park? What is the relative sensitivity of natural landscapes to disturbance? What are recent (historical) changes in vegetation community types? What is the timing of arrival of alien invasives?
Mapping; Pollen and charcoal assemblages, macrofossils, soil horizons, etc.
Species composition,Rate of change?
It was suggested that this is more a research or inventory question than something you could monitor.
? ? ? ? ? ? ? ? ? ?
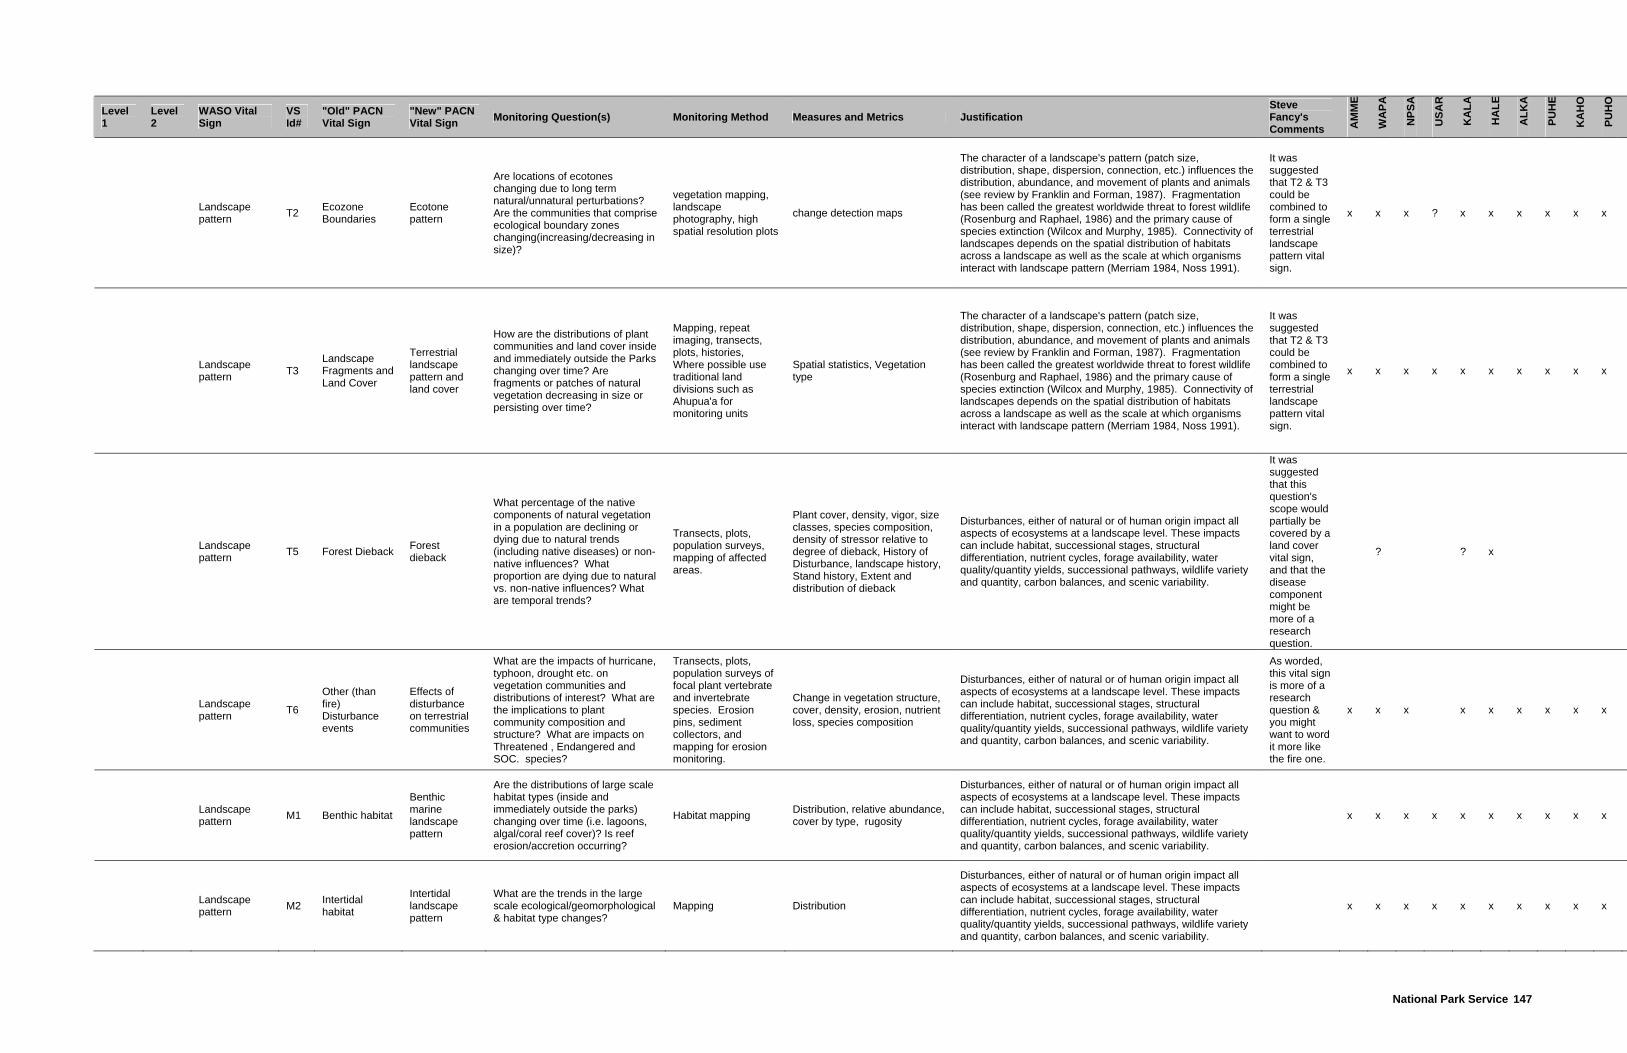
National Park Service 147
Level 1
Level 2
WASO Vital Sign
VS Id#
"Old" PACN Vital Sign
"New" PACN Vital Sign Monitoring Question(s) Monitoring Method Measures and Metrics Justification
Steve Fancy's Comments A
MM
E
WA
PA
NPS
A
USA
R
KA
LA
HA
LE
ALK
A
PUH
E
KA
HO
PUH
O
Landscape pattern T2 Ecozone
Boundaries Ecotone pattern
Are locations of ecotones changing due to long term natural/unnatural perturbations? Are the communities that comprise ecological boundary zones changing(increasing/decreasing in size)?
vegetation mapping, landscape photography, high spatial resolution plots
change detection maps
The character of a landscape's pattern (patch size, distribution, shape, dispersion, connection, etc.) influences the distribution, abundance, and movement of plants and animals (see review by Franklin and Forman, 1987). Fragmentation has been called the greatest worldwide threat to forest wildlife (Rosenburg and Raphael, 1986) and the primary cause of species extinction (Wilcox and Murphy, 1985). Connectivity of landscapes depends on the spatial distribution of habitats across a landscape as well as the scale at which organisms interact with landscape pattern (Merriam 1984, Noss 1991).
It was suggested that T2 & T3 could be combined to form a single terrestrial landscape pattern vital sign.
x x x ? x x x x x x
Landscape pattern T3
Landscape Fragments and Land Cover
Terrestrial landscape pattern and land cover
How are the distributions of plant communities and land cover inside and immediately outside the Parks changing over time? Are fragments or patches of natural vegetation decreasing in size or persisting over time?
Mapping, repeat imaging, transects, plots, histories, Where possible use traditional land divisions such as Ahupua'a for monitoring units
Spatial statistics, Vegetation type
The character of a landscape's pattern (patch size, distribution, shape, dispersion, connection, etc.) influences the distribution, abundance, and movement of plants and animals (see review by Franklin and Forman, 1987). Fragmentation has been called the greatest worldwide threat to forest wildlife (Rosenburg and Raphael, 1986) and the primary cause of species extinction (Wilcox and Murphy, 1985). Connectivity of landscapes depends on the spatial distribution of habitats across a landscape as well as the scale at which organisms interact with landscape pattern (Merriam 1984, Noss 1991).
It was suggested that T2 & T3 could be combined to form a single terrestrial landscape pattern vital sign.
x x x x x x x x x x
Landscape pattern T5 Forest Dieback Forest
dieback
What percentage of the native components of natural vegetation in a population are declining or dying due to natural trends (including native diseases) or non-native influences? What proportion are dying due to natural vs. non-native influences? What are temporal trends?
Transects, plots, population surveys, mapping of affected areas.
Plant cover, density, vigor, size classes, species composition, density of stressor relative to degree of dieback, History of Disturbance, landscape history, Stand history, Extent and distribution of dieback
Disturbances, either of natural or of human origin impact all aspects of ecosystems at a landscape level. These impacts can include habitat, successional stages, structural differentiation, nutrient cycles, forage availability, water quality/quantity yields, successional pathways, wildlife variety and quantity, carbon balances, and scenic variability.
It was suggested that this question's scope would partially be covered by a land cover vital sign, and that the disease component might be more of a research question.
? ? x
Landscape pattern T6
Other (than fire) Disturbance events
Effects of disturbance on terrestrial communities
What are the impacts of hurricane, typhoon, drought etc. on vegetation communities and distributions of interest? What are the implications to plant community composition and structure? What are impacts on Threatened , Endangered and SOC. species?
Transects, plots, population surveys of focal plant vertebrate and invertebrate species. Erosion pins, sediment collectors, and mapping for erosion monitoring.
Change in vegetation structure, cover, density, erosion, nutrient loss, species composition
Disturbances, either of natural or of human origin impact all aspects of ecosystems at a landscape level. These impacts can include habitat, successional stages, structural differentiation, nutrient cycles, forage availability, water quality/quantity yields, successional pathways, wildlife variety and quantity, carbon balances, and scenic variability.
As worded, this vital sign is more of a research question & you might want to word it more like the fire one.
x x x x x x x x x
Landscape pattern M1 Benthic habitat
Benthic marine landscape pattern
Are the distributions of large scale habitat types (inside and immediately outside the parks) changing over time (i.e. lagoons, algal/coral reef cover)? Is reef erosion/accretion occurring?
Habitat mapping Distribution, relative abundance, cover by type, rugosity
Disturbances, either of natural or of human origin impact all aspects of ecosystems at a landscape level. These impacts can include habitat, successional stages, structural differentiation, nutrient cycles, forage availability, water quality/quantity yields, successional pathways, wildlife variety and quantity, carbon balances, and scenic variability.
x x x x x x x x x x
Landscape pattern M2 Intertidal
habitat
Intertidal landscape pattern
What are the trends in the large scale ecological/geomorphological & habitat type changes?
Mapping Distribution
Disturbances, either of natural or of human origin impact all aspects of ecosystems at a landscape level. These impacts can include habitat, successional stages, structural differentiation, nutrient cycles, forage availability, water quality/quantity yields, successional pathways, wildlife variety and quantity, carbon balances, and scenic variability.
x x x x x x x x x x

Appendix O: Part IV Vital Signs Workshops
148
Level 1
Level 2
WASO Vital Sign
VS Id#
"Old" PACN Vital Sign
"New" PACN Vital Sign Monitoring Question(s) Monitoring Method Measures and Metrics Justification
Steve Fancy's Comments A
MM
E
WA
PA
NPS
A
USA
R
KA
LA
HA
LE
ALK
A
PUH
E
KA
HO
PUH
O
Land use H14
Wilderness Areas - HAVO, HALE, other Unofficial
Wilderness character
Monitor to identify the need for, or effects of, management actions. Are wilderness areas being unacceptably changed?
Limits of acceptable change. Nature, magnitude, and source of impacts
Limits of Acceptable Change (LAC)
Might want to change monitoring question & make it clear that this is checking for compliance to wilderness guidelines.
? ? x
Viewscape H2 Viewsheds Viewscape Are landscapes/seascapes changing in and surrounding the park? If so, how?
historical photos (periodic photography from fixed points)
qualitative, % of change, presence/absence x x x x x x x x x x
Soundscape
Natural and anthropogenic sound levels
H1 Alien, Natural, Human Soundscapes
Natural & anthropogenic sound levels
Are alien sounds appropriate to management zone? Are naturally present sounds maintained at appropriate frequencies, occurrence, db levels? Are we exceeding an acceptable level of sound?
point/plot sampling
frequency (hz), frequency (time), Sound durations, Sound levels, sound source identification, spatial distribution
Noise pollution can come from a variety of sources in National Parks. Aircraft, automobiles, other visitors, and activities external to the park can create noise that detracts from the visitor experience and may affect habits of park wildlife (e.g., breeding, grazing, and migratory routes).
x x x x x x x x x x
Nutrient Dynamics
Nutrient turnover P11
Biogeochemical Cycles - Nutrient Cycling
Nutrient turnover
How are processes changing over time (source, directions, levels of flow)?
monitoring plots
Aquatic senescence, Coral growth-CaCO3 deposition, Forest productivity (litter rain, incremental growth), Key constituents (N, K, CaCO3)
Nutrient cycles are essential ecosystem processes and the linkages to decomposition are complex and important. The carbon cycle is an essential ecosystem process, with insects, animals, saprophytes, pathogens and fire all play important roles in nutrient cycles. Nutrient cycles link the biotic and abiotic components of an ecosystem through a constant change of materials. As such, these cycles may be considered an integrating variable, since they occur across scales and involve the atmosphere, biosphere, lithosphere, and hydrosphere. While nutrients may be transported great distances in water or air, the key transformations that make these elements available to plants (and so to animals) are driven by soil microbes, as are the reactions that release the elements back to air or water, to repeat the cycle. In most cases, well established ecosystems have very "tight" nutrient cycles that conserve key nutrients. Human activities such as forest harvesting, fire suppression, disease introduction and/or control may disrupt these cycles leading to reduced availability of nutrients and a loss of nutrients from ecosystems.
If there's aquatic monitoring, you will need more in methods than monitoring plots.
x x x x x x x x x x
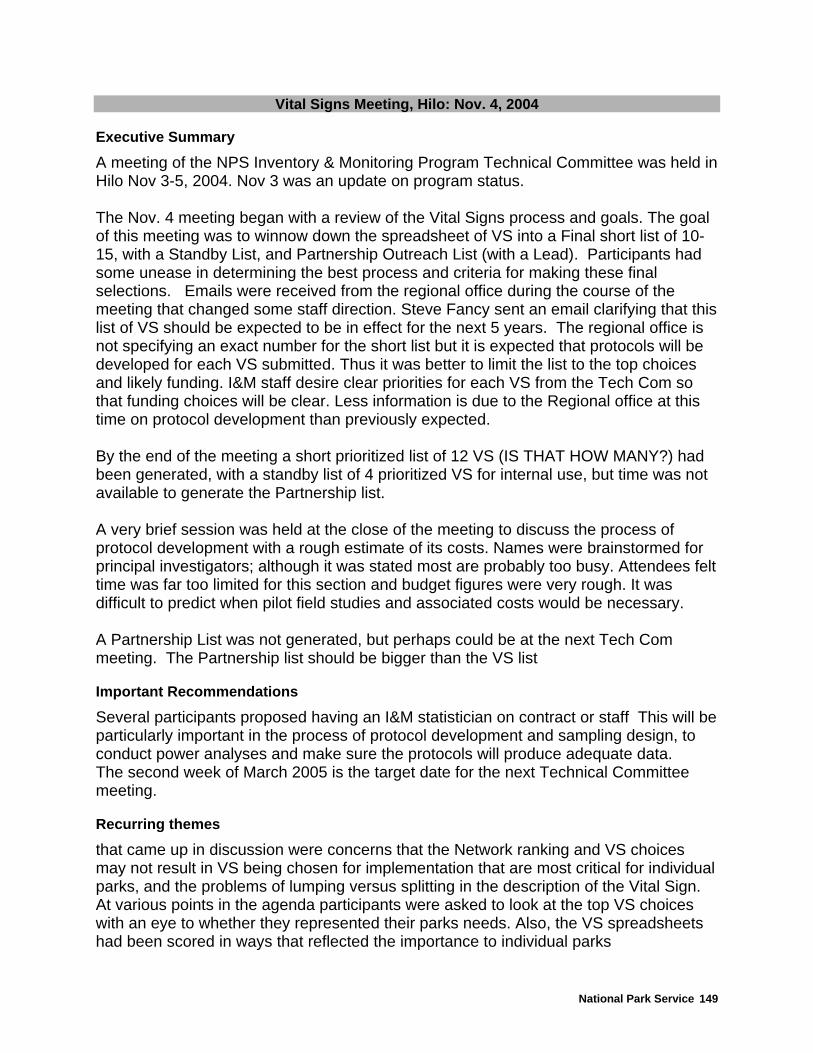
National Park Service 149
Vital Signs Meeting, Hilo: Nov. 4, 2004
Executive Summary
A meeting of the NPS Inventory & Monitoring Program Technical Committee was held in Hilo Nov 3-5, 2004. Nov 3 was an update on program status. The Nov. 4 meeting began with a review of the Vital Signs process and goals. The goal of this meeting was to winnow down the spreadsheet of VS into a Final short list of 10-15, with a Standby List, and Partnership Outreach List (with a Lead). Participants had some unease in determining the best process and criteria for making these final selections. Emails were received from the regional office during the course of the meeting that changed some staff direction. Steve Fancy sent an email clarifying that this list of VS should be expected to be in effect for the next 5 years. The regional office is not specifying an exact number for the short list but it is expected that protocols will be developed for each VS submitted. Thus it was better to limit the list to the top choices and likely funding. I&M staff desire clear priorities for each VS from the Tech Com so that funding choices will be clear. Less information is due to the Regional office at this time on protocol development than previously expected. By the end of the meeting a short prioritized list of 12 VS (IS THAT HOW MANY?) had been generated, with a standby list of 4 prioritized VS for internal use, but time was not available to generate the Partnership list. A very brief session was held at the close of the meeting to discuss the process of protocol development with a rough estimate of its costs. Names were brainstormed for principal investigators; although it was stated most are probably too busy. Attendees felt time was far too limited for this section and budget figures were very rough. It was difficult to predict when pilot field studies and associated costs would be necessary. A Partnership List was not generated, but perhaps could be at the next Tech Com meeting. The Partnership list should be bigger than the VS list
Important Recommendations
Several participants proposed having an I&M statistician on contract or staff This will be particularly important in the process of protocol development and sampling design, to conduct power analyses and make sure the protocols will produce adequate data. The second week of March 2005 is the target date for the next Technical Committee meeting.
Recurring themes
that came up in discussion were concerns that the Network ranking and VS choices may not result in VS being chosen for implementation that are most critical for individual parks, and the problems of lumping versus splitting in the description of the Vital Sign. At various points in the agenda participants were asked to look at the top VS choices with an eye to whether they represented their parks needs. Also, the VS spreadsheets had been scored in ways that reflected the importance to individual parks

Appendix O: Part IV Vital Signs Workshops
150
Participants felt that lumping simply deferred hard choices until later. The concern was expressed that if the goal is to have the same methodology to compare across parks then don’t allow lumping followed by individual park splitting. However, in some cases the VS would allow different park choices, for instance if the VS is fish communities, each park could do a subset of indicator species and the methodology would be comparable. Other participants felt it was important to consolidate VS in order to have the top tier represent all the attributes most in need of monitoring. This functions also as a political statement of their network importance and need for funding. However, staff reminded that the list of VS turned in to WAS0 will be critical; we will be expected to develop protocols and fund this list. Complex lumped vital signs with broad objectives will be hard to meet, to define protocols and adequately fund.
Background
The original large list of VS was decreased by merging vital signs, eliminating, redundancy and research questions that weren’t priority, and dropping low score VS. The group went into this meeting with a spreadsheet of 43 Vital Signs, resulting from Park Rankings and previous meetings using the level 2 criteria to winnow down the original 115 VS. In Oct 04 the parks were asked to review the VS and give ratings to break ties, and also prepare a list of the 10 VS that were of least importance. The bottom 10 list provided an indication to drop several VS from the list of 51 choices.
Participants
Larry Basch (Coral Reef), Guy Hughes (KALA), Steve Anderson (HALE), Duane (WAPA), Peter Craig (NPSA), Linda Pratt (HAVO), Tim Tunison (HAVO), Sallie Beavers (KAHO), Stan Bond (KAHO/PUHO), Marshall Owens (USAR), Jim Jacobi (HAVO), Laura Carter-Schuster Facilitator: Helen Felsing I&M Staff: Darcy Hu, Sandy Margriter, Leslie Haysmith, Fritz Klasner, Gordon Dicus, Allison Cocke I&M Contractors: Sonia Stephens, Page Else, Karin Schleppa, Jean Licus, Karl Magnacca
Process
Following review presentations and group discussion, meeting facilitators first proposed that subgroups break and come back with their 4 top VS in order of priority and cost estimate from the list of 43. Initially 4 subgroups were proposed: ecology and human use; marine biology; terrestrial biology; and Hydrology and FW biology. Meeting attendees had several reservations about this proposal, feeling that the groups were arbitrary and the choice of 4 VS limiting. There was concern that there was not

National Park Service 151
enough expertise in the room to split into 4 speciality groups. Participants did not want to be responsible for reranking VS that had already been ranked by a larger group. Ultimately it was decided to break into 3 subgroups: Terrestrial, Aquatic, Human Use to determine the top 6 VS and cost estimates for implementation. This group process elevated 17 VS from the 43 in the spreadsheet as the ones most worthy of selection. After Lunch the group reviewed an onscreen display of group rankings. Attendees continued to express concern about the process, and lumping vs splitting. Attendees felt that when the VS were first developed and ranked they had some tie to criteria and that during this meeting the process was mainly to lump in order to keep VS in the top list. There was concern that the obvious low cost parameters to measure are perhaps no longer included in the list. Upon review of this shorter list, it was apparent that 6 VS have a great deal of support; they are in the top tier of the park lists and have high network ranks. These included exotic terrestrial landscape pattern and land cover; land use patterns; weather/climate; water quality core parameters; focal terrestrial plant; focal terrestrial; birds, bats, and the benthic marine community. Other VS remaining in the top ten included groundwater. Each attendee was then asked to review this list of top VS from a park perspective. It became apparent that VS important to many participants but missing from the top 10 included marine fish and fish harvest, terrestrial invertebrates, and the freshwater animal community. Participants were then given homework: If they did not like the list of the 10 ten VS, come with a counter proposal in the morning. Upon reconvening, the proposals to adjust the top 10 list of VS included extending the list to 12 VS; Add fish harvest; Remove light & viewscape; Add freshwater biology; Combine T&E with focal terrestrial; Add terrestrial invert to terrestrial vert; Add fish to benthic marine community; Add fish harvest; Add exotic vert and invert to plant early detection. The justification for the inclusion of fish harvest was described as a topic that is gaining national significance. Reports have recently been published pushing governments to do more to protect fish stocks. NPS has allowed fishing while hunting is not allowed. Network prominence is needed fo this issue, which would affect about 7 parks. NPS has a draft ocean policy in the process of getting approved, but it is an unfunded mandate. It was felt that terrestrial invertebrates are too important of a group to ignore. They are a good indicator for change, and the fact that this VS did not come out on the top 10 reflects our ignorance more than their importance. It was felt unworkable to lump verts and inverts together, the protocols are too different. Participants agreed that groundwater dynamics are very important, especially to some individual parks. However, it was agreed that it could be dropped off the top 10 list,

Appendix O: Part IV Vital Signs Workshops
152
especially given the expense of groundwater research. There was a concern that knowledge about this parameter can be very important in analyzing other VS data.
Participants felt that decisions should not be based on the cost estimates made by the subgroups, they are too rough. Development of the protocols could give a better understanding of the true costs and needs. It was pointed out that costs can be controlled by choosing the frequency of sampling; and economies of scale, so we should not let cost be the only determining factor. There was concern about the degree of lumping in the marine vital sign. The subgroup responded that there are only 4 or 5 well established basic protocols, so protocol development costs should not be high. The List of Standby VS was prioritized (NOT IN ORDER HERE. HOW DID IT COME OUT?) P12 erosion/deposition P46 Cave Habitat H2 Viewscapes & lighscapes P21 Groundwater dynamics
Review of VS Timeline
Jun 02 Tech Com meeting here, id monitoring plan goals, establish workgroups to guide data mining 02—3 park scoping, park visits, questionnaire Mar 03 Conceptual modeling workshop; learning exercise Aug 03 Water Quality Meeting; Univ. USGS, EPA Oct 03 Draft VS structure for November Tech Com mtg Nov 03 Revew & revise proposed VS Jan 04 Draft PACN VS framework & monitoring objectives developed Mar 04 VS Workshop May-Sep 0r: Adapt VS identification to new WAS0 framework Sep 04 Draft short list of VS generated; meets GPRA 1b3(a); very imp goal for I&M but some parks do not realize they can include this in their accomplishments Oct 04 Discussion of VS selection criteria Nov 04 Tech Com meeting and shortlist of VS
Vital Sign Ranking Process
At the beginning of the meeting Gordon and Sonia reviewed the ranking methods. Reduction 115 to 79; eliminating redundancy, and low scores Reduction to 51 using level 2 criteria Wanted each level 2 category to have at least one VS Any VS ranked above 15 stayed on list

National Park Service 153
If all VS in cat were ranked below 50 only top one of list stayed At least 5 of any Parks top VS stay on list; problem with ties, took 5-7 Concern with using network rank for this process; why asked parks to relist top 10 Checked against 51 to make sure parks top list represented All parks had ties, some more than others, 8 VS ranked as number 2 for example Also asked Park to rank bottom 10; further reduced level 2 list Now have list of 43 A couple of VS that were in bottom 10 for some but top ten for others For VS that had 5 or more parks that included in bottom, none in top, then dropped
Dunes, lava flows, wilderness use, visibility and partic matter, volcanic ground deformation (these things already funded, monitored)
Air contaminants, solar rad should have been dropped before using level 2 criteria Top 10 list Top 10 list has park top 10 list that didn’t make short list; so added some VS back 38 or 40 in top ten, 7 or 8 were not in short list Still have some ties in network score Was fair bit of similarity between two lists but also VS on one and not another WHAT DOES IT ALL MEAN?
Beginning of Notes taken during meeting
Selection for Implementation Sonia is monitoring plan specialist; has been working extensively with Gordon on spreadsheets Revisiting Principles Omnibus Act 1998 Coordinate monitoring across multiple parks for scientific synergy and logistical and financial economies Want a regional analysis which would not otherwise be possible Often indicators selected because are sensitive to change Indicators may be compositional, structural, or functional Showing VS medical analogy slide Scoping: stressors, focal resources, system health Conceptual modeling: predict stress/response relationships; predict linkages Integration: list potential indicators, select, prioritization Models can illustrate why are monitoring what chosen to monitor Where VS fit within system Ranking criteria 30 eco sig, 30 mgt sig, 20 legal mandate, 20 cost effectiveness 6,028 ranks, 79 vital signs, top 10 earh park Final short list & Parnership Outreach List (with a Lead), and Standby List) Network core variables; not necessarily for all pakrs

Appendix O: Part IV Vital Signs Workshops
154
Have to stay with NPS Natural Resource Challenge VS, go beyond park boundaries, use mon data in mgmt Meet Performance goals Show table from monitoring plan of VS Process to date Jun 02 Tech Com meeting here, id monitoring plan goals, establish workgroups to guide data mining 02—3 park scoping, par visits, questionnaire Mar 03 Conceptual modeling workshop; learning exercise Aug 03 Water Quality Meeting; Univ. USGS, EPA Oct 03 Draft VS structure for Nov TC mtg Nov 03 Reivew & revise proposed VS Jan 04 Draft PACN VS framework & mon obj Mar 04 VS Workshop May Sep: Adapt VS to WASA framework Sep 04 Draft short list; meets GPRA 1b3(a); very imp goal for I&M but some parks ignore? Oct 04 Discussion of VS selection criteria Dropped big list VS by merging signs and dropping low score, redundancy Research questions that weren’t priority Gordon: VS Ranking database Reduction to 79 Reduction to 51 using level 2 criteria Wanted each level 2 category to have at least one VS Any VS ranked above 15 stayed on list If all VS in cat were ranked below 50 only top one of list stayed At least 5 of any Parks top VS stay on list; problem with ties, took 5-7 Concern with using network rank for this process; why asked parks to relist top 10 Checked against 51 to make sure parks top list represented All parks had ties, some more than others, 8 VS ranked as number 2 for example Also asked Park to rank bottom 10; further reduced level 2 list Now have list of 43 A couple of VS that were in bottom 10 for some but top ten for others For VS that had 5 or more parks that included in bottom, none in top, then dropped
Dunes, lava flows, wilderness use, visibility and partic matter, volcanic ground deformation (these things already funded, monitored) Air contaminants, solar rad should have been dropped before using level 2 criteria
Top 10 list Top 10 list has park top 10 list that didn’t make short list; so added some VS back 38 or 40 in top ten, 7 or 8 were not in short list Still have some ties in network score
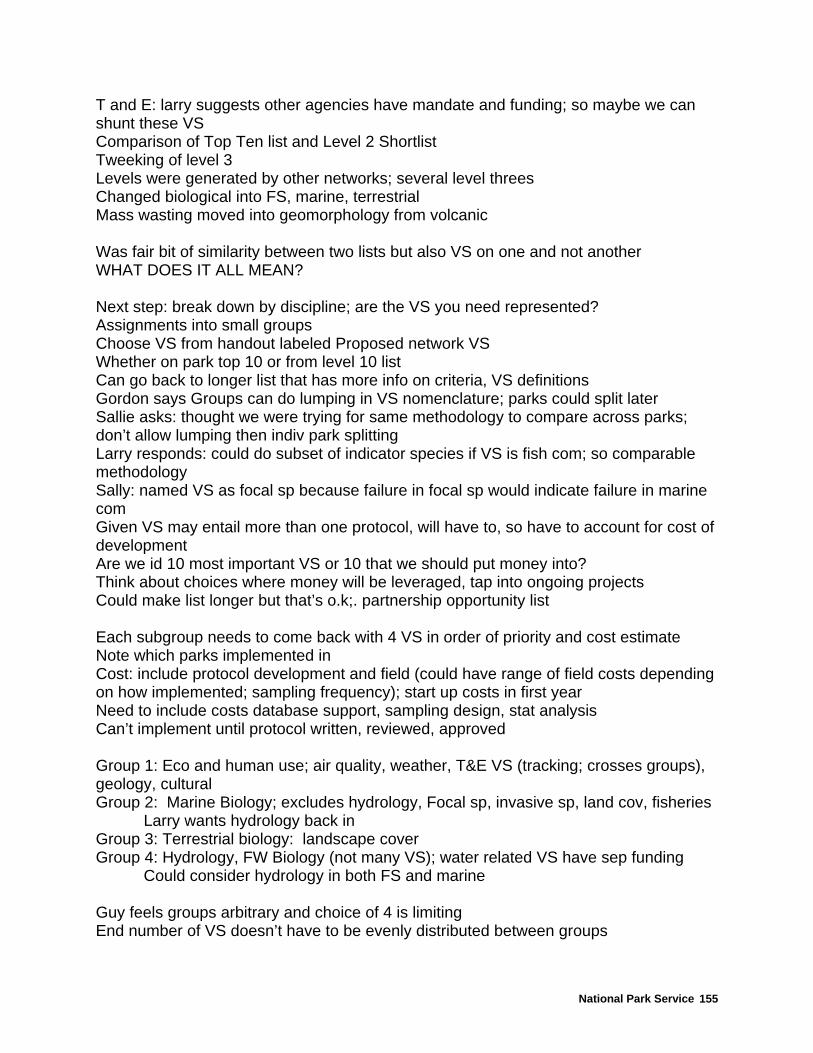
National Park Service 155
T and E: larry suggests other agencies have mandate and funding; so maybe we can shunt these VS Comparison of Top Ten list and Level 2 Shortlist Tweeking of level 3 Levels were generated by other networks; several level threes Changed biological into FS, marine, terrestrial Mass wasting moved into geomorphology from volcanic Was fair bit of similarity between two lists but also VS on one and not another WHAT DOES IT ALL MEAN? Next step: break down by discipline; are the VS you need represented? Assignments into small groups Choose VS from handout labeled Proposed network VS Whether on park top 10 or from level 10 list Can go back to longer list that has more info on criteria, VS definitions Gordon says Groups can do lumping in VS nomenclature; parks could split later Sallie asks: thought we were trying for same methodology to compare across parks; don’t allow lumping then indiv park splitting Larry responds: could do subset of indicator species if VS is fish com; so comparable methodology Sally: named VS as focal sp because failure in focal sp would indicate failure in marine com Given VS may entail more than one protocol, will have to, so have to account for cost of development Are we id 10 most important VS or 10 that we should put money into? Think about choices where money will be leveraged, tap into ongoing projects Could make list longer but that’s o.k;. partnership opportunity list Each subgroup needs to come back with 4 VS in order of priority and cost estimate Note which parks implemented in Cost: include protocol development and field (could have range of field costs depending on how implemented; sampling frequency); start up costs in first year Need to include costs database support, sampling design, stat analysis Can’t implement until protocol written, reviewed, approved Group 1: Eco and human use; air quality, weather, T&E VS (tracking; crosses groups), geology, cultural Group 2: Marine Biology; excludes hydrology, Focal sp, invasive sp, land cov, fisheries Larry wants hydrology back in Group 3: Terrestrial biology: landscape cover Group 4: Hydrology, FW Biology (not many VS); water related VS have sep funding Could consider hydrology in both FS and marine Guy feels groups arbitrary and choice of 4 is limiting End number of VS doesn’t have to be evenly distributed between groups

Appendix O: Part IV Vital Signs Workshops
156
Guy suggests other thresholds Use parks 5 or more that ranked in top 10; leads to 8 VS
4 10, leads to 11 VS 3 13
This is plant heavy (5 or more) so would have to look at other levels Linda says don’t have expertise in room to split into 4 groups Laura agrees with Guy; ranking already done by larger group in these handouts Break into subgroups: Terrestrial, Aquatic, Human Use Determine top 6 VS and cost estimate for implementation Aquatic VS Marine fish sp 6, benthic marine com health 1, fish harv 6, groundwater/wetlands hydrology 3, water quality core plus case by case toxins 2, FW animal com 5 Aquatic Dream List M1 large scale benthic mapping; F3 exotic aquatic could it be terrestrial VS P12 erosion and deposition h9 visitor to add ma intertidal P10 marine hydrography, P42 shoreline change Human Use/physical T14 and T3, exotics and landscape H5 land use patterns P7 weather/climate P46 cave habitat, geological, cultural, biological (inverts focus) H2 viewscapes and H3 lightscapes P12 erosion/dep and T4 fire P11 Nutrient Cycling P38 Seismic activity; covered by USGS P36 Volcanic deform/lava flows H1 Soundscapes; covered by air tour mgmt plan Terrestrial Lump T20+T17; forest birds, bat, focal sp T21; move to focal; rare inverts became focal and T23 indicator invert Lump T8+T12; focal plant Lump T31+32; exotics, early detection vs status trends; kept some separate T24 can include caves Fire dynamics; why was ranking so low but didn’t put in top 6 Some proposed vs should be research q rather than monitoring Cave inverts could be monitored as part of focal sp Top ranked focal terrestrial plant and animal T8+ Bird, bats, focal invert Exotic t plants early detection Rare T&E

National Park Service 157
Exotic t plants status trends Focal t invert Human Use Now we have 17 VS; how to drop Think about budget After Lunch 2 PM Looked at onscreen display of group rankings Due to lumping, park count won’t be correct any more Issue; should viewscape and lightscape really be lumped; Jean concern: won’t make short list so may not need to lump at this point, could cause difficulties later Guy: When first developed and ranked had some tie to criteria Today aren’t really applying criteria; just lumped; WE ARE DRIFTING SIDEWAYS The obvious low cost parameters to measure are perhaps no longer included in list Go back in groups Do estimated protocol development cost and cost per year on 6 VS Which parks implemented 3 PM reconvene Are 6 VS that leap out as much support; on 10 ten park list and high network rank So collect cost estimates T14 exotic terrestrial landscape pattern and land cover: protocols may have been done with veg mgmt; aerial photos, ground transects, H5 land use patterns (development; viewscape Weather/climate: maintainance for non HI parks, 70k per station, 1k per year Water quality core parameters 10-80k per park/year Focal terrestrial plant focal terrestrial; birds, bats 20k/unit; 250k/yr/park T1+T3; remote pilot study with power analysis T12+T15 That’s the obvious 6 Then look at first rank marine Benthic marine community Included with first 6 Discussed idea of having an I&M statistician on contract or staff Should find out from other networks cost of protocol development; example On back of agenda is outline of protocol development Groundwater dynamics; how fits into scheme
parks 50-80k/park; didn’t have high network rank wetland lumped with

Appendix O: Part IV Vital Signs Workshops
158
need this parameter to be known in order to analyze VS data
focal terrestrial vert; low network but high for couple of parks birds, bats 15-20k/unit don’t make decisions based on money estimates; too rough Jim Jacoby suggests: develop protocols, will give us better understanding of true costs Will help identify true needs After this 9, rare and endangered is remaining VS that has high network and park rank Exotic terrestrial plants; status and trends; Land use patterns Water quality groundwater Rare threatened & endangered Benthic marine community Focal terrestrial plant Focal terrestrial vertebrate Exotic terrestrial plants; early detection Weather/climate P7 Fish are not in this list; are dominant vert Neither are terrestrial invert Park Standpoint NPSA; miss marine fish and marine harvest; don’t see network issue to bump off WAPA; ditto, plus sediment erosion (Park already monitoring); don’t see network issue to bump off AMME: good listing, groundwater very important Stan: KAHO, miss marine fish; would drop groundwater in network view Ben Kawaiaea (via Larry); concerned with groundwater PUHO (Stan says small, natural resource base small) (Stan says exotic plant most imp for W. Hawaii; land use patterns; ALKA doesn’t have land base so how survey, or apply) Tim: Terrestrial inverts missing; Guy: weather/climate make it 11, focal marine sp is missing Marshall: ok with list, pollution is USAR Steve: focal terrestrial inverts big omission, HALE has good FW monitoring Could lump T and E What does land use patterns encompass Aerial or sat photo; monitoring development permits, veg mapping, conversion to impervious surface Are seabirds lost from these categories (incl in terrestrial vert)

National Park Service 159
Jim says T & E not very clear; sampling intensity or sp presence or absence If want quantitative analysis T&E need as sep VS Whats missing from top 10 Marine fish, terrestrial invert, FW animal community Homework: If you don’t like this, come with counter proposal in morn Larry proposal; put T&E into focal Elevate FW; combine terrestrial invert with vert Include fish in marine community VS Friday morning Proposals to adjust VS Extend List to 12 Add fish harvest Remove light & viewscape Add freshwater biology Combine T&E with focal terrestrial Add terrestrial invert to terrestrial vert Add fish to benthic marine community Add fish harvest Add exotic vert and invert to plant early detection Discussion of concern with marine lumping Darcy concerned; will have to identify separate protocols Larry says or only 4 or 5 basic protocols, well established Fish; 2 basic protocols Some VS don’t make sense without having data from other VS; eg fish pop and coral habitat Comeback: is it a VS then? VS supposed to be indicator of change Basic Marine Protocol Choose sampling sites; decide sampling unit (transect, quad, # of replicates) Fish: transect plus stationary point; note exotics and coral disease Benthic: cover, sp comp, functional group Calculate diversity, size freq distribution, sp comp Basic parameters: distribution and abundance Abun by counts or % cover or density depends on focal organisms Lumping is not a problem here because protocols/methods done simultaneously Can do video transectts; get point count Random sp off transect observed; presence/absence Protocols well-established; just need to sift through, find rigorous, pick ones that can be done simultaneously Marine protocols adopted from terrestrial
Appendix O: Part IV Vital Signs Workshops
160
Taking distribution abundance info for corals, algae, inverts, fish If do fish independent surveys can’t interpret without habitat Marine group thought needed to lump; nobody really likes to do Need rigourous lit review, recs needed on small set of protocols Protocols are same for algae, fish, coral Usually benthic and fish team; fish are done separately, dif protocol Fish mobile, react to presence of observer Fish counts done first Sampling design same, protocol different Discussion by Leslie of Tim’s remark that list upside down Partnership list should be bigger than VS list Short list for implementation; dollar dependent Need standby list that is prioritized Steve Fancy sent email in last 24 hours that it is 5 year list Regional is not specifying number of VS Tim points out we can control cost by choosing frequency of sampling; economies of scale Second week of March is target date for next Tech Com meeting Tasks for protocol development not as intense as previously thought (due to email) Identify title for protocol, list parks implemented, give cost Todays tasks Look at VS change proposals Prioritize top 10 Prioritize standby 5 Duane: add fish harvest, remove T&E; fish gaining/there with national significance, govt needs to do more to protect fish stocks, NPS has allowed fishing while hunting not allowed, need to give network prominence, about 7 parks; NPS had draft ocean policy in process of getting approved, unfunded mandate Sonia: add fw biology and remove T&E or groundwater Streams within parks still relatively pristine, not outside park Sp are endemic, indigo, endangered Groundwater too expensive, FW Biology can provide some info, habitat Apply to all parks but USAR Larry: combine T&E into terrestrial focal; get T&E as surveying other VS (terrestrial focal, marine, and FW; don’t need special protocol unless very rare) Add terrestrial invert to terrestrial vert; invert key component Add marine fish to marine community Then raise FW or fish harvest
National Park Service 161
LUMPING IS PUTTING IT OFF UNTIL LATER Linda: add terrestrial inverts; too important of a group to ignore Good indicator for change, fact wasn’t on top 10 reflects our ignorance more than importance Don’t have good choice for dropping Doesn’t want to lump verts and inverts together; unworkable Concern with too much lumping; need specificity, we’re moving backwards in process Proposes lumping fish harvest with marine fish Response: protocols too different T&E should be presence/absence annually Have two tiered monitoring questioning; Steve: early detection of invasive species If don’t merge losing opportunity for synergy Important to have early detection; is one of the most significant impacts we can have Larry points out need for better communication between land and water issues on this topic What is minimal protocol we can do, what is maximum? Darcy worried that would ramp up cost of protocol development Peter: missing some imp categories, combine invasive plant VS (early detection, status and trends) Guy; doesn’t like arbitrariness of this process Lets not lump, let’s have list that shows linkages Lets have larger list, just prioritize Helen complains; what is positive proposal in this comment? Karl says focus on tiers is unimportant; BUT maybe it is to WASO Helen Strong sentiment for including fish harvest, FW, terrestrial invert, marine fish Some willingness to manipulate T&E and groundwater, lump early detection Penny guidance: small list Linda says can’t combine invasive species; too different Steve doesn’t like idea of new vote; we’ve gone thru ranking process with parks and experts that aren’t here too Darcy agrees going backwards if go to list of 17 Is standby list going to be seen differently by WASO and region than top 10? Duane says will affect his vote WASO and region not asking for standby list

Appendix O: Part IV Vital Signs Workshops
162
What we turn in to WAS0 will be important; will be expected to develop protocol, funding; big lumps with broad objectives going to be hard to meet Linda; we are putting to much importance on cutoff but is meaningless cutoff Darcy uncomfortable with no T&E but ok with including in focal Could add invasives to focal sp rather than adding to early detection Leslie reports on conversation with Penny We could prioritize list of 17 but realize will be cutoff point And is somewhat different course so may require tech com input Protocol development summaries are due to Steve so list of 17 would need Not sure if we could drop some later Guy points out this list is implementation; so we have to be comfortable with it According to Steve is no prioritization Vital Signs for Prioritization Vote Exotic terrestrial plants; status and trends;T12 1 Exotic terrestrial early detection T15 6 Land use patterns H5 10 Water quality P24 8 Freshwater animal communities F5 7 Benthic marine community M5+ 2 Focal terrestrial plant T12 3 Focal terrestrial vertebrate T17 4 Focal terrestrial invert T23 5 Weather/climate P7 12 Fisheries Harvest h15 11 Marine fish 9 Scores recorded by Sonia into spreadsheet Folded or dropped in rank groundwater Rare threatened & endangered Process: Who’s Voting Tech Com; don’t vote from park perspective Darcy says can’t use previous ranks due to lumping Vote on list of top VS by each voter write rank from 1 top down By total or average? List of Standby VS for priorities

National Park Service 163
P12 erosion/deposition P46 Cave Habitat H2 Viewscapes & lighscapes P21 Groundwater dynamics Protocol Development Erosion/Dep Parks: PUHE, WAPA, AMME, NPSA, KALA, HALE, USAR PI: Bob Richmond (contact), Mike Field NPS lead: Aquatic Ecologist Budget; 100 k GW Dynamics Parks: AMME, NPSA, KAHO< PUHO, PUHE, KALE PI, Kaeo Duarte NPS Lead: Aquatic Ecologist Budget: 60 K (spatial design is crux of work) Fish Harvest Parks: KALA, PUHE, NPSA, WAPA, PUHO,KAHO, HAVO (kalapana issue) PI: Friedlander, Jerry David NPS lead: Peter Craig Budget 100k over 2 years; need stats and sample design (park specific), database development Marine Fish Parks; all but ALKA, USAR, HAVO, HALE PI: Allan Friedlander, Jim Beets Budget: 120k over 2 years Sample design, stats, field WQ Core Parks: all 11 PI’s: EMAP, Ed Laws NPS lead: PACN Aquatic Ecologist, Roy Irwin Budget: 30k Spatial and temporal sampling design FW Animal Community Parks: not USAR; different degree of implementation

Appendix O: Part IV Vital Signs Workshops
164
PI: Allison Sherwood, Bob Nishoimoto, Bob Kinzie, Charlie Chang, David Foote NPS lead: PACN Aquatic Ecolgoist Budget: 100k for one year analysze 5 standard protocols, stat analysis? Field tests, park specific, helicopter needed Marine Community Parks: not HAVO, HALE, USAR, ALKA PI: Burkeland, Celia Smith, Peter Vroom, Greta Aeby NPS lead: Larry Basch Budget 120 k/yr take 2 years Last 15 minutes Comments for I&M re this process! Follow up steps Wrapup Marine Group: Budget estimates probably imaginary PI’s are probably too busy; need for statistician Terrestrial Report: hard time predicting whether needed pilot field study, difficult to come up with park leads, Put GS level, time, Allison has on computer Table partnership outreach list with lead; until next tech com What about VS that were important to parks? Don’t forget