Embed Size (px)
Citation preview
APPENDIX J
Standard Operating Procedures for Data Management
RDD/100970006 (APPENDIX J_ SOP FOR DATAMGMT.DOC) III ES040110212315RDD
Preface
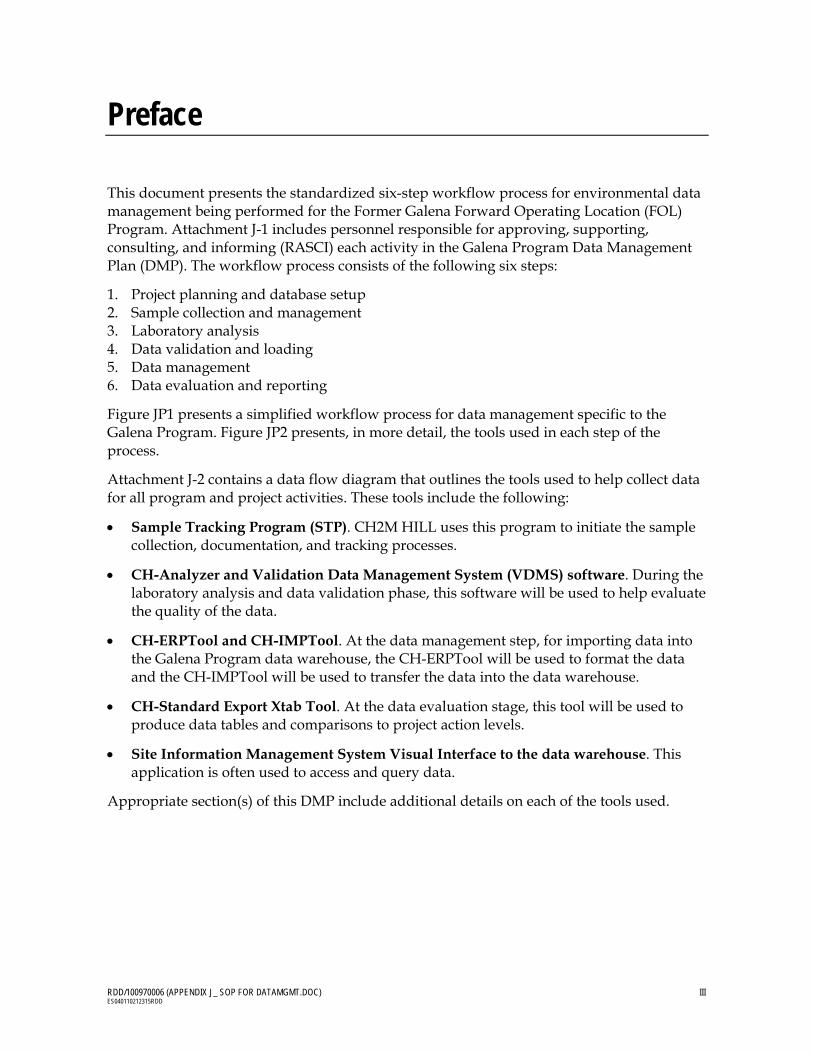
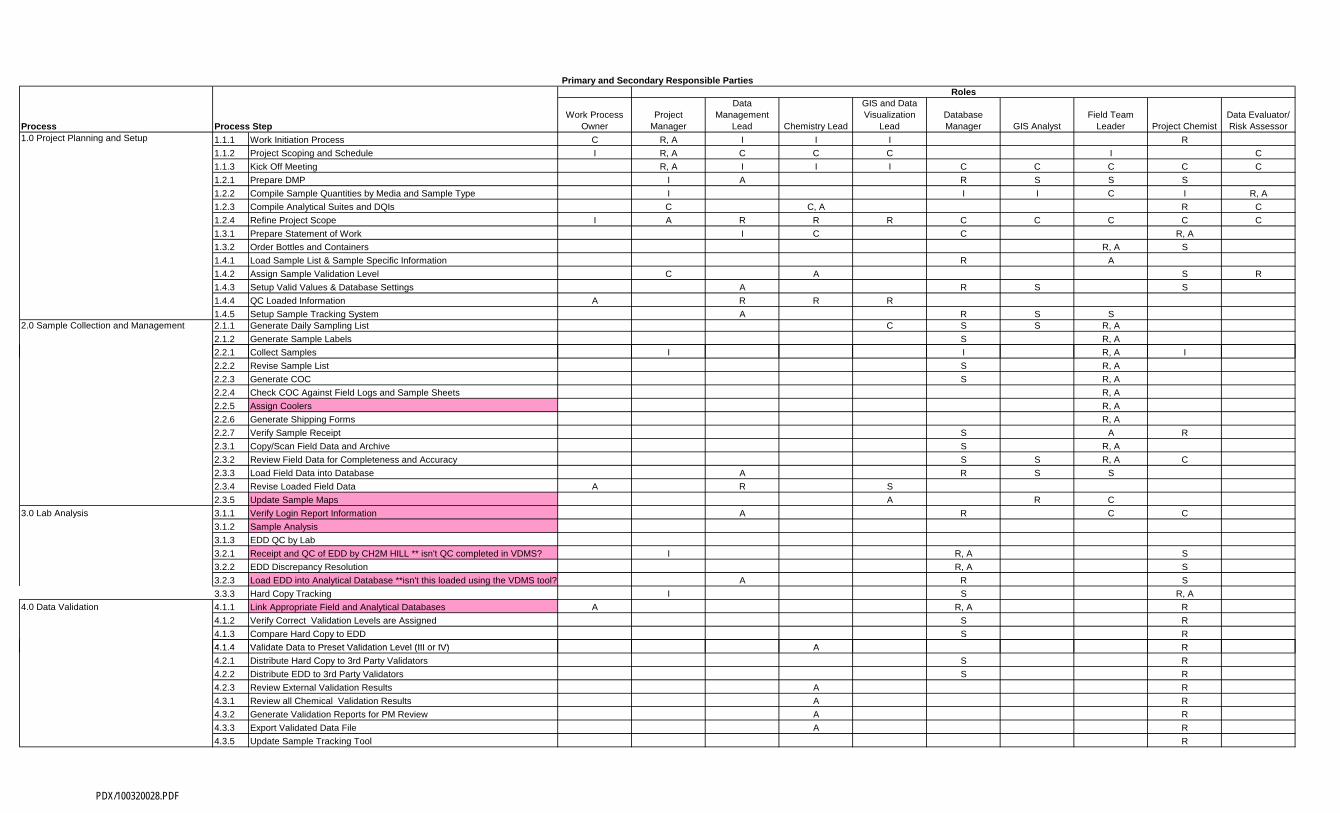
This document presents the standardized six-step workflow process for environmental data management being performed for the Former Galena Forward Operating Location (FOL) Program. Attachment J-1 includes personnel responsible for approving, supporting, consulting, and informing (RASCI) each activity in the Galena Program Data Management Plan (DMP). The workflow process consists of the following six steps:
1. Project planning and database setup 2. Sample collection and management 3. Laboratory analysis 4. Data validation and loading 5. Data management 6. Data evaluation and reporting
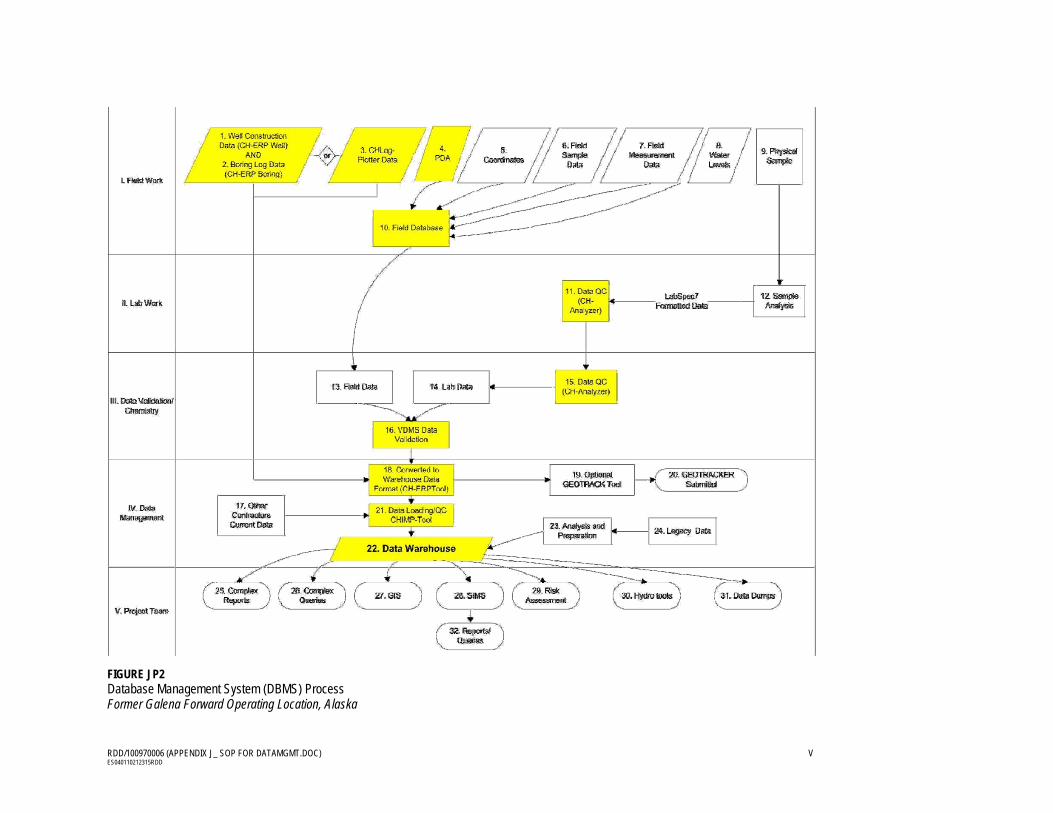
Figure JP1 presents a simplified workflow process for data management specific to the Galena Program. Figure JP2 presents, in more detail, the tools used in each step of the process.
Attachment J-2 contains a data flow diagram that outlines the tools used to help collect data for all program and project activities. These tools include the following:
Sample Tracking Program (STP). CH2M HILL uses this program to initiate the sample collection, documentation, and tracking processes.
CH-Analyzer and Validation Data Management System (VDMS) software. During the laboratory analysis and data validation phase, this software will be used to help evaluate the quality of the data.
CH-ERPTool and CH-IMPTool. At the data management step, for importing data into the Galena Program data warehouse, the CH-ERPTool will be used to format the data and the CH-IMPTool will be used to transfer the data into the data warehouse.
CH-Standard Export Xtab Tool. At the data evaluation stage, this tool will be used to produce data tables and comparisons to project action levels.
Site Information Management System Visual Interface to the data warehouse. This application is often used to access and query data.
Appropriate section(s) of this DMP include additional details on each of the tools used.
APPENDIX J: STANDARD OPERATING PROCEDURES FOR DATA MANAGEMENT WORK PLAN FOR SITE INSPECTION, REMEDIAL INVESTIGATION, AND SITE CHARACTERIZATION FORMER GALENA FORWARD OPERATING LOCATION, ALASKA AFCEE CONTRACT FA8903-08-D-8769, TASK ORDER 0184
IV RDD/100970006 (APPENDIX J_ SOP FOR DATAMGMT.DOC) ES040110212315RDD
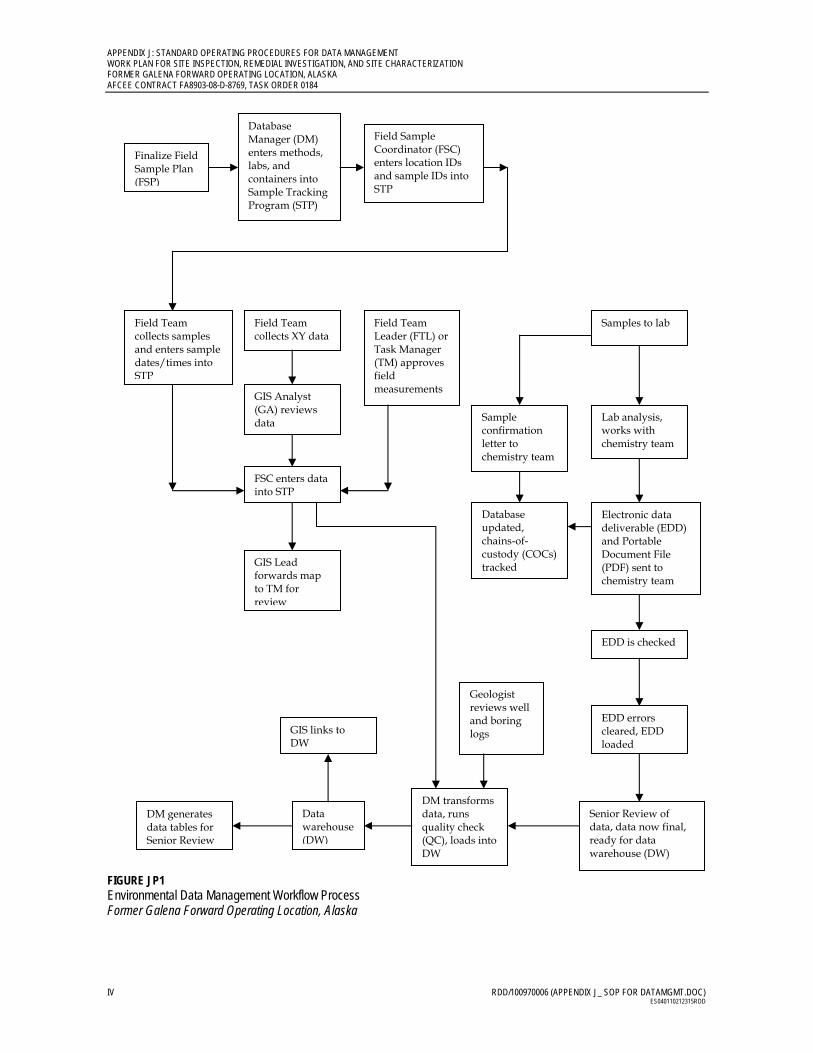
FIGURE JP1 Environmental Data Management Workflow Process Former Galena Forward Operating Location, Alaska
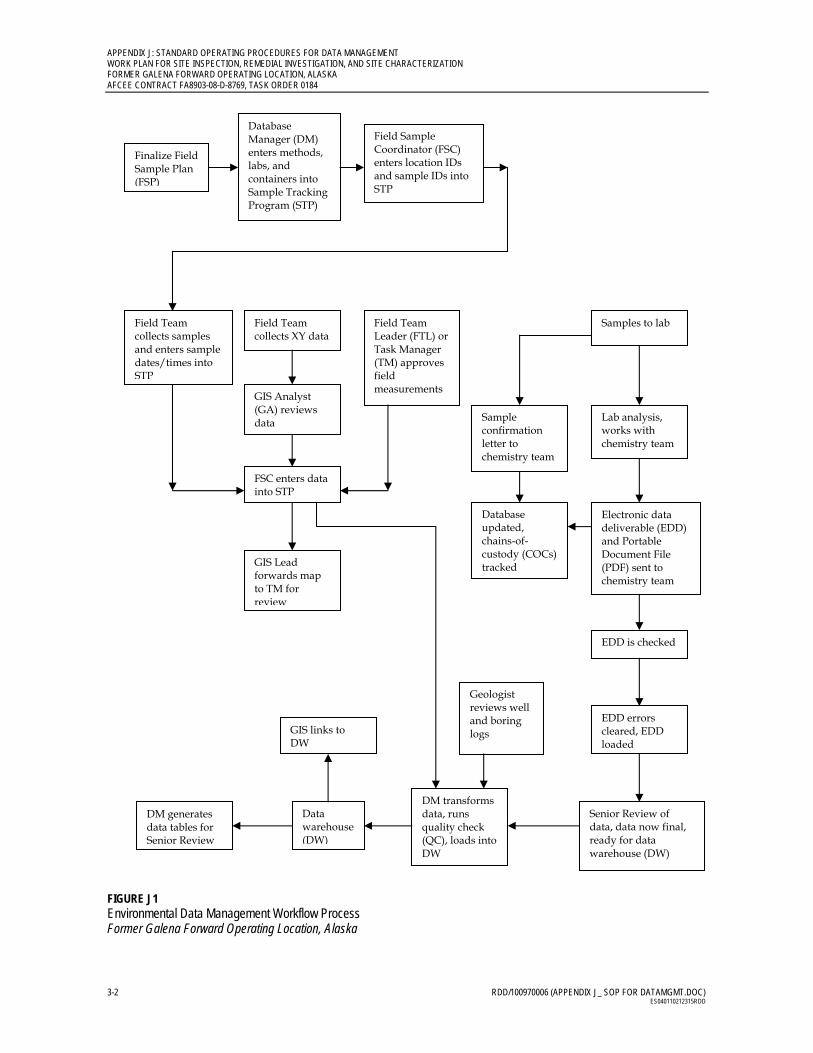
Finalize Field Sample Plan (FSP)
Database Manager (DM) enters methods, labs, and containers into Sample Tracking Program (STP)
Field Sample Coordinator (FSC) enters location IDs and sample IDs into STP
Field Team collects samples and enters sample dates/times into STP
Field Team collects XY data
Field Team Leader (FTL) or Task Manager (TM) approves field measurements
Geologist reviews well and boring logs
Samples to lab
GIS Analyst (GA) reviews data
FSC enters data into STP
GIS Lead forwards map to TM for review
Sample confirmation letter to chemistry team
Lab analysis, works with chemistry team
Electronic data deliverable (EDD) and Portable Document File (PDF) sent to chemistry team
EDD is checked
Database updated, chains-of-custody (COCs) tracked
EDD errors cleared, EDD loaded
Senior Review of data, data now final, ready for data warehouse (DW)
DM transforms data, runs quality check (QC), loads into DW
Data warehouse (DW)
GIS links to DW
DM generates data tables for Senior Review
RDD/100970006 (APPENDIX J_ SOP FOR DATAMGMT.DOC) V ES040110212315RDD
FIGURE JP2 Database Management System (DBMS) Process Former Galena Forward Operating Location, Alaska
Contents
Page
RDD/100970006 (APPENDIX J_ SOP FOR DATAMGMT.DOC) VII ES040110212315RDD
Preface ............................................................................................................................................... iii
1 Introduction ....................................................................................................................... 1-1 1.1 Purpose and Objective ......................................................................................... 1-1 1.2 Scope of the Data Management Plan ................................................................. 1-2
2 Roles and Responsibilities .............................................................................................. 2-1
3 Data Management System Description ........................................................................ 3-1
4 Project Planning, Database Setup, and Sample Collection and Management ..... 4-1 4.1 Project Planning .................................................................................................... 4-1
4.1.1 Database Setup and Administration ..................................................... 4-2 4.1.2 Data Security Procedures ........................................................................ 4-3 4.1.3 Data Backup and Recovery .................................................................... 4-3
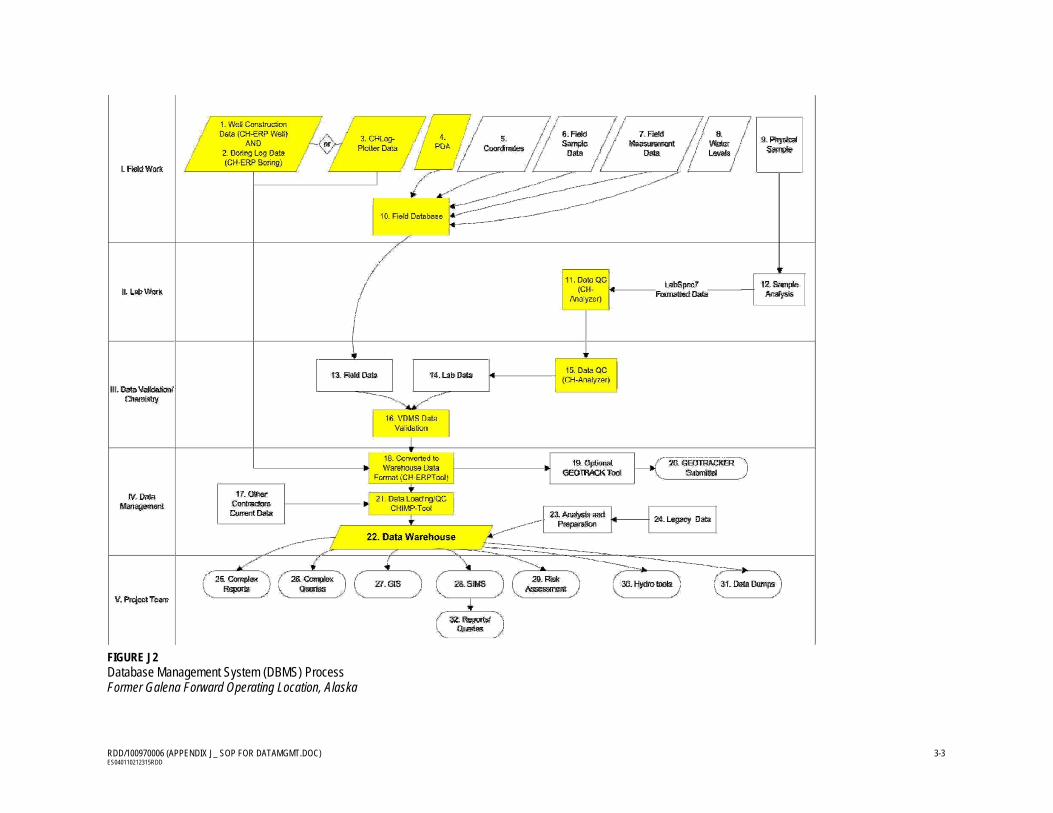
4.2 Sample Tracking Program (Figure J2, Box 10) .................................................. 4-3 4.2.1 Sample Nomenclature Guidelines ......................................................... 4-4 4.2.2 Chain-of-Custody and eData ................................................................. 4-5
4.3 Laboratory Analysis, Data Validation, and Data Loading ............................. 4-5 4.4 Data Management, Data Evaluation, and Reporting ....................................... 4-6
4.4.1 Data Management System (Figure J2, boxes 18, 21) ........................... 4-7 4.4.2 Data Warehouse (Figure J2, box 22) ...................................................... 4-7 4.4.3 Tables, Figures, and Diagrams ............................................................... 4-8 4.4.4 GIS and AutoCAD ................................................................................... 4-9 4.4.5 Legacy Data ............................................................................................ 4-10
5 Project Closeout ................................................................................................................ 5-1
6 Change Management ....................................................................................................... 6-3
Tables
J1 Galena Environmental Data Management Program Team .......................................... 2-2
Figures
J1 Environmental Data Management Workflow Process .................................................. 3-2 J3 Project Planning .................................................................................................................. 4-2 J4 Field Sampling..................................................................................................................... 4-4 J5 Laboratory Analysis ........................................................................................................... 4-5
Contents, Continued
VIII RDD/100970006 (APPENDIX J_ SOP FOR DATAMGMT.DOC) ES040110212315RDD
Attachments
J-1 RASCI/Workflow Process J-2 Data Collection Flow Diagram J-3 Standard Operating Procedures J-4 Process Flow Diagram for Producing Figures
RDD/100970006 (APPENDIX J_ SOP FOR DATAMGMT.DOC) 1-1 ES040110212315RDD
SECTION 1
Introduction
This Data Management Plan (DMP) describes the methods CH2M HILL will use to manage and present environmental data to support work at the Former Galena Forward Operating Location (FOL). These processes and procedures are part of an overall environmental data management system CH2M HILL hosts called the Validation Data Management System (VDMS).
Project members and any subcontractors supporting program data needs for site characterization and remediation activities can use this DMP. It is a living document that is flexible enough to meet the dynamic needs of the teams and stakeholders. The attachments include DMP details and procedures.
1.1 Purpose and Objective This document outlines how environmental data for the Galena Program will be obtained and managed using an Enterprise Management Solutions (EMS) approach. This systematic approach will:
Facilitate the retrieval of data from project files and the data warehouse when they are needed
Help ensure that the required data are collected and are of the appropriate quality
Help ensure that data records are not lost during transfer to the central program database repository
The following EMS objectives are critical to the success of this DMP:
Standardize and facilitate data collection. Use standard field forms and database applications; provide guidance and standard operating procedures (SOPs) for formatting, reviewing, and transferring data collected in the field to the Database Management System (DBMS).
Provide the ability to capture electronically field data directly or indirectly. Items that will be captured through standardized forms or applications include chains-of-custody (COCs), field parameter information, groundwater elevation data, and sample tracking records.
Minimize the uncertainties associated with the data. Implement quality assurance (QA) and quality control (QC) measures to provide accurate representation of all data collected and stored in the DBMS. QA/QC procedures include restricting data import or entry to specific valid value lists that will not allow incorrect data to be included in the DBMS.
APPENDIX J: STANDARD OPERATING PROCEDURES FOR DATA MANAGEMENT WORK PLAN FOR SITE INSPECTION, REMEDIAL INVESTIGATION, AND SITE CHARACTERIZATION FORMER GALENA FORWARD OPERATING LOCATION, ALASKA AFCEE CONTRACT FA8903-08-D-8769, TASK ORDER 0184
1-2 RDD/100970006 (APPENDIX J_ SOP FOR DATAMGMT.DOC) ES040110212315RDD
Provide a structured, yet flexible data set. The DBMS will store all types of environmental data and provide a standard framework for all projects within the Galena Program to use. The DBMS is organized and structured, yet flexible enough to allow additional data and data types to be added at any time over the life of the program.
Provide data that are well documented. Retain enough descriptive and source information for technical defensibility and legal admissibility of the data.
Provide end-users with tools to gain access to the data. Provide reporting and delivery support from a single DBMS source and allow relatively simple and rapid access to stored data for environmental characterization, report generation, modeling, geographic information system (GIS) mapping, statistical analyses, and risk assessments.
Provide data visualization capabilities. Offer accurate representations of data for use in models, GIS, boring log programs (such as the Environmental Visualization System [EVS]), computer-aided design (CAD), graphics, and other software used for mapping, graphing, charting, analyzing, and displaying environmental data.
Provide the ability to compare data electronically. Support electronic comparisons of project data to specific reference or screening criteria.
Provide the ability to transfer data to different formats. Provide the ability to reformat, convert, and transfer the data to any format that specific end-user applications require.
1.2 Scope of the Data Management Plan The scope of the data management activities addressed by this plan includes the following:
Defining staff roles and responsibilities (Attachment J-1).
Providing flow diagrams that illustrate how environmental data are collected, reviewed, and entered into the DBMS (Attachment J-2).
Specifying SOPs (Attachment J-3).
Describing and using data outputs (Attachment J-4).
Identifying electronic data deliverable (EDD) format specifications that analytical laboratories are required to use to transfer analytical data electronically to CH2M HILL. (These are provided to laboratories through a scope of work.)
Stipulating management and archive procedures for hard-copy and electronic project documentation.
RDD/100970006 (APPENDIX J_ SOP FOR DATAMGMT.DOC) 2-1 ES040110212315RDD
SECTION 1
Roles and Responsibilities
The Galena Program Environmental Data Services (EDS) team will work together to properly execute this DMP and ensure that the project objectives and scope are realized. The EDS team is composed of environmental, data, GIS, and EMS resources. The EDS team is responsible for all aspects of planning, executing, and reporting associated with environmental data. Data are derived from sampling events related to investigative and remedial activities for Galena Program projects.
Table J1 lists the titles and contact information for those on the Galena Environmental Data Management Program Team who are responsible for data management activities defined herein and summarized in Appendix J-1.
RDD/100970006 (APPENDIX J_ SOP FOR DATAMGMT.DOC) 2-2 ES040110212315RDD
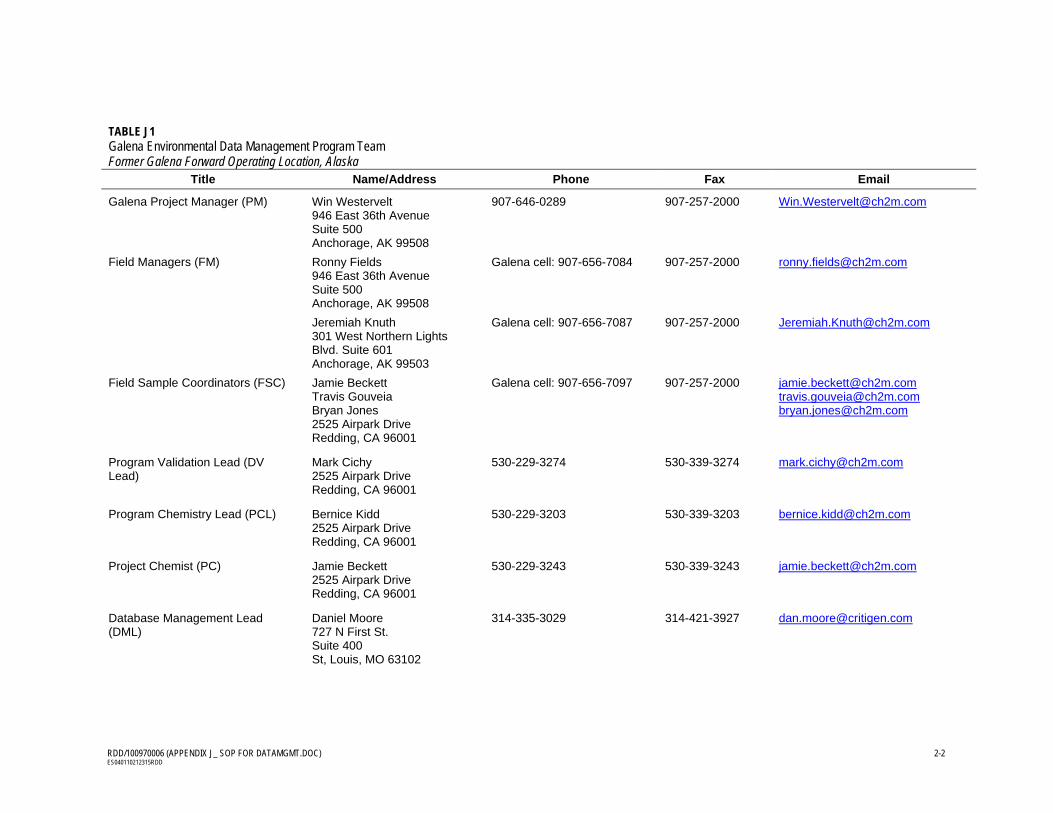
TABLE J1 Galena Environmental Data Management Program Team Former Galena Forward Operating Location, Alaska
Title Name/Address Phone Fax Email
Galena Project Manager (PM) Win Westervelt 946 East 36th Avenue Suite 500 Anchorage, AK 99508
907-646-0289 907-257-2000 [email protected]
Field Managers (FM) Ronny Fields 946 East 36th Avenue Suite 500 Anchorage, AK 99508
Jeremiah Knuth 301 West Northern Lights Blvd. Suite 601 Anchorage, AK 99503
Galena cell: 907-656-7084
Galena cell: 907-656-7087
907-257-2000
907-257-2000
Field Sample Coordinators (FSC) Jamie Beckett Travis Gouveia Bryan Jones 2525 Airpark Drive Redding, CA 96001
Galena cell: 907-656-7097 907-257-2000 [email protected] [email protected] [email protected]
Program Validation Lead (DV Lead)
Mark Cichy 2525 Airpark Drive Redding, CA 96001
530-229-3274 530-339-3274 [email protected]
Program Chemistry Lead (PCL) Bernice Kidd 2525 Airpark Drive Redding, CA 96001
530-229-3203 530-339-3203 [email protected]
Project Chemist (PC) Jamie Beckett 2525 Airpark Drive Redding, CA 96001
530-229-3243 530-339-3243 [email protected]
Database Management Lead (DML)
Daniel Moore 727 N First St. Suite 400 St, Louis, MO 63102
314-335-3029 314-421-3927 [email protected]
RDD/100970006 (APPENDIX J_ SOP FOR DATAMGMT.DOC) 2-3 ES040110212315RDD
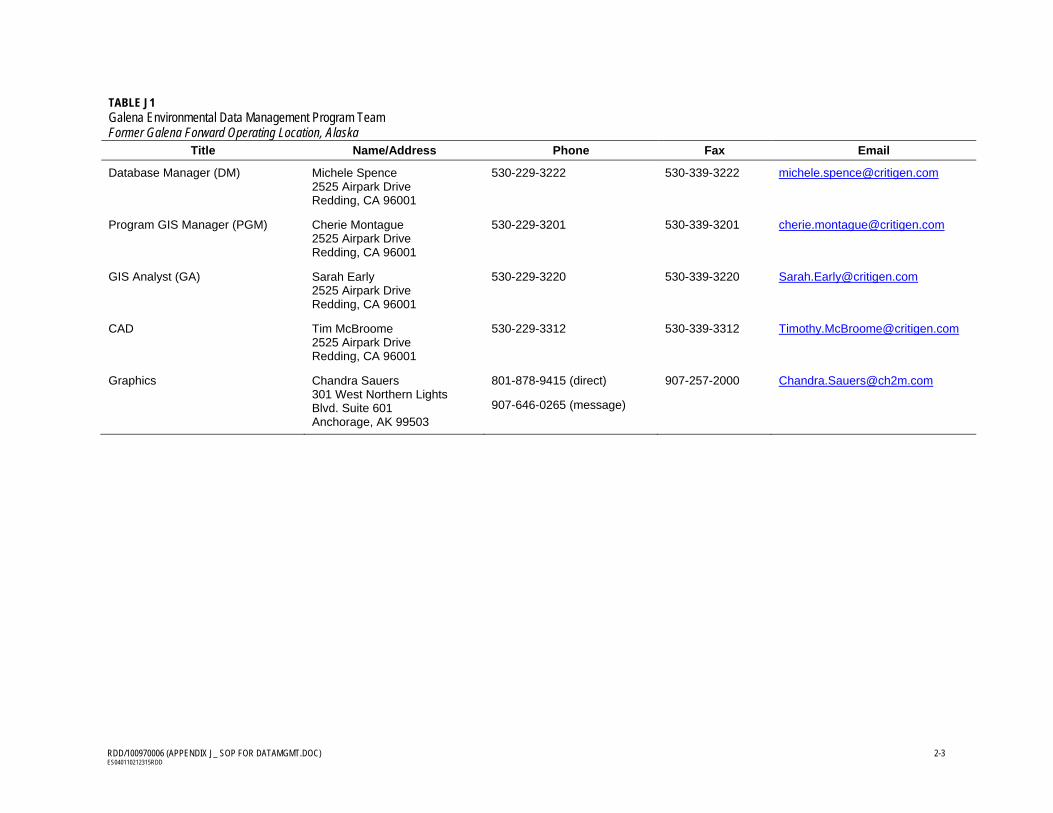
TABLE J1 Galena Environmental Data Management Program Team Former Galena Forward Operating Location, Alaska
Title Name/Address Phone Fax Email
Database Manager (DM) Michele Spence 2525 Airpark Drive Redding, CA 96001
530-229-3222 530-339-3222 [email protected]
Program GIS Manager (PGM) Cherie Montague 2525 Airpark Drive Redding, CA 96001
530-229-3201 530-339-3201 [email protected]
GIS Analyst (GA) Sarah Early 2525 Airpark Drive Redding, CA 96001
530-229-3220 530-339-3220 [email protected]
CAD Tim McBroome 2525 Airpark Drive Redding, CA 96001
530-229-3312 530-339-3312 [email protected]
Graphics Chandra Sauers 301 West Northern Lights Blvd. Suite 601 Anchorage, AK 99503
801-878-9415 (direct)
907-646-0265 (message)
907-257-2000 [email protected]
APPENDIX J: STANDARD OPERATING PROCEDURES FOR DATA MANAGEMENT WORK PLAN FOR SITE INSPECTION, REMEDIAL INVESTIGATION, AND SITE CHARACTERIZATION FORMER GALENA FORWARD OPERATING LOCATION, ALASKA AFCEE CONTRACT FA8903-08-D-8769, TASK ORDER 0184
2-4 RDD/100970006 (APPENDIX J_ SOP FOR DATAMGMT.DOC) ES040110212315RDD
This page intentionally left blank.
RDD/100970006 (APPENDIX J_ SOP FOR DATAMGMT.DOC) 3-1 ES040110212315RDD
SECTION 3
Data Management System Description
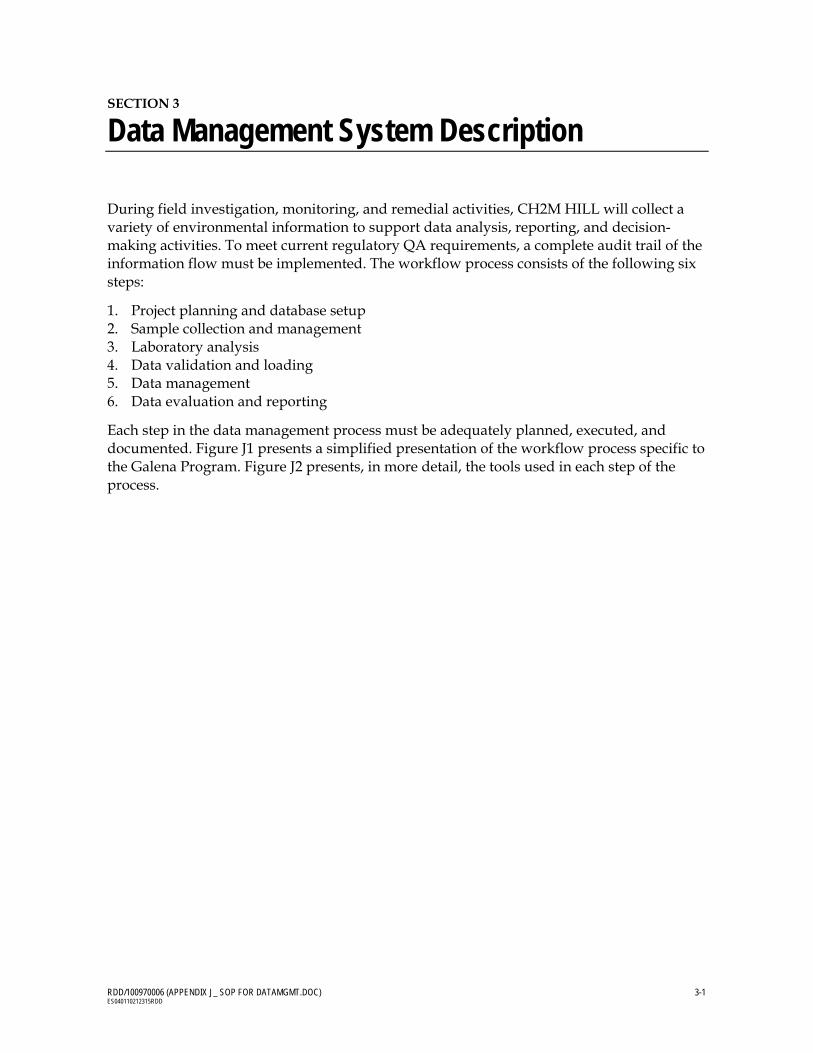
During field investigation, monitoring, and remedial activities, CH2M HILL will collect a variety of environmental information to support data analysis, reporting, and decision-making activities. To meet current regulatory QA requirements, a complete audit trail of the information flow must be implemented. The workflow process consists of the following six steps:
1. Project planning and database setup 2. Sample collection and management 3. Laboratory analysis 4. Data validation and loading 5. Data management 6. Data evaluation and reporting
Each step in the data management process must be adequately planned, executed, and documented. Figure J1 presents a simplified presentation of the workflow process specific to the Galena Program. Figure J2 presents, in more detail, the tools used in each step of the process.
APPENDIX J: STANDARD OPERATING PROCEDURES FOR DATA MANAGEMENT WORK PLAN FOR SITE INSPECTION, REMEDIAL INVESTIGATION, AND SITE CHARACTERIZATION FORMER GALENA FORWARD OPERATING LOCATION, ALASKA AFCEE CONTRACT FA8903-08-D-8769, TASK ORDER 0184
3-2 RDD/100970006 (APPENDIX J_ SOP FOR DATAMGMT.DOC) ES040110212315RDD
FIGURE J1 Environmental Data Management Workflow Process Former Galena Forward Operating Location, Alaska
Finalize Field Sample Plan (FSP)
Database Manager (DM) enters methods, labs, and containers into Sample Tracking Program (STP)
Field Sample Coordinator (FSC) enters location IDs and sample IDs into STP
Field Team collects samples and enters sample dates/times into STP
Field Team collects XY data
Field Team Leader (FTL) or Task Manager (TM) approves field measurements
Geologist reviews well and boring logs
Samples to lab
GIS Analyst (GA) reviews data
FSC enters data into STP
GIS Lead forwards map to TM for review
Sample confirmation letter to chemistry team
Lab analysis, works with chemistry team
Electronic data deliverable (EDD) and Portable Document File (PDF) sent to chemistry team
EDD is checked
Database updated, chains-of-custody (COCs) tracked
EDD errors cleared, EDD loaded
Senior Review of data, data now final, ready for data warehouse (DW)
DM transforms data, runs quality check (QC), loads into DW
Data warehouse (DW)
GIS links to DW
DM generates data tables for Senior Review
RDD/100970006 (APPENDIX J_ SOP FOR DATAMGMT.DOC) 3-3 ES040110212315RDD
FIGURE J2 Database Management System (DBMS) Process Former Galena Forward Operating Location, Alaska
APPENDIX J: STANDARD OPERATING PROCEDURES FOR DATA MANAGEMENT WORK PLAN FOR SITE INSPECTION, REMEDIAL INVESTIGATION, AND SITE CHARACTERIZATION FORMER GALENA FORWARD OPERATING LOCATION, ALASKA AFCEE CONTRACT FA8903-08-D-8769, TASK ORDER 0184
3-4 RDD/100970006 (APPENDIX J_ SOP FOR DATAMGMT.DOC) ES040110212315RDD
This page intentionally left blank.
RDD/100970006 (APPENDIX J_ SOP FOR DATAMGMT.DOC) 4-1 ES040110212315RDD
SECTION 4
Project Planning, Database Setup, and Sample Collection and Management
This section provides information about the following topics:
1. Project planning 2. Sample Tracking Program 3. Laboratory analysis, data validation, and data loading 4. Data management, data evaluation, and reporting
4.1 Project Planning Project planning starts when a new project or task is identified in the Galena Program. To determine the data needs, data management and visualization requirements are evaluated. The Program GIS Manager (PGM) and Database Management Lead (DML) work with the Project Manager (PM) to determine what is expected and required from the visualization and data management team. The following specific items should be considered:
Inputs. Determine what data will be collected and stored in the database. Determine frequency and quantity. Determine what tools will be used to handle data input.
Historical data. This unique data input requires special consideration. The DML must work with the other technical leads to assess what effort will be required.
Outputs. Determine what data will need to be presented in reports, figures, and electronic deliverables. Determine frequency and quality requirements. Determine preliminary data, validated data, and what tools will most effectively handle the output requirements. Discuss how the outputs needed by the team will be requested and documented in the project setup checklist.
Visualization. Determine whether GIS and CAD are necessary.
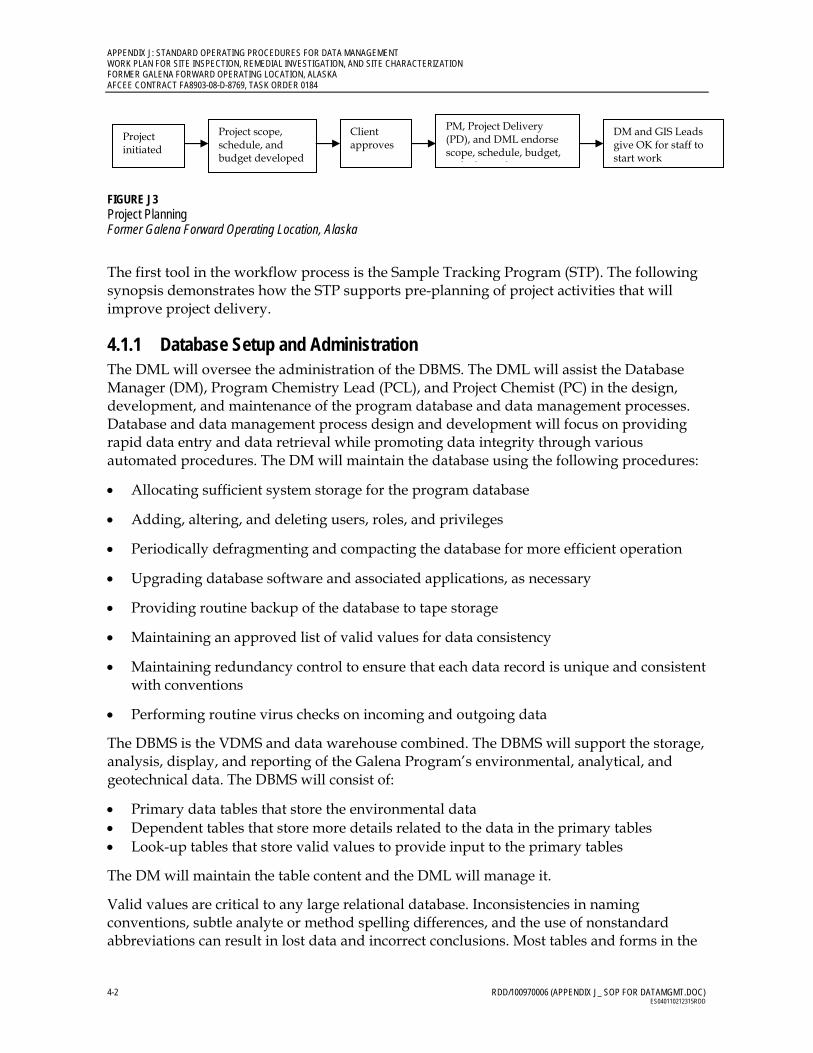
After that information has been gathered, the data management scope, schedule, and budget are developed and endorsed by the PM. The team can then proceed to have the client authorize the overall project budget. Figure J3 shows the process for project planning.
APPENDIX J: STANDARD OPERATING PROCEDURES FOR DATA MANAGEMENT WORK PLAN FOR SITE INSPECTION, REMEDIAL INVESTIGATION, AND SITE CHARACTERIZATION FORMER GALENA FORWARD OPERATING LOCATION, ALASKA AFCEE CONTRACT FA8903-08-D-8769, TASK ORDER 0184
4-2 RDD/100970006 (APPENDIX J_ SOP FOR DATAMGMT.DOC) ES040110212315RDD
FIGURE J3 Project Planning Former Galena Forward Operating Location, Alaska
The first tool in the workflow process is the Sample Tracking Program (STP). The following synopsis demonstrates how the STP supports pre-planning of project activities that will improve project delivery.
4.1.1 Database Setup and Administration The DML will oversee the administration of the DBMS. The DML will assist the Database Manager (DM), Program Chemistry Lead (PCL), and Project Chemist (PC) in the design, development, and maintenance of the program database and data management processes. Database and data management process design and development will focus on providing rapid data entry and data retrieval while promoting data integrity through various automated procedures. The DM will maintain the database using the following procedures:
Allocating sufficient system storage for the program database
Adding, altering, and deleting users, roles, and privileges
Periodically defragmenting and compacting the database for more efficient operation
Upgrading database software and associated applications, as necessary
Providing routine backup of the database to tape storage
Maintaining an approved list of valid values for data consistency
Maintaining redundancy control to ensure that each data record is unique and consistent with conventions
Performing routine virus checks on incoming and outgoing data
The DBMS is the VDMS and data warehouse combined. The DBMS will support the storage, analysis, display, and reporting of the Galena Program’s environmental, analytical, and geotechnical data. The DBMS will consist of:
Primary data tables that store the environmental data Dependent tables that store more details related to the data in the primary tables Look-up tables that store valid values to provide input to the primary tables
The DM will maintain the table content and the DML will manage it.
Valid values are critical to any large relational database. Inconsistencies in naming conventions, subtle analyte or method spelling differences, and the use of nonstandard abbreviations can result in lost data and incorrect conclusions. Most tables and forms in the
Project initiated
Project scope, schedule, and budget developed
Client approves
PM, Project Delivery (PD), and DML endorse scope, schedule, budget,
d j b b
DM and GIS Leads give OK for staff to start work
APPENDIX J: STANDARD OPERATING PROCEDURES FOR DATA MANAGEMENT WORK PLAN FOR SITE INSPECTION, REMEDIAL INVESTIGATION, AND SITE CHARACTERIZATION
FORMER GALENA FORWARD OPERATING LOCATION, ALASKA AFCEE CONTRACT FA8903-08-D-8769, TASK ORDER 0184
RDD/100970006 (APPENDIX J_ SOP FOR DATAMGMT.DOC) 4-3 ES040110212315RDD
database will use look-up tables for acceptable valid values and will not allow the entry of data that do not conform.
A primary purpose of managing data in a relational database environment is to ensure that each data record is unique and that the information contained within each field is consistent with conventions defined in other areas of the database. To ensure uniqueness, a key field or fields will be identified for each data record. Key fields define the record as unique. The VDMS architecture supports this approach and eliminates the possibility of data redundancy.
4.1.2 Data Security Procedures Some VDMS applications and data are stored in a secure location with login and password protection. Access to the DBMS will be controlled by user name and password and limited to staff approved by the PM and DML. The DML will provide security access to these tools. Microsoft Access 2003 must be installed on the computer that the user will be using to run these applications, and proper licenses must be distributed. Files received from any subcontractors will be scanned for common viruses using industry-standard, current virus protection programs. The file servers storing the data must be running current virus protection software, with automatic virus signature updates.
4.1.3 Data Backup and Recovery All project data management files will reside on a CH2M HILL server. A tape backup or equivalent will be created in accordance with CH2M HILL’s network server management policy.
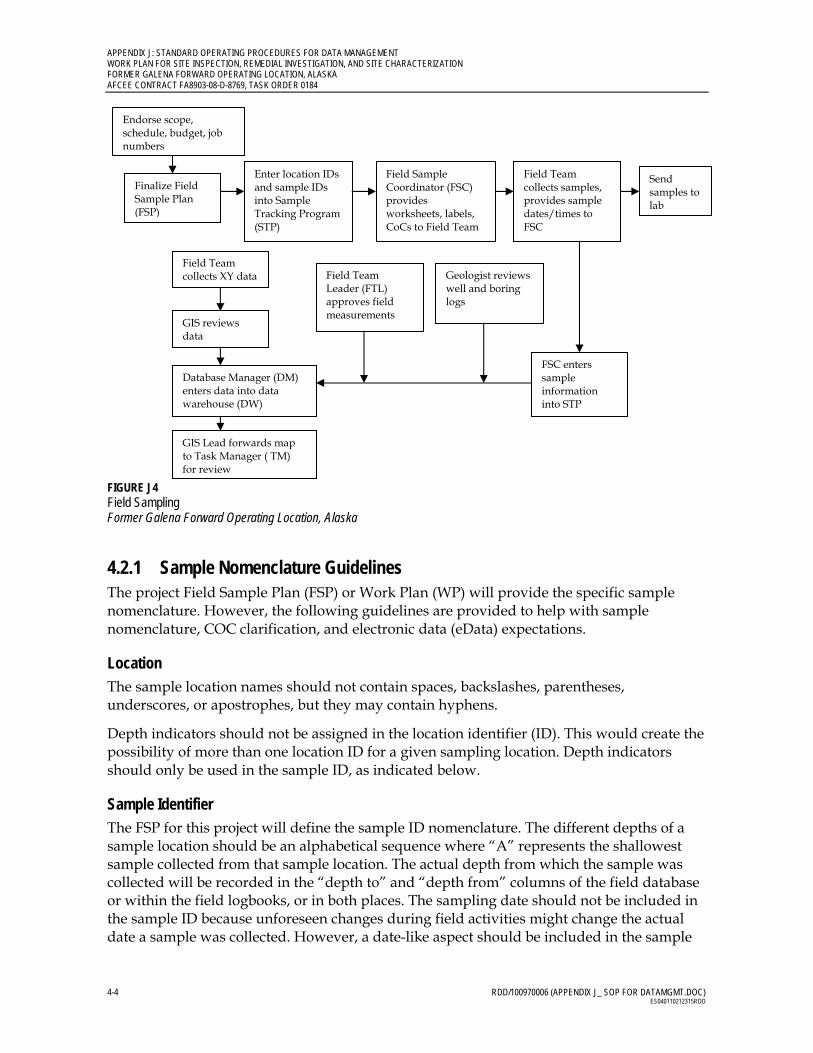
4.2 Sample Tracking Program (Figure J2, Box 10) During the planning stage, the PM, Field Team Leader (FTL), or Field Sample Coordinator (FSC) will specify the data requirements for the sampling event. The work plan or similar document will provide project-specific data requirements for a given sampling event. Figure J4 shows the process for planning and executing field-sampling events.
The FTL or FSC is responsible for reviewing the Sampling and Analysis Plan and specifying the amount of field and laboratory QC information required for the sampling event (trip blanks, equipment blanks, field blanks, field duplicates [FDs], matrix spikes [MSs], and matrix spike duplicates [MSDs]). All of this information must be entered into the STP.
The STP will be used to:
Develop work schedules and daily assignments for field crews Identify sampling container and preservation requirements Identify appropriate analytical laboratories for samples Print labels for sample bottles before the sample event Prepare and print COC forms after sampling is complete.
APPENDIX J: STANDARD OPERATING PROCEDURES FOR DATA MANAGEMENT WORK PLAN FOR SITE INSPECTION, REMEDIAL INVESTIGATION, AND SITE CHARACTERIZATION FORMER GALENA FORWARD OPERATING LOCATION, ALASKA AFCEE CONTRACT FA8903-08-D-8769, TASK ORDER 0184
4-4 RDD/100970006 (APPENDIX J_ SOP FOR DATAMGMT.DOC) ES040110212315RDD
FIGURE J4 Field Sampling Former Galena Forward Operating Location, Alaska
4.2.1 Sample Nomenclature Guidelines The project Field Sample Plan (FSP) or Work Plan (WP) will provide the specific sample nomenclature. However, the following guidelines are provided to help with sample nomenclature, COC clarification, and electronic data (eData) expectations.
Location The sample location names should not contain spaces, backslashes, parentheses, underscores, or apostrophes, but they may contain hyphens.
Depth indicators should not be assigned in the location identifier (ID). This would create the possibility of more than one location ID for a given sampling location. Depth indicators should only be used in the sample ID, as indicated below.
Sample Identifier The FSP for this project will define the sample ID nomenclature. The different depths of a sample location should be an alphabetical sequence where “A” represents the shallowest sample collected from that sample location. The actual depth from which the sample was collected will be recorded in the “depth to” and “depth from” columns of the field database or within the field logbooks, or in both places. The sampling date should not be included in the sample ID because unforeseen changes during field activities might change the actual date a sample was collected. However, a date-like aspect should be included in the sample
Endorse scope, schedule, budget, job numbers
Finalize Field Sample Plan (FSP)
Enter location IDs and sample IDs into Sample Tracking Program (STP)
Field Sample Coordinator (FSC) provides worksheets, labels, CoCs to Field Team
Send samples to lab
Field Team collects XY data Field Team
Leader (FTL) approves field measurements
Geologist reviews well and boring logs
GIS reviews data
Database Manager (DM) enters data into data warehouse (DW)
GIS Lead forwards map to Task Manager ( TM) for review
FSC enters sample information into STP
Field Team collects samples, provides sample dates/times to FSC
APPENDIX J: STANDARD OPERATING PROCEDURES FOR DATA MANAGEMENT WORK PLAN FOR SITE INSPECTION, REMEDIAL INVESTIGATION, AND SITE CHARACTERIZATION
FORMER GALENA FORWARD OPERATING LOCATION, ALASKA AFCEE CONTRACT FA8903-08-D-8769, TASK ORDER 0184
RDD/100970006 (APPENDIX J_ SOP FOR DATAMGMT.DOC) 4-5 ES040110212315RDD
ID to make it unique, such as month and year (that is, 0510) or sampling quarter and year (that is, 3Q10).
4.2.2 Chain-of-Custody and eData A single COC number for each laboratory and for each project should be generated each day. (One COC number can have multiple pages.) MSs and MSDs will be requested at a set frequency for each project (usually one per 20 samples collected). MS and MSD samples should not be taken from FDs or field blanks. FDs will be requested at a set frequency for each project (usually one per 10 samples). FDs should not be taken from MSs, MSDs, or field blanks. The laboratory should spike and analyze the MS and MSD samples listed on the COC.
Once the field data and samples have been collected, the FSC will enter information on sampling date and time into the STP and, as necessary, field measurements (such as water levels and other data collected in the field). For any data entered into the STP, a hard-copy printout must be generated to facilitate a manual QC review of the data. After its QC, this original hard-copy printout will be included in the cooler and sent to the laboratory, with a copy maintained in the onsite project file. In addition, versions of the printout must be emailed to the PM, the PC, and the laboratory.
The information entered into the STP is will be exported into CH2M HILL’s VDMS, where field data and laboratory analytical data are linked by location ID and sample ID. This procedure allows verification that the laboratory has received all sample and method combinations.
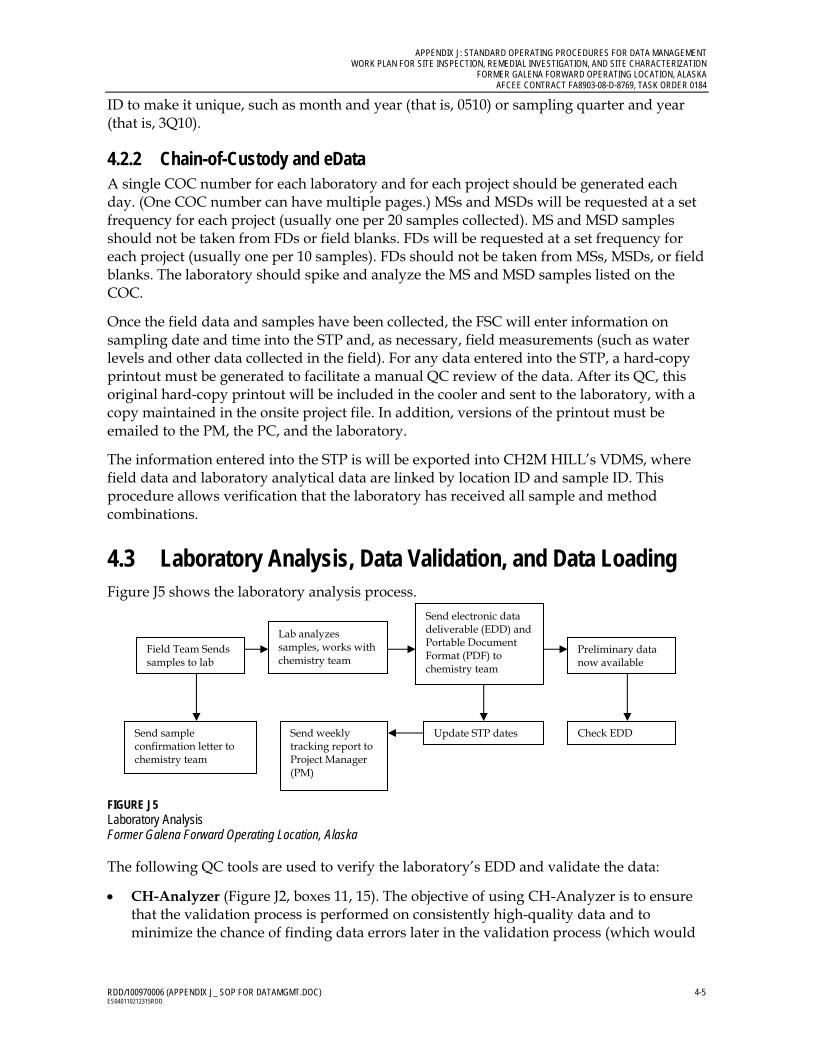
4.3 Laboratory Analysis, Data Validation, and Data Loading Figure J5 shows the laboratory analysis process.
FIGURE J5 Laboratory Analysis Former Galena Forward Operating Location, Alaska The following QC tools are used to verify the laboratory’s EDD and validate the data:
CH-Analyzer (Figure J2, boxes 11, 15). The objective of using CH-Analyzer is to ensure that the validation process is performed on consistently high-quality data and to minimize the chance of finding data errors later in the validation process (which would
Field Team Sends samples to lab
Lab analyzes samples, works with chemistry team
Send sample confirmation letter to chemistry team
Send electronic data deliverable (EDD) and Portable Document Format (PDF) to chemistry team
Send weekly tracking report to Project Manager (PM)
Preliminary data now available
Update STP dates Check EDD
APPENDIX J: STANDARD OPERATING PROCEDURES FOR DATA MANAGEMENT WORK PLAN FOR SITE INSPECTION, REMEDIAL INVESTIGATION, AND SITE CHARACTERIZATION FORMER GALENA FORWARD OPERATING LOCATION, ALASKA AFCEE CONTRACT FA8903-08-D-8769, TASK ORDER 0184
4-6 RDD/100970006 (APPENDIX J_ SOP FOR DATAMGMT.DOC) ES040110212315RDD
require the laboratory to resend corrected data and start the validation process over again).
Before the laboratory analytical data are entered into VDMS, the laboratory EDD must be processed through CH2M HILL’s CH-Analyzer (an Access database application). The CH-Analyzer application includes several automated diagnostic checks to verify that the format and content comply with EDD specifications. The analytical laboratory must correct any errors before transmitting the EDD to CH2M HILL. The laboratory forwards the CH-Analyzer report and the checked EDD and hard-copy printout of the data to the PCL. The PCL will manage the EDD verification process and data loading, tasks a PC or DM usually performs.
The EDD will be checked again using CH-Analyzer to verify that the format and content are correct. If errors are found, the file will be returned to the laboratory for correction and resubmittal. Even if the formatting of the EDD is completely correct, the data loader may reject the EDD if the contents of the file do not comply with the data library standardization requirements.
CH-Analyzer also should be used to compare COCs, hard-copy printout, and EDD content, and to resolve discrepancies and document data error issues (for example, EDD re-submissions, turnaround-time problems, hard-copy printout incompleteness). These checks ensure that the EDD’s content is consistent and valid before the data are electronically transferred to VDMS.
VDMS (Figure J2, box 16)
Once the EDD verification has been completed, the data are electronically transferred into CH2M HILL’s VDMS tool for data quality verification and validation according to project specifications. During the import process, the data are checked against a list of valid values. Once all error messages have been resolved, validation can begin.
VDMS will be operated in a semi-automated mode. This will require the chemist to configure various tables with QC information, associated validation logic, and qualifiers that would be applied when QC criteria were not achieved. Qualifier criteria will be based on the Quality Assurance Project Plan. The PCL will provide input and oversight to ensure that the PC correctly applies data flags.
4.4 Data Management, Data Evaluation, and Reporting Data management includes the following tasks:
Retrieving data from the data warehouse for project deliverables, data visualization, or consumption by third parties
Reviewing initial data and producing data queries and draft reports to dissect and disassemble the data
APPENDIX J: STANDARD OPERATING PROCEDURES FOR DATA MANAGEMENT WORK PLAN FOR SITE INSPECTION, REMEDIAL INVESTIGATION, AND SITE CHARACTERIZATION
FORMER GALENA FORWARD OPERATING LOCATION, ALASKA AFCEE CONTRACT FA8903-08-D-8769, TASK ORDER 0184
RDD/100970006 (APPENDIX J_ SOP FOR DATAMGMT.DOC) 4-7 ES040110212315RDD
Producing any requested client and regulatory agency data deliverables
Performing database maintenance and administration
This section discusses the following data management, data evaluation, and reporting topics:
Data management system Data warehouse Tables, figures, and diagrams GIS and AutoCAD Site Information Management System Legacy data
4.4.1 Data Management System (Figure J2, boxes 18, 21) The backbone of the data management system is a SQL-server-based data warehouse. Once the PCL or designee validates and approves the data, they are exported from VDMS to the data warehouse. Field and laboratory data are merged into a format that is amenable to the data warehouse.
4.4.2 Data Warehouse (Figure J2, box 22) This section describes the following aspects of the data warehouse:
Data structure Data loading Data integrity Data use
Data Structure The data warehouse is a Microsoft® SQL Server 2005 relational database. The data structure of this database, and all other “CH” tools used, has been designed to comply with the Environmental Restoration Program Information Management System (ERPIMS) standard specified by the Air Force Center for Engineering and the Environment (AFCEE). ERPIMS is an effective, comprehensive standard for environmental management.
Data Loading As part of the normal process of loading data into the data warehouse, data standardization tasks must be completed. The DM will load data into the data warehouse using the following two programs—CH-ERPTool and CH-IMPTool.
CH-ERPTool. This program runs an extensive series of logical QC checks and formats the data to be compatible with the data warehouse structure.
CH-IMPTool. This program runs an additional series of QC checks; adds project-specific formatting and valid values; and loads the data into the data warehouse.
APPENDIX J: STANDARD OPERATING PROCEDURES FOR DATA MANAGEMENT WORK PLAN FOR SITE INSPECTION, REMEDIAL INVESTIGATION, AND SITE CHARACTERIZATION FORMER GALENA FORWARD OPERATING LOCATION, ALASKA AFCEE CONTRACT FA8903-08-D-8769, TASK ORDER 0184
4-8 RDD/100970006 (APPENDIX J_ SOP FOR DATAMGMT.DOC) ES040110212315RDD
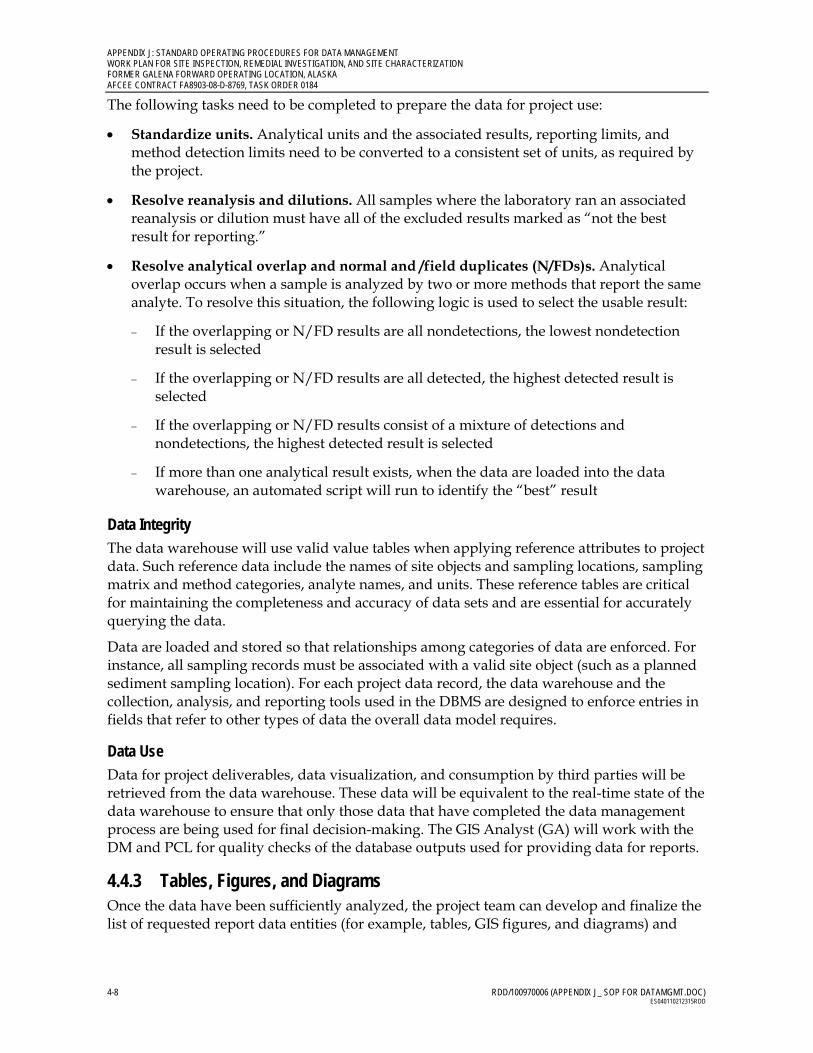
The following tasks need to be completed to prepare the data for project use:
Standardize units. Analytical units and the associated results, reporting limits, and method detection limits need to be converted to a consistent set of units, as required by the project.
Resolve reanalysis and dilutions. All samples where the laboratory ran an associated reanalysis or dilution must have all of the excluded results marked as “not the best result for reporting.”
Resolve analytical overlap and normal and /field duplicates (N/FDs)s. Analytical overlap occurs when a sample is analyzed by two or more methods that report the same analyte. To resolve this situation, the following logic is used to select the usable result:
If the overlapping or N/FD results are all nondetections, the lowest nondetection result is selected
If the overlapping or N/FD results are all detected, the highest detected result is selected
If the overlapping or N/FD results consist of a mixture of detections and nondetections, the highest detected result is selected
If more than one analytical result exists, when the data are loaded into the data warehouse, an automated script will run to identify the “best” result
Data Integrity The data warehouse will use valid value tables when applying reference attributes to project data. Such reference data include the names of site objects and sampling locations, sampling matrix and method categories, analyte names, and units. These reference tables are critical for maintaining the completeness and accuracy of data sets and are essential for accurately querying the data.
Data are loaded and stored so that relationships among categories of data are enforced. For instance, all sampling records must be associated with a valid site object (such as a planned sediment sampling location). For each project data record, the data warehouse and the collection, analysis, and reporting tools used in the DBMS are designed to enforce entries in fields that refer to other types of data the overall data model requires.
Data Use Data for project deliverables, data visualization, and consumption by third parties will be retrieved from the data warehouse. These data will be equivalent to the real-time state of the data warehouse to ensure that only those data that have completed the data management process are being used for final decision-making. The GIS Analyst (GA) will work with the DM and PCL for quality checks of the database outputs used for providing data for reports.
4.4.3 Tables, Figures, and Diagrams Once the data have been sufficiently analyzed, the project team can develop and finalize the list of requested report data entities (for example, tables, GIS figures, and diagrams) and

APPENDIX J: STANDARD OPERATING PROCEDURES FOR DATA MANAGEMENT WORK PLAN FOR SITE INSPECTION, REMEDIAL INVESTIGATION, AND SITE CHARACTERIZATION
FORMER GALENA FORWARD OPERATING LOCATION, ALASKA AFCEE CONTRACT FA8903-08-D-8769, TASK ORDER 0184
RDD/100970006 (APPENDIX J_ SOP FOR DATAMGMT.DOC) 4-9 ES040110212315RDD
submit these data entities to the DM/PCL. Attachment J-4 contains the process flow diagram for requesting and producing figures and graphics.
The DM will generate requested data summary tables, criteria comparison tables, analytical data tables, and any figures. The DM will generate data deliverables suitable for end use, and will provide data support to the end user. In addition, the DML will manage the generation of any requested client and regulatory-agency data deliverables.
4.4.4 GIS and AutoCAD ESRI’s suite of GIS software and AutoDesk® AutoCAD software will be used to produce figures for the program.
ESRI Personal Geodatabases
The GIS data model will consist of one or more ESRI personal geodatabases (PGDBs). Each PGDB will contain various feature data sets with the various feature classes (such as roads, creeks, buildings, and wells). Each PGDB is stored in an Access database. This GIS Access database will have a live link to the data warehouse through an open database connectivity (ODBC) connection.
Maps and Figures
Maps and figures will be produced using ESRI® ArcMap8.3 or later. Data will be manipulated using ESRI’s ArcCatalog, ArcToolbox, ArcMap, and ArcInfo. The project GIS system will be used for spatial analysis, and AutoCAD and GIS systems will be used for environmental data visualization, mapping, and report figure generation.
The following steps must be taken to prepare the project database for connection to ESRI® ArcGIS:
Feature locations must have valid geographical coordinates and be mapped in the same coordinate system as the GIS interface.
Each field-generated sample must be georeferenced to a sample point location if the analytical data are to appear on the GIS map. (Laboratory QC and waste characterization for disposal samples will not be mapped to sample point locations.)
The GIS system and its data will adhere to the specifications described herein. Map files will be named in accordance with spatial data standards, where applicable. However, map layers and attribute descriptions in the GIS will be named for ease of interpretation by the GA. GIS features (points, lines, polygons, and annotations) will be stored as ESRI PGDB features. Points, lines, polygons, and annotations created from AutoCAD will be 900 series .xrf and stored in .dwg files. Three-dimensional data will be stored as ESRI .TIN or ESRI .Grid file formats. Raster data will be stored in native file formats (.TIFF, .JPG, and .SIid).
The GIS will contain the following multiple map layer types:
Site map data. Base map data include structures and conditions at each project site. These may include, but are not limited to, buildings, roads, water bodies, utilities, and aerial photographs. These layers will provide a basic context in which to evaluate environmental conditions at the Galena Program sites. It is assumed that either the client or a certified source will provide these layers. It is expected that the project maps will
APPENDIX J: STANDARD OPERATING PROCEDURES FOR DATA MANAGEMENT WORK PLAN FOR SITE INSPECTION, REMEDIAL INVESTIGATION, AND SITE CHARACTERIZATION FORMER GALENA FORWARD OPERATING LOCATION, ALASKA AFCEE CONTRACT FA8903-08-D-8769, TASK ORDER 0184
4-10 RDD/100970006 (APPENDIX J_ SOP FOR DATAMGMT.DOC) ES040110212315RDD
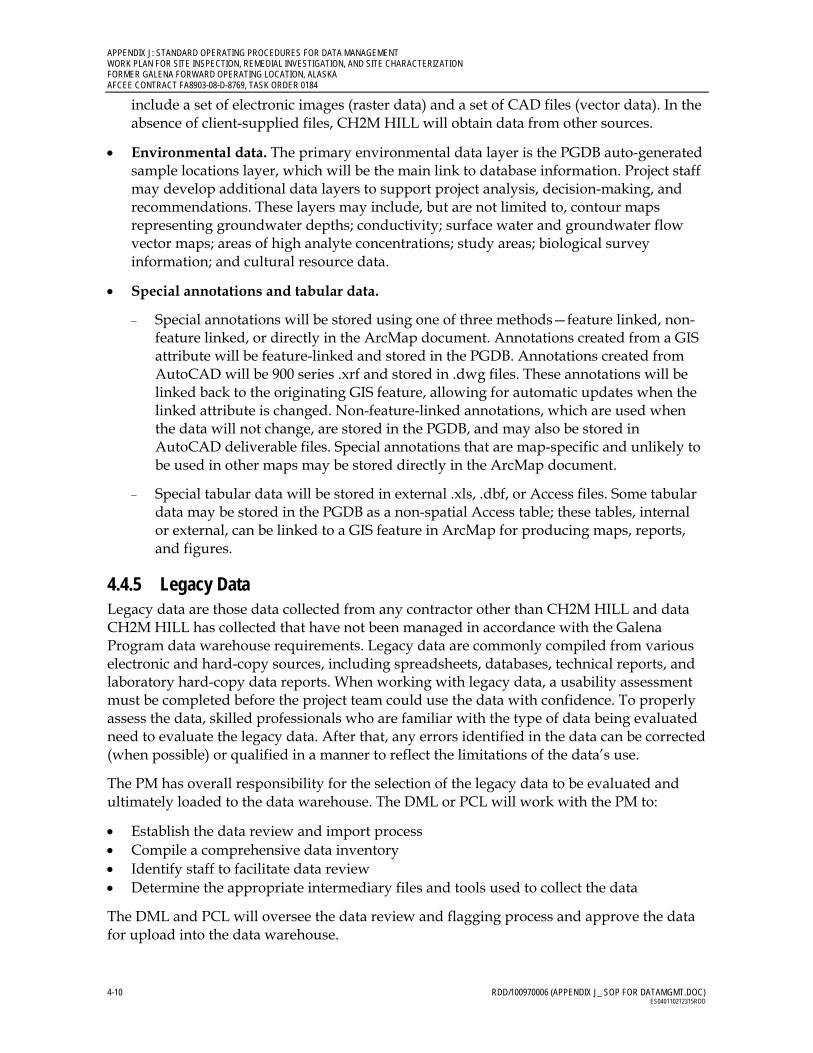
include a set of electronic images (raster data) and a set of CAD files (vector data). In the absence of client-supplied files, CH2M HILL will obtain data from other sources.
Environmental data. The primary environmental data layer is the PGDB auto-generated sample locations layer, which will be the main link to database information. Project staff may develop additional data layers to support project analysis, decision-making, and recommendations. These layers may include, but are not limited to, contour maps representing groundwater depths; conductivity; surface water and groundwater flow vector maps; areas of high analyte concentrations; study areas; biological survey information; and cultural resource data.
Special annotations and tabular data.
Special annotations will be stored using one of three methods—feature linked, non-feature linked, or directly in the ArcMap document. Annotations created from a GIS attribute will be feature-linked and stored in the PGDB. Annotations created from AutoCAD will be 900 series .xrf and stored in .dwg files. These annotations will be linked back to the originating GIS feature, allowing for automatic updates when the linked attribute is changed. Non-feature-linked annotations, which are used when the data will not change, are stored in the PGDB, and may also be stored in AutoCAD deliverable files. Special annotations that are map-specific and unlikely to be used in other maps may be stored directly in the ArcMap document.
Special tabular data will be stored in external .xls, .dbf, or Access files. Some tabular data may be stored in the PGDB as a non-spatial Access table; these tables, internal or external, can be linked to a GIS feature in ArcMap for producing maps, reports, and figures.
4.4.5 Legacy Data Legacy data are those data collected from any contractor other than CH2M HILL and data CH2M HILL has collected that have not been managed in accordance with the Galena Program data warehouse requirements. Legacy data are commonly compiled from various electronic and hard-copy sources, including spreadsheets, databases, technical reports, and laboratory hard-copy data reports. When working with legacy data, a usability assessment must be completed before the project team could use the data with confidence. To properly assess the data, skilled professionals who are familiar with the type of data being evaluated need to evaluate the legacy data. After that, any errors identified in the data can be corrected (when possible) or qualified in a manner to reflect the limitations of the data’s use.
The PM has overall responsibility for the selection of the legacy data to be evaluated and ultimately loaded to the data warehouse. The DML or PCL will work with the PM to:
Establish the data review and import process Compile a comprehensive data inventory Identify staff to facilitate data review Determine the appropriate intermediary files and tools used to collect the data
The DML and PCL will oversee the data review and flagging process and approve the data for upload into the data warehouse.
APPENDIX J: STANDARD OPERATING PROCEDURES FOR DATA MANAGEMENT WORK PLAN FOR SITE INSPECTION, REMEDIAL INVESTIGATION, AND SITE CHARACTERIZATION
FORMER GALENA FORWARD OPERATING LOCATION, ALASKA AFCEE CONTRACT FA8903-08-D-8769, TASK ORDER 0184
RDD/100970006 (APPENDIX J_ SOP FOR DATAMGMT.DOC) 4-11 ES040110212315RDD
The DM is responsible for:
Assembling the field and laboratory data in formats that facilitate data review Aiding the DML and PCL in overseeing the data review and flagging process Scheduling, converting the data to the proper data warehouse format, and
loading the data into the data warehouse after approval of the data quality by the DML and PCL
The GA, FTL, PC, and Data Evaluator have the primary responsibility for reviewing the data in their areas of expertise and providing the DM with data usability flags to be associated with each record.

APPENDIX J: STANDARD OPERATING PROCEDURES FOR DATA MANAGEMENT WORK PLAN FOR SITE INSPECTION, REMEDIAL INVESTIGATION, AND SITE CHARACTERIZATION FORMER GALENA FORWARD OPERATING LOCATION, ALASKA AFCEE CONTRACT FA8903-08-D-8769, TASK ORDER 0184
4-12 RDD/100970006 (APPENDIX J_ SOP FOR DATAMGMT.DOC) ES040110212315RDD
This page intentionally left blank.
RDD/100970006 (APPENDIX J_ SOP FOR DATAMGMT.DOC) 5-1 ES040110212315RDD
SECTION 5
Project Closeout
The project closeout phase includes archiving hard-copy and electronic documents.
A large variety of technical data will be generated during the field investigations. The FTL and DM will collect all hard-copy and eData they are responsible for and verify that the incoming records are legible and in suitable condition for storage. CH2M HILL will manage and maintain all project-related information. Record storage will be performed in two stages:
Storage during the project Permanent storage directly related to the project
CH2M HILL will use storage facilities that provide a suitable environment that minimizes deterioration or damage and prevents loss. Physical records will be secured in steel file cabinets labeled with the appropriate project identification. Electronic data will be maintained on CH2M HILL’s corporate local area network servers.
Information generated from field activities will be documented on appropriate forms and maintained in the project file. This information includes COC records, field logbooks, well construction forms, boring logs, location sketches, and site photographs. In addition, notes from project meetings and telephone conversations will be filed.
Both hard-copy deliverables and EDDs will be managed and stored. The hard-copy data packages will be filed by year and month and by sample delivery group or laboratory batch, as appropriate. Team staff will handle all hard-copy data packages during the data loading and validation phase. These hard-copy data packages will then be sent to the project files for storage. Upon project closeout, the data packages will be archived with the project files.
APPENDIX J: STANDARD OPERATING PROCEDURES FOR DATA MANAGEMENT WORK PLAN FOR SITE INSPECTION, REMEDIAL INVESTIGATION, AND SITE CHARACTERIZATION FORMER GALENA FORWARD OPERATING LOCATION, ALASKA AFCEE CONTRACT FA8903-08-D-8769, TASK ORDER 0184
5-2 RDD/100970006 (APPENDIX J_ SOP FOR DATAMGMT.DOC) ES040110212315RDD
This page intentionally left blank.
RDD/100970006 (APPENDIX J_ SOP FOR DATAMGMT.DOC) 6-3 ES040110212315RDD
SECTION 6
Change Management
Content may be revised or amended to accommodate changes in the scope of environmental investigations or data management requirements that affect the entire Galena Program. In addition, the attachments to this DMP will be subject to modification as new or improved methods of data management are developed and implemented.
Email messages to the project team will be used to communicate any modifications made to the tools. As revisions are finalized, they will be distributed electronically to all users. After revision, it is the user’s responsibility to conform to revised portions of this DMP.
Amendments will be versioned and released according to the following naming scheme: [Document Name_v#.#_yymmdd]. If a significant change is made to any of these files, the version number will increase by one integer. Table JP1 (following the Preface to this DMP) shows the revision history.

APPENDIX J: STANDARD OPERATING PROCEDURES FOR DATA MANAGEMENT WORK PLAN FOR SITE INSPECTION, REMEDIAL INVESTIGATION, AND SITE CHARACTERIZATION FORMER GALENA FORWARD OPERATING LOCATION, ALASKA AFCEE CONTRACT FA8903-08-D-8769, TASK ORDER 0184
6-4 RDD/100970006 (APPENDIX J_ SOP FOR DATAMGMT.DOC) ES040110212315RDD
This page intentionally left blank.
ATTACHMENT J-1
RASCI/Workflow Process
Work Process Owner
ProjectManager
Data Management
Lead Chemistry Lead
GIS and Data Visualization
LeadDatabase Manager GIS Analyst
Field Team Leader Project Chemist
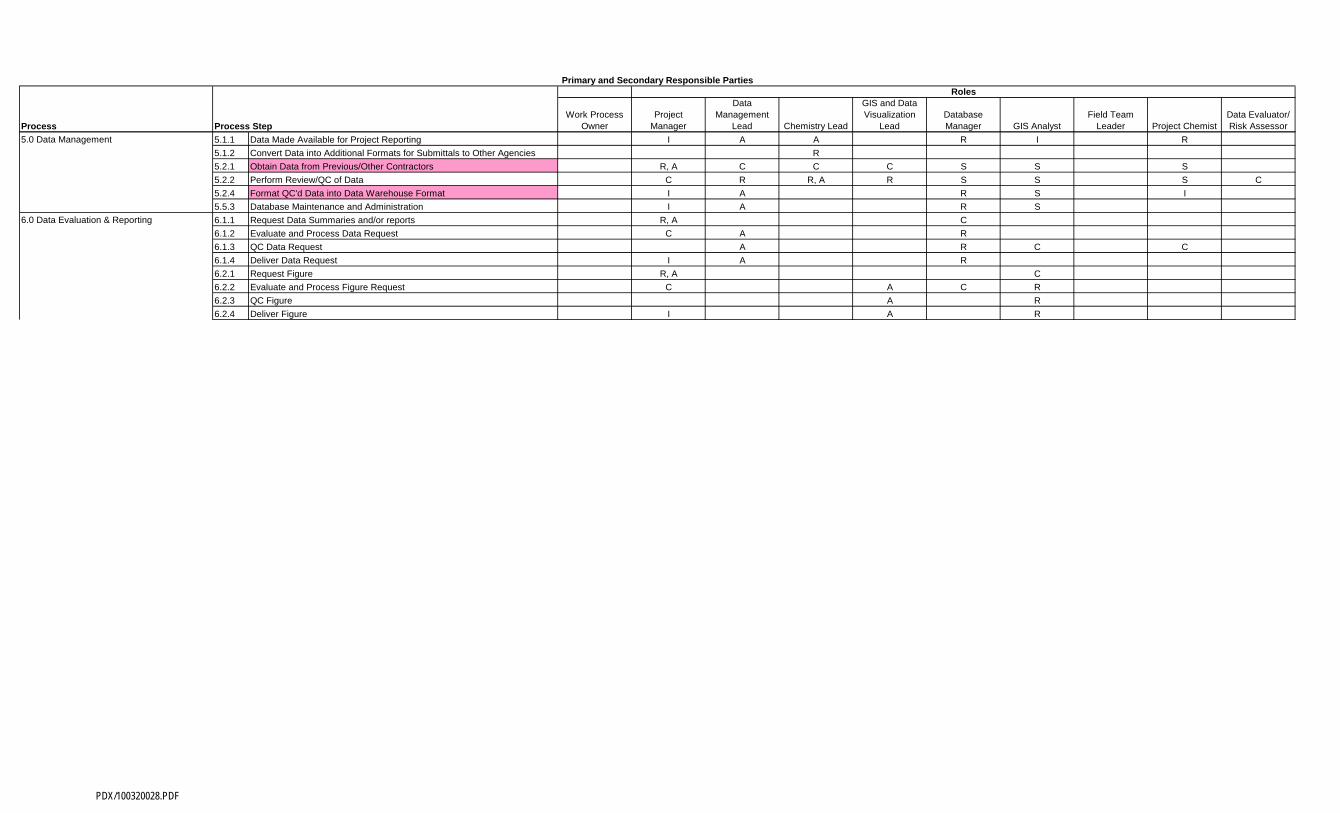
Data Evaluator/ Risk Assessor
1.0 Project Planning and Setup 1.1.1 Work Initiation Process C R, A I I I 0 0 0 R1.1.2 Project Scoping and Schedule I R, A C C C 0 0 I 0 C1.1.3 Kick Off Meeting 0 R, A I I I C C C C C1.2.1 Prepare DMP 0 I A 0 0 R S S S 01.2.2 Compile Sample Quantities by Media and Sample Type 0 I 0 0 0 I I C I R, A1.2.3 Compile Analytical Suites and DQIs 0 C 0 C, A 0 0 0 0 R C1.2.4 Refine Project Scope I A R R R C C C C C1.3.1 Prepare Statement of Work 0 0 I C 0 C 0 0 R, A 01.3.2 Order Bottles and Containers 0 0 0 0 0 0 0 R, A S 01.4.1 Load Sample List & Sample Specific Information 0 0 0 0 0 R 0 A 0 01.4.2 Assign Sample Validation Level 0 C 0 A 0 0 0 0 S R1.4.3 Setup Valid Values & Database Settings 0 0 A 0 0 R S 0 S 01.4.4 QC Loaded Information A 0 R R R 0 0 0 0 01.4.5 Setup Sample Tracking System 0 0 A 0 0 R S S 0 0
2.0 Sample Collection and Management 2.1.1 Generate Daily Sampling List 0 0 0 0 C S S R, A 0 02.1.2 Generate Sample Labels 0 0 0 0 0 S 0 R, A 0 0
Primary and Secondary Responsible PartiesRoles
Process StepProcess
2.2.1 Collect Samples 0 I 0 0 0 I 0 R, A I 02.2.2 Revise Sample List 0 0 0 0 0 S 0 R, A 0 02.2.3 Generate COC 0 0 0 0 0 S 0 R, A 0 02.2.4 Check COC Against Field Logs and Sample Sheets 0 0 0 0 0 0 0 R, A 0 02.2.5 Assign Coolers 0 0 0 0 0 0 0 R, A 0 02.2.6 Generate Shipping Forms 0 0 0 0 0 0 0 R, A 0 02.2.7 Verify Sample Receipt 0 0 0 0 0 S 0 A R 02.3.1 Copy/Scan Field Data and Archive 0 0 0 0 0 S 0 R, A 0 02.3.2 Review Field Data for Completeness and Accuracy 0 0 0 0 0 S S R, A C 02.3.3 Load Field Data into Database 0 0 A 0 0 R S S 0 02.3.4 Revise Loaded Field Data A 0 R 0 S 0 0 0 0 02.3.5 Update Sample Maps 0 0 0 0 A 0 R C 0 0
3.0 Lab Analysis 3.1.1 Verify Login Report Information 0 0 A 0 0 R 0 C C 03.1.2 Sample Analysis 0 0 0 0 0 0 0 0 0 03.1.3 EDD QC by Lab 0 0 0 0 0 0 0 0 0 03.2.1 Receipt and QC of EDD by CH2M HILL ** isn't QC completed in VDMS? 0 I 0 0 0 R, A 0 0 S 03.2.2 EDD Discrepancy Resolution 0 0 0 0 0 R, A 0 0 S 03.2.3 Load EDD into Analytical Database **isn't this loaded using the VDMS tool? 0 0 A 0 0 R 0 0 S 03.3.3 Hard Copy Tracking 0 I 0 0 0 S 0 0 R, A 0
4.0 Data Validation 4.1.1 Link Appropriate Field and Analytical Databases A 0 0 0 0 R, A 0 0 R 04.1.2 Verify Correct Validation Levels are Assigned 0 0 0 0 0 S 0 0 R 04.1.3 Compare Hard Copy to EDD 0 0 0 0 0 S 0 0 R 04 1 4 Validate Data to Preset Validation Level (III or IV) 0 0 0 A 0 0 0 0 R 04.1.4 Validate Data to Preset Validation Level (III or IV) 0 0 0 A 0 0 0 0 R 04.2.1 Distribute Hard Copy to 3rd Party Validators 0 0 0 0 0 S 0 0 R 04.2.2 Distribute EDD to 3rd Party Validators 0 0 0 0 0 S 0 0 R 04.2.3 Review External Validation Results 0 0 0 A 0 0 0 0 R 04.3.1 Review all Chemical Validation Results 0 0 0 A 0 0 0 0 R 04.3.2 Generate Validation Reports for PM Review 0 0 0 A 0 0 0 0 R 04.3.3 Export Validated Data File 0 0 0 A 0 0 0 0 R 04.3.5 Update Sample Tracking Tool 0 0 0 0 0 0 0 0 R 0
PDX/100320028.PDF
Work Process Owner
ProjectManager
Data Management
Lead Chemistry Lead
GIS and Data Visualization
LeadDatabase Manager GIS Analyst
Field Team Leader Project Chemist
Data Evaluator/ Risk Assessor
Primary and Secondary Responsible PartiesRoles
Process StepProcess5.0 Data Management 5.1.1 Data Made Available for Project Reporting 0 I A A 0 R I 0 R 0
5.1.2 Convert Data into Additional Formats for Submittals to Other Agencies 0 0 0 R 0 0 0 0 0 05.2.1 Obtain Data from Previous/Other Contractors 0 R, A C C C S S 0 S 05.2.2 Perform Review/QC of Data 0 C R R, A R S S 0 S C5.2.4 Format QC'd Data into Data Warehouse Format 0 I A 0 0 R S 0 I 05.5.3 Database Maintenance and Administration 0 I A 0 0 R S 0 0 0
6.0 Data Evaluation & Reporting 6.1.1 Request Data Summaries and/or reports 0 R, A 0 0 0 C 0 0 0 06.1.2 Evaluate and Process Data Request 0 C A 0 0 R 0 0 0 06.1.3 QC Data Request 0 0 A 0 0 R C 0 C 06.1.4 Deliver Data Request 0 I A 0 0 R 0 0 0 06.2.1 Request Figure 0 R, A 0 0 0 0 C 0 0 06.2.2 Evaluate and Process Figure Request 0 C 0 0 A C R 0 0 06.2.3 QC Figure 0 0 0 0 A 0 R 0 0 06.2.4 Deliver Figure 0 I 0 0 A 0 R 0 0 0
PDX/100320028.PDF
ATTACHMENT J-2
Data Collection Flow Diagram
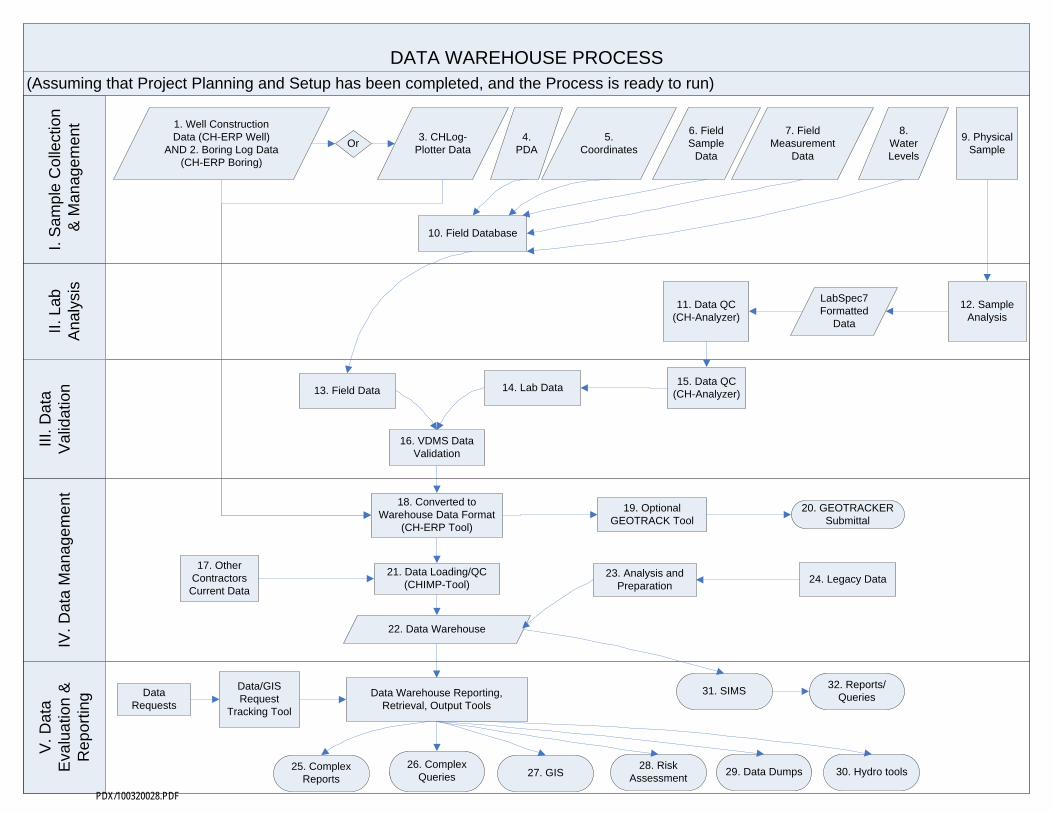
(Assuming that Project Planning and Setup has been completed, and the Process is ready to run)
II. L
ab
Ana
lysi
s
III. D
ata
Val
idat
ion
IV.
Dat
a M
anag
emen
tV
. D
ata
Eva
lua
tion
&
Re
port
ing
I. S
ampl
e C
olle
ctio
n &
Man
agem
ent 1. Well Construction
Data (CH-ERP Well) AND 2. Boring Log Data
(CH-ERP Boring)
Or3. CHLog-
Plotter Data4.
PDA5.
Coordinates
6. Field Sample
Data
7. Field Measurement
Data
8. Water Levels
9. Physical Sample
10. Field Database
12. Sample Analysis
LabSpec7 Formatted
Data
11. Data QC (CH-Analyzer)
13. Field Data 14. Lab Data
16. VDMS Data Validation
15. Data QC (CH-Analyzer)
18. Converted to Warehouse Data Format
(CH-ERP Tool)
21. Data Loading/QC (CHIMP-Tool)
17. Other Contractors
Current Data
19. Optional GEOTRACK Tool
20. GEOTRACKER Submittal
23. Analysis and Preparation
24. Legacy Data
22. Data Warehouse
25. Complex Reports
26. Complex Queries 27. GIS
31. SIMS
28. Risk Assessment
30. Hydro tools29. Data Dumps
32. Reports/Queries
DATA WAREHOUSE PROCESS
Data Requests
Data/GIS Request
Tracking Tool
Data Warehouse Reporting, Retrieval, Output Tools
PDX/100320028.PDF
ATTACHMENT J-3
Standard Operating Procedures
APPENDIX J: STANDARD OPERATING PROCEDURES FOR DATA MANAGEMENT WORK PLAN FOR SITE INSPECTION, REMEDIAL INVESTIGATION, AND SITE CHARACTERIZATION
FORMER GALENA FORWARD OPERATING LOCATION, ALASKA AFCEE CONTRACT FA8903-08-D-8769, TASK ORDER 0184
APRIL 2010
RDD/100970006 (APPENDIX J_ SOP FOR DATAMGMT.DOC) ES040110212315RDD
Attachment J-3: Standard Operating Procedures
GALENA-SOP-202 = Field Sample Coordinator GALENA-SOP-300 = Electronic Data Deliverable (EDD) Specifications GALENA-SOP-302 = CH-Analyzer Tool GALENA-SOP-401 = Importing Data into VDMS GALENA-SOP-402 = VDMS Validation GALENA-SOP-500 = CH-ERPTool GALENA-SOP-502 = CHIMP-Tool GALENA-SOP-503 = Managing Historical/Legacy Data

GALENA DBMS – SAMPLE COLLECTION & MANAGEMENT GALENA-SOP-202
FIELD SAMPLE COORDINATOR
C:\ALTHEN\PROJECTS_F-G\GALENA_AFCEE\APPENDIXES\APPJ_ARCHIVE\ATTACHMENTS\GALNA-SOP-202-FIELD SAMPLE COORDINATOR_V2.DOC
NER/CIS
1 OF 8 ISSUE DATE: 1/30/2010
REVISON 3.0
This standard operating procedure (SOP) establishes responsibilities, requirements, and instructions for the Field Database of the Galena Database Management System. This SOP provides Field Database Program operating information for tracking samples from collection to submission to the laboratory for analyses.
None.
COC chain-of-custody ID identification LAN local area network ORP oxidation-reduction potential PO purchase order QA quality assurance QC quality control SDG sample delivery group SOP standard operating procedure TB trip blank WBS work breakdown structure WMI well maintenance information
Personnel shall conduct data management activities in a fashion to maintain the highest standards of quality to ensure the integrity and defensibility of project data, consistent with project requirements. The following individuals are identified as having responsibilities associated with this procedure: Field Sample Coordinator ensures the accuracy of the data input into the Field Database and maintains the updates and exports of the Field Database to the Data Validation Team.
Field Sample Coordinator works with the field team, the project chemist and the laboratory on managing the samples to be archived onsite temporarily, to be held at the laboratory, or to be disposed of upon receipt at the laboratory. (Details on Sample Disposal are provided in SOP XXX Sample Disposal.) Data Management/Chemistry Lead provides the initial setup of the Field Database and places the master Field Database for each program under a rights-protected directory on the LAN. This task may be delegated as
2 References
3 Definitions
4 Responsibilities
1 Purpose and Description
PDX/100320028.PDF
GALENA DBMS – SAMPLE COLLECTION & MANAGEMENT GALENA-SOP-202
FIELD SAMPLE COORDINATOR
C:\ALTHEN\PROJECTS_F-G\GALENA_AFCEE\APPENDIXES\APPJ_ARCHIVE\ATTACHMENTS\GALNA-SOP-202-FIELD SAMPLE COORDINATOR_V2.DOC
NER/CIS
2 OF 8 ISSUE DATE: 1/30/2010
REVISON 3.0
appropriate. Responsibilities also include updating setup tables and distributing front-end database updates.
Vito D’Aurora/RDD is the contact for program issues. Responsibilities include providing technical and operational support for the program.
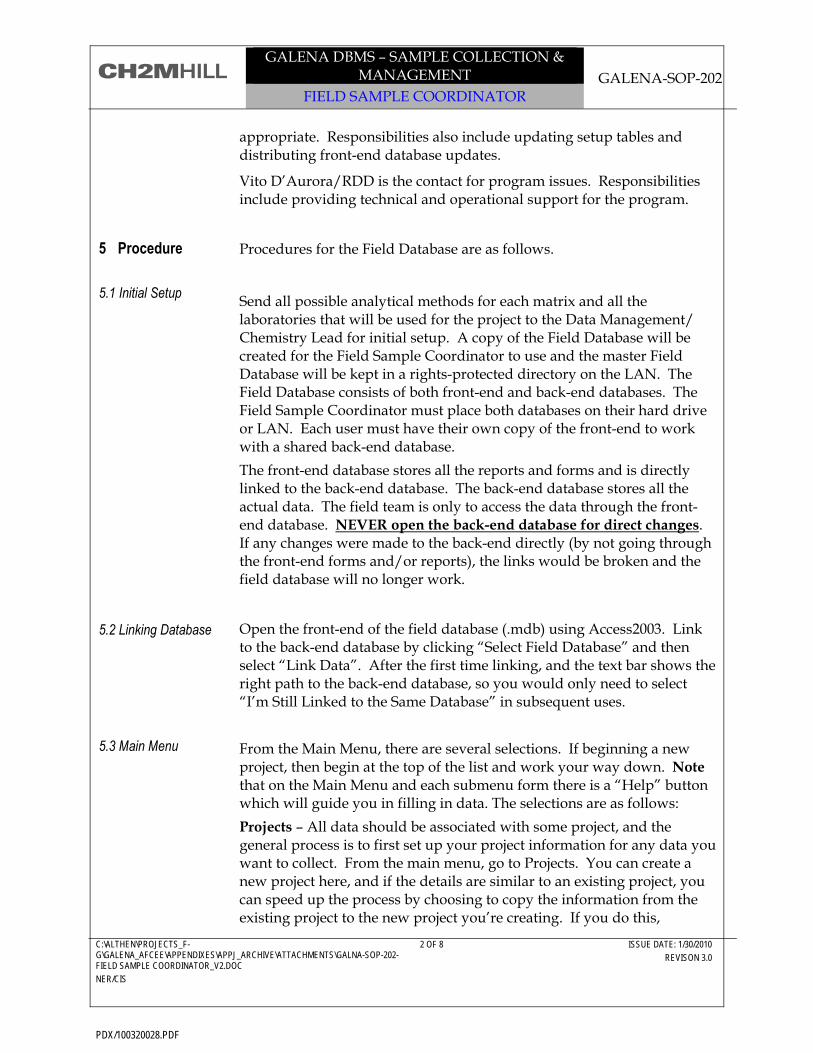
Procedures for the Field Database are as follows.
Send all possible analytical methods for each matrix and all the laboratories that will be used for the project to the Data Management/ Chemistry Lead for initial setup. A copy of the Field Database will be created for the Field Sample Coordinator to use and the master Field Database will be kept in a rights-protected directory on the LAN. The Field Database consists of both front-end and back-end databases. The Field Sample Coordinator must place both databases on their hard drive or LAN. Each user must have their own copy of the front-end to work with a shared back-end database. The front-end database stores all the reports and forms and is directly linked to the back-end database. The back-end database stores all the actual data. The field team is only to access the data through the front-end database. NEVER open the back-end database for direct changes. If any changes were made to the back-end directly (by not going through the front-end forms and/or reports), the links would be broken and the field database will no longer work.
Open the front-end of the field database (.mdb) using Access2003. Link to the back-end database by clicking “Select Field Database” and then select “Link Data”. After the first time linking, and the text bar shows the right path to the back-end database, so you would only need to select “I’m Still Linked to the Same Database” in subsequent uses. From the Main Menu, there are several selections. If beginning a new project, then begin at the top of the list and work your way down. Note that on the Main Menu and each submenu form there is a “Help” button which will guide you in filling in data. The selections are as follows: Projects – All data should be associated with some project, and the general process is to first set up your project information for any data you want to collect. From the main menu, go to Projects. You can create a new project here, and if the details are similar to an existing project, you can speed up the process by choosing to copy the information from the existing project to the new project you’re creating. If you do this,
5.1 Initial Setup
5 Procedure
5.2 Linking Database
5.3 Main Menu
PDX/100320028.PDF
GALENA DBMS – SAMPLE COLLECTION & MANAGEMENT GALENA-SOP-202
FIELD SAMPLE COORDINATOR
C:\ALTHEN\PROJECTS_F-G\GALENA_AFCEE\APPENDIXES\APPJ_ARCHIVE\ATTACHMENTS\GALNA-SOP-202-FIELD SAMPLE COORDINATOR_V2.DOC
NER/CIS
3 OF 8 ISSUE DATE: 1/30/2010
REVISON 3.0
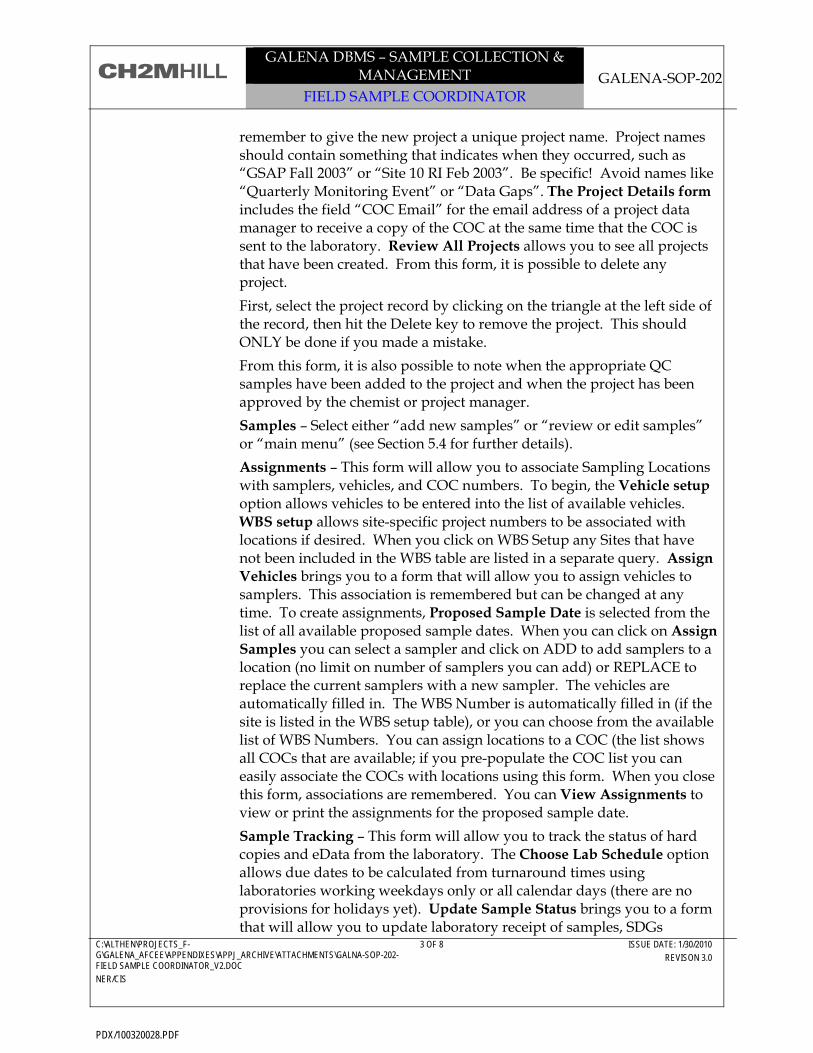
remember to give the new project a unique project name. Project names should contain something that indicates when they occurred, such as “GSAP Fall 2003” or “Site 10 RI Feb 2003”. Be specific! Avoid names like “Quarterly Monitoring Event” or “Data Gaps”. The Project Details form includes the field “COC Email” for the email address of a project data manager to receive a copy of the COC at the same time that the COC is sent to the laboratory. Review All Projects allows you to see all projects that have been created. From this form, it is possible to delete any project. First, select the project record by clicking on the triangle at the left side of the record, then hit the Delete key to remove the project. This should ONLY be done if you made a mistake. From this form, it is also possible to note when the appropriate QC samples have been added to the project and when the project has been approved by the chemist or project manager. Samples – Select either “add new samples” or “review or edit samples” or “main menu” (see Section 5.4 for further details). Assignments – This form will allow you to associate Sampling Locations with samplers, vehicles, and COC numbers. To begin, the Vehicle setup option allows vehicles to be entered into the list of available vehicles. WBS setup allows site-specific project numbers to be associated with locations if desired. When you click on WBS Setup any Sites that have not been included in the WBS table are listed in a separate query. Assign Vehicles brings you to a form that will allow you to assign vehicles to samplers. This association is remembered but can be changed at any time. To create assignments, Proposed Sample Date is selected from the list of all available proposed sample dates. When you can click on Assign Samples you can select a sampler and click on ADD to add samplers to a location (no limit on number of samplers you can add) or REPLACE to replace the current samplers with a new sampler. The vehicles are automatically filled in. The WBS Number is automatically filled in (if the site is listed in the WBS setup table), or you can choose from the available list of WBS Numbers. You can assign locations to a COC (the list shows all COCs that are available; if you pre-populate the COC list you can easily associate the COCs with locations using this form. When you close this form, associations are remembered. You can View Assignments to view or print the assignments for the proposed sample date. Sample Tracking – This form will allow you to track the status of hard copies and eData from the laboratory. The Choose Lab Schedule option allows due dates to be calculated from turnaround times using laboratories working weekdays only or all calendar days (there are no provisions for holidays yet). Update Sample Status brings you to a form that will allow you to update laboratory receipt of samples, SDGs
PDX/100320028.PDF
GALENA DBMS – SAMPLE COLLECTION & MANAGEMENT GALENA-SOP-202
FIELD SAMPLE COORDINATOR
C:\ALTHEN\PROJECTS_F-G\GALENA_AFCEE\APPENDIXES\APPJ_ARCHIVE\ATTACHMENTS\GALNA-SOP-202-FIELD SAMPLE COORDINATOR_V2.DOC
NER/CIS
4 OF 8 ISSUE DATE: 1/30/2010
REVISON 3.0
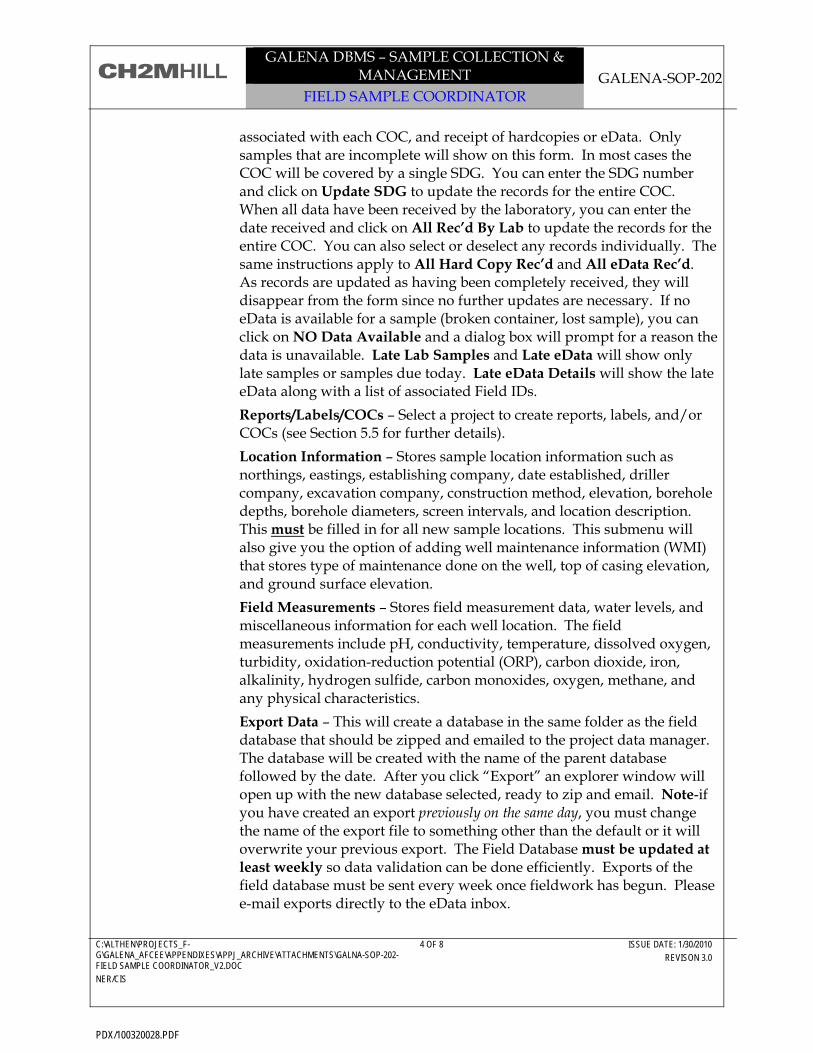
associated with each COC, and receipt of hardcopies or eData. Only samples that are incomplete will show on this form. In most cases the COC will be covered by a single SDG. You can enter the SDG number and click on Update SDG to update the records for the entire COC. When all data have been received by the laboratory, you can enter the date received and click on All Rec’d By Lab to update the records for the entire COC. You can also select or deselect any records individually. The same instructions apply to All Hard Copy Rec’d and All eData Rec’d. As records are updated as having been completely received, they will disappear from the form since no further updates are necessary. If no eData is available for a sample (broken container, lost sample), you can click on NO Data Available and a dialog box will prompt for a reason the data is unavailable. Late Lab Samples and Late eData will show only late samples or samples due today. Late eData Details will show the late eData along with a list of associated Field IDs. Reports/Labels/COCs – Select a project to create reports, labels, and/or COCs (see Section 5.5 for further details). Location Information – Stores sample location information such as northings, eastings, establishing company, date established, driller company, excavation company, construction method, elevation, borehole depths, borehole diameters, screen intervals, and location description. This must be filled in for all new sample locations. This submenu will also give you the option of adding well maintenance information (WMI) that stores type of maintenance done on the well, top of casing elevation, and ground surface elevation. Field Measurements – Stores field measurement data, water levels, and miscellaneous information for each well location. The field measurements include pH, conductivity, temperature, dissolved oxygen, turbidity, oxidation-reduction potential (ORP), carbon dioxide, iron, alkalinity, hydrogen sulfide, carbon monoxides, oxygen, methane, and any physical characteristics. Export Data – This will create a database in the same folder as the field database that should be zipped and emailed to the project data manager. The database will be created with the name of the parent database followed by the date. After you click “Export” an explorer window will open up with the new database selected, ready to zip and email. Note-if you have created an export previously on the same day, you must change the name of the export file to something other than the default or it will overwrite your previous export. The Field Database must be updated at least weekly so data validation can be done efficiently. Exports of the field database must be sent every week once fieldwork has begun. Please e-mail exports directly to the eData inbox.
PDX/100320028.PDF
GALENA DBMS – SAMPLE COLLECTION & MANAGEMENT GALENA-SOP-202
FIELD SAMPLE COORDINATOR
C:\ALTHEN\PROJECTS_F-G\GALENA_AFCEE\APPENDIXES\APPJ_ARCHIVE\ATTACHMENTS\GALNA-SOP-202-FIELD SAMPLE COORDINATOR_V2.DOC
NER/CIS
5 OF 8 ISSUE DATE: 1/30/2010
REVISON 3.0
Project Notes – A comment box to store notes on changes or updates made to the Field Database. Admin – Used only by data management team and requires an access code. Help – Will guide you in filling in data for each selection. Exit – Use to exit and close the field database From the Sample Menu, there are several selections. A project must be created in the first step in order to input samples. The selections are as follows:
Add New Samples - This menu allows you to enter new field samples in a variety of ways.
Create a New Sample - Create a single sample with multiple analytical methods. Each method must be entered as a new record. All green fields must be filled in. You must click “Run QC Checks” and “Accept Records” before exiting or you will lose all data entered.
You can quickly add additional methods by first selecting any records you want to copy from by clicking in the “Y/N” box at the left side of the form. Click on Add Another Method to copy the sample information to a new method. Click in the Method field to change the method/matrix combination for the new record. Note that the matrix for a sample can only be set through the Method field which lists all available method/matrix combinations.
You can quickly add field QC records by selecting Add Additional QC. You will be presented with a list of Field IDs to serve as a template for the new QC samples, select any QC types needed, and click on Continue. All QC samples will be created with new Field IDs.
You can View a Project in a second window to facilitate adding additional samples, or to copy a record from an existing project. If a warning about limited fields comes up, click OK.
To complete the process (whenever new samples are created), Run QC Checks and fix any problems that may be identified. Accept Records to add the new sample to the database.
Fields identified with a green background are the minimum required fields to add all new records. Additional fields may be necessary, depending on the individual records.
5.4 Samples Menu
PDX/100320028.PDF
GALENA DBMS – SAMPLE COLLECTION & MANAGEMENT GALENA-SOP-202
FIELD SAMPLE COORDINATOR
C:\ALTHEN\PROJECTS_F-G\GALENA_AFCEE\APPENDIXES\APPJ_ARCHIVE\ATTACHMENTS\GALNA-SOP-202-FIELD SAMPLE COORDINATOR_V2.DOC
NER/CIS
6 OF 8 ISSUE DATE: 1/30/2010
REVISON 3.0
Copy an Existing Sample – This will allow you to copy any sample (including all of its analytical methods) to create a new sample.
Create a Set of New Samples – This will allow you to create a set of samples modeled after any existing sample in the database. After you select the Project and Sample to copy from, you can list the new Locations/Field IDs that you want to create from the original sample.
Copy an Existing Project by Modifying Location Names – This will create a new project modeled after any existing project in the database. After you select the project to copy from, you can create the new Field IDs by adding any characters to the beginning or end of the location name. For instance, if you add “_Q3_03” as a suffix, location “MW-1” will have an automatic Field ID of “MW-1_Q3_03”. You can then edit the details about the new project and review the new samples.
Copy an Existing Project by Modifying Field IDs – This is similar to the previous option, but it allows you to create the new field IDs based on the existing Field IDs (the previous option created new Field IDs based on location names.) You can either strip a fixed number of characters from the end of the existing Field IDs or retain a fixed number of characters at the beginning of the existing Field IDs and append any other fixed set of characters. For instance, if an existing field ID was “MW-1_Q3_03” you could strip two characters from the end and replace them with “04” and end up with “MW-1_Q3_04”.
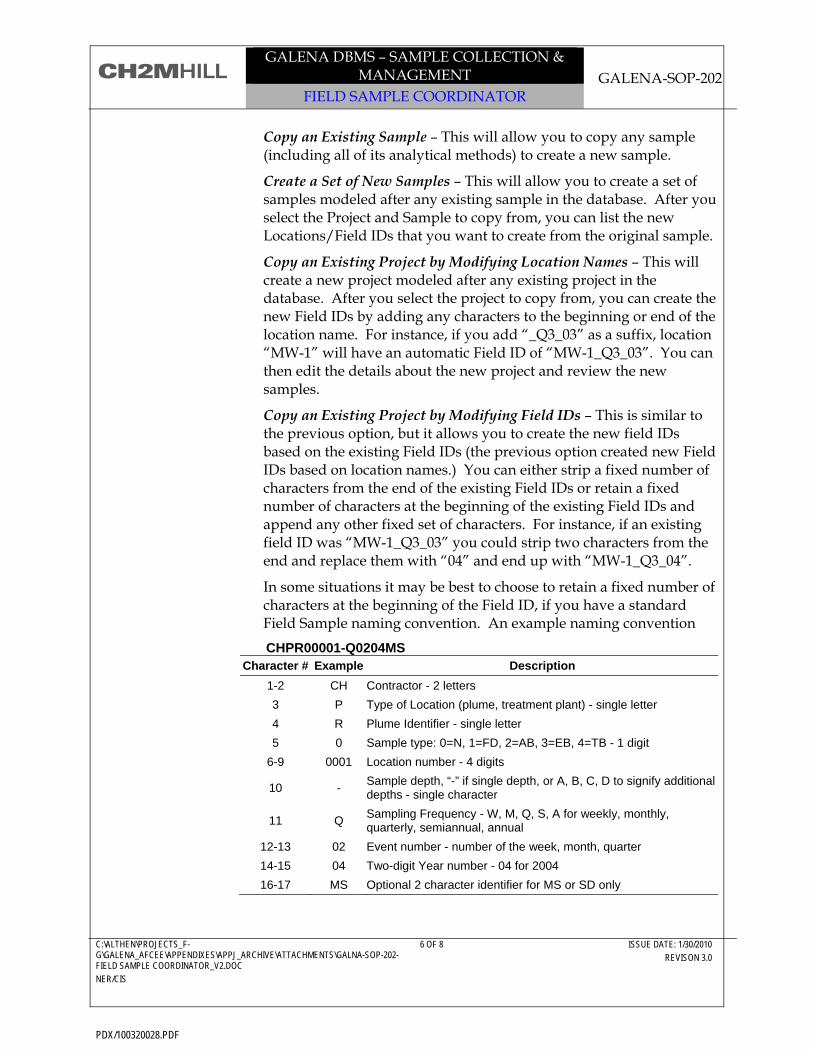
In some situations it may be best to choose to retain a fixed number of characters at the beginning of the Field ID, if you have a standard Field Sample naming convention. An example naming convention
CHPR00001-Q0204MS Character # Example Description
1-2 CH Contractor - 2 letters 3 P Type of Location (plume, treatment plant) - single letter 4 R Plume Identifier - single letter 5 0 Sample type: 0=N, 1=FD, 2=AB, 3=EB, 4=TB - 1 digit
6-9 0001 Location number - 4 digits
10 - Sample depth, “-” if single depth, or A, B, C, D to signify additional depths - single character
11 Q Sampling Frequency - W, M, Q, S, A for weekly, monthly, quarterly, semiannual, annual
12-13 02 Event number - number of the week, month, quarter 14-15 04 Two-digit Year number - 04 for 2004 16-17 MS Optional 2 character identifier for MS or SD only
PDX/100320028.PDF
GALENA DBMS – SAMPLE COLLECTION & MANAGEMENT GALENA-SOP-202
FIELD SAMPLE COORDINATOR
C:\ALTHEN\PROJECTS_F-G\GALENA_AFCEE\APPENDIXES\APPJ_ARCHIVE\ATTACHMENTS\GALNA-SOP-202-FIELD SAMPLE COORDINATOR_V2.DOC
NER/CIS
7 OF 8 ISSUE DATE: 1/30/2010
REVISON 3.0
The advantage to this convention is that samples are kept blind to the laboratory, a lot of information is stored in the ID, and it becomes very easy to create a new event with unique Sample IDs based on the existing IDs. - Highly recommended!
Export blank Excel template to C:\ExcelSamples.xls - This will create a blank Excel file at C:\ that can be filled in if you prefer to work in Excel. The required fields are marked in the Excel file. Remember that any projects listed in the file must exist in the database before the records can be imported. These records can be imported automatically by clicking on Import C:\ExcelSamples.xls.
Import C:\ExcelSamples.xls - This will import the data in the excel file and open the new samples form to allow the records to go through a QC process prior to final loading.
Review or Edit Samples – You can view an entire project and edit it as necessary (but to make additions to the project you will need to go back to Add New Samples). If a sample has more than one record in the table (due to multiple methods), all of the records are automatically updated when you change a value that is “shared” by all of the records. Examples of values that will automatically update include sample date, sample time, sample depths, and COC number.
Main Menu - returns you to the main menu.
From the Reports/Labels/COCs Menu, there are several selections. The selections are as follows:
COCs - You can add a new COC number for this project, view all COCs, update samples with new COC number, and/or print COCs.
Add COC numbers - Allows you to enter a new COC number into the database. The bottom half of this screen allows you to view previous COC details. You will need to enter COC numbers here before you can print the COC. A new COC number should always be used instead of the default “999” COC. View COC History – Allows you to view all of the project COCs in tabular layout. You can delete records from this form, be careful! Update Samples – Allows you to update the project’s samples for any date you choose. You can type in a date or use the calendar tool to choose a date. This should allow you to update the sample COC numbers, sample times, depths, sampler initials, remarks, and lot numbers. A note about lot numbers: the correct format for a lot number is DDMMYYNN, two-digit day, two-digit month, two-digit year, followed by the two-digit number of the sample.
5.5 Reports/Labels/ CoCs Menu
PDX/100320028.PDF
GALENA DBMS – SAMPLE COLLECTION & MANAGEMENT GALENA-SOP-202
FIELD SAMPLE COORDINATOR
C:\ALTHEN\PROJECTS_F-G\GALENA_AFCEE\APPENDIXES\APPJ_ARCHIVE\ATTACHMENTS\GALNA-SOP-202-FIELD SAMPLE COORDINATOR_V2.DOC
NER/CIS
8 OF 8 ISSUE DATE: 1/30/2010
REVISON 3.0
For instance, a TB lot number of 06090301 would be associated with a TB taken on Sep 06, 2003, the first TB taken that day. If a second TB was taken on the same day, its number would be 06090302. Update COC – Pulls up all the samples associated with the listed COC and allows you to update the sample COC numbers, sample times, depths, sampler initials, remarks, and lot numbers. View/Print COC- Will create a COC for any selection in the COC drop-down list. E-mail COC will e-mail a COC summary to the laboratory and the project data manager. A PO number must be entered in order to view/print the COC. Email COC- Will attach the COC to an e-mail so it can be sent to a specified person.
Labels/Worksheets - You can toggle either 10 labels per page or 21 labels per page. Occasionally, these will not look format correctly, mainly because the printers connections to the computer. You will need to delete the printer and reinstall it to correct the formatting. You can view the labels and/or worksheets by date or by COC. Bottle Orders/Future Sampling/Billing - You can create a bottle order or list the samples to be done or create a billing for the project.
Create Bottle Order - Will create a summary bottle order for the entire project.
Bottle Order (Future Samples) – Will create a summary bottle order for the entire project for samples not collected yet.
Proposed Samples – Will create a summary report of all samples for the project.
Billing – Creates an Excel spreadsheet with the project number, laboratory name, method, sample date, location, field ID, QA/QC type, laboratory matrix, and site. This spreadsheet can be used to compare with the invoices received from each lab.
Main Menu - Returns you to the main menu.
View Samples – Allows you to view all the samples for the selected project. You can also update the sample COC numbers, sample times, depths, sampler initials, remarks, and lot numbers.
Help – Will guide you in filling in data for each selection.
PDX/100320028.PDF
GALENA DBMS – LABORATORY ANALYSIS GALENA-SOP-300
EDD SPECIFICATIONS
C:\ALTHEN\PROJECTS_F-G\GALENA_AFCEE\APPENDIXES\APPJ_ARCHIVE\ATTACHMENTS\GALNA-SOP-300-EDD SPEC_BAM.DOC
VBO/CIS
1 OF 9 ISSUE DATE: 1/30/2010
REVISON 3.0
This standard operating procedure (SOP) establishes the requirements and instructions for the CH2M HILL Electronic Data Deliverable (EDD) format for the Galena Database Management System.
This SOP provides specifications on the CH2M HILL Galena EDD format for the submission of analytical results from laboratory analyses. .
This EDD format is the May 24, 2005 revision of the Laboratory Electronic Deliverable Format for CH2M HILL, version 4.10 from Vito D’Aurora and Ed Svastits.
EDD electronic data deliverable
Personnel shall conduct data management activities in a fashion to maintain the highest standards of quality to ensure the integrity and defensibility of project data, consistent with project requirements. The following individuals are identified as having responsibilities associated with this procedure:
Specifications for the CH2M HILL EDD format are as follows.
The electronic data deliverable (EDD) file from the laboratory will be a comma-delimited ASCII (CDA) file in the format listed below. There will be one file per hardcopy report and the filename of the EDD file will be in the format REPORTID.txt or REPORTID.csv, where REPORTID is the hardcopy report identifier of sample delivery group.
The first row of the EDD will contain the 47 field name values as listed in the EDD Specification Table.
The EDD Specification Table lists the attributes of the columns for each row of the CDA file. The fields should be reported in the order indicated.
The Data Type column describes the value in the field as either text (alphanumeric), number (numeric only), date (format: mm/dd/yyyy), or time (24-hour format hh:mm). If the field is conditional or optional and there is no value to be reported, report a null (that is, no) value. For a text field, do not report a zero-length string (that is, “”).
The Data Length column contains the maximum length of a text value for the particular data field.
The Rqmt column contains a code indicating whether the value is required (R) for all rows, optional (O) for all rows, or conditional (C) and depends on the type of result reported.
2 References
3 Definitions
4 Responsibilities
1 Purpose and Description
5 Procedure
PDX/100320028.PDF
GALENA DBMS – LABORATORY ANALYSIS GALENA-SOP-300
EDD SPECIFICATIONS
C:\ALTHEN\PROJECTS_F-G\GALENA_AFCEE\APPENDIXES\APPJ_ARCHIVE\ATTACHMENTS\GALNA-SOP-300-EDD SPEC_BAM.DOC
VBO/CIS
2 OF 9 ISSUE DATE: 1/30/2010
REVISON 3.0
Changes to the February 9, 2000 Revision: 1. Change the description of the QAQCType field (Field No. 6) to clarify how diluted samples should be
reported. 2. Change the description of the LRType field (Field No. 7) to allow for multiple dilutions, re-analyses, and
confirmation sample analyses. Also change the example values to reflect this change. 3. Change the description of the AnalysisMethod field (Field No. 10) to correct grammatical error. 4. Minor typographical/grammatical changes in the descriptions of the ExtractDate and ExtractTime fields
(Field Nos. 15 and 16). 5. Change requirement of the LabLotCtlNum field (Field No. 20) from Required to Conditional. If there is no
preparation, then the value in this field should be blank. 6. Change data type of the Result field (Field No. 24) from Number to Text, length of 10. Clarify the
requirement of a text value in the field description. 7. Change the description of the MDL field (Field No. 28) to clarify the contents of the field. 8. Change the description for the UpperControlLimit and LowerControlLimit fields (Field Nos. 35 and 36) to
explain when a value is required in those fields. 9. Change the description of the MDLAdjusted field (Field No. 39) to clarify the contents of the field. 10. Change the requirement of the SampleDescription field (Field No. 41) from Required to Conditional. Lab QC
samples (method blanks, blank spike, blank spike duplicates) do not appear on the COC. 11. Change the description of the CalRefID field (Field No. 47) to clarify the contents of the field.
5.1 Modification Notes
PDX/100320028.PDF

GALENA DBMS – LABORATORY ANALYSIS GALENA-SOP-300
EDD SPECIFICATIONS
C:\ALTHEN\PROJECTS_F-G\GALENA_AFCEE\APPENDIXES\APPJ_ARCHIVE\ATTACHMENTS\GALNA-SOP-300-EDD SPEC_BAM.DOC
VBO/CIS
3 OF 9 ISSUE DATE: 1/30/2010
REVISON 3.0
EDD Specification Table
Field Number
Field Name
Data Type
Data Length Rqmt Description and Comments
1 VersionCode text 15 R Code identifying the version of the EDD deliverable.
2 LabName text 10 R Identification code for the laboratory performing the work. This value is used to distinguish among different facilities.
3 SDG text 8 R Sample delivery group designation. Always populated for all samples, including QC.
4 FieldID text 20 R Client sample ID as appears on COC with optional lab-assigned suffixes and/or prefixes to make it unique. If the sample identifier on the COC and the prefix/suffix is greater than 13 characters, abbreviate the value but make it unique. For laboratory QC samples (i.e., method blanks, lab control samples), use a unique lab sample identifier.
5 NativeID text 20 R Client sample ID, exactly as on the COC. No prefix or suffix allowed. Used to identify the native sample from which other samples are derived (e.g., QAQCType = ”LR”, “MS”, or “SD”). For laboratory QC samples (i.e., method blanks, lab control samples), use a unique lab sample identifier. For lab blank spike (and blank spike duplicate) samples, use the FieldID value that was assigned to the associated method blank.
6 QAQCType text 2 R This is the code for the sample type. Any field sample that is not used as lab QC and is not otherwise marked on the COC should have the designation of “N” (normal field sample). No suffix allowed (i.e., do not add numbers as suffixes to the QAQCType values as is called for in the ERPIMS guidelines). Note that if all analyses for a given sample are diluted, then the first dilution should be designated as the normal sample. If more dilutions are required, then the next dilution should be designated as the first true dilution with a QAQCType value of “LR” and a LRType value of “DL” (see LRType, below).
7 LRType text 3 C This is the code for laboratory replicate sample type. Values are: blank (if QAQCType value is not “LR”), “DL” (dilution), “RE” (re-analysis), “D” (inorganic duplicate), “CF” (confirmation).
For multiple dilutions or re-analyses of the same sample, append the replicate number after the LRType value (i.e., “RE”, “RE2”, “RE3”, etc.).
PDX/100320028.PDF
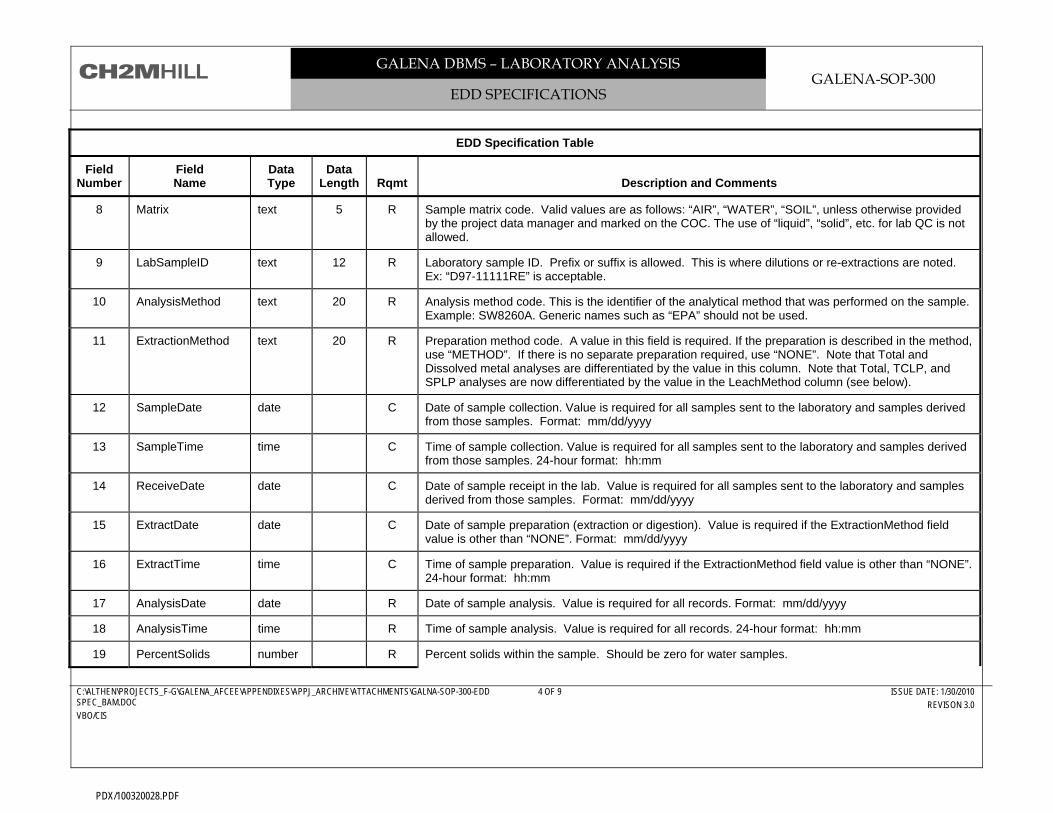
GALENA DBMS – LABORATORY ANALYSIS GALENA-SOP-300
EDD SPECIFICATIONS
C:\ALTHEN\PROJECTS_F-G\GALENA_AFCEE\APPENDIXES\APPJ_ARCHIVE\ATTACHMENTS\GALNA-SOP-300-EDD SPEC_BAM.DOC
VBO/CIS
4 OF 9 ISSUE DATE: 1/30/2010
REVISON 3.0
EDD Specification Table
Field Number
Field Name
Data Type
Data Length Rqmt Description and Comments
8 Matrix text 5 R Sample matrix code. Valid values are as follows: “AIR”, “WATER”, “SOIL”, unless otherwise provided by the project data manager and marked on the COC. The use of “liquid”, “solid”, etc. for lab QC is not allowed.
9 LabSampleID text 12 R Laboratory sample ID. Prefix or suffix is allowed. This is where dilutions or re-extractions are noted. Ex: “D97-11111RE” is acceptable.
10 AnalysisMethod text 20 R Analysis method code. This is the identifier of the analytical method that was performed on the sample. Example: SW8260A. Generic names such as “EPA” should not be used.
11 ExtractionMethod text 20 R Preparation method code. A value in this field is required. If the preparation is described in the method, use “METHOD”. If there is no separate preparation required, use “NONE”. Note that Total and Dissolved metal analyses are differentiated by the value in this column. Note that Total, TCLP, and SPLP analyses are now differentiated by the value in the LeachMethod column (see below).
12 SampleDate date C Date of sample collection. Value is required for all samples sent to the laboratory and samples derived from those samples. Format: mm/dd/yyyy
13 SampleTime time C Time of sample collection. Value is required for all samples sent to the laboratory and samples derived from those samples. 24-hour format: hh:mm
14 ReceiveDate date C Date of sample receipt in the lab. Value is required for all samples sent to the laboratory and samples derived from those samples. Format: mm/dd/yyyy
15 ExtractDate date C Date of sample preparation (extraction or digestion). Value is required if the ExtractionMethod field value is other than “NONE”. Format: mm/dd/yyyy
16 ExtractTime time C Time of sample preparation. Value is required if the ExtractionMethod field value is other than “NONE”. 24-hour format: hh:mm
17 AnalysisDate date R Date of sample analysis. Value is required for all records. Format: mm/dd/yyyy
18 AnalysisTime time R Time of sample analysis. Value is required for all records. 24-hour format: hh:mm
19 PercentSolids number R Percent solids within the sample. Should be zero for water samples.
PDX/100320028.PDF
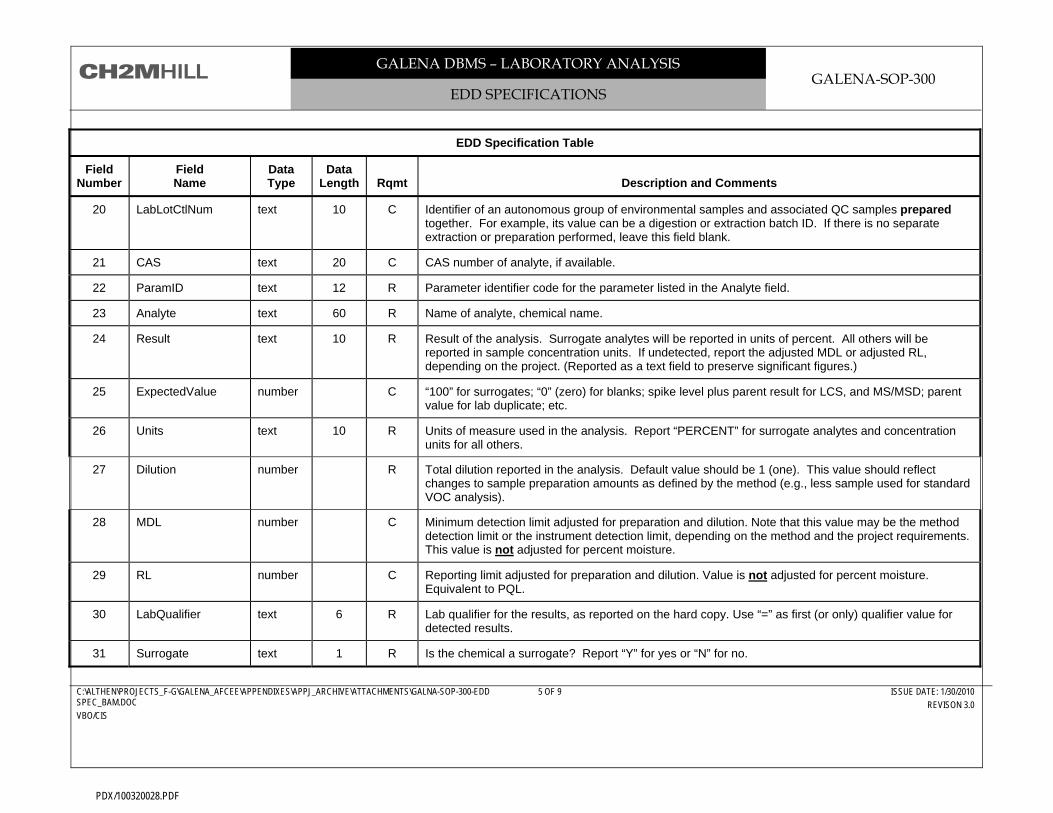
GALENA DBMS – LABORATORY ANALYSIS GALENA-SOP-300
EDD SPECIFICATIONS
C:\ALTHEN\PROJECTS_F-G\GALENA_AFCEE\APPENDIXES\APPJ_ARCHIVE\ATTACHMENTS\GALNA-SOP-300-EDD SPEC_BAM.DOC
VBO/CIS
5 OF 9 ISSUE DATE: 1/30/2010
REVISON 3.0
EDD Specification Table
Field Number
Field Name
Data Type
Data Length Rqmt Description and Comments
20 LabLotCtlNum text 10 C Identifier of an autonomous group of environmental samples and associated QC samples prepared together. For example, its value can be a digestion or extraction batch ID. If there is no separate extraction or preparation performed, leave this field blank.
21 CAS text 20 C CAS number of analyte, if available.
22 ParamID text 12 R Parameter identifier code for the parameter listed in the Analyte field.
23 Analyte text 60 R Name of analyte, chemical name.
24 Result text 10 R Result of the analysis. Surrogate analytes will be reported in units of percent. All others will be reported in sample concentration units. If undetected, report the adjusted MDL or adjusted RL, depending on the project. (Reported as a text field to preserve significant figures.)
25 ExpectedValue number C “100” for surrogates; “0” (zero) for blanks; spike level plus parent result for LCS, and MS/MSD; parent value for lab duplicate; etc.
26 Units text 10 R Units of measure used in the analysis. Report “PERCENT” for surrogate analytes and concentration units for all others.
27 Dilution number R Total dilution reported in the analysis. Default value should be 1 (one). This value should reflect changes to sample preparation amounts as defined by the method (e.g., less sample used for standard VOC analysis).
28 MDL number C Minimum detection limit adjusted for preparation and dilution. Note that this value may be the method detection limit or the instrument detection limit, depending on the method and the project requirements. This value is not adjusted for percent moisture.
29 RL number C Reporting limit adjusted for preparation and dilution. Value is not adjusted for percent moisture. Equivalent to PQL.
30 LabQualifier text 6 R Lab qualifier for the results, as reported on the hard copy. Use “=” as first (or only) qualifier value for detected results.
31 Surrogate text 1 R Is the chemical a surrogate? Report “Y” for yes or “N” for no.
PDX/100320028.PDF

GALENA DBMS – LABORATORY ANALYSIS GALENA-SOP-300
EDD SPECIFICATIONS
C:\ALTHEN\PROJECTS_F-G\GALENA_AFCEE\APPENDIXES\APPJ_ARCHIVE\ATTACHMENTS\GALNA-SOP-300-EDD SPEC_BAM.DOC
VBO/CIS
6 OF 9 ISSUE DATE: 1/30/2010
REVISON 3.0
EDD Specification Table
Field Number
Field Name
Data Type
Data Length Rqmt Description and Comments
32 Comments text 240 O Comment field
33 ParValUncert text 16 C Radiological parameter value uncertainty.
34 Recovery number C Percent recovery for MS, SD, LCS, and surrogate compounds.
35 LowerControlLimit number C Lower control limit value for spiked compounds, expressed in units of Percent. A value in this field is required if there is a value in the Recovery field (Field No. 34).
36 UpperControlLimit number C Upper control limit value for spiked compounds, expressed in units of Percent. A value in this field is required if there is a value in the Recovery field (Field No. 34).
37 Basis text 1 R Weight basis for soil (or solid) sample analysis. Use “D” for dry-weight basis, “W” for wet-weight basis, or “X” if not applicable.
38 ConcQual text 1 R Concentration qualifier. Use “=” for detects, “J” for estimated value (value between detection limit and reporting limit), “U” for undetected result, or “E” for exceeded result.
39 MDLAdjusted number C Minimum detection limit adjusted for preparation, dilution and percent moisture. See the description of the MDL field (Field No. 28) for an explanation of the contents of this field.
40 RLAdjusted number C Reporting limit adjusted for preparation, dilution and percent moisture. Equivalent to PQL
41 SampleDescription text 20 C Full sample identifier value as it appears on the COC. In some cases, this may be the name of the sampling location instead of the sample. Required for all samples that are either collected in the field and specified on the COC, or derived from samples that are collected in the field and specified on the COC.
42 LeachMethod text 20 R Analytical method used for leaching the sample. This applies to TCLP, SPLP, or other leaching or pre-extraction leaching procedures. Use “NONE” if the sample was not leached.
43 LeachDate date C Date that the leaching method was performed (start date for multi-date leaching procedures). Value is required if the LeachMethod field value is other then “NONE”. Format: mm/dd/yyyy.
44 LeachTime time C Time that the leaching procedure started. Value is required if the LeachMethod field value is other then “NONE”. 24-hour format: hh:mm.
PDX/100320028.PDF
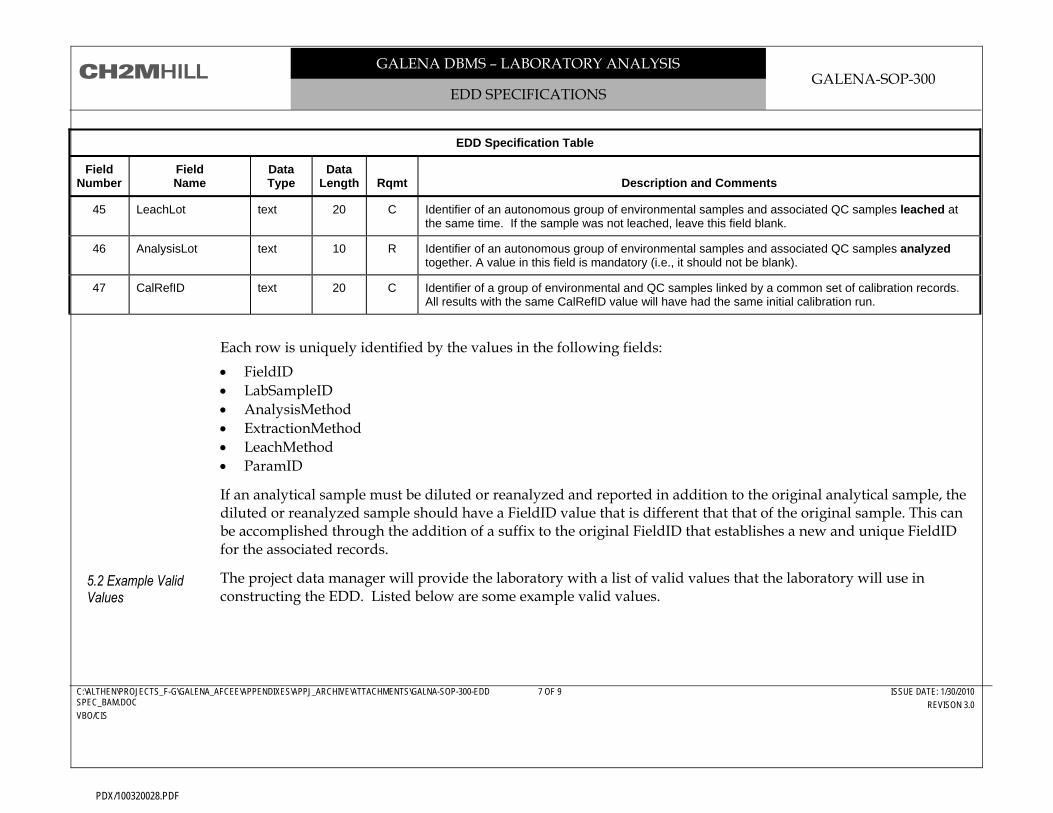
GALENA DBMS – LABORATORY ANALYSIS GALENA-SOP-300
EDD SPECIFICATIONS
C:\ALTHEN\PROJECTS_F-G\GALENA_AFCEE\APPENDIXES\APPJ_ARCHIVE\ATTACHMENTS\GALNA-SOP-300-EDD SPEC_BAM.DOC
VBO/CIS
7 OF 9 ISSUE DATE: 1/30/2010
REVISON 3.0
EDD Specification Table
Field Number
Field Name
Data Type
Data Length Rqmt Description and Comments
45 LeachLot text 20 C Identifier of an autonomous group of environmental samples and associated QC samples leached at the same time. If the sample was not leached, leave this field blank.
46 AnalysisLot text 10 R Identifier of an autonomous group of environmental samples and associated QC samples analyzed together. A value in this field is mandatory (i.e., it should not be blank).
47 CalRefID text 20 C Identifier of a group of environmental and QC samples linked by a common set of calibration records. All results with the same CalRefID value will have had the same initial calibration run.
Each row is uniquely identified by the values in the following fields: • FieldID • LabSampleID • AnalysisMethod • ExtractionMethod • LeachMethod • ParamID
If an analytical sample must be diluted or reanalyzed and reported in addition to the original analytical sample, the diluted or reanalyzed sample should have a FieldID value that is different that that of the original sample. This can be accomplished through the addition of a suffix to the original FieldID that establishes a new and unique FieldID for the associated records.
The project data manager will provide the laboratory with a list of valid values that the laboratory will use in constructing the EDD. Listed below are some example valid values.
5.2 Example Valid Values
PDX/100320028.PDF

GALENA DBMS – LABORATORY ANALYSIS GALENA-SOP-300
EDD SPECIFICATIONS
C:\ALTHEN\PROJECTS_F-G\GALENA_AFCEE\APPENDIXES\APPJ_ARCHIVE\ATTACHMENTS\GALNA-SOP-300-EDD SPEC_BAM.DOC
VBO/CIS
8 OF 9 ISSUE DATE: 1/30/2010
REVISON 3.0
Field Name Valid Value Meaning
VersionCode 4.00AFCEE3 Format 4.00, AFCEE data values. LabQualifier field contains the laboratory qualifier values defined in the AFCEE QAPP, version 3.0.
VersionCode 4.00EPACLP Format 4.00, EPA data values. LabQualifier field contains the standard EPA CLP lab qualifiers.
QAQCType N Normal, environmental sample
QAQCType LB Laboratory method blank
QAQCType MS Laboratory matrix spike sample
QAQCType SD Laboratory matrix spike duplicate
QAQCType LR Laboratory replicate (dilution, re-analysis, duplicate)
QAQCType BS Laboratory method blank spike
QAQCType BD Laboratory method blank spike duplicate
LRType DL First dilution sample
LRType DL2 Second dilution sample
LRType DL3 Third dilution sample
LRType RE First re-analysis/re-extraction sample
LRType RE2 Second re-analysis/re-extraction sample
LRType RE3 Third re-analysis/re-extraction sample
LRType D Inorganic duplicate sample
LRType CF First confirmation analysis sample
LRType CF2 Second confirmation analysis sample
LRType CF3 Third confirmation analysis sample
AnalysisMethod SW8260A Volatiles by method 8260A in EPA SW846.
PDX/100320028.PDF

GALENA DBMS – LABORATORY ANALYSIS GALENA-SOP-300
EDD SPECIFICATIONS
C:\ALTHEN\PROJECTS_F-G\GALENA_AFCEE\APPENDIXES\APPJ_ARCHIVE\ATTACHMENTS\GALNA-SOP-300-EDD SPEC_BAM.DOC
VBO/CIS
9 OF 9 ISSUE DATE: 1/30/2010
REVISON 3.0
Field Name Valid Value Meaning
AnalysisMethod SW8270 Semivolatiles by method 8270 in EPA SW846.
AnalysisMethod SW6010 ICP metals by method 6010 in EPA SW846.
AnalysisMethod SW7060 GFAA Arsenic by method 7060 in EPA SW846.
ExtractionMethod FLDFLT Field filtration for dissolved metals analysis
ExtractionMethod C3050 CLP-modified SW3050 acid digestion for metals analysis in soil samples.
ExtractionMethod SW1311 TCLP extraction
ExtractionMethod DISWAT Distilled water extraction for analytes in soil samples.
ExtractionMethod SW3510 Separatory funnel extraction
ExtractionMethod SW3540 Soxhlet extraction
ExtractionMethod TOTAL Digestion of unfiltered waters for total metals analysis
ParamID ACE Acetone
ParamID AS Arsenic
ParamID BHCGAMMA gamma-BHC (Lindane)
ParamID BZ Benzene
ParamID CDS Carbon disulfide
ParamID PB Lead
ParamID PHENOL Phenol
ParamID SE Selenium
ParamID TCE Trichloroethene
PDX/100320028.PDF

GALENA DBMS – LABORATORY ANALYSIS GALENA-SOP-302
CH-ANALYZER TOOL
C:\ALTHEN\PROJECTS_F-G\GALENA_AFCEE\APPENDIXES\APPJ_ARCHIVE\ATTACHMENTS\GALNA-SOP-302-CH-ANALYZER_BAM.DOC
NER/CIS
1 OF 3 ISSUE DATE: MAY 25, 2006
REVISON 1.0
This standard operating procedure (SOP) establishes responsibilities, requirements, and instructions for the CH-Analyzer Tool for the Galena Database Management System.
This SOP provides information on the use and maintenance of the CH-Analyzer Tool by labs submitting EDDs and internal EDD checks. The CH-Analyzer Tool is used to perform a Quality Control (QC) review of the content in electronic data deliverables (EDDs) to ensure correct reporting formats, valid values, and basic content before and after EDD submittal to CH2M HILL.
None
EDD Electronic Data Deliverable
QC Quality Control
Personnel shall conduct data management activities in a fashion to maintain the highest standards of quality to ensure the integrity and defensibility of project data, consistent with project requirements. The following individuals are identified as having responsibilities associated with this procedure:
The Project Chemist is responsible for ensuring that the laboratory has an up-to-date version of the CH-Analyzer, and is using it to perform a QC check on EDDs before their submittal to CH2M HILL. Responsibilities also include performing internal EDD QC checks on submittals with an internal copy of the CH-Analyzer, and assisting the laboratory with the resolution of EDD issues that may arise.
The Data Manager and Database Analyst will assist the Project Chemist with performing internal EDD QC checks on submittals and assisting the laboratory with the resolution of EDD issues that may arise, as needed.
Procedures for the CH-Analyzer are as follows. The procedure for operating the CH-Analyzer by laboratories and CH2M HILL are the same.
An up-to-date laboratory use only version of the CH-Analyzer must be provided to laboratories conducting sample analyses, the Project Chemist, and the Data Manager and Database Analyst as needed. A copy of the CH-Analyzer should be saved to the desktop of the computer where the EDD will undergo a QC check.
Enter the name of the person performing the QC review in the Reviewer box. Enter the date the QC review is being performed in the Date box.
Type the EDD file name and applicable extension in the next set of boxes (that is, csv or txt). Enter the location of the file to be QC’d in the location
2 References
3 Definitions
4 Responsibilities
1 Purpose and Description
5.1 Obtain CH-Analyzer
5.2 Enter Basic Information
5.3 Import the EDD
5 Procedure
PDX/100320028.PDF
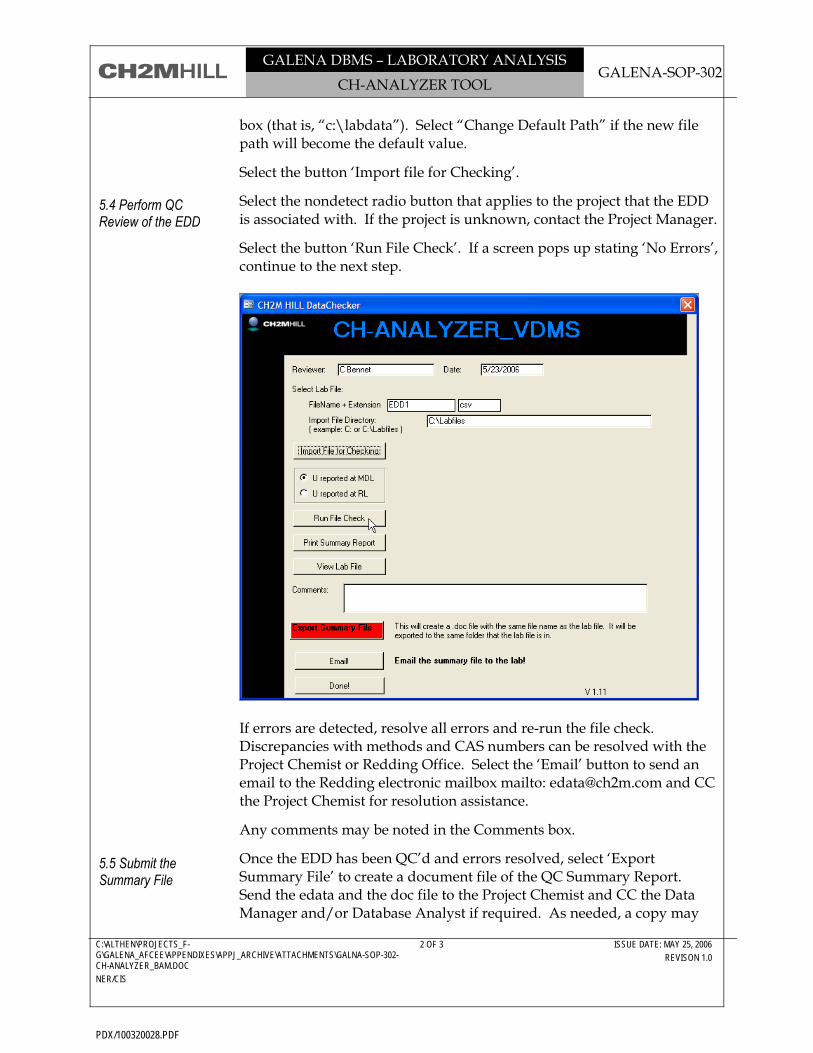
GALENA DBMS – LABORATORY ANALYSIS GALENA-SOP-302
CH-ANALYZER TOOL
C:\ALTHEN\PROJECTS_F-G\GALENA_AFCEE\APPENDIXES\APPJ_ARCHIVE\ATTACHMENTS\GALNA-SOP-302-CH-ANALYZER_BAM.DOC
NER/CIS
2 OF 3 ISSUE DATE: MAY 25, 2006
REVISON 1.0
box (that is, “c:\labdata”). Select “Change Default Path” if the new file path will become the default value.
Select the button ‘Import file for Checking’.
Select the nondetect radio button that applies to the project that the EDD is associated with. If the project is unknown, contact the Project Manager.
Select the button ‘Run File Check’. If a screen pops up stating ‘No Errors’, continue to the next step.
If errors are detected, resolve all errors and re-run the file check. Discrepancies with methods and CAS numbers can be resolved with the Project Chemist or Redding Office. Select the ‘Email’ button to send an email to the Redding electronic mailbox mailto: [email protected] and CC the Project Chemist for resolution assistance.
Any comments may be noted in the Comments box.
Once the EDD has been QC’d and errors resolved, select ‘Export Summary File’ to create a document file of the QC Summary Report. Send the edata and the doc file to the Project Chemist and CC the Data Manager and/or Database Analyst if required. As needed, a copy may
5.4 Perform QC Review of the EDD
5.5 Submit the Summary File
PDX/100320028.PDF
GALENA DBMS – LABORATORY ANALYSIS GALENA-SOP-302
CH-ANALYZER TOOL
C:\ALTHEN\PROJECTS_F-G\GALENA_AFCEE\APPENDIXES\APPJ_ARCHIVE\ATTACHMENTS\GALNA-SOP-302-CH-ANALYZER_BAM.DOC
NER/CIS
3 OF 3 ISSUE DATE: MAY 25, 2006
REVISON 1.0
also be provided to the Redding Office for approval as needed by sending an email to [email protected].
When finished, select the ‘Done’ button to close the application.
Note – Laboratories will perform the above procedure, and submit the QC Summary File and EDD to CH2M HILL. CH2M HILL will then repeat the above procedure to ensure the QC results are correct and all errors have been resolved.
PDX/100320028.PDF
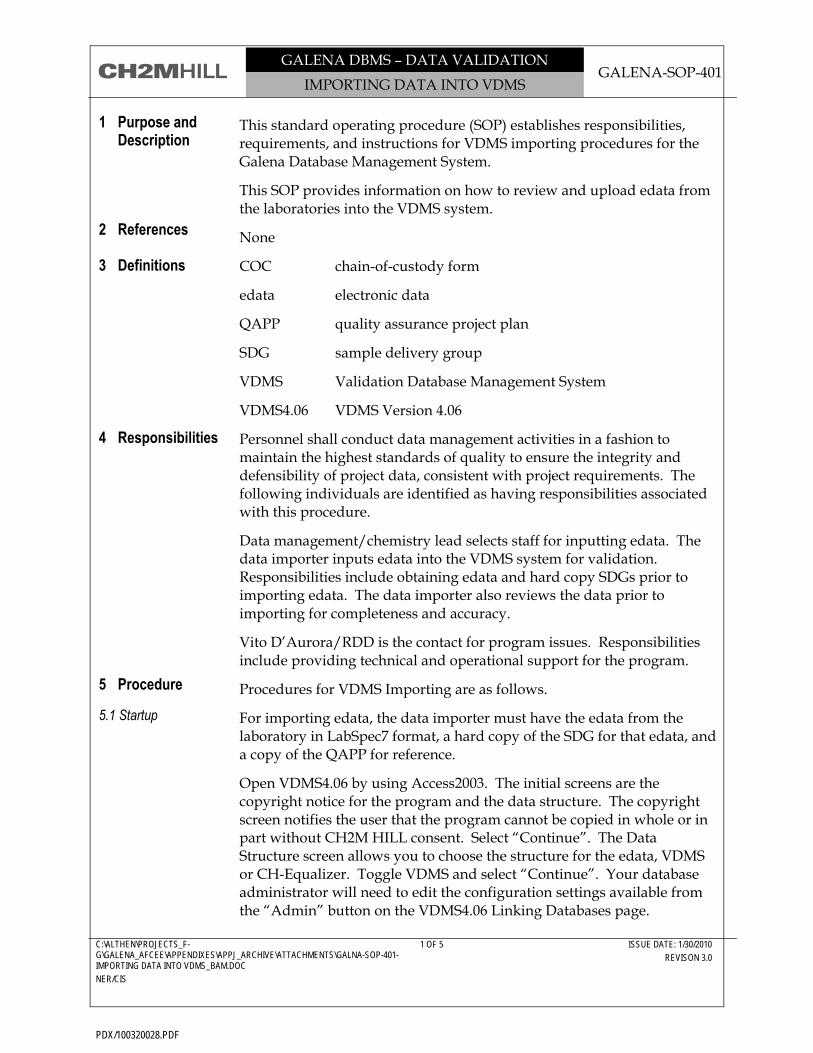
GALENA DBMS – DATA VALIDATION GALENA-SOP-401
IMPORTING DATA INTO VDMS
C:\ALTHEN\PROJECTS_F-G\GALENA_AFCEE\APPENDIXES\APPJ_ARCHIVE\ATTACHMENTS\GALNA-SOP-401-IMPORTING DATA INTO VDMS_BAM.DOC
NER/CIS
1 OF 5 ISSUE DATE: 1/30/2010
REVISON 3.0
This standard operating procedure (SOP) establishes responsibilities, requirements, and instructions for VDMS importing procedures for the Galena Database Management System.
This SOP provides information on how to review and upload edata from the laboratories into the VDMS system.
None
COC chain-of-custody form
edata electronic data
QAPP quality assurance project plan
SDG sample delivery group
VDMS Validation Database Management System
VDMS4.06 VDMS Version 4.06
Personnel shall conduct data management activities in a fashion to maintain the highest standards of quality to ensure the integrity and defensibility of project data, consistent with project requirements. The following individuals are identified as having responsibilities associated with this procedure.
Data management/chemistry lead selects staff for inputting edata. The data importer inputs edata into the VDMS system for validation. Responsibilities include obtaining edata and hard copy SDGs prior to importing edata. The data importer also reviews the data prior to importing for completeness and accuracy.
Vito D’Aurora/RDD is the contact for program issues. Responsibilities include providing technical and operational support for the program.
Procedures for VDMS Importing are as follows.
For importing edata, the data importer must have the edata from the laboratory in LabSpec7 format, a hard copy of the SDG for that edata, and a copy of the QAPP for reference.
Open VDMS4.06 by using Access2003. The initial screens are the copyright notice for the program and the data structure. The copyright screen notifies the user that the program cannot be copied in whole or in part without CH2M HILL consent. Select “Continue”. The Data Structure screen allows you to choose the structure for the edata, VDMS or CH-Equalizer. Toggle VDMS and select “Continue”. Your database administrator will need to edit the configuration settings available from the “Admin” button on the VDMS4.06 Linking Databases page.
2 References
3 Definitions
4 Responsibilities
1 Purpose and Description
5.1 Startup
5 Procedure
PDX/100320028.PDF
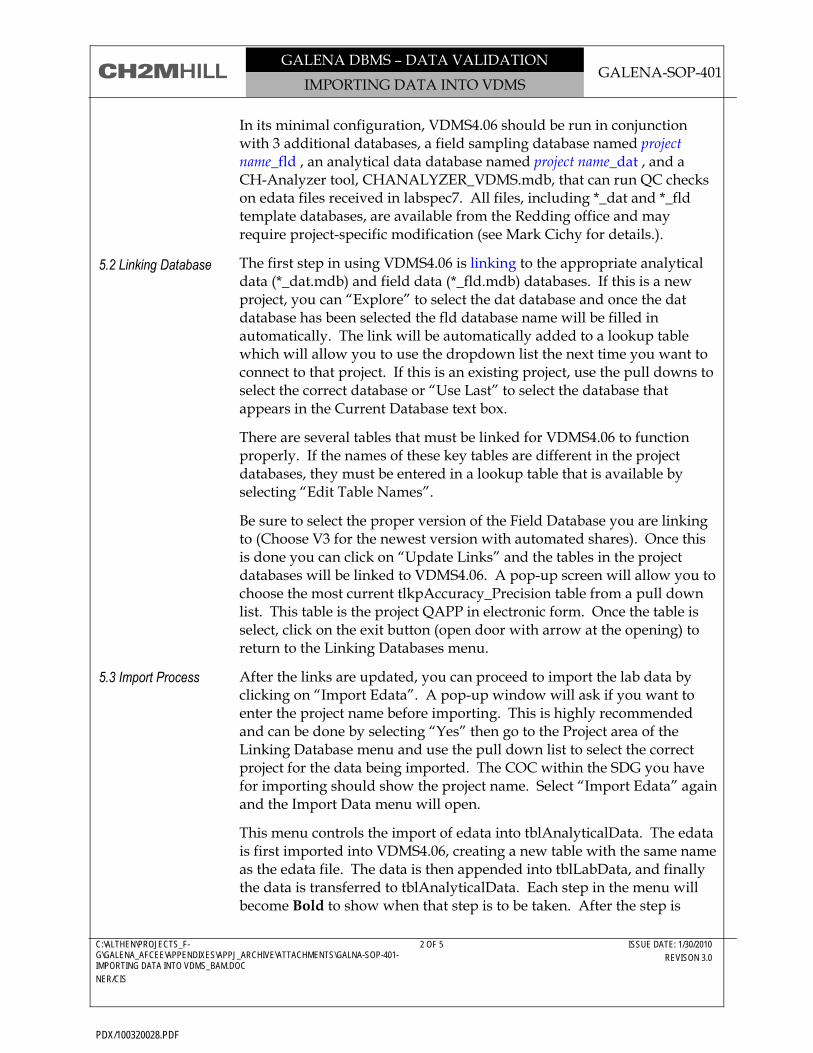
GALENA DBMS – DATA VALIDATION GALENA-SOP-401
IMPORTING DATA INTO VDMS
C:\ALTHEN\PROJECTS_F-G\GALENA_AFCEE\APPENDIXES\APPJ_ARCHIVE\ATTACHMENTS\GALNA-SOP-401-IMPORTING DATA INTO VDMS_BAM.DOC
NER/CIS
2 OF 5 ISSUE DATE: 1/30/2010
REVISON 3.0
In its minimal configuration, VDMS4.06 should be run in conjunction with 3 additional databases, a field sampling database named project name_fld , an analytical data database named project name_dat , and a CH-Analyzer tool, CHANALYZER_VDMS.mdb, that can run QC checks on edata files received in labspec7. All files, including *_dat and *_fld template databases, are available from the Redding office and may require project-specific modification (see Mark Cichy for details.).
The first step in using VDMS4.06 is linking to the appropriate analytical data (*_dat.mdb) and field data (*_fld.mdb) databases. If this is a new project, you can “Explore” to select the dat database and once the dat database has been selected the fld database name will be filled in automatically. The link will be automatically added to a lookup table which will allow you to use the dropdown list the next time you want to connect to that project. If this is an existing project, use the pull downs to select the correct database or “Use Last” to select the database that appears in the Current Database text box.
There are several tables that must be linked for VDMS4.06 to function properly. If the names of these key tables are different in the project databases, they must be entered in a lookup table that is available by selecting “Edit Table Names”.
Be sure to select the proper version of the Field Database you are linking to (Choose V3 for the newest version with automated shares). Once this is done you can click on “Update Links” and the tables in the project databases will be linked to VDMS4.06. A pop-up screen will allow you to choose the most current tlkpAccuracy_Precision table from a pull down list. This table is the project QAPP in electronic form. Once the table is select, click on the exit button (open door with arrow at the opening) to return to the Linking Databases menu.
After the links are updated, you can proceed to import the lab data by clicking on “Import Edata”. A pop-up window will ask if you want to enter the project name before importing. This is highly recommended and can be done by selecting “Yes” then go to the Project area of the Linking Database menu and use the pull down list to select the correct project for the data being imported. The COC within the SDG you have for importing should show the project name. Select “Import Edata” again and the Import Data menu will open.
This menu controls the import of edata into tblAnalyticalData. The edata is first imported into VDMS4.06, creating a new table with the same name as the edata file. The data is then appended into tblLabData, and finally the data is transferred to tblAnalyticalData. Each step in the menu will become Bold to show when that step is to be taken. After the step is
5.2 Linking Database
5.3 Import Process
PDX/100320028.PDF
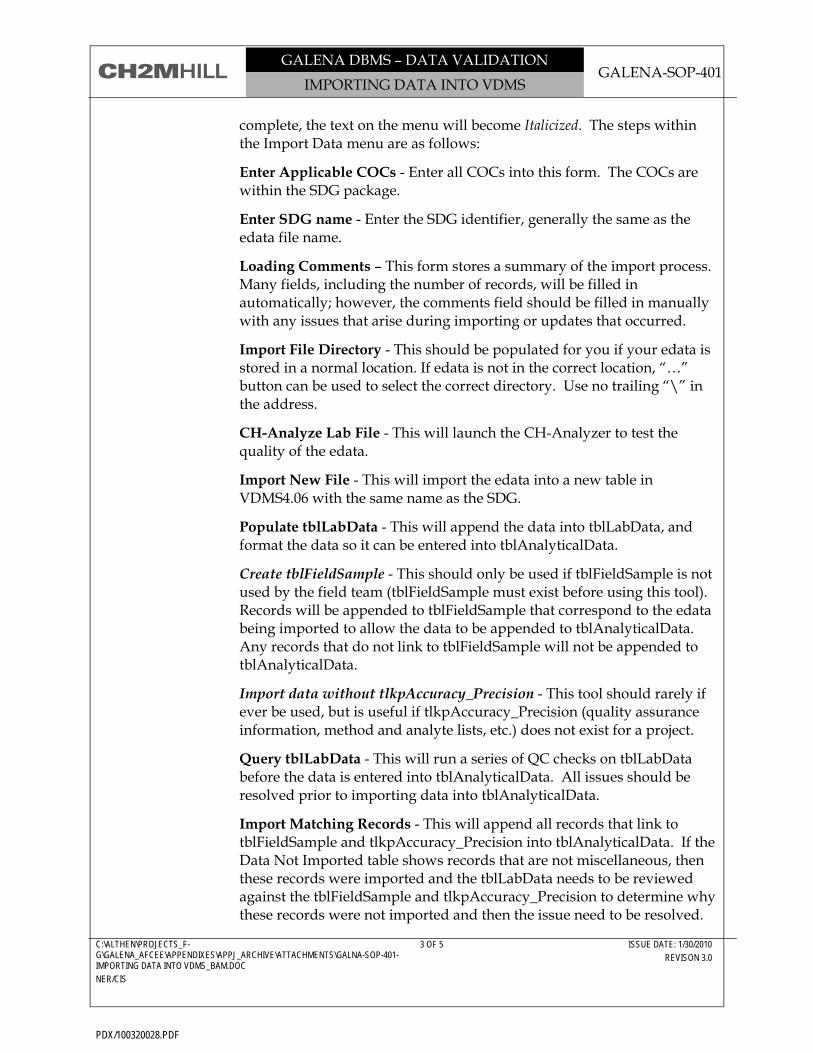
GALENA DBMS – DATA VALIDATION GALENA-SOP-401
IMPORTING DATA INTO VDMS
C:\ALTHEN\PROJECTS_F-G\GALENA_AFCEE\APPENDIXES\APPJ_ARCHIVE\ATTACHMENTS\GALNA-SOP-401-IMPORTING DATA INTO VDMS_BAM.DOC
NER/CIS
3 OF 5 ISSUE DATE: 1/30/2010
REVISON 3.0
complete, the text on the menu will become Italicized. The steps within the Import Data menu are as follows:
Enter Applicable COCs - Enter all COCs into this form. The COCs are within the SDG package.
Enter SDG name - Enter the SDG identifier, generally the same as the edata file name.
Loading Comments – This form stores a summary of the import process. Many fields, including the number of records, will be filled in automatically; however, the comments field should be filled in manually with any issues that arise during importing or updates that occurred.
Import File Directory - This should be populated for you if your edata is stored in a normal location. If edata is not in the correct location, “…” button can be used to select the correct directory. Use no trailing “\” in the address.
CH-Analyze Lab File - This will launch the CH-Analyzer to test the quality of the edata.
Import New File - This will import the edata into a new table in VDMS4.06 with the same name as the SDG.
Populate tblLabData - This will append the data into tblLabData, and format the data so it can be entered into tblAnalyticalData.
Create tblFieldSample - This should only be used if tblFieldSample is not used by the field team (tblFieldSample must exist before using this tool). Records will be appended to tblFieldSample that correspond to the edata being imported to allow the data to be appended to tblAnalyticalData. Any records that do not link to tblFieldSample will not be appended to tblAnalyticalData.
Import data without tlkpAccuracy_Precision - This tool should rarely if ever be used, but is useful if tlkpAccuracy_Precision (quality assurance information, method and analyte lists, etc.) does not exist for a project.
Query tblLabData - This will run a series of QC checks on tblLabData before the data is entered into tblAnalyticalData. All issues should be resolved prior to importing data into tblAnalyticalData.
Import Matching Records - This will append all records that link to tblFieldSample and tlkpAccuracy_Precision into tblAnalyticalData. If the Data Not Imported table shows records that are not miscellaneous, then these records were imported and the tblLabData needs to be reviewed against the tblFieldSample and tlkpAccuracy_Precision to determine why these records were not imported and then the issue need to be resolved.
PDX/100320028.PDF
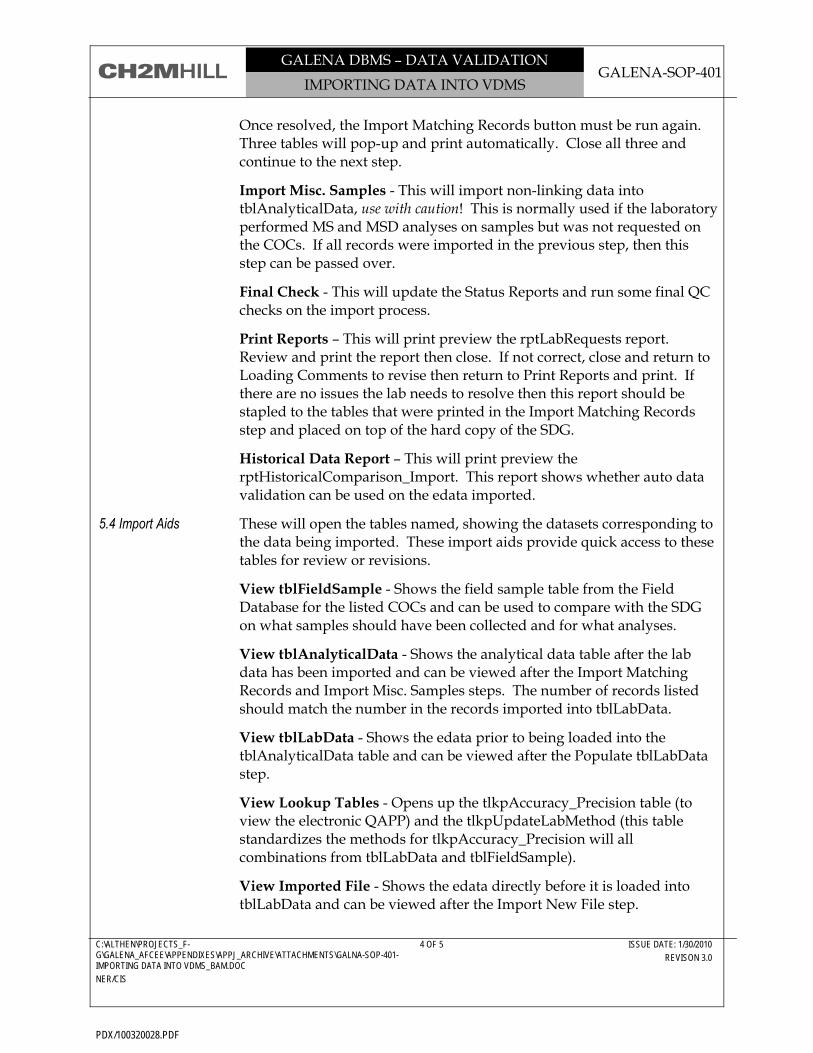
GALENA DBMS – DATA VALIDATION GALENA-SOP-401
IMPORTING DATA INTO VDMS
C:\ALTHEN\PROJECTS_F-G\GALENA_AFCEE\APPENDIXES\APPJ_ARCHIVE\ATTACHMENTS\GALNA-SOP-401-IMPORTING DATA INTO VDMS_BAM.DOC
NER/CIS
4 OF 5 ISSUE DATE: 1/30/2010
REVISON 3.0
Once resolved, the Import Matching Records button must be run again. Three tables will pop-up and print automatically. Close all three and continue to the next step.
Import Misc. Samples - This will import non-linking data into tblAnalyticalData, use with caution! This is normally used if the laboratory performed MS and MSD analyses on samples but was not requested on the COCs. If all records were imported in the previous step, then this step can be passed over.
Final Check - This will update the Status Reports and run some final QC checks on the import process.
Print Reports – This will print preview the rptLabRequests report. Review and print the report then close. If not correct, close and return to Loading Comments to revise then return to Print Reports and print. If there are no issues the lab needs to resolve then this report should be stapled to the tables that were printed in the Import Matching Records step and placed on top of the hard copy of the SDG.
Historical Data Report – This will print preview the rptHistoricalComparison_Import. This report shows whether auto data validation can be used on the edata imported.
These will open the tables named, showing the datasets corresponding to the data being imported. These import aids provide quick access to these tables for review or revisions.
View tblFieldSample - Shows the field sample table from the Field Database for the listed COCs and can be used to compare with the SDG on what samples should have been collected and for what analyses.
View tblAnalyticalData - Shows the analytical data table after the lab data has been imported and can be viewed after the Import Matching Records and Import Misc. Samples steps. The number of records listed should match the number in the records imported into tblLabData.
View tblLabData - Shows the edata prior to being loaded into the tblAnalyticalData table and can be viewed after the Populate tblLabData step.
View Lookup Tables - Opens up the tlkpAccuracy_Precision table (to view the electronic QAPP) and the tlkpUpdateLabMethod (this table standardizes the methods for tlkpAccuracy_Precision will all combinations from tblLabData and tblFieldSample).
View Imported File - Shows the edata directly before it is loaded into tblLabData and can be viewed after the Import New File step.
5.4 Import Aids
PDX/100320028.PDF
GALENA DBMS – DATA VALIDATION GALENA-SOP-401
IMPORTING DATA INTO VDMS
C:\ALTHEN\PROJECTS_F-G\GALENA_AFCEE\APPENDIXES\APPJ_ARCHIVE\ATTACHMENTS\GALNA-SOP-401-IMPORTING DATA INTO VDMS_BAM.DOC
NER/CIS
5 OF 5 ISSUE DATE: 1/30/2010
REVISON 3.0
Import Query Analysis - If you are experiencing difficulty importing, this will run a series of queries that will analyze various aspects of the import to help determine what might be causing the problem.
PDX/100320028.PDF
GALENA DBMS – DATA VALIDATION Galena-SOP-402
VDMS VALIDATION
C:\ALTHEN\PROJECTS_F-G\GALENA_AFCEE\APPENDIXES\APPJ_ARCHIVE\ATTACHMENTS\GALNA-SOP-402-VDMS VALIDATION_BAM.DOC
NER/CIS
1 OF 10 ISSUE DATE: 1/30/2010
REVISON 4.0
This standard operating procedure (SOP) establishes responsibilities, requirements, and instructions for VDMS validating procedures for the Galena Database Management System.
This SOP provides information on how to validate edata by either the semiautomated process which allows you to validate the edata step-by-step against the hard copy or the fully automated process which handles the entire validation process and exceedance reporting.
None
AFCEE Air Force Center for Environmental Excellence CLP Contract Laboratory Program COC chain-of-custody form DV data validation edata electronic data LCS/LCSD laboratory control sample/laboratory control sample duplicate LR laboratory replicate MS/SD matrix spike/matrix spike duplicate QA/QC quality assurance/quality control QAPP quality assurance project plan RAC response action contractor RPD relative percent difference SDG sample delivery group VDMS Validation Database Management System VDMS4.06 VDMS Version 4.06 VOC volatile organic compound
Personnel shall conduct data management activities in a fashion to maintain the highest standards of quality to ensure the integrity and defensibility of project data, consistent with project requirements. The following individuals are identified as having responsibilities associated with this procedure:
PC reviews the edata in the VDMS system against the QAPP. Responsibilities include completeness and accuracy of validating every method in each SDG. The PC will chose a validator if appropriate.
Vito D’Aurora/RDD is the contact for program issues. Responsibilities include providing technical and operational support for the program.
2 References
3 Definitions
4 Responsibilities
1 Purpose and Description
PDX/100320028.PDF
GALENA DBMS – DATA VALIDATION Galena-SOP-402
VDMS VALIDATION
C:\ALTHEN\PROJECTS_F-G\GALENA_AFCEE\APPENDIXES\APPJ_ARCHIVE\ATTACHMENTS\GALNA-SOP-402-VDMS VALIDATION_BAM.DOC
NER/CIS
2 OF 10 ISSUE DATE: 1/30/2010
REVISON 4.0
Procedures for VDMS validating are as follows.
For validation, the edata must be imported into VDMS and validator must have the hard copy report of the SDG for that edata and a copy of the QAPP for reference. The validator must ensure that VDMS has been properly configured by the PC for each method/matrix prior to executing each validation component or apply validation flags manually using the “Miscellaneous Flags” option.
Open VDMS4.06 by using Access2003. The initial screens are the copyright notice for the program and the data structure. The copyright screen notifies the user that the program cannot be copied in whole or in part without CH2M HILL consent. Select “Continue”. The Data Structure screen allows you to choose the structure for the edata, VDMS or CH-Equalizer. Toggle VDMS and select “Continue”. Your database administrator will need to edit the configuration settings available from the “Admin” button on the VDMS4.06 Linking Databases page.
In its minimal configuration, VDMS4.06 should be run in conjunction with three additional databases, a Field Database database named project name_fld , an analytical data database named project name_dat , and a CH-Analyzer tool, CHANALYZER_VDMS.mdb, that can run QC checks on edata files received in labspec7. All files, including *_dat and *_fld template databases, are available from the Redding office and may require project-specific modification (see Mark Cichy for details.).
The first step in using VDMS4.06 is linking to the appropriate analytical data (*_dat.mdb) and field data (*_fld.mdb) databases. If this is a new project, you can “Explore” to select the dat database and once the dat database has been selected the fld database name will be filled in automatically. The link will be automatically added to a lookup table that will allow you to use the dropdown list the next time you want to connect to that project. If this is an existing project, use the pull downs to select the correct database or “Use Last” to select the database that appears in the Current Database text box.
There are several tables that must be linked for VDMS4.06 to function properly. If the names of these key tables are different in the project databases, they must be entered in a lookup table that is available by selecting “Edit Table Names”.
Be sure to select the proper version of the Field Database you are linking to (Choose V3 for the newest version with automated shares). Once this is done you can click on “Update Links” and the tables in the project databases will be linked to VDMS4.06. A pop-up screen will allow you to choose the most current tlkpAccuracy_Precision table from a pull down list. This table is the project QAPP in electronic form. Once the table is
5.1 Startup
5 Procedure
5.2 Linking Database
5.3 Semiautomated Validation Process
PDX/100320028.PDF
GALENA DBMS – DATA VALIDATION Galena-SOP-402
VDMS VALIDATION
C:\ALTHEN\PROJECTS_F-G\GALENA_AFCEE\APPENDIXES\APPJ_ARCHIVE\ATTACHMENTS\GALNA-SOP-402-VDMS VALIDATION_BAM.DOC
NER/CIS
3 OF 10 ISSUE DATE: 1/30/2010
REVISON 4.0
select, click on the exit button (open door with arrow at the opening) to return to the Linking Databases menu.
After the links are updated, you can proceed to semi-automated validation by clicking on “Data Validation”. A pop-up window will ask if you want to enter the project name before validating. This is highly recommended and can be done by selecting “Yes” then go to the Project area of the Linking Database menu and use the pull down list to select the correct project for the data being imported. The SDG you have for validating should show the project name on the attached importing report. Note: the edata of the SDG needs to imported into the system before validation can occur. Select “Data Validation” again and the Flagging Rules menu will open. This menu should be setup by the senior chemist and should not be changed once established without approval by the senior chemist.
Select the exit door to continue to the Validate Data menu. Select the SDG and Method you are going to validate from the pull down lists; if they are not available, click on Refresh tlkpFieldID and try again. If the data has already been validated you can click on View All SDGs to show both validated and non-validated data. Once you have selected an SDG and Method, you can click on Begin Validation. If you want to revalidate data you can select the SDG/Method and click on Remove All Flags to strip all validation flags and start over. The Validation screen shows each Validation area, and each area is checked off if you have completed that aspect of the validation process. The following are the steps for each process:
Analytical Batch - displays the count of each QAQC type by LabLotNumber. This allows rapid identification of LabLotNumber / QAQC Type errors. Any totally orphaned laboratory QC will be highlighted in yellow, but other errors may be found. LabLotNumbers can be corrected for specific QAQC Types from this screen. Clicking on DV Worksheet will take you to Comments where you can fill in any comments from this review.
View Sample IDs - This screen shows the number of analytes by Sample, QAQC Type, and LR Type, allowing a rapid QC evaluation of the data set. Clicking on DV Worksheet will take you to Comments where you can fill in any comments from this review.
Dilutions and Reextractions - This screen allows you to view the original analysis against the diluted and/or reextracted analysis for each analyte. The diluted or reextracted value will be automatically excluded except when the original concentration has an “E” laboratory flag. In this case, the original concentration will be excluded and the diluted or reextracted value will be retained. Each
PDX/100320028.PDF
GALENA DBMS – DATA VALIDATION Galena-SOP-402
VDMS VALIDATION
C:\ALTHEN\PROJECTS_F-G\GALENA_AFCEE\APPENDIXES\APPJ_ARCHIVE\ATTACHMENTS\GALNA-SOP-402-VDMS VALIDATION_BAM.DOC
NER/CIS
4 OF 10 ISSUE DATE: 1/30/2010
REVISON 4.0
analyte should be reviewed to confirm that only one concentration (the best result) is retained. Clicking on DV Worksheet will take you to Form I Review, with the dilutions and/or reextractions already filled in.
Method Blank - This screen allows flagging for Method Blanks. Each Blank appears on its own page (the arrows at the top of the page allow you to scroll through each one), along with related samples. The top of the form shows information about the Blank, along with a recalculated (1X - 5X - 10X) Blank result. The calculated value will show the associated result with dilution calculated, and Final Flags, Validation Reasons, and Validation Comments are automatically filled in. You can apply or remove flags by entering or removing an “X” in the apply field along with the appropriate flag. Once you check flags for all pages and make any adjustments necessary, you can Accept Flags. Clicking on DV Worksheet will take you to Method Blanks, with blank detects already filled in.
Field Blank - The Field Blank flagging works just like the Method Blank flagging except that you can associate the field blank by SDG or laboratory lot control number. You can also apply a matrix conversion factor before checking flags. Each Blank appears on its own page, along with related samples. You have a choice of AFCEE (5X / 10X) or CLP flagging, this should be selected before continuing. The 10X analyte list can be edited in tlkp10X. The top of the form shows information about the Blank, along with a recalculated (1X - 5X - 10X) Blank result. The calculated value will show the associated result with dilution calculated, and Final Flags, Validation Reasons and Validation Comments are automatically filled in. Once you check flags for all pages and make any adjustments necessary, you can Accept Flags. Clicking on DV Worksheet will take you to Field Blanks, with blank detects already filled in.
Laboratory Control Sample - The initial LCS screen shows which spikes are out of control and gives you a choice of flagging only that analyte or all analytes. You can see the numbers of LCS and LCSD that are out of control, and you can preview the MS/SD flagging to facilitate Navy RAC LCS flagging. When you select Flag These Analytes or Flag All Analytes, each LCS or LCSD appears on its own page, along with related samples. The top of the form shows information about the LCS or LCSD, and the Final Flags, Validation Reasons and Validation Comments are automatically filled in for the associated samples. Once you check flags for all pages and make any adjustments necessary, you can Accept Flags. Clicking on DV Worksheet will take you to Laboratory Control Sample, with the analytes that are out of control already listed.
PDX/100320028.PDF
GALENA DBMS – DATA VALIDATION Galena-SOP-402
VDMS VALIDATION
C:\ALTHEN\PROJECTS_F-G\GALENA_AFCEE\APPENDIXES\APPJ_ARCHIVE\ATTACHMENTS\GALNA-SOP-402-VDMS VALIDATION_BAM.DOC
NER/CIS
5 OF 10 ISSUE DATE: 1/30/2010
REVISON 4.0
LCS RPD - The initial LCS screen shows which spikes are out of control, and gives you a choice of flagging only that analyte or all analytes. When you select Flag These Analytes or Flag All Analytes, each analyte appears on its own page, along with related samples. The top of the form shows information about the LCS/LCSD samples, the calculated RPD, and the RPD limit. The Final Flags, Validation Reasons and Validation Comments are automatically filled in for the associated samples. Once you check flags for all pages and make any adjustments necessary, you can Accept Flags. Clicking on DV Worksheet will take you to Laboratory Control Sample, with the analytes that are out of control already listed.
Matrix Spike (MS) Recovery - If any matrix spikes were found, you need to choose how to associate the MS to the normal samples; you can associate by ParentID, which should be populated in tblfieldSample, or preferably by FQCLot, which may not be populated, but which allows associating an MS to a set of normal samples. Each MS appears on its own page, along with related samples. The top of the form shows information about the MS, and the Final Flags, Validation Reasons and Validation Comments are automatically filled in for the associated samples. Once you check flags for all pages and make any adjustments necessary, you can Accept Flags. Clicking on DV Worksheet will take you to Matrix Spike, with the analytes that are out of control already listed.
Matrix Spike (SD) Recovery – Same as Matrix Spike (MS) Recovery step except for SD samples.
Matrix Spike RPD - Same as Matrix Spike (MS) Recovery step except for MS RPD exceedances.
Lab Duplicate RPD - Each LR appears on its own page along with the associated sample, and the Final Flags, calculated RPD, RPD limit, Validation Reasons and Validation Comments are automatically filled in for the associated sample. Once you check flags for all pages and make any adjustments necessary, you can Accept Flags. Clicking on DV Worksheet will take you to Laboratory Duplicate, with the LR already filled in.
Surrogate Recovery - Each surrogate appears on its own page, along with related samples. The top of the form shows information about the surrogate, and the Final Flags, Validation Reasons and Validation Comments are automatically filled in for the associated samples. Once you check flags for all pages and make any adjustments necessary, you can Accept Flags. Clicking on DV Worksheet will take you to Surrogates, with the analytes that are out of control already listed.
PDX/100320028.PDF
GALENA DBMS – DATA VALIDATION Galena-SOP-402
VDMS VALIDATION
C:\ALTHEN\PROJECTS_F-G\GALENA_AFCEE\APPENDIXES\APPJ_ARCHIVE\ATTACHMENTS\GALNA-SOP-402-VDMS VALIDATION_BAM.DOC
NER/CIS
6 OF 10 ISSUE DATE: 1/30/2010
REVISON 4.0
Calibration - This form allows you to choose which samples to flag for ICAL or CCAL: First choose the samples to flag, and the category of flagging. At the next step, select which analytes to flag. As you continue, enter the value for each analyte and select the category for the exceedance. The last step allows you to enter the new flags, the type of flagging (M for matrix or P for process), validation reason, and additional information. Select Review Flags to see the Final Flags, Validation Reasons and Validation Comments that are automatically filled in for the associated samples. Once you check all the flags and make any adjustments necessary, you can Accept Flags. Clicking on DV Worksheet will take you to either Initial Calibration or Continuing Calibration, depending on what category was originally selected, with the analytes that are out of control already listed.
Holding Time - The holding time form allows you to flag any samples that exceed holding times, and allows you to use a “custom” set of criteria for samples that are exceptions, such as unpreserved VOCs or Encores. Each sample appears on its own page. The top of the form shows information about the holding times, and the Final Flags, Validation Reasons and Validation Comments are automatically filled in for the associated analytes. Once you check flags for all pages and make any adjustments necessary, you can Accept Flags. After accepting flags, you have an option to flag for any unpreserved VOCs or Encore samples. You can select the samples, and enter the appropriate holding time limits. Clicking on DV Worksheet will take you to Holding Time, with the samples that exceeding holding times already listed.
Field Duplicates – Same as Laboratory Duplicate RPD except for field duplicate samples.
Reporting Limits - Under construction!
Confirmation RPD – Same as Laboratory Duplicate RPD except for confirmation samples.
Internal Standard - To flag for Internal Standards, choose the Lab Sample ID to be flagged, the IS that you are flagging for, and select an appropriate validation reason and choose M or P (Matrix or Process). The affected analytes will be listed below with the associated validation flag. Once you check all the flags and make any adjustments necessary, you can Accept Flags. Clicking on DV Worksheet will take you to Internal Standards, with the internal standards that are out of control already listed.
Miscellaneous Flags - Miscellaneous flags allows you to flag any records for any reason. First, choose the samples you want to flag,
PDX/100320028.PDF
GALENA DBMS – DATA VALIDATION Galena-SOP-402
VDMS VALIDATION
C:\ALTHEN\PROJECTS_F-G\GALENA_AFCEE\APPENDIXES\APPJ_ARCHIVE\ATTACHMENTS\GALNA-SOP-402-VDMS VALIDATION_BAM.DOC
NER/CIS
7 OF 10 ISSUE DATE: 1/30/2010
REVISON 4.0
then select the analytes in those samples that will be flagged. Enter the new validation flags, select a reason and comment, and fill in all appropriate fields. Review Flags, make any changes necessary, and Append Flags.
During each step in the process, you can select View Database, Help, and DV Worksheet. View Database will allow you direct access to the database were you can create your own queries or modify the data. Help allows you to access help for that specific process step. DV Worksheet is the text for the validation report and, during each process step, it will open the text for that specific step and will automatically populate; however, you can modify the text by selecting Append, Replace, or simply typing in your own comments. Below the text box for your DV Worksheet is a list of comments from previous SDGs for the same method. The Append allows you to append the text from those listed comments into your current worksheet and Replace allows you to replace the entire comment in your current worksheet with the one in the selected text box.
Once all the validation steps have been reviewed, you now continue through the Process Flags section.
In-Process Review – This view allows you to see all the flags that were applied during validation. This allows a rapid QC evaluation of the flagging. Should you see any incorrect flags, proceed to the Change In-process Flags. Otherwise, select Rank & Populate Final Flag.
Change In-process Flags – This view allows you to see all the flags that were applied during validation and allows you to change or delete them.
Rank & Populate Final Flag –All the flags applied to each analyte is ranked by severity. This button chooses the most sever flag and applies it to the edata as the final flag.
Review Queries – This must be reviewed before accepting final flags. This view runs queries on the validated data and again allows a rapid QC evaluation of the flagging. The first query listed is shows the concentration qualifier, the laboratory flag, and the final flag. The flagging should be consistent and logical. The next query shows the analyte count per sample. Again, these should be consistent and any outliers usually means something was missed during validation. The next query allows you to check validation flags applied for each reason. Again, these should be consistent and logical. The next query shows the sample counts for each analytes according to the Field Database database, the edata (analytical database), and the sum of
PDX/100320028.PDF
GALENA DBMS – DATA VALIDATION Galena-SOP-402
VDMS VALIDATION
C:\ALTHEN\PROJECTS_F-G\GALENA_AFCEE\APPENDIXES\APPJ_ARCHIVE\ATTACHMENTS\GALNA-SOP-402-VDMS VALIDATION_BAM.DOC
NER/CIS
8 OF 10 ISSUE DATE: 1/30/2010
REVISON 4.0
detects and non-detected results. All counts should match and be logical. The last query lists all the analytes for each sample, their original and final flagging. This should just be reviewed and compared to the previous query for consistency and accuracy.
Review Reports – This must be reviewed before accepting final flags. Before opening this step, the DV Worksheet should be opened from the Validate Data process page. The worksheet should be reviewed and any empty field should be filled in with appropriate comments such as not applicable. Once the DV Worksheet has been final reviewed, then open the Review Reports to see the final DV Report. This should be reviewed as well and printed. The printed reports should be attached to the front of the hard copy SDG.
Lab Issues – This must be reviewed before accepting final flags. This shows a Lab Issues report which is based off the Package Completeness field in the DV Worksheet. If any problems with the hard copy data package were found, comments should be entered into this field and this report printed and sent to the laboratory for them to fix the hard copy SDG. If there are no problems the data package, then this report is not printed.
Remove In Process Flags – If a major issue arises while validating the data and you need to stop validation until the laboratory modifies data, then you can remove all the flagging from the data until the appendices from the laboratory are received.
Capture Partial Validation – If a reason arises where you cannot finish validating a method and you need to stop validation but do not want to loose what you have done so far, then you can capture the flags you have applied thus far.
Accept All Flags – If you are done with validation and all reviews are complete and acceptable, then you can accept all the flags applied. The program will look for the Status Report database to enter the validation date if this is the last method for that SDG. It will ask you if this was a continuous process. Select “yes” if you worked on the data from beginning to end (no large breaks) and “no” if you were interrupted by something else for a long time. You will automatically exit the validation process page back to the main Validate Data menu.
What Do These Really Do? – Explains the function of each button in the process flag section.
View tblAnalyticalData – Allows you to view the edata for the selected SDG and method.
PDX/100320028.PDF
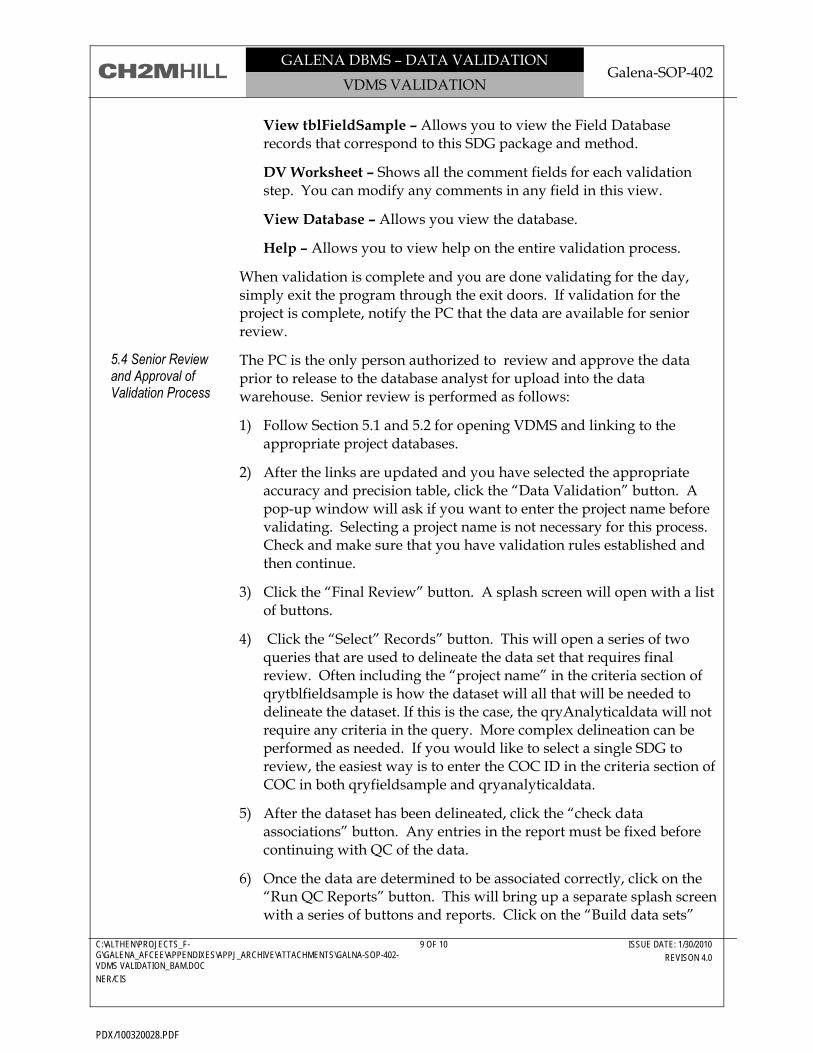
GALENA DBMS – DATA VALIDATION Galena-SOP-402
VDMS VALIDATION
C:\ALTHEN\PROJECTS_F-G\GALENA_AFCEE\APPENDIXES\APPJ_ARCHIVE\ATTACHMENTS\GALNA-SOP-402-VDMS VALIDATION_BAM.DOC
NER/CIS
9 OF 10 ISSUE DATE: 1/30/2010
REVISON 4.0
View tblFieldSample – Allows you to view the Field Database records that correspond to this SDG package and method.
DV Worksheet – Shows all the comment fields for each validation step. You can modify any comments in any field in this view.
View Database – Allows you view the database.
Help – Allows you to view help on the entire validation process.
When validation is complete and you are done validating for the day, simply exit the program through the exit doors. If validation for the project is complete, notify the PC that the data are available for senior review.
The PC is the only person authorized to review and approve the data prior to release to the database analyst for upload into the data warehouse. Senior review is performed as follows:
1) Follow Section 5.1 and 5.2 for opening VDMS and linking to the appropriate project databases.
2) After the links are updated and you have selected the appropriate accuracy and precision table, click the “Data Validation” button. A pop-up window will ask if you want to enter the project name before validating. Selecting a project name is not necessary for this process. Check and make sure that you have validation rules established and then continue.
3) Click the “Final Review” button. A splash screen will open with a list of buttons.
4) Click the “Select” Records” button. This will open a series of two queries that are used to delineate the data set that requires final review. Often including the “project name” in the criteria section of qrytblfieldsample is how the dataset will all that will be needed to delineate the dataset. If this is the case, the qryAnalyticaldata will not require any criteria in the query. More complex delineation can be performed as needed. If you would like to select a single SDG to review, the easiest way is to enter the COC ID in the criteria section of COC in both qryfieldsample and qryanalyticaldata.
5) After the dataset has been delineated, click the “check data associations” button. Any entries in the report must be fixed before continuing with QC of the data.
6) Once the data are determined to be associated correctly, click on the “Run QC Reports” button. This will bring up a separate splash screen with a series of buttons and reports. Click on the “Build data sets”
5.4 Senior Review and Approval of Validation Process
PDX/100320028.PDF
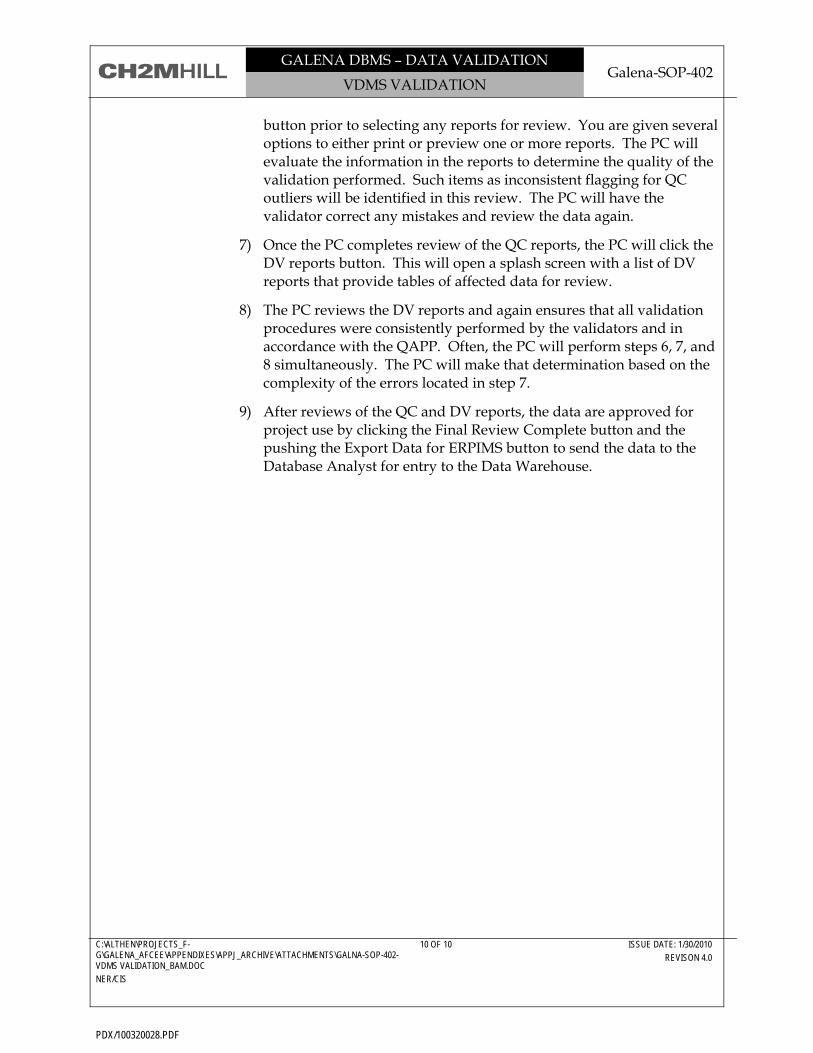
GALENA DBMS – DATA VALIDATION Galena-SOP-402
VDMS VALIDATION
C:\ALTHEN\PROJECTS_F-G\GALENA_AFCEE\APPENDIXES\APPJ_ARCHIVE\ATTACHMENTS\GALNA-SOP-402-VDMS VALIDATION_BAM.DOC
NER/CIS
10 OF 10 ISSUE DATE: 1/30/2010
REVISON 4.0
button prior to selecting any reports for review. You are given several options to either print or preview one or more reports. The PC will evaluate the information in the reports to determine the quality of the validation performed. Such items as inconsistent flagging for QC outliers will be identified in this review. The PC will have the validator correct any mistakes and review the data again.
7) Once the PC completes review of the QC reports, the PC will click the DV reports button. This will open a splash screen with a list of DV reports that provide tables of affected data for review.
8) The PC reviews the DV reports and again ensures that all validation procedures were consistently performed by the validators and in accordance with the QAPP. Often, the PC will perform steps 6, 7, and 8 simultaneously. The PC will make that determination based on the complexity of the errors located in step 7.
9) After reviews of the QC and DV reports, the data are approved for project use by clicking the Final Review Complete button and the pushing the Export Data for ERPIMS button to send the data to the Database Analyst for entry to the Data Warehouse.
PDX/100320028.PDF
GALENA DBMS – DATA MANAGEMENT Galena-SOP-500
CH-ERPTOOL
C:\ALTHEN\PROJECTS_F-G\GALENA_AFCEE\APPENDIXES\APPJ_ARCHIVE\ATTACHMENTS\GALNA-SOP-500-CH-ERPTOOL_BAM.DOC
NER/CIS
1 OF 4 ISSUE DATE: 1/30/2010
REVISON 2.0
This standard operating procedure (SOP) establishes responsibilities, requirements, and instructions for CHERPTool V6.1 for the Galena Database Management System.
This SOP provides information on the operation of CHERPTool V6.1 program for reformatting the edata into an ERPIMS format for the data warehouse.
AFCEE ERPIMS ’98 Data Loading Handbook, Version 4.0, October 1997. This handbook describes each table that can be submitted to ERPIMS and the formatting of each field in these tables.
CHERPTool CH2M HILL ERPIMS Tool
CHIMPTool CH2M HILL Importing Tool
edata electronic data
ERPIMS Environmental Restoration Program Information Management System
VVL valid value list
Personnel shall conduct data management activities in a fashion to maintain the highest standards of quality to ensure the integrity and defensibility of project data, consistent with project requirements. The following individuals are identified as having responsibilities associated with this procedure.
Data Management/Chemistry Lead receives the final reviewed validated data and reformats it for direct input into the data warehouse or assigns the proper staff. Responsibilities include accuracy of the reformatted data and maintenance of the valid value lookup tables.
Vito D’Aurora/RDD is the contact for program issues. Responsibilities include providing technical and operational support for the program.
Procedures for CHERPTOOL V6.1 are as follows.
This tool is a work in progress; as you find bugs or situations in which the tool doesn’t behave properly, please report them to [email protected]. The tool is not intended to fully automate submittals, but it should make the process of preparing error-free files much easier. This tool is designed to create data warehouse, ERPIMS, GeoTracker, and COELT files.
For the data warehouse, the data is reformatted into ERPIMS and will use all the VVL codes and lookup tables for ERPIMS data. Each table that can be imported into the warehouse is marked in the table with the extension *_EXPORT.
2 References
3 Definitions
4 Responsibilities
1 Purpose and Description
5.1 Introduction
5 Procedure
PDX/100320028.PDF
GALENA DBMS – DATA MANAGEMENT Galena-SOP-500
CH-ERPTOOL
C:\ALTHEN\PROJECTS_F-G\GALENA_AFCEE\APPENDIXES\APPJ_ARCHIVE\ATTACHMENTS\GALNA-SOP-500-CH-ERPTOOL_BAM.DOC
NER/CIS
2 OF 4 ISSUE DATE: 1/30/2010
REVISON 2.0
ACCESS 2003 is required to run the program. The requirements vary by reformatting type. In general, the tables tblAnalyticalData and tblFieldSample for the specific data set are required. The tables tblValidationFlags and tblValReasons are also required but do not need to be minimized to only the specific data set.
When you look at the database, you will see several tables marked VVL_* or tklp*. The valid value (VVL_*) tables contain valid value lists for the mentioned field (i.e. VVL_ERPIMS_ANMCODE is the list of valid value codes for ERPIMS data for the analysis method). The VVLs are updated quarterly and can be pulled down from AFCEE’s Web site (www.afcee.brooks.af.mil/ms/irp_vvl.asp) and imported into the CHERPTOOL. The old records should be deleted out of the existing tables and the new data appended to these tables. The lookup tables (tklp*) contain lookups for specific fields. These are generally modified by the project and any modifications should be sent to Michele Spence/RDD to be added to the master program.
Make a new copy of the tool for each submittal. As you work through each step make sure you keep track of any modification or changes you made to the data in the frmProject_Notes form. Import the required tables and append the data into the existing tables so queries and macros will continue to work.
The analytical data if reformatted through various queries and macros. From the Main Menu, select Run Initial QC Check to do a preliminary data evaluation. The program will run through several initial checks on required fields, valid codes, and required links. Any issues will show in a pop-up window. Minimize the pop-ups and fix each one of the issues to the data directly. When all have been resolved, select the Run Initial QC Check again until a No Errors message appears.
Next select ERPIMS because the data for the warehouse must be reformatted into ERPIMS tables. Process Data to finish the reformatting of the analytical data. From the ERPIMS window, you are allowed to select specific functions to run automatically. Usually, all are selected except the Update MDL and RL function and the Convert Metals to ug/L, both of which are required for only specific projects. Select Continue and the tblconvertMatrix table will pop-up for review on how the matrix will be coded. These are set to ERPIMS requirements and should not be changed unless specified by the client.
When Ok to Continue, the AFID form will pop-up. This form allows you to input the Air Force Identification (AFID) and the logging company code (LOGCODE). The AFID only needs to match the AFCEE VVL code if this were a real AFCEE project. However, because the data for Galena only needs to go into the data warehouse, the correct AFID would be
5.2 Requirements
5.3 Analytical Data Reformatting
PDX/100320028.PDF
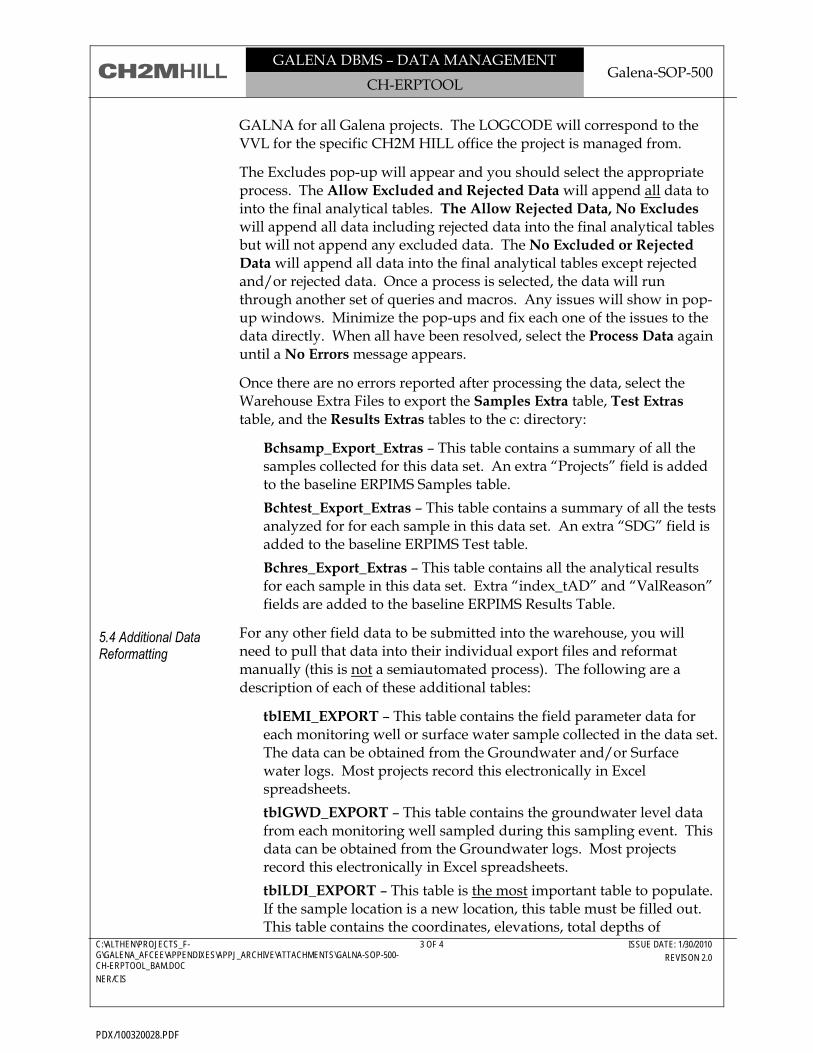
GALENA DBMS – DATA MANAGEMENT Galena-SOP-500
CH-ERPTOOL
C:\ALTHEN\PROJECTS_F-G\GALENA_AFCEE\APPENDIXES\APPJ_ARCHIVE\ATTACHMENTS\GALNA-SOP-500-CH-ERPTOOL_BAM.DOC
NER/CIS
3 OF 4 ISSUE DATE: 1/30/2010
REVISON 2.0
GALNA for all Galena projects. The LOGCODE will correspond to the VVL for the specific CH2M HILL office the project is managed from.
The Excludes pop-up will appear and you should select the appropriate process. The Allow Excluded and Rejected Data will append all data to into the final analytical tables. The Allow Rejected Data, No Excludes will append all data including rejected data into the final analytical tables but will not append any excluded data. The No Excluded or Rejected Data will append all data into the final analytical tables except rejected and/or rejected data. Once a process is selected, the data will run through another set of queries and macros. Any issues will show in pop-up windows. Minimize the pop-ups and fix each one of the issues to the data directly. When all have been resolved, select the Process Data again until a No Errors message appears.
Once there are no errors reported after processing the data, select the Warehouse Extra Files to export the Samples Extra table, Test Extras table, and the Results Extras tables to the c: directory:
Bchsamp_Export_Extras – This table contains a summary of all the samples collected for this data set. An extra “Projects” field is added to the baseline ERPIMS Samples table. Bchtest_Export_Extras – This table contains a summary of all the tests analyzed for for each sample in this data set. An extra “SDG” field is added to the baseline ERPIMS Test table. Bchres_Export_Extras – This table contains all the analytical results for each sample in this data set. Extra “index_tAD” and “ValReason” fields are added to the baseline ERPIMS Results Table.
For any other field data to be submitted into the warehouse, you will need to pull that data into their individual export files and reformat manually (this is not a semiautomated process). The following are a description of each of these additional tables:
tblEMI_EXPORT – This table contains the field parameter data for each monitoring well or surface water sample collected in the data set. The data can be obtained from the Groundwater and/or Surface water logs. Most projects record this electronically in Excel spreadsheets. tblGWD_EXPORT – This table contains the groundwater level data from each monitoring well sampled during this sampling event. This data can be obtained from the Groundwater logs. Most projects record this electronically in Excel spreadsheets. tblLDI_EXPORT – This table is the most important table to populate. If the sample location is a new location, this table must be filled out. This table contains the coordinates, elevations, total depths of
5.4 Additional Data Reformatting
PDX/100320028.PDF
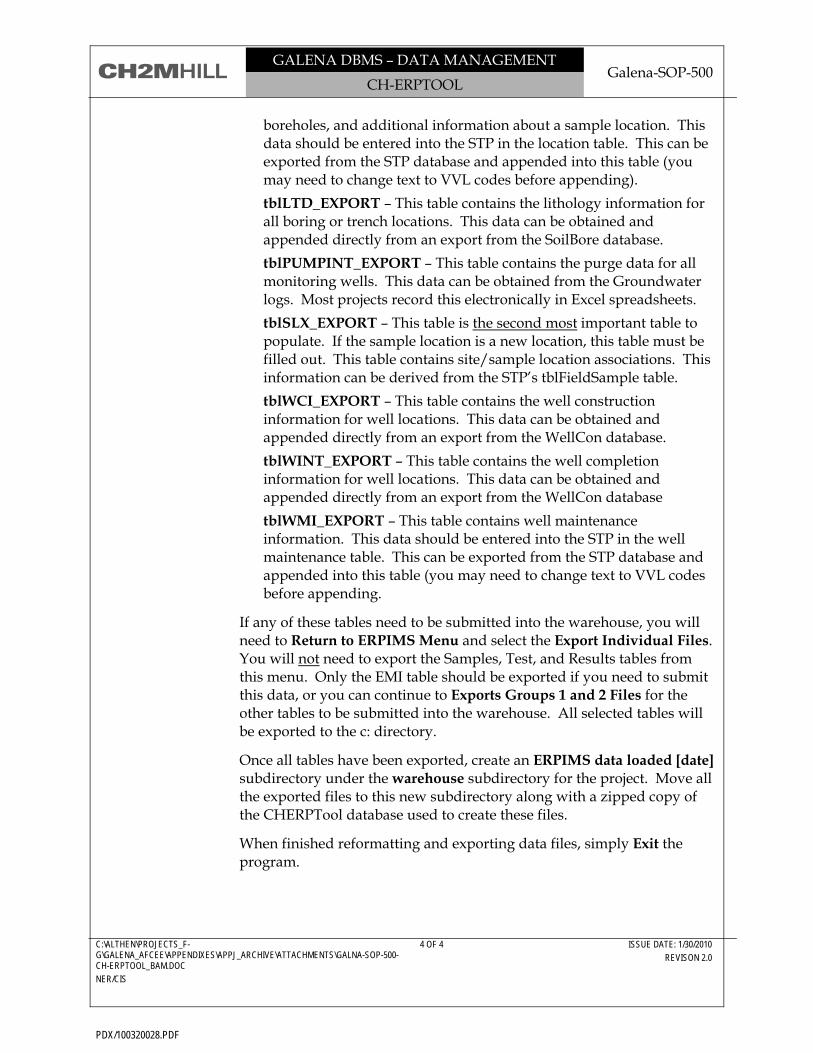
GALENA DBMS – DATA MANAGEMENT Galena-SOP-500
CH-ERPTOOL
C:\ALTHEN\PROJECTS_F-G\GALENA_AFCEE\APPENDIXES\APPJ_ARCHIVE\ATTACHMENTS\GALNA-SOP-500-CH-ERPTOOL_BAM.DOC
NER/CIS
4 OF 4 ISSUE DATE: 1/30/2010
REVISON 2.0
boreholes, and additional information about a sample location. This data should be entered into the STP in the location table. This can be exported from the STP database and appended into this table (you may need to change text to VVL codes before appending). tblLTD_EXPORT – This table contains the lithology information for all boring or trench locations. This data can be obtained and appended directly from an export from the SoilBore database. tblPUMPINT_EXPORT – This table contains the purge data for all monitoring wells. This data can be obtained from the Groundwater logs. Most projects record this electronically in Excel spreadsheets. tblSLX_EXPORT – This table is the second most important table to populate. If the sample location is a new location, this table must be filled out. This table contains site/sample location associations. This information can be derived from the STP’s tblFieldSample table. tblWCI_EXPORT – This table contains the well construction information for well locations. This data can be obtained and appended directly from an export from the WellCon database. tblWINT_EXPORT – This table contains the well completion information for well locations. This data can be obtained and appended directly from an export from the WellCon database tblWMI_EXPORT – This table contains well maintenance information. This data should be entered into the STP in the well maintenance table. This can be exported from the STP database and appended into this table (you may need to change text to VVL codes before appending.
If any of these tables need to be submitted into the warehouse, you will need to Return to ERPIMS Menu and select the Export Individual Files. You will not need to export the Samples, Test, and Results tables from this menu. Only the EMI table should be exported if you need to submit this data, or you can continue to Exports Groups 1 and 2 Files for the other tables to be submitted into the warehouse. All selected tables will be exported to the c: directory.
Once all tables have been exported, create an ERPIMS data loaded [date] subdirectory under the warehouse subdirectory for the project. Move all the exported files to this new subdirectory along with a zipped copy of the CHERPTool database used to create these files.
When finished reformatting and exporting data files, simply Exit the program.
PDX/100320028.PDF
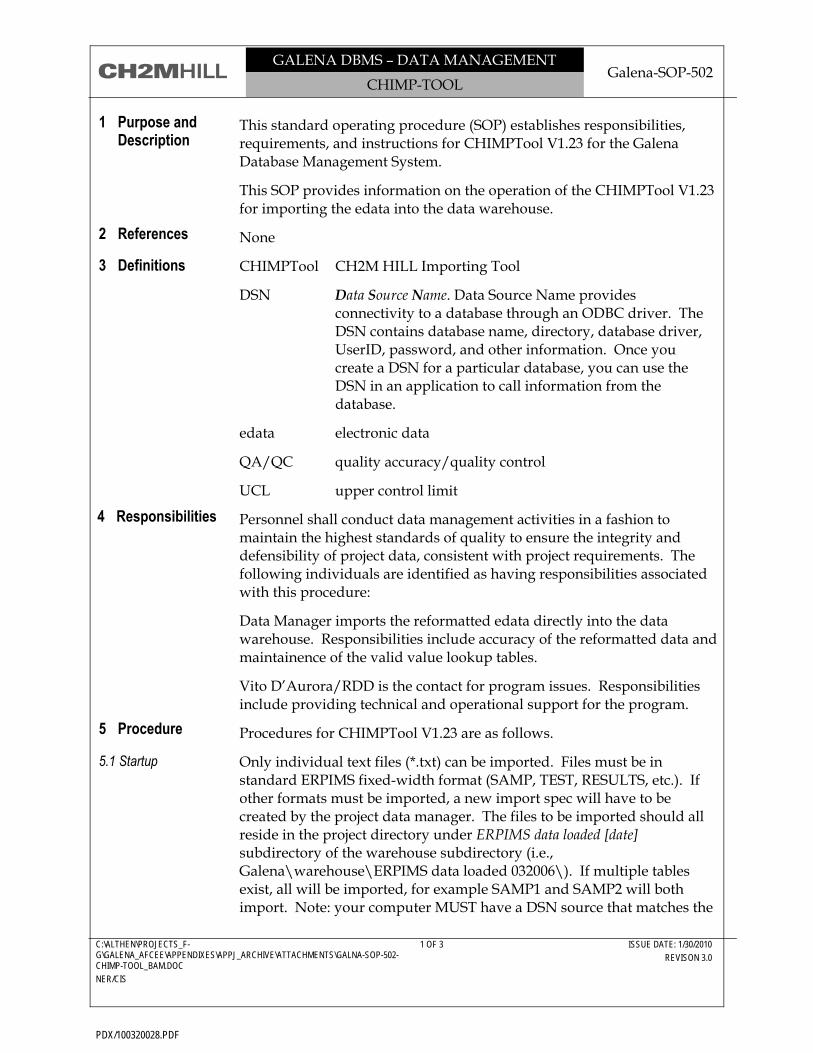
GALENA DBMS – DATA MANAGEMENT Galena-SOP-502
CHIMP-TOOL
C:\ALTHEN\PROJECTS_F-G\GALENA_AFCEE\APPENDIXES\APPJ_ARCHIVE\ATTACHMENTS\GALNA-SOP-502-CHIMP-TOOL_BAM.DOC
NER/CIS
1 OF 3 ISSUE DATE: 1/30/2010
REVISON 3.0
This standard operating procedure (SOP) establishes responsibilities, requirements, and instructions for CHIMPTool V1.23 for the Galena Database Management System.
This SOP provides information on the operation of the CHIMPTool V1.23 for importing the edata into the data warehouse.
None
CHIMPTool CH2M HILL Importing Tool
DSN Data Source Name. Data Source Name provides connectivity to a database through an ODBC driver. The DSN contains database name, directory, database driver, UserID, password, and other information. Once you create a DSN for a particular database, you can use the DSN in an application to call information from the database.
edata electronic data
QA/QC quality accuracy/quality control
UCL upper control limit
Personnel shall conduct data management activities in a fashion to maintain the highest standards of quality to ensure the integrity and defensibility of project data, consistent with project requirements. The following individuals are identified as having responsibilities associated with this procedure:
Data Manager imports the reformatted edata directly into the data warehouse. Responsibilities include accuracy of the reformatted data and maintainence of the valid value lookup tables.
Vito D’Aurora/RDD is the contact for program issues. Responsibilities include providing technical and operational support for the program.
Procedures for CHIMPTool V1.23 are as follows.
Only individual text files (*.txt) can be imported. Files must be in standard ERPIMS fixed-width format (SAMP, TEST, RESULTS, etc.). If other formats must be imported, a new import spec will have to be created by the project data manager. The files to be imported should all reside in the project directory under ERPIMS data loaded [date] subdirectory of the warehouse subdirectory (i.e., Galena\warehouse\ERPIMS data loaded 032006\). If multiple tables exist, all will be imported, for example SAMP1 and SAMP2 will both import. Note: your computer MUST have a DSN source that matches the
2 References
3 Definitions
4 Responsibilities
1 Purpose and Description
5.1 Startup
5 Procedure
PDX/100320028.PDF
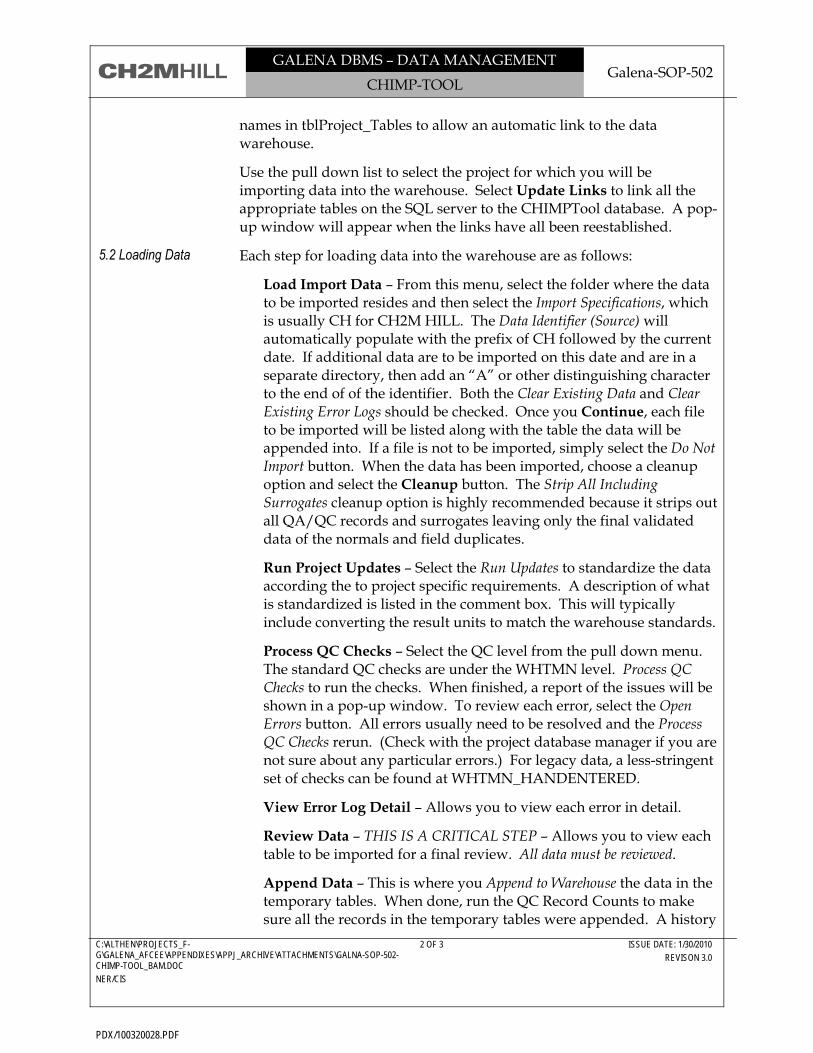
GALENA DBMS – DATA MANAGEMENT Galena-SOP-502
CHIMP-TOOL
C:\ALTHEN\PROJECTS_F-G\GALENA_AFCEE\APPENDIXES\APPJ_ARCHIVE\ATTACHMENTS\GALNA-SOP-502-CHIMP-TOOL_BAM.DOC
NER/CIS
2 OF 3 ISSUE DATE: 1/30/2010
REVISON 3.0
names in tblProject_Tables to allow an automatic link to the data warehouse.
Use the pull down list to select the project for which you will be importing data into the warehouse. Select Update Links to link all the appropriate tables on the SQL server to the CHIMPTool database. A pop-up window will appear when the links have all been reestablished.
Each step for loading data into the warehouse are as follows:
Load Import Data – From this menu, select the folder where the data to be imported resides and then select the Import Specifications, which is usually CH for CH2M HILL. The Data Identifier (Source) will automatically populate with the prefix of CH followed by the current date. If additional data are to be imported on this date and are in a separate directory, then add an “A” or other distinguishing character to the end of of the identifier. Both the Clear Existing Data and Clear Existing Error Logs should be checked. Once you Continue, each file to be imported will be listed along with the table the data will be appended into. If a file is not to be imported, simply select the Do Not Import button. When the data has been imported, choose a cleanup option and select the Cleanup button. The Strip All Including Surrogates cleanup option is highly recommended because it strips out all QA/QC records and surrogates leaving only the final validated data of the normals and field duplicates.
Run Project Updates – Select the Run Updates to standardize the data according the to project specific requirements. A description of what is standardized is listed in the comment box. This will typically include converting the result units to match the warehouse standards.
Process QC Checks – Select the QC level from the pull down menu. The standard QC checks are under the WHTMN level. Process QC Checks to run the checks. When finished, a report of the issues will be shown in a pop-up window. To review each error, select the Open Errors button. All errors usually need to be resolved and the Process QC Checks rerun. (Check with the project database manager if you are not sure about any particular errors.) For legacy data, a less-stringent set of checks can be found at WHTMN_HANDENTERED.
View Error Log Detail – Allows you to view each error in detail.
Review Data – THIS IS A CRITICAL STEP – Allows you to view each table to be imported for a final review. All data must be reviewed.
Append Data – This is where you Append to Warehouse the data in the temporary tables. When done, run the QC Record Counts to make sure all the records in the temporary tables were appended. A history
5.2 Loading Data
PDX/100320028.PDF
GALENA DBMS – DATA MANAGEMENT Galena-SOP-502
CHIMP-TOOL
C:\ALTHEN\PROJECTS_F-G\GALENA_AFCEE\APPENDIXES\APPJ_ARCHIVE\ATTACHMENTS\GALNA-SOP-502-CHIMP-TOOL_BAM.DOC
NER/CIS
3 OF 3 ISSUE DATE: 1/30/2010
REVISON 3.0
table will pop-up so you can enter comments about the importing process and data source. At a minimum, the subdirectory that the data was imported from should be entered.
Reduce Data – This process is the last step in the warehousing process. Note this process can take up to 10 minutes to complete. The data for the project is reviewed and a “best result” is flagged to resolve multiple results (typically selecting the maximum detect or minimum nondetect).
Generate 95% UCL – Optional - This is calculates the 95% UCL statistics if required by the project.
Admin – This is to be used only by the database management team in RDD for designing and maintaining the CHIMPTool program.
Help – Gives minimal detail on how to operate the CHIMPTool program.
When finished importing data into the warehouse, simply exit the program through the exit door.
PDX/100320028.PDF
GALENA DBMS – DATA MANAGEMENT GALENA-SOP-503
MANAGING HISTORICAL/LEGACY DATA
C:\ALTHEN\PROJECTS_F-G\GALENA_AFCEE\APPENDIXES\APPJ_ARCHIVE\ATTACHMENTS\GALNA-SOP-503-MANAGING HISTORIC DATA_BAM.DOC
NER/CIS
1 OF 12 ISSUE DATE: MARCH 10, 2006
REVISON 2.0
This standard operating procedure (SOP) establishes responsibilities, requirements, and instructions for managing legacy data for the Galena Database Management System.
This SOP provides information on compiling, evaluating, and loading legacy data into a data warehouse.
U.S. Environmental Protection Agency (USEPA) Guidance for Quality Assurance Project Plans (EPA QA/G-5), December 2002. Chapter 3 of this document contains a summary of pertinent issues to consider when using existing data.
Personnel shall conduct data management activities in a fashion to maintain the highest standards of quality to ensure the integrity and defensibility of project data, consistent with project requirements. The following individuals are identified as having responsibilities associated with this procedure:
Project Manager (PM) has overall responsibility for the process. The Program Data Management and Visualization Lead (DM/DV) and Program Database Management Lead (DML) will work with the PM to establish the data review and import process. The DML will work with the PM to compile a comprehensive data inventory and with staff to facilitate data review.
The DML will work with the Database Manager (DM) to determine the appropriate intermediary files and tools used to collect the data. The DML will work with the Project Chemist (PC), who will oversee the data review and flagging process and approve the data for upload into the data warehouse. The DM is responsible for assembling the field and laboratory data in formats that facilitate data review, aid the DML in overseeing the data review and flagging process and schedule, converting the data to the proper data warehouse format, and then loading the data into the warehouse after approval by the DML.
The GIS Analyst (GA), Field Sample Coordinator (FSC), PC, and Risk Assessor/Data Evaluator (RA) have the primary responsibility for performing review of the data in the area of expertise and providing the DM with data usability flags to be associated with each record.
An overview of the various responsibilities in the legacy data is included as Attachment 1.
Procedures for managing legacy data are as follows:
Legacy data refers to data that are collected from any contractor other than CH2M HILL and/or data collected by CH2M HILL that have not been managed in accordance with current Galena requirements. Legacy
2 References
3 Responsibilities
1 Purpose and Description
4.1 Overview of Legacy data Evaluation Process
4 Procedure
PDX/100320028.PDF
GALENA DBMS – DATA MANAGEMENT GALENA-SOP-503
MANAGING HISTORICAL/LEGACY DATA
C:\ALTHEN\PROJECTS_F-G\GALENA_AFCEE\APPENDIXES\APPJ_ARCHIVE\ATTACHMENTS\GALNA-SOP-503-MANAGING HISTORIC DATA_BAM.DOC
NER/CIS
2 OF 12 ISSUE DATE: MARCH 10, 2006
REVISON 2.0
data is commonly compiled from various electronic and hard copy sources including spreadsheets, databases, technical reports, and laboratory hard copy data reports. When working with legacy data, an assessment of the usability of that data must be completed for the project team to be able to use the data with confidence. In order to properly assess the data, the legacy data needs to be evaluated by skilled professionals that are familiar with the type of data being evaluated so that any errors identified in the data can be corrected when possible or qualified in a manner to reflect the limitations of the data’s use. A flowchart providing an overview of the process is included as Attachment 2.
The basis for this SOP regarding the evaluation of legacy data comes from Chapter 3 of the Guidance for the Development of Quality Assurance Project Plans (USEPA 2002), which essentially outlines the guidelines for a three step process:
• Identify existing data sources • Determine data needs • Evaluate existing data relative to the project’s data quality
specifications
Inventory of the data sources is the first step in the process. The PM or designee needs to identify all of the record sources that are available. This step is crucial because without a detailed inventory of available data, it will be impossible to assess if data needs can be fulfilled. When creating the data inventory, the person compiling the information must take care to annotate what type of sources the data are from. There are essentially two format sources of legacy data – hard copy or an electronic deliverable/ project database. Each of the sources has multiple sub categories.
Category 1 Hard Copy
A. Field Data (1) Complete hard copy records (Data Usability Flag of 1)
(2) Incomplete hard copy records – missing information such as units for field measurements or complete location identification (Data Usability Flag of 2 or 3)
B. Laboratory Data (1) Laboratory reports without quality control information (Data Usability Flag will depend on use of data) (2) Laboratory reports with limited quality control information, such as surrogates, laboratory spike information (Data Usability Flag will depend on use of data) (3) Laboratory reports with comprehensive quality control information (Data Usability Flag of 1)
4.1.1 Identifying Legacy Data Sources
PDX/100320028.PDF
GALENA DBMS – DATA MANAGEMENT GALENA-SOP-503
MANAGING HISTORICAL/LEGACY DATA
C:\ALTHEN\PROJECTS_F-G\GALENA_AFCEE\APPENDIXES\APPJ_ARCHIVE\ATTACHMENTS\GALNA-SOP-503-MANAGING HISTORIC DATA_BAM.DOC
NER/CIS
3 OF 12 ISSUE DATE: MARCH 10, 2006
REVISON 2.0
(4) Tabulated data validation unknown (Data Usability Flag will depend on use of data) (5) Tabulated data validation known (Data Usability Flag will depend upon validation qualifier applied to data)
Category 2 Electronic Data
A. Field Data (1) Complete data in project database/spreadsheets (Data Usability Flag of 1) (2) Incomplete data in project database/spreadsheets – missing information such as units for field measurements or complete location identification (Data Usability Flag of 2 or 3)
B. Laboratory Data (1) Spreadsheet/Project Database - results only - no analysis/collection dates, etc. (Data Usability Flag will depend on use of data) (2) Spreadsheet/Project Database – results with supporting data such as MDL, RL, collection, analysis dates, but without quality control information (Data Usability Flag will depend on use of data) (3) Spreadsheet/Project Database – items in bullet 2 above and quality control information (Data Usability Flag will depend on use of data and/or quality of data)
While preparing the data inventory, the person compiling the data sources can also assign one of three preliminary data use categories:
1. Sufficient documentation to demonstrate that the data meet the end use objectives and may be used with confidence.
2. Incomplete documentation available, but the data may be used to support some project objectives as long as the limitations of the data are considered.
3. Insufficient documentation to demonstrate that the data meet the end use objectives. The data should not be relied upon to support critical project decisions.
Included in Attachment 3 is an inventory checklist to compile and apply preliminary data usability flags for each record source.
Once the data inventory and application of preliminary data usability flags are complete, then it is appropriate to discuss what project data needs may be fulfilled with the legacy data that are available. The PM will define what uses that the legacy data are going to be used to fulfill, such as risk assessment or plume modeling. The intended use of the data is critical in determining the manner in which legacy data will be handled and warehoused by the DM. The evaluators must also consider the intended use of the data when applying data usability qualifiers and how
4.2 Determining Data Needs
4.1.2 Assigning Preliminary Data Usability Flags
PDX/100320028.PDF
GALENA DBMS – DATA MANAGEMENT GALENA-SOP-503
MANAGING HISTORICAL/LEGACY DATA
C:\ALTHEN\PROJECTS_F-G\GALENA_AFCEE\APPENDIXES\APPJ_ARCHIVE\ATTACHMENTS\GALNA-SOP-503-MANAGING HISTORIC DATA_BAM.DOC
NER/CIS
4 OF 12 ISSUE DATE: MARCH 10, 2006
REVISON 2.0
those data usability qualifiers are used in the data warehouse. Ideally, data usability flags will be applied directly to the legacy data or an intermediate format, such as an Excel spreadsheet prior to loading into the data warehouse by the DM.
In almost all cases, the ideal approach will be to combine the legacy data with existing CH2M HILL data in a shared data warehouse. The use of a data warehouse requires (and ensures) consistent data from all data sources in critical fields such as units, analyte names, CAS numbers, location names, site names, and validation flags.
There are three basic steps that are involved in data evaluation and are followed regardless of the data warehouse used to store the project data and are composed of the following tasks: 1. Data Compilation 2. Data Evaluation 3. Data Upload
The first step in using legacy data is to compile similar types of data together (most often in a flat file format) so they can be handled as one data set. Usually (depending on the data format and structure), the data from hard copy, word documents, and spreadsheets is compiled into a spreadsheet as a first step. Included in Attachment 4 is an example spreadsheet used to compile laboratory data. Attachment 5 details common issues that arise when compiling laboratory data. Care must be taken to identify each data source, and (if possible) retain any index numbers found in the original data to allow going back to the data source if necessary. Original data sources should be stored in a clearly-identified folder in the project’s directory on the LAN to allow users to reference the original data in the future.
When compiling data from word documents, it is often possible to paste word tables directly into Excel with minimal effort. When working with Excel crosstabs, it is usually possible to write some simple macros and utilize Excel’s copy features to quickly convert the crosstabs to flat file within Excel.
It is most efficient and strongly recommended to use an Excel template which is in a format that allows easy upload into the data warehouse. All meaningful data should be captured in Excel or else stored with the original data source. As an example, the warehouse normally is used to store non-surrogate normal and field duplicate data only and the laboratory or field QC data is left in the original data sources for later use if necessary. Similarly, there may be unusual metadata or laboratory data fields that can either be concatenated into a remarks field in the database or left in the original data sources for later use if necessary.
4.3 Data Evaluation
4.3.1 Data Compilation
PDX/100320028.PDF
GALENA DBMS – DATA MANAGEMENT GALENA-SOP-503
MANAGING HISTORICAL/LEGACY DATA
C:\ALTHEN\PROJECTS_F-G\GALENA_AFCEE\APPENDIXES\APPJ_ARCHIVE\ATTACHMENTS\GALNA-SOP-503-MANAGING HISTORIC DATA_BAM.DOC
NER/CIS
5 OF 12 ISSUE DATE: MARCH 10, 2006
REVISON 2.0
Once the data has been compiled, it must be reviewed. A thorough review at this point will save many hours and lots of frustration later. The first step of this process is to create a data summary memorandum that identifies the data sources and any initial findings about the data that may be apparent to the DML. The memorandum will then be discussed with the PM and the appropriate team members (for example, DM, FSC, PC, GA, RA) for review. Following the guidance for data needs in Section 4.2 and other appropriate documents such as the project QAPP or data quality objectives, each reviewer (including the DM) should identify any problems or questions about missing or insufficient data, and the results of the evaluation should be summarized.
The project team should try to identify problems such as missing or incorrect coordinate data, location names, and site identifiers. The chemist should pay special attention to data flagging, validation status, and inappropriate or missing detection limits.
A series of logical queries should be performed by the DM that are included in Attachment 6.
The PM, DML and DM will work together with other team members as needed to fix any data problems that can be corrected, and to flag specific subsets of the data if some of the data has limitations that must be considered when using the data.
An additional step in the data review process is for the chemist to assign “final flags” for the data, typically a validation flag that summarizes laboratory and validation flags in a final flag that will be most useful for the team (typically J, U, UJ, R).
The last step in the review process is a comparison of the data summary files with the original data sources. A common level of review is 10 percent.
Working with the compiled and reviewed data, the DM’s next step is to load the data into an MS Access database for evaluation. The DM should be sure that the data is consistent with the data in the warehouse. Common items to check are analyte CAS numbers, parlabels, and units consistent with the warehouse (and any screening level units), consistent location and site names, inappropriate field lengths, and correct data types. Another useful check at this point is to be sure the data do not already exist in the data warehouse.
Loading the location, site, well construction, and boring data is relatively straightforward. Some things to remember are that the location data must be loaded first, and all top of casing data (if available) should be loaded into the WMI table (this allows groundwater elevation data to be calculated on the fly from depth to water and top of casing values).
4.3.2 Data Evaluation
4.4 Data Loading
PDX/100320028.PDF
GALENA DBMS – DATA MANAGEMENT GALENA-SOP-503
MANAGING HISTORICAL/LEGACY DATA
C:\ALTHEN\PROJECTS_F-G\GALENA_AFCEE\APPENDIXES\APPJ_ARCHIVE\ATTACHMENTS\GALNA-SOP-503-MANAGING HISTORIC DATA_BAM.DOC
NER/CIS
6 OF 12 ISSUE DATE: MARCH 10, 2006
REVISON 2.0
The most efficient way to format the analytical data for the warehouse is to append the data into a flat file and run a series of SQL scripts that append the data to the SAMPLES, TESTS, and RESULTS tables. The scripts process run numbers and sample numbers, and manage the index fields in the three tables. An alternative approach would require formatting the data to work with the CH-ERPTool to create SAMPLES, TESTS, and RESULTS tables that would run through the CH-IMPTool. The advantage to this approach is complete QC checking, but most legacy data will fail a large number of the checks so in reality this approach is most useful for loading CH2M HILL data into the warehouse.
After the data are loaded in the warehouse, the data should be reduced if that is part of the project process (typically maximum detect and minimum nondetects are selected as best results) by running a SQL script directly on the warehouse or from the CH-IMPTool front end database.
The last step is to review the data in the warehouse to sure that all of the expected data is loaded and no fields are truncated.
PDX/100320028.PDF
GALENA DBMS – DATA MANAGEMENT GALENA-SOP-503
MANAGING HISTORICAL/LEGACY DATA
C:\ALTHEN\PROJECTS_F-G\GALENA_AFCEE\APPENDIXES\APPJ_ARCHIVE\ATTACHMENTS\GALNA-SOP-503-MANAGING HISTORIC DATA_BAM.DOC
NER/CIS
7 OF 12 ISSUE DATE: MARCH 10, 2006
REVISON 2.0
Attachment 1 – Responsibilities
Microsoft Office Excel Worksheet
PDX/100320028.PDF
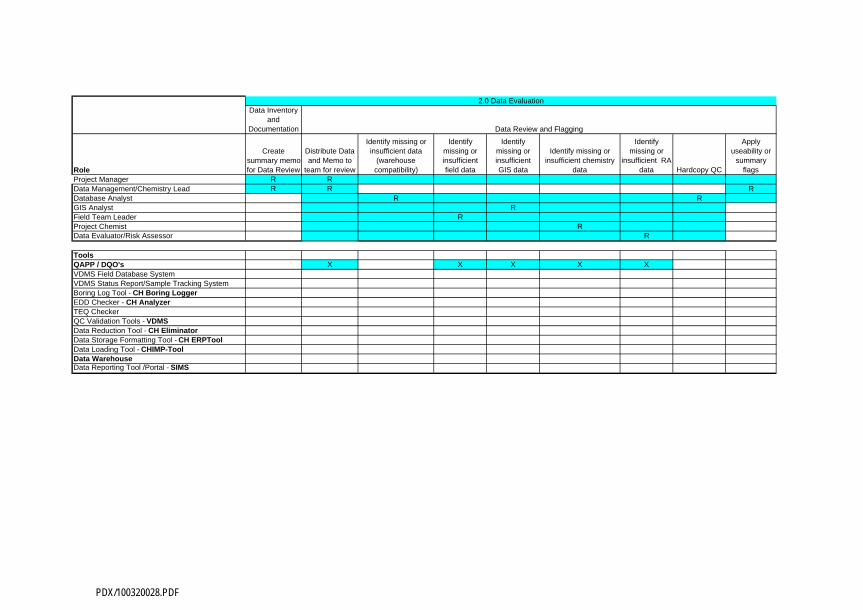
Data Inventory and
Documentation
Role
Create summary memo for Data Review
Distribute Data and Memo to
team for review
Identify missing or insufficient data
(warehouse compatibility)
Identify missing or insufficient field data
Identify missing or insufficient GIS data
Identify missing or insufficient chemistry
data
Identify missing or
insufficient RA data Hardcopy QC
Apply useability or
summary flags
Project Manager R RData Management/Chemistry Lead R R RDatabase Analyst R RGIS Analyst RField Team Leader RProject Chemist RData Evaluator/Risk Assessor R
ToolsQAPP / DQO's X X X X XVDMS Field Database SystemVDMS Status Report/Sample Tracking SystemBoring Log Tool - CH Boring LoggerEDD Checker - CH AnalyzerTEQ CheckerQC Validation Tools - VDMSData Reduction Tool - CH EliminatorData Storage Formatting Tool - CH ERPToolData Loading Tool - CHIMP-ToolData WarehouseData Reporting Tool /Portal - SIMS
Data Review and Flagging
2.0 Data Evaluation
PDX/100320028.PDF
GALENA DBMS – DATA MANAGEMENT GALENA-SOP-503
MANAGING HISTORICAL/LEGACY DATA
C:\ALTHEN\PROJECTS_F-G\GALENA_AFCEE\APPENDIXES\APPJ_ARCHIVE\ATTACHMENTS\GALNA-SOP-503-MANAGING HISTORIC DATA_BAM.DOC
NER/CIS
8 OF 12 ISSUE DATE: MARCH 10, 2006
REVISON 2.0
Attachment 2 Visio of Legacy Process
PDX/100320028.PDF
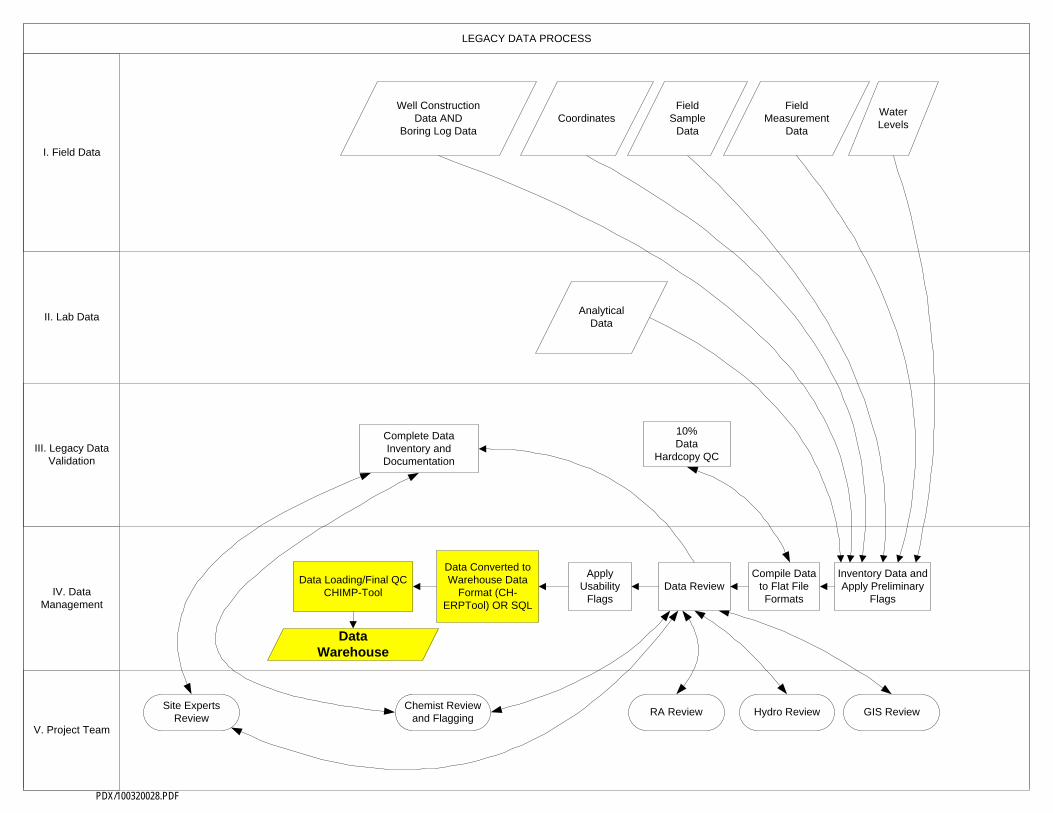
LEGACY DATA PROCESS
Well Construction Data AND
Boring Log DataCoordinates
Field Sample
Data
Field Measurement
Data
Water Levels
10% Data
Hardcopy QC
Data Warehouse
Data Converted to Warehouse Data
Format (CH-ERPTool) OR SQL
GIS ReviewHydro ReviewSite Experts
Review
Data Loading/Final QC CHIMP-Tool
I. Field Data
II. Lab Data
III. Legacy Data Validation
IV. Data Management
V. Project Team
Analytical Data
Inventory Data and Apply Preliminary
Flags
Chemist Review and Flagging
Complete Data Inventory and
Documentation
Apply Usability
Flags
RA Review
Data ReviewCompile Data
to Flat File Formats
PDX/100320028.PDF

GALENA DBMS – DATA MANAGEMENT GALENA-SOP-503
MANAGING HISTORICAL/LEGACY DATA
C:\ALTHEN\PROJECTS_F-G\GALENA_AFCEE\APPENDIXES\APPJ_ARCHIVE\ATTACHMENTS\GALNA-SOP-503-MANAGING HISTORIC DATA_BAM.DOC
NER/CIS
9 OF 12 ISSUE DATE: MARCH 10, 2006
REVISON 2.0
Attachment 3 Data Inventory checklist
DataInventory.xls
PDX/100320028.PDF
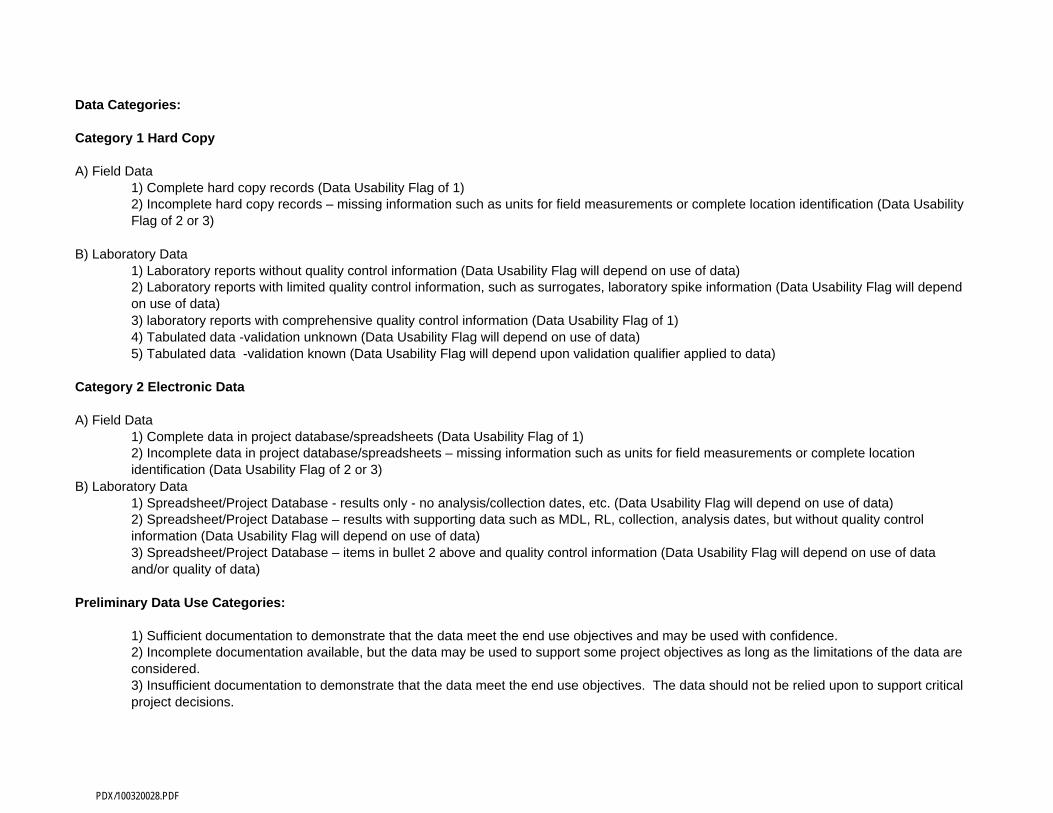
Data Categories:
Category 1 Hard Copy
A) Field Data1) Complete hard copy records (Data Usability Flag of 1)2) Incomplete hard copy records – missing information such as units for field measurements or complete location identification (Data Usability Flag of 2 or 3)
B) Laboratory Data1) Laboratory reports without quality control information (Data Usability Flag will depend on use of data)2) Laboratory reports with limited quality control information, such as surrogates, laboratory spike information (Data Usability Flag will depend on use of data)3) laboratory reports with comprehensive quality control information (Data Usability Flag of 1)4) Tabulated data -validation unknown (Data Usability Flag will depend on use of data)5) Tabulated data -validation known (Data Usability Flag will depend upon validation qualifier applied to data)
Category 2 Electronic Data
A) Field Data1) Complete data in project database/spreadsheets (Data Usability Flag of 1)2) Incomplete data in project database/spreadsheets – missing information such as units for field measurements or complete location identification (Data Usability Flag of 2 or 3)
B) Laboratory Data1) Spreadsheet/Project Database - results only - no analysis/collection dates, etc. (Data Usability Flag will depend on use of data)2) Spreadsheet/Project Database – results with supporting data such as MDL, RL, collection, analysis dates, but without quality control information (Data Usability Flag will depend on use of data)3) Spreadsheet/Project Database – items in bullet 2 above and quality control information (Data Usability Flag will depend on use of data and/or quality of data)
Preliminary Data Use Categories:
1) Sufficient documentation to demonstrate that the data meet the end use objectives and may be used with confidence.2) Incomplete documentation available, but the data may be used to support some project objectives as long as the limitations of the data are considered.3) Insufficient documentation to demonstrate that the data meet the end use objectives. The data should not be relied upon to support critical project decisions.
PDX/100320028.PDF

GALENA DBMS – DATA MANAGEMENT GALENA-SOP-503
MANAGING HISTORICAL/LEGACY DATA
C:\ALTHEN\PROJECTS_F-G\GALENA_AFCEE\APPENDIXES\APPJ_ARCHIVE\ATTACHMENTS\GALNA-SOP-503-MANAGING HISTORIC DATA_BAM.DOC
NER/CIS
10 OF 12 ISSUE DATE: MARCH 10, 2006
REVISON 2.0
Attachment 4 – Template for laboratory hard copy data entry
FlatFileXLS.xls
PDX/100320028.PDF
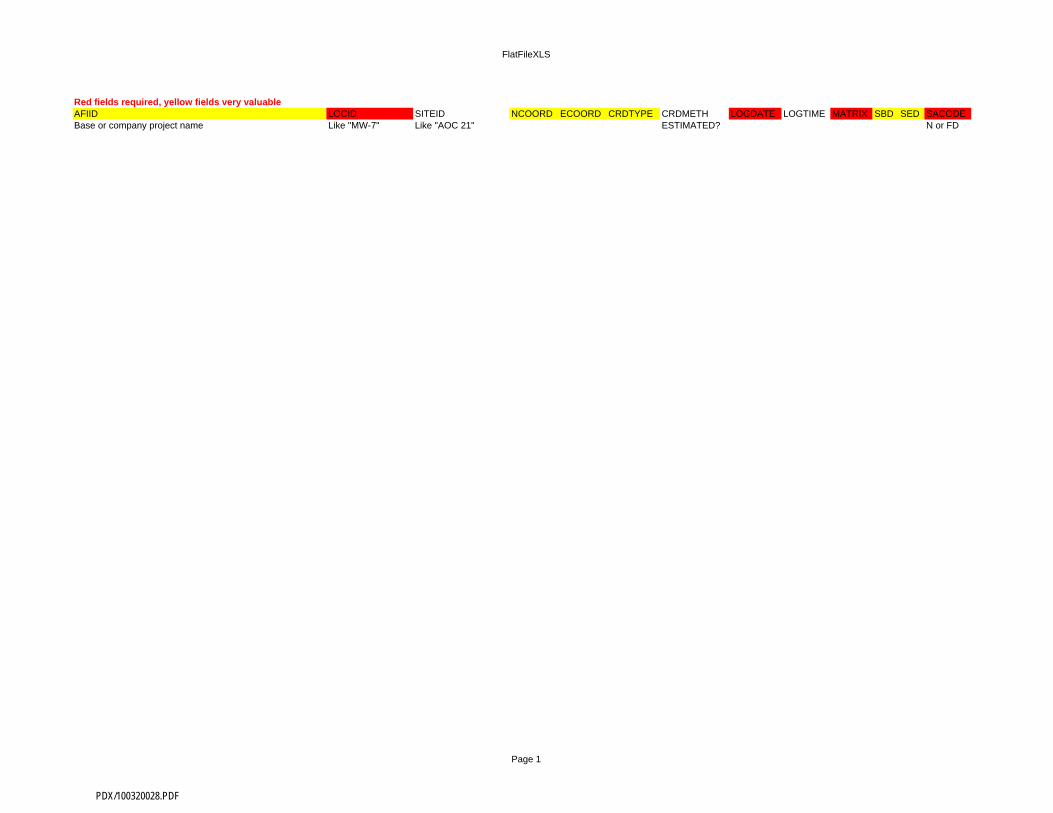
FlatFileXLS
Red fields required, yellow fields very valuableAFIID LOCID SITEID NCOORD ECOORD CRDTYPE CRDMETH LOGDATE LOGTIME MATRIX SBD SED SACODEBase or company project name Like "MW-7" Like "AOC 21" ESTIMATED? N or FD
Page 1
PDX/100320028.PDF
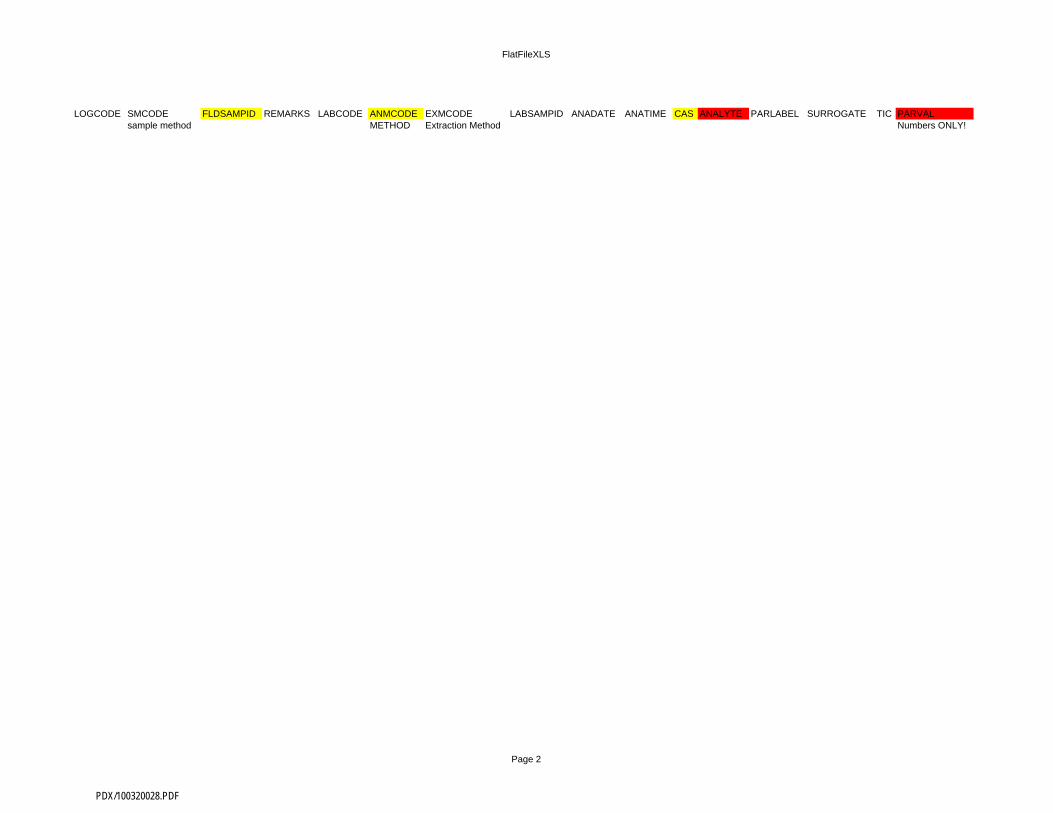
FlatFileXLS
LOGCODE SMCODE FLDSAMPID REMARKS LABCODE ANMCODE EXMCODE LABSAMPID ANADATE ANATIME CAS ANALYTE PARLABEL SURROGATE TIC PARVALsample method METHOD Extraction Method Numbers ONLY!
Page 2
PDX/100320028.PDF
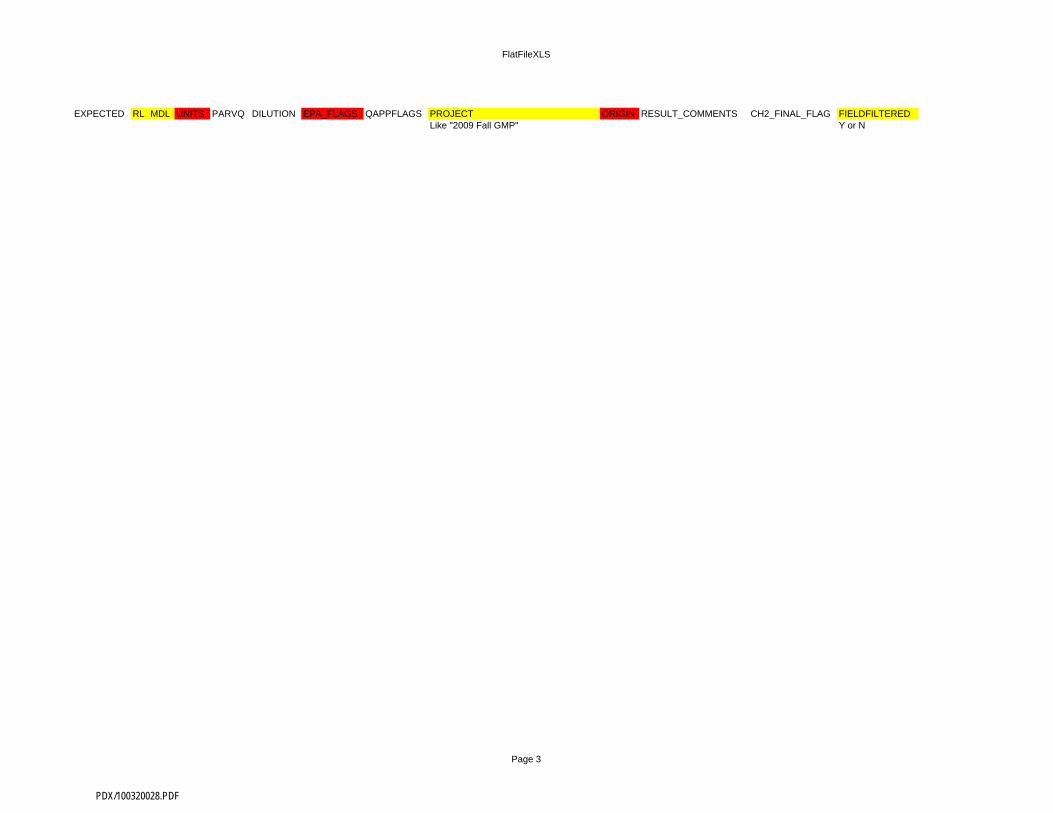
FlatFileXLS
EXPECTED RL MDL UNITS PARVQ DILUTION EPA_FLAGS QAPPFLAGS PROJECT ORIGIN RESULT_COMMENTS CH2_FINAL_FLAG FIELDFILTEREDLike "2009 Fall GMP" Y or N
Page 3
PDX/100320028.PDF
GALENA DBMS – DATA MANAGEMENT GALENA-SOP-503
MANAGING HISTORICAL/LEGACY DATA
C:\ALTHEN\PROJECTS_F-G\GALENA_AFCEE\APPENDIXES\APPJ_ARCHIVE\ATTACHMENTS\GALNA-SOP-503-MANAGING HISTORIC DATA_BAM.DOC
NER/CIS
11 OF 12 ISSUE DATE: MARCH 10, 2006
REVISON 2.0
Attachment 5 – Data Entry Details
Legacy Field Considerations.xls
PDX/100320028.PDF
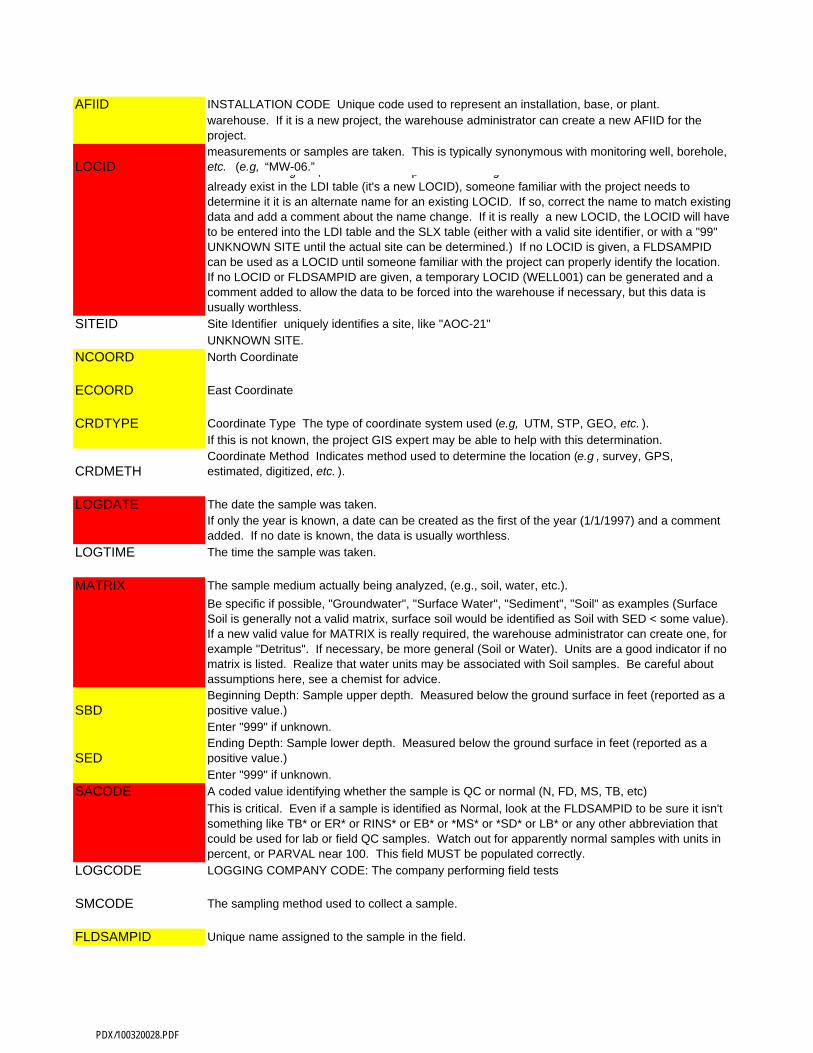
AFIID INSTALLATION CODE Unique code used to represent an installation, base, or plant.warehouse. If it is a new project, the warehouse administrator can create a new AFIID for the project.
LOCIDmeasurements or samples are taken. This is typically synonymous with monitoring well, borehole, etc. (e.g, “MW-06.”g , p galready exist in the LDI table (it's a new LOCID), someone familiar with the project needs to determine it it is an alternate name for an existing LOCID. If so, correct the name to match existing data and add a comment about the name change. If it is really a new LOCID, the LOCID will have to be entered into the LDI table and the SLX table (either with a valid site identifier, or with a "99" UNKNOWN SITE until the actual site can be determined.) If no LOCID is given, a FLDSAMPID can be used as a LOCID until someone familiar with the project can properly identify the location. If no LOCID or FLDSAMPID are given, a temporary LOCID (WELL001) can be generated and a comment added to allow the data to be forced into the warehouse if necessary, but this data is usually worthless.
SITEID Site Identifier uniquely identifies a site, like "AOC-21"UNKNOWN SITE.
NCOORD North Coordinate
ECOORD East Coordinate
CRDTYPE Coordinate Type The type of coordinate system used (e.g, UTM, STP, GEO, etc. ).If this is not known, the project GIS expert may be able to help with this determination.
CRDMETHCoordinate Method Indicates method used to determine the location (e.g , survey, GPS, estimated, digitized, etc. ).
LOGDATE The date the sample was taken.If only the year is known, a date can be created as the first of the year (1/1/1997) and a comment added. If no date is known, the data is usually worthless.
LOGTIME The time the sample was taken.
MATRIX The sample medium actually being analyzed, (e.g., soil, water, etc.).Be specific if possible, "Groundwater", "Surface Water", "Sediment", "Soil" as examples (Surface Soil is generally not a valid matrix, surface soil would be identified as Soil with SED < some value). If a new valid value for MATRIX is really required, the warehouse administrator can create one, for example "Detritus". If necessary, be more general (Soil or Water). Units are a good indicator if no matrix is listed. Realize that water units may be associated with Soil samples. Be careful about assumptions here, see a chemist for advice.
SBDBeginning Depth: Sample upper depth. Measured below the ground surface in feet (reported as a positive value.)Enter "999" if unknown.
SEDEnding Depth: Sample lower depth. Measured below the ground surface in feet (reported as a positive value.)Enter "999" if unknown.
SACODE A coded value identifying whether the sample is QC or normal (N, FD, MS, TB, etc)This is critical. Even if a sample is identified as Normal, look at the FLDSAMPID to be sure it isn't something like TB* or ER* or RINS* or EB* or *MS* or *SD* or LB* or any other abbreviation that could be used for lab or field QC samples. Watch out for apparently normal samples with units in percent, or PARVAL near 100. This field MUST be populated correctly.
LOGCODE LOGGING COMPANY CODE: The company performing field tests
SMCODE The sampling method used to collect a sample.
FLDSAMPID Unique name assigned to the sample in the field.
PDX/100320028.PDF
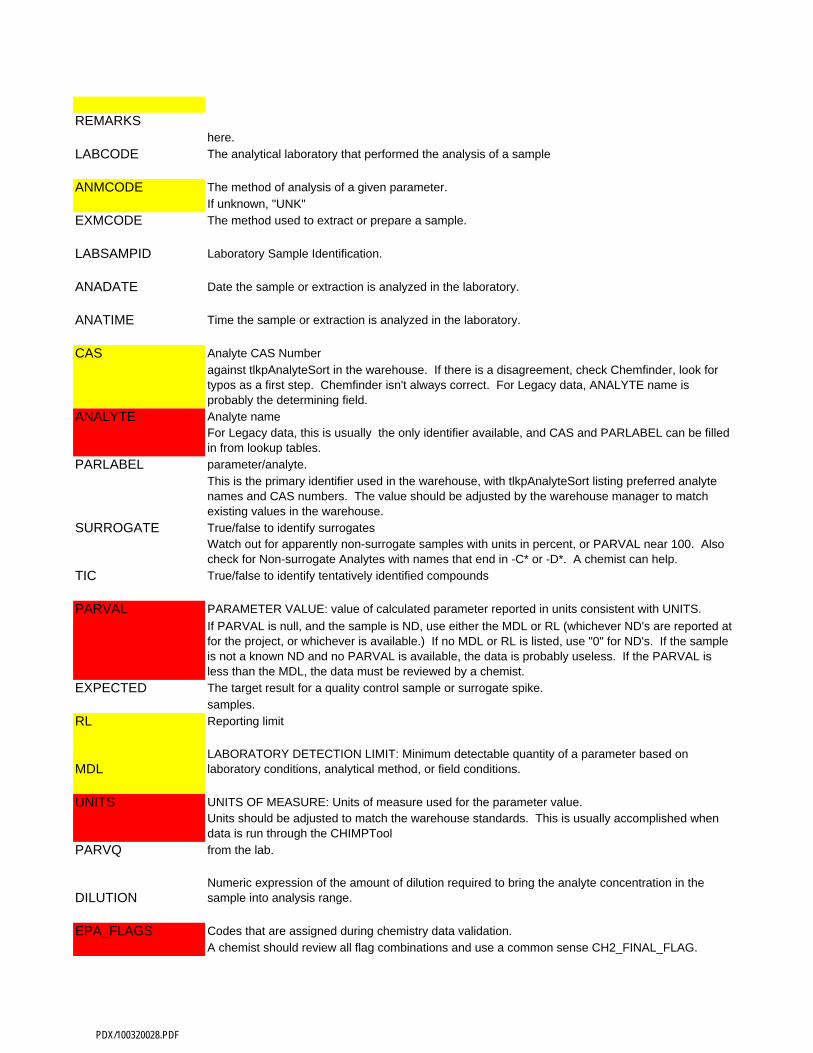
REMARKShere.
LABCODE The analytical laboratory that performed the analysis of a sample
ANMCODE The method of analysis of a given parameter.If unknown, "UNK"
EXMCODE The method used to extract or prepare a sample.
LABSAMPID Laboratory Sample Identification.
ANADATE Date the sample or extraction is analyzed in the laboratory.
ANATIME Time the sample or extraction is analyzed in the laboratory.
CAS Analyte CAS Numberagainst tlkpAnalyteSort in the warehouse. If there is a disagreement, check Chemfinder, look for typos as a first step. Chemfinder isn't always correct. For Legacy data, ANALYTE name is probably the determining field.
ANALYTE Analyte nameFor Legacy data, this is usually the only identifier available, and CAS and PARLABEL can be filled in from lookup tables.
PARLABEL parameter/analyte.This is the primary identifier used in the warehouse, with tlkpAnalyteSort listing preferred analyte names and CAS numbers. The value should be adjusted by the warehouse manager to match existing values in the warehouse.
SURROGATE True/false to identify surrogatesWatch out for apparently non-surrogate samples with units in percent, or PARVAL near 100. Also check for Non-surrogate Analytes with names that end in -C* or -D*. A chemist can help.
TIC True/false to identify tentatively identified compounds
PARVAL PARAMETER VALUE: value of calculated parameter reported in units consistent with UNITS.If PARVAL is null, and the sample is ND, use either the MDL or RL (whichever ND's are reported at for the project, or whichever is available.) If no MDL or RL is listed, use "0" for ND's. If the sample is not a known ND and no PARVAL is available, the data is probably useless. If the PARVAL is less than the MDL, the data must be reviewed by a chemist.
EXPECTED The target result for a quality control sample or surrogate spike.samples.
RL Reporting limit
MDLLABORATORY DETECTION LIMIT: Minimum detectable quantity of a parameter based on laboratory conditions, analytical method, or field conditions.
UNITS UNITS OF MEASURE: Units of measure used for the parameter value.Units should be adjusted to match the warehouse standards. This is usually accomplished when data is run through the CHIMPTool
PARVQ from the lab.
DILUTIONNumeric expression of the amount of dilution required to bring the analyte concentration in the sample into analysis range.
EPA_FLAGS Codes that are assigned during chemistry data validation.A chemist should review all flag combinations and use a common sense CH2_FINAL_FLAG.
PDX/100320028.PDF
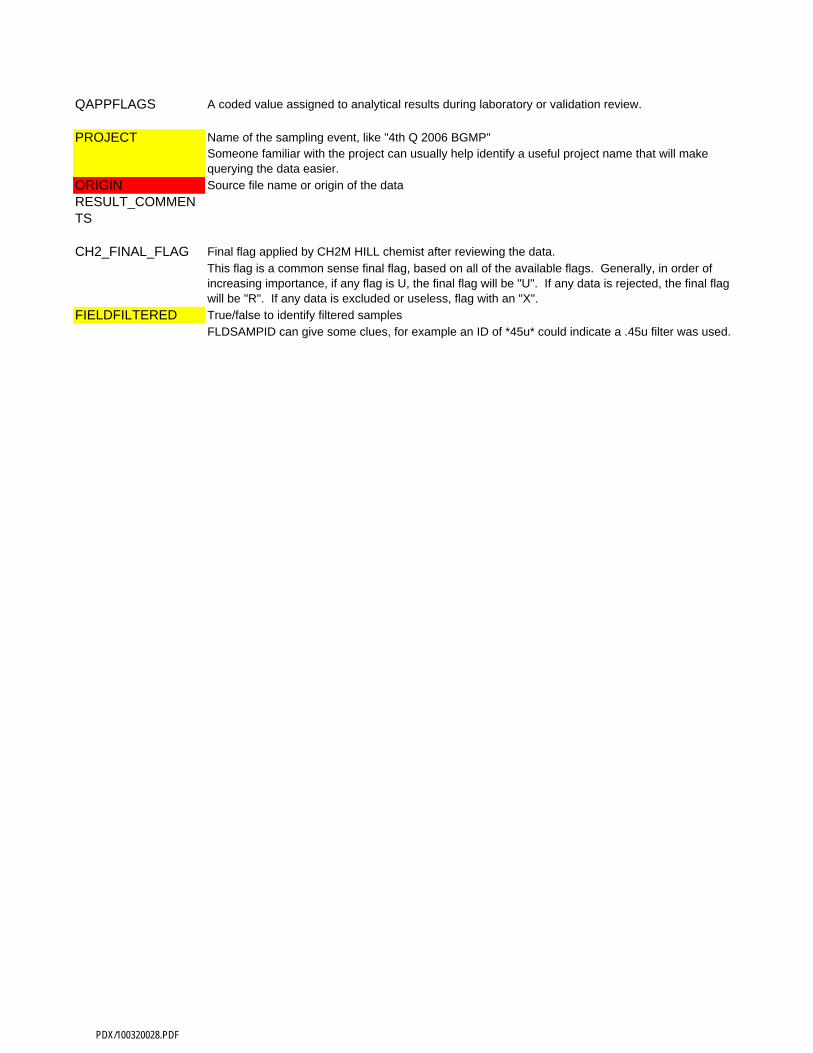
QAPPFLAGS A coded value assigned to analytical results during laboratory or validation review.
PROJECT Name of the sampling event, like "4th Q 2006 BGMP"Someone familiar with the project can usually help identify a useful project name that will make querying the data easier.
ORIGIN Source file name or origin of the dataRESULT_COMMENTS
CH2_FINAL_FLAG Final flag applied by CH2M HILL chemist after reviewing the data.This flag is a common sense final flag, based on all of the available flags. Generally, in order of increasing importance, if any flag is U, the final flag will be "U". If any data is rejected, the final flag will be "R". If any data is excluded or useless, flag with an "X".
FIELDFILTERED True/false to identify filtered samplesFLDSAMPID can give some clues, for example an ID of *45u* could indicate a .45u filter was used.
PDX/100320028.PDF
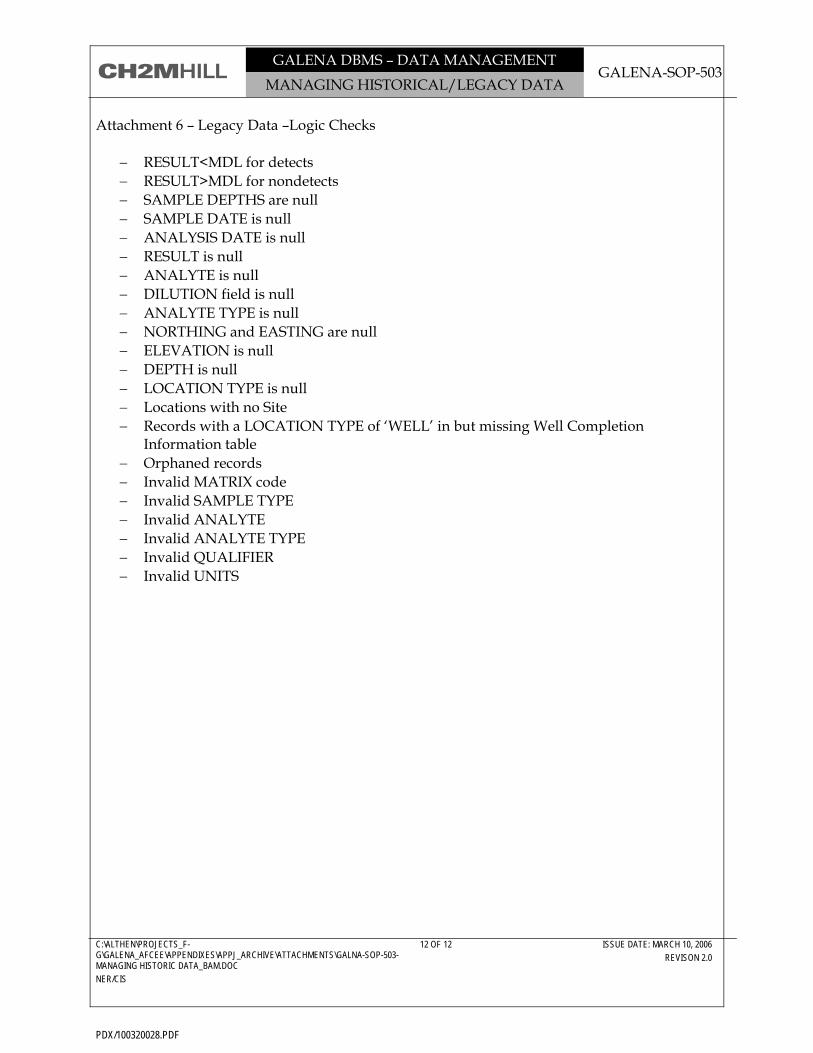
GALENA DBMS – DATA MANAGEMENT GALENA-SOP-503
MANAGING HISTORICAL/LEGACY DATA
C:\ALTHEN\PROJECTS_F-G\GALENA_AFCEE\APPENDIXES\APPJ_ARCHIVE\ATTACHMENTS\GALNA-SOP-503-MANAGING HISTORIC DATA_BAM.DOC
NER/CIS
12 OF 12 ISSUE DATE: MARCH 10, 2006
REVISON 2.0
Attachment 6 – Legacy Data –Logic Checks
− RESULT<MDL for detects − RESULT>MDL for nondetects − SAMPLE DEPTHS are null − SAMPLE DATE is null − ANALYSIS DATE is null − RESULT is null − ANALYTE is null − DILUTION field is null − ANALYTE TYPE is null − NORTHING and EASTING are null − ELEVATION is null − DEPTH is null − LOCATION TYPE is null − Locations with no Site − Records with a LOCATION TYPE of ‘WELL’ in but missing Well Completion
Information table − Orphaned records − Invalid MATRIX code − Invalid SAMPLE TYPE − Invalid ANALYTE − Invalid ANALYTE TYPE − Invalid QUALIFIER − Invalid UNITS
PDX/100320028.PDF
ATTACHMENT J-4
Process Flow Diagrams for Producing Figures
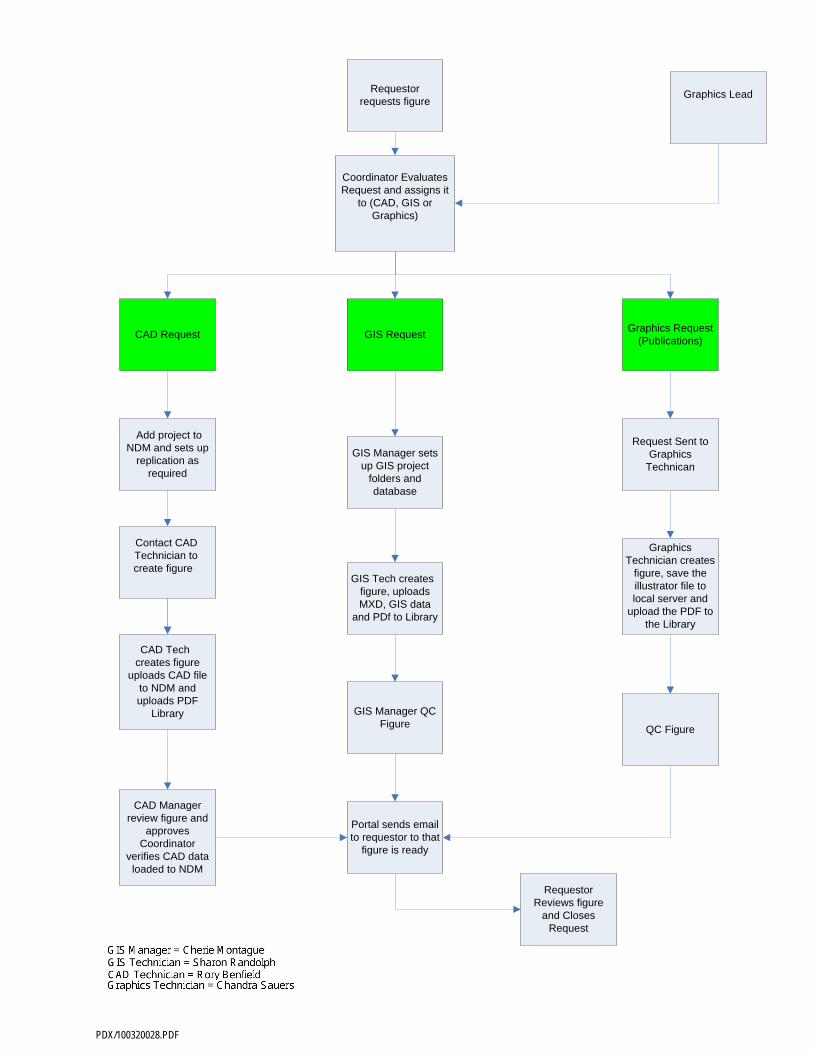
Requestor requests figure
Coordinator Evaluates Request and assigns it
to (CAD, GIS or Graphics)
CAD Request GIS RequestGraphics Request
(Publications)
Request Sent to Graphics
Technican
Contact CAD Technician to create figure
Add project to NDM and sets up
replication as required
CAD Tech creates figure
uploads CAD file to NDM and uploads PDF
Library
GIS Manager sets up GIS project
folders and database
GIS Tech creates figure, uploads MXD, GIS data
and PDf to Library
Graphics Technician creates
figure, save the illustrator file to local server and
upload the PDF to the Library
Portal sends email to requestor to that
figure is ready
Graphics Lead
CAD Manager review figure and
approvesCoordinator
verifies CAD data loaded to NDM
Requestor Reviews figure
and Closes Request
QC Figure
GIS Manager QC Figure
PDX/100320028.PDF
![Operating Procedures 1 G2 - OPERATING PROCEDURES [6 Exam Questions - 6 Groups] G2APhone operating procedures; USB/LSB utilization conventions; procedural](https://img.dokumen.tips/doc/110x75/56649e4d5503460f94b4351a/operating-procedures-1-g2-operating-procedures-6-exam-questions-6-groups.jpg)